mass spectrometry and proteomics - lecture 1 - history of mass spectrometry 1942 first commercial...
TRANSCRIPT

2
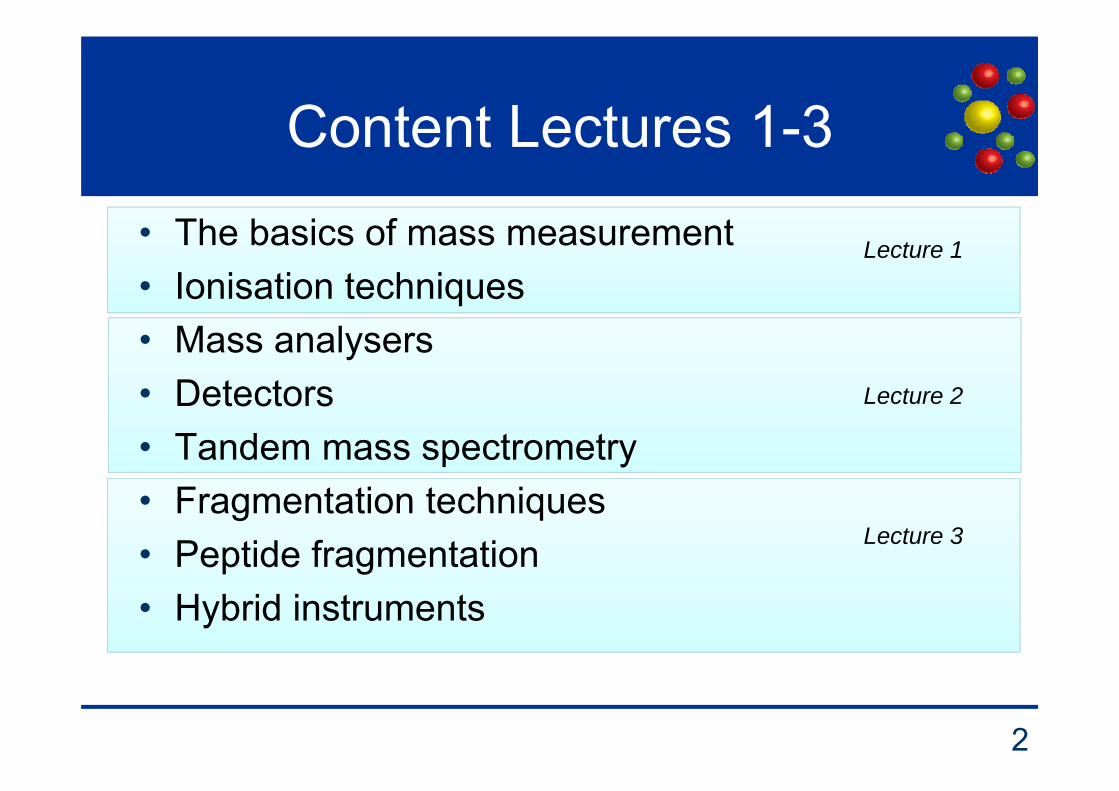
Content Lectures 1-3
• The basics of mass measurement• Ionisation techniques• Mass analysers• Detectors• Tandem mass spectrometry• Fragmentation techniques• Peptide fragmentation• Hybrid instruments
Lecture 1
Lecture 2
Lecture 3

Lecture 4
Lecture 5
Lecture 6
3
Content Lectures 4-6
• What is proteomics?• Sample Preparation• Experimental Design• Quantification techniques• Search engines, Databases, FDR• Data analysis & Data inspection• Fractionation techniques• Phosphoproteomics and other PTMs• Proteomics experiments

Lecture 1
• Basics– Components of a mass spectrometer– Isotopes and isotopic profiles– Resolution– Accuracy vs. Precision
• Ionisation techniques– Electrospray Ionisation– Matrix-assisted Laser Desorption/Ionisation
4

5
The basics of mass measurements
The zeroth law of mass spectrometry:
Never ever say mass spectroscopy!
Spectroscopy involves the measurement of electromagnetic waves and we look at “particles”.
6
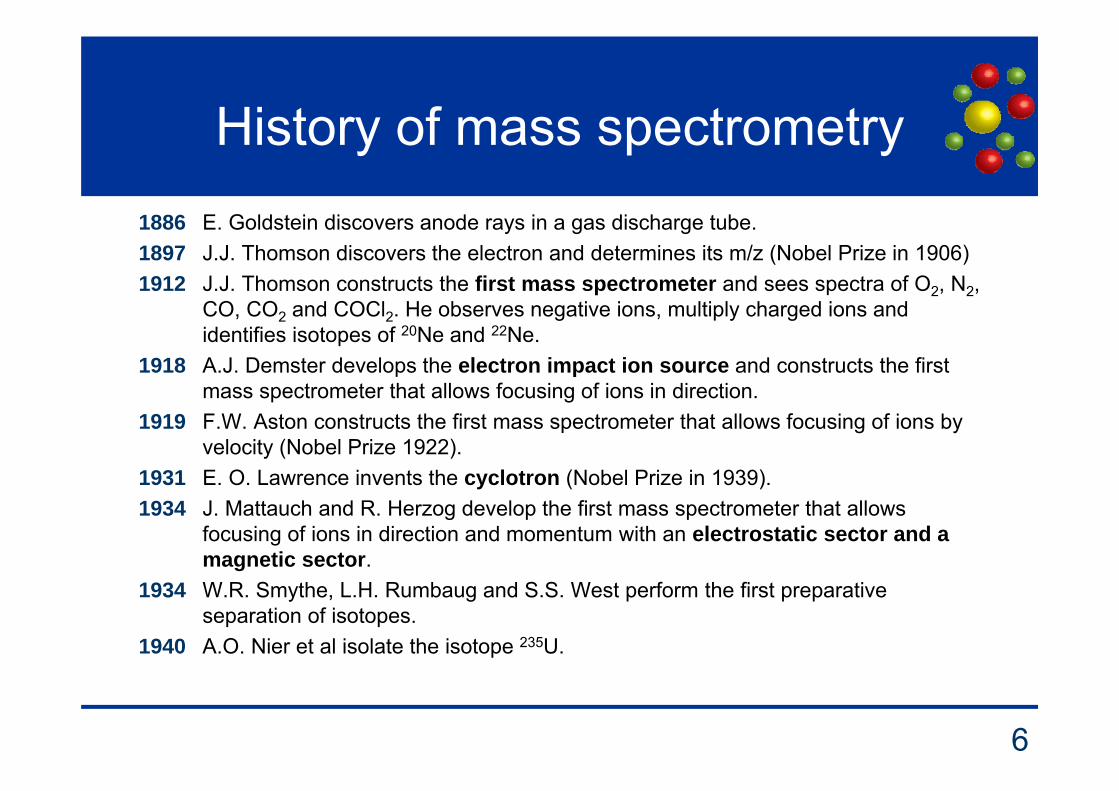
History of mass spectrometry1886 E. Goldstein discovers anode rays in a gas discharge tube.1897 J.J. Thomson discovers the electron and determines its m/z (Nobel Prize in 1906)1912 J.J. Thomson constructs the first mass spectrometer and sees spectra of O2, N2,
CO, CO2 and COCl2. He observes negative ions, multiply charged ions and identifies isotopes of 20Ne and 22Ne.
1918 A.J. Demster develops the electron impact ion source and constructs the first mass spectrometer that allows focusing of ions in direction.
1919 F.W. Aston constructs the first mass spectrometer that allows focusing of ions by velocity (Nobel Prize 1922).
1931 E. O. Lawrence invents the cyclotron (Nobel Prize in 1939).1934 J. Mattauch and R. Herzog develop the first mass spectrometer that allows
focusing of ions in direction and momentum with an electrostatic sector and a magnetic sector.
1934 W.R. Smythe, L.H. Rumbaug and S.S. West perform the first preparative separation of isotopes.
1940 A.O. Nier et al isolate the isotope 235U.

7
History of mass spectrometry1942 First commercial sector mass spectrometer by CEC.1948 A.E. Cameron et D.F. Eggers elaborate the plan for a Time-of-Flight mass
spectrometer after a principle proposed by W. Stephens in 1946.1952 Quasi-equilibrium theorie (QET) and Rice–Ramsperger–Kassel–Marcus (RRKM)
theory explain the molecular fragmentation of ions. Marcus receives Nobel Prize in 1992
1952 W. Paul and H.S. Steinwedel describe the first ion trap mass spectrometer.W. Paul, H.S Reinhard and U. von Zahn publish the first quadrupol mass spectrometer. Paul and Dehmelt (“Penning trap”) receive Nobel Prize in 1989.
1956 J. Beynon show the first identification of the empirical formula through measurement of exact mass.First GC-MS by F.W. McLafferty and R.S. Gohlke.
1966 M.S.B. Munson et F.H. Field introduce the chemical ionisation.K. Biemann et al determine first peptide sequence by mass spectrometry.
1967 F.W. McLafferty and K.R. Jennings introduce collision-induced dissociation(CID).
1968 Finnigan commercialises the first quadrupol mass spectrometer.

8
History of mass spectrometry1972 V.I. Karataev, B.A. Mamyrim et D.V. Smikk introduce the first Time-of-Flight
mass spectrometer with reflectron.1974 M.D. Comisarov and A.G. Marshall apply the Fourier transformation to analyse
ion cyclotron resonance mass spectra.P.J. Arpino, M.A. Bladwin and F.W. McLafferty present the first mass spectrometer coupled to a liquid chromatography system.
1978 R.A. Yost and C.G. Enke construct the first triple quadrupol mass spectrometer.1981 M. Barber, R.S. Bordoli, R.D. Sedgwick and A.H. Tyler describe the atom
bombardment ion source and publish the first spectrum of Insulin in 1982.1982 Sciex and Finnigan commercialise the first triple quadrupol mass spectrometer1987 M. Karas and F. Hillenkamp develop matrix-assisted laser
desorption/ionisation (MALDI), K. Tanaka laser desorption. Tanaka receives Nobel Prize in 2002.
1988 J. Fenn develops electrospray ionisation after a concept proposed by M.Dole in 1968. Fenn receives Nobel Prize in 2002.
1999 A.A. Makarov presents a new type of mass analyser – the Orbitrap.2004 D.F. Hunt lab develops electron-transfer dissociation (ETD) mass spectrometry.
9
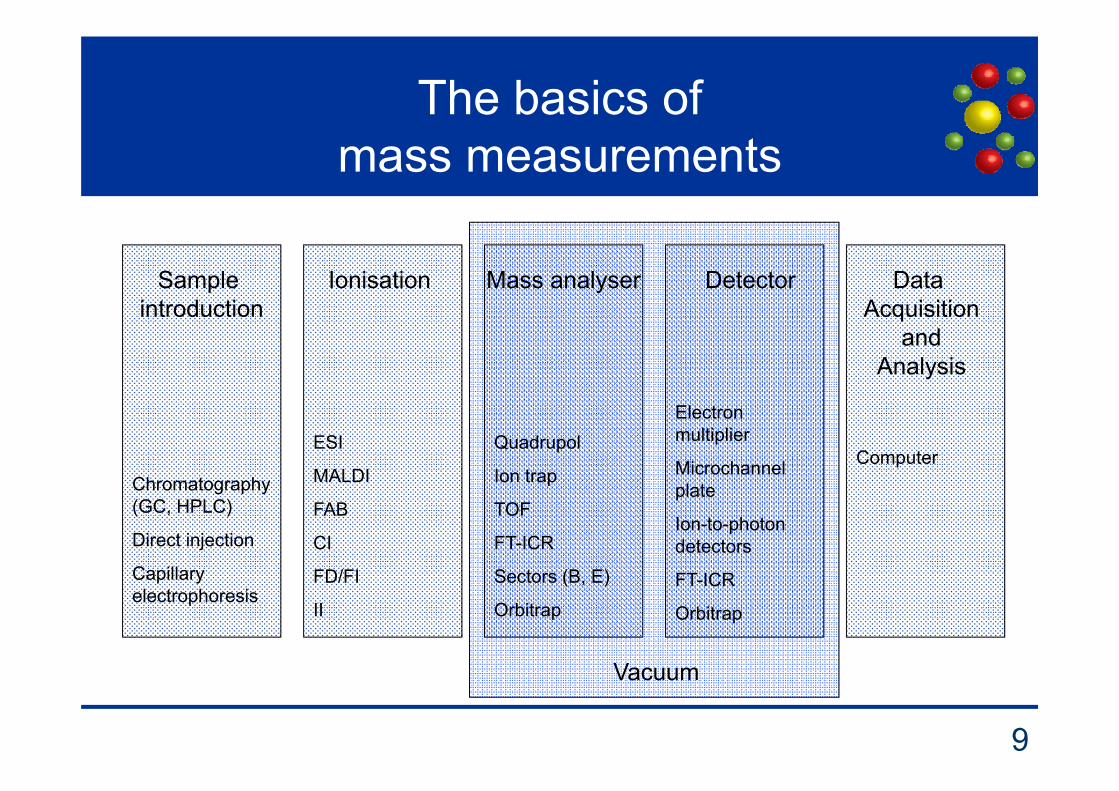
The basics of mass measurements
Sample introduction
Mass analyserIonisation Detector Data Acquisition
andAnalysis
Chromatography (GC, HPLC)
Direct injection
Capillary electrophoresis
ESI
MALDI
FAB
CI
FD/FI
II
Quadrupol
Ion trap
TOF
FT-ICR
Sectors (B, E)
Orbitrap
Electron multiplier
Microchannel plate
Ion-to-photon detectors
FT-ICR
Orbitrap
Computer
Vacuum

10
The basics of mass measurements: vacuum
Vacuum technology
Pressure (mbar) Pressure (mtorr) Vacuum
1000 - 1 750 torr-750 mtorr Primary Vacuum
100-10-3 750-0.75 Intermediate Vacuum
10-3-10-7 0.75-7.5 * 10-5 High Vacuum
<10-7 <7.5 * 10-5 Ultra-high vacuum
• Rotation pumps (backing/roughing pumps): 4-16 m3/h for the primary vacuum necessary for turbomolecular pumps (turbo pumps).
• Ultra-high vacuum almost entirely achieved by turbo pumps (200-500 L/sec) (20-90,000 rpm!, up to several thousand km/h!). Less used are diffusion pumps (600-2000 L/sec) and cryo-pumps.

11
The basics of mass measurements: vacuum
Why is a vacuum necessary?The mean free path, , is the average distance traveled by an ion before it collides with an air molecule, and is given by:
= 1/N where N is the gas number density, and is the collision cross section between the ion and the molecule (typically ~50 Å2 for a small peptide ion). Using a collision cross section of 50 Å2, the following table may be constructed:
12
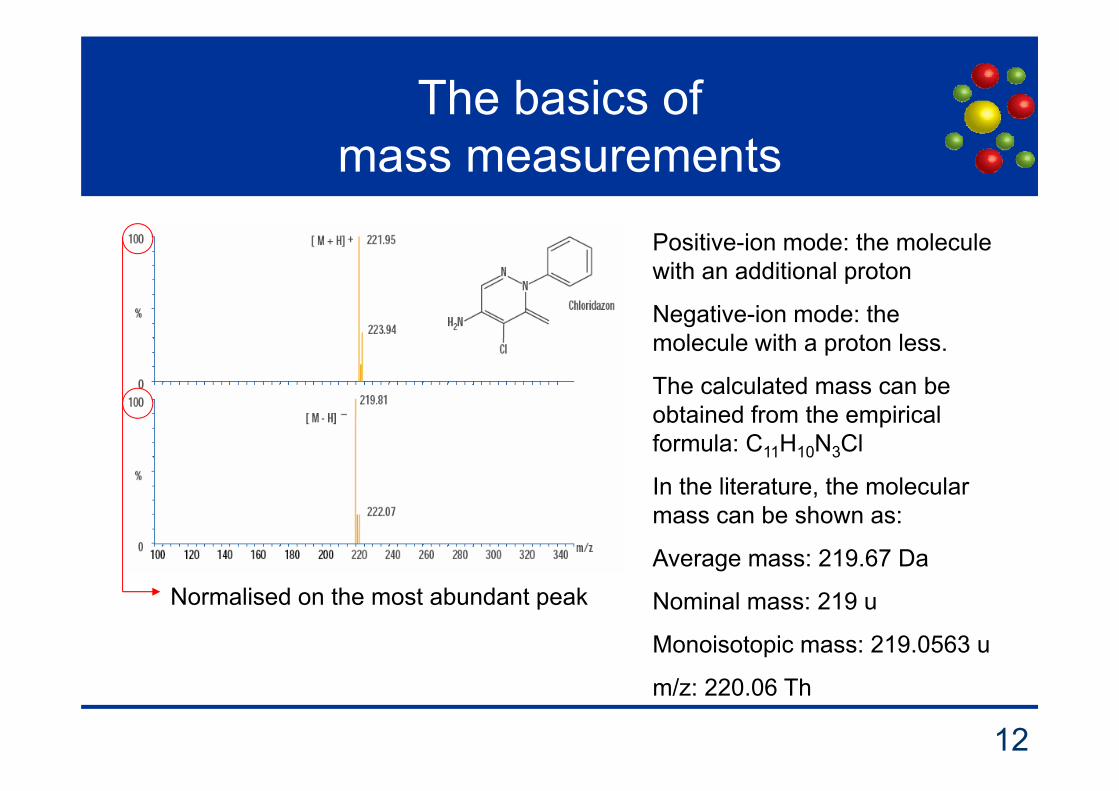
The basics of mass measurements
Positive-ion mode: the molecule with an additional proton
Negative-ion mode: the molecule with a proton less.
The calculated mass can be obtained from the empirical formula: C11H10N3Cl
In the literature, the molecular mass can be shown as:
Average mass: 219.67 Da
Nominal mass: 219 u
Monoisotopic mass: 219.0563 u
m/z: 220.06 Th
Normalised on the most abundant peak

13
The basics of mass measurements: isotopes
Isotopes
• A molecule is defined by its empiric formula• Each atom has a natural isotopic ratio due to difference
in the number of neutrons. E.g. carbon and chlorine:12C: 12.0000u <-> 13C: 13.0034u35Cl: 34.9689u <-> 37Cl: 36.9659u1u=1 Da=1/12 of 12C ~ mass of the H-atom
(1.00794u)• Each isotope has a natural abundance: E.g.
12C: 100% <-> 13C: 1.08%
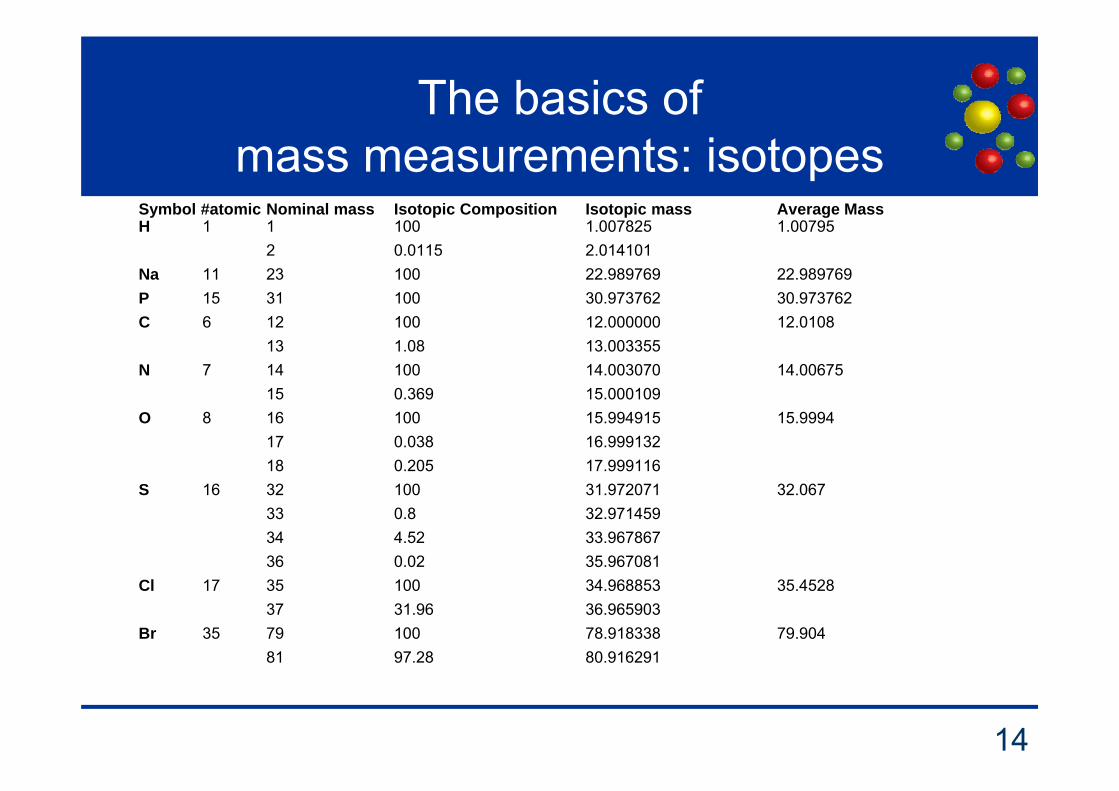
14
The basics of mass measurements: isotopes
Symbol #atomic Nominal mass Isotopic Composition Isotopic mass Average MassH 1 1 100 1.007825 1.00795
2 0.0115 2.014101Na 11 23 100 22.989769 22.989769 P 15 31 100 30.973762 30.973762 C 6 12 100 12.000000 12.0108
13 1.08 13.003355N 7 14 100 14.003070 14.00675
15 0.369 15.000109O 8 16 100 15.994915 15.9994
17 0.038 16.99913218 0.205 17.999116
S 16 32 100 31.972071 32.067 33 0.8 32.97145934 4.52 33.96786736 0.02 35.967081
Cl 17 35 100 34.968853 35.452837 31.96 36.965903
Br 35 79 100 78.918338 79.90481 97.28 80.916291

Mass Defect
15
http://pprco.tripod.com/SIMS/Theory.htm http://nsb.wikidot.com/pl-9-8-3-9
• The mass of an atom is less than the sum of the individual parts (protons, neutrons and electrons). This difference is called mass defect.
• The mass defect originates from the binding energy of protons and neutrons in the nucleus.
• The energy can be calculated by E=mc2.
16
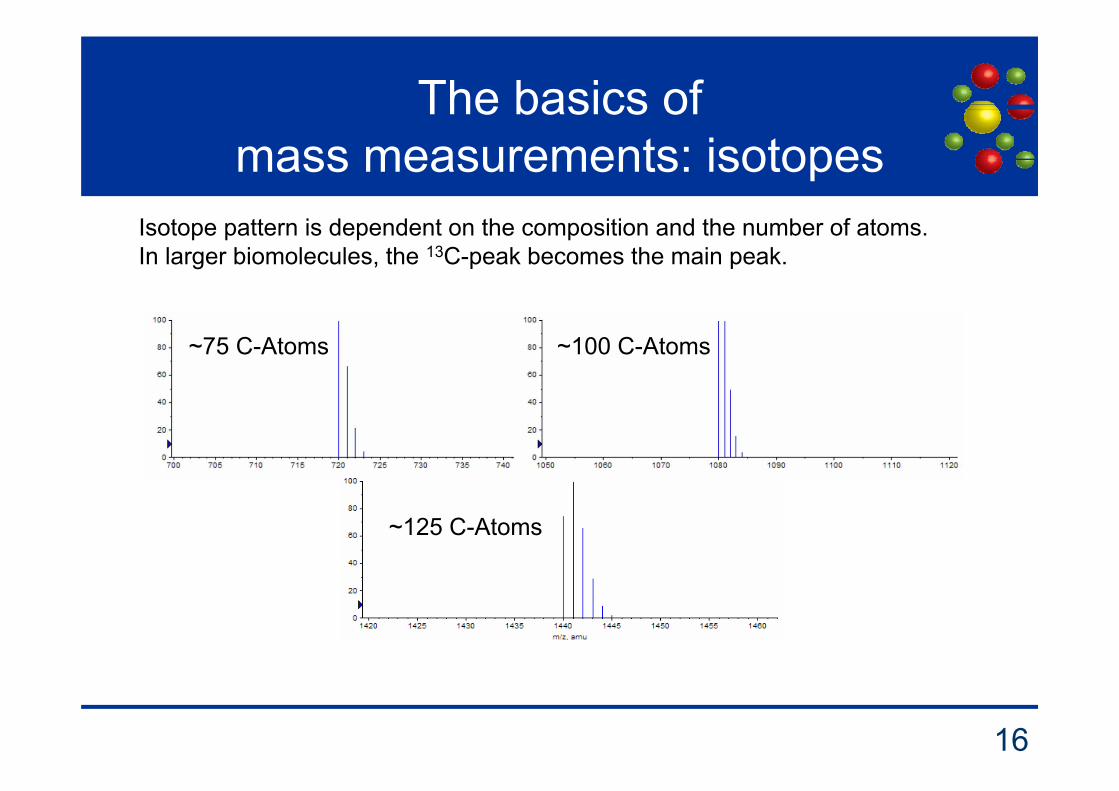
The basics of mass measurements: isotopes
Isotope pattern is dependent on the composition and the number of atoms.In larger biomolecules, the 13C-peak becomes the main peak.
~75 C-Atoms ~100 C-Atoms
~125 C-Atoms

The distances between isotopic peaks reveal charge state
protein_modelingLCTmix of 6 proteins
m/z500 501 502 503 504 505 506 507 508 509 510 511 512
%
0
100prot_mix_0724a 651 (10.856) Sm (SG, 2x6.00); Cm (648:651) TOF MS ES+
783505.3506
506.3584
507.3566
505.3506
506.3584
507.3566
+1
1.00
protein_modelingLCTmix of 6 proteins
m/z1084 1085 1086 1087 1088 1089 1090
%
0
100prot_mix_0724a 655 (10.923) Sm (SG, 2x6.00); Cm (645:675) TOF MS ES+
4541086.5515
1086.0433
1087.0444
1087.5529
1088.0460
1086.04331086.5515
1086.0444
1087.5529
1088.0460
0.5 +2
protein_modelingLCTmix of 6 proteins
m/z915 916 917 918
%
0
00rot_mix_0724a 350 (5.837) Sm (SG, 2x6.00); Cm (343:374) TOF MS ES+
1.86e3915.7363915.4818
915.2274
915.9765
916.2311
916.4857
916.7402
915.2247
915.4818 915.7363
915.9765
916.2311
916.48570.25
+4
17

18
The basics of mass measurements: resolution
Resolution

19
The basics of mass measurements: resolution
ResolutionHow does the isotopic pattern vary with resolution for a
peptide of 2000 Da?

20
The basics of mass measurements: resolution
ResolutionImpact on the identification of an ion species:
R=1000 R>10000C20H9
+
C19H7N+
C13H19N3O2+ C20H9
+C19H7N+ C13H19N3O2+
249 249.0580 249.0700 249.1479
Typical resolution of mass spectrometers:• Quadrupol, Ion trap: <10,000
• Time-of-Flight: 10-30,000
• Orbitrap: up to 500,000-1,000,000
• FT-ICR >1,000,000

21
The basics of mass measurements: Accuracy and Precision

22
Ionisation techniques
• Electrospray ionisation (ESI)• Matrix-assisted laser desorption/ionisation
(MALDI)
• Not covered: Electron Ionisation (EI), Chemical Ionisation (CI), Fast-Atom Bombardment (FAB)

23
Electrospray

24
Electrospray

25
Electrospray Ionisation (ESI)
• Ionisation of molecules from solution• “Soft” ionisation technique• Ease of coupling with separation techniques
such as nano-LC• Production of multiply charged ions
( MS/MS)
26
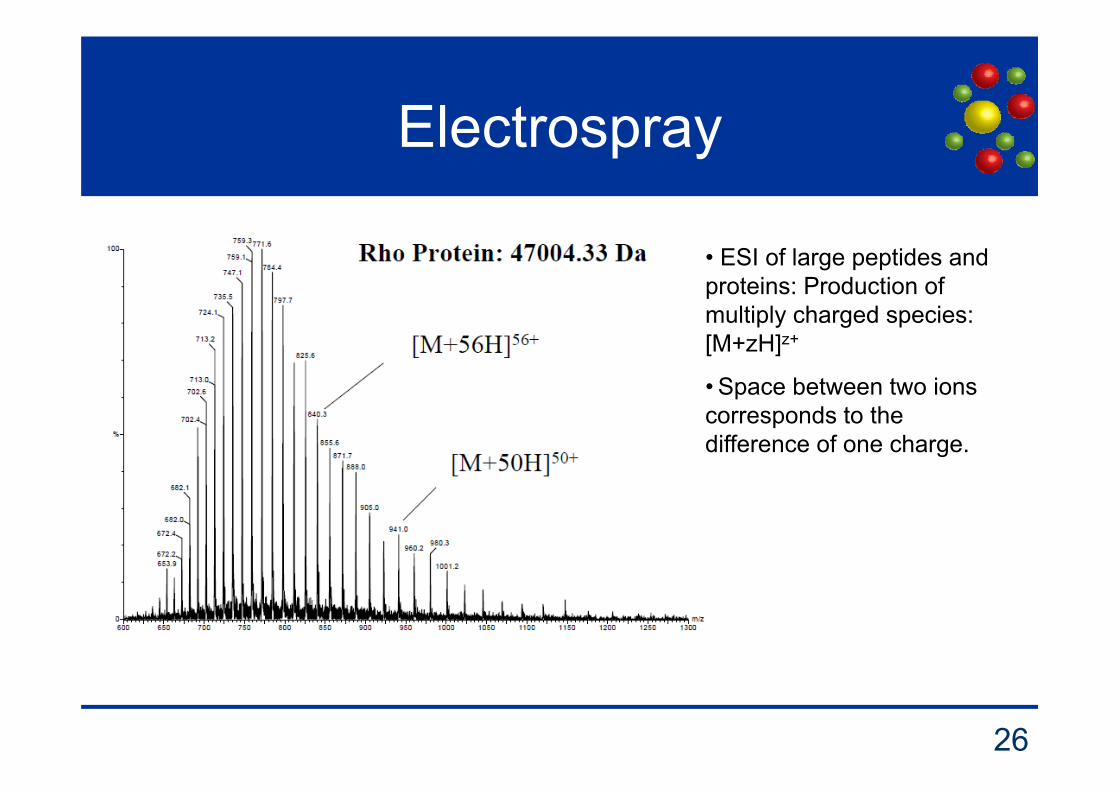
Electrospray
• ESI of large peptides and proteins: Production of multiply charged species: [M+zH]z+
• Space between two ions corresponds to the difference of one charge.

942.8
893.3
848.7
808.3
771.6
738.1
707.4
998.1
1060.5
How to determine the molecular mass of a protein from an ESI-MS spectrum
• Observed ions have composition [M+nH]n+
• For the charge states of m/z1 (higher value) and m/z2 (lower value) we have n2=n1+1
• mn= m/z1 = (H=mass of proton)
• Its neighbouring peak to the left: • mn+1=m/z2 = =
(with M being the mass of the protein)•
Solving both equations for n and M:• n1 = /
/ /• M = n1(m/z1 – H)• e.g. m/z2 = 998.1 and m/z1 = 1060.5
• n1 = 17, and M = 18011 Da
m/z
n must be an integer
27

Deconvolution of ESI mass spectra
Charge states Deconvolutedspectrum
M = n(mn – H)
3000 30000 Mass (Da)
28
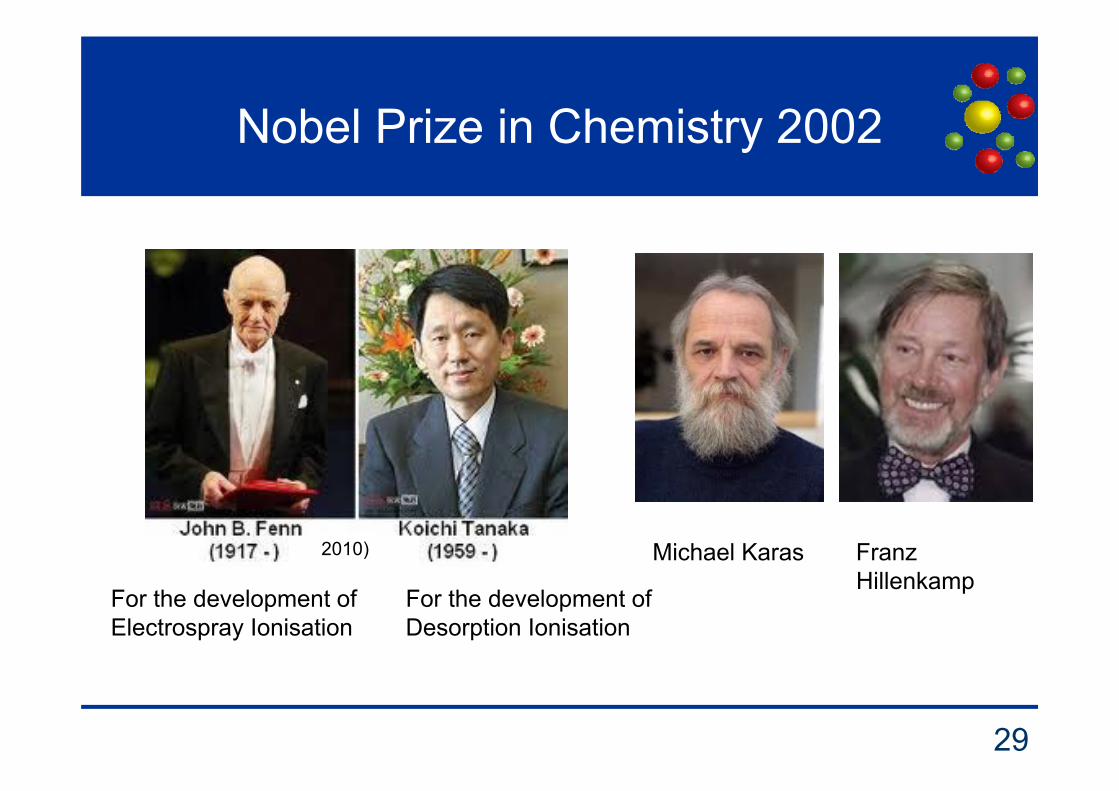
Nobel Prize in Chemistry 2002
29
2010)
For the development of Electrospray Ionisation
For the development of Desorption Ionisation
Michael Karas Franz Hillenkamp

30
Matrix-assisted Laser Desorption/Ionisation (MALDI)
• Analyte is co-deposited with Matrix. • Laser excites matrix which transfers energy to analyte. • Produces predominately singly charged species [M+H]+. • Typically used for large biomolecules / polymers. • MALDI is a high mass/pulsed source so usually combined with TOF.• Less sensitive to contaminants such as salts and detergents• Sensitivity at attomole level.• High throughput analysis (up to ~3000 samples/day)• Samples can be re-analysed.
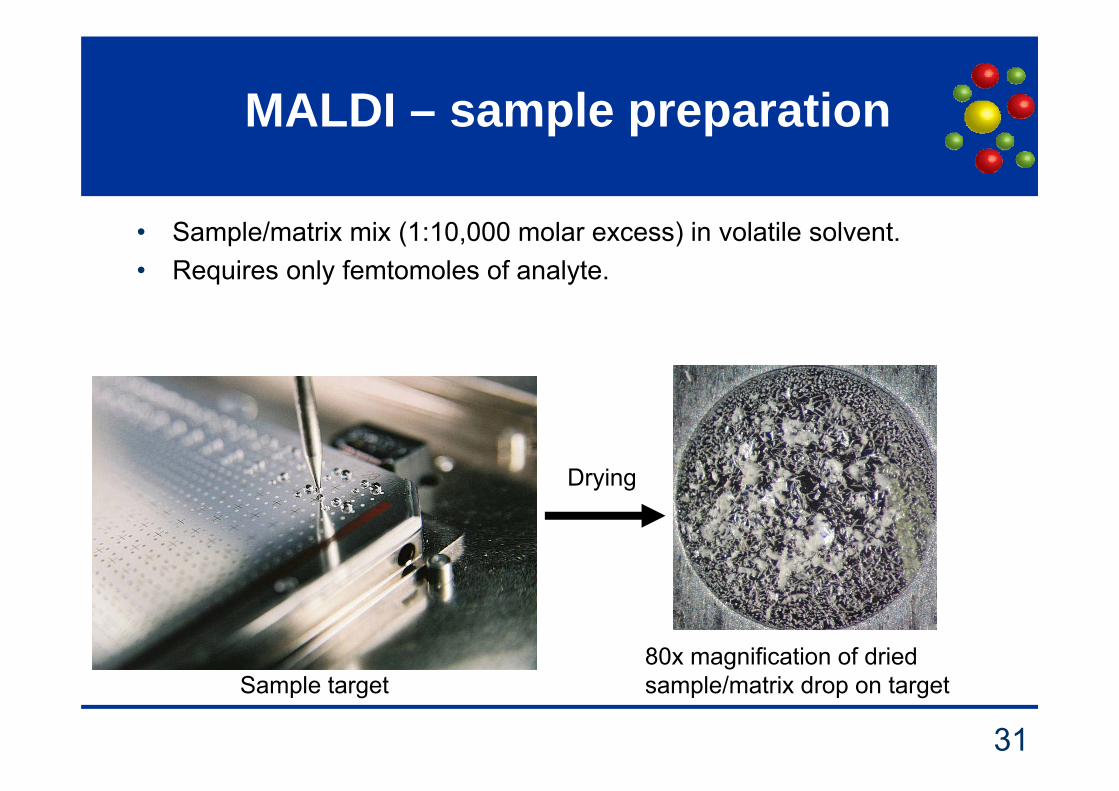
MALDI – sample preparation
• Sample/matrix mix (1:10,000 molar excess) in volatile solvent.• Requires only femtomoles of analyte.
80x magnification of dried sample/matrix drop on targetSample target
Drying
31
32
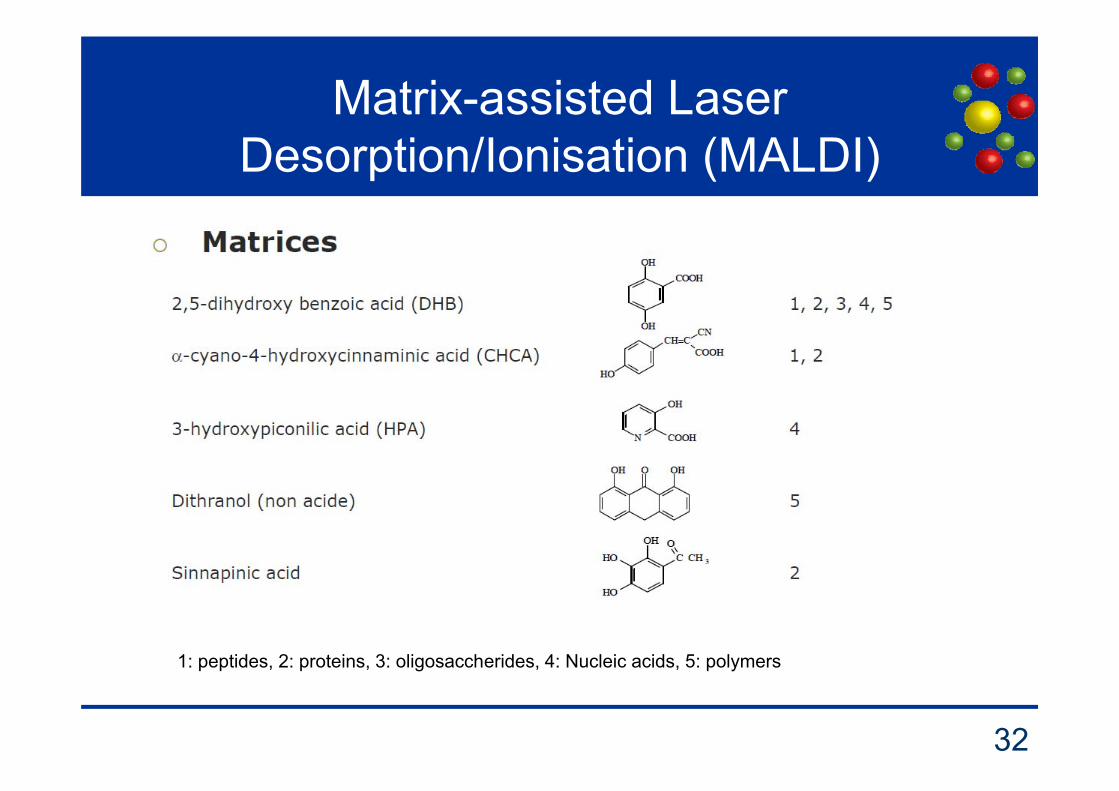
Matrix-assisted Laser Desorption/Ionisation (MALDI)
1: peptides, 2: proteins, 3: oligosaccherides, 4: Nucleic acids, 5: polymers

33
Matrix-assisted Laser Desorption/Ionisation (MALDI)

MALDI matrix
• Absorbs photon energy and transfers it to analyte.• Minimises aggregation between analyte molecules.
• Matrix must – Absorb strongly at Laser wavelength.– Have low sublimation temperature.– Have good mixing and solvent compatibility with
analyte.– Have ability to participate in photochemical reaction.
34

Absorbance
Wavelength (nm)
matrix
analyte
Common lasers; N2 (337 nm), ArF excimer (193), Nd-YAG frequency tripled (355 nm) and quadrupled (266 nm)
Matrices and analytes: desired photochemical characteristics
Laser
200 500
35

Applications:Mass determination of intact proteins
• MALDI-TOF spectrum of a single protein
36
8798.5
17597.05865.7
8798.50
2932.83
DHAP_forhighermasses_plusMax 0:G22 MS Raw
0
1
2
3
4
5
4x10
Inte
ns. [
a.u.
]
4000 6000 8000 10000 12000 14000 16000 18000m/z
[M+H]+
[M+2H]2+
[M+3H]3+

Applications: Molecular weight distribution of polymers
http://www.arkat-usa.org/?VIEW=MANUSCRIPT&MSID=869
poly(dimethyl)siloxane 2.25 kD
37
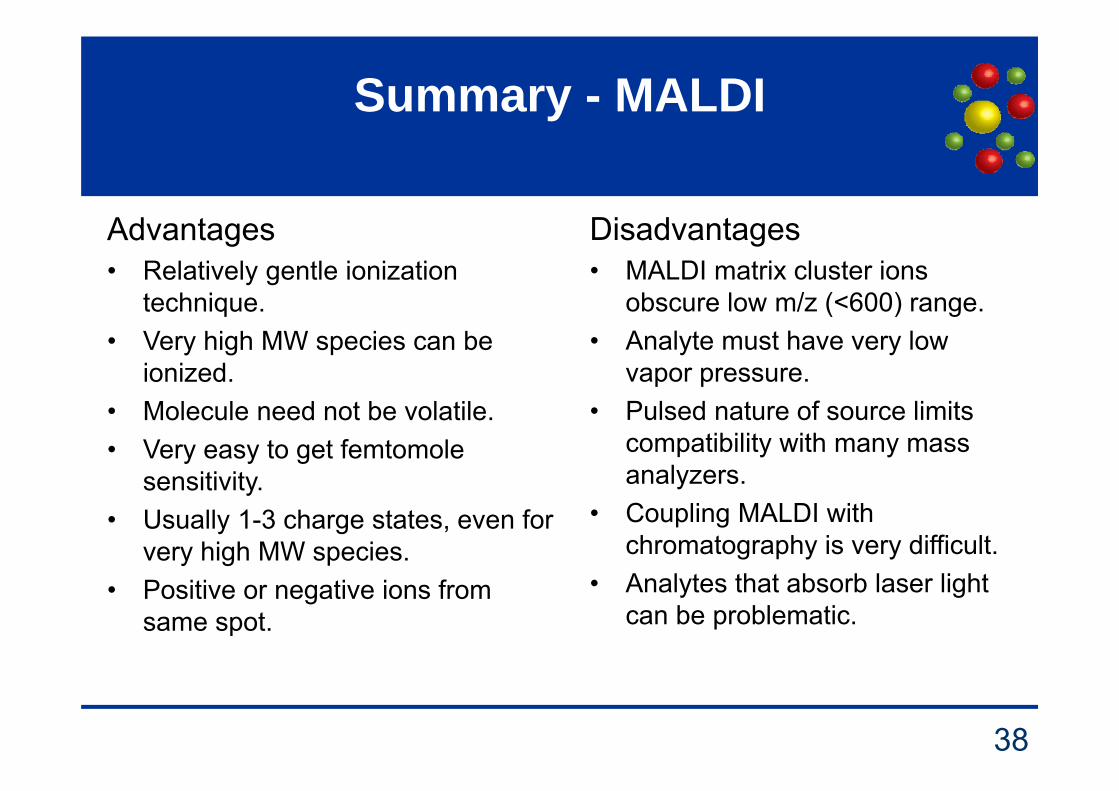
Summary - MALDI
Disadvantages• MALDI matrix cluster ions
obscure low m/z (<600) range.• Analyte must have very low
vapor pressure.• Pulsed nature of source limits
compatibility with many mass analyzers.
• Coupling MALDI with chromatography is very difficult.
• Analytes that absorb laser light can be problematic.
Advantages• Relatively gentle ionization
technique.• Very high MW species can be
ionized.• Molecule need not be volatile.• Very easy to get femtomole
sensitivity.• Usually 1-3 charge states, even for
very high MW species.• Positive or negative ions from
same spot.
38