mass transfer investigation in a horizontal–vertical
TRANSCRIPT
RSC Advances
PAPER
Ope
n A
cces
s A
rtic
le. P
ublis
hed
on 0
6 D
ecem
ber
2017
. Dow
nloa
ded
on 1
2/5/
2021
10:
22:0
6 A
M.
Thi
s ar
ticle
is li
cens
ed u
nder
a C
reat
ive
Com
mon
s A
ttrib
utio
n 3.
0 U
npor
ted
Lic
ence
.
View Article OnlineView Journal | View Issue
Mass transfer inv
aSchool of Chemical Engineering, Faculty of E
IranbMaterial and Nuclear Fuel Research School,
Institute, P.O. Box: 11365-8486, Tehran, Ira
21 88221116; Tel: +98 21 88221117
† Electronic supplementary informa10.1039/c7ra07999k
Cite this: RSC Adv., 2017, 7, 55326
Received 20th July 2017Accepted 15th November 2017
DOI: 10.1039/c7ra07999k
rsc.li/rsc-advances
55326 | RSC Adv., 2017, 7, 55326–5533
estigation in a horizontal–verticalpulsed packed extraction column†
Sajad Khooshechin, ab Mohammad Ali Moosavian,a Jaber Safdari*b
and Mohammad Hassan Mallahb
In this study, hydrodynamic parameters and themass transfer coefficient were investigated in a pilot version
of a horizontal–vertical pulsed packed extraction column using a toluene–acetone–water system. The
effects of the operational parameters on the volumetric overall mass transfer coefficient and
hydrodynamic parameters away from the flooding point were studied, and it was found that the
volumetric overall mass transfer coefficient, mean drop size and disperse phase holdup were significantly
affected by the pulse intensity. However, the dispersed and continuous phase flow rates have a weaker
effect. On the other hand, by increasing the pulse intensity the mean drop size and volumetric overall
mass transfer coefficient were reduced and increased, respectively, in both sections of the column, but
the disperse phase holdup displayed different behavior in the horizontal and vertical sections. By
increasing the pulse intensity, the disperse phase holdup was first reduced and then increased in the
horizontal section; however, an incremental trend was observed in the vertical section. The effect of the
dispersed phase flow rate was significant for all the investigated parameters, but weaker. For instance, all
the investigated parameters were increased by enhancing the dispersed phase flow rate. In contrast, the
continuous phase flow rate has sometimes had no significant effect, for example, on the mean drop size
in both sections of the column. Finally, two empirical correlations for the prediction of the volumetric
overall mass transfer coefficient based on the continuous phase were derived in terms of the Sherwood
number, Reynolds number and other dimensionless numbers. Good agreement between predictions and
experiments was found for all operating conditions that were investigated.
1. Introduction
Liquid–liquid extraction is a useful technique used in variousseparation technologies, for example, in the chemical,biochemical, and petroleum industries, in hydrometallurgy forthe purication of metals and in nuclear fuel reprocessing.1–5
Solvent extraction equipment can be classied into mixer-settlers and different types of countercurrent extractioncolumns. On comparing the performance characteristics ofthese devices, columns are found to be highly efficient andexhibit low costs in respect of their stage numbers, solventinventory, settler area, site area and maintenance.6 The effi-ciency of mass transfer is generally a function of the diffusionconstant, degree of turbulence and interfacial area available formass transfer. Factors that can be changed by liquid–liquidcontactors to improve the efficiency of mass transfer include the
ngineering, University of Tehran, Tehran,
Nuclear Science and Technology Research
n. E-mail: [email protected]; Fax: +98
tion (ESI) available. See DOI:
5
degree of turbulence imparted to the system and the interfacialarea.7 The rate of mass transfer in liquid–liquid extraction canbe increased by mechanical agitation such as pulsationsimparted to the liquids by an external mechanical or electronicdevice. Internal mechanical parts are eliminated, leakage isminimized, and the pulsator can be isolated.7–10
One form of countercurrent extraction equipment that usesan external mechanical device is the pulsed column. Pulsedcolumns have been of interest in the eld of liquid–liquidextraction because pulsing improves the rate of mass transfer byreducing the drop size.10 Chantry et al. (1955) showed that thecolumn height required to achieve a given degree of extractionis reduced by a factor of three via pulsation. These columnshave an obvious advantage over other mechanical contactorswhen processing corrosive or radioactive solutions because thepulsing unit can be remote from the column. In addition, theabsence of moving mechanical parts in such columns facilitatesrepair and servicing. On the basis of the published literature,pulsed extraction columns can be categorized into the verticaltype (sieve plate, packed, and disc and doughnut), the hori-zontal type (sieve plate and packed) and the horizontal–verticaltype (sieve plate and packed), of which the horizontal–verticalpulsed packed column is introduced in this work.
This journal is © The Royal Society of Chemistry 2017
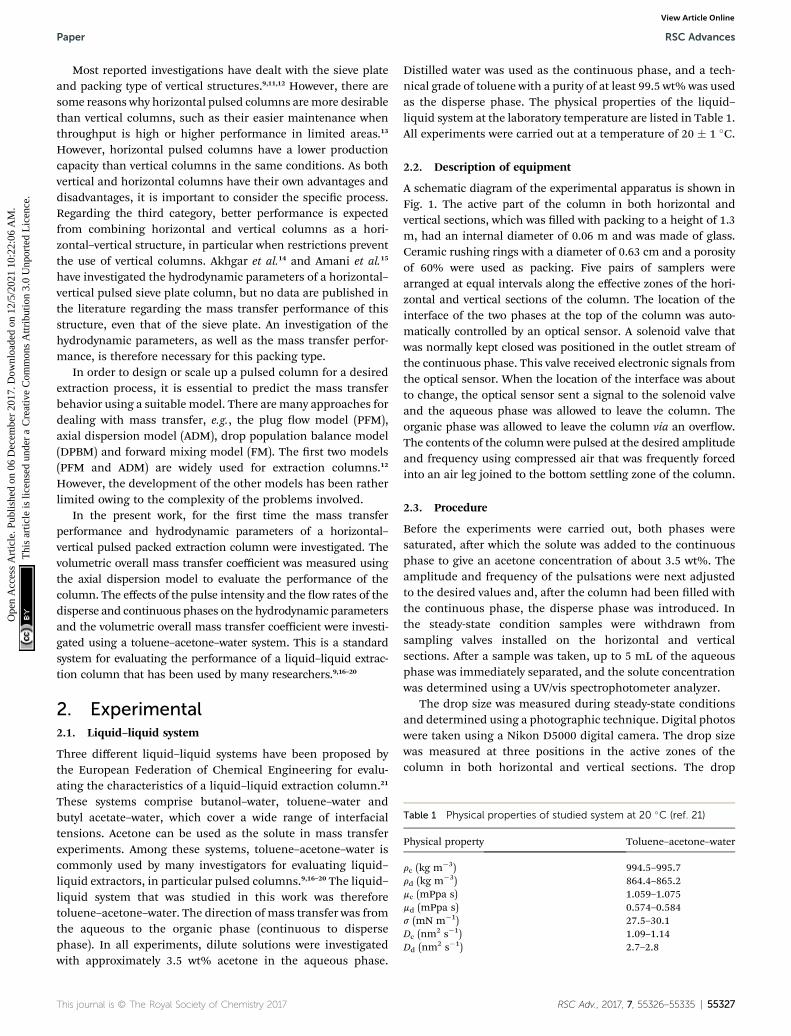
Table 1 Physical properties of studied system at 20 �C (ref. 21)
Physical property Toluene–acetone–water
rc (kg m�3) 994.5–995.7rd (kg m�3) 864.4–865.2mc (mPpa s) 1.059–1.075md (mPpa s) 0.574–0.584s (mN m�1) 27.5–30.1Dc (nm
2 s�1) 1.09–1.14Dd (nm2 s�1) 2.7–2.8
Paper RSC Advances
Ope
n A
cces
s A
rtic
le. P
ublis
hed
on 0
6 D
ecem
ber
2017
. Dow
nloa
ded
on 1
2/5/
2021
10:
22:0
6 A
M.
Thi
s ar
ticle
is li
cens
ed u
nder
a C
reat
ive
Com
mon
s A
ttrib
utio
n 3.
0 U
npor
ted
Lic
ence
.View Article Online
Most reported investigations have dealt with the sieve plateand packing type of vertical structures.9,11,12 However, there aresome reasons why horizontal pulsed columns aremore desirablethan vertical columns, such as their easier maintenance whenthroughput is high or higher performance in limited areas.13
However, horizontal pulsed columns have a lower productioncapacity than vertical columns in the same conditions. As bothvertical and horizontal columns have their own advantages anddisadvantages, it is important to consider the specic process.Regarding the third category, better performance is expectedfrom combining horizontal and vertical columns as a hori-zontal–vertical structure, in particular when restrictions preventthe use of vertical columns. Akhgar et al.14 and Amani et al.15
have investigated the hydrodynamic parameters of a horizontal–vertical pulsed sieve plate column, but no data are published inthe literature regarding the mass transfer performance of thisstructure, even that of the sieve plate. An investigation of thehydrodynamic parameters, as well as the mass transfer perfor-mance, is therefore necessary for this packing type.
In order to design or scale up a pulsed column for a desiredextraction process, it is essential to predict the mass transferbehavior using a suitable model. There are many approaches fordealing with mass transfer, e.g., the plug ow model (PFM),axial dispersion model (ADM), drop population balance model(DPBM) and forward mixing model (FM). The rst two models(PFM and ADM) are widely used for extraction columns.12
However, the development of the other models has been ratherlimited owing to the complexity of the problems involved.
In the present work, for the rst time the mass transferperformance and hydrodynamic parameters of a horizontal–vertical pulsed packed extraction column were investigated. Thevolumetric overall mass transfer coefficient was measured usingthe axial dispersion model to evaluate the performance of thecolumn. The effects of the pulse intensity and the ow rates of thedisperse and continuous phases on the hydrodynamic parametersand the volumetric overall mass transfer coefficient were investi-gated using a toluene–acetone–water system. This is a standardsystem for evaluating the performance of a liquid–liquid extrac-tion column that has been used by many researchers.9,16–20
2. Experimental2.1. Liquid–liquid system
Three different liquid–liquid systems have been proposed bythe European Federation of Chemical Engineering for evalu-ating the characteristics of a liquid–liquid extraction column.21
These systems comprise butanol–water, toluene–water andbutyl acetate–water, which cover a wide range of interfacialtensions. Acetone can be used as the solute in mass transferexperiments. Among these systems, toluene–acetone–water iscommonly used by many investigators for evaluating liquid–liquid extractors, in particular pulsed columns.9,16–20 The liquid–liquid system that was studied in this work was thereforetoluene–acetone–water. The direction of mass transfer was fromthe aqueous to the organic phase (continuous to dispersephase). In all experiments, dilute solutions were investigatedwith approximately 3.5 wt% acetone in the aqueous phase.
This journal is © The Royal Society of Chemistry 2017
Distilled water was used as the continuous phase, and a tech-nical grade of toluene with a purity of at least 99.5 wt% was usedas the disperse phase. The physical properties of the liquid–liquid system at the laboratory temperature are listed in Table 1.All experiments were carried out at a temperature of 20 � 1 �C.
2.2. Description of equipment
A schematic diagram of the experimental apparatus is shown inFig. 1. The active part of the column in both horizontal andvertical sections, which was lled with packing to a height of 1.3m, had an internal diameter of 0.06 m and was made of glass.Ceramic rushing rings with a diameter of 0.63 cm and a porosityof 60% were used as packing. Five pairs of samplers werearranged at equal intervals along the effective zones of the hori-zontal and vertical sections of the column. The location of theinterface of the two phases at the top of the column was auto-matically controlled by an optical sensor. A solenoid valve thatwas normally kept closed was positioned in the outlet stream ofthe continuous phase. This valve received electronic signals fromthe optical sensor. When the location of the interface was aboutto change, the optical sensor sent a signal to the solenoid valveand the aqueous phase was allowed to leave the column. Theorganic phase was allowed to leave the column via an overow.The contents of the column were pulsed at the desired amplitudeand frequency using compressed air that was frequently forcedinto an air leg joined to the bottom settling zone of the column.
2.3. Procedure
Before the experiments were carried out, both phases weresaturated, aer which the solute was added to the continuousphase to give an acetone concentration of about 3.5 wt%. Theamplitude and frequency of the pulsations were next adjustedto the desired values and, aer the column had been lled withthe continuous phase, the disperse phase was introduced. Inthe steady-state condition samples were withdrawn fromsampling valves installed on the horizontal and verticalsections. Aer a sample was taken, up to 5 mL of the aqueousphase was immediately separated, and the solute concentrationwas determined using a UV/vis spectrophotometer analyzer.
The drop size was measured during steady-state conditionsand determined using a photographic technique. Digital photoswere taken using a Nikon D5000 digital camera. The drop sizewas measured at three positions in the active zones of thecolumn in both horizontal and vertical sections. The drop
RSC Adv., 2017, 7, 55326–55335 | 55327
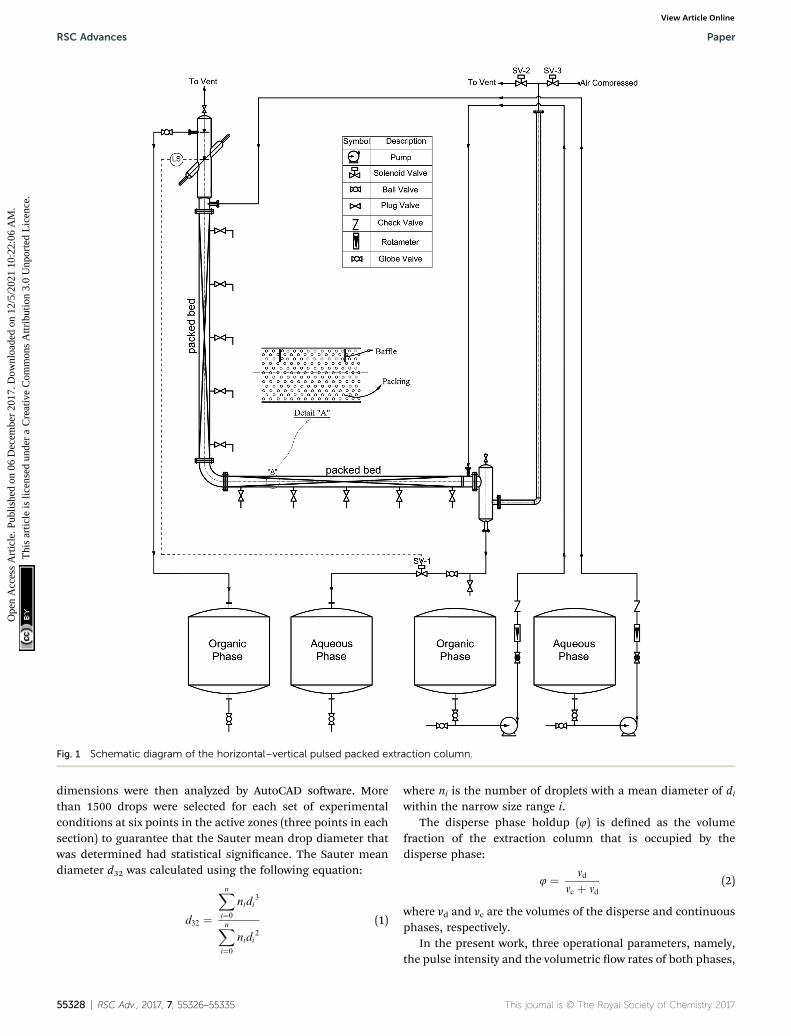
Fig. 1 Schematic diagram of the horizontal–vertical pulsed packed extraction column.
RSC Advances Paper
Ope
n A
cces
s A
rtic
le. P
ublis
hed
on 0
6 D
ecem
ber
2017
. Dow
nloa
ded
on 1
2/5/
2021
10:
22:0
6 A
M.
Thi
s ar
ticle
is li
cens
ed u
nder
a C
reat
ive
Com
mon
s A
ttrib
utio
n 3.
0 U
npor
ted
Lic
ence
.View Article Online
dimensions were then analyzed by AutoCAD soware. Morethan 1500 drops were selected for each set of experimentalconditions at six points in the active zones (three points in eachsection) to guarantee that the Sauter mean drop diameter thatwas determined had statistical signicance. The Sauter meandiameter d32 was calculated using the following equation:
d32 ¼
Xn
i¼0
nidi3
Xn
i¼0
nidi2
(1)
55328 | RSC Adv., 2017, 7, 55326–55335
where ni is the number of droplets with a mean diameter of diwithin the narrow size range i.
The disperse phase holdup (4) is dened as the volumefraction of the extraction column that is occupied by thedisperse phase:
4 ¼ vd
vc þ vd(2)
where vd and vc are the volumes of the disperse and continuousphases, respectively.
In the present work, three operational parameters, namely,the pulse intensity and the volumetric ow rates of both phases,
This journal is © The Royal Society of Chemistry 2017
Paper RSC Advances
Ope
n A
cces
s A
rtic
le. P
ublis
hed
on 0
6 D
ecem
ber
2017
. Dow
nloa
ded
on 1
2/5/
2021
10:
22:0
6 A
M.
Thi
s ar
ticle
is li
cens
ed u
nder
a C
reat
ive
Com
mon
s A
ttrib
utio
n 3.
0 U
npor
ted
Lic
ence
.View Article Online
were examined. Twenty experiments were carried out accordingto the central composite design method (CCDM), whereby theparameters were systematically varied in 15 experiments withthe central data point repeated six times in order to determinethe accuracy of the system in question and check the repro-ducibility of the experiments, which proved to be good. Theerror of the system was found to be about 4.3%. The intervals ofthe pulse intensity and the volumetric ow rates of thecontinuous and disperse phases were set to 1.2–1.6 cm s�1,1.0–4.0 L h�1, and 1.0–4.0 L h�1, respectively.
The average absolute relative deviation (AARD) was used tocompare the predicted results with the experimental data, andis dened as follows:
AARD ¼�
1
NDP
�XNDP
i¼1
jexperimental value� predicted valuejexperimental value
(3)
where NDP is the number of data points.
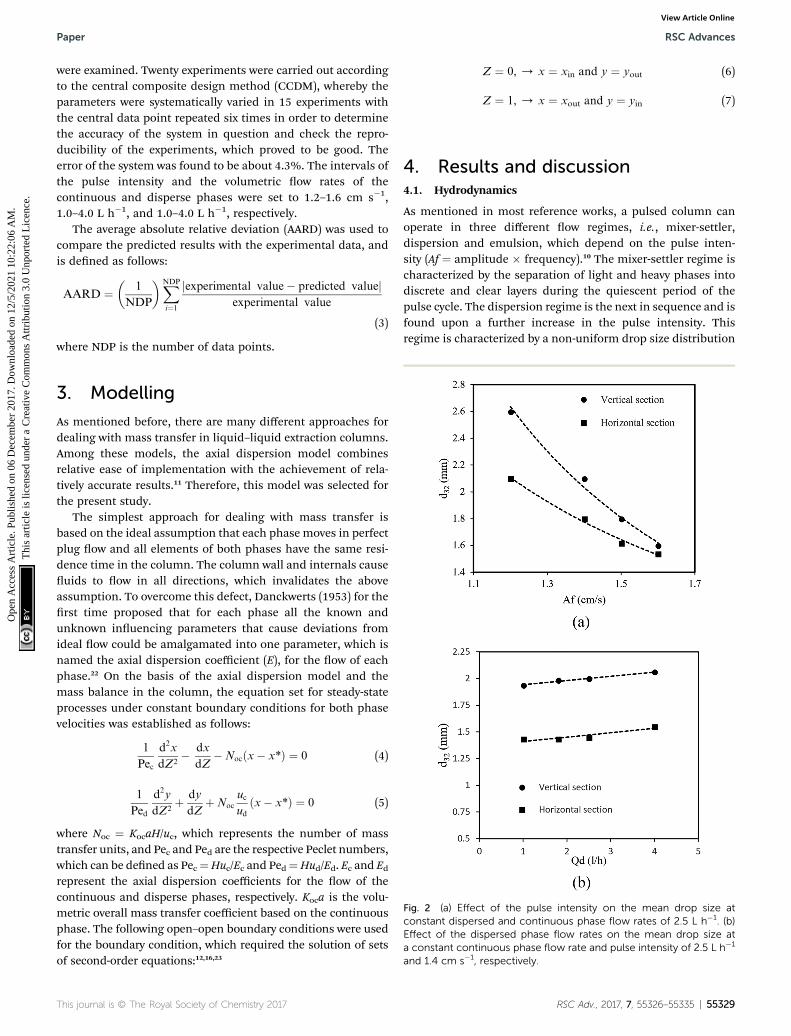
Fig. 2 (a) Effect of the pulse intensity on the mean drop size atconstant dispersed and continuous phase flow rates of 2.5 L h�1. (b)Effect of the dispersed phase flow rates on the mean drop size ata constant continuous phase flow rate and pulse intensity of 2.5 L h�1
and 1.4 cm s�1, respectively.
3. Modelling
As mentioned before, there are many different approaches fordealing with mass transfer in liquid–liquid extraction columns.Among these models, the axial dispersion model combinesrelative ease of implementation with the achievement of rela-tively accurate results.11 Therefore, this model was selected forthe present study.
The simplest approach for dealing with mass transfer isbased on the ideal assumption that each phase moves in perfectplug ow and all elements of both phases have the same resi-dence time in the column. The column wall and internals causeuids to ow in all directions, which invalidates the aboveassumption. To overcome this defect, Danckwerts (1953) for therst time proposed that for each phase all the known andunknown inuencing parameters that cause deviations fromideal ow could be amalgamated into one parameter, which isnamed the axial dispersion coefficient (E), for the ow of eachphase.22 On the basis of the axial dispersion model and themass balance in the column, the equation set for steady-stateprocesses under constant boundary conditions for both phasevelocities was established as follows:
1
Pec
d2x
dZ2� dx
dZ�Nocðx� x*Þ ¼ 0 (4)
1
Ped
d2y
dZ2þ dy
dZþNoc
uc
udðx� x*Þ ¼ 0 (5)
where Noc ¼ KocaH/uc, which represents the number of masstransfer units, and Pec and Ped are the respective Peclet numbers,which can be dened as Pec¼Huc/Ec and Ped¼Hud/Ed. Ec and Edrepresent the axial dispersion coefficients for the ow of thecontinuous and disperse phases, respectively. Koca is the volu-metric overall mass transfer coefficient based on the continuousphase. The following open–open boundary conditions were usedfor the boundary condition, which required the solution of setsof second-order equations:12,16,23
This journal is © The Royal Society of Chemistry 2017
Z ¼ 0, / x ¼ xin and y ¼ yout (6)
Z ¼ 1, / x ¼ xout and y ¼ yin (7)
4. Results and discussion4.1. Hydrodynamics
As mentioned in most reference works, a pulsed column canoperate in three different ow regimes, i.e., mixer-settler,dispersion and emulsion, which depend on the pulse inten-sity (Af ¼ amplitude � frequency).10 The mixer-settler regime ischaracterized by the separation of light and heavy phases intodiscrete and clear layers during the quiescent period of thepulse cycle. The dispersion regime is the next in sequence and isfound upon a further increase in the pulse intensity. Thisregime is characterized by a non-uniform drop size distribution
RSC Adv., 2017, 7, 55326–55335 | 55329
RSC Advances Paper
Ope
n A
cces
s A
rtic
le. P
ublis
hed
on 0
6 D
ecem
ber
2017
. Dow
nloa
ded
on 1
2/5/
2021
10:
22:0
6 A
M.
Thi
s ar
ticle
is li
cens
ed u
nder
a C
reat
ive
Com
mon
s A
ttrib
utio
n 3.
0 U
npor
ted
Lic
ence
.View Article Online
and no coalescence of drops of the disperse phase. With anincrease in the pulse velocity, the drop size decreases and thusan emulsion is formed. All these ow regimes can be observedin the vertical and horizontal types of pulsed sieve plate column.However, on the basis of our knowledge and practical obser-vations, only the dispersion and emulsion regimes are found ina vertical pulsed packed column, in contrast to the horizontaltype. Regarding the structure of the pulsed column used in thiswork, we should determine the transitional pulse intensityrequired to work in the dispersion regime. This is usually therecommended regime, as it combines high ux and good masstransfer.24 Therefore, as was described above, it was possible toidentify visually different ow regimes by applying differentpulse velocities. Thus, values of A and f that led to the dispersionregime were selected. Aer a few tests, the minimum andmaximum pulse intensities for working in the dispersionregime were found to be 1.2 and 1.6 cm s�1, respectively. Themaximum intensity was chosen to prevent ooding.
4.1.1. Sauter mean diameter. The drop size has an impor-tant effect on the disperse phase holdup and the maximumthroughput. Furthermore, the interfacial mass transfer area canbe determined using a combination of drop size and holdup.25
The drop size obviously depends on the rates of drop breakageand coalescence. On the basis of the experiments conducted inthis research, the main operational parameters that affect themean drop size are the pulse intensity and the ow rates of thedisperse phase. The effect of the pulse intensity on the Sautermean drop size is shown in Fig. 2a. As can be seen, the Sautermean drop size decreased with an increase in the pulse inten-sity, because drop breakage is enhanced with an increase in
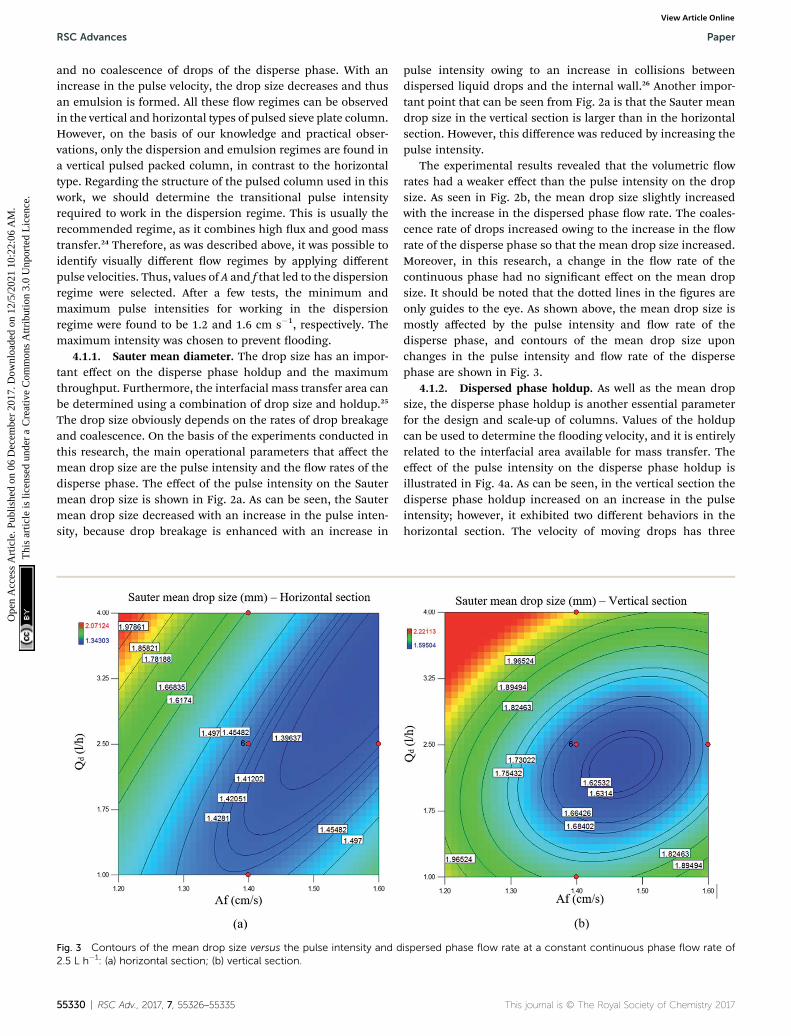
Fig. 3 Contours of the mean drop size versus the pulse intensity and d2.5 L h�1: (a) horizontal section; (b) vertical section.
55330 | RSC Adv., 2017, 7, 55326–55335
pulse intensity owing to an increase in collisions betweendispersed liquid drops and the internal wall.26 Another impor-tant point that can be seen from Fig. 2a is that the Sauter meandrop size in the vertical section is larger than in the horizontalsection. However, this difference was reduced by increasing thepulse intensity.
The experimental results revealed that the volumetric owrates had a weaker effect than the pulse intensity on the dropsize. As seen in Fig. 2b, the mean drop size slightly increasedwith the increase in the dispersed phase ow rate. The coales-cence rate of drops increased owing to the increase in the owrate of the disperse phase so that the mean drop size increased.Moreover, in this research, a change in the ow rate of thecontinuous phase had no signicant effect on the mean dropsize. It should be noted that the dotted lines in the gures areonly guides to the eye. As shown above, the mean drop size ismostly affected by the pulse intensity and ow rate of thedisperse phase, and contours of the mean drop size uponchanges in the pulse intensity and ow rate of the dispersephase are shown in Fig. 3.
4.1.2. Dispersed phase holdup. As well as the mean dropsize, the disperse phase holdup is another essential parameterfor the design and scale-up of columns. Values of the holdupcan be used to determine the ooding velocity, and it is entirelyrelated to the interfacial area available for mass transfer. Theeffect of the pulse intensity on the disperse phase holdup isillustrated in Fig. 4a. As can be seen, in the vertical section thedisperse phase holdup increased on an increase in the pulseintensity; however, it exhibited two different behaviors in thehorizontal section. The velocity of moving drops has three
ispersed phase flow rate at a constant continuous phase flow rate of
This journal is © The Royal Society of Chemistry 2017
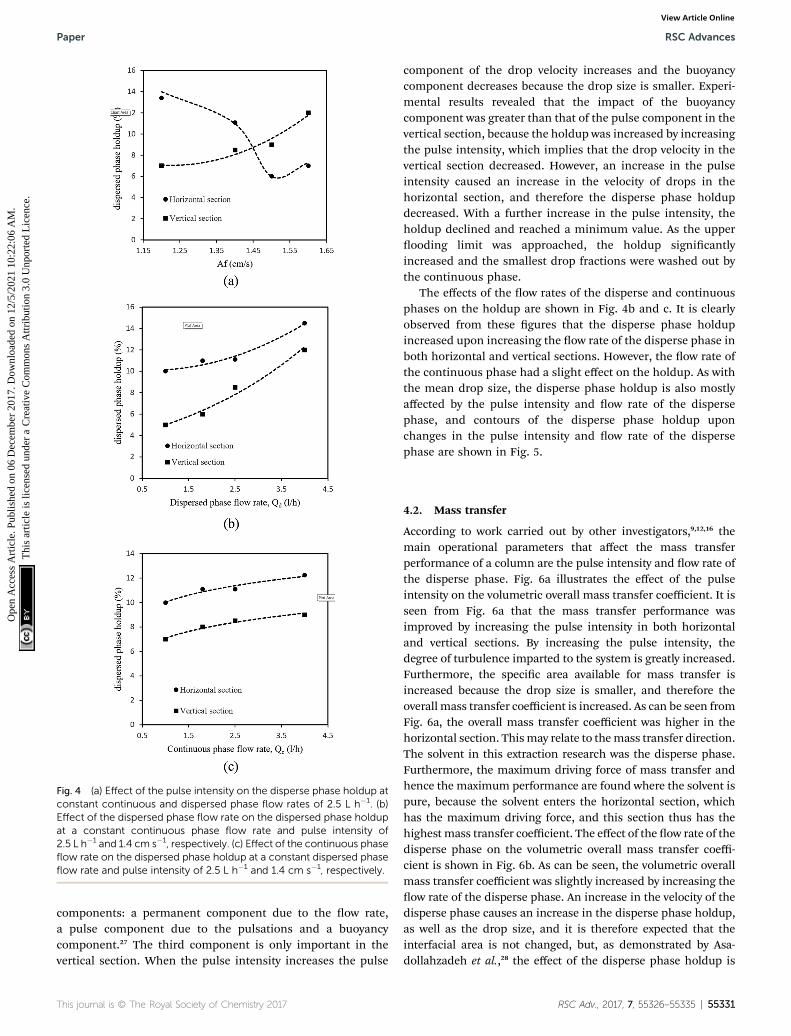
Fig. 4 (a) Effect of the pulse intensity on the disperse phase holdup atconstant continuous and dispersed phase flow rates of 2.5 L h�1. (b)Effect of the dispersed phase flow rate on the dispersed phase holdupat a constant continuous phase flow rate and pulse intensity of2.5 L h�1 and 1.4 cm s�1, respectively. (c) Effect of the continuous phaseflow rate on the dispersed phase holdup at a constant dispersed phaseflow rate and pulse intensity of 2.5 L h�1 and 1.4 cm s�1, respectively.
Paper RSC Advances
Ope
n A
cces
s A
rtic
le. P
ublis
hed
on 0
6 D
ecem
ber
2017
. Dow
nloa
ded
on 1
2/5/
2021
10:
22:0
6 A
M.
Thi
s ar
ticle
is li
cens
ed u
nder
a C
reat
ive
Com
mon
s A
ttrib
utio
n 3.
0 U
npor
ted
Lic
ence
.View Article Online
components: a permanent component due to the ow rate,a pulse component due to the pulsations and a buoyancycomponent.27 The third component is only important in thevertical section. When the pulse intensity increases the pulse
This journal is © The Royal Society of Chemistry 2017
component of the drop velocity increases and the buoyancycomponent decreases because the drop size is smaller. Experi-mental results revealed that the impact of the buoyancycomponent was greater than that of the pulse component in thevertical section, because the holdup was increased by increasingthe pulse intensity, which implies that the drop velocity in thevertical section decreased. However, an increase in the pulseintensity caused an increase in the velocity of drops in thehorizontal section, and therefore the disperse phase holdupdecreased. With a further increase in the pulse intensity, theholdup declined and reached a minimum value. As the upperooding limit was approached, the holdup signicantlyincreased and the smallest drop fractions were washed out bythe continuous phase.
The effects of the ow rates of the disperse and continuousphases on the holdup are shown in Fig. 4b and c. It is clearlyobserved from these gures that the disperse phase holdupincreased upon increasing the ow rate of the disperse phase inboth horizontal and vertical sections. However, the ow rate ofthe continuous phase had a slight effect on the holdup. As withthe mean drop size, the disperse phase holdup is also mostlyaffected by the pulse intensity and ow rate of the dispersephase, and contours of the disperse phase holdup uponchanges in the pulse intensity and ow rate of the dispersephase are shown in Fig. 5.
4.2. Mass transfer
According to work carried out by other investigators,9,12,16 themain operational parameters that affect the mass transferperformance of a column are the pulse intensity and ow rate ofthe disperse phase. Fig. 6a illustrates the effect of the pulseintensity on the volumetric overall mass transfer coefficient. It isseen from Fig. 6a that the mass transfer performance wasimproved by increasing the pulse intensity in both horizontaland vertical sections. By increasing the pulse intensity, thedegree of turbulence imparted to the system is greatly increased.Furthermore, the specic area available for mass transfer isincreased because the drop size is smaller, and therefore theoverall mass transfer coefficient is increased. As can be seen fromFig. 6a, the overall mass transfer coefficient was higher in thehorizontal section. Thismay relate to themass transfer direction.The solvent in this extraction research was the disperse phase.Furthermore, the maximum driving force of mass transfer andhence the maximum performance are found where the solvent ispure, because the solvent enters the horizontal section, whichhas the maximum driving force, and this section thus has thehighest mass transfer coefficient. The effect of the ow rate of thedisperse phase on the volumetric overall mass transfer coeffi-cient is shown in Fig. 6b. As can be seen, the volumetric overallmass transfer coefficient was slightly increased by increasing theow rate of the disperse phase. An increase in the velocity of thedisperse phase causes an increase in the disperse phase holdup,as well as the drop size, and it is therefore expected that theinterfacial area is not changed, but, as demonstrated by Asa-dollahzadeh et al.,28 the effect of the disperse phase holdup is
RSC Adv., 2017, 7, 55326–55335 | 55331
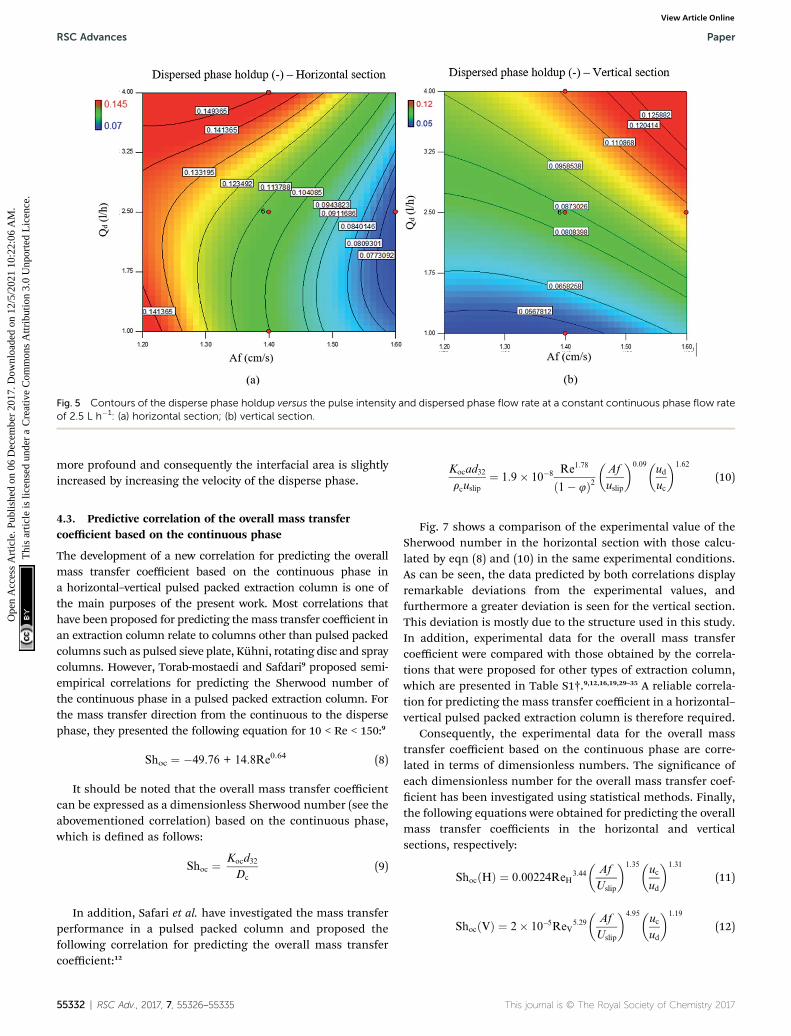
Fig. 5 Contours of the disperse phase holdup versus the pulse intensity and dispersed phase flow rate at a constant continuous phase flow rateof 2.5 L h�1: (a) horizontal section; (b) vertical section.
RSC Advances Paper
Ope
n A
cces
s A
rtic
le. P
ublis
hed
on 0
6 D
ecem
ber
2017
. Dow
nloa
ded
on 1
2/5/
2021
10:
22:0
6 A
M.
Thi
s ar
ticle
is li
cens
ed u
nder
a C
reat
ive
Com
mon
s A
ttrib
utio
n 3.
0 U
npor
ted
Lic
ence
.View Article Online
more profound and consequently the interfacial area is slightlyincreased by increasing the velocity of the disperse phase.
4.3. Predictive correlation of the overall mass transfercoefficient based on the continuous phase
The development of a new correlation for predicting the overallmass transfer coefficient based on the continuous phase ina horizontal–vertical pulsed packed extraction column is one ofthe main purposes of the present work. Most correlations thathave been proposed for predicting the mass transfer coefficient inan extraction column relate to columns other than pulsed packedcolumns such as pulsed sieve plate, Kuhni, rotating disc and spraycolumns. However, Torab-mostaedi and Safdari9 proposed semi-empirical correlations for predicting the Sherwood number ofthe continuous phase in a pulsed packed extraction column. Forthe mass transfer direction from the continuous to the dispersephase, they presented the following equation for 10 < Re < 150:9
Shoc ¼ �49.76 + 14.8Re0.64 (8)
It should be noted that the overall mass transfer coefficientcan be expressed as a dimensionless Sherwood number (see theabovementioned correlation) based on the continuous phase,which is dened as follows:
Shoc ¼ Kocd32
Dc
(9)
In addition, Safari et al. have investigated the mass transferperformance in a pulsed packed column and proposed thefollowing correlation for predicting the overall mass transfercoefficient:12
55332 | RSC Adv., 2017, 7, 55326–55335
Kocad32
rcuslip¼ 1:9� 10�8 Re1:78
ð1� 4Þ2�Af
uslip
�0:09�ud
uc
�1:62
(10)
Fig. 7 shows a comparison of the experimental value of theSherwood number in the horizontal section with those calcu-lated by eqn (8) and (10) in the same experimental conditions.As can be seen, the data predicted by both correlations displayremarkable deviations from the experimental values, andfurthermore a greater deviation is seen for the vertical section.This deviation is mostly due to the structure used in this study.In addition, experimental data for the overall mass transfercoefficient were compared with those obtained by the correla-tions that were proposed for other types of extraction column,which are presented in Table S1†.9,12,16,19,29–35 A reliable correla-tion for predicting the mass transfer coefficient in a horizontal–vertical pulsed packed extraction column is therefore required.
Consequently, the experimental data for the overall masstransfer coefficient based on the continuous phase are corre-lated in terms of dimensionless numbers. The signicance ofeach dimensionless number for the overall mass transfer coef-cient has been investigated using statistical methods. Finally,the following equations were obtained for predicting the overallmass transfer coefficients in the horizontal and verticalsections, respectively:
ShocðHÞ ¼ 0:00224ReH3:44
�Af
Uslip
�1:35�uc
ud
�1:31
(11)
ShocðVÞ ¼ 2� 10�5ReV5:29
�Af
Uslip
�4:95�uc
ud
�1:19
(12)
This journal is © The Royal Society of Chemistry 2017
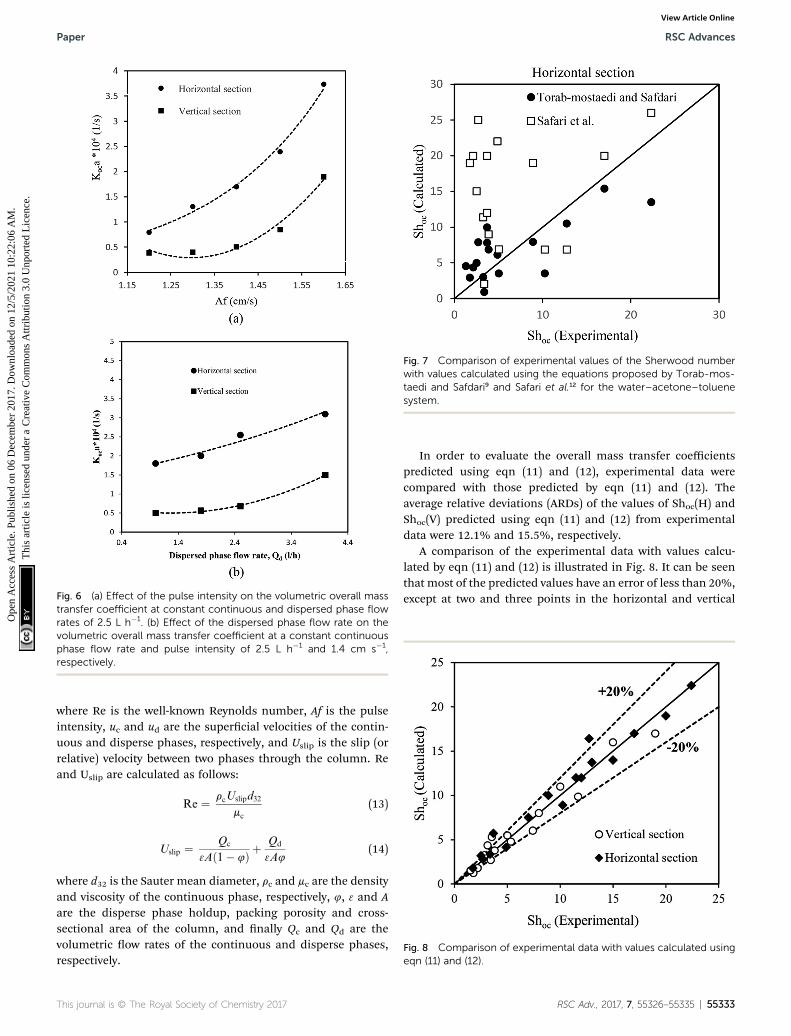
Fig. 6 (a) Effect of the pulse intensity on the volumetric overall masstransfer coefficient at constant continuous and dispersed phase flowrates of 2.5 L h�1. (b) Effect of the dispersed phase flow rate on thevolumetric overall mass transfer coefficient at a constant continuousphase flow rate and pulse intensity of 2.5 L h�1 and 1.4 cm s�1,respectively.
Fig. 7 Comparison of experimental values of the Sherwood numberwith values calculated using the equations proposed by Torab-mos-taedi and Safdari9 and Safari et al.12 for the water–acetone–toluenesystem.
Fig. 8 Comparison of experimental data with values calculated usingeqn (11) and (12).
Paper RSC Advances
Ope
n A
cces
s A
rtic
le. P
ublis
hed
on 0
6 D
ecem
ber
2017
. Dow
nloa
ded
on 1
2/5/
2021
10:
22:0
6 A
M.
Thi
s ar
ticle
is li
cens
ed u
nder
a C
reat
ive
Com
mon
s A
ttrib
utio
n 3.
0 U
npor
ted
Lic
ence
.View Article Online
where Re is the well-known Reynolds number, Af is the pulseintensity, uc and ud are the supercial velocities of the contin-uous and disperse phases, respectively, and Uslip is the slip (orrelative) velocity between two phases through the column. Reand Uslip are calculated as follows:
Re ¼ rcUslipd32
mc
(13)
Uslip ¼ Qc
3Að1� 4Þ þQd
3A4(14)
where d32 is the Sauter mean diameter, rc and mc are the densityand viscosity of the continuous phase, respectively, 4, 3 and Aare the disperse phase holdup, packing porosity and cross-sectional area of the column, and nally Qc and Qd are thevolumetric ow rates of the continuous and disperse phases,respectively.
This journal is © The Royal Society of Chemistry 2017
In order to evaluate the overall mass transfer coefficientspredicted using eqn (11) and (12), experimental data werecompared with those predicted by eqn (11) and (12). Theaverage relative deviations (ARDs) of the values of Shoc(H) andShoc(V) predicted using eqn (11) and (12) from experimentaldata were 12.1% and 15.5%, respectively.
A comparison of the experimental data with values calcu-lated by eqn (11) and (12) is illustrated in Fig. 8. It can be seenthat most of the predicted values have an error of less than 20%,except at two and three points in the horizontal and vertical
RSC Adv., 2017, 7, 55326–55335 | 55333
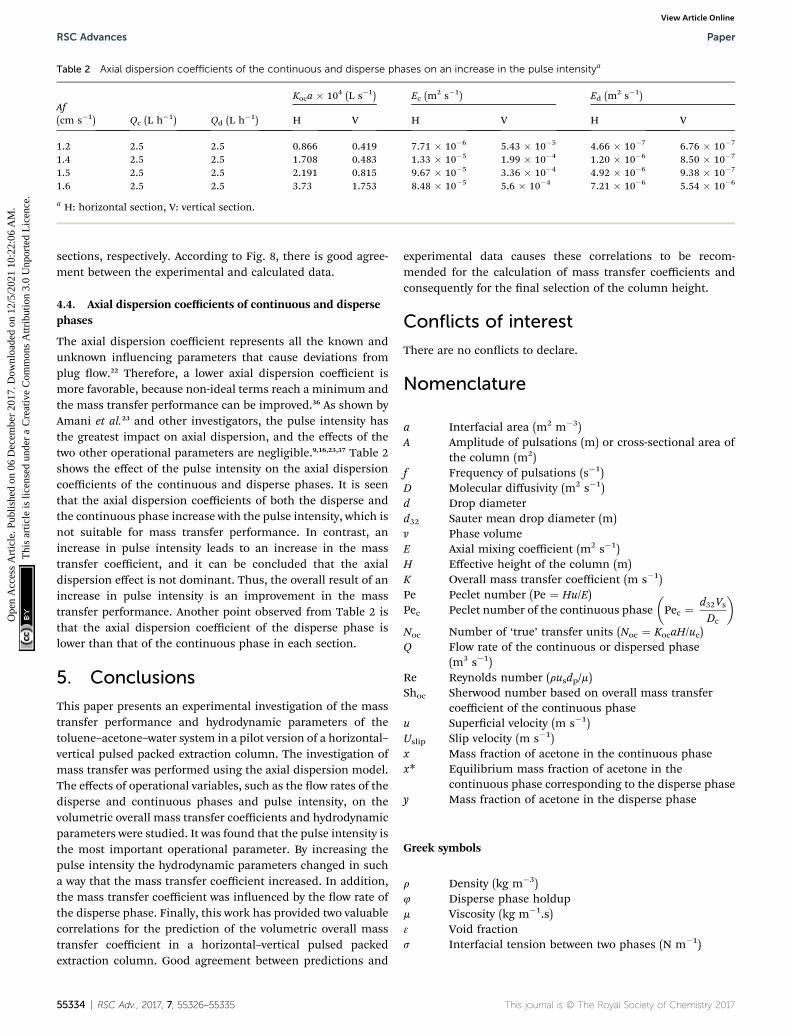
Table 2 Axial dispersion coefficients of the continuous and disperse phases on an increase in the pulse intensitya
Af(cm s�1) Qc (L h�1) Qd (L h�1)
Koca � 104 (L s�1) Ec (m2 s�1) Ed (m2 s�1)
H V H V H V
1.2 2.5 2.5 0.866 0.419 7.71 � 10�6 5.43 � 10�5 4.66 � 10�7 6.76 � 10�7
1.4 2.5 2.5 1.708 0.483 1.33 � 10�5 1.99 � 10�4 1.20 � 10�6 8.50 � 10�7
1.5 2.5 2.5 2.191 0.815 9.67 � 10�5 3.36 � 10�4 4.92 � 10�6 9.38 � 10�7
1.6 2.5 2.5 3.73 1.753 8.48 � 10�5 5.6 � 10�4 7.21 � 10�6 5.54 � 10�6
a H: horizontal section, V: vertical section.
RSC Advances Paper
Ope
n A
cces
s A
rtic
le. P
ublis
hed
on 0
6 D
ecem
ber
2017
. Dow
nloa
ded
on 1
2/5/
2021
10:
22:0
6 A
M.
Thi
s ar
ticle
is li
cens
ed u
nder
a C
reat
ive
Com
mon
s A
ttrib
utio
n 3.
0 U
npor
ted
Lic
ence
.View Article Online
sections, respectively. According to Fig. 8, there is good agree-ment between the experimental and calculated data.
4.4. Axial dispersion coefficients of continuous and dispersephases
The axial dispersion coefficient represents all the known andunknown inuencing parameters that cause deviations fromplug ow.22 Therefore, a lower axial dispersion coefficient ismore favorable, because non-ideal terms reach a minimum andthe mass transfer performance can be improved.36 As shown byAmani et al.23 and other investigators, the pulse intensity hasthe greatest impact on axial dispersion, and the effects of thetwo other operational parameters are negligible.9,16,23,37 Table 2shows the effect of the pulse intensity on the axial dispersioncoefficients of the continuous and disperse phases. It is seenthat the axial dispersion coefficients of both the disperse andthe continuous phase increase with the pulse intensity, which isnot suitable for mass transfer performance. In contrast, anincrease in pulse intensity leads to an increase in the masstransfer coefficient, and it can be concluded that the axialdispersion effect is not dominant. Thus, the overall result of anincrease in pulse intensity is an improvement in the masstransfer performance. Another point observed from Table 2 isthat the axial dispersion coefficient of the disperse phase islower than that of the continuous phase in each section.
5. Conclusions
This paper presents an experimental investigation of the masstransfer performance and hydrodynamic parameters of thetoluene–acetone–water system in a pilot version of a horizontal–vertical pulsed packed extraction column. The investigation ofmass transfer was performed using the axial dispersion model.The effects of operational variables, such as the ow rates of thedisperse and continuous phases and pulse intensity, on thevolumetric overall mass transfer coefficients and hydrodynamicparameters were studied. It was found that the pulse intensity isthe most important operational parameter. By increasing thepulse intensity the hydrodynamic parameters changed in sucha way that the mass transfer coefficient increased. In addition,the mass transfer coefficient was inuenced by the ow rate ofthe disperse phase. Finally, this work has provided two valuablecorrelations for the prediction of the volumetric overall masstransfer coefficient in a horizontal–vertical pulsed packedextraction column. Good agreement between predictions and
55334 | RSC Adv., 2017, 7, 55326–55335
experimental data causes these correlations to be recom-mended for the calculation of mass transfer coefficients andconsequently for the nal selection of the column height.
Conflicts of interest
There are no conicts to declare.
Nomenclature
a
Interfacial area (m2 m�3) A Amplitude of pulsations (m) or cross-sectional area ofthe column (m2)
f Frequency of pulsations (s�1) D Molecular diffusivity (m2 s�1) d Drop diameter d32 Sauter mean drop diameter (m) v Phase volume E Axial mixing coefficient (m2 s�1) H Effective height of the column (m) K Overall mass transfer coefficient (m s�1) Pe Peclet number (Pe ¼ Hu/E) �d V�
Pec
Peclet number of the continuous phase Pec ¼ 32 sDc
Noc Number of ‘true’ transfer units (Noc ¼ KocaH/uc) Q Flow rate of the continuous or dispersed phase(m3 s�1)
Re Reynolds number (rusdp/m) Shoc Sherwood number based on overall mass transfercoefficient of the continuous phase
u Supercial velocity (m s�1) Uslip Slip velocity (m s�1) x Mass fraction of acetone in the continuous phase x* Equilibrium mass fraction of acetone in thecontinuous phase corresponding to the disperse phase
y Mass fraction of acetone in the disperse phaseGreek symbols
r
Density (kg m�3) 4 Disperse phase holdup m Viscosity (kg m�1.s) 3 Void fraction s Interfacial tension between two phases (N m�1)This journal is © The Royal Society of Chemistry 2017
Paper RSC Advances
Ope
n A
cces
s A
rtic
le. P
ublis
hed
on 0
6 D
ecem
ber
2017
. Dow
nloa
ded
on 1
2/5/
2021
10:
22:0
6 A
M.
Thi
s ar
ticle
is li
cens
ed u
nder
a C
reat
ive
Com
mon
s A
ttrib
utio
n 3.
0 U
npor
ted
Lic
ence
.View Article Online
Subscripts/superscripts
c
This journa
Continuous phase or column
d Disperse phase o Overall value * Equilibrium value in Inlet to the column out Outlet from the columnReferences
1 X. Sun, H. Luo and S. Dai, Chem. Rev., 2012, 112, 2100–2128.2 S. Saha, R. Mistri and B. C. Ray, J. Chromatogr. A, 2010, 1217,307–311.
3 S. Saha, R. Mistri and B. C. Ray, J. Chromatogr. A, 2009, 1216,3059–3063.
4 D. P. Mantuano, G. Dorella, R. C. A. Elias and M. B. Mansur,J. Power Sources, 2006, 159, 1510–1518.
5 H. G. Schutze, W. A. Quebedeaux and H. Lochte, Ind. Eng.Chem., Anal. Ed., 1938, 10, 675–677.
6 J. C. Godfrey and M. J. Slater, Liquid–liquid extractionequipment, Wiley Chichester, UK, 1994.
7 S. Khooshechin, J. Safdari, M. A. Moosavian andM. H. Mallah, Int. J. Heat Fluid Flow, 2013, 44, 684–691.
8 A. Hussain, T.-B. Liang and M. Slater, Chem. Eng. Res. Des.,1988, 66, 541–554.
9 M. Torab-Mostaedi and J. Safdari, Chem. Eng. Process., 2009,48, 1321–1326.
10 R. Yadav and A. Patwardhan, Chem. Eng. J., 2008, 138, 389–415.
11 A. E. Ferreira, S. Agarwal, R. M. Machado, M. L. F. Gameiro,S. M. Santos, M. T. A. Reis, M. R. C. Ismael, M. J. N. Correiaand J. M. Carvalho, Hydrometallurgy, 2010, 104, 66–75.
12 A. Safari, J. Safdari, H. Abolghasemi, M. Forughi andM. Moghaddam, Chem. Eng. Res. Des., 2012, 90, 193–200.
13 A. Melnyk, S. Vijayan and D. Woods, Can. J. Chem. Eng., 1992,70, 417–425.
14 S. Akhgar, J. Safdari, J. Towghi, P. Amani and M. H. Mallah,RSC Adv., 2017, 7, 2288–2300.
15 P. Amani, J. Safdari, H. Abolghasemi, M. H. Mallah andA. Davari, Int. J. Heat Fluid Flow, 2017, 65, 266–276.
l is © The Royal Society of Chemistry 2017
16 M. Asadollahzadeh, A. Hemmati, M. Torab-Mostaedi,M. Shirvani, A. Ghaemi and Z. Mohsenzadeh, Chin. J.Chem. Eng., 2017, 25, 53–61.
17 M. Torab-Mostaedi, A. Ghaemi, M. Asadollahzadeh andP. Pejmanzad, Braz. J. Chem. Eng., 2011, 28, 447–456.
18 M. Torab-Mostaedi and J. Safdari, Braz. J. Chem. Eng., 2009,26, 685–694.
19 M. Torab-Mostaedi, S. Safdari, M. Moosavian andM. G. Maragheh, Braz. J. Chem. Eng., 2008, 25, 473–481.
20 M. Torab-Mostaedi, A. Ghaemi and M. Asadollahzadeh, Can.J. Chem. Eng., 2012, 90, 1570–1578.
21 T. Mısek, R. Berger and J. Schroter, EFCE Publ. Ser., 1985, 46,1.
22 P. Danckwerts, Chem. Eng. Sci., 1953, 2, 1–13.23 P. Amani, J. Safdari, A. Gharib, H. Badakhshan and
M. H. Mallah, Prog. Nucl. Energy, 2017, 98, 71–84.24 B. Grinbaum, Solvent Extr. Ion Exch., 2006, 24, 795–822.25 A. Kumar and S. Hartland, Ind. Eng. Chem. Res., 1996, 35,
2682–2695.26 S. Ousmane, M. Isabelle, M.-S. Mario, T. Mamadou and
A. Jacques, Chem. Eng. Res. Des., 2011, 89, 60–68.27 G. Angelov and C. Gourdon, Chem. Eng. Res. Des., 2012, 90,
877–883.28 M. Asadollahzadeh, S. Shahhosseini, M. Torab-Mostaedi and
A. Ghaemi, Chem. Eng. Res. Des., 2015, 100, 104–112.29 A. Rahbar-Kelishami and H. Bahmanyar, Chem. Eng. Res.
Des., 2012, 90, 615–621.30 C.-H. He, Y.-H. Gao, S.-H. Yang and D. W. Edwards, J. Loss
Prev. Process Ind., 2004, 17, 195–204.31 A. Kumar and S. Hartland, Chem. Eng. Res. Des., 1999, 77,
372–384.32 A. F. Seibert and J. R. Fair, Ind. Eng. Chem. Res., 1988, 27,
470–481.33 R. Cli, Bubbles, drops, and particles, 1978.34 M. E. Weber, Ind. Eng. Chem. Fundam., 1975, 14, 365–366.35 A. Lochiel and P. Calderbank, Chem. Eng. Sci., 1964, 19, 471–
484.36 T. C. Lo, M. H. I. Baird and C. Hanson, Handbook of solvent
extraction, Wiley, New York, 1983.37 F. Panahinia, J. Safdari, M. Ghannadi-Maragheh, P. Amani
and M. H. Mallah, Sep. Sci. Technol., 2017, 52, 1537–1552.
RSC Adv., 2017, 7, 55326–55335 | 55335