mass transfer studies of carbon dioxide absorption into...
TRANSCRIPT
Mass Transfer Studies of Carbon Dioxide Absorption into Aqueous
Solutions of 4-(Diethylamine)-2-Butanol, Blended Monoethanolamine
with 4-(Diethylamine)-2-Butanol, and Blended Monoethanolamine with
Methyldiethanolamine
A Thesis
Submitted to the Faculty of Graduate Studies and Research
In Partial Fulfillment of the Requirements
for the Degree of
Doctor of Philosophy
in
Industrial Systems Engineering
University of Regina
By
Abdulaziz Naami
Regina, Saskatchewan
July, 2012
©Copyright 2012: A. Naami

UNIVERSITY OF REGINA
FACULTY OF GRADUATE STUDIES AND RESEARCH
SUPERVISORY AND EXAMINING COMMITTEE
Abdulaziz Elmabruk Naami, candidate for the degree of Doctor of Philosophy in Industrial Systems Engineering, has presented a thesis titled, Mass Transfer Studies of Carbon Dioxide Absorption into Aqueous Solutions of 4-(Diethylamine)-2-Butanol, Blended Monoethanolamine with 4-(Diethylamine)-2-Butanol, and Blended Monoethanolamine with Methyldiethanolamine, in an oral examination held on May 11, 2012. The following committee members have found the thesis acceptable in form and content, and that the candidate demonstrated satisfactory knowledge of the subject material. External Examiner: *Dr. Pomthong Malakul Na Ayudhaya, Chulalongkorn University
Co-Supervisor: **Dr. Raphael Idem, Industrial Systems Engineering
Co-Supervisor: Dr. Paitoon Tontiwachwuthikul, Faculty of Engineering & Applied Science
Committee Member: Dr. Hussameldin Ibrahim, Industrial Systems Engineering
Committee Member: Dr. Farshid Torabi, Petroleum Systems Engineering
Committee Member: Dr. Renata Raina, Department of Chemistry & Biochemistry
Chair of Defense: Dr. Dongyan Blachford, Faculty of Graduate Studies and Research *Not present at defense **Participated via teleconference

i
Abstract
One of the parameters used to characterize the performance of a solvent for carbon
dioxide (CO2) capture is the mass transfer performance of CO2 absorption in the solvent.
In this study, a newly developed amino alcohol solvent, 4-(diethylamino)-2-butanol
(DEAB), was evaluated for its mass transfer performance as a single or blended solvent
in comparison with existing commercially available amine solvents. Consequently, the
mass transfer performance characteristics of the absorption of CO2 in aqueous solutions
of a primary alkanolamine (e.g. monoethanolamine, MEA), a tertiary amine (e.g.
methyldiethanolamine, MDEA) and DEAB were compared using a bench-scale absorber
packed with high efficiency DX structured packing at atmospheric pressure using a feed
gas mixture containing 14.9% CO2 and 85.1% nitrogen. The mass transfer performance
characteristics of CO2 absorption in aqueous blended MDEA/MEA solution with total
concentrations of 30 g/L and weight ratios of 27/03, 25/05, and 23/07, as well as aqueous
blended DEAB/MEA solution with concentrations of DEAB+MEA (g/L) of 3.5+30.23,
7.18+30.23, 14.43+30.23, 17.96+30.23, 21.82+30.23, 25.15+30.32, and 29.38+30.23
were also compared using the same experimental conditions. Specific absorption
performance criteria used for this study were CO2 removal efficiency, absorber height
requirement, the effective interfacial area for mass transfer, and the overall mass transfer
coefficient (KGav).
The results show that the new tertiary aqueous chemical solvent, DEAB, has a
much higher removal efficiency for CO2 along the height of the column than aqueous
MDEA, another tertiary solvent. The results for blended aqueous MDEA/MEA system

ii
and blended aqueous DEAB/MEA system showed that the ratios of 23/07 (g/L)
MDEA/MEA system and 17.96/30.23 of DEAB/MEA system respectively has the
highest CO2 removal efficiencies along the height of the column, highest KGav values and
highest cyclic capacities compared with other ratios tested, with the blended aqueous
DEAB/MEA system having extremely superior performance. Interestingly, the results of
the new blended amine solution demonstrate that the height of the column can be reduced
substantially by up to 32.5% compared even to pure aqueous MEA (30.23 g/L), which
before now, has been credited with providing the shorter column height.

iii
Acknowledgements
I wish to express my thanks to my thesis supervisors Professors Raphael Idem and
Paitoon Tontiwachwuthikul for their helpful advice, constant support, and encouragement
throughout this study. Their comments and suggestions not only provided valuable
knowledge but broadened my perspective in practical applications, as well. The valuable
discussion and brainstorming sessions I had with all members of the CO2 capture group
in our department as well as with Drs. M. Edali and D. deMontigny incited a lot of
amazing ideas, which have resulted in a more comprehensive work.
Also, thanks go to Mr. Ross Brice for his exceptional work on parts of the mass
transfer equipment. Reaching graduate school was made possible by the love, teaching,
and support of my parents and my brothers and sisters, and I greatly appreciate how they
invested themselves in me. My greatest support during the last few years came from my
wife, Elham. Her loyalty, faithfulness, patience, and positive enthusiasm provided much
needed strength during the preparation of this thesis. I am extremely grateful for the long
nights she spent in taking care of our kids, Hala, Ahmed, Fatima, Hajer, and Alaa to
allow me time for my research.
Finally, my thanks go to the Libya High Educational studies and to the Canadian
Bureau for International Education (CBIE) for their scholarship support and
administrative assistance during my PhD studies. Thank you also to the International Test
Centre for CO2 Capture (ITC), and the Faculty of Graduate Studies and Research (FGSR)
for financial their support, and to the Natural Sciences and Engineering Research Council
of Canada (NSERC) for support through funding received by my supervisors.

iv
Dedication
This work is dedicated to
My parents,
Al-Hajj-Elmabruk Milad Naami and AL-Hajja-Keruma Ramadan Naami
And
My wife, Elham Kashkusha
And
Beautiful kids, Hala, Ahmed, Fatima, Hajer, and Alaa
And
My brothers, Mohamed, Keri, and Milad Naami
And
My sisters, Hamuda, Kerua, and Asha Naami

v
Table of Contents
Abstract ................................................................................................................................ i
Acknowledgements ............................................................................................................ iii
Dedication .......................................................................................................................... iv
List of Figures ................................................................................................................... xii
List of Tables .................................................................................................................. xvii
Chapter 1 ............................................................................................................................. 1
Introduction ......................................................................................................................... 1
1.1 General .......................................................................................................................... 1
1.2 CO2 Capture by Post-Combustion Technologies .......................................................... 5
1.2.1 Absorption process ................................................................................................. 5
1.2.2 Adsorption process ................................................................................................. 7
1.2.3 Cryogenics ............................................................................................................. 7
1.2.4 Membrane processes .............................................................................................. 7
1.3 CO2 Absorption Process ............................................................................................... 8
1.3.1 Absorption using packed columns ....................................................................... 10

vi
1.4. Research Objectives ................................................................................................... 15
1.5 Thesis Outline ............................................................................................................. 16
1.6 References ................................................................................................................... 18
Chapter 2 ........................................................................................................................... 21
Overall Literature Review ................................................................................................. 21
2.1 Absorption Technique ................................................................................................. 21
2.2 Chemical Solvents for Absorption Process ................................................................. 22
2.2.1 Single aqueous amine........................................................................................... 24
2.2.2 Blended alkanolamines ........................................................................................ 25
2.3 Literature Review of New Chemical Solvents ............................................................ 26
2.3.1 New solvents for acid gas removal ...................................................................... 28
2.4 Physical Properties of Solvents ................................................................................... 30
2.5 Mass Transfer .............................................................................................................. 32
2.5.1 Determination of the overall mass transfer coefficient ........................................ 34
2.5.2 Structured packing ............................................................................................... 41
2.6 References ................................................................................................................... 42
CHAPTER 3 ..................................................................................................................... 48

vii
Experimental Section ........................................................................................................ 48
3.1 Mass Transfer Experimental Apparatus ...................................................................... 48
3.2 Experimental Procedure for Mass Transfer Experiments ........................................... 50
3.3 Sampling and Analysis ............................................................................................... 51
3.4 Optimized Operating Conditions for Packed Column ................................................ 51
3.5 References ................................................................................................................... 57
CHAPTER 4 ..................................................................................................................... 58
Comparison of Mass Transfer Performance of CO2 Absorption into Aqueous Solutions of
4-diethylamino-2-butanol, Monoethanolamine, and N-methyldiethanolamine ................ 58
4.1 Introduction ................................................................................................................. 58
4.2 Thermodynamics for CO2 Absorption ........................................................................ 59
4.2.1 Equilibrium concentration of CO2 in gas face (y*) .............................................. 60
4.2.2 Physical properties ............................................................................................... 61
4.3 Results and Discussion ............................................................................................... 61
4.3.1 Verification of the packed column. ...................................................................... 62
4.3.2 Effect of liquid flow rate in the packed column................................................... 63
4.3.3 Effect of CO2 loading on KGav ............................................................................. 68
4.3.4 Effect of concentration on loading capacity of DEAB ........................................ 68

viii
4.3.5 CO2 absorption performance of MEA, MDEA, and DEAB solutions................. 70
4.3.6 Effect of liquid temperature on KGav for DEAB .................................................. 76
4.4 Mass-Transfer Correlations ........................................................................................ 80
4.4.1 Development of a new correlation for DEAB ..................................................... 81
4.5 Relative Cost Issues .................................................................................................... 82
4.6 Summary and Conclusions ......................................................................................... 85
4.7 References ................................................................................................................... 87
Chapter 5 ........................................................................................................................... 90
Comparative Mass Transfer and Cyclic Capacity Performance Studies of CO2 Absorption
into Aqueous MEA, MDEA, and Blended MDEA/MEA Solutions ................................ 90
5.1 Introduction ................................................................................................................. 90
5.2 Determination of the Overall Mass Transfer Coefficient ........................................... 90
5.3 Experimental Section .................................................................................................. 91
5.4 Results and Discussion ............................................................................................... 92
5.4.1 CO2 Absorption performance of blended alkanolamine solution and single
amines ........................................................................................................................... 92
5.4.2 Effect of liquid flow rate on KGav for MEA-MDEA ........................................... 99
5.4.3 Effect of temperature on KGav for blended alkanolamine solution .................... 103

ix
5.4.4 Effect of lean loading on KGav for MEA/MDEA .............................................. 103
5.4.5 Effect of concentration on loading capacity of single and blended alkanolamine
..................................................................................................................................... 106
5.5 Regeneration Experiments for Single and Blended Alkanolamines ......................... 111
5.6 Summary and Conclusions ....................................................................................... 112
5.7 References ................................................................................................................. 119
Chapter 6 ......................................................................................................................... 121
Physical Properties of Blended Solutions of DEAB-MEA for CO2 Capture from Flue Gas
Streams ............................................................................................................................ 121
6.1 Introduction ............................................................................................................... 121
6.2. Experimental Section ............................................................................................... 122
6.3 Results and discussion .............................................................................................. 125
6.3.1. Density .............................................................................................................. 125
6.3.2 Viscosity ............................................................................................................ 132
6.4 Summary and Conclusions ....................................................................................... 137
6.5 Reference .................................................................................................................. 138
CHAPTER 7 ................................................................................................................... 140

x
Comparative Mass Transfer Studies of CO2 Absorption into Blended Amines (DEAB-
MEA) .............................................................................................................................. 140
7.1 Introduction ............................................................................................................... 140
7.2 Determination of the Overall Mass Transfer Coefficient ......................................... 140
7.3 Experimental Section ................................................................................................ 141
7.4 Results and Discussion ............................................................................................. 142
7.4.1 CO2 Absorption performance of blended amine solution DEAB+MEA ........... 142
7.4.2 Effect of liquid flow rate in the packed column................................................. 143
7.4.3 Effect of temperature on KGav for ratio of 0.25/5.0M DEAB+MEA in the packed
column ......................................................................................................................... 148
7.4.4 Effect of lean loading on KGav for DEAB+MEA .............................................. 151
7.4.5 Effect of solution concentration of blended amine DEAB+MEA on KGav ....... 151
7.4.6 Effect of blended amine ratio DEAB+MEA on cyclic capacity ........................ 153
7.5 Summary and Conclusions ....................................................................................... 159
7.6 References ................................................................................................................. 161
CHAPTER 8 ................................................................................................................... 162
Overall Conclusions and Recommendation .................................................................... 162
8.1 Conclusions ............................................................................................................... 162

xi
8.2 Recommendations for Future Work .......................................................................... 166
Appendix ......................................................................................................................... 167
Appendix A: Packed column experimental data for single and blended amines; MEA,
MDEA, DEAB, MEA+MDEA, and DEAB+MEA. ....................................................... 167
Appendix B: Sample Calculations .................................................................................. 189
B.1 The solubility of CO2 into DEAB ............................................................................ 189
B.2 The solubilities of NO2 ............................................................................................. 191
B.3 The solubilities of CO2 ............................................................................................. 191
B.4 The solubility of CO2 into DEAB ............................................................................. 192
APPENDIX C: Sample of Calculation for Mass Error ................................................... 194
C.1 Determine solution concentration ............................................................................ 194
C.2 Determine Solution Loading .................................................................................... 195
C.3 Mass Balance Error .................................................................................................. 196

xii
List of Figures
Figure 1.1 Canada’s GHG Emissions by Gas, Environment Canada 2008 ........................ 2
Figure 1.2 The Kyoto Protocol Implementation Act integrate modelling forecast in the
context of Canada’s 2020 target, Environment Canada 2010 ............................................. 3
Figure 1.3 Capture technologies for CO2 ............................................................................ 6
Figure 1.4: Typical process flow diagram of an absorption. ............................................ 11
Figure 1.5 Reduce the height of CO2 absorption column by improving the KGav value and
solvent ............................................................................................................................... 14
Figure 2.1 Concentration profiles across an interface ...................................................... 35
Figure 2.2: Determined (dYA,G/dZ) for Y = 0.09 from experiments ................................ 39
Figure 3.1: Mass Transfer Process - Experiment Schematic Diagram ............................. 49
Figure 3.2: Titration and CO2 loading measurment equipment [1]
.................................... 52
Figure 4.2: CO2 concentration profiles at different liquid loads for 2M MEA, DEAB, and
MDEA ............................................................................................................................... 66
Figure 4.3: Effect of liquid flow rate on KGav for 2M DEAB, MEA, and DEAB ............ 67
Figure 4.4: Effect of loading on KGav of 2M BEAB and MDEA ..................................... 69
Figure 4.5: Effect of DEAB concentration on cyclic capacity ......................................... 71

xiii
Figure 4.6: Effect of DEAB concentration on cyclic capacity ......................................... 72
Figure 4.7: CO2 concentration profile for 2M MEA, MDEA, and DEAB 2M liquid flow
rate of 5 m3/m
2·hr .............................................................................................................. 73
Figure 4.8: CO2 removal efficiency during absorption process ........................................ 74
Figure 4.9. Equilibrium solubility of CO2 in aqueous solutions of 2 M MEA, 2 M DEA, 2
M MDEA, 2 M AMP, 2 M DEAB, and 2 M PZ by (Sema, 2012) (lines are trend lines of
the experimental results (Sema et al, 2012)) ..................................................................... 77
Figure 4.10 CO2 concentration profiles under different liquid feed temperatures ............ 78
Figure 4.11 Effect of temperature on absorption efficiency for CO2-DEAB system ....... 79
Figure 4.12: Relationship between (KGav/L0.6
) and [(αeq-α)C]/PCO2 ................................. 83
Figure 4.13: Parity chart presenting the KGav value from experiment against prediction
for DEAB system .............................................................................................................. 84
Figures 5.1: CO2 Concentration profiles for mixed MEA/MDEA at a loading of 0.04
molCO2/mol amine ........................................................................................................... 94
Figures 5.2: CO2 Concentration profiles for mixed MEA/MDEA at a loading of 0.15 mol
CO2/mol amine .................................................................................................................. 95
Figures 5.3: CO2 Concentration profiles for mixed MEA/MDEA at a loading of 0.25 mol
CO2/mol amine .................................................................................................................. 96
Figures 5.4: Effect of MEA-MDEA ratio on KGav ........................................................... 97

xiv
Figures 5.5: Effect of lean loading on CO2 concentration profiles for 1.1/1.9 M-
MEA/MDEA solvent ........................................................................................................ 98
Figures 5.6: Absorption performances of blended MEA/MDEA, MEA, and MDEA.... 100
Figures 5.7: Effect of liquid flow rate on CO2 concentration profiles for MEA-MDEA
ratio 1.1/1.9M .................................................................................................................. 101
Figures 5.8: Effect of liquid flow rate on KGav for blended MEA/MDEA ..................... 102
Figures 5.9: Effect of temperature on CO2 concentration profiles for a ratio of 0.5/2.3M-
MEA/MDEA ................................................................................................................... 104
Figure 5.10: Effect of temperature on KGav for MEA/MDEA solvents ......................... 105
Figures 5.11: Effect of lean loading on KGav for ratios of 0.5/2.3M-MEA/MDEA ....... 107
Figures 5.12: Effect of lean loading on KGav for MEA/MDEA ..................................... 108
Figures 5.13: Effect of concentration ratios on cyclic capacity for MEA/MDEA amine109
Figures 5.14: Effect of concentration ratios on cyclic capacity for blended alkanolamine
MEA/MDEA and single amines MEA, MDEA, and DEAB .......................................... 110
Figure 5.15: Cyclic capacity for single and blended alkanolamines............................... 115
Figure 5.16: Regeneration experiments for single and blended alkanolamines ............. 116
Figure 5.17: Regeneration time for single and blended alkanolamines .......................... 117
Figure 5.18: CO2 loading at 530 min for single and blended amines ............................. 118

xv
Figure 6.1: Density of mixtures produced by experiments ............................................. 127
Figure 6.2: Density for different ratios produced by the correlation .............................. 130
Figure 6.3: New data produced by the correlation for DEAB-MEA ratios 17.96/30.27%
and 25.19/30.27 ............................................................................................................... 131
Figure 6.4: Experimental and calculation data for viscosity of blended solution DEAB-
MEA-H2O ....................................................................................................................... 136
Figure 7.1: CO2 concentration profiles along the column for bended DEAB-MEA ...... 144
Figure 7.2: CO2 concentration profiles along the column for bended DEAB-MEA and
single amine MEA .......................................................................................................... 145
Figure 7.3: Effect of liquid flow rate on CO2 absorption into DEAB-MEA .................. 146
Figure 7.4: Effect of liquid flow rate on KGav for 0.25M-DEAB and 5M-MEA ratio ... 147
Figure 7.5 Effect of temperature on CO2 absorption into DEAB-MEA ratio 0.25/5.0 .. 149
Figure 7.6: Effect of temperature on KGav for ratio of 0.25M-DEAB ............................ 150
Figure 7.7: Effect of CO2 loading on KGav for ratio of 0.25M-DEAB ........................... 152
Figure 7.8: Effect of solution concentration of DEAB-MEA on viscosity ..................... 154
Figure 7.9: Effect of solution concentration of DEAB-MEA on KGav value ................. 155
Figure 7.10: The highest KGav value for the solution concentration of (DEAB-MEA) . 156
xvi
Figure 7.11: Effect of concentration ratios on cyclic capacity for blended alkanolamine
(DEAB-MEA) ................................................................................................................. 157
Figure 7.12: Sema data (2012) ........................................................................................ 158

xvii
List of Tables
Table 1.1 Comparison of CO2 post-combustion capture technologies ............................... 9
Table 2.1: Structural formulas for alkanolamines ............................................................. 23
Table 3.1: Sample of packed column experimental data .................................................. 53
Table 4.2: Verifying the packed column performance ..................................................... 64
Table 5.1: Energy consumption for Single and Blended Alkanolamines ....................... 114
Table 6.1: Experimental data of density for blended amine solution of DEAB + MEA +
H2O ................................................................................................................................. 128
Table 6.2: Parameters for Density Correlations .............................................................. 129
Table 6.3: Experimental data of density for blended solution ........................................ 134
Table 6.4: Regressed parameters of McAllister correlation for Equation 6 of blended
amine solution DEAB + MEA + H2O ............................................................................. 135

xviii
Nomenclature
b Coefficient
C Amine concentration (moles of CO2/mol amine)
c Coefficient
LAC , Bulk concentration (kmol/m3)
F packing factor
G Gas mass velocity (lb/ft2.hr)
GI Gas flow rate (kmol/m2.hr)
ONHe2
Solubility of N2O, kPa m3/kmol
eaCOHe min2 Solubility of CO2 in aqueous amine solution, kPa m
3/kmol
eaONHe min2 Solubility of N2O in aqueous amine solution, kPa m3/kmol
DEABONHe 2 Solubility of N2O in pure DEAB, kPa m
3/kmol
OHCOHe22
Solubility of CO2 in water, kPa m3/kmol
OHONHe22 Solubility of N2O in water, kPa m
3/kmol
I enhancement factor (dimensionless)
Gk Gas side mass transfer coefficient (kgmol/m2.s.kPa)
GK Overall mass transfer coefficient (kgmol/m2.s.kPa)
kL Liquid side mass transfer coefficient (m/s)

xix
KL Overall mass transfer coefficient (m/s)
vGaK Volumetric overall mass transfer coefficient (kgmol/m2.s.kPa)
av Specific area of contact (m2/m
3)
L liquid flow rate (m3/m
2.hr)
AN Mass flux (kgmol/m2-s)
P Pressure, kPa
2COP Partial pressure of CO2 , kPa
T Temperature, Cº
GAY , Mole ratio value (mol/mol)
iAGA yy ,, , Mole fraction (kgmol/kgmol)
*
Ay Gas phase in equilibrium (mol/mol)
Z Height, (m)
ID Inside diameter (m)
ADD Absolute average deviation,%
Greek Symbols
eq CO2 loading of solution in equilibrium with 2COP (mol CO2/mol amine)
CO2 loading (mol CO2/mol amine)

xx
Liquid viscosity (cps)
µ Absolute viscosity (kg/m-hr)
ρ Density of solution (kg/m3)
v Kinematic viscosity (m2/hr)
Abbreviations
MDEA Methyldiethanolamine
MEA Monoethanolamine
DEAB 4-(diethylamino)-2-butanol
CO2 Carbon dioxide
DEA Diethanolamine
AMP 2-Amino-2-Methyl-Propanol
DGA Diglycolamine
TEA Triethanolamine

1
Chapter 1
Introduction
1.1 General
Energy consumption is the most critical factor for the growth of any nation’s
economy. The majority of global energy production is from fossil fuels, the world’s most
important energy source. This source of energy has been shown to be the key contributor
of carbon dioxide and the greenhouse gas (GHG) effect, which has a direct influence on
climate change and global warming. It also contributes to other pollutants such as oxides
of both nitrogen (NOx) and sulfur (SOx). The major greenhouse gases contributing to
global warming are presented in Figure 1.1 (Environment Canada 2008). Carbon dioxide
(CO2) constitutes the largest fraction of greenhouse gas emissions, accounting for 78.1 %
of the total greenhouse gases emitted in Canada (Environment Canada 2008). Canada had
committed to capping GHG emissions at 6% below the 1990 level, as per the Kyoto
Protocol target. In 2008, the emissions were 31.5% above the Kyoto Protocol's target at
175 million tonnes of CO2 (Environment Canada 2008), and the newest emission target,
which are 17% below 2005 level, by 2020 under the Copenhagen Accord as shown in
Figure 1.2.
The international community has concluded that there is compelling evidence that
human activities like energy use and deforestation are accelerating the concentration of
greenhouse gases in the earth’s atmosphere. There is general agreement that the world is
experiencing a change in the earth’s surface temperature. The average increase is

2
predicted to be 1.4 to 5.8ºC by 2100 with serious implications regarding global food and
water requirements (Climate Change Plan for Canada, 2003).
CO2
73%
CH4
13%
N2O
7%
HFCs
7%
PFCs
0.3% SFs
0.3%
Figure 1.1 Canada’s GHG Emissions by Gas, Environment Canada 2008

3
Figure 1.2 The Kyoto Protocol Implementation Act integrate modelling forecast in
the context of Canada’s 2020 target, Environment Canada 2010

4
One of the major sources of GHG emissions is flue gas. Flue gas is gas that exits to
the atmosphere via a flue, which is a pipe or channel for conveying exhaust gases from a
fireplace, oven, furnace, boiler, or steam generator. Its composition depends on what is
being burned, but it usually consists mostly of nitrogen (typically more than two-thirds)
derived from the combustion air, CO2, and water vapour, as well as excess oxygen.
The removal of carbon dioxide from gaseous mixtures not only is important in the
field of sour gas removal, but it is also used to curb emissions of greenhouse gases. The
process of CO2 capture and sequestration is considered to be one of the promising
potential approaches to reducing total GHG emissions and meeting the reduction targets
that have been set out. Carbon capture and storage (CCS) is a process designed to capture
CO2 emissions from large industrial facilities such as coal, oil, and gas combustion
facilities and other industrial operations before the CO2 is emitted to the atmosphere. The
goal of emission reduction programs is to capture CO2 emissions from industrial point
sources and to use it for other applications like enhanced oil recovery and then,
ultimately, store it underground. In enhanced oil recovery, for example, CO2 can be
injected into an oil reservoir in order to drive the oil out through the production wells,
with the CO2 then remaining trapped in the reservoir.
There are several ways to capture CO2:
Post-combustion capture: This is the most common and widely used process. In
this method, the CO2 is separated from other gases in the flue stack by using a
solvent. The most common solvent is chilled ammonia and other selective
solvents.

5
Pre-combustion capture: In this method, hydrogen and CO2 in a fossil fuel energy
source are separated prior to combustion. The fuel source becomes chemically
transformed into two gas streams consisting of hydrogen and CO2 that can be
easily captured.
Oxyfuel combustion: In this process, the burning of a fossil fuel energy source
occurs in the presence of pure oxygen. This removes contaminates including
nitrogen, creating an exhaust stream of pure CO2 that is easier to capture.
1.2 CO2 Capture by Post-Combustion Technologies
Several technologies are available for capturing CO2 from gas streams, and
depending on the nature of the problem, one process will be favoured over another.
Among these mature technologies, economics often serve as the determining factor for
process selection. Some of the common separation methods include adsorption,
cryogenics, membrane technologies, and absorption. Based on the method of CO2
removal, capture technologies can be broadly classified into a number of categories as
shown in Figure 1.3.
1.2.1 Absorption process
The absorption of CO2 is normally carried out in a counter current flow process
using a contact tower. The gas is introduced near the bottom of the absorber and the
liquid solvent is introduced at the top. The process of absorption is divided into chemical
absorption and physical absorption. The chemical absorption process is able to remove
the bulk of the CO2 from a flue gas stream, effectively. The physical process is based on

6
Activated carbon
Alkali Molecular sieves
Alumina
Other Silica gel
Selexol Pressure swing adsorption
Purisol Temperature swing adsorption
Other Electric swing adsorption
Sulfinol
Amisol
Other
Figure 1.3 Capture technologies for CO2
CO2 Capture Technology
Membrane Cryogenic
s
Adsorption Absorption
Chemical
Physical
Gas
Absorption
Gas
Separation
Adsorbent
Regeneration
Alkanolamine
e
New solvent
Mixed physical
Chemical solvent

7
the dissolving of CO2 gas molecules into a liquid solvent without chemical reaction.
However, physical absorption processes are not economically competitive when the CO2
partial pressure is low because the absorption capacity of a physical solvent is a strong
function of partial pressure.
1.2.2 Adsorption process
Adsorption is a viable option for carbon removal when the CO2 partial pressure is
high in the feed, the concentration of CO2 in the product is very small, and if there are
other gaseous impurities to be removed by the adsorbent. In the adsorption process, the
fluid is passed through the bed and the solid particles adsorb components from the fluid.
When the bed is almost saturated, the flow in the bed is stopped and the bed is
regenerated thermally or by other methods so that desorption occurs.
1.2.3 Cryogenics
Cryogenic separation has been used commercially for purification of CO2 from
streams that already have high CO2 concentrations. In this process, CO2 from combustion
gas streams can be liquefied by compression and cooling, and the liquefied CO2 will be
separated from the gas phase. However, cryogenic methods are expensive and have high
energy consumption because the cost and energy of gas compression and cooling are
high.
1.2.4 Membrane processes
Membrane technology is a semi permeable barrier that allows the passage of select
components. In this process, separation occurs by the membrane controlling the rate of

8
movement of various molecules between two liquid phases, two gas phases, or a liquid
and a gas phase. The two phases are usually miscible, and the membrane barrier prevents
actual, ordinary hydrodynamic flow. Meisen et al. (1997) described the membrane
technology for CO2 capture using a gas absorption membrane. In this process, the solid
micro-porous membrane is in contact with a liquid absorbent, and the solute gas must
first diffuse through the pores of the membrane before being absorbed into the liquid
solvent on the other side of the membrane wall.
In terms of suitability of capture systems, each capture technology discussed above
has different limitations and different applications. The selection of a suitable CO2
capture technology depends on many factors, such as the purity of the treated gases, the
volume of the gas stream, and the condition of the feed gas. Table 1.1 presents the
advantages and disadvantages of these CO2 capture technologies. At present, the
absorption process is the best method for CO2 removal from gas stream. However, this
process still has some weak points. In the chemical absorption process, the absorption
occurs at a low temperature and pressure; it is presently costly, with a significant amount
of energy required for regeneration of solvent.
1.3 CO2 Absorption Process
Removal of CO2 from gaseous mixtures by means of liquid absorbents continues to
be one of the leading research areas in the field of gas absorption. According to Astarita
et al. (1983) and Gupta et al. (1997), absorption is the most commonly used process when
it comes to gas treating. Presently, chemical absorption is the only commercially proven
process for CO2 capture from low CO2 concentration gas streams. In the CO2

9
Table 1.1 Comparison of CO2 post-combustion capture technologies
Techniques Advantages Disadvantages
Absorption Effective for dilute CO2
stream (typically flue gas
contains only about 10 to
14% CO2 by volume)
Can handle a large volume of
flue gas
Requires significant energy for
regeneration
Limited CO2 loading
Adsorption Uncomplicated technology Low efficiency
High operating cost (Meisen et
al., 1997)
Gas
Absorption
Membrane
Compact due to a high
packing density
Operation is independent of
gas and liquid flow rate
Less foaming, channelling,
flooding, (Falk-Pederson et
al., 1997)
Development of a CO2 selective
membrane is challenging since
each gas component has its own
solubility and permeability
through membrane material,
(Wolsk et al., 1994)
Cryogenics Use for high partial pressure
of CO2
Use for gas contained more
than 70% of CO2
High energy consumption
associated with gas compression
and cooling, (Plasynski et al.,
2002)

10
absorption systems, two main components are required, an absorber and a regenerator.
The absorber is used to capture CO2 from a gas phase into a liquid solvent, and
regeneration is used to strip CO2 out of the solvent so that it can be reused. In Figure 1.4,
the gas is introduced near the bottom of the absorber, and the liquid solvent, called lean
solvent at this stage because it has low CO2 content, is introduced at the top. The
absorption of CO2 is normally carried out in a counter current flow process using a
contact tower. In this system, absorption occurs when the gas solute transfers from the
gas phase into a liquid solvent across a gas-liquid interface, and the liquid solvent, now
rich in CO2 and called a rich solvent, leaves the absorber at the bottom. As the rich
solvent, carrying CO2, is sent to the regenerator, it passes through a heat exchanger and
then enters the top of regenerator. In the regenerator, the rich solvent is further heated so
that CO2 is stripped out of the solvent, and then the lean solvent is sent back to the
absorber. Meanwhile, water vapour and CO2 exit the top of the regenerator and are
cooled by a condenser. Finally, the water is reintroduced to the regenerator and CO2 is
sent for storage or industrial uses.
1.3.1 Absorption using packed columns
One of the critical factors in an absorption system is the contact between the gas
and liquid phases. The process of CO2 absorption in a packed tower depends mainly on
the contact between the flue gas and the liquid solvent. In the last thirty five years, tray
columns have been replaced in large part by packed columns, Meisen et al., (1997) and
Falk-Pedersen et al., (1997). This has been due to the successful development of efficient
packing that provides a high absorption capacity per unit volume of packing. Inside the
absorption column, the good packings should offer characteristics such as large surface

11
Regeneration
Lean Solvent
Absorber
Rich SolventRich/Line
Heat exchanger
Rich Solvent
Cooler
Lean Solvent
Condenser
Reflux
CO2
Pump
Feed Gas
Figure 1.4: Typical process flow diagram of an absorption.

12
area-to-volume ratio, low pressure drop across the absorber, and good, uniform
distribution between the gas and a contact area, which separates the liquid flow into
droplets. This increases the amount of liquid surface area that is exposed to the gas phase,
thereby enhancing absorption rates. On the basis of these characteristics, Aroonwilas et
al. (1999) and deMontigny et al. (2001) have shown that structured packings offer a
superior performance when compared to random packings. Fernandes et al. (2009)
studied structured packing and found that the high surface area in this packing increases
the mass transfer efficiencies.
The systematic study of mass transfer in packed columns started with the early
classical work on random packings performed in 1940, and in the 1970s, high
performance structured packings improved capacity and efficiency. Packed columns or
towers are preferred over spray and tray towers for gas/liquid contacting when
minimizing pressure drop and maximizing mass transfer are important. The pressure drop
in packed towers is considerably less than in tray towers, and they are often less
expensive. However, channeling may occur at low flow rates. When fouling is a problem,
tray towers are preferred because they can be cleaned more easily. Spray towers are used
for processing corrosive gases and liquids but typically have a poorer performance than
packed towers, as reported in Maddox (1994). Aroonwilas and Tontiwachwuthikul
(1994) reported that the structured packings provide a superior performance in terms of
mass transfer characteristics.
Gas-liquid mass transfer is one of the most fundamental steps in determining the
absorption rate. In the column process design, the most important part is the mass transfer

13
determination. In order to determine the mass transfer characteristics, experimental data
are needed for calculation using Eq. 1 below:
PAaK
YYGZ
vG
outCOinCOinert
,, 22 (1)
The height of the column (Z) can be calculated with Eq. 1. Also, experimental data are
needed to calculate the overall mass transfer coefficient (KGav) value. In gas treatment
processes, optimization of absorbers is mainly driven through the increase of mass
transfer characteristics between the gas to be treated and the liquid solvent. The height
and diameter of the absorption column can be reduced by improving the contact surface
area of the column, KGav value, and the chemical solvent as shown in Figure 1.5, and that
leads to a reduction of the capital cost and equipment cost and the operational costs in the
long term.
Chemical solvent is another key parameter that can be used to improve the efficacy
of the absorption column. Presently, the most commonly used chemical solvents are
amines, and these amines can be classified into three chemical categories: primary,
secondary, and tertiary amines. Typically, the principle amines in commercial CO2
absorption processes are monoethanolamine (MEA), diethanolamine (DEA),
methyldiethanolamine (MDEA), and 2-amino-2-methyl-1-propanol (AMP) (Sartori and
Savage, 1983; Tontiwachwuthikul et al., 1991; Kohl and Nielsen, 1997). According to
studies by Tontiwachwuthikul et al.,

14
AbsorptionZ
Absorption Z
Figure 1.5 Reduce the height of CO2 absorption column by improving the KGav
value and solvent

15
(2008) and Maneeintr et al. (2009), who developed amino alcohol solvent, 4-
(diethylamino)-2-butanol (DEAB), is being considered as a promising solvent for
capturing CO2 due to its energy efficiency for regeneration and very high absorption
capacity. The required characteristics to reduce the energy consumption in any CO2
capture technique can be achieved by application of mixed primary and tertiary amines.
Chakravarty et al. (1985) first suggested mixing a primary or secondary amine with
a tertiary amine to capitalize on the advantages of each amine and to compensate for the
undesirable properties of one amine using the second amine. By mixing a primary or
secondary amine with a tertiary amine, the CO2 absorption rate can be enhanced and the
energy requirement for the regeneration process can be reduced. Based on the suggestion
of Chakravarty et al., (1985), it is worthwhile to blend MEA with DEAB in order to
increase the absorption capacity and to reduce the energy consumption for regeneration.
Therefore, the primary focus of this research is on studying the mass transfer of CO2
absorption into aqueous solutions of the new formulated solvents (i.e., DEAB and blends
including DEAB) and comparing the results with MEA, MDEA, and blended MEA-
DEAB) because the overall mass transfer coefficient data is one of the key parameters
required for design of the absorber for a CO2 capture plant. Furthermore, the performance
of these newly formulated solvents in terms of the physical properties of MEA-DEAB is
also considered in this research.
1.4. Research Objectives
The overall objectives of this research are as follows: (1) to characterize and
evaluate the mass transfer performance as well as interpret the experimental mass transfer

16
data of three single and two blended solvent systems. The three single aqueous solvent
systems were CO2/MEA and CO2/MDEA, as well as the new chemical solvent system
(CO2/DEAB), while the two blended aqueous solvent systems were CO2/MEA/MDEA
and CO2/MEA/DEAB and (2) To determine the physical properties of a mixed solvent
system (CO2/MEA/DEAB). These objectives were accomplished by performing the
following specific tasks: (i) developing a comprehensive mass transfer performance study
of CO2 absorption into aqueous solution of a primary amine (MDEA) and an amino
alcohol (DEAB); (ii) conducting mass transfer experiments on the CO2 absorption into
MEA/MDEA mixed solvent wt ratio of 27/03, 25/05 and 23/07, and total amine
concentration of 30 wt %, using a mass transfer experimental 1-inch lab-scale column
with DX structured packing; (iii) measuring the physical properties of the mixed solvent
system DEAB/MEA and produce correlation models for the density and viscosity of the
system; and (iv) developing a comprehensive mass transfer model for the absorption of
CO2 into DEAB/MEA mixed solvent. The concentrations of the new blended amine
DEAB/MEA were: 0.25/5.0, 0.5/5.0, 1.0/5.0, 1.25/5.0, 1.5/5.0, 1.75/5.0, and 2.0/5.0M
total amine 7 mol.
1.5 Thesis Outline
The thesis is written in the integrated article format where Chapter 1 provides an overall
general introduction to the thesis work of this study while Chapter 2 provides a
comprehensive literature review of the subject matter of the present study. Chapter 3
describes the experimental section. Chapter 4 describes the mass transfer performance for
CO2 absorption in conventional amine, MEA and MDEA, and the new chemical solvent
DEAB. Chapter 5 discusses the mixed solvent system mass transfer work for

17
MEA/MDEA. Chapter 6 looks at physical properties of the mixed solvent system
DEAB/MEA, while Chapter 7 includes the comprehensive mass transfer work for the
mixed solvent system for CO2 absorption into DEAB/MEA. Each of Chapters 4 to 7 is a
standalone chapter with separate relevant sections such as introduction, literature review,
experimental procedures, results and discussion, and conclusion. Chapter 8 will provide a
summary of the overall conclusions and recommendations of the thesis work.
18
1.6 References
1. Aroonwilas, A.; Tontiwachwuthikul, P., Behaviour of the Mass Transfer Coefficients
of Structured Packing in CO2 Absorption with Chemical Reactions. Ind. Eng. Chem.
Res., 38, 1999.
2. Aroonwilas, A.; Tontiwachwuthikul, P., Mass Transfer Coefficients and Correlation
for CO2 Absorption into 2-Amino-2-methyl-1-propanol (AMP) Using Structured
Packing. Ind. Eng. Chem. Res., 37, 569, 1998.
3. Astarita, G., Savage, D. W., & Bisio, A. Gas treating with chemical solvents. New
York: Wiley, 1983.
4. Chakravaty, T.; Phukan, U.K.; Weiland, R.H. Reaction of acid gases with mixtures of
amines. Chem. Engng. Prog., 81, 32-36. 1985.
5. deMontigny, D.; Tontiwachwuthikul, P.; Chakma, A., Parametric Studies of Carbon
Dioxide Absorption into Highly Concentrated Monoethanolamine Solutions. Can. J.
Chem. Eng., 79, 137, 2001.
6. Environment Canada, Climate change plan for Canada,
http://www.ec.gc.ca/default.asp, 2003.
7. Environment Canada, Climate change plan for Canada,
http://www.climatechange.gc.ca/default.asp?lang=En&n=5497F282-1, 2010.
8. Falk-Pedersen, O., and Dannstrom, H., Separation of Carbone Dioxide from
Offshore Gas Turbine Exhaust, Energy COnvers. Mang., 38, 1997.

19
9. Fernandes J.; Pedro F. Lisboa; Pedro C. Simoes; Jose P. B. Mota; Esteban S.,
Application of CFD in the Study of Supercritical fluid Extraction with Structured
Packing. J. Supercritical. Fluid, 50, 61-69, 2009.
10. Gupta M., Coyle I., and Thambimuthu, K., CO2 Capture Technology and
Opportunities in Canada, 1st Canadian CC7S Technology Roadmap Workshop, 18-
19, 2003, Alberta, Canada, 2003.
11. Kohl, A.L.; Nielsen, R.B. Gas Purification: 5th Edition; Gulf Publishing Company:
Houston, Texas, USA, 1997.
12. Maddox R.N., Gas Conditioning and Processes, Volume 4: Gas Liquid Sweetening,
Campbell Petroleum Series, Norman, Oklahoma, USA, 1994.
13. Maneeintr, K.; Idem, R. O.; Tontiwachwuthikul, P.; Wee, A. G. H. Synthesis,
solubilities, and cyclic capacity of amino alcohols for CO2 Capture from flue gas
streams. Energy procedia, 1, 1327-1334. 2009.
14. Meisen A., and Shuai X., Research and Development Issues in CO2 Capture, Energy
Conversion and Management, 38, 37-42, 1997.
15. Meisen, A. And Shuai, X., Research and Development Issues in CO2 Capture,
Energy Convers. Mangt., 38, 1997.
16. National Inventory Report Greenhouse Gas Sources, Environment Canada, web site
at http://www.ec.gc.ca/ges-ghg, Annual 1990–2008.

20
17. Plasynski, I., and Chen Y., Review of CO2 Capture Technologies and Some
Improvement Opportunities, Ameri. Chem. Soci. 45, 644, 2002.
18. Sartori, G.; Savage, D.W. Sterically hindered amines for CO2 removal from gases.
Ind. Eng. Chem. Fundam., 22, 239-249, 1983.
19. Tontiwachwuthikul, P.; Meisen, A.; Lim, J.C. Solubility of CO2 in 2-amino-
2methyl-1-propanol solutions. J. Chem. Eng. Data, 36, 130-133. 1991.
20. Tontiwachwuthikul, P.; Wee, A. G. H.; Idem, R. O.; Maneeintr, K.; Fan, G. J.;
Veawab, A.; Aroonwilas, A.; Chakma, A. Method for capturing carbon dioxide from
gas streams. US Patent Application. US Patent Application, No. US 2008/0050296
A1, 2008.
21. Wolsk, M., Daniels. J., and Jody, J., (1994), CO2 Capture from the Fule Gas of
Conventional Fossil Fuel Fired Power Plants, Environment Progress, 13, 1994.

21
Chapter 2
Overall Literature Review
This chapter provides an overall literature review for the whole thesis. The review
includes the absorption technique for CO2 capture and the chemical solvents for the
absorption process. Chemical absorption solvents, single and mixed amines, new
chemical solvents, as well as the mass transfer and thermophysical properties of single
and mixed solvents are included.
2.1 Absorption Technique
Absorption technology is the most widely used process in many chemical and
process-oriented industrial operations. Absorption is widely used in the petroleum,
natural gas, and chemical industries for the separation or capture of CO2. In addition, this
technology is now being considered as a promising technique for CO2 capture from high
volume stationary emission sources (Lipinsky 1991). The operational costs for this
technology are high, especially regarding the large amount of energy required for the
solvent regeneration process. About 80% of the total energy consumption in an
alkanolamine absorption process occurs during solvent regeneration, and the rest of the
energy consumption comes from the pumps, cooling system, and compressor. The
absorption process may occur physically or chemically, depending on the solvent used.

22
2.2 Chemical Solvents for Absorption Process
The most commonly used technology today for low concentration CO2 capture is
absorption with chemical solvents. This chemical absorption process is adapted from the
gas processing industry where amine-based processes have been used commercially for
the removal of acid gas impurities from process gas streams. However, problems of
stability, scale, and efficiency become barriers when chemical solvents are used for high
volume gas flows with a relatively smaller fraction of valuable product. In addition, the
processes require large amounts of material to undergo significant changes in conditions,
leading to high investment costs and energy consumption.
There are a number of different solvents that have been applied in CO2 chemical
absorption. Most solvents are mixtures of water and base molecules. However, the bases
can either be inorganic or organic compounds. Furthermore, almost all organic bases are
amine molecules, such as alkanolamines. Alkanolamines are normally classified into
primary, secondary, and tertiary types. Primary amines include MEA and DEA,
secondary amines are typically TEA, and the typical tertiary amine is MDEA. Structural
formulas for the alkanolamines and DEAB are presented in Table 2.1. Primary and
secondary alkanolamines react rapidly with CO2 to form carbamates. However, the heat
of absorption associated with carbamate formation is high, which results in high solvent
regeneration costs. Also, the CO2 loading capacity of such alkanolamines is limited to 0.5
mol of CO2 per mol of amine. Tertiary alkanolamines possess no hydrogen atom attached
to the nitrogen atom, as in the case of primary and secondary alkanolamines. Thus,
carbamation reaction cannot take place, resulting in a low reactivity with CO2. Instead,

23
Table 2.1: Structural formulas for alkanolamines
Name Chemical Structure
Monoethanolamine MEA HO-CH2-CH2-NH2
HO-CH2-CH2
Methyldiethanolamine MDEA N CH3
HO-CH2-CH2
OH
4-diethylamine-2-butanol DEAB N

24
tertiary amines facilitate the CO2 hydrolysis reaction, forming bicarbonates. The reaction
heat released in bicarbonate formation is lower than that of carbamate formation,
reducing solvent regeneration costs. Moreover, tertiary amines have a high CO2 loading
capacity, such as, for example 1 mol of CO2 per mol of amine for MDEA.
2.2.1 Single aqueous amine
Single aqueous amine such as monoethanolamine (MEA) is the most widely used
solvent because it has a faster rate of reaction with CO2, which allows acid gas absorption
to take place in shorter columns (Strigle 1987; Kohl and Nielsen 1997).
Tontiwachwuthikul et al., (1992 and 1998) reported detailed absorption data for a CO2-
MEA system using up to 18wt% MEA concentration. Aboudheir et al. (1998) studied
MEA solutions as solvents for acid gas absorption systems, and new absorption data for
MEA systems was presented at ultra-high concentration of up to 54.0wt%. Aroonwilas et
al. (1999) examined aqueous solutions of MEA, and 2-amino-2- methyl-1-propanol
(AMP), which was employed as an absorption solvent for CO2 capture. Also, Aroonwilas
et al. (2004) examined single and blended alkanolamines. The single amines examined
were MEA, DEA, diisopropanolamine (DIPA), methyldiethanolamine (MDEA), and 2-
amino-2-methyl-1-propanol (AMP). The results showed that MEA and AMP are more
effective in CO2 absorption than MDEA solvent. Setameteekul et al., (2008) tested CO2
absorption systems using a single solvent, aqueous MEA, to study the effect of various
parameters on KGav value. From the literature, the operating cost of using MEA in the
absorption process is prohibitively high, mainly because the energy consumption is high
and CO2 loading capacity of such alkanolamines is limited to 0.5 mol of CO2 per mol of
amine. Also, severe operational problems such as corrosion and solvent degradation
25
occur. Thus, MDEA has high CO2 absorption capacity and low heat of regeneration but is
limited by slow kinetics whereas MEA is highly reactive with CO2 but has the limitation
of low CO2 absorption capacity, with an equilibrium absorption of 0.5 mol CO2/mol of
MEA, and it also has high heat of regeneration.
2.2.2 Blended alkanolamines
The required characteristics to reduce the energy consumption in any CO2
capture technique can be achieved by application of mixed primary and tertiary amines
such as MDEA and MEA solvents. MEA reacts more quickly with CO2 than MDEA, but
MDEA has a higher CO2 absorption capacity than MEA and requires lower energy
consumption to regenerate. The advantages of MDEA, a tertiary amine, over primary or
secondary amine include its high equilibrium loading capacity (1.0 mol of CO2 per mole
of amine) and its low heat of reaction with CO2, which leads to lower energy requirement
for regeneration. By varying the relative concentrations of the amines, an optimum
absorption system can be designed for a specific application. Charkravarty et al. (1985)
have suggested that blended amines can take advantage of each amine component by
adding a small amount of primary amine to a tertiary amine, and this can enhance the rate
of absorption of CO2 to a large extent without changing the stripping characteristics.
Mixed amine systems in acid gas treating processes are becoming more important
due to the increase of their use in process design. Mandal et al., (2001) investigated CO2
absorption into aqueous blends of MDEA and MEA, as well as AMP and MEA. These
blends were studied both experimentally and theoretically. Mass transfer, reaction
kinetics, and an equilibrium model were combined to describe CO2 absorption into mixed

26
solvents. The results showed that the addition of a small amount of MEA to an aqueous
solution of MDEA significantly improved the enhancement factor and rate of absorption
for both solvents.
Aroonwilas et al. (2004) studied the performance of different mixed amines such as
MEA-MDEA, DEA-MDEA, MEA-AMP, and DEA-AMP for CO2 capture. The results
showed that the AMP-based solvents, especially MEA-AMP, are more effective in CO2
absorption than MDEA-based solvents. Setameteekul et al., (2008) studied mixtures of
MEA-MDEA in CO2 absorption for coal-fired power plants and found that when the
MEA and MDEA are mixed at an appropriate ratio and used as a solvent for CO2 capture,
the energy consumption for regenerating CO2 is reduced significantly. Compared with
MEA only, the whole power plant with CO2 capture can improve thermal efficiency by
3%. Ramachandran et al. (2006) and Edali et al. (2009) studied blended amine systems of
MEA-MDEA. The results showed that adding MDEA to MEA solvent increases the
absorption capacity of CO2 and reduces the energy requirement for regeneration.
In the literature, mixed solvents such as primary and tertiary amines are promising
for CO2 capture in terms of cyclic capacity and the absorption rate. More research needs
to be done to find better tertiary amines than MDEA to reduce the energy consumption of
the absorption process, and this can be done by developing new chemical solvents with
high cyclic capacity.
2.3 Literature Review of New Chemical Solvents
CO2 removal through the application of alkanolamines has been used on a
commercial scale for more than a half century (Gupa et al., 2003). Acid gas removal by

27
absorption with aqueous alkanolamine solutions is the most widely used approach for
CO2 absorption. In this process, the regeneration of the used solvent is carried out in a
stripping column. The estimated energy used during the regeneration process for a
conventional MEA plant is over 80%. The basic alkanolamine process has remained
unchanged for many years, but current demands to reduce energy consumption and
decrease solvent losses are incentives for several modifications to upgrade the solvents.
Depending on the process requirements (e.g., the selective removal of H2S and/or CO2-
bulk removal), several options for alkanolamine-based gas treating solvents are available.
The process of CO2 absorption can be improved by using more efficient column
packing and good chemical solvent. Good column packing leads to improved mass
transfer, reducing the cost of the equipment and the long-term operational costs. In
addition, increasing the cyclic capacity of the solvent leads to reduced energy
consumption. Therefore, good solvent will be one of the primary solutions to improving
the CO2 absorption process. A solvent can be broadly defined as a solvent that has been
specifically formulated to perform a specific task. For example, a solvent might be
formulated for the selective separation of H2S from light hydrocarbons in the presence of
CO2 or for the bulk separation of CO2, and so on (Chakma et al., 1994; 1999). The
chemical solvent can consist of a single solvent such as DEA or can be a mixed solvent
such as one formed from the mixture of MEA and MDEA in an aqueous solution. Most
of the proprietary solvents marketed by the major solvent manufacturers are based on
new amines. Through the judicious choice of a new amine or amine mixture, the process
efficiency of existing plants can be enhanced significantly compared to the use of
conventional amines (Astarita et al., 1983).

28
The advantage of good solvents is that they can enhance the technology by
providing a lower energy consumption for stripping. Also, the new amines can absorb
more CO2 than conventional amines. Therefore, with higher chemical solvent cyclic
capacities, the thermal energy consumption for CO2 regeneration is expected to be
significantly less than that in the conventional MEA process. Moreover, the solvent
circulation rate, which is one of the most important factors in the economics of gas
treating with chemical solvents, is much lower, resulting in high cost savings (Sartori,
1978b).
2.3.1 New solvents for acid gas removal
Researchers and companies are still working to reduce the cost of the chemical
solvent for CO2 absorption technology by reducing the energy consumption. Recently,
many companies have developed proprietary hindered amines for use in removing acid
gas from gas streams. These companies are Mitsubishi, Exxon, Siemens, and Kansai
Electric. In the patents, a large number of sterically hindered amines are presented,
including more than 100 chemical solvents, and many of these chemicals are presented in
the literature (Maneeintr 2009). Sartori et al., (1987c) and Mimura et al. (1997) invented
many kinds of amines for use in many applications. Most of them are used for acid gas
removal, especially CO2. These amines can work individually or work with other
chemicals. Mimura et al. and Yoshida et al., (2002) developed many hindered amines to
apply to H2S absorption, and Yoshida et al., (2002) presented many similar types of
amines. Pennsylvania (2009) studied the thermodynamic and kinetic properties of a new
chemical solvent. The chemical solvent, called solvent A, a sterically hindered amine,
was studied to establish its potential as a viable CO2 solvent. The results indicate that
29
solvent A looks promising due to its reasonable reaction rate and CO2 solubility and its
potential for yielding lower regeneration energy. However, complete understanding of the
physicochemical properties, CO2 working capacity, and regeneration potential will be
needed before a final decision can be made on the potential of solvent (A) as an efficient
CO2 solvent (Tontiwachwuthikul et al., 2007).
Recently, the International Test Centre for Carbon Dioxide Capture (ITC),
Saskatchewan, Canada, has developed new chemical solvents based on amino alcohols
for CO2 capture to overcome the drawbacks of these conventional amines. The majority
of chemical solvents are amine-base solvents, and the limitations of this group, such as
regeneration and low absorption capacity, have led to research to develop chemical
solvent that increases the absorption capacity. Tontiwachwuthikul et al. (2008) and
Maneeintr et al. (2008) have developed new solvents (amino alcohol 4-diethylamino-2-
butanol (DEAB)) that can be used for the capture of CO2 from industrial flue gas in a
more efficient manner than conventional solvents. This solvent was studied further by
Maneeintr et al., (2007); they studied the solubility, physical and transport properties, and
mass transfer. The results showed that the absorption rate of DEAB has high cyclic
capacity and low energy for regeneration. However, it was mentioned by Maneeintr et al.
(2010), who studied the CO2 absorption performance of MEA and DEAB in terms of the
overall mass transfer coefficient, that the overall mass transfer coefficient of aqueous
DEAB solutions is lower than that of aqueous MEA solutions. The results also showed
that the reaction between CO2 and DEAB is probably slower than that of MEA. This is
because DEAB is a tertiary amine, since it has 3 carbon atoms attached to the nitrogen
atom (Maneeintr et al., 2010).

30
Sema et al., (2012) studied the equilibrium solubility of CO2 in aqueous DEAB.
The results showed that the equilibrium solubility of CO2 in DEAB is the highest
(comparable with those in 2M PZ). The equilibrium solubility of CO2 in DEAB is clearly
higher than that in AMP, MDEA, MEA, and DEA, respectively. In addition, in terms of
the heat of CO2 absorption, the results showed that the heat of CO2 absorption in aqueous
DEAB solution is lower than those in MDEA, DEA, and MEA. Conversely, the
regeneration energy for DEAB is lower than for MEA, DEAB, and MDEA, respectively.
Also for the volatility, the result showed that the volatility of DEAB is lower than that of
MEA and a bit higher than that of MDEA. This implies that DEAB is a good solvent in
terms of the solvent volatility (Sema et al. 2012). However, several investigations on
DEAB performance, such as reaction kinetics, mass transfer, corrosion, and degradation
behaviours, still need to be carried out before it can be used for commercial applications.
Furthermore, Maneeintr et al., (2010) reported that the mass transfer column setup
had liquid channelling that resulted in a smaller wetted surface area and decrease in KGav
values, especially at lower solution concentrations. New data on this solvent, presented in
Chapter 4, is focused on the mass transfer because the solvent has otherwise shown good
potential as a promising solvent for CO2 capture. In, addition, the experimental work
included efforts to gather mass transfer data on three single solvent systems (CO2/MEA),
(CO2/MDEA), along with the new chemical solvent system (CO2/ DEAB).
2.4 Physical Properties of Solvents
Physical properties of mixtures of liquids are required for the solution of many
engineering problems concerning mass transfer, heat transfer, and fluid flow. The

31
viscosity and density of liquid mixtures is important from a practical point of view, and it
is also of great interest from a theoretical view point in that mixture behaviour might lead
to better understanding of liquid theory. The physical properties of liquid mixtures have
attracted much attention in the literature (Reid et al., 1977). For the pure component
properties, it is important that the correlations used to model physical properties provide
reliable extrapolation to higher and lower temperatures with the measurement of as little
data as possible. This means using correlations that provide reasonable extrapolation, and
by limiting the number of coefficients in such correlations, they can be fitted to match the
amount of available data. A number of empirical equations have been successfully
developed for pure components and binary mixtures, but for ternary systems, these are
limited.
Understanding of physical properties has many applications in the chemical
industry and, essentially, influences all aspects of chemical plant operations. With the
availability of commercial simulation software, process simulation has become the main
tool for the development, design, and optimization of chemical processes. Physical and
transport properties for liquid solutions are needed to perform engineering calculations.
The use of such data is typically for dimensioning the column diameter and the
calculation of mass transfer correlation and mass-transfer rate modeling of absorbers and
regenerators because these properties affect the liquid-film coefficient for mass transfer
(Wang et al., 2005).
For the pure component properties, it is important that the correlations used to
model physical properties provide reliable extrapolation to higher and lower temperatures
with the measurement of as little data as possible. This means using correlations that

32
provide reasonable extrapolation by limiting the number of coefficients in such
correlations to be fitted to match the amount of available data. The correlation of density
and viscosity has been carried out by many researchers. Examples are the Redlich-Kister
equation for liquid density and the method developed by Grunberg et al. (1950) for liquid
viscosity. Also, the McAllister (1960) method for the ternary liquid systems for viscosity
appears widely in the literature (Reid et al. 1987; Chandramouii et al. 1963; Kalldas et al.,
1964; Manuchehr et al., 1982).
With respect to the work presented in this thesis, physical and transport properties
for the chemical solvents have been studied by Maneeintr et al. (2007) for aqueous amino
alcohol solution DEAB for CO2 capture from flue gas streams. Densities, viscosities, and
refractive indices of 4-diethylamino-2-butanol + water mixtures were measured
experimentally over the entire concentration range of 0–1 mole fraction and temperature
range of 298.15 to 343.15 K. For the new mixed solvent, the new physical property data
for DEAB + MEA + H2O are presented Chapter 6. The new chemical solvent was
examined experimentally by measuring the density and viscosity and producing the
correlations for the ternary systems to fit the experimental data.
2.5 Mass Transfer
Mass transfer is a common phenomenon that takes place in simple, everyday life as
well as engineering processes. Mass transfer is a result of a concentration difference, or
gradient, with the diffusing substance moving from a place of high to one of low
concentration. The transport process in different concentrations can be expressed by the
following general equation by (Geankoplis, 2003):

33
Rate of a transport process = driving force/resistance = (coefficient) (driving force) (2.1)
The processes take place by means of diffusion driven by a difference in concentration,
and the transport rate is the mass transfer flux. However, the driving force for this process
is the concentration gradient. Examples of some simple mass transfer that we encounter
daily include drying of clothes outside in summer and adding sugar to a cup of coffee or
tea. Industrial examples of mass transfer are distillation processes and flue gas clean up.
In the case of absorption, the mass transfer occurs when the gas phase transfers into a
liquid phase.
Film theory is the oldest and most obvious understanding of mass transfer
coefficients. In an absorption system, the mass transfer from a gas phase into a liquid
phase can occur through processes of physical absorption and chemical absorption. In the
mass transfer processes, film theory has been used to describe both physical and chemical
absorption at a molecular level. This model assumes that a film exists near a gas-liquid
interface where mass transfer only takes place through molecular diffusion, as described
by Astarita et al., (1983).
At steady state, the theory holds that mass transfer occurs via two films. Mass transfer
processes involve the contact of two or more phases, solute transfer from a gas phase into
a receiving liquid phase or solvent across a phase boundary or interface (Lewis et al.,
1924; Geankoplis 2003). These authors also described inter-phase transfer as being
confined to two thin stagnant films on either side of the gas-liquid interface. This film
consists of a liquid-side film and a gas-side film that contact each other at an interface. As
shown in Figure 2.1, the solute A transfers from the bulk gas phase into the bulk liquid

34
phase because of a difference in concentration. The mole fraction of A in the bulk gas,
YA,G, is constant but decreases to yA,i at the interface. On the liquid side, the mole fraction
of A at the interface is CA,i, which decreases to a constant value of CA,i in the bulk liquid.
As shown in Figure 2.1, the flux of A in terms of mass transfer coefficient for each phase
and the concentration changes can be describe in Eq. 2.2 as follows:
LAiA
o
LiAGAGA CCkyykN ,,,, (2.2)
2.5.1 Determination of the overall mass transfer coefficient
Mass transfer occurs when a component, called component A herein, in a gas phase
transfers across a gas-liquid interface into a liquid phase. Component A transfers from the
gas phase into the liquid because of a concentration gradient in the direction of mass
transfer within each phase. The mass flux of component A (NA) across the gas-liquid
interface at a steady state can be represented in terms of the gas-side mass-transfer
coefficient (kG) and driving force (yA,G – yA,i) as follows:
iAGAGA yyPKN ,, (2.3)

35
Concentration
of Solution
InterfaceLiquid FilmGas Film
y A,i
y A,G
C A,i
C A,L
Gas Phase
Mass Transfer Direction
Liquid Phase
Figure 2.1 Concentration profiles across an interface
where P represents the total pressure of the system and yA,G and yA,i represent the mole
fraction of component A in gas bulk. The gas mass transfer coefficient kG is difficult to
measure because of the change in interfacial area with varying gas flow rates in the
packed columns. Instead, the overall mass transfer coefficient for the gas phase (KG) is

36
often used (Geankoplis, 2003) and can be presented in terms of Henry’s law constant (H)
as follows:
LAGAGA HCPyKN ,, (2.4)
Strigle (1987) described the relationship between the overall mass transfer coefficients
and the individual mass transfer coefficients as follows:
LGG k
H
kK
11 (2.5)
The overall mass transfer coefficients for chemical absorption can be expressed as a
function of enhancement factor (I):
0
11
LGG Ik
H
kK (2.6)
The concentration gradients (yA,G – yA,i) take place over extremely small distances, which
makes it difficult to measure the concentration of component A at the gas-liquid
interface. Under this circumstance, it is more practical to express the mass flux in terms
of the overall mass transfer coefficient and the mole fraction of component A in the gas
phase (yA*) in equilibrium with the concentration of A in the bulk liquid as follows:
*
, AGAGA yyPKN (2.7)
Then, KG can be expressed as:

37
*
AA
AG
yyP
NK (2.8)
In a gas absorption apparatus such as a packed column, it is more useful to
represent rates of absorption in terms of volumetric overall mass transfer coefficients
represented by the term (KGav) instead of the one based on the interfacial area unit
because the gas-liquid interfacial area cannot be measured accurately.
Therefore, it is more useful to present the mass-transfer coefficient based on the
unit volume of the absorption column rather than based on the interfacial area unit as
follows:
*
AA
vAvG
yyP
aNaK (2.9)
The term of NAav can be determined from the absorption experiments in packed
columns where the concentration profile of the absorbed component A in the gas phase
can be measured along the column height, and that allows the KGav values to be
evaluated. Considering an element of the absorption column with height dZ, in Figure
3.1, the mass balance of component A can be given as follows:
A
AIvA
y
ydGdZaN
1 (2.10)
GAIAGAvG dYGdZyyPaK ,
*
, (2.11)

38
where YA,G represents the mole ratio of component A in the bulk gas and GI represents
the molar flow rate of total gas without component A. The final equation that determines
the overall mass transfer coefficient, KGav, can then be defined as follows:
dZ
dY
yyP
GaK
GA
AGA
IvG
,
*
,
(2.12)
This approach has been used successfully by Aroonwilas et al. (1999) and deMontigny et
al. (2001 and 2004) for analyzing packed columns. In this study, the CO2 absorption
experiments were carried out in test columns packed with structured packings. The
variables presented in Eq. 3.10 can be obtained from the absorption experiments. The
inert gas flow rate (GI) is an operating condition of the experiment, which is conducted at
atmospheric pressure (P). The CO2 concentration in the gas phase (yA,G) can be measured
along the length of the packed column. The y*A is the concentration of solute A in
equilibrium with the bulk concentration CA,L. The measured CO2 concentration can be
converted into mole ratio values (YA,G) and plotted against the height of the column to
obtain the solute mole ratio concentration gradient (dYA,G/dZ), as shown in Figure 2.2,
and the advantage of this technique is that it allows the calculation of the KGav value at
any specific mole ratio values along the column. However, when comparing the KGav
value for two experiments, it is important to make the comparison when similar

39
Packed Absorber
Column
Gas phase Liquid phase
Y A,G
NAZT
dz
Treated
Gas
Rich
Solution
Feed Gas
Gas liquid
interface
Lean
Solution
0.00
0.02
0.04
0.06
0.08
0.10
0.12
0.14
0.16
0.18
0.20
0 0.2 0.4 0.6 0.8 1 1.2
Y (
mo
le
rati
o)
Height from the Column Bottom (m)
Slope = dYA,G / dZdY
dZ
Figure 2.2: Determined (dYA,G/dZ) for Y = 0.09 from experiments

40
conditions exist in the system. For example, to compare the effect of liquid flow rate on
KGav values for two experiments, the solution concentration, mole ratio, and CO2 loading
conditions in the packed column should be the same, or at least in the same range, to
ensure that the calculated KGav values are being compared fairly. For example, if two
experiments had the same mole ratio value, but one experiment had a solution CO2
loading of α = 0.15 mol CO2/mol amine and the second a value of α = 0.36 mol CO2/mol
amine, the comparison would not be fair, since the second experiment had a reduced
capacity for absorption due to its high loading and relatively low free-amine
concentration. In order to determine the loading at a specific height of the column and
CO2 concentration, we used the following equation:
%/21. errormassLMtimeADDloadinglean (2.13)
where α is the CO2 loading at any height of the column, αlean loading is the loading of
solvent coming in at the top of the column, M is the solvent molarity, L is the liquid flow
rate, A is a cross sectional area of the column, AI yGD , where GI = inert gas flow
rate, and yA = gas phase CO2 concentration, and the mass error% is the error in the
experiment.
In the literature (Aroonwilas et al. 1999; deMontigny 2004), it is usually assumed
that the term y*
A is equal to zero because component A is quickly consumed in the fast
chemical reaction and difficult to measure, but in this work, the term y*
A was measured,
relying on the previous work of the solubility of CO2 into DEAB by Sema et al. (2012).

41
2.5.2 Structured packing
The process of CO2 absorption in a packed tower depends mainly on the contact
between the flue gas and the liquid solvent. In the last thirty five years, tray columns have
been replaced in large part by packed columns (Aroonwilas et al., 1998 and 1999). This
has been due to the successful development of efficient packing that provides a high
absorption capacity per unit volume of packing. Inside the absorption column, the
packing provides a contact area that separates the liquid flow into droplets. This increases
the amount of liquid surface area that is exposed to the gas phase, thereby enhancing
absorption rates. Good packings should offer characteristics such as large surface area-to-
volume ratio, low pressure drop across the absorber, and good uniform distribution
between the gas and liquid phases through the column. On the basis of these
characteristics, Aroonwilas et al., (1999) and deMontigny et al. (2001) have shown that
structured packings offer a superior performance when compared to random packings.
Fernandes et al. (2009) studied structured packing and found that the high surface area of
this packing increases the mass transfer efficiencies.
One of the earliest versions of modern structured packing was EX and DX packing,
(Sulzer Chemtech CANADA, Inc.). This packing has a coarser structure and, hence, a
lower number of theoretical stages. It is suitable for laboratory columns, where a modest
number of theoretical stages is required, together with low pressure drop and high
capacity. Standard structured packings are hardly suitable for use in laboratory columns
of less than 50 mm diameter, and Sulzer packing offers ID columns from 20 to 80 mm
and vacuum from (1-mbar). In this work, DX structured packing (27.5 mm) ID was used
to study the mass transfer.

42
2.6 References
1. Aboudheir, A., deMontigny, D., Tontiwachwuthikul, P., and Chakma, A., Important
Factors Affecting Carbon Dioxide Removal Efficiency By Using Extra-high
Concentrated Monoethanolamine Solutions and High-Capacity Packings, SPE Gas
Technology Symposium held in Calgary, Alberta, Canada.1998.
2. Anothai, S., Aroonwilas, A., Amornvadee V., Statistical factorial design analysis for
parametric interaction and empirical correlations of CO2 absorption performance in
MEA and blended MEA/MDEA processes. Separation and Purification Technology
64, 16–25. 2008.
3. Aroonwilas, A., Amornvadee, V., and Tontiwachwuthikul, P., Behaviour of the
Mass-Transfer Coefficient of Structured Packings in CO2 Absorbers with Chemical
Reactions. Ind. Eng. Chem. Res., 38, 2044-2050. 1999.
4. Aroonwilas, A., and Amornvadee, V., Characterization and Comparison of the CO2
Absorption Performance into Single and Blended Alkanolamines in a Packed
Column, Ind. Eng. Chem. Res., 43, 2228-2237. 2004.
5. Aroonwilas, A.; Tontiwachwuthikul, P., Mass Transfer Coefficients and Correlation
for CO2 Absorption into 2-Amino-2-methyl-1-propanol (AMP) Using Structured
Packing. Ind. Eng. Chem. Res., 37, 569.1998.
6. Astarita, G., Savage, D. W., & Bisio, A., Gas treating with chemical solvents. New
York: Wiley. 1983.

43
7. Chakma, A., Formulated Solvents: New Opportunities for Energy Efficient
Separation of Acid Gases, Energy Sources, Vol. 21, pp. 51-62. 1999.
8. Chakma, A., Separation of Acid Gases from Power Plant Flue Gas Streams by
Formulated Amines, Separation Technology, Vol. 11, pp. 727-737. 1994.
9. Chandramouii V. V.; Laddha, G. S. Indlan, J. Tech., 1, 199. 1963.
10. Charkravarty, T., Phuken, U.K., Reaction of acid gases with mixtures of amines.
Chem. Eng. Prog. 40, 32–36. 1985.
11. deMontigny, D., Comparing Packed Columns and Membrane Absorbers for CO2
Capture. PhD. Dissertation; University of Regina: Regina, Saskatchewan, Canada.
2004.
12. deMontigny, D.; Tontiwachwuthikul, P.; Chakma, A., Parametric Studies of Carbon
Dioxide Absorption into Highly Concentrated Monoethanolamine Solutions. Can. J.
Chem. Eng., 79, 137. 2001.
13. deMontigny, D.; Tontiwachwuthikul, P.; Chakma, A., Parametric Studies of Carbon
Dioxide Absorption into Highly Concentrated Monoethanolamine Solutions. Can. J.
Chem. Eng., 79, 137. 2001.
14. Edali, M. Kinetics, modeling, and simulation of carbon dioxide absorption into
mixed aqueous loaded solution blendes of methyldiethanolamine with
monoethanolamine and with piperazine; Ph.D. thesis, University of Regina, Regina,
Canada, 2010.

44
15. Edali, M.; Aboudheir, A.; Idem, R. Kinetics of carbon dioxide into mixed aqueous
solutions of MDEA and MEA using laminar jet apparatus and a numerically solved
2D absorption rate/kinetics model. International Journal of Greenhouse Gas Control,
3, 550-560. 2009.
16. Fernandes J.; Pedro F. Lisboa; Pedro C. Simoes; Jose P. B. Mota; Esteban S.,
Application of CFD in the Study of Supercritical fluid Extraction with Structured
Packing. J. Supercr. Fluid, 50, 61-69. 2009.
17. Geankoplis, C. J., Transport Process and Separation Process Principles, 4th
ed.;
Prentice Hall: NJ. 2003.
18. Grunberg, L., and Nissan, A., Viscosity of Highly Compressed Fluids, Ind. Eng. Chem.
The Bowater Paper Corporation, Ltd., North fleet, Kent, England. 1950.
19. Gupta, M., Coyle, I., and Thambimuyhu, K., CO2 Capture Technologies and
Opportunities in Canada, 1st Canadian CC7S Tschnology Roadmap Workshop,
Calgary, Alberta, Canada. 2003.
20. Kalldas, R.; Laddha, G. S., J. Chem. Eng. Data, 9, 142. 1964.
21. Kohl, A. L.; Riesenfeld, F. C. Gas Purification, 5th
ed., Gulf Publishing Co.;
Houston, Texas, 1997.
22. Lee, M.,and Lin, T. Density and Viscosity for Monoethanolamine + Water, +
Ethanol, and + 2-Propanol. J. Chem. Eng. Data, 40, 336–339. 1995.

45
23. Lewis, W. K. and W.G. Whitman, ‘‘Principles of gas Absorption’’, Industrial
Engineering Chemistry, 16(12), 1215, 1924.
24. Lipinsky, E.S., Final report on R&D ststus of carbon dioxide separation, disposal,
and utilization technologies to Trans Alta Utilities Corporation, Battelle, Columbus,
Ohio,1991.
25. Mandal, B.P., Guha, M., Biswas, A.K., Bandyopadhyay, S.S., Removal of carbon
dioxide by absorption in mixed amines: modelling of absorption in aqueous
MDEA/MEA and AMP/MEA solutions. Chemical Engineering Science 56, 6217–
6224. 2001.
26. Maneeintr K.; Idem, R. O.; Tontiwachwuthikul P.; Wee, A. G. H., Solvent
Development for CO2 Capture from Industrial Gas Streams. The 2nd International
Conference on Advances in Petrochemicals and Polymers (ICAPP2007); Bangkok,
Thailand, Jun 25-28. 2007.
27. Maneeintr, K., New Solvent for Acid Gas Separation PhD Thesis; University of
Regina: Regina, Saskatchewan, Canada. 2010.
28. Maneeintr, K.; Henni, A.; Idem, R. O.; Tontiwachwuthikul, P.; Wee, A. G. H.,
Physical and Transport Properties of Aqueous Amino Alcohol Solutions for CO2
Capture from Flue Gas Streams. Process Saf. EnViron. Prot., 86, 291–295. 2008.
29. Manuchehr D. And Ekkehard M., Correlation for Viscosity Data of Liquid Mixtures,
Ind. Eng. Chem. Process Des. Dev., 27, 282-289. 1982.

46
30. McAllister, R. A., AICHE J., 6 427. 1960.
31. Mimura, T., Shimayoshi, H., Mitsuoka, S., Tanaka, H., and Iijima, M., US. Patent,
No. 6117404. 1997.
32. Mimura, T., Shimojo, S., Iijima, M. And Mitsuoka, S., US. Patent, No. 5609840.
1997.
33. Pennsylvania, P., CO2 Chemical Solvent Screening, Presented at: 8th Annual
Conference on Carbon Capture and Sequestration – DOE/NETL, Babcock & Wilcox
Power Generation Group, Inc., Barberton, Ohio, U.S.A. 2009.
34. Ramachandran, N.T., Aboudheir, A., Idem, R., Tontiwachwuthikul, P., Kinetics of
the absorption of CO2 into mixed aqueous loaded solutions of monoethanolamine
and methyldiethanolamine. Ind. Eng. Chem. Res. 45, 2608–2616. 2006.
35. Reid C. R., Prausnitz J. M., and Poling E. B., The Properties of Gases and Liquids,
4th
ed., McGraw-Hill NEW York, 1937.
36. Reid, R. C.; Sherwood, T. K., “The Properties of Gases and Liquids”, McGraw- Hill:
New York, 1977.
37. Sartori, G. And Leder, F., US. Patent, No. 4112051. 1978b.
38. Sartori, G. And Leder, F., US. Patent, No. 4112051. 1978c.
39. Sema, T., Naami, A., Idem, R., and Tontiwachwuthikul P., Correlations for
Equilibrium Solubility of Carbon Dioxide in Aqueous 4-(Diethylamino)-2-butanol
Solutions. Industrial & Engineering Chemistry Research. 2012.

47
40. Strigle, R. F. Random Packing and Packed Towers; Gulf Publishing Company:
Houston, TX, 1987.
41. Tontiwachwuthikul, P., Meisen, A., and Lim, C., CO2 Absorption by NaOH,
Monoethanolamine and 2-Amino-2-methyl-1-propanol Solutions in a Packed
Column, Chem. Eng. Sci. 47, 381-381-390, 1992.
42. Tontiwachwuthikul, P., Wee, A. G. H., Idem, R. O., Maneeintr, K., Fan, G. J.,
Veawab, A., Henni, A, Aroonwilas, A. And Chakma. A., Method for Capturing
Carbon Dioxide from Gas Streams, Canadian Patent Application, No. 2598388.
2007.
43. Tontiwachwuthikul, P.; Wee, A. G. H.; Idem, R. O.; Maneeintr, K.; Fan, G.-J.;
Veawab, A.; Henni, A.; Aroonwilas, A.; Chakma. A., Method for capturing carbon
dioxide from gas streams. World Intellectual Property Organization Patent (WIPO),
No. WO/2008/022437. 2008.
44. Wang G. Q.; Yuan X. G.; Yu K. T. (2005), Review of Mass Transfer Correlations for
Packed Column. Ing. Eng. Chem. Res., 44, 8715-8729.
45. Yoshida, K., Mimura, T., Shimojo, S., Karasaki, M., Iijima, M., Seto, T. And
Mitsuoka, S., US Patent, No. 6500397 B1. 2002.

48
CHAPTER 3
Experimental Section
This section presents the general experimental apparatus, experimental procedures,
sample analysis, and optimized operating conditions for mass transfer experiments in a
packed column and all the experiments related to this thesis research.
3.1 Mass Transfer Experimental Apparatus
The absorption performance of alkanolamines was evaluated by conducting
experiments in a bench-scale absorption column unit, of which a simplified flow diagram
is given in Figure 3.1. The unit consists of a glass absorption column (27.5 × 10⁻²
m in
diameter and 2.15 m in height) packed with 37 elements of stainless steel structured
packing (Sulzer DX) and 900 m2/m
3 of surface area within the packing. The column was
designed for a counter current mode of operation in which a liquid solution is introduced
to the column at the top while a gas mixture enters the column below the packing section.
A series of gas sampling points was also installed at regular intervals along the sides of
the column to allow measurement of the gas-phase CO2 concentration during the
experiments, and a series of thermocouple points was also installed along the sides of the
column to allow measurement of the temperature of liquid during the experiments. The
absorption unit, as shown in Figure 3.1, was composed of (i) two 35-L solution tanks, (ii)
three calibrated mass flow meters, (iii) three needle valves, (iv) a variable-speed gear
pump, and (v) an infrared (IR) gas analyzer. The solution tanks served as reservoirs for

49
4
Glass
Packed
Column
Sulzer
DX
Packing
B2
3
2
6
B1
C2C1
Needle Valve
F
9
F Gas Mixer
Gas Line
5
1
Liquid
Line
Regeneration Line
FVent
7
8
Gas Flow out
Gas
Line
1. Lean solvent feed tank
2. Pump
3. Water bath
4. Glass Column
5. Gas line
6. Rich solution tank
7. Temperature thermocouple
8. CO2 analyzer
9. Mass flow meter
Gas phase Liquid phase
Y A,G
NA
dz
Gas liquid
interface
B1. Nitrogen cylinder
B2. Carbon dioxide cylinder
C1. Balloon filled with Nitrogen
C2. Balloon filled with Nitrogen
Figure 3.1: Mass Transfer Process - Experiment Schematic Diagram

50
supplying and receiving the liquid solution used in the experiments. Two mass flow
meters from Aalborg Instruments & Controls Inc. (model GFM 17) were used to measure
the flow rates for N2 and CO2 streams, respectively, and the third mass flow rate from
Bios International Corp. with high efficiency was used to measure the mixed gas stream
before entering the column. The gear pump (Cole-Parmer) was used to drive the liquid
solution to the top of the column. The IR gas analyzer (model 301D, Nova Analytical
Systems Inc.) was operated during the experiments to withdraw samples to measure the
CO2 concentration of the gas mixture inside the column. This analyzer can measure CO2
concentrations of up to 20%.
3.2 Experimental Procedure for Mass Transfer Experiments
Each experimental run began by introducing N2 and CO2 gases from cylinders
through mass flow meters at desired flow rates to produce a CO2 –N2 gas mixture, which
was fed to the bottom of the column. The concentration of CO2 in the feed gas was
checked with the IR gas analyzer and adjusted until the desired value was obtained. The
prepared solvent was then pumped at a given flow rate to the column top, and a needle
valve was installed on the top of the column to control the liquid flow rate so as to create
counter current contact between gas and liquid. After absorbing CO2 and traveling
through the column, the CO2-rich solution was collected continuously in the liquid
receiving tank. This operation was continued for at least 30 minutes to allow the system
to reach steady state conditions. At this point, gas-phase CO2 concentrations at different
positions along the column were measured through a series of sampling points using the
IR gas analyzer. At the same time, liquid samples were taken from the bottom of the

51
column and analyzed for their concentrations and CO2 loading. A sample of data
collected in a typical packed column experiment is presented in Table 3.1.
3.3 Sampling and Analysis
Prior to the experiments, an aqueous solution of the amine was prepared in the feed
tank by diluting the concentrated amine with deionized water to a given concentration.
However, the feed tank was connected with nitrogen balloons to keep the solvents under
a blanket of inert gas (nitrogen). The total amine concentration was determined by
titration with a standard 1.0 HCl solution using methyl orange as the indicator. The CO2
content in the liquid sample was then determined by the standred method given by the
Association of Official Analytical Chemisti (AOAC). A precise amount of the sample
was acidified by adding exess HCI solution. The CO2 released was measured in a
precision gas burette and used to calculate the CO2 loading of the aqueous amine
solution. Details of the gas apparatus are shown in Figure 3.2. Horwitz (1975) presented
the official analytical chemistry to determine the solution CO2 loading, and deMontigny
(2004) used the procedure as shown in Figure 3.2. Sample solution concentration and
CO2 loading calculations are given in Appendix B.
3.4 Optimized Operating Conditions for Packed Column
Packed towers operated in a two-phase counter-current flow have maintained an
important role in today’s chemical industry. The flooding capacity is determined by the
volume of fluid in the bed at which point the liquid starts to overflow. Flooding capacity
can only be observed and not measured. However, there is no accurate definition to
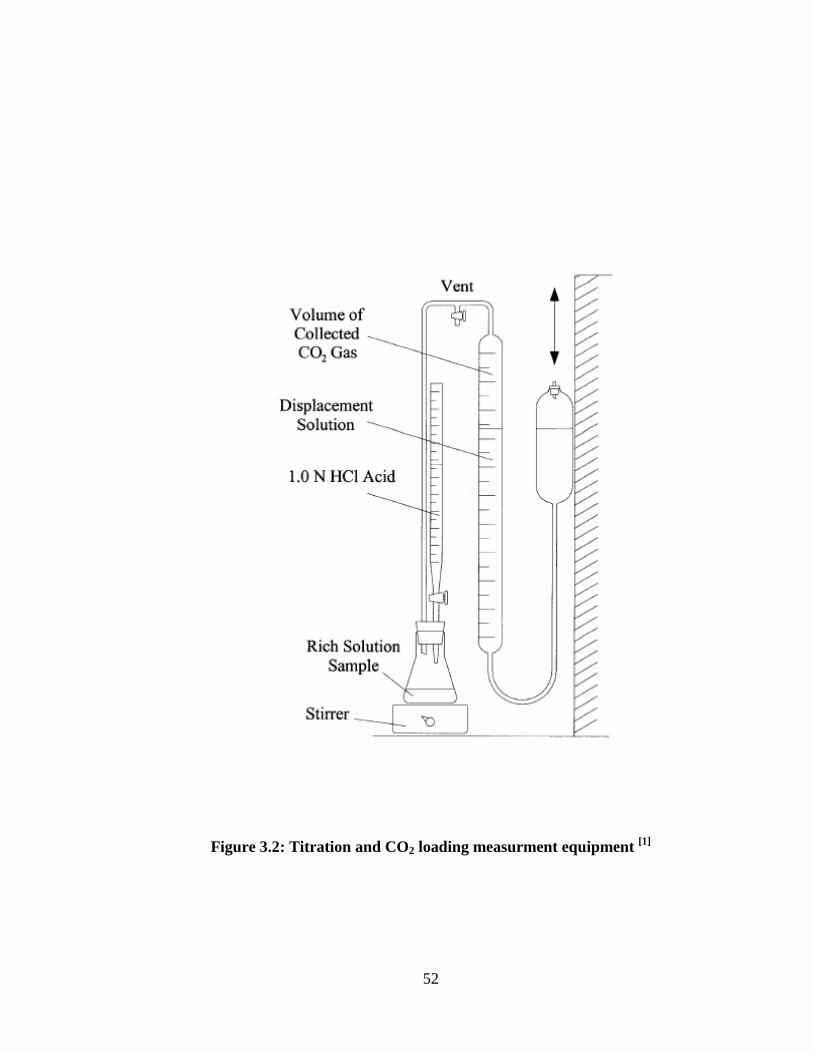
52
Figure 3.2: Titration and CO2 loading measurment equipment [1]
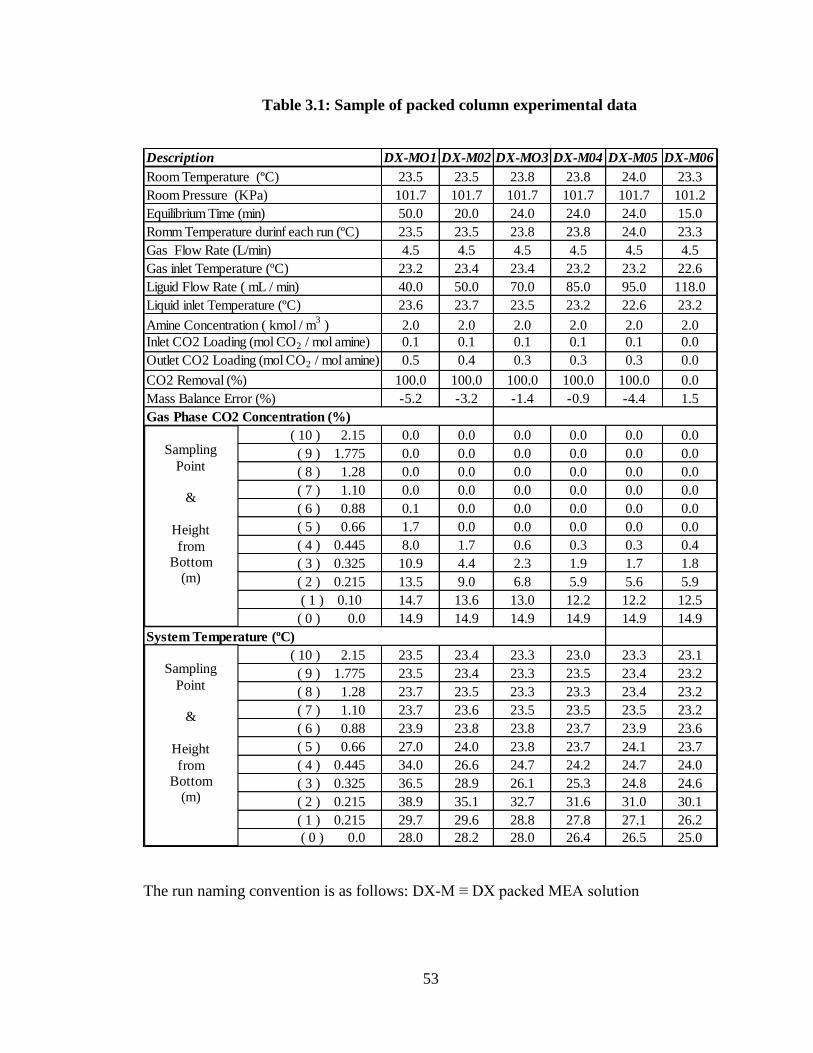
53
Table 3.1: Sample of packed column experimental data
Description DX-MO1 DX-M02 DX-MO3 DX-M04 DX-M05 DX-M06
Room Temperature (ºC) 23.5 23.5 23.8 23.8 24.0 23.3
Room Pressure (KPa) 101.7 101.7 101.7 101.7 101.7 101.2
Equilibrium Time (min) 50.0 20.0 24.0 24.0 24.0 15.0
Romm Temperature durinf each run (ºC) 23.5 23.5 23.8 23.8 24.0 23.3
Gas Flow Rate (L/min) 4.5 4.5 4.5 4.5 4.5 4.5
Gas inlet Temperature (ºC) 23.2 23.4 23.4 23.2 23.2 22.6
Liguid Flow Rate ( mL / min) 40.0 50.0 70.0 85.0 95.0 118.0
Liquid inlet Temperature (ºC) 23.6 23.7 23.5 23.2 22.6 23.2
Amine Concentration ( kmol / m3 ) 2.0 2.0 2.0 2.0 2.0 2.0
Inlet CO2 Loading (mol CO2 / mol amine) 0.1 0.1 0.1 0.1 0.1 0.0
Outlet CO2 Loading (mol CO2 / mol amine) 0.5 0.4 0.3 0.3 0.3 0.0
CO2 Removal (%) 100.0 100.0 100.0 100.0 100.0 0.0
Mass Balance Error (%) -5.2 -3.2 -1.4 -0.9 -4.4 1.5
Gas Phase CO2 Concentration (%)
( 10 ) 2.15 0.0 0.0 0.0 0.0 0.0 0.0
( 9 ) 1.775 0.0 0.0 0.0 0.0 0.0 0.0
( 8 ) 1.28 0.0 0.0 0.0 0.0 0.0 0.0
( 7 ) 1.10 0.0 0.0 0.0 0.0 0.0 0.0
( 6 ) 0.88 0.1 0.0 0.0 0.0 0.0 0.0
( 5 ) 0.66 1.7 0.0 0.0 0.0 0.0 0.0
( 4 ) 0.445 8.0 1.7 0.6 0.3 0.3 0.4
( 3 ) 0.325 10.9 4.4 2.3 1.9 1.7 1.8
( 2 ) 0.215 13.5 9.0 6.8 5.9 5.6 5.9
( 1 ) 0.10 14.7 13.6 13.0 12.2 12.2 12.5
( 0 ) 0.0 14.9 14.9 14.9 14.9 14.9 14.9
System Temperature (ºC)
( 10 ) 2.15 23.5 23.4 23.3 23.0 23.3 23.1
( 9 ) 1.775 23.5 23.4 23.3 23.5 23.4 23.2
( 8 ) 1.28 23.7 23.5 23.3 23.3 23.4 23.2
( 7 ) 1.10 23.7 23.6 23.5 23.5 23.5 23.2
( 6 ) 0.88 23.9 23.8 23.8 23.7 23.9 23.6
( 5 ) 0.66 27.0 24.0 23.8 23.7 24.1 23.7
( 4 ) 0.445 34.0 26.6 24.7 24.2 24.7 24.0
( 3 ) 0.325 36.5 28.9 26.1 25.3 24.8 24.6
( 2 ) 0.215 38.9 35.1 32.7 31.6 31.0 30.1
( 1 ) 0.215 29.7 29.6 28.8 27.8 27.1 26.2
( 0 ) 0.0 28.0 28.2 28.0 26.4 26.5 25.0
Sampling
Point
&
Height
fromBottom
(m)
Sampling
Point
&
Height
fromBottom
(m)
The run naming convention is as follows: DX-M ≡ DX packed MEA solution

54
describe this phenomenon, and it can be interpreted in many ways. To determine the
operating conditions of the packed column, gas phase was first introduced at a low flow
rate into the column and then fed into the column with a given liquid flow rate. For the
Dx structured packing used in this study, the operating conditions for liquid flow rate
were between (0.1 to 0.5 m3/m
2·h), in accordance with the supplier specifications of
(Sulzer), and the optimal gas load was found to be 15 to 25% below the gas load at
flooding. To find the flooding point for this type of structured packing size, we tested the
column for different gas flow rates. In the experiment, the liquid flow rate was set for 0.5
m3/m
2.h, and the gas flow was then increased gradually until column instability occurred
concomitantly with a rising continuous phase liquid body in the column. At this point, the
gas flow rate was measured and recorded as the flooding condition at liquid flow rate. As
per the supplier specifications (Sulzer), the gas flow rates for this condition are 15 to 25%
below the gas load at flooding. The experiment was repeated for different gas flow rates
until the best conditions for gas flow rate (i.e., 15 to 25% below the flooding point) were
obtained. The flooding point was different for each solvent, so in this study, the flooding
point for each solvent had to be independently found to establish a gas flow rate condition
table.
Maneeintr et al. (2009) reported that the mass transfer column setup had liquid
channelling that resulted in a smaller than expected wetted surface area, which resulted in
a decrease in KGav values, especially at lower solution concentrations. In this study,
major improvements in the experimental setup were implement, which can be categorized
as follows:

55
The absorption column DX Sulzer 37 elements packing were reinstalled and their
fins were fixed to prevent the liquid channelling throughout the column.
The liquid redistributors were redesigned to reduce the flooding inside the
columns.
The liquid flow rate was controlled by the use of a needle valve to keep the
pressure drop constant throughout the column.
The gas flow rate was also controlled by the use of a needle valve, whereas
before, the dependence on only the regular gas cylinder valves was not
sufficiently accurate to keep the gas mass flow rates constant during data
collection.
Two new condensers were added and installed to the experimental column setup
of Maneeintr et al. (2009); these were needed to protect the CO2 analyzer (IR)
from the solvent vapour coming from the column and causing invalid
concentration reading values.
New temperature thermocouple meters were installed to replace the old, used,
inaccurate ones, and the new ones were connected to two switch boxes to get
quick and accurate readings.
Two new N2 balloons were installed to keep the solvent in the feeding and storage
tanks protected from any contact with the outside air in order to keep the solvent
CO2 loading constant.

56
The 4-Diethylamino-2-butanol (DEAB) was synthesized in the CO2 laboratory at
the University of Regina, Regina, Canada. The synthesis process is described in detail
elsewhere (Tontiwachwuthikul 2008). At this point, DEAB is synthesized in-house on a
small scale. MEA and MDEA were obtained from Fisher Scientific with a purity of
99+%. Nitrogen and CO2 were supplied by Praxair Inc. with purities of 99.9%. All
materials in this study were used as received without further purification.

57
3.5 References
1. deMontigny, D., Comparing Packed Columns and Membrane Absorbers for CO2
Capture. PhD. Dissertation; University of Regina: Regina, Saskatchewan, Canada.
2004.
2. Horwitz, W., Association of Official Analytical Chemists (AOAC) Methods, 12th
Edition, George Banta. 1975.
3. Maneeintr, K.; Henni, A.; Idem, R. O.; Tontiwachwuthikul, P.; Wee, A. G. H.,
Synthesis, Solubilities, and Cyclic Capacities of Amino Alcohols for CO2 Capture
from Flue Gas Streams, Energy Procedia 1, 1327–1334, 2009.
4. Tontiwachwuthikul, P.; Wee, A. G. H.; Idem, R. O.; Maneeintr, K.; Fan, G.-J.;
Veawab, A.; Henni, A.; Aroonwilas, A.; Chakma. A., Method for capturing carbon
dioxide from gas streams. World Intellectual Property Organization Patent
(WIPO), No. WO/2008/022437. 2008.
58
CHAPTER 4
Comparison of Mass Transfer Performance of CO2 Absorption
into Aqueous Solutions of 4-diethylamino-2-butanol,
Monoethanolamine, and N-methyldiethanolamine
4.1 Introduction
This section focuses on the comparison of mass transfer performance of carbon
dioxide (CO2) absorption into aqueous solutions of 4-diethylamino-2-butanol,
monoethanolamine, and N-methyldiethanolamine.
CO2 absorption into aqueous solutions of Monoethanolamine (MEA) has been
studied by deMontigny (2004). A packed column was used to study the mass transfer for
2M MEA. In the experiment, DX structured packing type was used in column with inside
diameter of 0.028 meters and the total height of 2.40 meters. Also Maneeintr et al.,
(2009) studied the mass transfer for 2M MEA and 2M DEAB using DX structured
packing. They reported that the mass transfer column setup had liquid channelling that
resulted in a smaller than expected wetted surface area, which resulted in a decrease in
KGav values, especially at lower solution concentrations. In this study, new data reported
for comparison of mass transfer performance of CO2 absorption into aqueous solutions of
2M DEAB solvent. Also, new blended amine (DEAB-MEA) solutions was used as
solvent for CO2 capture.

59
A comparison of a primary amine (MEA) with the new data for chemical solvent
(amino alcohol 4-diethylamino-2-butanol (DEAB)) and a tertiary amine
(methyldiethanolamine (MDEA)) was conducted to comprehensively study the mass
transfer characteristics of the new solvent in a packed-bed absorption column. However,
before proceeding to study the mass transfer characteristics of a blended solvent, it is very
important to determine the mass transfer characteristics of the individual components
(i.e., aqueous DEAB alone) in order to evaluate both the contributions of DEAB and to
determine the blend ratio of the blended amines.
The objective in this chapter was to perform a comparative study of the mass
transfer performance for CO2 absorption of conventional amine, MEA, MDEA, and the
new amino-alcohol solvent, DEAB, using a mass transfer experimental lab-scale column
with DX structured packing for the three solvents under similar conditions. The mass
transfer performance of the three solvents is presented in terms of the overall mass
transfer coefficient.
4.2 Thermodynamics for CO2 Absorption
The thermodynamic properties of amine solution, such as physical solubility of
CO2 or CO2 Henry’s constant, physical diffusivity of CO2, equilibrium constants for CO2-
amine system, viscosity, and density, need to be determined in order to improve the CO2
absorption process.
60
4.2.1 Equilibrium concentration of CO2 in gas face (y*)
In this study, the solubility of CO2 in aqueous amine solution was used to measure
the term y*
A, as shown in Eq. 4.1.
eaCO
CO
AHe
Py
min
*
2
2
(4.1)
where *
Ay is the equilibrium concentration of gas at the interface, eaCOHe min2 is the
solubility of CO2 in aqueous amine solution, kPa m3/kmol, and partial pressure
2COP of
CO2, kPa.
The term eaCOHe min2 can be determined from Eq. 4.2 (Liu et al., 1999):
OHON
OHCO
eaONeaCOHe
HeHeHe
22
22
22 minmin (4.2)
The solubility of pure DEAB solvent can be determined from the solubilities of CO2 and
N2O for water, which were obtained from the work of Versteeg and Swaaij (1988). The
correlations described are shown in Eqs. 4.3 and 4.4 below:
THe OHON
2284exp1055.8 6
22 (4.3)
THe OHCO
2044exp1082.2 6
22 (4.4)
61
The solubility of CO2 into DEAB was determined by Sema et al. (2012) with Eq. 4.5
below:
3
3
2
2
1
10min2CACACAAHe eaON (4.5)
The (T) in Eqs. 4.3 and 4.4 can be used from the experimental data of the packed column
by determining the solubility of CO2 in aqueous amine solution. The experimental data of
the solubility of CO2 into DEAB by Sema et al. (2012) were used to measure parameter in
Eq.4.5, and it was then used to calculate eaONHe min2 ; then, the term y*
A can be calculated
in Eq. 3.12. Sample calculations for term y*
A are given in Appendix B.
4.2.2 Physical properties
The physical properties of DEAB, MDEA, and MEA as a function of amine
solution concentration were obtained from the work of Maneeintr et al., (2008). In this
work, the physical and transport properties (densities, viscosities, and refractive indices)
of aqueous amines and amino alcohol solutions for CO2 capture were studied.
4.3 Results and Discussion
The experiments for mass transfer in a packed column were divided into 3 parts:
CO2 absorption into MEA, into MDEA, and into DEAB. The absorption process was
conducted in a packed column with a counter-current mode at different operating
conditions. At steady state operation, the gas concentration and the temperature profiles
along the column were measured and recorded. The outlet liquid composition was

62
analyzed for its CO2 loading. The overall mass transfer coefficient was calculated using
Eq. 2.12.
The total number of measured data points was 540 from 27 experimental runs,
which included 270 measured points for CO2 gas concentration and 270 measured points
for temperature. The concentration, temperature, and the KGav profiles along the column
were obtained. The effects of liquid flow rate, solution concentration, and temperature on
KGav were examined. The experimental equipment used for this study was verified by
comparing the results for 2M MEA with results from a similar setup for 2M MEA
reported in the literature by deMontigny (2004). A mass balance calculation using Eq. 2.1
was performed at the end of each experiment in order to confirm the validity of the run.
The calculation compares the amount of CO2 removed from the gas phase, as measured
by IR, with the amount of CO2 added into the liquid phase, as measured by the solution
CO2 loading apparatus. Theoretically, these two values should be equal, but because of
the small accumulating errors in using the equipment, such as the IR analyzer, the CO2
loading measurement apparatus, and the large elongated liquid trap, the mass balance
errors obtained in this study were about 2 - 6%, which is within acceptable limits. The
calculations of mass balance errors are given in Appendix C.
4.3.1 Verification of the packed column.
The 1-inch packed column setup for this study was the same setup used in Maneeintr et
al. (2010), which had liquid channelling. However, this study setup had several
improvements, as shown in Figure 3.1, with the most important being that it was made
channel free. Verification of the apparatus was performed by comparing the results of

63
runs for the absorption of CO2 from a simulated flue gas stream (air + CO2) using MEA
solution with the work done by deMontigny (2004). The results indicated that increasing
liquid flow rate improves the KGav value, as shown in Table 4.2. The results served as the
basis for comparison with the new, improved absorption experiment. The results of the
comparison between the two studies are shown in Table 4.2. The new data is close data as
the data published by deMontigny (2004). There are a few minor differences between the
experiments from the two studies. This study experiment had lower gas and liquid flow
rates than deMontigny’s (2004) work. However, since the results are in the same range
and follow a similar data, the packed column was determined to be in good working
order.
4.3.2 Effect of liquid flow rate in the packed column
Aroonwilas et al. (1999) and deMontigny et al., (2001 and 2004) have shown that
the liquid flow rate has a great impact on the CO2 absorption efficiency of the DX
structured packing. As shown in Figure 4.2, increasing liquid flow rate caused a reduction
in CO2 concentration of gas-phase, indicating higher absorption efficiency. This was a
result of the basic phenomena taking place, so an increase in liquid flow rate led to a
greater degree of wetted packing surface and increased the efficiency of the mass-
transfer, kL, which was shown to be proportional to the KGav in Eq. 2.5 presented earlier.
The effect of the liquid flow rate on KGav values is shown in Figure 4.3. Again, it is
evident that the KGav values for MEA are higher than the values for MDEA and DEAB
under corresponding operating conditions. This is because MEA is a primary amine
whereas DEAB is a tertiary amino alcohol and MDEA is a tertiary amine. The new

64
Table 4.2: Verifying the packed column performance
Cases Work Liquid Flow Rate KGav Comment
Case 1 deMontigny 5.26 m3/m
2.h 1.0537
Naami 5.05 m3/m
2.h 1.043 close
Case 2 deMontigny 6.52 m3/m
2.h 1.309
Naami 7.071 m3/m
2.h 1.286
Case 3 deMontigny 8.57 m3/m
2.h 1.327
Naami 8.586 m3/m
2.h 1.305 close

65
chemical amino alcohol DEAB provides a greater KGav value than MDEA by 30%, and
that led to increased efficiency of the column. Also, the results show that the liquid flow
rate has an influence on the value of KGav (i.e., an increase in liquid load generally yields
a greater KGav value). The possible reason for this behaviour is that a higher liquid load
leads to a greater liquid-side mass transfer coefficient (kL) (which is directly proportional
to the overall KGav in the case of liquid-phase-controlled mass transfer), a greater
effective area (which is caused by more liquid spreading on the packing surface), and the
amount of free amine molecules in the system becoming larger or the system having
more capacity to absorb CO2 from the gas phase, thereby enhancing the KGav values.
This is evidence that DEAB is not an unusual solvent but follows trends similar to those
exhibited by other solvents as a function of these mentioned parameters. The unusual
results are the specific attributes of DEAB compared to MDEA (both tertiary amines). As
indicated before, the unexpected results are that DEAB has larger cyclic and absorption
capacities than MDEA while, at the same time, its mass transfer coefficient is larger than
that of MDEA. However, the increase in solution flow rate leads to higher circulation and
regeneration costs and, thus, might not improve the overall system efficiency.
Maximizing liquid flow rates might not lead to optimum operating conditions. Therefore,
an optimum flow rate has to be determined. The effect of liquid flow rate on KGav value
from 4.0 to 5.0 m3/m
2·hr was found to be higher than that when the liquid flow rate
increased from 5.0 to 7.0 m3/m
2·hr. The reason for this could be related to the maximum
liquid flow rate allowed for this type of packing inside diameter (ID), which was
indicated to be 5.0 m3/m
2·hr.

66
MDEA
DEAB
MEA
0.0
0.2
0.4
0.6
0.8
1.0
1.2
1.4
1.6
1.8
2.0
2.2
0.0 2.0 4.0 6.0 8.0 10.0 12.0 14.0
Heig
ht fr
om
bott
om
(m
)
CO2 Concentration, %
L = 4 m3/m2.h
L = 5 m3/m2.h
L = 7 m3/m2.h
Figure 4.2: CO2 concentration profiles at different liquid loads for 2M MEA, DEAB,
and MDEA
(Runs from Table A01, A5, and A9)

67
DEAB
MDEA
MEA
0.00
0.05
0.10
0.15
0.20
0.25
0.30
0.35
0.40
0.45
0.50
0.55
0.60
0.65
0.70
0.02
0.03
0.04
0.05
0.06
0.07
0.08
0.09
0.10
0.11
0.12
0.13
0.14
0.0 1.0 2.0 3.0 4.0 5.0 6.0 7.0 8.0 9.0
KG
a v(K
mo
l /m
3.h
r.k
Pa)
KG
a v(K
mol /
m3.h
r.kP
a)
Liquid Flow Rate m3/m2.hr
Figure 4.3: Effect of liquid flow rate on KGav for 2M DEAB, MEA, and DEAB
(Vertical Axis: RHS refers to MEA; LHS refers to MDEA and DEAB)
(Runs from Table A01, A05, A06, A07, A09)
[Amine] = 2.0 (kmol/m3)
GI = 17.8 (kmol/m2·h)
Y = 0.15 (mol CO2/mol air)
α = 0.14 (mol CO2/mol amine)

68
4.3.3 Effect of CO2 loading on KGav
The value of KGav decreases with CO2 loading due to the fact that as the CO2
loading increases, the amount of active amine decreases, causing the KGav to decrease.
The relationship between system efficiency and concentration of active absorbent, which
is represented in terms of CO2 loading, is shown in Figure 4.4. Higher CO2 loading,
reflecting lower absorbent concentration, gave the lowest mass-transfer coefficient (KGav)
of the system. By increasing the CO2 loading from 0.09 to 0.25 mol/mol, the KGav value
was reduced by approximately by 20% for MDEA and DEAB, as shown in Figure 4.4,
and by 50% for MEA. The experimental results show that CO2 loading of the feed
solution had an apparent influence on the shape of the KGav value. As CO2 loading
increased, the KGav value reduced, resulting in a lower overall mass transfer coefficient.
This illustrates a reduction in the efficiency of the column.
4.3.4 Effect of concentration on loading capacity of DEAB
The concentration of DEAB has a great effect on cyclic capacity. As shown in
Figures 4.5 and 4.6, a concentration decrease of DEAB from 2.0 mole to 1.1 kmol/m3
led
to an increase in rich loading from 0.26 to 0.65 mol/mol, respectively. This increase of
rich loading led to a 60% increase of cyclic capacity, which would reduce the cost for
regeneration. Regeneration has a large influence on the overall costs of gas treating
plants, as indicated by Astarita et al. (1983). The cyclic capacity of the solvent can be
calculated as per Sartori et al. (1978a). The cyclic capacity (Cc) can be expressed
mathematically in terms of the following equation:

69
DEAB
MDEA
MEA
0.00
0.05
0.10
0.15
0.20
0.25
0.30
0.35
0.40
0.45
0.50
0.55
0.03
0.04
0.05
0.06
0.07
0.08
0.09
0.1
0.11
0.00 0.05 0.10 0.15 0.20 0.25 0.30
KG
a v(K
mol
/m3.h
r.kP
a)
KG
a v(K
mol
/m3.h
r.k
Pa)
Lean Loading, mol CO2/mol amine
Figure 4.4: Effect of loading on KGav of 2M BEAB and MDEA
(Vertical Axis: RHS refers to MEA; LHS refers to MDEA and DEAB)
(Runs from Table A01, A02, A03 A05, A06, A07, A08, and A09)
[Amine] = 2.0 (kmol/m3)
GI = 17.8 (kmol/m2·h)
Y = 0.1357 (mol CO2/mol air)
α = 0.14 (mol CO2/mol amine)
70
Cc = ( mol of CO2 abs – mole of CO2 regen)/Vsolution (4.6)
CC = ( loading of CO2 abs – loading of CO2 regen)(M)
where M = concentration of solution (mole/L).
4.3.5 CO2 absorption performance of MEA, MDEA, and DEAB solutions
Figure 4.7 shows the gas phase CO2 concentration profiles that were obtained from
absorption experiments using three single-alkanolamine solutions: MEA, MDEA, and
DEAB. During the experiments, the concentration of the solvents was 2.0 kmol/m3 and
the CO2 loading of the feed solutions was 0.14 mol/mol. CO2 removal efficiency, as
given in Figure 4.8, shows that MDEA solvent gave the lowest CO2 absorption
performance at 45%, while DEAB offered a higher performance of 65%. The highest
removal (100%) was achieved by MEA. However, by considering 9% CO2 gas removal,
the actual performance of these three solvents can be differentiated by the required
column height. In the MEA case, removal took place within a distance of only 0.4 m from
the column bottom, while DEAB and MDEA required as high as 1.25 m and 2.15 m,
respectively, to meet the same removal target. This is due to the fact that MEA is a
primary amine with very high mass transfer performance when compared to both MDEA
as a tertiary amine and DEAB as a tertiary amino alcohol. Based on mass transfer
performance alone, both DEAB and MDEA would not be good candidates as solvents for
CO2 capture. However, one of the other important criteria for solvent selection is energy
required for solvent regeneration. In this case, we have shown that DEAB is by far better
than MEA Maneeintr et al. (2007) and Tontiwachwuthikul et al. (2008). Therefore, it is
apparent that DEAB is a good candidate for CO2 capture, most preferably as a blended

71
0.26
0.37
0.650
0.080.10
0.20
0.00
0.10
0.20
0.30
0.40
0.50
0.60
0.70
1.0 1.2 1.4 1.6 1.8 2.0 2.2
CO
2L
oad
ing, m
ol
CO
2/m
ol
am
ine
DEAB Concentration, %
Rich Loading
Lean Loading
Figure 4.5: Effect of DEAB concentration on cyclic capacity
(Runs from Table A08 and A9)

72
0.0
0.1
0.2
0.3
0.4
0.5
0.6
0.7
0.08 0.10
0.20
0.26
0.37
0.650
CO
2L
oad
ing, m
ol
CO
2/m
ol
am
ine
DEAB Concentration, %
In loading
Out loading
1.6M2M
1.1M
Figure 4.6: Effect of DEAB concentration on cyclic capacity
(Runs from Table A08 and A9)

73
0.0
0.2
0.4
0.6
0.8
1.0
1.2
1.4
1.6
1.8
2.0
2.2
0.0 2.0 4.0 6.0 8.0 10.0 12.0 14.0 16.0
Heig
ht fr
om
bott
om
(m
)
CO2 Concentration %
MEA in loading=0.138 mol CO2/mol amine
MDEA in loading=0.138 mol CO2/mol amine
DEAB in loading=0.25 mol CO2/mol amine
Figure 4.7: CO2 concentration profile for 2M MEA, MDEA, and DEAB 2M liquid
flow rate of 5 m3/m
2·hr
(Runs from Table A01, A5, and A9)

74
MEA -100 %
DEAB
65 %
MDEA
45 %
0
20
40
60
80
100
CO
2re
mo
val eff
icie
ncy (%
)
MEA DEAB MDEA
Figure 4.8: CO2 removal efficiency during absorption process

75
solvent with a primary amine such as MEA. However, before moving on to the study of
the mass transfer characteristics of a blended solvent, it is very important to determine the
mass transfer characteristics of the individual components (i.e., aqueous DEAB alone) in
order to evaluate both the contributions of DEAB and to determine the blend ratio of the
blended amines. In this work, a systematic study of DEAB (a tertiary amine) was
conducted so that the contributions of DEAB when mixed with a primary or secondary
amine to the overall performance of the blended amine in CO2 capture could be
determined.
In addition, CO2 is more soluble in DEAB than MEA, and, based on a previous
study by Sema et al. (2012), it was shown that DEAB has a very high CO2 absorption
capacity compared with conventional amines, such as MEA, even at the practical partial
pressures of CO2 used in the CO2 absorption process, as shown in Figure 4.9 by Sema et
al. (2012). Also, the molecular weight of DEAB is high, 145 g/mol. This also implies
high viscosity at very high DEAB concentrations. Bearing in mind the viscosity
limitation, and the fact that it does not need a high concentration of DEAB to achieve the
same CO2 recovery efficiency as conventional amines, we decided to work with DEAB
concentrations in the range of 1-2.0 M. Also in term of volatility, it can be seen that the
volatility of DEAB is lower than MEA and a bit higher than MDEA (Sema et al., 2012).
However, one of the other important criteria for solvent selection is the energy required
for solvent regeneration. The new amino alcohol has higher removal efficiency than
MDEA, so it should be considered as a promising new solvent. Moreover, the new amino
alcohol has high cyclic capacity, leading to reduced energy cost and reduced column
height, which will reduce the capital cost and the operation cost in the long term.

76
4.3.6 Effect of liquid temperature on KGav for DEAB
Temperature also has an influence on the mass-transfer efficiency of structured packings.
From Figure 4.10, an increase in the temperature of the DEAB solution from 23.5ºC to
40ºC caused the CO2 concentration profile to shift to the bottom of the absorption
column. This demonstrates the greater mass-transfer efficiency of the system, which can
also be observed from the increasing KGav value (Figure 4.11). The temperature has a
direct relationship with KGav value, where KGav increases with temperature for DEAB
solutions. This is due to the increase in both reaction kinetics and CO2 diffusivity
repetition. However, the heat of the reaction kinetics is responsible for increasing the
temperature of the liquid. Such behaviour is attributable to the nature of CO2 absorption
kinetics (i.e., increasing temperature leads to a greater second-order reaction rate constant
(k2), which can be evaluated from Eq. 4.7 in Sema (2012)).
Tskmolmk DEAB
7.7527exp1001.4)/( 133
,2
(4.7)
As the temperature of the solvents increases in Eq. (4.7) from 23.5ºC to 40ºC, the
reaction of the k2 value increases from 382.49 m3/kmol·s to 1456.45 m
3/kmol·s. It is clear
from Eq. (4.7) that the effect of temperature on the reaction is high. The efficiency of the
absorption increases with temperature, but it should be noted that too high a termperature
could well induce efficiency deterioration. Figure 4.11 shows the effect of solution
temperature on KGav for DEAB solutions, and as the temperature increased from 23.5°C
to 40°C, the KGav value increased by 70%. The reason for this is the increase in the
reaction of the solvent.

77
Figure 4.9. Equilibrium solubility of CO2 in aqueous solutions of 2 M MEA, 2 M
DEA, 2 M MDEA, 2 M AMP, 2 M DEAB, and 2 M PZ by (Sema, 2012) (lines are
trend lines of the experimental results (Sema et al, 2012))

78
0
0.2
0.4
0.6
0.8
1
1.2
1.4
1.6
1.8
2
2.2
0.0 3.0 6.0 9.0 12.0 15.0
Heig
ht fr
om
th
e th
e B
ott
om
(m
)
CO2 concentration, %
T=40ºCT=23.5ºC
Figure 4.10 CO2 concentration profiles under different liquid feed temperatures

79
0
0.02
0.04
0.06
0.08
0.1
0.12
0.14
15 20 25 30 35 40 45
KGa
v(K
mo
l /m
3.h
r.kP
a)
Temperature, ºC
Figure 4.11 Effect of temperature on absorption efficiency for CO2-DEAB system

80
4.4 Mass-Transfer Correlations
Mass transfer coefficient correlation is an important part of this research. Several
correlations have been used to predict mass transfer coefficients in chemical engineering
processes. Strigle (1987) predicted correlations for overall mass transfer coefficients KGav
as follows:
c
b
vG GLaK (4.8)
where L represents liquid mass velocity (lb/ft2 hr), b is a coefficient, G represents gas
mass velocity (lb/ft2 hr), and c is a coefficient. Kohl et al. (1997) have developed a means
of predicting correlations for KGav for MEA as follows:
pT
eqvG CeLFaK 4.30067.032
7.51 (4.9)
where F represents the packing factor, L represents liquid flow rate (lb/hr ft2), µ is liquid
viscosity (cps), αeq is CO2 loading of solution in equilibrium with PCO2, α is CO2 loading,
C is amine concentration, P represents partial pressure of CO2 over the solution, and T
represents temperature.
The KGav correlation in Eq. 4.9 is suitable for MEA systems using random
packing in the absorption column but is not suitable for other absorption systems, as
suggested by deMontigny (1998) and Aroonwilas et al., (1999), because of different
packing correlation factors that provide different KGav data. A correlation was developed
by deMontigny (1998) for MEA systems to predict KGav values.

81
4.4.1 Development of a new correlation for DEAB
In this study, the overall mass transfer coefficient correlation was defined in terms
of the individual mass transfer coefficient as shown in Eq. 2.6. The terms on the right
hand side of the equation represent the gas and liquid film resistances to mass transfer.
When the liquid film resistance to mass transfer is much larger than the gas film, the
equation can be simplified as:
v
o
LvG aIkaK (4.10)
According to Perry et al. (2008), the term of ko
L in Eq 4.10 has been shown to vary as a
function of liquid flow rate, L, to the power of x. The exponent x lies in a range between
0.3 and 0.7. Furthermore, Astarita et al. (1983) has suggested that the enhancement
factor, I, can be expressed as follows:
2CO
eq
P
CI
(4.11)
where αeq represents CO2 loading of solution in equilibrium with PCO2, α is CO2 loading,
C is amine concentration, and P represents partial pressure of CO2 (kPa). By rearranging
Eqs. 4.10 and 4.11 and by replacing the ko
L term with Lx, the relation is as follows:
2CO
eqX
vGP
CLaK
(4.12)

82
This relationship can be solved by plotting the term of (KGav/Lx) against the term of [(αeq
– α)C]/PCO2. In the development of this correlation, several values of x were tried, but the
best results were obtained with x = 0.6. The plot shown in Figure 4.12 is a linear
regression of all the data points, which produces an equation of the common form y = mx
+ b where m is the slope of the line and b is the y axis intercept, so Eq. 4.12 can be
rewritten as follows:
b
P
CmLaK
CO
eqx
vG
2
(4.13)
The new correlation was used to obtain the predicted KGav value, which was plotted in
Figure 4.13 against the actual experimental values in order to check the accuracy of the
model. In this study, the overall mass transfer correlation was predicted for structured
packings; the KGav values are in relatively good agreement with the actual values, and the
% AAD of this correlation is 14.6%.
4.5 Relative Cost Issues
The cost of building a CO2 absorption plant is dependent on the chemical solvent and the
energy that can be saved from the regenration process. The most promising areas for
operating cost savings with the new chemical solvent are from its high cyclic capacity
and low energy of consmption. It is estimated that the new chemical solvent (DEAB),
which has high cyclic capacity and low regenration energy, can decrease the energy
requirement by 50%. Since the energy requirement for regeneration accounts for about
70% of operating costs and by splitting capital and operating costs for CO2 capture at

83
y = 1.0233x - 0.0071
0
0.02
0.04
0.06
0.08
0.1
0.12
0.14
0.16
0 0.02 0.04 0.06 0.08 0.1 0.12 0.14
KG
av/L
0.6
[(αeq-α)C]/PCO2
m b
Figure 4.12: Relationship between (KGav/L0.6
) and [(αeq-α)C]/PCO2

84
0
0.05
0.1
0.15
0.2
0.25
0.3
0 0.05 0.1 0.15 0.2 0.25 0.3
Calc
ula
ted
va
lue
Experimental value
AAD% 14.5
Figure 4.13: Parity chart presenting the KGav value from experiment against
prediction for DEAB system

85
50% each, it can be estimated that by using DEAB, the CO2 capture costs can be reduced
by about 35%. Also, even though the cost of producing DEAB now is high, this is
somewhat compensated for by the need to use lower DEAB concentrations compared
with higher concentrations of MEA to achieve the same removal efficiency.
4.6 Summary and Conclusions
Comparative mass transfer studies of CO2 absorption in aqueous MEA, MDEA,
and DEAB solutions have been conducted using structured packing in an absorption
column. The performance was presented in terms of the overall mass transfer coefficient,
KGav. Also, the effects of various parameters, such as CO2 loading of the solution,
solution concentration on loading capacity, and liquid flow rate on KGav, were studied.
1. The results have shown that the CO2 loading of the solution and liquid flow rate
have effects on KGav in that KGav increases as liquid flow rate increases and KGav
is improved by a decrease in CO2 loading in feed solution. Also, the liquid flow
rate and CO2 loading have a significant impact on the CO2 absorption
performance of structured packings. However, there is no effect of the inert gas
flow rate on the KGav values.
2. The concentration of the new chemical solvent DEAB has a high effect on loading
capacity in that as the concentration of DEAB decreases, the loading capacity
increases. Also, the experimental results have shown that the DEAB solvent has
higher CO2 removal efficiency than MDEA.

86
3. The new synthesized amino alcohol (DEAB) provided much higher CO2
absorption capacity and higher cyclic capacity than MDEA, and that led to a
reduction in the circulation rate and energy for solvent regeneration. A reduction
in the energy requirements and the height of the column can lead to a reduction in
operational and capital cost. The CO2 capture costs can be reduced by about 35%.
The DEAB absorption system provided an excellent overall mass transfer
coefficient that was higher than that of the MDEA system.
4. The new correlation for the overall mass transfer coefficient for DEAB solvent
using structured packings in this study predicts the KGav values with relatively
good agreement with the actual experimental values and with a 14.6% AAD.

87
4.7 References
1. Aroonwilas, A.; Tontiwachwuthikul, P., Behaviour of the Mass Transfer
Coefficients of Structured Packing in CO2 Absorption with Chemical Reactions.
Ind. Eng. Chem. Res., 38. 1999.
2. Aroonwilas, A.; Tontiwachwuthikul, P., Mass Transfer Coefficients and
Correlation for CO2 Absorption into 2-Amino-2-methyl-1-propanol (AMP) Using
Structured Packing. Ind. Eng. Chem. Res., 37, 569. 1998.
3. Benamar, A.; Aroua, M. K. Modeling of CO2 Solubility and Carbamate
Concentration in DEA, MDEA and Their Mixtures Using the Deshmukh_Mather
Model. Fluid Phase Equilib, 231, 150, 2005.
4. deMontigny, D., Carbon Dioxide Absorption Studies Using Ultra-highly
Concentrated Monoethanolamine Solutions. Master thesis; University of Regina:
Regina, Saskatchewan, Canada. 1988.
5. deMontigny, D., Comparing Packed Columns and Membrane Absorbers for CO2
Capture. PhD. Dissertation; University of Regina: Regina, Saskatchewan, Canada.
2004.
6. deMontigny, D.; Tontiwachwuthikul, P.; Chakma, A., Parametric Studies of
Carbon Dioxide Absorption into Highly Concentrated Monoethanolamine
Solutions. Can. J. Chem. Eng., 79, 137. 2001.
88
7. Kohl, A. L.; Riesenfeld, F. C., Gas Purification, 5th
ed., Gulf Publishing Co.;
Houston, Texas. 1997.
8. Maneeintr K.; Idem, R. O.; Tontiwachwuthikul P.; Wee, A. G. H., Solvent
Development for CO2 Capture from Industrial Gas Streams. The 2nd International
Conference on Advances in Petrochemicals and Polymers (ICAPP2007); Bangkok,
Thailand, Jun 25-28. 2007.
9. Maneeintr, K.; Henni, A.; Idem, R. O.; Tontiwachwuthikul, P.; Wee, A. G. H.,
Physical and Transport Properties of Aqueous Amino Alcohol Solutions for CO2
Capture from Flue Gas Streams. Process Saf. Environ. Prot., 86, 291–295. 2008.
10. Maneeintr, K.; Henni, A.; Idem, R. O.; Tontiwachwuthikul, P.; Wee, A. G. H.,
Comparative Mass Transfer Performance Studies of CO2 Absorption into Aqueous
Solutions of DEAB and MEA. Ind. Eng. Chem. Res., 49 (6), pp 2857-2863. 2010.
11. Maneeintr, K.; Idem, R. O.; Tontiwachwuthikul, P.; Wee, A. G. H. Synthesis,
Solubilities, and Cyclic Capacity of Amino Alcohols for CO2 Capture from Flue
Gas Streams. Energy Procedia 2009, 1, 1327.
12. Perry, R. H.; Green, D., Perry’s Chemical Engineer’s Handbook, Eighth Ed.;
McGraw Hill Book Company: New York. 2008.
13. Perry, R. H.; Green, D., Perry’s Chemical Engineer’s Handbook, Eighth Ed.;
McGraw Hill Book Company: New York. 2008.
14. Sartori, G., and Leder, F., US. Patent, No. 4112050, 1978a.

89
15. Sema T.; Naami, A.,; Idem, R.,; Tontiwachwuthikul, P., Correlations for
Equilibrium Solubility of Carbon Dioxide in Aqueous 4-(Diethylamino)-2-butanol
Solutions, Ind. Eng. Chem., 2012.
16. Sema, T., Edali, M., Naami, A., Raphael Idem, and Tontiwachwuthikul, P., N2O
Solubility and N2O Diffusivity of Aqueous 4-(Diethylamino)-2-Butanol Solutions.
International Test Centre for CO2 Capture, University of Regina, Regina,
Saskatchewan, Canada, S4S 0A2, 2012.
17. Strigle, R. F., Random Packing and Packed Towers; Gulf Publishing Company:
Houston, TX. 1987.
18. Tontiwachwuthikul, P.; Meisen, A.; Lim, J. C. Solubility of CO2 in 2-Amino-2-
methyl-1-propanol Solutions. J.Chem. Eng. Data 1991, 36, 130.
19. Versteeg, G. F.; van Swaaij W.P.M., Solubility and diffusivity of acid gases (CO2,
N2O) in aqueous alkanolamine solutions. J. Chem. Eng. Data, 33, 29-34. 1988.

90
Chapter 5
Comparative Mass Transfer and Cyclic Capacity Performance
Studies of CO2 Absorption into Aqueous MEA, MDEA, and
Blended MDEA/MEA Solutions
5.1 Introduction
The focus of this section is to compare the mass transfer performance and cyclic
capacities of aqueous solutions of MEA and MDEA individually and when MEA and
MDEA are blended.
5.2 Determination of the Overall Mass Transfer Coefficient
Mass transfer occurs when a component, A, in a gas phase transfers across a gas-
liquid interface into a liquid phase. Component A transfers from the gas phase into the
liquid phase because of the concentration gradient in the direction of mass transfer within
each phase. The final equation that determines the overall mass transfer coefficient, KGav,
can be calculated using Eq. 2.12.
dZ
dY
yyP
GaK
GA
AGA
IvG
,
*
,
(2.12)

91
The variables presented in Eq. 2.12 can be obtained from the absorption
experiments. The inert gas flow rate (GI) is an operating condition of the experiment,
which is conducted at atmospheric pressure (P). The CO2 concentration in the gas phase
(yA,G) can be measured along the length of the packed column. The term y*
A is the
concentration of solute A in equilibrium with the bulk concentration CA,L, and details of
the y*
A determination can be found elsewhere (in Chapter 4). The measured CO2
concentration can be converted into mole ratio values (YA,G) and plotted against the
height of the column to obtain the solute mole ratio concentration gradient (dyA,G/dz), as
shown in Figure 2.2 and as discussed in Chapter 2. The advantage of this technique is that
it allows the calculation of the KGav value at any specific mole ratio value along the
column. Details of the KGav determination can be found elsewhere (in Chapter 4).
5.3 Experimental Section
The mixture of MEA+MDEA was obtained from Fisher Scientific with a purity of
99+%. Nitrogen and CO2 were supplied by Praxair Inc. with purities of 99.9%. All
materials in this study were used as received without further purification. The absorption
performance of alkanolamines was evaluated by conducting experiments in a bench-scale
absorption unit, of which a simplified flow diagram is given in Figure 3.1 in Chapter 3.
The unit consists of a glass absorption column (27.5 × 10⁻²
m in diameter and 2.15 m in
height), packed with 37 elements of stainless steel structured packing (Sulzer DX) and
900 m2/m
3 of packing surface area. The details of the experimental setup were given in
Chapter 3.

92
5.4 Results and Discussion
The experiments for mass transfer in a packed column were studied based on CO2
absorption into mixed MEA-MDEA solution with concentrations of three mol ratios of
0.5/2.3 M, 0.8/2.1 M, and 1.1/1.9 M and total amine concentration of 5 M. The
absorption process was conducted in a packed column with a counter-current mode at
different operating conditions. At steady state operation, the gas concentration and the
temperature profiles along the column were measured and recorded. The outlet liquid
composition was analyzed for its CO2 loading. The overall mass transfer coefficient was
calculated using Eq. 2.12.
The total number of measured data points was 600 from 30 experimental runs,
which included 300 measured points for CO2 gas concentration and 300 measured points
for temperature. The KGav, temperature, and concentration profiles along the column
were obtained. The effects of liquid flow rate, solution concentration, and temperature on
KGav were examined. The experimental equipment used for this study was verified
(deMontigny 2004).
5.4.1 CO2 Absorption performance of blended alkanolamine solution and single
amines
Three different concentrations for MEA+MDEA were examined with mole ratios
of 0.5/2.3M, 0.8/2.1M, and 1.1/1.9M over a concentration range of 2.31-1.99 kmol/m3 for
MDEA and 0.49–1.14 kmol/m3 for MEA, which were selected because of the low energy
consumption for solvent regeneration for MDEA and high absorption rate of CO2 for

93
MEA. Three different CO2 loadings of the feed solution (0.04, 0.15, and 0.25 mol/mol)
were selected. The results show that as the ratio of MEA-MDEA decreased from
0.5/2.3M to 0.8/2.1M, the CO2 removal efficiency along the column increased, as seen in
Figure 5.1. The ratio 1.1/1.9M MEA-MDEA has the highest CO2 removal along the
column. The CO2 loading of feed solution has a significant effect on the CO2
concentration profiles, as shown in Figures 5.1, 5.2, and 5.3, where the increase in the
loading from 0.04 to 0.25 mol/mol caused the efficiency of absorption to decrease. Also,
the MEA-MDEA ratio had a significant effect on KGav values; as the ratio changed from
0.5/2.3M to 1.1/1.9M, the KGav values increased, as shown in Figure 5.4. This behaviour
illustrates a combined kinetic/thermodynamic competition between two reactive species
(MEA and MDEA) in the blended solutions. Figure 5.5 shows the case of ratio for a
1.1/1.9M MEA-MDEA blend, and, whereas, as the loading increased, the profiles of
higher CO2 absorption blended solution concentrations moved up to the top of the
column, which led to reduction of the absorption efficiency. Figure 5.6 shows the gas
phase CO2 concentration profiles that were obtained from the absorption experiments
using two single alkanolamine solutions, MEA and MDEA, and blended alkanolamine
MEA-MDEA. The results show that MDEA gave the lowest CO2 absorption performance
and MEA and MEA-MDEA offered better performances. In addition, in terms of cyclic
capacity and heat regeneration, MEA-MDEA is a better solvent. The increase in cyclic
capacity can improve the regeneration process and lead to a reduction in the cost of
energy required in the capture process.
94
0
0.2
0.4
0.6
0.8
1
1.2
1.4
1.6
1.8
2
2.2
0.0 3.0 6.0 9.0 12.0 15.0
Heig
ht
from
bott
om
(m
)
CO2 Concentration, %
0.5/2.3 M-MEA/MDEA
0.8/2.1 M-MEA/MDEA
1.1/1.9 M-MEA/MDEA
Figures 5.1: CO2 Concentration profiles for mixed MEA/MDEA at a loading of 0.04
molCO2/mol amine

95
0
0.2
0.4
0.6
0.8
1
1.2
1.4
1.6
1.8
2
2.2
0.0 3.0 6.0 9.0 12.0 15.0
Hei
gh
t fr
om
bott
om
(m
)
CO2 Concentration, %
0.5/2.3 M-MEA/MDEA
0.8/2.1 M-MEA/MDEA
1.1/1.9 M-MEA/MDEA
Figures 5.2: CO2 Concentration profiles for mixed MEA/MDEA at a loading of 0.15
mol CO2/mol amine

96
0
0.2
0.4
0.6
0.8
1
1.2
1.4
1.6
1.8
2
2.2
0.0 2.0 4.0 6.0 8.0 10.0 12.0 14.0 16.0
Hei
gh
t fr
om
bo
tto
m (
m)
CO2 Concentration, %
0.5/2.3 M-MEA/MDEA
0.8/2.1 M-MEA/MDEA
1.1/1.9 M-MEA/MDEA
Figures 5.3: CO2 Concentration profiles for mixed MEA/MDEA at a loading of 0.25
mol CO2/mol amine

97
1.1/1.9 M
MEA/MDEA
0.8/2.1 M
MEA/MDEA
0.5/2.3 M
MEA/MDEA
0.00
0.10
0.20
0.30
0.40
0.50
0.60
0.70
0.80
0.90
1.00
KG
a v (K
mol/m
3.h
r.kP
a)
Figures 5.4: Effect of MEA-MDEA ratio on KGav

98
0.0
0.2
0.4
0.6
0.8
1.0
1.2
1.4
1.6
1.8
2.0
2.2
0.0 3.0 6.0 9.0 12.0 15.0
Hei
gh
t fr
om
bott
om
(m
)
CO2 Concentration, %
Lean loading 0.25 (mol CO2/mol amine)
Lean loading 0.17 (mol CO2/mol amine)
Lean loading 0.05 (mol CO2/mol amine)
Figures 5.5: Effect of lean loading on CO2 concentration profiles for 1.1/1.9 M-
MEA/MDEA solvent

99
5.4.2 Effect of liquid flow rate on KGav for MEA-MDEA
Liquid flow rate has a significant impact on the CO2 absorption efficiency of the
DX structured packing. As shown in Figure 5.7, increasing liquid flow rate caused a
reduction in CO2 concentration of gas phase, indicating higher absorption efficiency. This
was a result of the basic phenomena taking place, so an increase in liquid flow rate led to
a greater degree of wetted packing surface and increased the efficiency of the mass
transfer.
The effect of the liquid flow rate on KGav values is shown in Figure 5.8 for ratios
from 0.5/2.3M to 1.1/1.9M MEA+MDEA. Again, it is evident that the KGav values for
MEA+MDEA ratio 1.1/1.9M are higher than the values of 0.5/2.3M and 0.8/2.1M for
MEA+MDEA. Also from Figure 5.8, the results show that the liquid flow rate has a
significant effect on KGav values (i.e., an increase in liquid load generally yields a greater
KGav value). The possible reason for this behaviour is that a higher liquid load leads to
the following: a greater liquid side mass transfer coefficient (kL), which is directly
proportional to the overall KGav in the case of liquid-phase controlled mass transfer, and a
greater effective area, which is caused by more liquid spreading on the packing surface.
However, the increase in solution flow rate leads to higher circulation and regeneration
costs, and, thus, it might not improve the overall system efficiency. Maximizing liquid
flow rates might not lead to optimum operating conditions. Therefore, an optimum flow
rate has to be determined.
100
2M-MDEA
1.1/1.9M-
MEA/MDEA
5M-MEA
0
0.2
0.4
0.6
0.8
1
1.2
1.4
1.6
1.8
2
2.2
0.0 2.0 4.0 6.0 8.0 10.0 12.0 14.0
Hei
gh
t fr
om
bo
tto
m (m
)
CO2 Concentration, %
Figures 5.6: Absorption performances of blended MEA/MDEA, MEA, and MDEA
Lean loading 0.2 mol CO2/mol amine
Ratios1.1/1.9M-MEA/MDEA
Liquid flow rate 5.0 m3/m
2·hr

101
0
0.2
0.4
0.6
0.8
1
1.2
1.4
1.6
1.8
2
2.2
0.0 3.0 6.0 9.0 12.0 15.0
Hei
gh
t fr
om
bo
tto
m (
m)
Concentration, %
Liquid flow rate (2.8 m3/m2.h)
Liquide flow rate (3.8 m3/m2.h)
Liquid flow rate (5 m3/m2.h)
Figures 5.7: Effect of liquid flow rate on CO2 concentration profiles for MEA-
MDEA ratio 1.1/1.9M

102
0.0
0.1
0.2
0.3
0.4
0.5
0.6
0.7
0.8
0.9
1.0
1.1
1.0 2.0 3.0 4.0 5.0 6.0
KG
av
(km
ol/m
3.h
r.k
Pa)
Liquid flow rate (m3/m2.hr.)
1.1/1.9M-MEA/MDEA
0.8/2.1M-MEA/MDEA
0.5/2.3M-MEA/MDEA
Figures 5.8: Effect of liquid flow rate on KGav for blended MEA/MDEA
103
5.4.3 Effect of temperature on KGav for blended alkanolamine solution
Temperature has a very great effect on CO2 absorption, as shown in Figure 5.9,
where increasing the temperature can lead to a reduction in CO2 absorption along the
height of the column and an increase of the mass transfer. The temperature has a direct
relationship with KGav, where KGav increases with the temperature of the mixed solvent
solution at low-to-medium CO2 loading. This is due to the increase in both reaction
kinetics and CO2 diffusivity.
The temperature also has a direct relationship with KGav in that KGav increases with
temperature for blended alkanolamine solution at low-to-medium CO2 loading. This is
due to the increase in both reaction kinetics and CO2 diffusivity repetition. Figure 5.10
shows the effect of solution temperature on KGav for three blended alkanolamine ratios
(0.5/2.3M, 0.8/2.1M, and 1.1/1.9M MEA/MDEA), and the results show that temperature
and the ratios have an effect on KGav; as the ratios changed from 0.5/2.3M to 1.1/1.9M,
the KGav increased by 80% due to increase of the reaction of the solvent as a result of
increasing the MEA ratio and reducing the MDEA.
5.4.4 Effect of lean loading on KGav for MEA/MDEA
In absorption column systems, the CO2 loading is an interesting parameter because
it changes along the height of the column and can be considered as a dynamic parameter,
whereas other parameters, such as solution concentration and liquid flow rate, are static
parameters. In packed columns, the CO2 loading increases as the liquid flows down from
the top of the column, and this is a direct result of the mass transfer of CO2 from the gas
phase into the liquid phase as both come into contact inside the column.
104
0.0
0.2
0.4
0.6
0.8
1.0
1.2
1.4
1.6
1.8
2.0
2.2
0.0 3.0 6.0 9.0 12.0 15.0
Hei
gh
t fr
om
bo
tto
m (
m)
Concentration, %
T= 21C
T= 30C
T= 45C
Figures 5.9: Effect of temperature on CO2 concentration profiles for a ratio of
0.5/2.3M-MEA/MDEA

105
0.0
0.1
0.2
0.3
0.4
0.5
0.6
0.7
0.8
0.9
1.0
0.0 5.0 10.0 15.0 20.0 25.0 30.0 35.0 40.0 45.0
KGa
v(K
mo
l/m
3.h
r.k
Pa)
Temperature, C°
1.1/1.9M-MEA/MDEA
0.8/2.1M-MEA/MDEA
0.5/2.3M-MEA/MDEA
Figure 5.10: Effect of temperature on KGav for MEA/MDEA solvents
Liquid flow rate = 5.0 (m3/m
2·hr)
GI = 15.99 (kmol/m2.h)
Y = 0.09 (mol CO2/mol air)
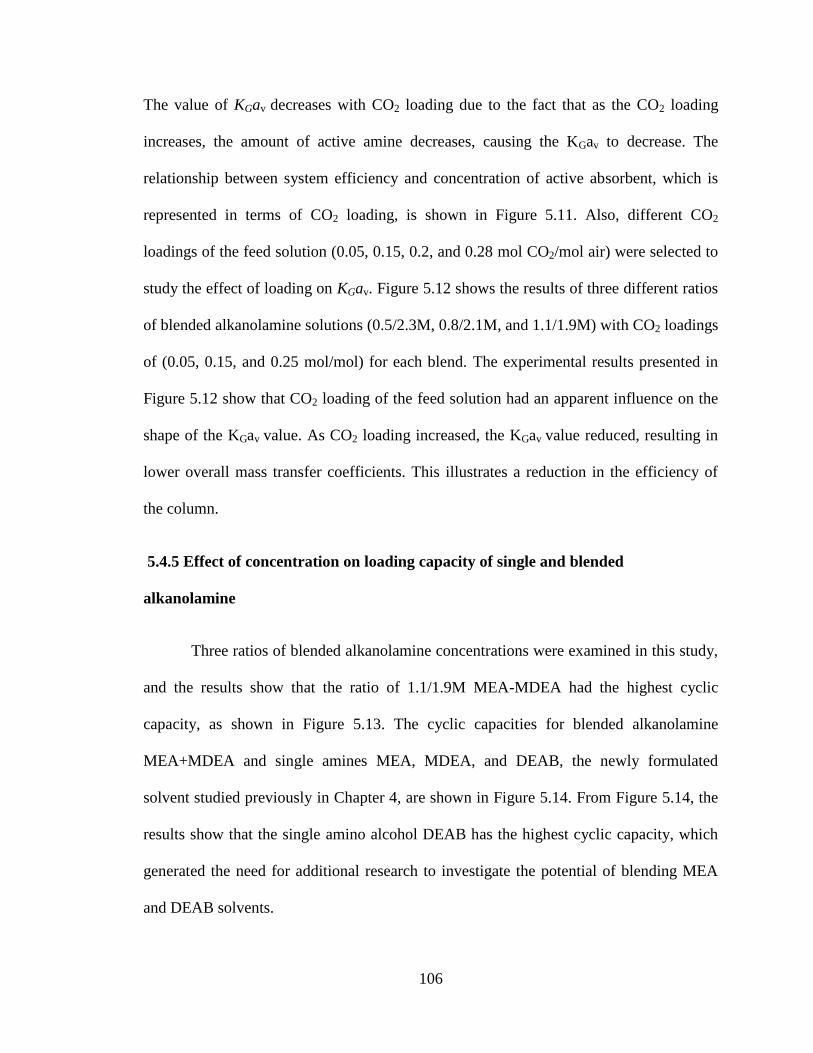
106
The value of KGav decreases with CO2 loading due to the fact that as the CO2 loading
increases, the amount of active amine decreases, causing the KGav to decrease. The
relationship between system efficiency and concentration of active absorbent, which is
represented in terms of CO2 loading, is shown in Figure 5.11. Also, different CO2
loadings of the feed solution (0.05, 0.15, 0.2, and 0.28 mol CO2/mol air) were selected to
study the effect of loading on KGav. Figure 5.12 shows the results of three different ratios
of blended alkanolamine solutions (0.5/2.3M, 0.8/2.1M, and 1.1/1.9M) with CO2 loadings
of (0.05, 0.15, and 0.25 mol/mol) for each blend. The experimental results presented in
Figure 5.12 show that CO2 loading of the feed solution had an apparent influence on the
shape of the KGav value. As CO2 loading increased, the KGav value reduced, resulting in
lower overall mass transfer coefficients. This illustrates a reduction in the efficiency of
the column.
5.4.5 Effect of concentration on loading capacity of single and blended
alkanolamine
Three ratios of blended alkanolamine concentrations were examined in this study,
and the results show that the ratio of 1.1/1.9M MEA-MDEA had the highest cyclic
capacity, as shown in Figure 5.13. The cyclic capacities for blended alkanolamine
MEA+MDEA and single amines MEA, MDEA, and DEAB, the newly formulated
solvent studied previously in Chapter 4, are shown in Figure 5.14. From Figure 5.14, the
results show that the single amino alcohol DEAB has the highest cyclic capacity, which
generated the need for additional research to investigate the potential of blending MEA
and DEAB solvents.
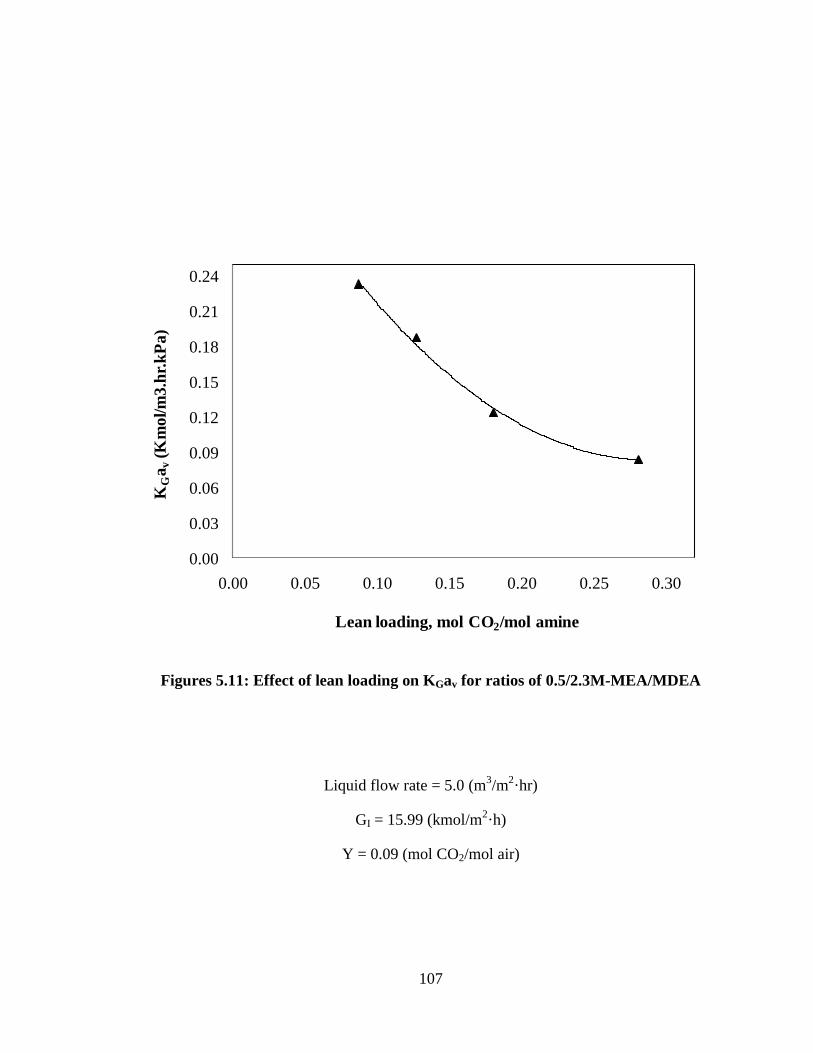
107
0.00
0.03
0.06
0.09
0.12
0.15
0.18
0.21
0.24
0.00 0.05 0.10 0.15 0.20 0.25 0.30
KG
av
(Km
ol/m
3.h
r.k
Pa)
Lean loading, mol CO2/mol amine
Figures 5.11: Effect of lean loading on KGav for ratios of 0.5/2.3M-MEA/MDEA
Liquid flow rate = 5.0 (m3/m
2·hr)
GI = 15.99 (kmol/m2·h)
Y = 0.09 (mol CO2/mol air)

108
0.0
0.1
0.2
0.3
0.4
0.5
0.6
0.7
0.8
0.9
1.0
0.00 0.05 0.10 0.15 0.20 0.25 0.30
KGa
v(K
mo
l/m
3.h
r.k
Pa)
Lean loading, mol CO2/mol amine
1.1/1.9M-MEA/MDEA
0.8/2.1M-MEA/MDEA
0.5/2.3M-MEA/MDEA
Figures 5.12: Effect of lean loading on KGav for MEA/MDEA
Liquid flow rate = 5.0 (m3/m
2·hr)
GI = 18.65 (kmol/m2·h)
Y = 0.09 (mol CO2/mol air)

109
1.1/1.9M
MEA/MDEA
0.8/2.1M
MEA/MDEA 0.5/2.3M
MEA/MDEA
0.3
0.5
0.7
0.9
1.1
1.3
1.5
1.7
1.9
Cy
clic
cap
acit
y, m
ol
CO
2/ m
ol
amin
e
Figures 5.13: Effect of concentration ratios on cyclic capacity for MEA/MDEA
amine

110
0
0.1
0.2
0.3
0.4
0.5
0.6
0.7
0.5M/2.31M
MEA/MDEA
0.83M/2.14M
MEA/MDEA
1.17/1.97M
MEA/MDEA
1.1M DEAB
2M MEA
2M MDEA
mol C
O2/m
ol am
ine
Figures 5.14: Effect of concentration ratios on cyclic capacity for blended
alkanolamine MEA/MDEA and single amines MEA, MDEA, and DEAB

111
5.5 Regeneration Experiments for Single and Blended Alkanolamines
Energy consumption for solvent regeneration is an important parameter that must
be known for design and operation, economic analysis, and development of strategies for
a cost-effective carbon dioxide (CO2) absorption process. In this work, the energy needed
for regeneration was studied for three solvents, MEA, MDEA, and MEA+MDEA, two
single and one blended alkanolamine, using a total amine concentration of 5 M for each
solvent. As the results show in Figure 5.15, the ratio 0.5/2.3 M MEA+MDEA had the
highest cyclic capacity compared with MEA and MDEA. However, removing the CO2
from those solvents required more energy, so in this section, the time required to reduce
the CO2 loading was measured.
The regeneration experiment consisted of three parts, one for each solvent. A
diagram is given in Figure 5.16 showing the setup for the regeneration experiment. The
setup consists of a 3000 ml flask, an electrical heater, an adapter, a condenser, and a
thermometer. The three solvents were loaded with CO2 at 0.5 mol CO2 per mol amine for
each solvent, and the total alkanolamine concentration was determined by titration with a
standard 1.0 kmol/m3 hydrochloric acid (HCl) solution using methyl orange indicator.
Three flasks were filled with solvent as shown in Figure 5.16, and the three
experiments included the same size capacity of electrical heater and thermometer to
control the temperature for each solvent. The temperature was maintained at
approximately 80°C. The start time for the three experiments was the same, and after
each run, samples were taken and the CO2 loading was measured. The results show that
as time increased, the CO2 loading decreased for the three solvents as shown in Figure

112
5.17. Figure 5.18 shows the loading for single and blended amines after 530 min for
MEA, MDEA+MEA, and MDEA. MDEA had the lowest CO2 loading because MDEA
solvent is a tertiary amine, which also would contribute to reduction of the energy
consumption for regeneration. The results for MEA and MDEA+MEA show that the
blended amine MDEA+MEA had higher energy savings than the single amine MEA by
64%, which would also reduce the energy for regeneration and the associated costs. Table
5.1 shows the energy that is used to regenerate the solvents for MEA, MDEA, and
MDEA-MEA. The results show that the blended amine MDEA-MEA uses less energy
(up to 50%) than pure MEA. However, the ratio of blended amine 1.1/1.9M MEA-
MDEA had the highest CO2 removal efficiency along the columns, as well as the highest
cyclic capacity, KGav, and energy savings for CO2 absorption, all of which would also
lead to reduced costs.
5.6 Summary and Conclusions
Comparative mass transfer studies of CO2 absorption in blended alkanolamine
MEA/MDEA solutions have been conducted using structured packing in an absorption
column. Mixed MEA-MDEA with three ratios of 0.5/2.3M, 0.8/2.1M, and 1.1/1.9M and
total amine concentration of 5M were studied. The performance was evaluated in terms
of the overall mass transfer coefficient, KGav. Also, the effects of various parameters such
as CO2 loading of the solution, temperature, and solution concentration on loading
capacity, liquid flow rate on KGav, and solvent regeneration were studied.
1. The results show that the CO2 loading of the solution and liquid flow rate have
large effects on KGav in that KGav increases as liquid flow rate increases and KGav
113
is improved by a decrease in CO2 loading in feed solution. Also, the liquid flow
rate and CO2 loading have a significant impact on the CO2 absorption
performance of structured packings. However, there is no effect of the inert gas
flow rate on the KGav values.
2. The ratio concentration 1.1/1.9M of MEA-MDEA had the highest removal
efficiency for CO2 concentration along the columns compared to 1.1/1.9M and
0.8/2.1M. Also, the experimental results have shown that the ratio of 1.1/1.9M for
MEA-MDEA solvent has higher loading capacity and lower regeneration costs.

114
Table 5.1: Energy consumption for Single and Blended Alkanolamines
Chemica solvent Energy
MEA 5912.92 KJ/mol CO2
MDEA+MEA 2334.05 KJ/mol CO2
MDEA 255.1 KJ/mol CO2
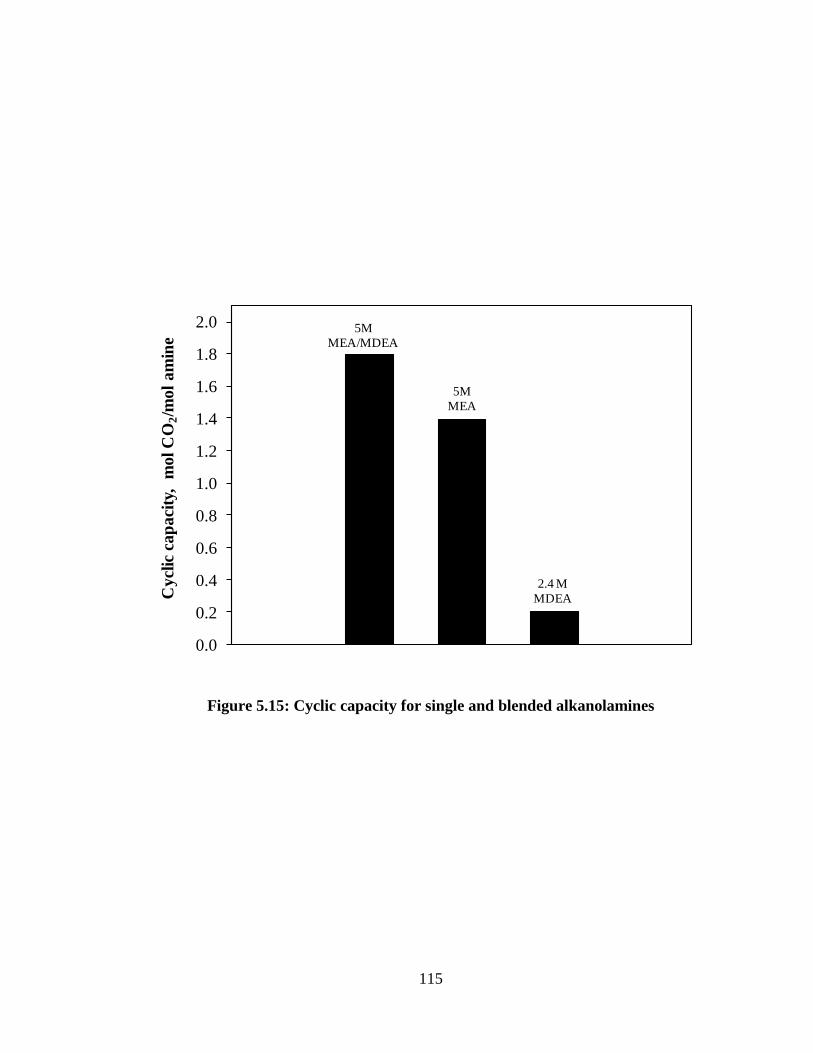
115
5M
MEA/MDEA
5M
MEA
2.4 M
MDEA
0.0
0.2
0.4
0.6
0.8
1.0
1.2
1.4
1.6
1.8
2.0
Cycl
ic c
ap
aci
ty,
mol C
O2/m
ol
am
ine
Figure 5.15: Cyclic capacity for single and blended alkanolamines

116
3000ml
MDEA
Water
in
Water
out
Electrical Heater
3-Thermometer
CO2 out
3000ml
MEA/MDEA
Water
in
Water
out
Electrical Heater
Thermometer
CO2 out
3000ml
MEA
Water
in
Water
out
Electrical Heater
Thermometer
CO2 out
2-Adapter
4-Condenser
1- Flask
Figure 5.16: Regeneration experiments for single and blended alkanolamines

117
0
0.1
0.2
0.3
0.4
0.5
0.6
0 50 100 150 200 250 300 350 400 450 500 550
Load
ing (m
ol
CO
2/m
ol
am
ine)
Time, min
5M-MEA
5M-MEA-MDEA
2.4M-MDEA
Figure 5.17: Regeneration time for single and blended alkanolamines

118
5 M
MEA
5 M
MEA-MDEA
2.4 M
MDEA
0.00
0.05
0.10
0.15
0.20
0.25
0.30
0.35
0.40
mo
l C
O2/m
ol
am
ine
Time, 530 min
Figure 5.18: CO2 loading at 530 min for single and blended amines

119
5.7 References
1. Aroonwilas, A. and Tontiwachwuthikul, P., Mass Transfer Coefficients and
Correlation for CO2 Absorption into 2-Amino-2-methyl-1-propanol (AMP) Using
Structured Packing, Ind. Eng. Chem. Res. 37, 569-575. 1998.
2. Aroonwilas, A. Veawab, A. and Tontiwachwuthikul, P., Behaviour of the Mass-
Transfer Coefficient of Structured Packings in CO2 Absorbers with Chemical
Reactions. Ind. Eng. Chem. Res. 38, 2044-2050. 1999.
3. Charkravarty, T., Phuken, U.K., Reaction of acid gases with mixtures of amines.
Chem. Eng. Prog. 40, 32–36. 1985.
4. deMontigny, D., Comparing Packed Columns and Membrane Absorbers for CO2
Capture. PhD. Dissertation; University of Regina: Regina, Saskatchewan, Canada.
2004.
5. Edali, M., Aboudheir, A., and Idem, R., Kinetics of carbon dioxide absorption into
mixed aqueous solutions of MDEA and MEA using a laminar jet apparatus and a
numerically solved 2D absorption rate/kinetics model, International Journal of
Greenhouse Gas Control 3, 550–560. 2009.
6. Mandal, B.P., Guha, M., Biswas, A.K., Bandyopadhyay, S.S., Removal of carbon
dioxide by absorption in mixed amines: modelling of absorption in aqueous
MDEA/MEA and AMP/MEA solutions. Chemical Engineering Science 56, 6217–
6224. 2001.

120
7. Naami, A., Edali, M., Sema, T., Idem, R., and Tontiwachwuthikul, P. “Comparative
Mass Transfer Performance Studies of CO2 Absorption into Aqueous Solution of a
Primary Amine and Two Tertiary Amines” International Test Centre for CO2
Capture, University of Regina, Regina, Saskatchewan, Canada, in pres. 2011.
8. Ramachandran, N.T., Aboudheir, A., Idem, R., Tontiwachwuthikul, P., Kinetics of
the absorption of CO2 into mixed aqueous loaded solutions of monoethanolamine
and methyldiethanolamine. Ind. Eng. Chem. Res. 45, 2608–2616. 2006.
9. Setameteekul, A., Aroonwilas, A., Veawab, A., Statistical factorial design analysis
for parametric interaction and empirical correlations of CO2 absorption
performance in MEA and blended MEA/MDEA processes. Separation and
Purification Technology 64, 16–25. 2008.

121
Chapter 6
Physical Properties of Blended Solutions of DEAB-MEA for
CO2 Capture from Flue Gas Streams
6.1 Introduction
This section is focused on determination of the physical properties of aqueous
solutions of DEAB, MEA, and blended MEA-DEAB.
These physical properties play a significant role in the efficient design and
operation of a gas treating process plant. The specific properties studied were density and
viscosity of blended amine solution DEAB-MEA. The objectives of the work were to
experimentally measure and develop suitable correlations for the densities and viscosities
for the blended systems of DEAB+MEA+water. These were evaluated over the entire
concentration weight ratios 3.5/30.23%, 7.18/30.23%, 14.43/30.23%, 17.96/30.23,
21.82/30.23%, 25.15/30.23%, and 29.38/30.23% at temperatures from 298.15 to 343.15
K for density and viscosity. Densities and viscosities for this solution are needed in order
to perform engineering calculations. The use of such data is typical for dimensioning the
column diameter and the calculation of mass transfer correlation and mass-transfer rate
modeling of absorbers and regenerators because these properties affect the liquid-film
coefficient for mass transfer (Wang et al., 2005). The empirical of the density and

122
viscosity correlations is important because it enables the use of the experimental results to
predict unknown density and viscosity based on experimental conditions.
6.2. Experimental Section
Materials: 4-Diethylamino-2-butanol (DEAB) was synthesized in the CO2 laboratory at
the University of Regina, Regina, Canada. The solutions were prepared to the desired
concentration in mole fraction by mixing with distilled water and MEA. The weights of
the materials were measured using an analytical balance (model Ap 250 D, Ohaus,
Florham Park, NJ) with ±0.01mg accuracy (up to 55 g) and (0.1 mg accuracy (up to 220
g). All materials in this study were used as received without further purification. The
possible uncertainty in the mole fraction was estimated to be around ±0.000. The new
amine (DEAB) was synthesized as described in the following paragraph.
Methyl vinyl ketone (65 mL, 0.71 mol) [CAS: 78-94-4; B.P. 81.4C] was added
drop wise to an ice-water cold neat pure diethyl amine (70 mL, 0.68 mol) [CAS: 109-89-
7; B.P. 55.5C]. After addition was completed in 1 h, the cooling bath was removed and
the solution was stirred at room temperature for 3 h. Thereupon, it was diluted with 30
mL of methanol [CAS: 78-94-4; B.P. 65.0C] and cooled in an ice water bath to facilitate
the slow addition (1 h duration) of sodium boron hydride (26 g, 0.68 mol) [CAS: 16940-
66-2]. After the addition was complete, the solution was removed from the ice water bath
and was subjected to stirring at RT for 3 h, after which, 30 mL of water was added and
the mixture solution was stirred for an additional 1 h in a cool water bath (4C). In the
course of the process, the colour of the solution turned from dark green to wine red.
Subsequently, the water bath was removed and the solution was stirred at room

123
temperature for another hour. The resultant mixture solution was subjected to fractional
distillation. As the temperature was raised to 50-55C the unreacted diethyl amine
fraction was collected, followed by water fraction between 85 and 100C. At this point,
vacuum was introduced into the distillation setup to extract remnant water, after which
the temperature was raised to 114C under vacuum to recover pure DEAB [4-
(diethylamino)-2-butanol: bp 110oC/50-55 mmHg;
1H NMR (CDCl3
(tq, J = 2.1, 6.2 Hz, 1 H), 2.58-2.69 (m, 3 H), 2.52 (dt, J = 3.8, 13.0 Hz, 1 H), 2.31 (sex, J
= 7.1 Hz, 2 H), 1.48-1.58 (m, 1 H), 1.39 (dq, J = 3.5, 14.4 Hz, 1 H), 1.10 (d, J = 6.2 Hz, 3
H), 1.00 (t, J = 7.2 Hz, 6 H)]. Fractional distillation was used to purify the chemical, the
identity of which was later verified by using the nuclear magnetic resonance (NMR)
technique. Approximately, the purity of DEAB was 94.5% and the impurities were 4-
methoxy-2-butanol, 2.3%; 2-butanol, 1.9%; and diethyl amine1, 0.5%. At this point,
DEAB is synthesized in-house on a small scale.
Methods and Procedures: Densities of the blended mixtures DEAB+MEA+water were
measured with an Anton Paar DMA-4500 density meter with a 0.00001 g/cm3 resolution
calibrated by using distilled water. The density of distilled water was measured in the
temperature range 298.15–343.15 K and was compared with the values provided by
Anton Paar in the instruction manual. Densities of every sample were measured at least 3
times. Density measurements were reproducible to ±0.00002 g/cm3. The uncertainty
should be accepted if the measurements were within ±0.00005 g/cm3.
The kinematic viscosities were measured by appropriate U-tube glass Cannon-
Ubbelohde viscometers (Cole–Parmer). Different sizes of viscometers were used to cover

124
the range of temperature from 298.15 to 343.15 K. The measurements were performed in
a well-stirred constant temperature water bath (Model CT 500, Cannon Instrument
Company, State College, PA)3 with ±0.01K uncertainty. The temperature was measured
with an Ertco–Hart RTD high-precision digital thermometer (model 850C, West
Patterson, NJ) with ±0.005K accuracy. The efflux time was measured with a hand-held
certified digital stopwatch capable of measuring time to within ±0.01 s. Experiments
were repeated a minimum of 3 times at each temperature for all concentrations. The
equation for kinematic viscosity, according to Poiseuille’s law (Henni et al., 2005), is:
t
ktk 2
1 (6.1)
where t is the efflux time and k1 and k2 are the viscometer constants. The second term
representing the correction due to the kinetic energy was found to be negligible (Cannon
et al., 1960). The value of the absolute viscosity (η) was obtained by multiplying the
measured kinematic viscosity (v) by the measured density. Calibration was done using
distilled water. The results were compared with the works of Perry et al., (1984) and
DiGuilio et al., (1992). From the overall average percent deviation of the means of the
average flow time and the accuracy of the density measurement, we estimate the
uncertainty of the absolute viscosity to be 1.3%.
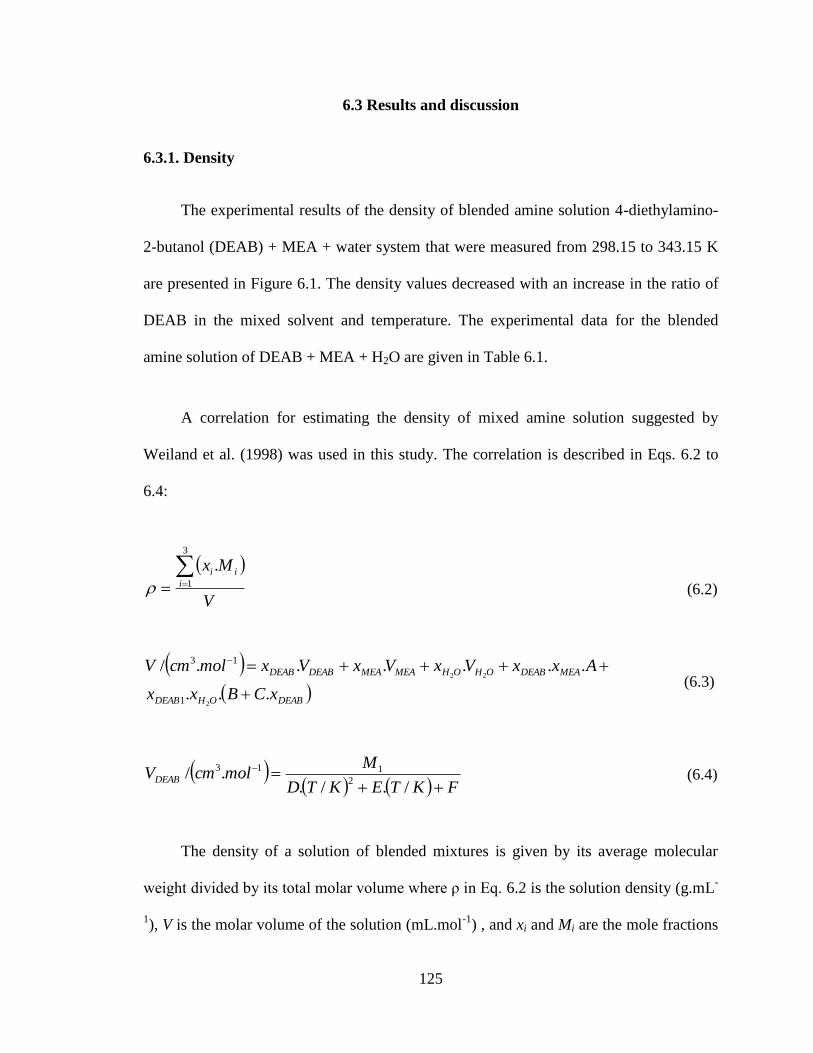
125
6.3 Results and discussion
6.3.1. Density
The experimental results of the density of blended amine solution 4-diethylamino-
2-butanol (DEAB) + MEA + water system that were measured from 298.15 to 343.15 K
are presented in Figure 6.1. The density values decreased with an increase in the ratio of
DEAB in the mixed solvent and temperature. The experimental data for the blended
amine solution of DEAB + MEA + H2O are given in Table 6.1.
A correlation for estimating the density of mixed amine solution suggested by
Weiland et al. (1998) was used in this study. The correlation is described in Eqs. 6.2 to
6.4:
V
Mxi
ii
3
1
.
(6.2)
DEABOHDEAB
MEADEABOHOHMEAMEADEABDEAB
xCBxx
AxxVxVxVxmolcmV
...
....../
2
22
1
13
(6.3)
FKTEKTD
MmolcmVDEAB
/./../
2
113 (6.4)
The density of a solution of blended mixtures is given by its average molecular
weight divided by its total molar volume where ρ in Eq. 6.2 is the solution density (g.mL-
1), V is the molar volume of the solution (mL.mol
-1) , and xi and Mi are the mole fractions

126
and molecular weights, respectively, of the blended amine DEAB, MEA, and water. The
molar volume of an ideal solution is the sum of the partial molar volumes of the
components multiplied by their respective mole fractions. The calculated values using
Eqs. 6.2 to 6.4 for density are shown in Figure 6.2; the density decreased with an increase
in the ratio of DEAB and the temperature of the solution, and the results are in good
agreement with the measured data. The Weiland’s equation coefficients (Weiland et al.,
1998) and the average absolute deviations of excess molar volume of the blended
mixtures for this study are presented in Table 6.2. The density correlation of Weiland’s
equation is satisfactory over the whole range if it is assumed that the experimental data
have an uncertainty well below 1.24 %. New data were produced from this correlation,
as shown in Figure 6.3 for ratios of 1.25/5.0 and 1.75/5.0 of DEAB-MEA. Also from
Figure 6.3, the results show that the correlation can produce more data for any ratio for
this ternary system. The blended amine DEAB-MEA is a new solvent; thus, no data exist
in the literature with which to compare it, but our results are comparable with the
experimental data, as shown in Figures 6.1 to 6.3.

127
0.94
0.95
0.96
0.97
0.98
0.99
1.00
1.01
1.02
1.03
0 10 20 30 40 50 60 70 80
ρ(g
·cm
-3)
t, (ºC)
0.25/5M-DEAB+MEA
0.5/5M-DEAB+MEA
1/5M-DEAB+MEA
1.5/5M-DEAB+MEA
2/5M-DEAB+MEA
Figure 6.1: Density of mixtures produced by experiments

128
Table 6.1: Experimental data of density for blended amine solution of DEAB + MEA + H2O
T,ºC
DEAB + MEA
3.59+30.23 % 7.18+30.23 % 14.43+30.23 % 17.96+30.27 % 21.82+30.23 % 25.15+30.27 % 29.38+30.23 %
25 1.014467433 1.009842775 1.001289402 0.997406386 0.993825291 0.990584828 0.987733693
30 1.010770173 1.006388394 0.99766223 0.993551886 0.989772676 0.986453251 0.98342955
40 1.005190585 1.000452951 0.991389619 0.987085202 0.982950696 0.97900415 0.975268228
50 0.998573578 0.993772786 0.984466459 0.979972233 0.975593853 0.971341085 0.96722624
60 0.992229774 0.987362957 0.977863084 0.973235903 0.96869583 0.964248168 0.959899674
70 0.98575401 0.980751359 0.970900468 0.966050918 0.961251159 0.956500643 0.951798879

129
Table 6.2: Parameters for Density Correlations
t / C° A B C AAD/ %
25 -63.8927 -3.2585 -4.6614 0.24597
30 -36.4793 -2.0017 -10.9837 0.40835
40 -35.0548 0.1946 -17.5013 0.18201
50 -21.3724 1.4607 -16.1186 0.16913
60 -12.2140 1.9071 -7.8990 0.15478
70 -0.2883 2.4041 0.1613 0.11655

130
0.94
0.95
0.96
0.97
0.98
0.99
1.00
1.01
1.02
1.03
0 10 20 30 40 50 60 70 80
ρ(g
·cm
-3)
t , (ºC)
0.25/5M-DEAB+MEA
0.5/5M-DEAB+MEA
1/5M-DEAB+MEA
1.5/5M-DEAB+MEA
2/5M-DEAB+MEA
Figure 6.2: Density for different ratios produced by the correlation

131
0.94
0.95
0.96
0.97
0.98
0.99
1.00
1.01
1.02
1.03
20 30 40 50 60 70 80 90
ρ(g
·cm
-3)
t, (Cº)
0.25/5.0M
DEAB-MEA
0.5/5.0M
DEAB-MEA
1.0/5.0M
DEAB-MEA
1.25/5.0M
DEAB-MEA
1.5/5.0M
DEAB-MEA
1.75/5.0M
DEAB-MEA
2.0/5.0M
DEAB-MEA
Figure 6.3: New data produced by the correlation for DEAB-MEA ratios
17.96/30.27% and 25.19/30.27
132
6.3.2 Viscosity
The viscosity of liquid mixtures is an important physicochemical property required
for fluid transport calculations in chemical processes, and it is also of great interest from
a theoretical view point in that mixture behaviour might lead to a better understanding of
liquid theory. The viscosity of liquid mixtures has attracted much attention (Reid et al.
1987). Correlations of viscosity would be especially valuable when the data are needed
for extreme conditions such as high temperature and pressure, where the corresponding
experimental measurements are particularly difficult to obtain. The correlation of
viscosity has been carried out by many researchers (McAllister, 1960), and a number of
empirical and semi-theoretical equations have been successfully developed for pure
components and binary mixtures (Reid et al., 1987), but the literature on correlations of
flow properties for ternary systems is limited. The McAllister method has been used to
correlate the viscosity of ternary systems. The McAllister method is the best correlating
technique available for ternary liquid systems as shown in the literature (Chandramouli et
al., 1963; Kalldas et al., 1964; Ried et al., 1987: Lee et al., 1995 ). Also, Manuchehr et al.
(1982) tested the McAllister method for 16 ternary fluid mixtures, and the results showed
that the data from the correlation were in good agreement with the experimental data.
The experimental viscosities of five ternary liquid mixtures, namely (4-
diethylamino- 2-butanol (DEAB) + MEA + water system) at ratios of 3.59/30.27%,
7.18/30.27%, 14.4/30.27%, 21.82/30.27%, and 29.38/30.27% and at several temperatures
are presented in Table 6.3. The experimental kinematic viscosities for five ternary liquid
mixtures were fitted by correlations suggested by McAllister (1960). The blended
viscosity data for DEAB, MEA, and H2O have been regressed by least squares

133
minimization using the McAllister equation given in Eq.6.6, and this equation was used
to produce the viscosity data of 5 ternary mixture systems and compared with
experimental data.
/v (6.5)
]3/)ln[(6]3/)2ln[(3]3/)2ln[(
3]3/)2ln[(3]3/)2ln[(3]3/)2ln[(
3]3/)2ln[(3lnlnln)
ln(ln6ln3ln3ln3
ln3ln3ln3lnlnlnln
321321232
2
3131
2
3313
2
2121
2
231
3
2
1212
2
13
3
32
3
21
3
133
2211123321322
2
3311
2
3233
2
2
211
2
2133
2
1122
2
13
3
32
3
21
3
1
MMMxxxMMxxMMx
xMMxxMMxxMM
xxMMxxMxMMxMx
MxMxvxxxvxxvxxvxx
vxxvxxvxxvxvxvxvm
(6.6)
where v is the kinematic viscosity, η/ρ, η is the viscosity, and ρ is the density, vm is the
kinematic viscosity for mixture fluid, and xi and Mi are the mole fractions and molecular
weights for pure solvent, respectively. The model requires the pure component of
kinematic viscosities. The equations should correlate experimental data as closely as
possible and should allow for only a very small standard deviation. The results are given
in Table 6.4 for the McAllister equation parameters (v12, v13, v21, v23, v31, v32, and v123).
Figure 6.4 show measurements in this work from 25-70°C for all DEAB-MEA ratios for
viscosities. The standard deviation of this correlation is 5%. The deviation started at 1.2%
in a concentration of 3.59/30.27 DEAB-MEA, and as the concentration increased, the
deviation increased until it reached 5% at a concentration of 29.38/30.27 DEAB-MEA, as
shown in Figure 6.4. However, the reason for the increase in the deviation is that the
viscosity of the solution increased.

134
Table 6.3: Experimental data of density for blended solution
DEAB / 30.27% MEA
t / °C 3.59% 7.18% 14.43% 21.82% 29.38%
25 3.125754 3.845441 5.746652 8.668576 12.396652
30 2.665021 3.282733 4.806974 7.150972 10.000981
40 1.995357 2.427276 3.425056 4.911758 6.540381
50 1.581860 1.886447 2.543220 3.560925 4.475263
60 1.281415 1.484149 1.996530 2.482828 3.039764
70 1.050727 1.221081 1.631756 1.981318 2.386074

135
Table 6.4: Regressed parameters of McAllister correlation for Equation 6 of
blended amine solution DEAB + MEA + H2O
ln v 12 ln v 13 ln v 21 ln v 23 ln v 31 ln v 32 ln v 123
0.0007287 0.1082760 0.0000364 0.0002707 0.8044183 0.0402209 0.0108276
0.0019461 0.1938264 0.0001579 0.0011220 1.4041732 0.1000505 0.0278961
0.0072495 0.3570057 0.0012194 0.0076588 2.4090644 0.3011766 0.0932158
0.0144805 0.5794909 0.0026666 0.0165714 3.7791738 0.5754001 0.1822754
0.0147406 0.5823222 0.0027706 0.0170241 3.7914994 0.5803290 0.1845398

136
0
2
4
6
8
10
12
14
0 20 40 60 80
η/
(mP
a.s)
t, (ºC)
Experiments
0.25/5M-DEAB+MEA
0.5/5M-DEAB+MEA
1/5M-DEAB+MEA
1.5/5M-DEAB+MEA
2/5M-DEAB+MEA
Calculation
0.25/5M-DEAB+MEA
0.5/5M-DEAB+MEA
1/5M-DEAB+MEA
1.5/5M-DEAB+MEA
2/5M-DEAB+MEA
Figure 6.4: Experimental and calculation data for viscosity of blended solution
DEAB-MEA-H2O

137
6.4 Summary and Conclusions
New experimental density and viscosity data for a new chemical solvent at several
temperatures were obtained. The specific properties studied were density and viscosity,
all of which play a significant role in the process design and operation of a gas treating
process plant. The density and viscosity of DEAB + MEA + water mixtures were
measured over the entire concentration range from 0.25/5.0 to 2.0/5.0 mole and
temperatures from 25-70°C for density and viscosity.
The Redlich-Kister equation gave low %AAD, and it provided a suitable
correlation to the experimental data of density of ternary systems for DEAB + MEA +
water, and percent absolute deviation was found to be 1.3%. For viscosity, the
McAllister equation was used to provided correlations to present the experimental data of
a ternary system of DEAB + MEA + water, and the percent of the absolute deviation was
5%. New data have been presented in this study for the first time, and it was found that
the models used in this study represented the experimental data very well.

138
6.5 Reference
1- Cannon, M. R.; Manning, R. E.; Bell, J. D., Viscosity Measurement. Kinetic
Energy Correction and New Viscometer. Anal. Chem., 32, pp. 355-358, 1960.
2- Chandramouli V. V.; Laddha, G. S. Indlan., J. Tech., 1, 199. 1963.
3- DiGuilio, R. M.; Lee, R. J., Schaeffer, S. T.; Brasher, L. L.; Teja, A. S. Densities
and Viscosities of the Ethanolamines. J. Chem. Eng. Data, 37, pp. 239, 1992.
4- Henni, A., Naami, A., and Tontiwachwuthikul, P., Densities and Viscosities
Derived Functions of Binary Mixtures: (Triethylene Glycol Dimethyl Ether +
Water) and (N-Acetylmorpholine + Water) from 298.15 K to 343.15 K. J. Chem.
Eng. Data, 50, pp. 1038-1042, 2005.
5- Kalldas, R.; Laddha, G. S., J. Chem. Eng. Data, 9, pp.142, 1964.
6- Lee, M.; Lin, T. Density and Viscosity for Monoethanolamine + Water, +
Ethanol, and + 2-Propanol. J. Chem. Eng. Data, 40, pp. 336–339, 1995.
7- Manuchehr D. And Ekkehard M., Correlation for Viscosity Data of Liquid
Mixtures, Ind. Eng. Chem. Process Des. Dev., 27, pp. 282-289, 1982.
8- McAllister, R. A., AICHE J., 6, pp 427, 1960.
9- Naami, A., Edali, M., Sema, T., Idem, R., and Tontiwachwuthikul, P.
“Comparative Mass Transfer Performance Studies of CO2 Absorption into
Aqueous Solution of a Primary Amine and Two Tertiary Amines” International
139
Test Centre for CO2 Capture, University of Regina, Regina, Saskatchewan,
Canada, in pres. 2011.
10- Perry, R. H.; Chilton, C. H., Chemical Engineer's Handbook, 6th
ed.; McGraw-
Hilk New York, 1984.
11- Reid C. R., Prausnitz J. M., Poling E. B., The Properties of Gases and Liquids, 4th
ed., McGraw-Hill NEW York, 1987.
12- Reid, C. R.; Prausnitz, J. M.; Poling, E. B., The Properties of Gases and Liquids,
4th ed.; McGraw-Hill: New York. 1987.
13- Reid, R. C.; Sherwood, T. K., “The Properties of Gases and Liquids”, McGraw-
Hill: New York, 1977.
14- Wang G. Q.; Yuan X. G.; Yu K. T., Review of Mass Transfer Correlations for
Packed Column. Ing. Eng. Chem. Res., 44, 8715-8729, 2005.
15- Weiland, R. H.; Dingman, J. C.; Cronin, D. B.; Browning, G. J., Density and
Viscosity of Some Partially Carbonated Aqueous Alkanolamine Solutions and
Their Blends. J. Chem. Eng. Data, 43, pp. 378–382, 1998.

140
CHAPTER 7
Comparative Mass Transfer Studies of CO2 Absorption into
Blended DEAB-MEA Amine Solution
7.1 Introduction
The objective in this chapter was to perform a comparative study of the mass
transfer performance for CO2 absorption of the new blended amine system DEAB+MEA
(4-diethylamino-2-butanol + monoethanolamine) with a MEA-MDEA system using a
mass transfer experimental lab-scale column with DX structured packing. The mass
transfer performance of the new mixed solvent is presented in terms of the overall mass
transfer coefficient. The concentrations of the new blended amine in this study are:
0.25/5.0, 0.5/5.0, 1.0/5.0, 1.25/5.0, 1.5/5.0, 1.75/5.0, and 2.0/5.0 M total amine 7 mol.
7.2 Determination of the Overall Mass Transfer Coefficient
Mass transfer occurs when a component A in a gas phase transfers across a gas-
liquid interface into a liquid phase. The component A transfers from the gas phase into
the liquid phase because of the concentration gradient in the direction of mass transfer
within each phase. The final equation that determines the overall mass transfer
coefficient, KGav, is presented in Chapter 2, Eq. 2.12. 2.12)

141
7.3 Experimental Section
The new mixture of DEAB+MEA was synthesis in the International Test Centre
for Carbon Dioxide Capture (ITC), University of Regina, Saskatchewan, Canada. The
synthesis process for 4-Diethylamino-2-butanol (DEAB) is described in detail elsewhere
(Chapter 6). At this point, DEAB is synthesized in-house on a small scale. MEA was
obtained from Fisher Scientific with a purity of 99%. Nitrogen and CO2 were supplied by
Praxair Inc. with purities of 99.9%. All materials in this study were used as received
without further purification. The absorption performance of amine solvent was evaluated
by conducting experiments in a bench-scale absorption unit, of which a simplified flow
diagram is given in Figure 3.1 in Chapter 3. The unit consists of a glass absorption
column (27.5 × 10⁻²
m in diameter and 2.15 m in height) packed with 37 elements of
stainless steel structured packing (Sulzer DX) and 900 m2/m
3 of packing surface area.
The details of the experimental setup were given in Chapter 3.
The operating conditions of the packed column for these experiments were
determined as per the specifications of the supplier (Sulzer). In the experiment, the liquid
flow rate was set for a maximum of 0.5 m3/m
2·h, and the gas flow was then increased
gradually until column instability occurred concomitantly with a rising continuous phase
liquid body in the column. At this point, the gas flow rate was measured and recorded as
being at flooding conditions at the set liquid flow rate. In this study, the flooding point for
DEAB-MEA solvent was found in order to reach the desired gas flow rate conditions for
the experiment.

142
7.4 Results and Discussion
The experiments for mass transfer in a packed column were studied based on CO2
absorption into mixed (4-diethylamino-2-butanol+monoethanolamine) (DEAB+MEA)
solution with concentrations of seven mole ratios of 5/0.25, 5/0.5, 5/1.0, 5/1.25, 5/1.5,
5/1.75, and 5/2.0 M with total 7 M. The absorption process was conducted in a packed
column with a counter-current mode at different operating conditions. At steady state
operation, the gas concentration and the temperature profiles along the column were
measured and recorded. The outlet liquid composition was analyzed for its CO2 loading.
The overall mass transfer coefficient was calculated using Eq. 2.12.
The total number of measured data points was 520 from 26 experimental runs of
MEA+DEAB, which included 260 measured points for CO2 gas concentration and 260
measured points for temperature. The concentration, temperature, and the KGav profiles
along the column were obtained. The effects of liquid flow rate, solution concentration,
and temperature on KGav were examined. The experimental equipment used for this study
was verified by deMontigny (2004) and the details are shown in section 4.5.1.
7.4.1 CO2 Absorption performance of blended amine solution DEAB+MEA
Seven different blended amine ratios for DEAB+MEA solvent were examined at
mol ratios of 0.25/5.0 M, 0.5/5.0 M, 1.0/5.0 M, 1.25/5.0 M, 1.5/5.0 M, 1.75/5.0 M, and
2.0/5.0 M DEAB+MEA. The gas phase CO2 concentration profiles for the new bended
amine solution DEAB+MEA for seven different concentrations are shown in Figure 7.1,
and the results show that the ratio of 1.25/5.0M DEAB+MEA solution had the highest
CO2 removal along the column. This ratio also shows the best concentration in the mix of

143
DEAB+MEA solution. The new blended amine has higher removal efficiency along the
column than the single amine solvent MEA, as shown in Figure 7.2, and the new blended
amine could reduce the height of the column by 32.5%, which would lead to reduced cost
of equipment and operating costs in the long term.
7.4.2 Effect of liquid flow rate in the packed column
Liquid flow rate has a great impact on the CO2 absorption efficiency of the DX
structured packing. As shown in Figure 7.3, increasing liquid flow rate caused a reduction
in CO2 concentration of gas-phase, indicating higher absorption efficiency. This was a
result of the basic phenomena taking place, so an increase in liquid flow rate led to a
greater degree of wetted packing surface and increased the efficiency of the mass-
transfer.
The effect of the liquid flow rate on KGav values is shown in Figure 7.4 for ratio
0.25/5.0 M DEAB+MEA. The results show that the liquid flow rate has an influence on
the value of KGav (i.e., an increase in liquid load generally yields a greater KGav value).
The possible reasons for this behaviour are that a higher liquid load leads to the
following: (1) a greater liquid side mass transfer coefficient (kL), which is directly
proportional to the overall KGav in the case of liquid-phase controlled mass transfer as
shown in Eq. 2.5 presented earlier; (2) a greater effective area, which is caused by more
liquid spreading on the packing surface; and (3) the amount of free amine molecules in
the system becoming larger or the system having more capacity to absorb CO2 from the

144
0
0.1
0.2
0.3
0.4
0.5
0.6
0.7
0.0 3.0 6.0 9.0 12.0 15.0
Hei
gh
t fr
om
Bott
om
, (m
)
CO2 Concentration (%)
5M-MEA
0.25/5M DEAB-MEA
0.5/5M DEAB-MEA
1.0/5M DEAB-MEA
1.25/5M DEAB-MEA
1.5/5M DEAB-MEA
1.75/5M DEAB-MEA
2.0/5M DEAB-MEA
Figure 7.1: CO2 concentration profiles along the column for bended DEAB-MEA

145
65.5 cm
44.5 cm
0.00
0.05
0.10
0.15
0.20
0.25
0.30
0.35
0.40
0.45
0.50
0.55
0.60
0.65
0.70
0.0 3.0 6.0 9.0 12.0 15.0
Hei
ght
from
Bott
om
, (m
)
CO2 Concentration (%)
5M-MEA
1.25M-DEAB+5M-
MEA
Figure 7.2: CO2 concentration profiles along the column for bended DEAB-MEA
and single amine MEA

146
0
0.1
0.2
0.3
0.4
0.5
0.6
0.0 3.0 6.0 9.0 12.0 15.0
Heig
ht
fro
m B
ott
om
, (m
)
CO2 Concentration, %
Liquid flow rate 3 m3/m2.h
Liquid flow rate 4 m3/m2.h
Liquid flow rate 5 m3/m2.h
Figure 7.3: Effect of liquid flow rate on CO2 absorption into DEAB-MEA
(Run Table A.17, DX-13, 14, 15)
[Amine] = 5.25 (kmol/m3)
GI = 22.61 (kmol/m2·h)
Y = 0.09 (mol CO2/mol air)
α = 0.20 (mol CO2/mol amine)

147
1.52
1.53
1.54
1.55
1.56
1.57
1.58
1.59
1.60
1.61
2.0 2.5 3.0 3.5 4.0 4.5 5.0 5.5
KG
av, (
km
ol/
m3.h
r.k
pa
s
Liguid flow rate, m3/m2·hr
Figure 7.4: Effect of liquid flow rate on KGav for 0.25M-DEAB and 5M-MEA ratio
(Runs: Table A.17, DX,13, 14, 15)
Amine = 5.25 (kmol/m3)
GI = 22.61 (kmol/m2·h)
Y = 0.09 (mol CO2/mol air)
α = 0.17 (mol CO2/mol amine)

148
gas phase, thereby enhancing the KGav values. However, the increase in solution flow rate
leads to higher circulation and regeneration costs, and, thus, might not improve the
overall system efficiency. Maximizing liquid flow rates might not lead to optimum
operating conditions. Therefore, an optimum flow rate has to be determined.
7.4.3 Effect of temperature on KGav for ratio of 0.25/5.0M DEAB+MEA in the
packed column
The temperature of the liquid also has an effect on the absorption performance of
the structured packings. As shown in Figure 7.5, an increase in the temperature can lead
to a reduction in CO2 absorption along the height of the column and increase the mass
transfer. The temperature has a direct relationship with KGav value, where KGav increases
with temperature for the new blended amine solution at low to medium CO2 loading. This
is due to the increase in both reaction kinetics and CO2 diffusivity repetition. However,
the heat of the reaction kinetics is responsible for increasing the temperature of the liquid.
Figure 7.6 shows the effect of solution temperature on KGav for blended amine solution
ratio of (0.25/5.0 M DEAB+MEA), and the results show that temperature has an effect on
KGav value; as the temperature increased from 22.8ºC to 43.0ºC , the KGav value increased
by 10%, and the reason for this is the increase in the reaction of the solvent. Raising the
temperature of the DEAB+MEA solution yields a greater reaction rate constant, which
can be evaluated from Eq. 7.1. This basically enhances the performance of the absorption
phenomenon (Sema et al., 2012).
Tskmolmk DEAB
7.7527exp1001.4)/( 133
,2
(7.1)

149
0
0.1
0.2
0.3
0.4
0.5
0.6
0.0 3.0 6.0 9.0 12.0 15.0
Heig
ht fr
om
Bo
ttom
, (m
)
CO2 concentration, %
Temperature 22.8 C
Temperature 32.0 C
Temperature 43.0 C
Figure 7.5 Effect of temperature on CO2 absorption into DEAB-MEA ratio 0.25/5.0
(Run Table A.18 DX-15,16,17)
[Amine] = 5.25 (kmol/m3)
GI = 22.61 (kmol/m2·h)
Y = 0.09 (mol CO2/mol air)
α = 0.17 (mol CO2/mol amine)

150
1.50
1.52
1.54
1.56
1.58
1.60
1.62
1.64
1.66
1.68
1.70
1.72
15.0 20.0 25.0 30.0 35.0 40.0 45.0
KGa v
, (km
ol/m
3.h
r.kpas
Temperature, ºC
Figure 7.6: Effect of temperature on KGav for ratio of 0.25M-DEAB
(Runs: Table A. 18, DX-15, 16, 17)
Amine = 5.25 (kmol/m3)
GI = 22.61 (kmol/m2·h)
Y = 0.09 (mol CO2/mol air)
α = 0.17 (mol CO2/mol amine)

151
As the temperature of the solvents increases in Eq. 7.1 from 25ºC to 35ºC, the reaction of
k2 value increases from 434.57 m3/kmol·s to 986.05 m
3/kmol·s. It is clear from Eq. 7.1
that the effect of the temperature on the reaction is high.
7.4.4 Effect of lean loading on KGav for DEAB+MEA
In absorption column systems, the CO2 loading is an interesting parameter because it
changes along the height of the column and can be considered as a dynamic parameter,
whereas other parameters, such as solution concentration and liquid flow rate, are static
parameters. In packed columns, the CO2 loading increases as the liquid flows down from
the top of the column, and this is a direct result of the mass transfer of CO2 from the gas
phase into the liquid phase as both contact inside the column. The value of KGav
decreases with CO2 loading due to the fact that as the CO2 loading increases, the amount
of active amines decreases, causing the KGav to decrease. The relationship between
system efficiency and concentration of active absorbent, which is represented in terms of
CO2 loading, is shown in Figure 7.7. Also, CO2 loadings of the feed solution were
selected to study the effect of loading on KGav (0.12, 0.17, and 0.26 mol CO2/mol air).
The experimental results in Figure 7.7 show that CO2 loading of the feed solution had an
apparent influence on the shape of the KGav value. As CO2 loading increased, the KGav
value reduced, resulting in lower amounts of overall mass transfer coefficient.
7.4.5 Effect of solution concentration of blended amine DEAB+MEA on KGav
The effect of solution concentration on the KGav is an interesting area of study. As
the concentration of the solution increases, the amount of free amine molecules increases
per unit volume. The viscosity of the solution becomes an issue because the increase in

152
0.9
1.1
1.2
1.4
1.5
1.7
0.00 0.04 0.08 0.12 0.16 0.20 0.24 0.28
KG
a v(k
mo
l/m
3.h
r.k
pa)
CO2 Loading (mol/mol)
Figure 7.7: Effect of CO2 loading on KGav for ratio of 0.25M-DEAB

153
the concentration of the solution leads to an increase of the viscosity of the solution, as
shown in Figure 7.8. The effect of solution concentration on the KGav value in the packed
column is shown in Figure 7.9 for blended amine DEAB+MEA. The KGav value at low
concentration increased as the concentration increased. However, as the ratio of DEAB
increased, the value of KGav increased until it reached a concentration of 7.5 (kmol/m3),
and then the value of the KGav started decreasing, as shown in Figure 7.9. The reason for
the decrease in the value of KGav is the increase of the viscosity of solution, as shown in
Figure 7.8. Also, the molecular weight of DEAB is high at 145 g/mol. This also implies
high viscosity at very high DEAB concentrations (Sema, 2012). Bearing in mind the
viscosity limitation, and the fact that it does not need a high concentration of DEAB to
achieve the same CO2 recovery efficiency as conventional amines, this is the reason, that
in Chapter 4, in the case of pure DEAB, we decided to work with DEAB concentrations
in the range of 1-2.0 M. In addition, the ratio of 1.5/5.0M for the new blended amine
DEAB+MEA has the highest KGav value, as shown in Figure 7.10.
7.4.6 Effect of blended amine ratio DEAB+MEA on cyclic capacity
Seven ratios of blended amine concentrations of DEAB+MEA were examined, and
the results show that the ratio of 1.25/5.0 M DEAB+MEA has the highest cyclic capacity,
as shown in Figure 7.11. The cyclic capacity for blended amine solutions of
MEA+MDEA and single amines MEA, MDEA, and DEAB, the newly formulated
solvent studied previously elsewhere Naami et al. (2011), are shown in Figure 7.14 in
Chapter 4. From Figure 7.14, the results show that the single amino alcohol DEAB has
the highest cyclic capacity. Also from Figure 4.5 in Chapter 4, the results show that as the
concentration of DEAB was reduced, the cyclic capacity increased, and the highest

154
0.0
2.0
4.0
6.0
8.0
10.0
12.0
14.0
5.0 5.5 6.0 6.5 7.0 7.5
Vis
cosi
ty (
mP
a.s)
DEAB-MEA Solution Concentration (kmol/m3)
Figure 7.8: Effect of solution concentration of DEAB-MEA on viscosity
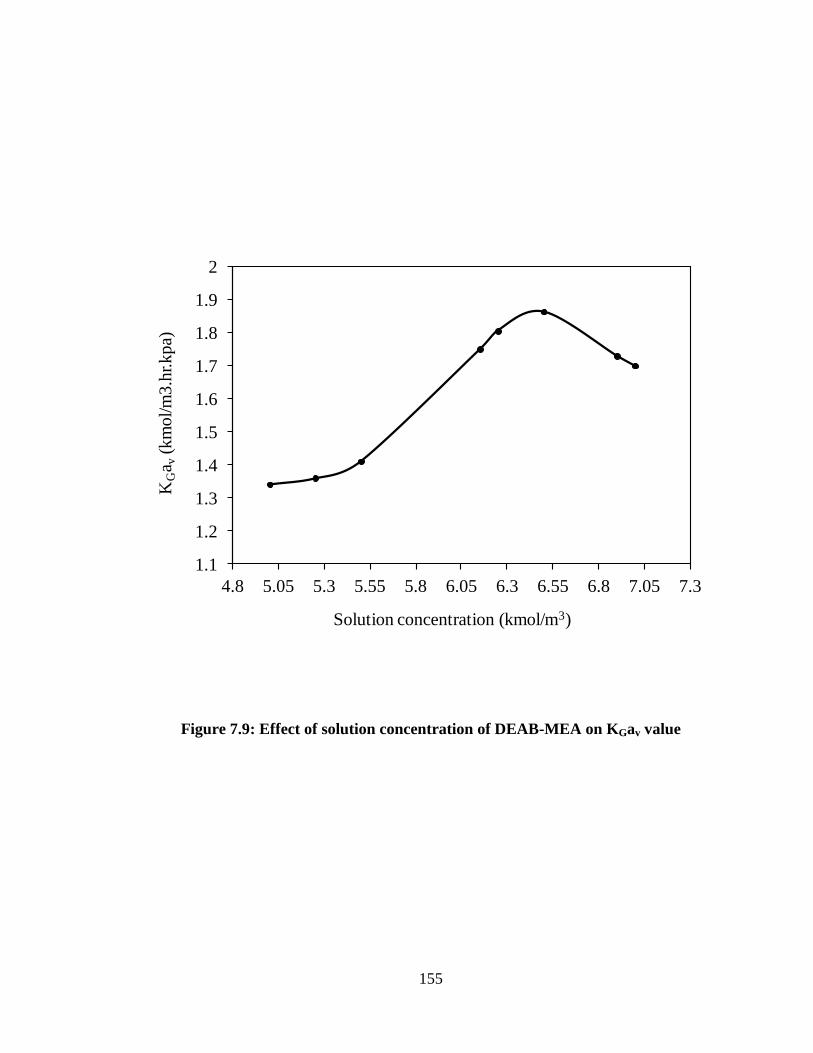
155
1.1
1.2
1.3
1.4
1.5
1.6
1.7
1.8
1.9
2
4.8 5.05 5.3 5.55 5.8 6.05 6.3 6.55 6.8 7.05 7.3
KG
a v(k
mo
l/m
3.h
r.k
pa)
Solution concentration (kmol/m3)
Figure 7.9: Effect of solution concentration of DEAB-MEA on KGav value

156
5.0 M
MEA
0.25/5.0 M
DEAB-MEA0.5/5.0 M
DEAB-MEA
1.0/5.0 M
DEAB-MEA
1.25/5.0 M
DEAB-MEA
1.5/5.0 M
DEAB-MEA
1.75/5.0 M
DEAB-MEA 2.0/5.0 M
DEAB-MEA
0.7
0.9
1.1
1.3
1.5
1.7
1.9
2.1
2.3
KGa v
(km
ol/m
3.h
r.k
pa)
Figure 7.10: The highest KGav value for the solution concentration of (DEAB-MEA)

157
5.0 M
MEA
0.25.50 M
DEAB-MEA
0.5/5.0 M
DEAB-MEA1.0/5.0 M
DEAB-MEA
1.25/5.0 M
DEAB-MEA
1.5/5.0 M
DEAB-MEA1.75/5.0 M
DEAB-MEA
2.0/5.0 M
DEAB-MEA
1.9
2
2.1
2.2
2.3
2.4
2.5
2.6
2.7
2.8
Cycl
ic c
ap
aci
ty,
mol C
O2/m
ol
am
ine
Figure 7.11: Effect of concentration ratios on cyclic capacity for blended DEAB-
MEA amine solutions

158
20
22
24
26
28
30
32
4.5 5 5.5 6 6.5 7 7.5
En
ha
ncem
en
t fa
cto
r
Total amine concentration, (M)
5 M MEA
0.5 M DEAB
5 M MEA
0.25 M DEAB
5 M MEA
1 M DEAB
5 M MEA
1.25 M DEAB
5 M MEA
1.5 M DEAB
5 M MEA
1.75 M DEAB
5 M MEA
2 M DEAB
5 M MEA
Figure 7.12: Sema data (2012)
Enhancement factor of blended DEAB-MEA solutions

159
cyclic capacity was reached at 1.1 M DEAB concentration. However, the cyclic capacity
of the blended DEAB+MEA amine solution ratio of 1.25/5.0 M was close to that of pure
DEAB. Also, Sema (2012) studied the blended of DEAB+MEA, and based on the
kinetics data, in terms of the enhancement factor, it was found that the 1.25 M DEAB+5
M MEA is the best DEAB+MEA combination over a concentration range of 0.25 M
DEAB+5 M MEA to 2 M DEAB+5 M MEA. Figure 7.12 shows the enhancement factor
of blended MEA+DEAB from Sema (2012).
7.5 Summary and Conclusions
Comparative mass transfer studies of CO2 absorption in blended DEAB+MEA solutions
have been conducted using structured packing in an absorption column. Seven different
blended amine ratios for DEAB-MEA were examined at mol ratios of 0.25/5.0M,
0.5/5.0M, 1.0/5.0, 1.25/5.0, 1.5/5.0, and 1.75/5.0 with a total 7 M. The performance was
evaluated in terms of the overall mass transfer coefficient, KGav. Also, the effects of
various parameters such as CO2 loading of the solution, temperature, and solution
concentration on loading capacity and liquid flow rate on KGav were studied. The results
have shown the following:
3. The liquid flow rate and CO2 loading of the solution have high effects on KGav
value, in that KGav increases as liquid flow rate increases and KGav is improved by
a decrease in CO2 loading in feed solution. Also, the liquid flow rate and CO2
loading have a significant impact on the CO2 absorption performance of
structured packings.

160
4. The new blended amine solution of DEAB+MEA at a ratio of 1.25/5.0M has the
highest removal efficiency for CO2 concentration along the columns compared to
other ratios. Also, the experimental results have shown that the ratio of 1.25/5.0M
for DEAB-MEA solvent has higher cyclic capacity. Based on the mass transfer
study data, it was found that the 5 M MEA+1.25 M DEAB is the best DEAB-
MEA combination over a concentration range of 0.25M DEAB+5 M MEA to 2 M
DEAB+5M MEA in terms of cyclic capacity and KGav value.
5. The new blended amine solution could reduce the height of the column by 32.5%,
and that could lead to a reduction in the cost of the equipment and the operation
costs in the long term.
6. The new blended amine solution DEAB-MEA is a promising solvent for CO2
capture in industry. Also, the new blended amine solution will reduce the cost of
CO2 capture technologies.

161
7.6 References
1- deMontigny, D., Comparing Packed Columns and Membrane Absorbers for CO2
Capture. PhD. Dissertation; University of Regina: Regina, Saskatchewan, Canada,
2004.
2- Maneeint, K.; Idem, R. O.; Tontiwachwuthikul, P.; Wee, A. G. H., Synthesis,
Solubilities, and Cyclic Capacities of Amino Alcohols for CO2 Capture from Flue
Gas Streams. 9th International Conference on Greenhouse Gas Technologies
(GHGT 9); Washington DC, USA, Nov 16-20. 2008.
3- Naami, A., Edali, M., Sema, T., Idem, R., and Tontiwachwuthikul, P.,
“Comparative Mass Transfer Performance Studies of CO2 Absorption into Aqueous
Solution of a Primary Amine and Two Tertiary Amines” International Test Centre
for CO2 Capture, University of Regina, Regina, Saskatchewan, Canada, in pres.
4- Tontiwachwuthikul, P.; Wee, A. G. H.; Idem, R. O.; Maneeintr, K.; Fan, G.-J.;
Veawab, A.; Henni, A.; Aroonwilas, A.; Chakma. A. Method for capturing carbon
dioxide from gas streams. World Intellectual Property Organization Patent
(WIPO), No. WO/2008/022437, 2008.
5- Tontiwachwuthikul, P.; Wee, A. G. H.; Idem, R. O.; Maneeintr, K.; Fan, G.-J.;
Veawab, A.; Henni, A.; Aroonwilas, A.; Chakma. A. (2008). Method for capturing
carbon dioxide from gas streams. World Intellectual Property Organization Patent
(WIPO), No. WO/2008/022437.

162
CHAPTER 8
Overall Conclusions and Recommendation
Carbon dioxide (CO2) is a greenhouse gas that substantially contributes to global
warming and climate change. One of the options to reduce CO2 emissions is carbon
capture technology, which involves gas treating. Absorption is the most commonly used
technology when it comes to gas treating. The chemical absorption systems can be used
to capture CO2 from large-point emission sources, and researchers are trying to reduce
the cost of capturing CO2 by improving column designs or developing new chemical
solvents. In this study, a new solvent has been developed for capturing CO2, and from the
results, it was found that the new solvent has the potential to play an important role in
CO2 absorption.
8.1 Conclusions
In this work, the chemical absorption of CO2 was studied using three single amines
MEA, DEAB, and MDEA, and two bended amines MDEA+MEA and DEAB+MEA.
Also, the physical properties for blended DEAB+MEA were determined in this study.
Furthermore, the three single solvents were evaluated under similar operating conditions
in order to compare their performance. The absorption experiments were conducted in an
absorption column containing structured packing, and the absorption performance was
presented in terms of the CO2 removal efficiency, absorber height requirement, effective

163
interfacial area for mass transfer, and overall mass-transfer coefficient (KGav). The Sulzer
DX structured packing performed well and presented no operating challenges. The main
conclusions for both single and blended solvents are summarized below.
8.1.1 Comparative mass transfer studies for single amines of CO2 absorption in
aqueous MEA, MDEA, and DEAB solutions have been conducted using structured
packing in an absorption column. The performance was presented in terms of the overall
mass transfer coefficient, KGav. Also, the effects of various parameters such as CO2
loading of the solution, solution concentration on loading capacity, and liquid flow rate
on KGav were studied.
The results have shown that the CO2 loading of the solution and liquid flow rate
have effects on KGav in that KGav increases as liquid flow rate increases and KGav is
improved by a decrease in CO2 loading in feed solution for single and blended solvents.
Also, the liquid flow rate and CO2 loading have a significant impact on the CO2
absorption performance of structured packings. However, there is no effect of the inert
gas flow rate on the KGav values for single and blended solvents.
The concentration of the new chemical solvent DEAB has a great effect on loading
capacity; as the concentration of DEAB decreases, the loading capacity increases. Also,
the experimental results have shown that the DEAB solvent has higher CO2 removal
efficiency than MDEA. Furthermore, the new, synthesized amino alcohol (DEAB)
provided much higher CO2 absorption capacity and higher cyclic capacity than MDEA,
and that led to a reduction in the circulation rate and energy for solvent regeneration. A
reduction in the energy requirements and the height of the column can lead to a reduction
164
in operational and capital cost. The DEAB absorption system provided an excellent
overall mass transfer coefficient that was higher than that of the MDEA system.
The new correlation for the overall mass transfer coefficient for DEAB solvent
using structured packings in this study predicts the KGav values with relatively good
agreement with the actual experimental values with a %AAD of 14.6%.
8.1.2 Comparative mass transfer studies for blended of CO2 absorption in blended
alkanolamine MEA+MDEA solutions have been conducted using structured packing in
an absorption column. Mixtures of MEA-MDEA with three ratios of 0.5/2.3M,
0.8/2.1M, and 1.1/1.9M and total amine concentration of 5M were studied. The results for
ratio concentration 1.9/1.1M of MDEA-MEA show that this ratio had the highest removal
efficiency for CO2 concentration along the columns compared to 1.9/1.1M and 2.1/0.8M.
Also, the experimental results show that the ratio of 1.9/1.1M of MDEA-MEA solvent
has higher loading capacity and lower regeneration costs.
8.1.3 The specific properties of blended DEAB+MEA studied were density and
viscosity, all of which play a significant role in the process design and operation of a gas
treating process plant. The Redlich-Kister equation gave low %AAD, and it provided a
suitable correlation to the experimental data of density of ternary systems for DEAB +
MEA + water, and the percent absolute deviation was found to be 1.3%. For viscosity,
the McAllister equation was used to provided correlations to present the experimental
data of a ternary system of DEAB + MEA + water, and the percent of the absolute
deviation was 5%. New data has been presented in this study for the first time, and it was
found that the models used in this study represent the experimental data very well.

165
8.1.4 Comparative mass transfer studies of CO2 absorption in blended DEAB-MEA
solutions have been conducted using structured packing in an absorption column. Seven
different blended amine ratios for DEAB-MEA were examined for mol ratios ranging
across 0.25/5.0M, 0.5/5.0M, 1.0/5.0, 1.25/5.0, 1.5/5.0, 1.75/5.0, and 2.0/5.0 with a total of
7 M.
The results showed that the liquid flow rate and CO2 loading of the solution have
great effects on KGav value in that KGav increases as liquid flow rate increases and KGav is
improved by a decrease in CO2 loading in the feed solution. Also, the liquid flow rate and
CO2 loading have a significant impact on the CO2 absorption performance of structured
packings.
The new blended amine solution of DEAB-MEA ratio of 1.25/5.0M has the highest
removal efficiency for CO2 concentration along the columns compared to other ratios.
Also, the experimental results have shown that the ratio of 1.25/5.0M for DEAB-MEA
solvent has higher cyclic capacity.
The new blended amine solution can reduce the height of the column by 32.5%,
leading to reduced cost of the CO2 capture equipment and reduced operating costs over
the long term. The new blended amine solution DEAB-MEA is a promising solvent for
capture of CO2 from industrial sources and for reducing the size and cost of capture
technology.

166
8.2 Recommendations for Future Work
The results of this thesis have demonstrated that this new blended solvent,
DEAB/MEA, is a promising solvent for industry to capture CO2 from flue gas in terms of
the absorption of CO2 along the column and cyclic capacity. However, more research on
the new blended solvent is needed, especially with respect to understanding the corrosion
factors of this solvent, and more physical properties need to be determined, including heat
capacity and phase tension. As well, mathematical modeling needs to be completed.
Proposed for future work are the following:
8.2.1 One of the main problems for CO2 treating plants is corrosion. Therefore,
investigating the corrosion characteristics of the newly formulated solvents (i.e., DEAB
and blended MEA-DEAB), as well as potential corrosion inhibitors, is suggested.
8.2.2 Degradation studies are required in order to determine how to reclaim the lean
solution. The solvent’s degradation characteristics are required so as to determine the
commercial economics.
8.2.3 Mathematical modeling for the mass transfer coefficient for the new solvent is
recommended in order to predict the mass transfer coefficient data for the absorption
column. Also, the kinetics rate for the new solvent is needed in order to model the
column.

167
Appendix
Appendix A: Packed column experimental data for single and blended amines;
MEA, MDEA, DEAB, MEA+MDEA, and DEAB+MEA.
Appendix B: Sample calculation for solubility of CO2 into DEAB.
Appendix C: Determine solution concentration and loading. Mass balance error

168
Table A.1: DX packed column experiments, liquid flow rate study. (MEA)
Description DX-MO1 DX-M02 DX-MO3 DX-M04 DX-M05
Room Temperature (C) 23.5 23.5 23.8 23.8 24.0
Room Pressure (Kpa) 101.7 101.7 101.7 101.7 101.7
Equilibrium Time (min) 50.0 20.0 24.0 24.0 24.0
Romm Temperature durinf each run (C°) 23.5 23.5 23.8 23.8 24.0
Gas Flow Rate (L / min) 4.5 4.5 4.5 4.5 4.5
Gas inlet Temperature ( C ) 23.2 23.4 23.4 23.2 23.2
Liguid Flow Rate ( mL / min) 40.0 50.0 70.0 85.0 95.0
Liquid inlet Temperature ( C ) 23.6 23.7 23.5 23.2 22.6
Amine Concentration ( kmol / m3 ) 2.0 2.0 2.0 2.0 2.0
Inlet CO2 Loading (mol CO2 / mol amine) 0.1 0.1 0.1 0.1 0.1
Outlet CO2 Loading (mol CO2 / mol amine) 0.5 0.4 0.3 0.3 0.3
CO2 Removal ( % ) 100.0 100.0 100.0 100.0 100.0
Mass Balance Error ( % ) -5.2 -3.2 -1.4 -0.9 -4.4
Gas Phase CO2 Concentration (%)
( 10 ) 2.15 0.0 0.0 0.0 0.0 0.0
( 9 ) 1.775 0.0 0.0 0.0 0.0 0.0
( 8 ) 1.28 0.0 0.0 0.0 0.0 0.0
( 7 ) 1.10 0.0 0.0 0.0 0.0 0.0
( 6 ) 0.88 0.1 0.0 0.0 0.0 0.0
( 5 ) 0.66 1.7 0.0 0.0 0.0 0.0
( 4 ) 0.445 8.0 1.7 0.6 0.3 0.3
( 3 ) 0.325 10.9 4.4 2.3 1.9 1.7
( 2 ) 0.215 13.5 9.0 6.8 5.9 5.6
( 1 ) 0.10 14.7 13.6 13.0 12.2 12.2
( 0 ) 0.0 14.9 14.9 14.9 14.9 14.9
System Temperature (C)
( 10 ) 2.15 23.5 23.4 23.3 23.0 23.3
( 9 ) 1.775 23.5 23.4 23.3 23.5 23.4
( 8 ) 1.28 23.7 23.5 23.3 23.3 23.4
( 7 ) 1.10 23.7 23.6 23.5 23.5 23.5
( 6 ) 0.88 23.9 23.8 23.8 23.7 23.9
( 5 ) 0.66 27.0 24.0 23.8 23.7 24.1
( 4 ) 0.445 34.0 26.6 24.7 24.2 24.7
( 3 ) 0.325 36.5 28.9 26.1 25.3 24.8
( 2 ) 0.215 38.9 35.1 32.7 31.6 31.0
( 1 ) 0.215 29.7 29.6 28.8 27.8 27.1
( 0 ) 0.0 28.0 28.2 28.0 26.4 26.5
Sampling
Point
&
Height
fromBottom
(m)
Sampling
Point
&
Height
fromBottom
(m)

169
Table A.2: DX packed column experiments, solution concentration and loading study.
(MEA)
Description DX-M06 DX-M07 DX-MO8 DX-M09 DX-M10
Room Temperature (Cº) 23.3 23.7 24.0 24.6 24.6
Room Pressure (Kpa) 101.2 101.2 101.2 101.2 101.2
Equilibrium Time (min) 15.0 27.0 24.0 22.0 24.0
Romm Temperature durinf each run (Cº) 23.3 23.6 24.2 24.5 24.4
Gas Flow Rate (L / min) 4.5 4.5 4.5 4.5 4.5
Gas inlet Temperature (Cº) 22.6 23.7 23.8 24.0 24.1
Liguid Flow Rate ( mL / min) 118.0 36.0 40.0 50.0 70.0
Liquid inlet Temperature (Cº) 23.2 23.3 23.5 22.8 23.2
Amine Concentration (kmol/m³) 2.0 2.0 2.0 2.0 2.0
Inlet CO2 Loading (mol CO2/mol amine) 0.1 0.2 0.2 0.2 0.2
Outlet CO2 Loading (mol CO2 / mol amine) 0.3 0.5 0.5 0.4 0.4
CO2 Removal ( % ) 100.0 96.6 100.0 100.0 100.0
Mass Balance Error ( % ) -1.4 -2.3 -3.1 -1.2 -2.6
Gas Phase CO2 Concentration (%)
( 10 ) 2.15 0.0 0.7 0.0 0.0 0.0
( 9 ) 1.775 0.0 10.2 0.0 0.0 0.0
( 8 ) 1.28 0.0 12.6 3.7 0.0 0.0
( 7 ) 1.10 0.0 13.4 8.6 0.0 0.0
( 6 ) 0.88 0.0 13.8 12.4 0.0 0.0
( 5 ) 0.66 0.0 14.1 13.5 0.4 0.0
( 4 ) 0.445 0.4 14.1 14.0 3.8 1.5
( 3 ) 0.325 1.8 14.3 14.1 7.2 3.8
( 2 ) 0.215 5.9 14.4 14.3 10.9 7.8
( 1 ) 0.10 12.5 14.5 14.4 13.6 12.4
( 0 ) 0.0 14.9 14.6 14.6 14.6 14.6
System Temperature (Cº)
( 10 ) 2.15 23.1 23.1 23.1 22.3 22.7
( 9 ) 1.775 23.2 34.2 23.7 23.3 23.1
( 8 ) 1.28 23.2 34.3 29.7 23.4 23.1
( 7 ) 1.10 23.2 33.1 32.3 23.5 23.5
( 6 ) 0.88 23.6 33.0 36.5 24.5 24.1
( 5 ) 0.66 23.7 31.0 34.3 25.2 24.2
( 4 ) 0.445 24.0 30.1 33.0 29.7 26.0
( 3 ) 0.325 24.6 29.8 32.8 32.7 26.9
( 2 ) 0.215 30.1 29.6 32.6 36.4 32.2
( 1 ) 0.215 26.2 26.7 28.3 30.8 28.7
( 0 ) 0.0 25.0 25.4 27.0 29.0 27.5
Sampling
Point
&
Height
fromBottom
(m)
Sampling
Point
&
Height
fromBottom
(m)
The run naming convention is follow: DX-M ≡ DX packed MEA solution

170
Table A.3: DX packed column experiments, liquid flow rate study. (MEA)
Description DX-MEA11 DX-MEA12 DX-MEA13 DX-MEA14
Room Temperature (C°) 25.6 25.5 25.7 25.5
Room Pressure (Kpa) 101.0 101.0 101.0 101.0
Equilibrium Time (min) 25.0 25.0 25.0 26.0
Romm Temperature durinf each run (C°) 25.6 25.6 25.8 25.6
Gas Flow Rate (L / min) 4.5 4.5 4.5 4.5
Gas inlet Temperature (C°) 25.0 24.8 25.3 25.4
Liguid Flow Rate ( mL / min) 40.0 50.0 70.0 100.0
Liquid inlet Temperature (C°) 22.8 23.3 23.1 22.5
Amine Concentration ( kmol / m3 ) 2.0 2.0 2.0 2.0
Inlet CO2 Loading (mol CO2 / mol amine) 0.2 0.2 0.2 0.2
Outlet CO2 Loading (mol CO2 / mol amine) 0.5 0.5 0.4 0.3
CO2 Removal ( % ) 98.5 100.0 100.0 100.0
Mass Balance Error ( % ) -2.4 -1.8 1.2 1.1
Gas Phase CO2 Concentration (%)
( 10 ) 2.15 0.3 0.0 0.0 0.0
( 9 ) 1.775 6.1 0.0 0.0 0.0
( 8 ) 1.28 12.3 0.0 0.0 0.0
( 7 ) 1.10 13.1 0.0 0.0 0.0
( 6 ) 0.88 13.5 0.2 0.0 0.0
( 5 ) 0.66 13.7 1.6 0.4 0.1
( 4 ) 0.445 14.1 7.0 2.5 1.4
( 3 ) 0.325 14.2 9.6 5.2 3.5
( 2 ) 0.215 14.4 12.0 9.0 7.4
( 1 ) 0.10 14.5 13.9 12.9 12.1
( 0 ) 0.0 14.7 14.7 14.7 14.7
System Temperature (C)
( 10 ) 2.15 22.5 23.3 22.8 22.6
( 9 ) 1.775 31.6 24.0 23.3 23.0
( 8 ) 1.28 34.4 24.0 23.4 23.2
( 7 ) 1.10 34.4 24.1 23.7 23.6
( 6 ) 0.88 34.1 25.1 24.5 24.3
( 5 ) 0.66 33.3 26.2 24.6 24.3
( 4 ) 0.445 32.6 31.1 26.6 25.1
( 3 ) 0.325 32.2 33.3 28.6 25.9
( 2 ) 0.215 31.8 35.1 33.0 31.0
( 1 ) 0.215 28.1 30.2 29.8 28.6
( 0 ) 0.0 27.0 29.0 28.8 27.6
Sampling
Point
&
Height
fromBottom
(m)
Sampling
Point
&
Height
fromBottom
(m)

171
Table A.4: DX packed column experiments, liquid flow rate study. (MEA)
Description DX-MEA15 DX-MEA16 DX-MEA17 DX-MEA18
Room Temperature (C) 24.3 24.7 25.1 25.2
Room Pressure (Kpa) 101.6 101.6 101.6 101.6
Equilibrium Time (min) 20.0 20.0 27.0 18.0
Romm Temperature durinf each run (C°) 24.4 24.7 25.2 25.3
Gas Flow Rate (L / min) 4.5 4.5 4.5 4.5
Gas inlet Temperature ( C ) 24.6 25.2 25.7 25.7
Liguid Flow Rate ( mL / min) 100.0 100.0 70.0 70.0
Liquid inlet Temperature ( C ) 30.0 40.5 41.0 31.5
Amine Concentration ( kmol / m3 ) 2.0 2.0 2.0 2.0
Inlet CO2 Loading (mol CO2 / mol amine) 0.2 0.2 0.2 0.2
Outlet CO2 Loading (mol CO2 / mol amine) 0.3 0.4 0.4 0.4
CO2 Removal ( % ) 100.0 100.0 100.0 100.0
Mass Balance Error ( % ) -1.9 0.8 -2.4 -1.4
Gas Phase CO2 Concentration (%)
( 10 ) 2.15 0.0 0.0 0.0 0.0
( 9 ) 1.775 0.0 0.0 0.0 0.0
( 8 ) 1.28 0.0 0.0 0.0 0.0
( 7 ) 1.10 0.0 0.0 0.0 0.0
( 6 ) 0.88 0.0 0.0 0.0 0.0
( 5 ) 0.66 0.1 0.0 0.1 0.3
( 4 ) 0.445 1.0 0.7 1.5 2.3
( 3 ) 0.325 2.9 2.2 3.8 4.9
( 2 ) 0.215 7.1 6.3 7.9 8.8
( 1 ) 0.10 12.7 12.5 13.9 13.4
( 0 ) 0.0 14.7 14.7 14.7 14.7
System Temperature (C)
( 10 ) 2.15 30.0 40.3 41.0 31.1
( 9 ) 1.775 30.0 40.3 39.0 30.5
( 8 ) 1.28 30.1 38.2 37.8 30.1
( 7 ) 1.10 30.1 37.7 37.7 30.0
( 6 ) 0.88 30.3 39.6 38.0 30.7
( 5 ) 0.66 32.4 41.6 39.5 31.7
( 4 ) 0.445 32.9 42.0 40.2 33.5
( 3 ) 0.325 33.8 43.2 41.2 35.3
( 2 ) 0.215 43.0 48.4 45.7 40.2
( 1 ) 0.215 31.1 36.4 36.2 32.8
( 0 ) 0.0 29.8 36.0 35.6 32.0
Sampling
Point
&
Height
fromBottom
(m)
Sampling
Point
&
Height
fromBottom
(m)

172
Table A.5: DX packed column experiments, liquid flow rate study. (MDEA)
Description DX-MD01 DX-MD02 DX-MD03
Room Temperature (Cº) 24.5 24.6 24.7
Room Pressure (Kpa) 101.6 101.6 101.6
Equilibrium Time (min) 25.0 23.0 30.0
Romm Temperature durinf each run (Cº) 24.5 24.6 24.7
Gas Flow Rate (L / min) 4.5 4.5 4.5
Gas inlet Temperature (Cº) 24.6 24.7 25.1
Liguid Flow Rate ( mL / min) 40.0 50.0 70.0
Liquid inlet Temperature (Cº) 22.8 23.0 23.0
Amine Concentration ( kmol / m3 ) 2.0 2.0 2.0
Inlet CO2 Loading (mol CO2 / mol amine) 0.1 0.1 0.1
Outlet CO2 Loading (mol CO2 / mol amine) 0.3 0.2 0.2
CO2 Removal ( % ) 46.6 48.7 50.1
Mass Balance Error ( % ) 3.1 1.3 -1.2
Gas Phase CO2 Concentration (%)
( 10 ) 2.15 9.1 8.8 8.6
( 9 ) 1.775 10.2 9.9 9.7
( 8 ) 1.28 11.5 10.9 10.8
( 7 ) 1.10 12.0 11.5 11.3
( 6 ) 0.88 12.8 12.1 12.0
( 5 ) 0.66 13.2 12.8 12.7
( 4 ) 0.445 13.8 13.2 13.1
( 3 ) 0.325 13.9 13.4 13.4
( 2 ) 0.215 14.3 13.8 13.7
( 1 ) 0.10 14.5 14.2 14.0
( 0 ) 0.0 14.7 14.7 14.7
System Temperature (C)
( 10 ) 2.15 23.2 23.6 23.5
( 9 ) 1.775 24.5 24.7 24.4
( 8 ) 1.28 24.6 24.7 24.5
( 7 ) 1.10 25.0 25.1 24.6
( 6 ) 0.88 26.0 26.1 25.6
( 5 ) 0.66 26.3 26.5 25.8
( 4 ) 0.445 26.5 26.5 25.9
( 3 ) 0.325 26.6 26.6 26.1
( 2 ) 0.215 27.0 27.0 26.2
( 1 ) 0.215 25.0 25.4 25.1
( 0 ) 0.0 24.5 24.6 24.3
Sampling
Point
&
Height
fromBottom
(m)
Sampling
Point
&
Height
fromBottom
(m)

173
Table A.6: DX packed column experiments, liquid flow rate study. (MDEA)
Description DX-MD04 DX-MD05 DX-MD06
Room Temperature (Cº) 24.0 24.2 24.5
Room Pressure (Kpa) 101.6 101.6 101.6
Equilibrium Time (min) 25.0 23.0 23.0
Romm Temperature durinf each run (Cº) 24.1 24.3 24.5
Gas Flow Rate (L / min) 4.5 4.5 4.5
Gas inlet Temperature (Cº) 24.4 24.6 24.8
Liguid Flow Rate ( mL / min) 40.0 50.0 70.0
Liquid inlet Temperature (Cº) 22.8 22.7 22.8
Amine Concentration ( kmol / m3 ) 2.0 2.0 2.0
Inlet CO2 Loading (mol CO2 / mol amine) 0.1 0.1 0.1
Outlet CO2 Loading (mol CO2 / mol amine) 0.2 0.2 0.2
CO2 Removal ( % ) 43.7 48.7 51.5
Mass Balance Error ( % ) 1.1 1.4 0.8
Gas Phase CO2 Concentration (%)
( 10 ) 2.15 9.5 8.8 8.4
( 9 ) 1.775 10.6 9.9 9.7
( 8 ) 1.28 11.5 10.8 10.7
( 7 ) 1.10 12.1 11.4 11.3
( 6 ) 0.88 12.7 12.1 12.0
( 5 ) 0.66 13.3 12.8 12.7
( 4 ) 0.445 13.9 13.4 13.3
( 3 ) 0.325 14.0 13.6 13.6
( 2 ) 0.215 14.3 13.9 13.9
( 1 ) 0.10 14.4 14.1 14.2
( 0 ) 0.0 14.7 14.7 14.7
System Temperature (C)
( 10 ) 2.15 22.7 23.0 22.8
( 9 ) 1.775 24.5 24.3 24.3
( 8 ) 1.28 24.5 24.3 24.3
( 7 ) 1.10 24.9 24.7 24.3
( 6 ) 0.88 26.0 25.7 25.3
( 5 ) 0.66 26.3 26.7 25.6
( 4 ) 0.445 26.5 27.0 25.6
( 3 ) 0.325 26.6 27.2 25.7
( 2 ) 0.215 26.8 28.5 26.1
( 1 ) 0.215 25.2 25.2 25.2
( 0 ) 0.0 24.4 24.5 24.3
Sampling
Point
&
Height
fromBottom
(m)
Sampling
Point
&
Height
fromBottom
(m)

174
Table A.7: DX packed column experiments, liquid flow rate study. (MDEA)
Description DX-MD07 DX-MD08 DX-MD09
Room Temperature (Cº) 23.8 24.0 24.1
Room Pressure (Kpa) 101.7 101.7 101.7
Equilibrium Time (min) 26.0 27.0 25.0
Romm Temperature durinf each run (Cº) 23.9 24.0 24.2
Gas Flow Rate (L / min) 4.5 4.5 4.5
Gas inlet Temperature (Cº) 24.3 24.4 24.6
Liguid Flow Rate ( mL / min) 40.0 50.0 70.0
Liquid inlet Temperature (Cº) 23.6 23.2 23.3
Amine Concentration ( kmol / m3 ) 2.0 2.0 2.0
Inlet CO2 Loading (mol CO2 / mol amine) 0.2 0.2 0.2
Outlet CO2 Loading (mol CO2 / mol amine) 0.3 0.3 0.3
CO2 Removal ( % ) 44.7 45.5 49.7
Mass Balance Error ( % ) 2.4 2.1 -4.1
Gas Phase CO2 Concentration (%)
( 10 ) 2.15 9.5 9.4 8.8
( 9 ) 1.775 10.5 10.5 9.8
( 8 ) 1.28 11.6 11.6 11.1
( 7 ) 1.10 12.2 12.1 11.7
( 6 ) 0.88 13.0 12.9 12.5
( 5 ) 0.66 13.5 13.4 13.1
( 4 ) 0.445 14.1 14.0 13.8
( 3 ) 0.325 14.3 14.2 13.9
( 2 ) 0.215 14.7 14.6 14.3
( 1 ) 0.10 14.9 14.9 14.6
( 0 ) 0.0 14.9 14.9 14.9
System Temperature (C)
( 10 ) 2.15 23.3 23.3 23.2
( 9 ) 1.775 24.3 24.3 24.2
( 8 ) 1.28 24.7 24.5 24.2
( 7 ) 1.10 24.8 24.7 24.2
( 6 ) 0.88 25.5 25.5 25.0
( 5 ) 0.66 25.7 25.6 25.2
( 4 ) 0.445 26.0 25.7 25.3
( 3 ) 0.325 26.0 25.8 25.4
( 2 ) 0.215 26.2 26.1 25.7
( 1 ) 0.215 25.0 25.0 25.0
( 0 ) 0.0 24.2 24.4 24.3
Sampling
Point
&
Height
fromBottom
(m)
Sampling
Point
&
Height
fromBottom
(m)
175
Table A.8: DX packed column experiments, liquid flow rate study. (DEAB)
Description DX-DE01 DX-DE02 DX-DE03DX-DE04 DX-DE05
Room Temperature (Cº) 23.5 24.3 23.6 24.7 25.0
Room Pressure (Kpa) 102.0 102.0 101.7 101.7 101.7
Equilibrium Time (min) 24.0 24.0 26.0 25.0 23.0
Romm Temperature durinf each run (Cº) 23.5 24.3 23.7 24.7 25.0
Gas Flow Rate (L / min) 4.5 4.5 4.5 4.5 4.5
Gas inlet Temperature (Cº) 24.0 26.0 23.8 24.4 25.1
Liguid Flow Rate ( mL / min) 50.0 50.0 50.0 50.0 50.0
Liquid inlet Temperature (Cº) 22.8 30.1 23.3 30.5 39.3
Amine Concentration ( kmol / m3 ) 2.0 1.6 1.1 1.1 1.1
Inlet CO2 Loading (mol CO2 / mol amine) 0.1 0.1 0.2 0.2 0.2
Outlet CO2 Loading (mol CO2 / mol amine) 0.3 0.4 0.7 0.7 0.7
CO2 Removal ( % ) 68.8 71.3 60.4 66.9 79.7
Mass Balance Error ( % ) -3.9 5.9 -2.1 -3.7 -1.8
Gas Phase CO2 Concentration (%)
( 10 ) 2.15 5.7 5.3 6.9 5.9 3.8
( 9 ) 1.775 7.0 6.8 8.3 7.5 5.8
( 8 ) 1.28 8.3 8.2 9.3 8.8 7.5
( 7 ) 1.10 9.3 9.2 10.3 9.8 8.7
( 6 ) 0.88 10.4 10.4 11.3 10.8 10.1
( 5 ) 0.66 11.4 11.5 12.0 11.8 11.2
( 4 ) 0.445 12.5 12.8 12.9 12.7 12.4
( 3 ) 0.325 13.0 13.2 13.3 13.1 13.0
( 2 ) 0.215 13.7 13.9 13.8 13.7 13.6
( 1 ) 0.10 14.5 14.3 14.2 14.2 14.1
( 0 ) 0.0 14.6 14.6 14.4 14.4 14.4
System Temperature (C)
( 10 ) 2.15 23.1 29.3 23.8 30.8 38.8
( 9 ) 1.775 24.6 29.8 25.2 32.2 38.3
( 8 ) 1.28 25.2 30.2 25.5 31.1 38.3
( 7 ) 1.10 25.5 30.5 25.8 31.1 37.9
( 6 ) 0.88 27.1 32.1 27.1 32.6 39.0
( 5 ) 0.66 27.4 32.1 27.4 32.5 38.5
( 4 ) 0.445 27.7 32.2 27.6 32.5 38.2
( 3 ) 0.325 28.2 32.4 27.7 32.5 38.1
( 2 ) 0.215 29.7 33.2 28.5 33.1 38.2
( 1 ) 0.215 27.2 29.6 26.8 29.4 32.6
( 0 ) 0.0 26.6 28.8 26.0 29.0 32.0
Sampling
Point
&
Height
fromBottom
(m)
Sampling
Point
&
Height
fromBottom
(m)

176
Table A.9: DX packed column experiments, liquid flow rate study. (DEAB)
Description DX-1 DX-2 DX-1 DX-1
Room Temperature (C) 25.0 25.5 25.5 24.2
Room Pressure (Kpa) 101.4 101.4 101.0 101.2
Equilibrium Time (min) 27.0 24.0 23.0 22.0
Romm Temperature durinf each run C 25.1 25.6 25.5 24.4
Gas Flow Rate (L / min) 4.5 4.5 4.5 4.5
Gas inlet Temperature ( C ) 24.6 25.5 26.0 24.7
Liguid Flow Rate ( mL / min) 40.0 50.0 50.0 74.0
Liquid inlet Temperature ( C ) 23.0 23.2 23.2 23.1
Amine Concentration ( kmol / m3 ) 2.0 2.0 2.0 2.0
Inlet CO2 Loading (mol CO2 / mol amine) 0.3 0.3 0.1 0.1
Outlet CO2 Loading (mol CO2 / mol amine) 0.5 0.4 0.3 0.3
CO2 Removal ( % ) 62.1 64.1 68.5 67.3
Mass Balance Error ( % ) -10.7 -6.0 -8.8 0.7
Gas Phase CO2 Concentration (%)
( 10 ) 2.15 6.5 6.4 5.7 5.9
( 9 ) 1.775 7.8 7.7 6.8 7.1
( 8 ) 1.28 9.0 9.0 8.2 8.5
( 7 ) 1.10 9.8 9.8 9.0 9.4
( 6 ) 0.88 10.9 10.9 10.3 10.5
( 5 ) 0.66 11.8 11.8 11.2 11.4
( 4 ) 0.445 12.8 12.8 12.6 12.7
( 3 ) 0.325 13.2 13.2 13.1 13.2
( 2 ) 0.215 13.7 13.7 13.6 13.7
( 1 ) 0.10 14.2 14.2 14.4 14.3
( 0 ) 0.0 14.6 14.6 14.6 14.6
System Temperature (C)
( 10 ) 2.15 23.4 23.2 23.5 23.3
( 9 ) 1.775 25.2 25.3 25.1 24.0
( 8 ) 1.28 25.8 25.4 25.9 25.0
( 7 ) 1.10 26.3 26.0 26.7 25.1
( 6 ) 0.88 28.1 27.6 28.0 26.5
( 5 ) 0.66 28.7 27.7 28.2 26.5
( 4 ) 0.445 28.7 28.0 28.6 26.8
( 3 ) 0.325 30.0 28.7 29.1 27.2
( 2 ) 0.215 30.1 29.5 30.6 28.2
( 1 ) 0.215 28.1 27.9 28.5 26.8
( 0 ) 0.0 27.0 27.0 28.0 26.0
Sampling
Point
&
Height
fromBottom
(m)
Sampling
Point
&
Height
fromBottom
(m)

177
Table A.10: DX packed column experiments, liquid flow rate study. (3% MEA+27%
MDEA)
Description DX-MO1 DX-M02 DX-MO3 DX-M04 DX-M05
Room Temperature (Cº) 21.1 21.0 21.0 19.6 20.0
Room Pressure (Kpa) 100.4 100.4 100.4 101.9 101.9
Equilibrium Time (min) 29.0 22.0 24.0 28.0 23.0
Romm Temperature durinf each run (Cº) 21.1 21.0 21.0 19.6 19.9
Gas Flow Rate (L / min) 4.6 4.6 4.6 4.6 4.6
Gas inlet Temperature (Cº) 21.2 20.9 20.8 19.6 19.6
Liguid Flow Rate ( mL / min) 50.0 38.0 28.0 26.0 40.0
Liquid inlet Temperature (Cº) 21.3 21.1 21.3 20.0 20.5
Amine Concentration (kmol/m³) 2.9 2.9 2.9 2.8 2.8
Inlet CO2 Loading (mol CO2 / mol amine) 0.1 0.1 0.1 0.3 0.3
Outlet CO2 Loading (mol CO2 / mol amine) 0.4 0.5 0.6 0.6 0.6
CO2 Removal ( % ) 97.0 90.2 79.1 58.4 66.9
Mass Balance Error ( % ) 2.3 1.9 -1.5 3.6 3.7
Gas Phase CO2 Concentration (%)
(10) 2.15 0.6 1.9 3.9 7.2 5.9
(9) 1.775 3.2 5.4 7.6 9.7 8.5
(8) 1.28 6.1 8.1 9.5 11.0 10.1
(7) 1.10 7.6 9.1 10.4 11.6 10.9
(6) 0.88 9.3 10.5 11.4 12.3 11.8
(5) 0.66 10.7 11.6 12.2 12.9 12.6
(4) 0.445 11.9 12.5 12.9 13.5 13.2
(3) 0.325 12.5 12.9 13.2 13.7 13.6
(2) 0.215 13.1 13.4 13.5 14.0 13.9
(1) 0.10 13.6 13.8 13.9 14.3 14.2
(0) 0.0 14.4 14.4 14.4 14.4 14.4
System Temperature (Cº)
(10) 2.15 21.2 21.5 21.4 20.5 20.7
(9) 1.775 23.8 25.1 26.3 23.5 23.0
(8) 1.28 24.8 25.6 26.4 23.6 23.3
(7) 1.10 24.8 25.8 26.5 23.6 23.3
(6) 0.88 25.9 26.6 26.8 23.7 23.7
(5) 0.66 26.6 26.8 26.8 24.0 24.0
(4) 0.445 26.7 26.8 26.9 24.0 24.0
(3) 0.325 26.6 26.7 26.6 24.0 24.0
(2) 0.215 27.1 26.9 26.5 24.0 24.2
(1) 0.10 23.4 23.0 22.7 21.0 22.0
(0) 0.0 23.1 22.6 22.4 20.7 20.9
Sampling
Point
&
Height
fromBottom
(m)
Sampling
Point
&
Height
fromBottom
(m)
The run naming convention is follow: DX-M ≡ DX packed MEA solution

178
Table A.11: DX packed column experiments, temperature and liquid flow rate for (3%
MEA+27% MDEA) solvent.
Description DX-M06 DX-MO7 DX-M08 DX-MO9 DX-M10
Room Temperature (Cº) 20.1 20.8 21.3 20.2 20.3
Room Pressure (Kpa) 101.9 101.9 101.9 102.4 102.3
Equilibrium Time (min) 16.0 20.0 22.0 20.0 24.0
Romm Temperature durinf each run (Cº) 20.1 20.8 21.5 20.2 20.3
Gas Flow Rate (L / min) 4.6 4.6 4.6 4.6 4.7
Gas inlet Temperature (Cº) 19.9 20.9 22.0 20.0 30.3
Liguid Flow Rate ( mL / min) 50.0 50.0 50.0 25.0 39.9
Liquid inlet Temperature (Cº) 20.7 30.2 44.7 20.6 21.1
Amine Concentration (kmol/m³) 2.8 2.8 2.8 2.9 2.9
Inlet CO2 Loading (mol CO2 / mol amine) 0.3 0.3 0.3 0.2 0.2
Outlet CO2 Loading (mol CO2 / mol amine) 0.5 0.5 0.4 0.6 0.5
CO2 Removal ( % ) 67.6 99.0 100.0 65.0 82.9
Mass Balance Error ( % ) 4.1 0.1 -1.3 2.5 3.1
Gas Phase CO2 Concentration (%)
(10) 2.15 5.8 0.2 0.0 6.3 3.3
(9) 1.775 7.5 1.5 0.0 9.5 6.7
(8) 1.28 9.3 4.2 0.0 10.8 8.9
(7) 1.10 10.2 6.0 0.0 11.5 9.8
(6) 0.88 11.2 8.7 0.0 12.4 11.3
(5) 0.66 12.2 10.5 0.1 13.1 12.3
(4) 0.445 13.1 12.0 1.1 13.6 13.3
(3) 0.325 13.4 12.8 3.8 13.9 13.6
(2) 0.215 13.9 13.5 8.1 14.2 14.0
(1) 0.10 14.2 14.1 12.9 14.5 14.4
(0) 0.0 14.4 14.4 14.4 14.6 14.6
System Temperature (Cº)
(10) 2.15 20.7 30.6 45.6 20.8 21.3
(9) 1.775 23.0 30.5 43.1 26.3 24.7
(8) 1.28 23.2 30.2 38.7 27.1 25.6
(7) 1.10 23.2 30.6 37.1 27.6 26.3
(6) 0.88 23.7 30.6 36.0 28.0 27.2
(5) 0.66 24.1 30.5 34.5 27.7 27.5
(4) 0.445 24.0 30.2 33.6 27.7 27.7
(3) 0.325 24.0 30.2 33.2 27.3 28.0
(2) 0.215 24.5 30.3 34.1 26.6 28.1
(1) 0.10 22.2 26.2 31.0 22.7 24.6
(0) 0.0 22.0 25.0 30.0 22.0 23.6
Sampling
Point
&
Height
fromBottom
(m)
Sampling
Point
&
Height
fromBottom
(m)

179
Table A.12: DX packed column experiments, temperature and liquid flow rate for (3%
MEA+27% MDEA) solvent.
Description DX-M11 DX-M12 DX-M13 DX-M14
Room Temperature (Cº) 20.7 21.6 21.7 21.4
Room Pressure (Kpa) 102.3 101.7 101.7 101.7
Equilibrium Time (min) 23.0 20.0 22.0 20.0
Romm Temperature durinf each run (Cº) 20.7 21.6 21.7 21.7
Gas Flow Rate (L / min) 4.7 4.7 4.7 4.7
Gas inlet Temperature (Cº) 20.8 21.5 21.7 21.8
Liguid Flow Rate ( mL / min) 50.0 50.0 50.0 50.0
Liquid inlet Temperature (Cº) 21.0 20.7 30.7 41.1
Amine Concentration (kmol/m³) 2.9 2.9 2.9 2.9
Inlet CO2 Loading (mol CO2 / mol amine) 0.2 0.1 0.1 0.1
Outlet CO2 Loading (mol CO2 / mol amine) 0.5 0.4 0.4 0.4
CO2 Removal ( % ) 84.5 100.0 100.0 100.0
Mass Balance Error ( % ) 3.2 4.1 1.2 0.8
Gas Phase CO2 Concentration (%)
(10) 2.15 3.0 0.0 0.0 0.0
(9) 1.775 6.3 1.8 0.0 0.0
(8) 1.28 8.6 5.0 0.9 0.0
(7) 1.10 9.6 6.6 2.8 0.5
(6) 0.88 11.0 9.1 6.6 3.8
(5) 0.66 12.1 10.8 9.3 7.2
(4) 0.445 13.0 12.3 11.6 10.3
(3) 0.325 13.4 12.9 12.6 11.7
(2) 0.215 13.8 13.8 13.5 13.1
(1) 0.10 14.3 14.3 14.3 14.3
(0) 0.0 14.6 14.6 14.6 14.6
System Temperature (Cº)
(10) 2.15 21.2 20.9 30.8 41.0
(9) 1.775 24.0 24.0 30.8 40.8
(8) 1.28 24.6 25.5 32.0 39.3
(7) 1.10 24.6 25.6 32.9 39.2
(6) 0.88 25.7 28.0 35.5 43.0
(5) 0.66 26.7 29.0 36.5 43.2
(4) 0.445 27.1 29.1 36.6 43.5
(3) 0.325 27.2 29.2 36.6 43.6
(2) 0.215 28.0 29.7 37.1 44.0
(1) 0.10 24.7 26.0 30.5 34.5
(0) 0.0 24.0 25.0 30.0 34.0
Sampling
Point
&
Height
fromBottom
(m)
Sampling
Point
&
Height
fromBottom
(m)
Sampling
Point
&
Height
fromBottom
(m)

180
Table A.13a: DX packed column experiments, lean loading, temperature, and liquid flow
rate studies (5 wt % MEA+25 wt % MDEA)
Description DX-MO1 DX-M02 DX-MO3 DX-M04
Room Temperature (Cº) 21.0 21.6 21.2 21.3
Room Pressure (Kpa) 102.1 102.1 102.1 102.1
Equilibrium Time (min) 25.0 23.0 22.0 22.0
Romm Temperature durinf each run (Cº) 21.4 21.5 21.2 21.3
Gas Flow Rate (L / min) 4.7 4.7 4.7 4.7
Gas inlet Temperature (Cº) 21.4 21.4 21.3 21.6
Liguid Flow Rate ( mL / min) 25.0 35.4 50.0 50.0
Liquid inlet Temperature (Cº) 21.4 21.7 21.6 21.3
Amine Concentration (kmol/m³) 3.0 3.0 3.0 3.0
Inlet CO2 Loading (mol CO2 / mol amine) 0.0 0.0 0.0 0.2
Outlet CO2 Loading (mol CO2 / mol amine) 0.7 0.5 0.4 0.5
CO2 Removal ( % ) 100.0 100.0 100.0 100.0
Mass Balance Error ( % ) 3.2 4.1 2.7 -2.6
Gas Phase CO2 Concentration (%)
(10) 2.15 0.0 0.0 0.0 0.0
(9) 1.775 0.0 0.0 0.0 0.0
(8) 1.28 5.1 0.0 0.0 0.0
(7) 1.10 8.1 0.0 0.0 0.0
(6) 0.88 10.5 1.2 0.0 2.4
(5) 0.66 11.8 5.9 0.5 6.4
(4) 0.445 12.1 10.1 5.4 10.0
(3) 0.325 13.1 11.8 8.0 11.4
(2) 0.215 13.6 13.2 11.3 13.0
(1) 0.10 14.3 14.3 13.7 14.1
(0) 0.0 14.6 14.6 14.6 14.6
System Temperature (Cº)
(10) 2.15 21.6 21.8 21.8 21.5
(9) 1.775 28.3 21.8 21.8 22.1
(8) 1.28 35.8 22.2 21.9 22.4
(7) 1.10 37.1 23.0 21.7 22.9
(6) 0.88 36.9 28.2 22.8 26.7
(5) 0.66 36.1 22.0 25.7 28.7
(4) 0.445 36.3 35.0 28.5 30.1
(3) 0.325 35.3 35.7 30.1 30.6
(2) 0.215 34.3 35.8 33.5 31.2
(1) 0.10 26.5 28.8 28.7 27.2
(0) 0.0 27.0 27.5 29.0 27.0
Sampling
Point
&
Height
fromBottom
(m)
Sampling
Point
&
Height
fromBottom
(m)

181
Table A.13b: DX packed column experiments, lean loading, temperature, and liquid
flow rate studies (5 wt % MEA+25 wt % MDEA)
Description DX-M05 DX-M06 DX-M07
Room Temperature (Cº) 21.5 21.5 21.6
Room Pressure (Kpa) 102.9 102.1 102.0
Equilibrium Time (min) 18.0 25.0 26.0
Romm Temperature durinf each run (Cº) 21.5 21.5 21.6
Gas Flow Rate (L / min) 4.7 4.7 4.7
Gas inlet Temperature (Cº) 22.2 22.8 21.7
Liguid Flow Rate ( mL / min) 50.0 50.0 50.0
Liquid inlet Temperature (Cº) 31.0 41.3 21.0
Amine Concentration (kmol/m³) 3.0 3.0 0.0
Inlet CO2 Loading (mol CO2 / mol amine) 0.2 0.2 0.2
Outlet CO2 Loading (mol CO2 / mol amine) 0.5 0.4 0.5
CO2 Removal ( % ) 100.0 100.0 100.0
Mass Balance Error ( % ) 1.3 2.3 4.5
Gas Phase CO2 Concentration (%)
(10) 2.15 0.0 0.0 0.0
(9) 1.775 0.0 0.0 0.0
(8) 1.28 0.0 0.0 0.4
(7) 1.10 0.0 0.0 2.6
(6) 0.88 1.8 0.0 6.3
(5) 0.66 5.7 2.9 9.2
(4) 0.445 9.6 7.7 11.5
(3) 0.325 11.3 9.6 12.6
(2) 0.215 12.9 12.0 13.5
(1) 0.10 14.0 13.8 14.2
(0) 0.0 14.6 14.6 14.6
System Temperature (Cº)
(10) 2.15 31.5 42.0 21.2
(9) 1.775 31.7 41.4 23.6
(8) 1.28 31.6 38.7 24.3
(7) 1.10 30.5 38.4 25.5
(6) 0.88 34.7 40.1 28.3
(5) 0.66 36.5 41.7 29.5
(4) 0.445 38.5 44.2 30.8
(3) 0.325 39.0 45.5 31.0
(2) 0.215 39.3 46.3 31.2
(1) 0.10 31.7 35.7 27.1
(0) 0.0 32.0 36.0 27.6
Sampling
Point
&
Height
fromBottom
(m)
Sampling
Point
&
Height
fromBottom
(m)

182
Table A.14: DX packed column experiments, lean loading, temperature, and liquid flow
rate studies for (7 wt % MEA+23 wt % MDEA).
Description DX-MO1 DX-M02 DX-MO3 DX-M04 DX-M05
Room Temperature (Cº) 21.2 21.6 21.6 21.0 22.2
Room Pressure (Kpa) 101.1 101.1 101.1 101.0 101.0
Equilibrium Time (min) 24.0 23.0 23.0 24.0 24.0
Romm Temperature durinf each run (Cº) 21.3 21.5 21.7 21.8 22.2
Gas Flow Rate (L / min) 4.7 4.7 4.7 4.7 4.7
Gas inlet Temperature (Cº) 21.8 21.6 21.9 22.2 22.5
Liguid Flow Rate ( mL / min) 25.0 35.5 49.3 50.0 50.0
Liquid inlet Temperature (Cº) 21.0 21.3 21.4 21.5 30.5
Amine Concentration (kmol/m³) 3.2 3.2 3.2 3.2 3.2
Inlet CO2 Loading (mol CO2 / mol amine) 0.0 0.0 0.0 0.2 0.2
Outlet CO2 Loading (mol CO2 / mol amine) 0.7 0.5 0.4 0.5 0.5
CO2 Removal ( % ) 100.0 100.0 100.0 100.0 100.0
Mass Balance Error ( % ) 3.1 4.7 2.4 3.3 5.1
Gas Phase CO2 Concentration (%)
(10) 2.15 0.0 0.0 0.0 0.0 0.0
(9) 1.775 0.0 0.0 0.0 0.0 0.0
(8) 1.28 0.0 0.0 0.0 0.0 0.0
(7) 1.10 0.0 0.0 0.0 0.0 0.0
(6) 0.88 2.7 0.0 0.0 0.0 0.0
(5) 0.66 8.3 0.0 0.0 0.0 0.0
(4) 0.445 10.7 2.9 0.6 3.3 2.7
(3) 0.325 11.5 5.9 3.7 6.3 5.3
(2) 0.215 12.3 9.7 7.7 9.3 9.0
(1) 0.10 13.0 12.3 11.8 12.3 12.2
(0) 0.0 14.6 14.6 14.6 14.6 14.6
System Temperature (Cº)
(10) 2.15 21.6 21.3 21.5 21.5 30.7
(9) 1.775 22.3 22.1 22.2 22.1 31.5
(8) 1.28 22.3 21.5 21.7 21.8 29.6
(7) 1.10 28.2 21.5 21.5 21.6 29.3
(6) 0.88 39.3 22.5 22.0 22.5 30.0
(5) 0.66 42.7 25.8 22.8 24.1 31.3
(4) 0.445 42.8 31.5 25.1 26.7 34.6
(3) 0.325 40.7 36.6 28.7 30.6 35.5
(2) 0.215 39.2 39.3 34.6 33.1 40.1
(1) 0.10 29.1 32.0 30.2 29.4 33.7
(0) 0.0 29.0 31.6 30.0 28.5 33.0
Sampling
Point
&
Height
fromBottom
(m)
Sampling
Point
&
Height
fromBottom
(m)
Sampling
Point
&
Height
fromBottom
(m)

183
Table A.15: DX packed column experiments, lean loading, temperature, and liquid flow
rate studies (7 wt % MEA+23 wt % MDEA).
Description DX-MO1 DX-M02 DX-M03 DX-M04
Room Temperature (Cº) 22.2 22.2 21.7 21.8
Room Pressure (Kpa) 101.0 101.0 101.0 101.0
Equilibrium Time (min) 24.0 23.0 26.0 25.0
Romm Temperature durinf each run (Cº) 22.3 22.1 21.7 21.8
Gas Flow Rate (L / min) 4.7 4.7 4.7 4.7
Gas inlet Temperature (Cº) 23.6 23.4 22.4 22.4
Liguid Flow Rate ( mL / min) 50.0 25.0 25.0 50.0
Liquid inlet Temperature (Cº) 40.1 22.3 20.9 20.7
Amine Concentration (kmol/m³) 3.2 3.2 3.3 3.3
Inlet CO2 Loading (mol CO2 / mol amine) 0.2 0.2 0.3 0.3
Outlet CO2 Loading (mol CO2 / mol amine) 0.5 0.7 0.8 0.6
CO2 Removal ( % ) 100.0 100.0 100.0 100.0
Mass Balance Error ( % ) 3.6 4.1 3.8 4.2
Gas Phase CO2 Concentration (%)
(10) 2.15 0.0 0.0 0.0 0.0
(9) 1.775 0.0 0.0 2.0 0.0
(8) 1.28 0.0 0.5 6.4 0.0
(7) 1.10 0.0 3.6 7.8 0.0
(6) 0.88 0.0 7.9 10.2 0.3
(5) 0.66 0.0 10.4 11.7 4.0
(4) 0.445 2.3 11.7 12.8 8.2
(3) 0.325 5.1 12.2 13.3 10.2
(2) 0.215 9.0 12.7 13.8 12.4
(1) 0.10 12.4 13.2 14.2 13.9
(0) 0.0 14.6 14.6 14.6 14.6
System Temperature (Cº)
(10) 2.15 40.9 22.2 21.2 21.0
(9) 1.775 40.8 23.5 24.6 21.8
(8) 1.28 38.3 28.0 30.1 21.3
(7) 1.10 37.6 33.5 33.5 21.9
(6) 0.88 38.0 37.4 35.6 25.7
(5) 0.66 39.3 36.3 34.3 28.4
(4) 0.445 42.0 38.2 33.6 29.3
(3) 0.325 45.7 37.8 33.0 30.9
(2) 0.215 48.1 37.0 32.5 31.6
(1) 0.10 38.8 28.6 27.0 28.5
(0) 0.0 38.0 28.0 26.8 28.0
Sampling
Point
&
Height
fromBottom
(m)
Sampling
Point
&
Height
fromBottom
(m)

184
Table A.16: DX packed column experiments for different ratios (DEAB+MEA)
Description DX-M.D5 DX-M.D6 DX-M.D7 DX-M.D8 DX-M.D9
MEA+DEAB ratio 2.0/5.0 2.0/5.0 1.5/5.0 1.0/5.0 0.5/5.0
Room Temperature (Cº) 24.300 24.600 23.300 23.000 22.200
Room Pressure (Kpa) 102 101.81 100.93 100.63 100.64
Equilibrium Time (min) 21.00 20.00 20.00 21.00 28.00
Romm Temperature durinf each run (Cº) 24.30 24.60 23.20 23.00 22.30
Gas Flow Rate (L / min) 5.70 5.70 5.70 5.70 5.70
Gas inlet Temperature (Cº) 24.90 25.00 24.30 23.40 23.50
Liguid Flow Rate ( mL / min) 30.00 30.00 30.00 30.00 30.00
Liquid inlet Temperature (Cº) 25.90 26.00 23.30 24.00 23.10
Amine Concentration (kmol/m³) 7.15 7.17 6.65 6.15 5.75
Inlet CO2 Loading (mol CO2 / mol amine) 0.030 0.170 0.175 0.170 0.170
Outlet CO2 Loading (mol CO2 / mol amine) 0.374 0.480 0.554 0.530 0.575
CO2 Removal ( % ) 100.00 100.00 100.00 100.00 100.00
Mass Balance Error ( % ) 4.2 3.8 4.6 5.2 3.4
Gas Phase CO2 Concentration (%)
(10) 2.15 0.00 0.00 0.00 0.00 0.00
(9) 1.775 0.00 0.00 0.00 0.00 0.00
(8) 1.28 0.00 0.00 0.00 0.00 0.00
(7) 1.10 0.00 0.00 0.00 0.00 0.00
(6) 0.88 0.00 0.00 0.00 0.00 0.00
(5) 0.66 0.00 0.00 0.00 0.00 0.00
(4) 0.445 0.00 0.00 0.00 0.00 0.50
(3) 0.325 0.20 0.30 0.40 0.30 2.80
(2) 0.215 4.70 4.40 4.00 3.90 8.00
(1) 0.10 11.70 11.00 10.90 10.40 12.10
(0) 0.0 14.90 14.90 14.90 14.90 14.90
System Temperature (Cº)
(10) 2.15 25.70 26.10 23.10 23.90 23.30
(9) 1.775 26.00 26.10 23.10 23.70 23.60
(8) 1.28 26.20 26.10 22.80 23.60 23.60
(7) 1.10 25.80 26.80 22.80 23.60 23.10
(6) 0.88 26.60 26.90 23.20 23.60 23.30
(5) 0.66 26.60 27.00 23.30 23.60 23.50
(4) 0.445 26.60 27.10 23.40 23.70 25.80
(3) 0.325 38.30 39.10 30.00 31.40 44.00
(2) 0.215 57.40 55.40 53.00 52.00 55.70
(1) 0.10 46.30 47.30 46.60 46.20 45.20
(0) 0.0 46.00 47.00 46.10 45.80 44.80
Sampling
Point
&
Height
fromBottom
(m)
Sampling
Point
&
Height
fromBottom
(m)
Sampling
Point
&
Height
fromBottom
(m)
The run naming convention is follow: DX-M.D ≡ DX packed MEA.DEAB solution

185
Table A.17: DX packed column experiments for different ratios (DEAB+MEA)
Description DX-M.D10 DX-M.D11 DX-M.D12 DX-M.D13 DX-M.D14
DEAB+MEA Ratio 0.5/5.0 0.5/5.0 0.5/5.0 0.25/5.0 0.25/5.0
Room Temperature (Cº) 23.0 22.2 22.8 23.4 23.6
Room Pressure (Kpa) 100.3 100.6 100.7 101.0 101.0
Equilibrium Time (min) 23.0 28.0 22.0 21.0 22.0
Romm Temperature durinf each run (Cº) 23.0 22.3 23.0 23.4 23.6
Gas Flow Rate (L/min) 5.7 5.7 5.7 5.7 5.7
Gas inlet Temperature (Cº) 23.7 23.5 23.6 23.8 24.3
Liguid Flow Rate ( mL/min) 30.0 30.0 30.0 50.0 40.0
Liquid inlet Temperature (Cº) 24.5 23.1 23.0 22.5 23.0
Amine Concentration (kmol/m³) 5.6 5.8 6.0 5.3 5.3
Inlet CO2 Loading (mol CO2 / mol amine) 0.1 0.2 0.3 0.2 0.2
Outlet CO2 Loading (mol CO2 / mol amine) 0.5 0.6 0.7 0.5 0.5
CO2 Removal ( % ) 100.0 100.0 100.0 100.0 100.0
Mass Balance Error ( % ) 3.9 4.3 4.1 5.4 3.4
Gas Phase CO2 Concentration (%)
(10) 2.15 0.0 0.0 0.0 0.0 0.0
(9) 1.775 0.0 0.0 0.0 0.0 0.0
(8) 1.28 0.0 0.0 0.0 0.0 0.0
(7) 1.10 0.0 0.0 0.0 0.0 0.0
(6) 0.88 0.0 0.0 0.0 0.0 0.0
(5) 0.66 0.0 0.0 0.0 0.0 0.0
(4) 0.445 0.0 0.1 0.5 0.1 0.2
(3) 0.325 0.6 1.8 2.8 1.5 2.0
(2) 0.215 5.2 7.2 8.0 6.4 7.1
(1) 0.10 11.4 11.5 12.1 12.3 12.7
(0) 0.0 14.9 14.9 14.9 14.9 14.9
System Temperature (Cº)
(10) 2.15 23.6 23.6 23.3 22.8 23.0
(9) 1.775 23.5 23.5 23.6 22.8 23.2
(8) 1.28 23.3 23.5 23.6 22.9 23.3
(7) 1.10 23.9 23.1 23.1 23.0 23.1
(6) 0.88 23.7 23.3 23.3 23.3 23.4
(5) 0.66 23.7 23.3 23.5 23.6 23.7
(4) 0.445 24.1 24.5 25.8 23.7 24.1
(3) 0.325 35.0 35.1 44.0 27.1 33.2
(2) 0.215 54.5 52.4 55.7 42.7 46.7
(1) 0.10 44.2 43.8 45.2 36.2 38.5
(0) 0.0 44.0 43.0 44.6 35.8 38.0
Sampling
Point
&
Height
fromBottom
(m)
Sampling
Point
&
Height
fromBottom
(m)
186
Table A.18: DX packed column experiments for different ratios (DEAB+MEA)
Description DX-M.D15 DX-M.D16 DX-M.D17 DX-M.D18 DX-M.D19
DEAB+MEA Ratio 0.25/5.0 0.25/5.0 0.25/5.0 0.25/5.0 2.0/5.0
Room Temperature (Cº) 23.7 23.8 23.8 23.2 24.0
Room Pressure (Kpa) 101.0 101.0 101.0 101.4 99.9
Equilibrium Time (min) 22.0 24.0 20.0 23.5 22.0
Romm Temperature durinf each run (Cº) 23.7 23.8 23.8 23.2 21.6
Gas Flow Rate (L / min) 5.7 5.7 5.7 24.4 5.7
Gas inlet Temperature (Cº) 23.8 24.4 25.6 24.1 23.9
Liguid Flow Rate ( mL / min) 30.0 30.0 30.0 30.0 25.0
Liquid inlet Temperature (Cº) 22.8 32.0 43.0 23.1 21.7
Amine Concentration (kmol/m³) 5.3 5.3 5.3 5.4 6.9
Inlet CO2 Loading (mol CO2 / mol amine) 0.2 0.2 0.2 0.2 0.0
Outlet CO2 Loading (mol CO2 / mol amine) 0.6 0.7 0.6 0.6 0.6
CO2 Removal ( % ) 100.0 100.0 100.0 100.0 100.0
Mass Balance Error ( % ) 2.8 1.6 -1.1 4.2 3.7
Gas Phase CO2 Concentration (%)
(10) 2.15 0.0 0.0 0.0 0.0 0.0
(9) 1.775 0.0 0.0 0.0 0.0 0.0
(8) 1.28 0.0 0.0 0.0 0.0 0.0
(7) 1.10 0.0 0.0 0.0 0.0 0.0
(6) 0.88 0.0 0.0 0.0 0.0 0.0
(5) 0.66 0.0 0.0 0.0 0.0 0.0
(4) 0.445 0.3 0.0 0.0 0.0 0.0
(3) 0.325 2.3 1.8 1.4 1.5 1.2
(2) 0.215 7.7 7.4 7.1 6.5 6.0
(1) 0.10 13.0 13.1 13.0 11.8 12.1
(0) 0.0 14.9 14.9 14.9 14.9 14.9
System Temperature (Cº)
(10) 2.15 23.0 32.7 43.6 23.5 21.6
(9) 1.775 23.1 31.8 40.5 23.5 22.0
(8) 1.28 23.2 31.5 38.0 23.5 23.0
(7) 1.10 23.2 29.5 36.8 23.2 23.6
(6) 0.88 23.8 29.3 36.5 23.3 25.3
(5) 0.66 24.0 29.2 35.5 23.5 25.3
(4) 0.445 24.4 30.1 36.6 24.8 34.6
(3) 0.325 42.2 56.1 60.2 34.5 58.0
(2) 0.215 54.2 62.6 64.5 52.5 62.7
(1) 0.10 42.3 45.8 48.1 44.0 46.7
(0) 0.0 41.8 45.0 47.6 43.2 46.0
Sampling
Point
&
Height
fromBottom
(m)
Sampling
Point
&
Height
fromBottom
(m)

187
Table A.19: DX packed column experiments for different ratios (DEAB+MEA)
Description DX-M.D20 DX-M.D21 DX-M.D22 DX-M.D23
DEAB+MEA Ratio 2.0/5.0 2.0/5.0 2.0/5.0 2.0/5.0
Room Temperature (Cº) 25.7 25.6 25.8 25.5
Room Pressure (Kpa) 100.0 100.1 100.3 100.5
Equilibrium Time (min) 22.0 20.0 21.0 18.0
Romm Temperature durinf each run (Cº) 22.1 25.8 25.8 25.0
Gas Flow Rate (L / min) 5.7 5.7 5.7 5.7
Gas inlet Temperature (Cº) 25.8 25.2 25.9 25.5
Liguid Flow Rate ( mL / min) 25.0 25.0 30.0 30.0
Liquid inlet Temperature (Cº) 22.6 23.7 23.7 24.0
Amine Concentration (kmol/m³) 6.9 6.9 6.9 6.8
Inlet CO2 Loading (mol CO2 / mol amine) 0.1 0.2 0.2 0.2
Outlet CO2 Loading (mol CO2 / mol amine) 0.5 0.6 0.5 0.5
CO2 Removal ( % ) 100.0 100.0 100.0 100.0
Mass Balance Error ( % ) 4.3 4.1 3.8 3.6
Gas Phase CO2 Concentration (%)
(10) 2.15 0.0 0.0 0.0 0.0
(9) 1.775 0.0 0.0 0.0 0.0
(8) 1.28 0.0 0.0 0.0 0.0
(7) 1.10 0.0 0.0 0.0 0.0
(6) 0.88 0.0 0.0 0.0 0.0
(5) 0.66 0.0 0.0 0.0 0.0
(4) 0.445 0.0 0.0 0.0 0.0
(3) 0.325 0.7 1.5 0.3 0.0
(2) 0.215 5.3 6.3 3.9 2.6
(1) 0.10 11.2 11.4 10.5 9.9
(0) 0.0 14.9 14.9 14.9 14.9
System Temperature (Cº)
(10) 2.15 22.0 23.0 24.1 23.7
(9) 1.775 22.1 24.6 24.4 24.5
(8) 1.28 23.7 24.7 24.5 24.5
(7) 1.10 24.1 24.8 24.6 24.5
(6) 0.88 25.6 25.7 25.1 24.7
(5) 0.66 25.7 25.9 25.2 24.7
(4) 0.445 27.5 34.8 25.2 24.7
(3) 0.325 49.7 55.8 31.8 26.1
(2) 0.215 60.7 60.6 54.2 48.3
(1) 0.10 46.6 47.1 44.7 40.3
(0) 0.0 46.0 46.4 44.0 39.8
Sampling
Point
&
Height
fromBottom
(m)
Sampling
Point
&
Height
fromBottom
(m)

188
Table A.20: DX packed column experiments for different ratios (DEAB+MEA)
Description DX-M.D24 DX-M.D25 DX-M.D26 DX-M.D26
DEAB+MEA Ratio 1.75/5.0 1.5/5.0 1.5/5.0 1.25/5.0
Room Temperature (Cº) 24.1 23.2 24.2 24.3
Room Pressure (Kpa) 101.3 101.8 101.7 101.5
Equilibrium Time (min) 21.0 21.0 22.0
Romm Temperature durinf each run (Cº) 24.1 23.3 24.2 24.3
Gas Flow Rate (L / min) 5.7 5.7 5.7 5.7
Gas inlet Temperature (Cº) 24.2 22.5 24.5 24.6
Liguid Flow Rate ( mL / min) 30.0 30.0 30.0 30.0
Liquid inlet Temperature (Cº) 23.8 23.3 23.3 23.2
Amine Concentration (kmol/m³) 6.8 6.6 6.3 6.3
Inlet CO2 Loading (mol CO2 / mol amine) 0.2 0.2 0.2 0.2
Outlet CO2 Loading (mol CO2 / mol amine) 0.6 0.6 0.5 0.6
CO2 Removal ( % ) 100.0 100.0 100.0 100.0
Mass Balance Error ( % ) 4.6 3.8 5.3 4.6
Gas Phase CO2 Concentration (%)
(10) 2.15 0.0 0.0 0.0 0.0
(9) 1.775 0.0 0.0 0.0 0.0
(8) 1.28 0.0 0.0 0.0 0.0
(7) 1.10 0.0 0.0 0.0 0.0
(6) 0.88 0.0 0.0 0.0 0.0
(5) 0.66 0.0 0.0 0.0 0.0
(4) 0.445 0.0 0.0 0.0 0.0
(3) 0.325 0.6 0.7 0.3 1.1
(2) 0.215 4.5 4.7 3.6 5.9
(1) 0.10 10.0 10.3 10.0 11.1
(0) 0.0 14.9 14.9 14.9 14.9
System Temperature (Cº)
(10) 2.15 24.0 22.8 23.1 23.5
(9) 1.775 24.0 22.8 23.7 23.6
(8) 1.28 24.2 22.8 23.7 23.7
(7) 1.10 24.2 23.0 23.7 23.9
(6) 0.88 24.2 23.0 24.2 24.1
(5) 0.66 24.5 23.1 24.2 24.1
(4) 0.445 24.7 23.7 24.2 25.8
(3) 0.325 36.2 30.6 26.8 45.0
(2) 0.215 53.5 52.0 49.8 57.7
(1) 0.10 43.2 42.5 41.2 46.5
(0) 0.0 42.4 42.0 40.8 46.0
Sampling
Point
&
Height
fromBottom
(m)
Sampling
Point
&
Height
fromBottom
(m)

189
Appendix B: Sample Calculations
Calculation of the (y*A) term
In this work, the term of y*
A in Eq.2.10 in Chapter 2 was measured relying on the
previous work of the solubility of CO2 into DEAB by Sema et al., (2012). In the literature
(Aroonwilas et al. 1999; deMontigny 2004). It is usually assumed that the term of y*
A is
equal to zero because the compound A is quickly consumed in the fast chemical reaction
and difficult to measure, but in this work, the term of y*
A was measured as follows:
dZ
dY
yyP
GaK
GA
AGA
IvG
,
*
,
(B.1)
eaCO
CO
AHe
Py
min
*
2
2
(B.2)
where *
Ay is the equilibrium concentration of gas at interface, eaCOHe min2 is solubility of
CO2 in aqueous amine solution, kPa m3/kmol, and partial pressure
2COP of CO2, kPa.
B.1 The solubility of CO2 into DEAB
The term of eaCOHe min2 can be determined from Eq. B.3:

190
OHON
OHCO
eaONeaCOHe
HeHeHe
22
22
22 minmin (B.3)
The solubility of pure DEAB solvent can be determined from the solubilities of CO2 and
N2O for water, which were obtained from the work of Versteeg and van Swaaij (1988).
The correlations described are shown in Eqs. B.4 and B.5 below:
THe OHON
2284exp1055.8 6
22 (B.4)
THe OHCO
2044exp1082.2 6
22 (B.5)
The solubility of CO2 into DEAB was determined by Sema et al., (2012):
3
3
2
2
1
10min2CACACAAHe eaON (B.6)
The (T) in Eqs. 2.13 and 2.14 can be used from the experimental data of the packed
column by determining the solubility of CO2 in aqueous amine solution; then, the term
y*
A can be calculated in Eq. (B-2).
The temperature of the solvent along the column is shown in the table below:
DEAB-run no. DX-DEAB.1
Height of the column T - K
2.15 cm 296.30
1.78 297.80
1.28 298.40
1.10 298.70
0.88 300.30
0.66 300.60

191
0.45 300.90
0.33 301.40
0.22 302.90
0.10 300.40
0.00 299.80
B.2 The solubilities of NO2
THe OHON
2284exp1055.8 6
22 (B.4)
3.296
2284exp1055.8 6
22 OHONHe (B.5)
05.114522 OHONHe
B.3 The solubilities of CO2
THe OHCO
2044exp1082.2 6
22
3.296
2044exp1082.2 6
22 OHCOHe
5.284622 OHCOHe

192
B.4 The solubility of CO2 into DEAB
OHON
OHCO
eaONeaCOHe
HeHeHe
22
22
22 minmin
3
3
2
2
1
10min2CACACAAHe eaON
(B.6)
C = the concentration of the amine
3
3
2
2
1
10 TaTaTaaAi
The experimental data of the solubility of CO2 into DEAB from Sema et al., (2012) were
used to measure parameter in Eq. B.6, and then it was used to calculate eaONHe min2 .
So,
4.194317151min2 eaONHe
We then calculate the solubility of CO2 in aqueous amine solution in Eq. B.3 as follows:
OHON
OHCO
eaONeaCOHe
HeHeHe
22
22
22 minmin (B.3)
05.1145
5.28464.194317151min2 eaCOHe
7.483052346min2 eaCOHe

193
Calculate the *
Ay term from Eq. B.2 as follows:
eaCO
CO
AHe
Py
min
*
2
2
4830523467
81343.5* Ay
082.1* EyA
dZ
dY
yyP
GaK
GA
AGA
IvG
,
*
,

194
APPENDIX C: Sample of Calculation for Mass Error
C.1 Determine solution concentration
The process of titration is use to determine the concentration of the solution.
Hydrochloric acid (HCl) is used to titrate a known sample volume of the solution, with
methyl orange as an indicator. The following relationship can then be solved:
C1V1 = C2V2 (C.1)
where: C1 = solution concentration (mol/L)
V1 = solution sample volume (ml)
C2 = HC1 concentration (mol/L)
V2 = HC1 volume, from titration (ml)
The solution concentration in unknown: C1 = ? (mol/L)
The solution sample volume collected is: V1 = 4 (ml)
The hydrochloric acid concentration is: C2 = 2 (mol/L)
The titration requires hydrochloric acid: V2 = 18 (ml)
Solving:

195
1
221
V
VCC
Lmol
ml
mlLmolC /0.9
4
18/21
C.2 Determine Solution Loading
The solution loading is determined in conjunction with the determination of
solution concentration using the titration process. As the HCl gas is added to the solution,
it reacts with the absorption by-product and frees the CO2 molecules. The vented CO2 is
collected in a gas burette so that the volume of CO2 released can be measured. The
following relationship can then be solved:
AMV
V
B
MV
AB
V
CO
CO
11
2
2
(C.2)
where: α = solution CO2 loading (mol CO2/mol MEA)
VCO2 = volume of CO2 collected (ml)
B = conversion constant (22.41 L/mol)
V1 = solution sample volume (ml)
M = solution concentration (mol/L)
The volume of CO2 released and collected is: VCO2 = 164 (mol/L)

196
The solution sample volume collected is: V1 = 4 (ml)
The solution concentration (from titration) is: M = 9 (mol/L)
Solving:
molMEAcomol
mlLmlLmol
ml/203.0
/41.224/9
1642
C.3 Mass Balance Error
At the conclusion of a run, a mass balance error calculation was done to ensure that no
significant errors occurred during the run and that the results are acceptable. The
calculation itself compares the amount of CO2 at the inlet and outlets of the gas side with
the amount of CO2 at the inlet and outlets of the liquid side.
αi = 0.061
αi = 0.516CO2 in l
CO2 out l
C.3.1 Gas Side Analysis
Removed CO2 = [(YCO2)in – (YCO2)out] × GI

197
where: YCO2 = mole ratio
GI = inert gas flow rate (mol/min)
Solving:
Removed CO2 = [(14.9/85.1)in – (0.0/100)out](0.1767 mol/min) = 0.031 mol/min
C.3.2 Liquid side analysis
Absorbed CO2 = (CO2) out - (CO2) in
(CO2) in = M αin L
(CO2) out = M αin L
where: M = solution concentration (mol/L)
α = solution loading (mol CO2/mol MEA)
L = liquid flow rate (L/min)
C.3.3 Mass balance error
Solving:
(CO2) in = (2.0 mol/L)×(0.13 mol CO2/mol MEA)×(0.095 L/min) = 0.0247 mol CO2/min
(CO2) out = (2.0 mol/L)×(0.29 mol CO2/mol MEA)×(0.095 L/min) = 0.0551 mol CO2/min
Absorbed CO2 = 0.0304 mol CO2/min
The mass balance error:

198
2
22 Re%
COAbsorbed
COmovedCOAbsorberError
%97.1%1000304.0
031.00304.0%
Error