massachusetts consumer survey results 2011 - ma...
TRANSCRIPT
50-2 Howard Street, Somerville, MA 02144
Phone: (617) 284-6230 Fax: (617) 284-6239
www.nmrgroupinc.com
Submitted to:
Cape Light Compact
National Grid
NSTAR
Unitil
Western Massachusetts Electric
Energy Efficiency Advisory Council Consultant
Submitted by:
NMR Group, Inc.
Massachusetts Consumer Survey Results 2012
FINAL
10/23/2012
Massachusetts Lighting Consumer Survey Report
NMR
Contents
EXECUTIVE SUMMARY .................................................................................................................... I
BACKGROUND AND METHODOLOGY .............................................................................................. I
SUMMARY OF FINDINGS ................................................................................................................ II
AWARENESS OF ENERGY-SAVING LIGHT BULBS .......................................................................... II
USE OF VARIOUS LIGHTING TECHNOLOGIES ...............................................................................III
RECENT LIGHTING PURCHASES .................................................................................................. IV
KEY LIGHTING CONCEPTS ............................................................................................................ V
AWARENESS OF AND REACTIONS TO EISA ................................................................................... V
CFL PRICE AWARENESS AND SATISFACTION ............................................................................. VI
CONCLUSIONS AND RECOMMENDATIONS ................................................................................. VIII
1 INTRODUCTION ........................................................................................................................ 1
1.1 BACKGROUND ....................................................................................................................1
1.2 METHODOLOGY .................................................................................................................2
2 AWARENESS OF ENERGY-SAVING LIGHT BULBS AND EISA ................................................. 4
2.1 CFL AWARENESS AND FAMILIARITY .................................................................................4
2.2 FAMILIARITY WITH OTHER ENERGY-SAVINGS BULBS ........................................................7
2.3 AWARENESS OF EISA AND MEDIA ATTENTION TO LIGHT BULBS ......................................9
3 USE OF VARIOUS LIGHTING TECHNOLOGIES ...................................................................... 12
3.1 INCANDESCENT BULB USE ...............................................................................................12
3.2 CFL BULB USE ................................................................................................................14
3.3 ALTERNATIVE LIGHTING TECHNOLOGIES ........................................................................18
4 RECENT LIGHTING PURCHASES ........................................................................................... 20
4.1 RECENT PURCHASE HISTORY OF INCANDESCENT BULBS .................................................20
4.1.1 Shopping for 100 Watt Incandescent Bulbs............................................................ 20
4.1.2 Types of Bulbs Purchased when Shopping for 100 Watt Incandescents ................ 22
4.2 PURCHASE OF ALL TYPES OF LIGHT BULBS .....................................................................24
5 KEY LIGHTING CONCEPTS ................................................................................................... 26
5.1 INFORMATION CONSIDERED WHEN BUYING LIGHT BULBS ...............................................26
5.2 LUMENS AND COLOR TEMPERATURE ...............................................................................28

Massachusetts Lighting Consumer Survey Report
NMR
6 POTENTIAL REACTIONS TO EISA ........................................................................................ 31
6.1 BULB CHOICE UNDER EISA .............................................................................................31
6.2 STOCKPILING OF INCANDESCENTS ....................................................................................34
7 CFL PRICE AWARENESS AND SATISFACTION ...................................................................... 38
7.1 CFL PRICE AWARENESS...................................................................................................38
7.2 CFL SATISFACTION ..........................................................................................................40
8 CUSTOMER DEMOGRAPHICS ................................................................................................ 47
8.1 HOUSING CHARACTERISTICS ............................................................................................47
8.2 SOCIAL ATTRIBUTES ........................................................................................................50
8.3 ENVIRONMENTAL AND EARLY ADOPTER OPINIONS .........................................................52
9 CONCLUSIONS AND RECOMMENDATIONS ............................................................................ 53
APPENDIX A CONSUMER SURVEY QUESTIONNAIRE .............................................................. A1

Massachusetts Lighting Consumer Survey Report
NMR
Tables
TABLE 1-1: TELEPHONE SURVEY SAMPLE .................................................................................... 2
TABLE 1-2: POPULATION, SAMPLE SIZES, AND WEIGHTS FOR RDD SURVEY ............................. 3
TABLE 2-1: AWARENESS OF CFLS ................................................................................................. 4
TABLE 2-2: FAMILIARITY WITH CFLS .......................................................................................... 5
TABLE 2-3: FAMILIARITY WITH SPECIALTY CFLS ....................................................................... 6
TABLE 2-4: FAMILIARITY WITH ENERGY-SAVING BULB TYPES 2011, 2012 ................................ 7
TABLE 2-5: RESPONDENTS’ JUDGMENTS ABOUT RELATIVE ENERGY USE OF CFLS & HALOGEN
BULBS .............................................................................................................................................. 8
TABLE 2-6: EISA STANDARDS ....................................................................................................... 9
TABLE 2-7: WHETHER HAS SEEN OR READ ANY NEWS STORIES ABOUT LIGHT BULBS IN PAST
YEAR ............................................................................................................................................... 9
TABLE 2-8: INFORMATION REMEMBERED IN NEWS STORIES ABOUT LIGHT BULBS ................. 10
TABLE 2-9: AWARENESS OF EISA LAW ...................................................................................... 11
TABLE 3-1: 100 WATT INCANDESCENT BULBS INSTALLED IN HOME ........................................ 12
TABLE 3-2: REASONS 100 WATT INCANDESCENT BULBS NOT INSTALLED IN HOME ................ 13
TABLE 3-3: ANY INCANDESCENT BULBS INSTALLED IN HOME .................................................. 14
TABLE 3-4: CFLS EVER INSTALLED IN HOME ............................................................................ 14
TABLE 3-5: WHEN FIRST USED A CFL ........................................................................................ 15
TABLE 3-6: CFLS CURRENTLY INSTALLED IN HOME ................................................................. 16
TABLE 3-7: REASONS FOR NO LONGER USING CFLS ................................................................. 17
TABLE 3-8: USE OF DIMMABLE CFLS IN THE HOME .................................................................. 18
TABLE 3-9: LED SCREW-IN BULBS INSTALLED IN HOME .......................................................... 18
TABLE 3-11: TYPES OF FIXTURES OR LAMPS WITH INSTALLED LED BULBS IN HOME--2012 . 19
TABLE 4-1: WHETHER RESPONDENTS HAD LOOKED FOR 100 WATT INCANDESCENTS IN THE
PAST THREE MONTHS .................................................................................................................. 20
TABLE 4-2: WHETHER RESPONDENTS HAD FOUND 100 WATT INCANDESCENT BULBS ON
RETAILERS SHELVES IN THE PAST THREE MONTHS .................................................................. 21
TABLE 4-3: WHETHER RESPONDENTS HAD LOOKED ELSEWHERE FOR 100 WATT
INCANDESCENT BULBS IF NOT FOUND AT RETAILER ................................................................. 21
TABLE 4-4: 100 WATT INCANDESCENT BULBS PURCHASED IN PAST THREE MONTHS ............. 22
TABLE 4-5: WHETHER PURCHASED LIGHT BULBS INSTEAD OF 100 WATT INCANDESCENT IN
PAST THREE MONTHS .................................................................................................................. 22
TABLE 4-6: TYPE OF BULB PURCHASED INSTEAD OF 100 WATT INCANDESCENT ..................... 23
TABLE 4-7: WATTAGE OF INCANDESCENT BULB BOUGHT INSTEAD OF 100 WATT
INCANDESCENT ............................................................................................................................. 23
TABLE 4-8: LIGHT BULB PURCHASES IN THE PAST THREE MONTHS ........................................ 24
TABLE 4-9: TYPE OF BULB PURCHASED IN THE PAST THREE MONTHS ..................................... 25

Massachusetts Lighting Consumer Survey Report
NMR
TABLE 5-1: INFORMATION LOOKED FOR ON BULB PACKAGING ................................................ 27
TABLE 5-2: WHETHER RESPONDENTS HAD SEEN OR HEARD THE TERM “LUMENS”, “WARM
WHITE” AND “COOL WHITE”...................................................................................................... 28
TABLE 5-3: UNDERSTANDING OF THE TERM “LUMENS” ............................................................ 29
TABLE 5-4: UNDERSTANDING OF THE TERMS “WARM WHITE” AND “COOL WHITE” ............. 30
TABLE 6-1: BULB CHOICE UNDER EISA ..................................................................................... 31
TABLE 6-2: REASONS FOR BULB CHOICE UNDER EISA .............................................................. 33
TABLE 6-3: LIKELIHOOD OF BUYING AND SAVING EXTRA 100 WATT INCANDESCENT BULBS
FOR USE AFTER 2012 ................................................................................................................... 35
TABLE 6-4: QUANTITY OF 100 WATT INCANDESCENT BULBS PURCHASED ............................... 36
TABLE 6-5: TOTAL NUMBER OF 100 WATT INCANDESCENT BULBS PURCHASED BY SELF-
REPORTED TENDENCY TO STOCK PILE ....................................................................................... 37
TABLE 7-1: CFL PRICE COMPARED TO PREVIOUS YEAR .......................................................... 39
TABLE 7-2: WHETHER HIGHER PRICE PREVENTED RECENT CFL PURCHASES ....................... 40
TABLE 7-3: SATISFACTION WITH STANDARD CFLS .................................................................... 40
TABLE 7-4: CHANGE IN SATISFACTION WITH CFLS OVER PAST YEAR .................................... 41
TABLE 7-5: WHETHER NEWS STORIES ABOUT LIGHT BULBS INCREASED OR DECREASED
SATISFACTION WITH CFLS .......................................................................................................... 41
TABLE 7-6: REASONS FOR INCREASED SATISFACTION WITH CFLS OVER PAST YEAR............. 42
TABLE 7-7: REASONS FOR DECREASED SATISFACTION WITH CFLS OVER PAST YEAR ........... 43
TABLE 7-8: REASONS RESPONDENTS LIKE CFL BULBS ............................................................. 44
TABLE 7-9: REASONS RESPONDENTS DO NOT LIKE CFLS ........................................................ 45
TABLE 7-10: DIMMABLE CFL FEATURES RESPONDENTS DO NOT LIKE ................................... 46
TABLE 8-1: TYPE OF HOME ......................................................................................................... 47
TABLE 8-2: DECADE IN WHICH HOME WAS BUILT ..................................................................... 48
TABLE 8-3: OWNERSHIP OF HOME .............................................................................................. 48
TABLE 8-4: SIZE OF HOME ........................................................................................................... 49
TABLE 8-5: ROOMS IN HOME ....................................................................................................... 49
TABLE 8-6: HIGHEST LEVEL OF EDUCATION .............................................................................. 50
TABLE 8-7: NUMBER OF PERSONS LIVING THE HOME ............................................................... 50
TABLE 8-8: HOUSEHOLD INCOME ............................................................................................... 51
TABLE 8-9: GENDER ..................................................................................................................... 51
TABLE 8-10: RESPONDENTS’ AGREEMENT WITH TWO STATEMENTS ABOUT ENVIRONMENT
AND ECONOMY ............................................................................................................................. 52
TABLE 8-11: RESPONDENTS’ AGREEMENT WITH STATEMENTS ABOUT TECHNOLOGY ............ 52
Figures
FIGURE ES-1: CFL AWARENESS AND FAMILIARITY, 2009 TO 2012 ........................................... II
FIGURE ES-2: FAMILIARITY WITH CFLS, LEDS, AND HALOGEN BULBS .................................. III
Massachusetts Lighting Consumer Survey Report
NMR
FIGURE ES-3: RESPONDENTS THAT HAVE EVER USED CFLS, 2009 TO 2012 ............................ IV
FIGURE ES-4: CFL SATISFACTION, 2009 TO 2012 .................................................................... VII

Massachusetts Lighting Consumer Survey Report Page I
NMR
Executive Summary
NMR Group, Inc. (NMR) served as the primary contractor for this research effort, with Tetra
Tech, Inc. acting as subcontractor (here after the Team). The research presented here compares
the results of a telephone survey (here after the 2012 survey), performed between June 18, 2012
and August 2, 2012, with the results of a similar survey (here after the 2011 survey) performed
between December 8, 2011 and January 19, 2012.1 The 2011 survey sought to establish a
baseline at the onset of the changes in lighting standards resulting from the Energy Independence
and Security Act of 2007 (EISA) while the 2012 survey searched for possible changes in the
lighting market since the initial implementation of EISA. When possible, the Team also
compares the results to those obtained from lighting consumer surveys conducted in 2009 and
2010.
Background and Methodology
The goal of the consumer survey was to track key indicators of the market for compact
fluorescent lamps (CFLs), light emitting diodes (LEDs), and halogens as well as the impact of
EISA. Topics addressed in the first wave of consumer surveys included the following, some of
which allowed for the continued monitoring of the market from earlier evaluations (e.g.
awareness of CFLs):
Awareness of and familiarity with spiral and specialty CFLs, LEDs, and halogens meant
to replace A-line incandescent bulbs
Awareness of and anticipated reactions to EISA
Current use of CFLs and LEDs
Satisfaction with CFLs and perceived advantages and disadvantages of using CFLs
Changes in CFL satisfaction and possible reasons for these changes
Exposure to recent media attention to lighting and its potential influences on CFL
satisfaction
Recent light bulb purchases, particularly of 100 Watt incandescents to identify
stockpiling of incandescent bulbs
Familiarity with lighting terminology such as lumens and color temperature
Household demographics
The Team drew the sample from among customers of the five PAs in Massachusetts. To increase
response rates, we took the following steps:
1 For details on the 2011 survey results see NMR Group. Massachusetts Consumer Survey Results 2011. Delivered
to the Program Administrators and EEAC Consultants in April 2011. The 2011 results in this report have been
updated with a new weighting scheme that is more comparable to those used in 2009 and 2010 for reasons discussed
in detail in the original 2011 report.

Massachusetts Lighting Consumer Survey Report Page II
NMR
Sent an advance letter to potential respondents informing them of the survey
Called households up to 10 times before removing the phone number from our call lists
Fielded the survey in English and Spanish
In total, we surveyed 604 households, with three respondents answering the Spanish version of
the survey. We weighted the data by education and home ownership status so that the results are
representative of all households in Massachusetts.
Summary of Findings
In this section, we present a summary of key findings from the 2012 telephone survey,
comparing them to results of the 2009, 2010, and 2011 lighting telephone surveys when possible.
Awareness of Energy-Saving Light Bulbs
The survey assessed respondents‘ awareness of and familiarity with CFLs and other energy-
saving bulb types.
Nearly all respondents in 2012 (89%) indicated that they had been aware of CFLs before
responding to the survey (Figure ES-1). The percentage of respondents self-reporting awareness
of CFLs is similar to that measured in 2009 but lower than awareness measured in 2010 and
2011. The percentage of respondents who said that they were ―very familiar‖ with CFLs in 2012
was 27%, which is similar to the percentage from 2011 but lower than 2009 (32%) and 2010
(42%). We will continue to track this indicator in the third wave of the survey, to be fielded in
late 2012 and early 2013.
Figure ES-1: CFL Awareness and Familiarity, 2009 to 2012

Massachusetts Lighting Consumer Survey Report Page III
NMR
Familiarity with all types of specialty CFLs (specifically, dimmable, 3-way, flood/recessed,
candelabra, globe, and A-line versions) increased from 2010 to 2012, with the increase likely
reflecting the PAs‘ efforts to promote such bulbs. However, the increases in familiarity tend to
be more from ―not too familiar‖ to ―somewhat familiar.‖ Respondents generally still do not
report being ―very familiar‖ with any type of specialty CFL.
Only 17% of respondents reported being ―very familiar‖ with A-line screw-in LEDs, the same
percentage as in the 2011 survey; 29% of respondents said they were familiar with A-line, screw-
in halogen bulbs, a similar percentage as reported in 2011 (Figure ES-2). Based on work the
Team has conducted elsewhere that showed very little familiarity with halogen bulbs,2 we
suspect that respondents may have confused halogen bulbs meant to replace incandescents with
other types of halogen bulbs. Most respondents (72%) who voiced awareness of both CFLs and
halogens correctly concluded that CFLs save more energy than halogens.
Figure ES-2: Familiarity with CFLs, LEDs, and Halogen Bulbs
Almost one-half (45%) of respondents indicated that they had heard news stories about lighting
products in the past year. The most frequently remembered content of the stories included the
incandescent phase-out (mentioned by 30% of respondents), that newer bulb types were more
energy efficient (24%), that CFLs contained mercury and required careful disposal (19%),
comparisons of newer and older bulb types (13%), and that LEDs and/or CFLs last longer but are
more expensive (12%).
Use of Various Lighting Technologies
When asked if they had ever used CFLs, 64% of respondents said that they had used them
(Figure ES-3). This percentage is statistically similar to self-reported use in 2009 and 2011, but
2 NMR Group, Inc. 2011. ―Connecticut Lighting Focus Groups: Exploration of Market and Reactions to Various
Efficient Lighting Choices.‖
Available at http://www.ctenergyinfo.com/111121%20EISA%20Lighting%20Focus%20Groups%20Report.pdf

Massachusetts Lighting Consumer Survey Report Page IV
NMR
lower than in 2010. However, onsite verified use of CFLs in early 2012 was much higher—96%
of the households visited used at least one CFL, demonstrating that the self-reported decrease in
CFL use does not reflect respondents‘ actual behavior. Consumers may be confused about what
constitutes a CFL bulb or their responses have been influenced by other factors, leading to the
contradictory self-reported responses and onsite verified use. About one-fifth of respondents
(18%) reported using dimmable CFLs.
Figure ES-3: Respondents that have Ever Used CFLs, 2009 to 2012
A total of 64% of households say that they use at least one incandescent in their home, but 26%
of households self-reported use the 100 Watt incandescent (covered by the first stage of EISA
currently being implemented). In contrast, the 2012 onsite study found that 51% of onsite homes
had 100 Watt incandescents installed, but these accounted for only about three percent of all
sockets in the onsite homes.
Sixteen percent of respondents report using screw-in LEDs at this time. These bulbs are most
frequently used in floor, table, or other portable lamps.
Recent Lighting Purchases
Only 14% of respondents had shopped for 100 Watt incandescent light bulbs in the three months
prior to the survey. Of those who had shopped for the bulbs, most (63%) were able to find them
on store shelves, though this represents a significant decrease from the 77% who were able to do
so in 2011, likely revealing effects of EISA on 100 Watt availability. Eighteen of the 31
respondents who could not find 100 incandescent bulbs purchased at least one other type of bulb;
some purchased more than one bulb type. In total, ten purchased incandescent bulbs, seven
respondents purchased CFLs, two purchased halogen bulbs, and one purchased an LED. Five of
the ten incandescent purchasers bought lower wattage bulbs, and the remaining five purchased
three-way bulbs, which, as specialty bulbs, are not subject to EISA. None of the 18 respondents
who could not find 100 Watt incandescents purchased a higher wattage incandescent. Note that

Massachusetts Lighting Consumer Survey Report Page V
NMR
the other 13 respondents who could not find 100 Watt incandescents said that they did not buy
any bulbs at that time.
Turning again to all 604 respondents, 42% of respondents reported buying at least one type of
light bulb in the three months prior to the survey. CFLs (15% of all 604 respondents) and
incandescents (23% of respondents) were most commonly purchased, although at least some
respondents also reported buying halogens, fluorescent tubes, LEDs, and pin-based CFLs or
LEDs. Note that purchase rates overall in the 2012 survey—fielded in early summer—are lower
than in the 2011 study, which was fielded during the winter lighting season.
Key Lighting Concepts
When asked what types of information they look for on bulb packing, 96% of respondents report
that they consider wattage, 92% consider price, and 70% consider wattage equivalency. These
percentages are statistically similar to those reported in the 2011 survey. Other characteristics
considered by more than one-half of the respondents include bulb life, color appearance, the
ENERGY STAR label, and bulb shape.
Given that lumens and color appearance will become increasingly important aspects of choosing
a light bulb after the phase-out of incandescent bulbs, the Team asked respondents if they had
heard of these terms, and, if so, what the terms meant. Most consumers had heard of lumens
(55%) and the terms ―warm white‖ and ―cool white‖ (67%), which were similar but slightly
higher percentages to those we observed in 2011. Of those who had heard these terms, 74% (or
45% of all 604 respondents) correctly understood that lumens referred to light output or
brightness, the same percentage as in 2011. Of those who had heard the terms ―warm white‖ and
―cool white‖, 83% (or 60% of all 604 respondents) correctly identified them as referring to the
color appearance of the bulb. This percentage is statistically lower than the 92% from 2011. In
2012, more respondents (7%) seemed to confuse color rendition and color appearance.
Awareness of and Reactions to EISA
The survey continued to track awareness of EISA and reactions to the phase out of 100 Watt
incandescent bulbs. Fewer than one-half (42%) of respondents reported being aware of the
incandescent phase-out resulting from EISA; this is statistically lower than the 47% observed in
the 2011 survey, which coincided with the initial implementation of the phase-out when the
transition was receiving greater media attention.
Even if they are not aware of the incandescent phase-out, at some point consumers will be
confronted with the fact that most incandescent bulbs will no longer be available on store
shelves. Therefore, after having explained the phase-out to respondents, we asked them what
type of bulb they would be most likely to purchase after 100 Watt incandescents were no longer
available. Respondents did not speak with one mind about their anticipated bulb purchases.
Many respondents (41%) said they would buy a lower wattage incandescent bulb, and this is

Massachusetts Lighting Consumer Survey Report Page VI
NMR
statistically higher than respondents in the 2011 survey. Another 27% said they would buy a 23
Watt CFL, a similar percentage to 2011. Only four percent of respondents said they would buy a
150 Watt incandescent, but 11% would choose a 72 Watt halogen and 10% a 17 Watt LED; all
of these percentages are statistically similar to 2011.
When asked to explain their bulb choices, those who said they would buy CFLs or LEDs most
often mentioned the energy savings associated with these bulbs, while those that chose the other
bulb types cited preference for the light color or brightness.
The possibility that consumers will buy many incandescent bulbs and save them for use after the
incandescent phase-out has been the subject of much discussion in the energy-efficiency
community and in the media discussions of EISA. Our research concludes that about one-fourth
(24%) of all respondents are likely to engage in this ―stockpiling‖ or ―hoarding‖ behavior;
however, 30% of respondents who were aware of EISA prior to the survey reported being likely
to stockpile incandescent bulbs.
Optimistically, few respondents have already begun stockpiling bulbs. Less than two percent of
all 604 survey respondents reported having purchased six or more 100 Watt incandescent bulbs
in the three months prior to survey, although the summer survey date and the seasonality of
lighting purchases must be kept in mind when interpreting this result. Again keeping seasonality
in mind, households likely to stockpile reported buying an average of 5.7 100 Watt incandescent
bulbs compared to 4.5 among those unlikely to stockpile. In the 2011 survey, we had found a
much larger discrepancy between average purchases of those likely and unlikely to stockpile,
with those likely to stockpile buying an average of 17.7 bulbs compared to just 5.1 among those
unlikely to stockpile. The onsite survey also noted relatively small rates of stockpiling of
incandescent bulbs, but the rates were higher among those households that reported in the 2011
survey that they would be likely to stockpile. Thus, evidence is mixed about the severity of
stockpiling, and the seasonality of lighting purchases complicating the interpretation of the
results.
CFL Price Awareness and Satisfaction
The price of CFLs has risen in the past year due to the scarcity of rare earth minerals, some of
which are key components of CFLs.3 The survey asked respondents who are somewhat or very
familiar with CFLs if they had noticed a price increase and, if so, whether the increase had
prevented them from buying CFLs. The majority of respondents who were somewhat or very
familiar with CFLs (45%) had not noticed whether the price of CFLs had changed from last year
to this year. In fact, 35% thought the price was the same or lower than last year, and only 13%
thought it was higher. Moreover, 18% of respondents who recently purchased CFLs were likely
to say that the price was lower in the past year. It may be that consumers have not been directly
3 DiClerico, Daniel. 2011. ―Shortage of rare earth metals results in higher CFL prices.‖ Consumer Reports.
September 16, 2011. Available at http://news.consumerreports.org/appliances/2011/09/shortage-of-rare-earth-
metals-stokes-controversy-around-cfls.html.

Massachusetts Lighting Consumer Survey Report Page VII
NMR
exposed to the price increase because PA programs lower the price of bulbs on store shelves, or
that they do not buy CFLs often enough to notice the prices. Of 48 respondents who had noticed
a price increase, 40% said it prevented them from buying a CFL.
The percentage of respondents ―very satisfied‖ with CFLs increased significantly from 2011 to
2012, but remained statistically lower than satisfaction in 2009 and statistically similar to
satisfaction in 2010 (Figure ES-4). Due to the concerns raised in response to the decreased levels
of satisfaction found in the 2011 survey, the Team added a question in 2012 to determine if
respondents‘ satisfaction with CFLs had changed over time, and, if so, why their opinions had
changed. More than three out of four CFL users (76%) said their satisfaction with CFLs had
stayed the same, and 18% said their satisfaction had increased. Only 5% replied that they were
less satisfied with CFLs now than a year ago.
Figure ES-4: CFL Satisfaction, 2009 to 2012
Out of the 31 respondents who indicated their satisfaction with CFLs increased over the past year
and who had been exposed to media stories about lighting, 67% said that news stories
contributed to their increased satisfaction. Alternatively, of the 13 respondents whose satisfaction
with CFLs decreased and who had been exposed to lighting news stories, 59% indicated that
news stories were responsible for the decrease. These findings indicate that media attention
toward lighting has the capability to sway opinions toward the bulbs in either direction,
depending on the content of the story, but, on the whole, the influence appears to have been more
positive than negative in the past year.
When asked what they did like about CFLs, respondents—both those who are and are not
satisfied with them—most often cited that they save energy, have a long bulb life, and save
money on bills. In contrast, respondents are less happy with how slow CFLs are to brighten,

Massachusetts Lighting Consumer Survey Report Page VIII
NMR
mercury and disposal issues, and poor light color. For dimmable CFLs, respondents focused on
the fact that these bulbs are also slow to turn on/brighten, and do not dim as much as other bulb
types.
Conclusions and Recommendations
Earlier in 2012, the Team delivered the 2011 (first wave) consumer lighting report; this report
described EISA baseline conditions, as the survey coincided with the initial implementation of
the new lighting standards. Currently the PAs and EEAC Consultants are reviewing a revised
draft of the spring 2012 lighting saturation study, which also provided information on residential
lighting use during the early stages of EISA implementation. This report serves as an interim
check-in on the residential lighting market one-half year after the earliest phases of EISA
implementation. Therefore, the team refrains from drawing new conclusions or making
recommendations. Instead, we review the recommendations from the 2011 consumer survey and
the 2012 onsite saturation study in light of the findings from this current report.
Satisfaction with CFLs: The 2011 survey provided evidence that customer satisfaction with
CFLs was declining, while the onsite study demonstrated that, in fact, those dissatisfied with
CFLs used fewer of them—even though they still typically used at least some CFLs. The current
study, in contrast, found that CFL satisfaction was higher in 2012 than in 2011 but remained
below 2009 and 2010 levels. While most survey respondents indicated that their satisfaction with
CFLs had not changed, 18% reported increased satisfaction with CFLs, while 5% said their
satisfaction had decreased. Importantly, news stories about lighting influenced these changing
opinions—both the positive and the negative ones. The Team will continue to explore CFL
satisfaction in the third wave of the consumer survey and in the upcoming 2013 saturation study,
and we continue to recommend that the PAs work with the residential retail products and other
residential evaluation teams as well as program implementers to understand the dynamics of
consumer satisfaction with CFLs and LEDs more fully.
The Team also previously recommended that the PAs continue to work with program partners to
support the highest quality CFLs and LEDs on the market and that the PAs develop educational
materials that highlight the features of LEDs that consistently perform better than CFLs (e.g.,
quickness to brighten, lack of mercury, lifespan) but in a manner that does not denigrate CFLs.
We believe the current study results continue to suggest the relevance of both of these
recommendations.
A-line CFLs: Respondents to both the 2011 and 2012 study reported relatively low levels of
familiarity with A-line CFLs, and use of these bulbs is still uncommon in the homes visited for
the saturation study. However, because A-line bulbs closely resemble incandescents and can fit
into some types of fixtures that standard CFLs cannot (e.g., those in which the shade clips onto
the bulb), NMR recommended in both the 2011 study and the onsite saturation study that the
PAs focus more educational and promotional efforts on A-line CFLs. The team also suggesting
that the PAs consider thinking of them more as a ―standard‖ CFL rather than a specialty one, as

Massachusetts Lighting Consumer Survey Report Page IX
NMR
most A-line CFLs will be used in general service and not specialty applications. We believe the
2012 study results support these recommendations.
Bulb Dimmability: In the 2011 survey results, NMR noted that users of dimmable CFLs
generally tended to like them, but the most persistent complaint about them is that they do not
dim consistently or as much as other types of light bulbs. At that time, we recommended that the
PAs consider removing dimmable CFLs in favor of promoting LEDs for dimmable applications.
However, since making the recommendation, the Team has learned from various sources that
LEDs may have dimmability concerns as well. Therefore, we withdraw the recommendation and
refrain from making new recommendations about dimmable bulbs specifically. However, the
previous recommendation about continuing to promote only the highest quality energy-efficiency
bulbs certainly applies to dimmable energy-efficient bulbs.
Stockpiling of Incandescent Bulbs: The results presented for both the 2011 and 2012 surveys as
well as the onsite saturation effort suggested that about one-fourth of respondents will consider
stockpiling incandescent bulbs, and that some respondents have already started to do so.
Therefore, NMR continues to recommend that the PAs may want to consider placing a consumer
education campaign that helps consumers make more informed bulb choices, rather than simply
defaulting to the incandescent bulb with which they are most familiar. Moreover, as explained in
the onsite study, the PAs may also want to consider asking partner retailers not to repeat ―get
them while you can‖ incandescent bulb campaigns in late 2012 and 2013, as they did in late 2011
before the 100 Watt phase-out started.
Consumer Understanding of Key Lighting Concepts: While consumers are becoming more
familiar with the term ―lumens‖ and understand that it means light output or brightness, they still
buy bulbs based on wattage or wattage equivalence. Therefore, we believe that the suggestion
that the PAs continue their efforts at helping consumers make the transition from thinking about
Watts to thinking about lumens remains relevant.
A-line Halogen Bulbs: Although telephone survey respondents reported relatively high rates of
familiarity with A-line halogen bulbs, the Team found very few of these bulbs in use in onsite
households. Yet, as we noted in the onsite study, A-line halogen bulbs look almost exactly like
incandescent bulbs and it is likely that consumer are unable to distinguish between the two bulb
types in the store. The fact that halogen bulbs are labeled ―energy efficient‖ only adds to
consumer confusion; in fact, the number of consumers familiar with CFLs who identified
halogen and CFLs as using the same amount of energy rose significantly between the 2011 and
2012 studies. Therefore, we believe that our suggestion that the PAs work with other
organizations across the nation to try to convince manufacturers to remove the term ―energy
efficient‖ from halogen packaging remains relevant in light of the current survey results.

Massachusetts Lighting Consumer Survey Report Page 1
NMR
1 Introduction
This report presents the findings of research conducted to understand the market for energy-
efficient light bulbs. NMR Group, Inc. (NMR) served as the primary contractor for this research
effort, with Tetra Tech, Inc. acting as subcontractor (here after the Team). The research
presented here compares the results of a telephone survey (here after the 2012 survey),
performed between June 18, 2012 to August 2, 2012, with the results of a similar survey (here
after the 2011 survey) performed between December 8, 2011 through January 19, 2012.4 The
2011 survey sought to establish a baseline at the onset of the changes in lighting standards
resulting from the Energy Independence and Security Act of 2007 (EISA) while the 2012 survey
searched for possible changes in the lighting market since the initial implementation of to EISA.
When possible, the Team also compares the results to those obtained from lighting consumer
surveys conducted in 2009 and 2010.
1.1 Background
The Team fielded the consumer surveys of households in Massachusetts. The goal of the surveys
was to track key indicators of the market for compact fluorescent lamps (CFLs), light emitting
diodes (LEDs), and halogens as well as the impact of EISA. Many of these indicators provide
information necessary to revise program savings estimates while others contribute to a broader
assessment of the market at the onset of EISA implementation. The results from the 2011 and
2012 waves of the survey presented in this report will be compared to those of a third wave to be
conducted in late 2012 and early 2013. Topics addressed in the first wave of consumer surveys
included the following, some of which allowed for the continued monitoring of the market from
earlier evaluations (e.g. awareness of CFLs):
Awareness of and familiarity with spiral and specialty CFLs, LEDs, and halogens meant
to replace A-line incandescent bulbs
Awareness of and anticipated reaction to EISA
Current use of CFLs and LEDs
Satisfaction with CFLs and aspects of the bulbs that respondents like and dislike
Changes in CFL satisfaction and possible reasons for these changes (2012 only)
Exposure to recent media attention to lighting (2012 only) lighting and its potential
influences on CFL satisfaction
4 For details on the 2011 survey results see NMR Group. Massachusetts Consumer Survey Results 2011. Delivered
to the Program Administrators and EEAC Consultants in April 2011. The 2011 results in this report have been
updated with a new weighting scheme that is more comparable to those used in 2009 and 2010 for reasons discussed
in detail in the original 2011 report.

Massachusetts Lighting Consumer Survey Report Page 2
NMR
Recent light bulb purchases, particularly of 100 Watt incandescents to identify
stockpiling of incandescent bulbs
Familiarity with lighting terminology such as lumens and color temperature
Household demographics
1.2 Methodology
To implement the surveys, we first obtained a list of randomly selected customers of each of the
five PAs and drew our sample from this list according to the ―desired sample‖ column in Table
1-1 below. We sent an advance letter to potential respondents that explained the study‘s
objectives, asked for respondents‘ cooperation, and provided a toll-free number in case the
household wanted to schedule a specific time to answer the survey. When calling potential
respondents, we used a minimum of ten attempts over different times of the day, days of the
week, and weeks of the month in an effort to increase the response rate and achieve as
representative a sample as possible. To further increase response rates and population coverage,
we fielded the survey in Spanish as well as in English. We finalized the survey at 604
completions, which achieves three percent precision for the entire sample at the 90% confidence
level, assuming a 50% break in responses. The sampling errors for individual PAs ranged from a
low of 5% for National Grid to 21% for Unitil, due to its small population size.5 The overall
response rate was 23% and no less than 21% for each PA. We performed three of the surveys in
Spanish.
Table 1-1: Telephone Survey Sample
Program
Administrator
Households
Served Desired Sample Final Sample Sampling Error Response Rate
Cape Light Compact 201,991 42 39 13.1% 23.3%
National Grid 1,117,912 288 289 4.8% 24.2%
NSTAR 954,917 210 217 5.6% 21.0%
Unitil 40,087 12 16 21.2% 24.0%
WMECO 187,140 48 43 12.7% 26.7%
Overall 2,502,047 600 604 3.0% 23.08%
5 The overall error is the most important one to consider, given that the predominant markdown method was a
statewide approach offered to all consumers, not just those of specific PA service territories.

Massachusetts Lighting Consumer Survey Report Page 3
NMR
The consumer survey sample contained a greater proportion of households with people who had
some education beyond the high school diploma and who owned homes than exist in the
population of Massachusetts households.6 In response, the team weighted the consumer survey
by education and home ownership status so that the reported results would better reflect the
characteristics of all households in the state. Table 1-2 presents this weighting scheme
Table 1-2: Population, Sample Sizes, and Weights for RDD Survey
Households Sample
Size Weight
State Total 2,512,552 604*
Owner-occupied housing units
Less than high school graduate 106,875 9 2.85
High school graduate 367,185 73 1.21
Some college or Associate‘s degree 397,959 109 0.88
Bachelor‘s degree or higher 736,455 268 0.66
Renter-occupied housing units
Less than high school graduate 155,720 4 9.36
High school graduate 251,964 30 2.02
Some college or Associate‘s degree 226,427 28 1.94
Bachelor‘s degree or higher 269,967 73 0.89
* Ten respondents refused to answer either the home ownership or the education question, or both.
They were assigned a weight of one.
The Team also tests the statistical significance between some of most critical indicators in the
study. We focus most of these tests on the results between 2011 and 2012, as 2011 represents the
EISA baseline and 2012 is the first attempt to measure change from that baseline, but we do
sometimes provide statistical tests with 2009 and 2010 as well.
6 Underrepresentation of renters and respondents with lower levels of educational attainment is common in
telephone surveys. For example, see Galesic, M., R. Tourangeau, M.P. Couper (2006) ―Complementing Random-
Digit-Dial Telephone Surveys with Other Approaches to Collecting Sensitive Data.‖ American Journal of
Preventive Medicine. Volume 35, Number 5.

Massachusetts Lighting Consumer Survey Report Page 4
NMR
2 Awareness of Energy-Saving Light Bulbs and EISA
The survey assessed respondents‘ awareness of and familiarity with CFLs and other energy-
saving bulb types. These questions supplied necessary context for understanding respondents‘
knowledge of various lighting technologies and allowed us to target questions about particular
bulb types to those respondents most able to provide informed opinions on them. When possible,
we compared the responses to questions on awareness and familiarity with similar ones from the
2009 to 2011 Massachusetts consumer surveys. We also asked respondents whether they were
aware of the EISA light bulb efficiency provisions, but we only compare the 2011 and 2012
results for these questions as questions about EISA awareness asked in previous years used
substantially different wording, limiting their comparability to the 2011 and 2012 results.
2.1 CFL Awareness and Familiarity
Approximately nine out of ten respondents in 2012 (89%) indicated that they were aware of
CFLs before responding to the survey (Table 2-1). This represents a statistically significant
decrease in awareness from the 2011 (92%) and 2010 (94%) surveys but is still within historical
rates of awareness measured from 2009 onward (ranging from 87% to 94%).
Table 2-1: Awareness of CFLs
(Base: All respondents)
Awareness 2009 2010 2011 2012
Sample size 503 381 582 604
Yes 87% 94%ǂ 92%ǂ 89%*∞
No 13% 6% 8% 11%
Don‘t know/refused - - - -
ǂ ―Yes‖ significantly different from 2009 at the 90% confidence level.
∞ ―Yes‖ significantly different from 2010 at the 90% confidence level.
* ―Yes‖ significantly different from 2011 at the 90% confidence level.

Massachusetts Lighting Consumer Survey Report Page 5
NMR
More than two out of three respondents in 2012 indicated that they were somewhat or very
familiar with CFLs (68%) (Table 2-2). This percentage is similar to that from the 2011 survey
(69%). Also similar to the 2011 surveys, however, is the significantly smaller percentage of
respondents who reported being ―very familiar‖ with CFLs in 2011 (29%) and 2012 (27%)
compared with 2010 (42%) results. The findings continue to point to an increase in the
percentage of respondents saying that they were ―not too familiar‖ with CFLs, 17% in 2011 and
16% in 2012. In short, the 2012 surveys confirm the unexpected results of the 2011 survey that
appeared to be pointing to lower rates of self-reported familiarity, use, and awareness with CFLs.
Later in this report, the Team explores possible reasons for these changes in analyses of exposure
to media stories about lighting and reasons for possible changes in CFL satisfaction.
Table 2-2: Familiarity with CFLs
(Base: All respondents)
Familiarity with CFLs 2009 2010 2011 2012
Sample size 503 381 582 604
Very familiar 32% 42%ǂ 29%∞ 27%ǂ∞
Somewhat familiar 39% 38% 40% 41%
Not too familiar 11% 9% 17% 16%
Not at all familiar 5% 5% 6% 5%
Not aware of CFLs 13% 6% 8% 11%
Don‘t know / refused 1% 0% <1% <1%
ǂ ―Very familiar‖ significantly different from 2009 at the 90% confidence level.
∞ ―Very familiar‖ significantly different from 2010 at the 90% confidence level.
The survey also asked respondents about their familiarity with various types of specialty CFLs,
including dimmable, 3-way, flood/recessed, candelabra, globe, and A-line. These levels of
familiarity are shown in Table 2-3 on the next page, along with comparisons to familiarity for the
same bulb types in 2011 and 2010. Similar to standard CFL familiarity from last year,
respondents in 2012 reported an overall decrease in being ―very familiar‖ with specialty CFLs.
However, those familiar (very and somewhat) with some specialty CFLs exhibited slight
increases. Flood or recessed CFL familiarity rose from 43% in 2011 to 47% in 2012. Similarly,
familiarity with candelabra CFLs increased from 35% to 40%. . Furthermore, comparisons
between 2010 and 2012 indicate the three year trend in familiarity with specialty CFLs exhibits
increases for most specialty bulb types. The differences over time could be attributed to
differences in the sample composition, but it is most likely due to the increased attention that the
PAs and retailers have given to the diversity of light bulb choices and to the increased
availability of specialty bulbs on store shelves.

Massachusetts Lighting Consumer Survey Report Page 6
NMR
Table 2-3: Familiarity with Specialty CFLs
(Base: Respondents who had heard of CFLs and were very, somewhat or not too familiar with CFLs)
Type of
Specialty
CFL
Familiarity 2010 2011 2012
Sample Size 381 582 604
Dimmable
Very familiar 12% 17% 15%
Somewhat familiar 19% 23% 25%
Not too familiar 14% 11% 15%
Not at all familiar 44% 35% 30%
Not aware of CFLs 11% 14% 16%
Don‘t know / refused <1% 1% -
3-way
Very familiar 16% 19% 19%
Somewhat familiar 20% 25% 27%
Not too familiar 15% 11% 11%
Not at all familiar 36% 32% 28%
Not aware of CFLs 11% 14% 16%
Don‘t know / refused <1% <1% -
Flood or
Recessed
Very familiar 16% 22% 17%
Somewhat familiar 16% 21% 30%
Not too familiar 13% 12% 13%
Not at all familiar 41% 33% 24%
Not aware of CFLs 11% 14% 16%
Don‘t know / refused 3% <1% -
Candelabra
Very familiar 9% 16% 17%
Somewhat familiar 17% 19% 23%
Not too familiar 13% 17% 13%
Not at all familiar 48% 35% 31%
Not aware of CFLs 11% 14% 16%
Don‘t know / refused 1% 1% -
Globe
Very familiar 18% 20% 19%
Somewhat familiar 24% 24% 26%
Not too familiar 13% 16% 15%
Not at all familiar 33% 27% 24%
Not aware of CFLs 11% 14% 16%
Don‘t know / refused <1% <1% -
A-line
Very familiar 14% 14% 13%
Somewhat familiar 14% 18% 21%
Not too familiar 16% 13% 18%
Not at all familiar 44% 42% 33%
Not aware of CFLs 11% 14% 16%
Don‘t know / refused 1% <1% <1%

Massachusetts Lighting Consumer Survey Report Page 7
NMR
2.2 Familiarity with other Energy-Savings Bulbs
The past few years saw an influx of screw-in, A-line, light emitting diodes (LEDs) and A-line
halogen bulbs (sometimes called energy-efficient incandescents) to the lighting market that were
meant to replace incandescent bulbs.7 For this reason, the recent surveys assessed not only
familiarity with CFLs, but with these other energy-saving bulb types as well. Close to one-half
(47%) of all 2012 respondents reported being very familiar or somewhat familiar with LEDs, up
from 41% in 2011, including a statistically significant increase in those saying they were
somewhat familiar with LEDs (Table 2-4). Almost two out of three respondents (65%) reported
being very or somewhat familiar with halogens, which is statistically similar to the percentage
from the 2011 survey (69%). The team cautions that the percentage of respondents familiar with
halogens seems high, at least based on prior focus group research conducted by NMR in
Connecticut.8 The findings from the focus groups indicated that consumers are familiar with
certain types of halogen bulbs, including those used in torchieres (frequently remembered as a
fire hazard) or as screw-in flood or spotlight bulbs. Yet, very few of the Connecticut focus group
participants were familiar with the newest generation of halogen bulbs that closely resemble an
incandescent bulb. Based on this prior research, it is the Team‘s opinion that respondents to the
2011 and 2012 Massachusetts consumer survey may have been indicating their familiarity with
other types of halogens—not with those meant to replace incandescents.
Table 2-4: Familiarity with Energy-Saving Bulb Types 2011, 2012
(Base: All respondents)
Familiarity CFLs LEDs Halogen Bulbs
2011 2012 2011 2012 2011 2012
Sample size 582 604 582 604 582 604
Very familiar 29% 27% 17% 17% 32% 29%
Somewhat familiar 40% 41% 24% 30%* 37% 36%
Not too familiar 17% 16% 25% 21% 12% 17%*
Not at all familiar 14% 16% 34% 31% 19% 18%
Don‘t know / refused <1% <1% <1% <1% <1% -
* Significantly different from 2011 at the 90% confidence level.
7 Halogen bulbs have been on the market for decades, but the 2011 and 2012 surveys focused exclusively on the A-
line halogen bulbs meant to replace incandescent bulbs. 8 NMR Group, Inc. 2011. ―Connecticut Lighting Focus Groups: Exploration of Market and Reactions to Various
Efficient Lighting Choices.‖
Available at http://www.ctenergyinfo.com/111121%20EISA%20Lighting%20Focus%20Groups%20Report.pdf

Massachusetts Lighting Consumer Survey Report Page 8
NMR
As a further assessment of energy-saving bulb awareness and familiarity, respondents who were
somewhat or very familiar with both CFLs and halogens were asked which bulb type used less
energy to produce light. Although we must caution that some respondents may have had the
wrong type of halogen in mind when answering this question, the majority of 2012 respondents
(72%) correctly said that CFLs use less energy than halogen bulbs (Table 2-5), indicating, as did
the similar result in 2011, that the respondents‘ knowledge of energy-saving bulb types goes
beyond simple awareness of the bulbs‘ existence. The remaining respondents were almost evenly
split between thinking halogens use less energy, that the two bulbs use the same amount of
energy, and being uncertain of which bulb uses less. Similar to the 2011 results, when comparing
respondents who self-reported being ―very familiar‖ or ―somewhat familiar‖ with CFLs those
most familiar with CFLs in 2012 more frequently identified the CFL as the lower energy user of
the two (78% for very familiar vs. 68% for somewhat familiar). Those somewhat familiar with
CFLs also tended to choose the CFL in both comparison years, but, a similar proportion of the
2012 respondents instead thought that the two bulbs used about the same amount of energy (10%
somewhat familiar vs. 9% very familiar). However, there was a significant increase (3% to 9%)
in the percentage of very familiar respondents who thought that CFLs and halogens used about
the same amount of energy.
Table 2-5: Respondents’ Judgments about Relative Energy Use of CFLs & Halogen Bulbs
(Base: Respondents who were somewhat or very familiar with both CFL and Halogen bulbs)
Which bulb uses less
energy
Overall Very Familiar with
CFLs
Somewhat Familiar with
CFLs
2011 2012 2011 2012 2011 2012
Sample size 327 317 156 142 171 175
CFLs use less energy 70% 72% 81% 78% 63%Ω
68% Ω
Halogens use less energy 9% 10% 9% 8% 10% 10%
They use about the same 9% 9% 3% 9%** 14% 10%
Don‘t know/refused 11% 9% 7% 6% 14% 12%
* Significantly different from overall at the 90% confidence level.
** Significantly different at the 90% confidence level from 2011 to 2012. Ω Significantly different from ‗Very Familiar‘ at the 90% confidence level.

Massachusetts Lighting Consumer Survey Report Page 9
NMR
2.3 Awareness of EISA and Media Attention to Light Bulbs
The Federal Energy Independence and Security Act (EISA) of 2007 included new efficiency
standards for lighting products. EISA set maximum wattage levels by lumen output for medium
screw-base lamps that have a range from 310 to 2600 lumens and are capable of operating at a
voltage range of 110 to 130 volts. The standards started to become effective under a phased
approach beginning in 2012, and general service bulbs must use 20-30% less energy than current
incandescent bulbs according to the timeline and lumen ratings listed in Table 2-6. 9
Table 2-6: EISA Standards
Rated Lumens Max Rated
Wattage
Min Rated
Lifetime (hours) Effective Date
1490-2600 72 1,000 1/1/2012
1050-1489 53 1,000 1/1/2013
750-1049 43 1,000 1/1/2014
310-749 29 1,000 1/1/2014
The Team asked respondents a series of questions about their exposure to media report about
lighting and their awareness of EISA. These questions served two purposes: 1) to gauge
awareness of EISA, and 2) to learn more about what consumer hear about lighting products in
the media, be it related to EISA or to specific lighting technologies. In fact, one of the impetuses
behind the questions about media attention was to find out if consumers had been hearing
negative reports about CFLs, a hypothesis NMR put forth when first presenting the 2011 results
as a possible reason for changes in self-reported CFL use and satisfaction (see Section 3.2 and
Section 7.2).
The current survey found that almost one-half (45%) of the respondents indicated that they had
heard news stories about lighting products in the past year (Table 2-7).
Table 2-7: Whether Has Seen or Read any News Stories about Light Bulbs in Past Year
(Base: All Respondents)
Has seen/heard news stories about
light bulbs in past year? 2012
Sample size 604
Yes 45%
No 54%
Don‘t know/refused 1%
9 The EISA standards are being phased in over the next three years. In December 2011, the U.S. Congress defunded
enforcement of the EISA Title III light-bulb performance requirements as part of the Consolidated Appropriations
Act in the 2012 federal budget. The new standards and regulations remain law despite the fact they are currently not
enforced. Accessed here:
http://www.energystar.gov/ia/products/lighting/cfls/downloads/EISA_Backgrounder_FINAL_4-11_EPA.pdf

Massachusetts Lighting Consumer Survey Report Page 10
NMR
Those having heard lighting-related news stories were asked to recall what the news story was
about. Thirty percent of respondents mentioned they had heard that traditional bulbs were being
taken off the market or phased out (Table 2-8), indicating awareness of the EISA legislation.
about one-fourth (24%) of respondents reported that they had hear that new bulbs were more
energy efficient, while others (5%) noted that the media story suggested that consumers should
be switching over to more efficient lighting. Turning to the question of media attention to CFLs,
19% of respondents had heard that CFLs were dangerous because of mercury and needed careful
disposal, and another 6% said they hear that many consumers did not like CFLs. These results
indicate that, in fact, some consumer have been exposed to negative press about CFLs. In Section
7.2, we explore whether exposure to these stories has influenced satisfaction with CFLs. Other
responses noted comparisons between ―old‖ and ―new‖ bulbs, the long life and price of efficient
lighting, the positive aspects of LED lighting, and the increased diversity of bulbs on the market.
Table 2-8: Information Remembered in News Stories about Light Bulbs
(Base: Respondents having heard lighting news)
What respondent remembers seeing or reading in the
stories about light bulbs (Multiple Response) 2012
Sample size 295
Traditional bulbs are being taken off the market/phased out 30%
New bulbs are more energy efficient 24%
CFLs are dangerous because of mercury/disposal 19%
How new bulbs compare to older bulbs in terms of
wattage/price/brightness 13%
LED/CFLs last longer but are more expensive 12%
Positive aspects of LEDs/We should be using LEDs 7%
Many consumers do not like CFLs 6%
We should be switching over to efficient lighting 5%
New bulbs coming on the market 4%
New bulbs come in different shapes 1%
Other 9%
Don‘t know/refused 3%

Massachusetts Lighting Consumer Survey Report Page 11
NMR
The 2011 and 2012 surveys also directly asked respondents‘ about their awareness of the EISA
legislation that bans most incandescent light bulbs. Despite the fact that the top lighting-related
news story respondents‘ recalled was about the incandescent phase-out (Table 2-8), only two out
of five (42%) of all 2012 respondents had heard of EISA compared with the 47% of respondents
in 2011(Table 2-9). This statistically significant decrease in EISA awareness, however, may be
related to the timing of the two surveys—the 2011 survey was in the field when the 100 Watt
phase-out went in effect; the 2012 survey occurred six month later when the phase-out was
getting less media attention. Various sections later in this report address information regarding
current and likely consumer responses to EISA, including possible stockpiling behavior (Section
6.2) and probable bulb purchases in response to EISA (Section 6.1).
Table 2-9: Awareness of EISA Law
(Base: All Respondents)
Have heard about EISA law 2011 2012
Sample size 582 604
Yes 47% 42%*
No 53% 58%*
Don‘t know/refused - -
* Significantly different from 2011 at the 90% confidence level.
Massachusetts Lighting Consumer Survey Report Page 12
NMR
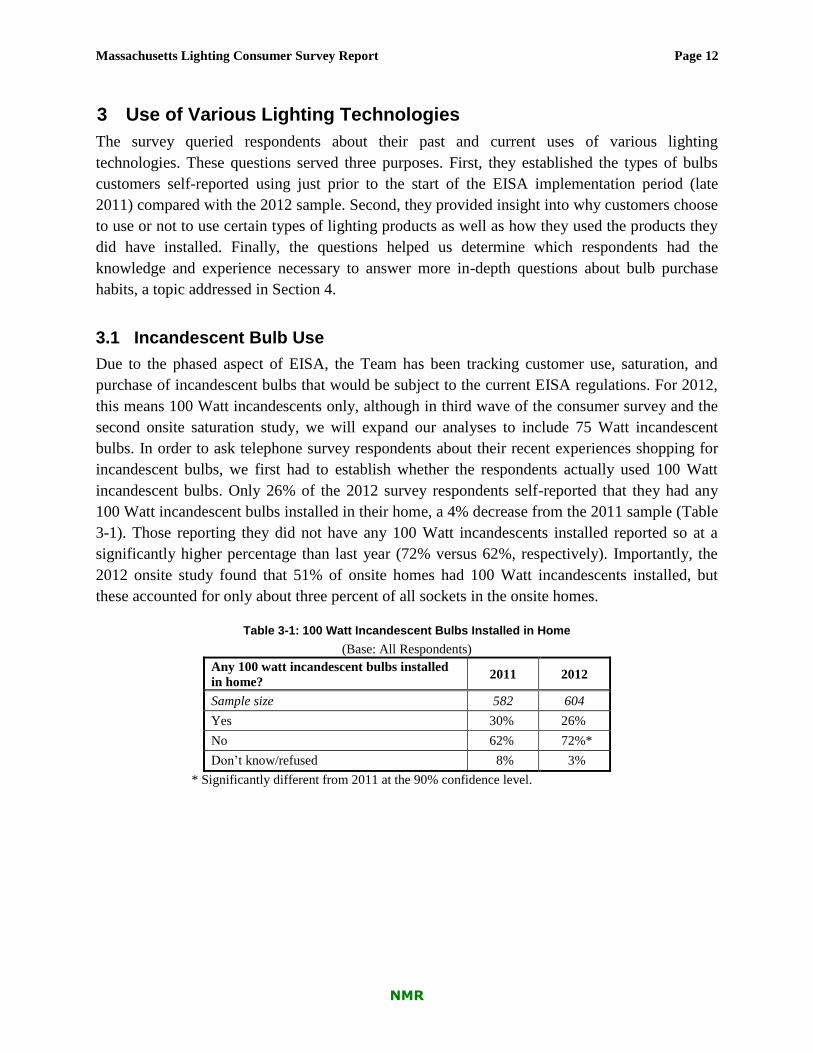
3 Use of Various Lighting Technologies
The survey queried respondents about their past and current uses of various lighting
technologies. These questions served three purposes. First, they established the types of bulbs
customers self-reported using just prior to the start of the EISA implementation period (late
2011) compared with the 2012 sample. Second, they provided insight into why customers choose
to use or not to use certain types of lighting products as well as how they used the products they
did have installed. Finally, the questions helped us determine which respondents had the
knowledge and experience necessary to answer more in-depth questions about bulb purchase
habits, a topic addressed in Section 4.
3.1 Incandescent Bulb Use
Due to the phased aspect of EISA, the Team has been tracking customer use, saturation, and
purchase of incandescent bulbs that would be subject to the current EISA regulations. For 2012,
this means 100 Watt incandescents only, although in third wave of the consumer survey and the
second onsite saturation study, we will expand our analyses to include 75 Watt incandescent
bulbs. In order to ask telephone survey respondents about their recent experiences shopping for
incandescent bulbs, we first had to establish whether the respondents actually used 100 Watt
incandescent bulbs. Only 26% of the 2012 survey respondents self-reported that they had any
100 Watt incandescent bulbs installed in their home, a 4% decrease from the 2011 sample (Table
3-1). Those reporting they did not have any 100 Watt incandescents installed reported so at a
significantly higher percentage than last year (72% versus 62%, respectively). Importantly, the
2012 onsite study found that 51% of onsite homes had 100 Watt incandescents installed, but
these accounted for only about three percent of all sockets in the onsite homes.
Table 3-1: 100 Watt Incandescent Bulbs Installed in Home
(Base: All Respondents)
Any 100 watt incandescent bulbs installed
in home? 2011 2012
Sample size 582 604
Yes 30% 26%
No 62% 72%*
Don‘t know/refused 8% 3%
* Significantly different from 2011 at the 90% confidence level.

Massachusetts Lighting Consumer Survey Report Page 13
NMR
The most common reason for why 2012 respondents did not use 100 Watt incandescents was that
the bulbs were too bright (28%),with another 24% specifically noting they preferred to use more
energy-efficient types of bulbs (Table 3-2). One interesting shift between 2011 and 2012 is the
way in which respondents discussed their choice of more efficient bulbs: The 2012 respondents
were significantly more likely than 2011 to mention that they choose to use more efficient bulb
types (24% vs. 17%) but less likely to say that the 100 Watt incandescent bulbs used ―too much
energy‖ (18% vs. 28%). In essence, these two statements lead to the same result—great use of
more efficient bulb types—but represent different ways of explaining the behavior. The 2012
survey respondents were also significantly more likely to say that they prefer to use lower
wattage incandescent bulbs (21% in 2012 vs. 11% in 2011) or that their socket does not accept
100 Watt bulbs (14% in 2012 vs. 6% in 2011). Note that a handful of respondents in both years
(about 1%) specifically cited EISA as a reason that they did not use 100 Watt incandescents.
Table 3-2: Reasons 100 Watt Incandescent Bulbs Not Installed in Home
(Base: Respondents who do not currently use 100 Watt incandescent bulbs in their homes)
Reasons (Multiple Response) 2011 2012
Sample size 350 410
They are too bright 26% 28%
I use CFLs/halogens/efficient lighting 17% 24%*
Prefer to use a lower wattage incandescent 11% 21%*
They use too much energy 29% 18%*
My socket says only to use a certain Watt bulb/ fixtures won‘t
take such high wattage 6% 14%*
Don‘t need them 16% 13%
Cost too much/want to save money 6% 5%
They are bad for the environment/not energy conscious 2% 1%
Because of EISA 1% <1%
Landlord chose bulbs/bulbs were already here 1% 3%
They are too hard to find/Can‘t find them - 3%
They don‘t last long/short bulb life 1% 1%
Other 2% 2%
Don‘t know/refused 7% 3%
* Significantly different from 2011 at the 90% confidence level.

Massachusetts Lighting Consumer Survey Report Page 14
NMR
To get a sense of whether respondents still used incandescents, even if they did not use the 100
Watt variety, respondents who did not have a 100 Watt bulb installed revealed whether they had
any incandescents installed. As shown above (Table 3-1), the majority of 2012 respondents did
not use 100 Watt incandescents, but among this group roughly two out of three (63%) reported
that they did use other wattages of incandescent bulbs (Table 3-3). However, 34% of respondents
who did not use 100 Watt incandescents reported that they did not use incandescents whatsoever.
Looking at the entire sample and taking into account use of 100 Watt incandescents (or lack
thereof), a similar number (64%) of respondents said that they used at least some wattage
incandescents in their home. This is significantly different than the 75% of all 2011 respondents
who indicated they used 100 Watt bulbs as well as other incandescents.
Table 3-3: Any Incandescent Bulbs Installed in Home
(Base: Respondents who do not currently use 100 Watt incandescent bulbs in their homes and all respondents)
Incandescent bulbs installed?
Households not Using
100 Watt
Incandescents**
All Households
2011 2012 2011 2012
Sample size 387 410 582 604
Yes 63% 63% 75% 64%*
No 34% 34% 23% 33%*
Don‘t know/refused 3% 3% 2% 3%
Currently using 100 Watt incandescent - - - -
* Significantly different from 2011 at the 90% confidence level.
** The percentages in both years are the same (once rounded).
3.2 CFL Bulb Use
The survey also explored historic and current self-reported CFL use, comparing the results to
those from 2009 to 2011 when possible. In the current survey, 64% of respondents had CFLs
installed in their homes at some point—a similar percentage to 2011, but a decrease from 2010
and 2009, when 78% and 68% of respondents indicated having had CFLs installed respectively
(Table 3-4). Similarly, 19% of respondents in 2012 revealed never having had CFLs installed
compared with the 20% of respondents in 2011 (Table 3-4).
Table 3-4: CFLs Ever Installed in Home
(Base: All respondents)
Have Ever Used a CFL 2009 2010 2011 2012
Sample size 503 381 582 604
Yes 68% 78% 61% 64%
No 12% 11% 20% 19%
Don‘t know/Refused 1% <1% 6% 1%
Not aware of / familiar with CFLs 19% 11% 14% 16%

Massachusetts Lighting Consumer Survey Report Page 15
NMR
The 2012 survey respondents who have used CFLs were asked to specify how long ago they first
used a CFL. A majority of respondents self-reported using CFLs for the first time between one
and four years ago (55%) (Table 3-5). Only 5% specified they began using them more than ten
years ago, with a similarly small percentage (7%) reporting their first use within the past year.
The team did not ask this question in 2011, but the results are consistent with self-reported first
use of CFLs in the 2009 and 2010, in that first use of CFLs is relatively recent, but the
percentage using CFLs for more than four years has tended to increase over time.10
Table 3-5: When First Used a CFL
(Base: Respondents who have ever used a CFL)
How long ago first used a CFL bulb? 2012
Sample size 414
Less than one year ago 7%
1 to 2 years ago 29%
to 4 years ago 26%
5 to 6 years ago 16%
7 to 8 years ago 6%
9 to 10 years ago 7%
More than 10 years ago 5%
Don‘t know/Refused 4%
10
See NMR Results of the Massachusetts and Pennington County, South Dakota Telephone and Onsite Compact
Fluorescent Lamp Surveys. Delivered to the PAs and EEAC Consultants on April 15, 2011.
Massachusetts Lighting Consumer Survey Report Page 16
NMR
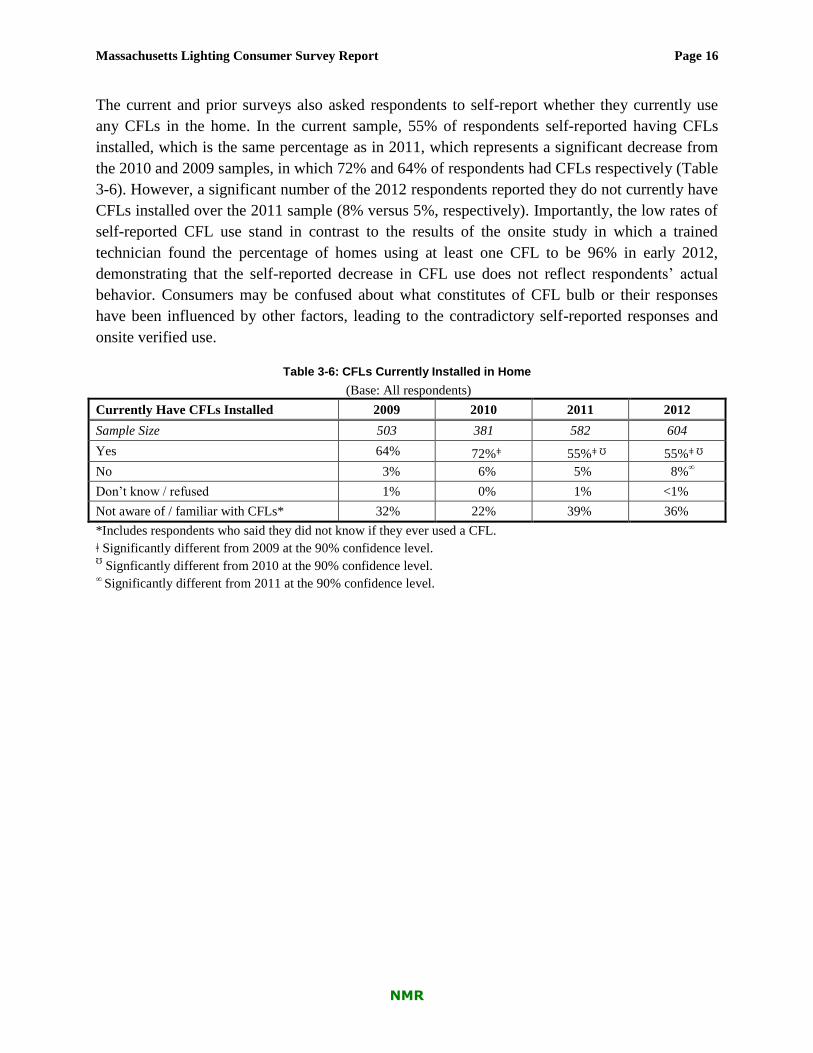
The current and prior surveys also asked respondents to self-report whether they currently use
any CFLs in the home. In the current sample, 55% of respondents self-reported having CFLs
installed, which is the same percentage as in 2011, which represents a significant decrease from
the 2010 and 2009 samples, in which 72% and 64% of respondents had CFLs respectively (Table
3-6). However, a significant number of the 2012 respondents reported they do not currently have
CFLs installed over the 2011 sample (8% versus 5%, respectively). Importantly, the low rates of
self-reported CFL use stand in contrast to the results of the onsite study in which a trained
technician found the percentage of homes using at least one CFL to be 96% in early 2012,
demonstrating that the self-reported decrease in CFL use does not reflect respondents‘ actual
behavior. Consumers may be confused about what constitutes of CFL bulb or their responses
have been influenced by other factors, leading to the contradictory self-reported responses and
onsite verified use.
Table 3-6: CFLs Currently Installed in Home
(Base: All respondents)
Currently Have CFLs Installed 2009 2010 2011 2012
Sample Size 503 381 582 604
Yes 64% 72%ǂ
55%ǂ Ʊ 55%ǂ Ʊ
No 3% 6% 5% 8%∞
Don‘t know / refused 1% 0% 1% <1%
Not aware of / familiar with CFLs* 32% 22% 39% 36%
*Includes respondents who said they did not know if they ever used a CFL.
ǂ Significantly different from 2009 at the 90% confidence level. Ʊ Signficantly different from 2010 at the 90% confidence level.
∞ Significantly different from 2011 at the 90% confidence level.

Massachusetts Lighting Consumer Survey Report Page 17
NMR
In order to explore reasons why some households may stop using CFLs, the 2012 respondents
who said that they once had CFLs installed but no longer utilize them further indicated why this
is the case. Only 34 respondents indicated that they had stopped using CFLs, and these
respondents provided multiple responses so the totals sum to more than 100%. Almost one-half
(47%) of these 34 respondents indicated that they had moved homes or were now renting, and
that bulbs other than CFLs were already installed (Table 3-7). This is an optimistic finding given
that their switch from efficient lighting was not the result of concerns about CFLs, but simply the
circumstance of switching residences, although it certainly would be preferable if these
respondents or their landlords chose efficient lighting. Further, another 32% of the sample
indicated that they prefer other efficient lighting choices such as LEDs, which is also an
optimistic finding from an efficiency perspective. An equal number of respondents (32%)
mentioned that someone else purchases the light bulbs in their homes. Yet, a sizable percentage
(84%) of respondents still voiced at least some concerns over actual price, performance, or
disposal issues of CFLs; the concerns mentioned varied so that no single response garnered more
than 12% of all reasons offered for discontinued CFL use by the survey respondents.
Table 3-7: Reasons for No Longer Using CFLs
(Base: Respondents who have ever used a CFL but do not currently have any installed)
Why no longer have CFLs installed? (Multiple Response) 2012
Sample size 34
Non-Performance or CFL Price Issues 111%
Moved/renting and bulbs were already there 47%
Someone else buys/replaces them 32%
Prefer LEDs/other efficient lighting choices 32%
CFL Performance or Price Issues 84%
Price/expense 12%
Poor light color 12%
Broke too easily 9%
Did not like the look/appearance of CFLs 9%
Mercury/disposal issues 9%
Shorter bulb life than promised 9%
Did not work with fixtures 6%
Not bright enough 6%
Inadequate for my needs 3%
Did not work well 3%
Went back to/prefer incandescents 3%
The long warm up time 3%
Other
Don‘t know/Refused 15%

Massachusetts Lighting Consumer Survey Report Page 18
NMR
Respondents also self-reported their use of dimmable CFLs. Most 2012 respondents (82%) did
not have dimmable CFLs installed, but 18% utilized dimmable CFLs in their homes (Table 3-8).
These results are very similar to the 2011 survey.
Table 3-8: Use of Dimmable CFLs in the Home
(Base: All respondents)
Dimmable CFLs currently installed 2011 2012
Sample size 582 604
Yes 16% 18%
No 83% 82%
Don‘t know/Refused 1% <1%
3.3 Alternative Lighting Technologies
The 2011 survey established baseline use of the types of screw-in LEDs meant to replace
incandescent bulbs. Similarly to 2011, only 16% of respondents self-reported using LED screw-
in bulbs currently installed in their homes (Table 3-8). The percentage is greater than the seven
percent of household found using LEDs during the onsite visits—and the onsite percentage
includes all types of LEDs such as A-line screw-in bulb but also the cabinet and night lights.
Table 3-9: LED Screw-In Bulbs Installed in Home
(Base: All respondents)
Any LED bulbs currently installed? 2011 2012
Sample size 582 604
Yes 16% 16%
No 79% 81%
Don‘t know/Refused 5% 3%

Massachusetts Lighting Consumer Survey Report Page 19
NMR
Respondents who self-reported having screw-in LEDs currently installed also described the types
of fixtures they were installed in. The most frequent response was floor, table, and portable
lamps, named by roughly two out of three respondents (64%) (Table 3-10). Ceiling and overhead
lighting was mentioned by more than one out of four respondents (27%) while outdoor and
general lighting were each mentioned by 8% of respondents.11
Table 3-10: Types of Fixtures or Lamps with Installed LED Bulbs in Home--2012
(Base: Respondents who said they had an LED screw-in bulb installed in their home)
Fixture/Lamp type 2012
Sample size 101
Floor/table portable lamps 64%
Ceiling/Overhead Lighting 27%
Outdoor 8%
General lighting/wherever I can 8%
Ceiling fans with lighting 6%
Recessed lighting 3%
Basement/cellar/utility spaces 3%
In an appliance 2%
Track lighting 2%
Vanity 1%
Chandelier 1%
Nightlights 1%
Pendant/hanging 1%
Holiday lighting/candle 0%
Other 4%
Don‘t know/Refused 2%
11
The Team asked a similar question in the 2011 survey but responses focused on technical definitions of fixture
types, and interviewers unfamiliar with fixture types mislabeled responses. The 2012 survey relied on more
colloquial language for describing fixture types, making the task of identifying fixtures easier for respondents and
interviewers, even if the terminology is not as exact as that used professionally.

Massachusetts Lighting Consumer Survey Report Page 20
NMR
4 Recent Lighting Purchases
The team fielded the first wave of the consumer survey in late 2011 and early 2012, just at the
time of EISA implementation of the phase-out of 100 Watt incandescent bulbs, allowing the
Team to establish a baseline at the onset of EISA implementation about preferences for certain
bulb types and likely consumer reactions to the phase-out of most incandescent bulbs. The 2012
(wave 2) consumer survey completed in June repeated these questions in order to track changes
during the first six months of EISA implementation.12
4.1 Recent Purchase History of Incandescent Bulbs
In order to assess whether respondents had noticed any changes in the availability of 100 Watt
incandescent bulbs, we asked whether they had looked for 100 Watt incandescent bulbs in the
past three months. Those who had shopped for 100 Watt incandescent bulbs were then asked a
series of questions about their shopping and purchasing experiences.
4.1.1 Shopping for 100 Watt Incandescent Bulbs
Only 14% of respondents indicated that they had shopped for 100 Watt incandescent bulbs in the
past three months (Table 4-1) in both the 2011 and 2012 surveys. However, it should be
remembered that only 26% of the 2012 households recalled using 100 Watt incandescent bulbs,
so it is not surprising to find so few respondents shopping for them in the past three months (see
Table 3-1 above).
Table 4-1: Whether Respondents Had Looked for 100 Watt Incandescents in the Past Three Months
(Base: All respondents)
Looked for 100 Watt incandescent bulbs in past 3 months 2011 2012
Sample size 582 604
Yes 14% 14%
No 85% 86%
Don‘t know/Refused 1% <1%
12
Note that the third wave of the consumer survey will continue asking about 100 Watt incandescent bulbs and
introduce questions about 75 Watt bulbs, which will be phased out in 2013.

Massachusetts Lighting Consumer Survey Report Page 21
NMR
Those respondents who had looked for 100 Watt incandescent bulbs then indicated whether they
had been successful in their attempt to purchase them. The findings point to evidence that the
phase-out has begun to affect consumers‘ ability to find 100 Watt incandescents on store shelves.
In 2011, more than three out of four respondents (77%) who had attempted to purchase these
bulbs found them on store shelves, but, n contrast, only 63% of 2012 respondents shopping for
100 Watt incandescents found them on the shelves in the three months prior to the 2012 survey
(Table 4-2).
Table 4-2: Whether Respondents Had Found 100 Watt Incandescent Bulbs on Retailers Shelves in the Past Three Months
(Base: Respondents who said they had looked for 100 Watt incandescent in the past three months)
Response 2011 2012
Sample size 84 84
Yes – went to a store and found them on the shelves 77% 63%*
No – went to a store and could NOT find them on the shelves 15% 28%*
Don‘t know/Refused 8% 9%
* Significantly different from 2011 at the 90% confidence level.
The respondents who did not find 100 Watt incandescent bulbs on retailer‘s shelves in their first
attempt noted whether they had looked elsewhere for the bulbs. Four 2012 respondents went to
another store to find the bulbs, and did so successfully (Table 4-3). The majority, however, did
not go to another store or otherwise try to locate the bulbs further.
Table 4-3: Whether Respondents Had Looked Elsewhere for 100 Watt Incandescent Bulbs If Not Found at Retailer
(Base: Respondents who had looked for 100 Watt incandescent in the past three months but had not found them)
Looked for 100 Watt incandescents elsewhere (unweighted
counts) 2011 2012
Sample size 14 25
Yes, went to another store 2 4
Yes, went to look on the internet 0 0
Yes, both stores and internet 0 0
No, did not go to another store or look on the internet 12 21

Massachusetts Lighting Consumer Survey Report Page 22
NMR
4.1.2 Types of Bulbs Purchased when Shopping for 100 Watt Incandescents
Of the respondents who had found 100 Watt incandescent bulbs on store shelves in the past three
months, only 39% reported purchasing those bulbs, representing a significant decline in the
purchase of 100 Watt bulbs from the 2011 sample (Table 4-4).13
Table 4-4: 100 Watt Incandescent Bulbs Purchased in Past Three Months
(Base: Respondents who said they had found 100 Watt incandescent in a retail store or elsewhere)
Purchased 100 Watt incandescents in past 3 months? 2011 2012
Sample size 71 61
Yes 56% 39%*
No 43% 60%*
Don‘t know/Refused 2% 1%
* Significantly different from 2011 at the 90% confidence level.
The 31 respondents who had not found 100 Watt incandescent bulbs in 2012 also reported
whether they had purchased other light bulbs instead of the 100 Watt incandescent in the past
three months. Eighteen of these respondents indicated that they had purchased a different type of
light bulb while the other thirteen had not (Table 4-5).
Table 4-5: Whether Purchased Light Bulbs Instead of 100 Watt Incandescent in Past Three Months
(Base: Respondents who said they had not found 100 Watt incandescents in a retail store or elsewhere)
Purchased instead of 100 Watt incandescent in past 3 months 2011 2012
Sample size 22 31
Yes 12 18
No 9 13
Don‘t know/Refused 1 -
13
NMR recommends adding a follow-up question in the Wave 3 survey to find out why some respondents who find
100 Watt—and 75 Watt—incandescent bulbs decide not to buy them.
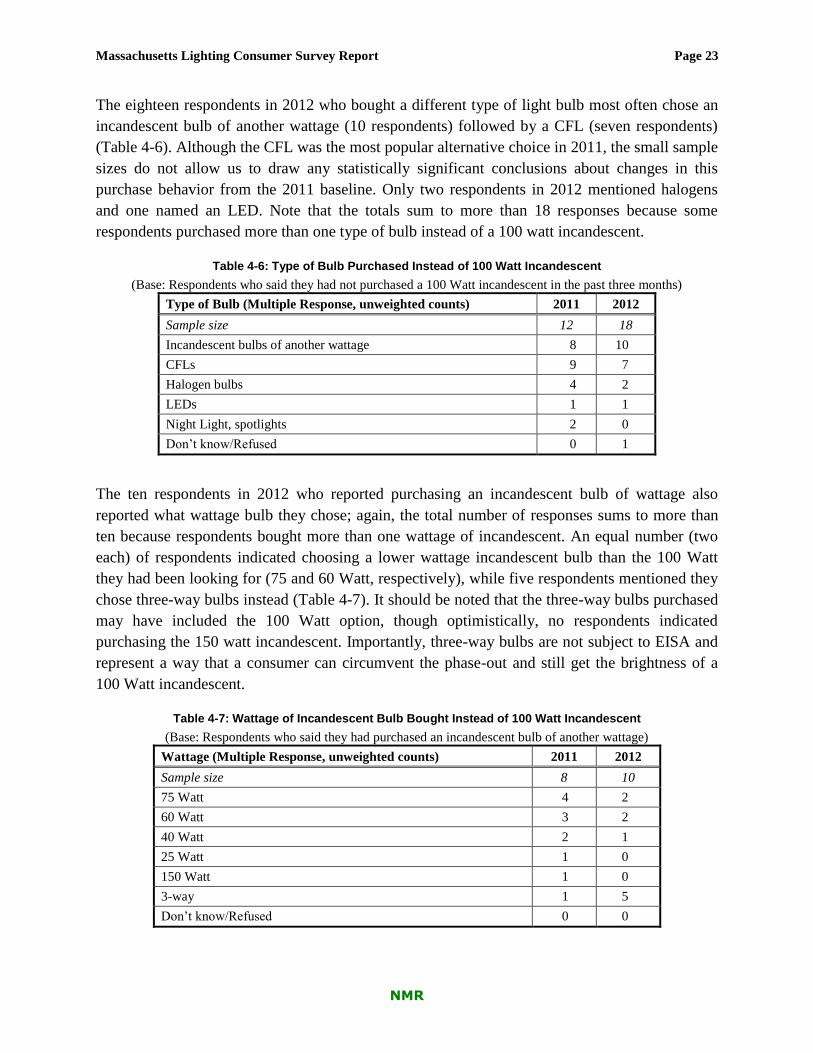
Massachusetts Lighting Consumer Survey Report Page 23
NMR
The eighteen respondents in 2012 who bought a different type of light bulb most often chose an
incandescent bulb of another wattage (10 respondents) followed by a CFL (seven respondents)
(Table 4-6). Although the CFL was the most popular alternative choice in 2011, the small sample
sizes do not allow us to draw any statistically significant conclusions about changes in this
purchase behavior from the 2011 baseline. Only two respondents in 2012 mentioned halogens
and one named an LED. Note that the totals sum to more than 18 responses because some
respondents purchased more than one type of bulb instead of a 100 watt incandescent.
Table 4-6: Type of Bulb Purchased Instead of 100 Watt Incandescent
(Base: Respondents who said they had not purchased a 100 Watt incandescent in the past three months)
Type of Bulb (Multiple Response, unweighted counts) 2011 2012
Sample size 12 18
Incandescent bulbs of another wattage 8 10
CFLs 9 7
Halogen bulbs 4 2
LEDs 1 1
Night Light, spotlights 2 0
Don‘t know/Refused 0 1
The ten respondents in 2012 who reported purchasing an incandescent bulb of wattage also
reported what wattage bulb they chose; again, the total number of responses sums to more than
ten because respondents bought more than one wattage of incandescent. An equal number (two
each) of respondents indicated choosing a lower wattage incandescent bulb than the 100 Watt
they had been looking for (75 and 60 Watt, respectively), while five respondents mentioned they
chose three-way bulbs instead (Table 4-7). It should be noted that the three-way bulbs purchased
may have included the 100 Watt option, though optimistically, no respondents indicated
purchasing the 150 watt incandescent. Importantly, three-way bulbs are not subject to EISA and
represent a way that a consumer can circumvent the phase-out and still get the brightness of a
100 Watt incandescent.
Table 4-7: Wattage of Incandescent Bulb Bought Instead of 100 Watt Incandescent
(Base: Respondents who said they had purchased an incandescent bulb of another wattage)
Wattage (Multiple Response, unweighted counts) 2011 2012
Sample size 8 10
75 Watt 4 2
60 Watt 3 2
40 Watt 2 1
25 Watt 1 0
150 Watt 1 0
3-way 1 5
Don‘t know/Refused 0 0

Massachusetts Lighting Consumer Survey Report Page 24
NMR
4.2 Purchase of All Types of Light Bulbs
The survey also asked about the purchase of all types of light bulbs, not just 100 Watt
incandescents. Including the bulb purchase behavior of the respondents discussed above who had
at least shopped for 100 Watt incandescent bulbs, we find that 42% of the 2012 sample
purchased some type of light bulb in the past three months, a significant decline of 5% from the
2011 sample (Table 4-8), which likely reflects the seasonality of lighting purchases. In other
words, more household bought light bulbs in the 2011 survey because it was fielded in early
winter, rather than the late spring time period of the 2012 survey.
Table 4-8: Light Bulb Purchases in the Past Three Months
(Base: All respondents)
Purchased a bulb in past 3 months? 2011 2012
Sample size 582 604
Yes 47% 42%*
No 53% 58%*
Don‘t know/Refused <1% 1%
* Significantly different from 2011 at the 90% confidence level.
Table 4-9 on the next page summarizes the types of bulbs purchased by respondents that had
bought bulbs in the past three months, including those discussed in Section 4.1.2. Note that only
respondents who had previously reported familiarity with the relevant bulb type were asked these
items. Therefore, it is possible that respondents purchased more bulbs than indicated here, but we
could not inquire about these purchases as they had not indicated familiarity with all bulb types.
Although sample sizes differed between several of the bulb types examined, the highest recorded
percentage of purchases for the 2012 sample were for incandescents (58% of aware purchasers,
23% of all respondents) followed by CFLs (49% of aware purchasers, 15% of all respondents).
Halogen bulbs (18% of aware purchasers, 6% of all respondents), pin-based fluorescent tubes
(17% of purchasers, 7% of all respondents), and LEDs (13% of aware purchasers, 3% of all
respondents) were also popular choices. Compared with the 2011 results, the percentage of 2012
purchases of all bulb types, except incandescents and pin based fluorescent tubes, have declined,
but again, this may reflect a seasonality issue more than changes in behavior. Comparisons to the
Wave 3 survey to be fielded during the same season as the Wave 1 survey may provide more
clarification on this issue.

Massachusetts Lighting Consumer Survey Report Page 25
NMR
Table 4-9: Type of Bulb Purchased in the Past Three Months
(Base: Respondents who said they had purchased any light bulbs in the past three months and were aware of relevant
bulb type; and all respondents)
Type of Bulb (Multiple
Response)
Sample Size Percent of Respondents
Asked Question
Percent of All
Respondents
(n = 582; 604)
2011 2012 2011 2012 2011 2012
CFLs that screw into regular
light sockets 250 196 65% 49%* 24% 15%*
Incandescent or regular light
bulbs 359 238 57% 58% 25% 23%
Halogen bulbs that screw
into regular light sockets 236 200 26% 18%* 9% 6%*
Pin-based fluorescent tubes
that can only be used in
fluorescent light fixtures
300 269 16% 17% 8% 7%
LEDs that screw into regular
light sockets 164 134 18% 13% 4% 3%
Pin-based CFLs that can
only be used in special light
fixturesΩ
300 203 10% 8% 5% 3%*
Pin-based LEDs that can
only be used in special light
fixturesΩ
300 137 5% 3% 2% 1%
Other bulbs mentioned
Pin-based Halogens 2 5
N/A** - N/A** -
Flood lights 5 7
Strip or under cabinet LED 2 1
Holiday/string lighting 2 1
Automotive bulbs/headlights 3 4
Bulb for recessed lighting 3 2
High pressure sodium lights 1 0
Other 4 10
* Significantly different from 2011 at the 90% confidence level.
** Number of respondents naming other bulbs types is too small to report percentages. Ω Survey altered in 2012 to limit this question to respondents previously aware of CFLs and LEDs, hence the lower
sample sizes.

Massachusetts Lighting Consumer Survey Report Page 26
NMR
5 Key Lighting Concepts
The gradual phase-out of most incandescent bulbs will likely change the way that consumers
shop for light bulbs. Instead of searching for ―100 Watt‖ bulbs and their equivalents, consumers
will instead be presented with labels and educational materials that reference lumens, color
temperature, annual operating costs, and other bulb life. The survey included multiple questions
to gauge what consumers currently consider when buying light bulbs and their knowledge of key
lighting concepts.
5.1 Information Considered when Buying Light Bulbs
We asked respondents two questions about the type of information that they currently look for on
bulb packing when buying light bulbs; the first question was open-ended, allowing the consumer
to name any information they desired, while the second asked about specific characteristics. For
example, if a respondent had not mentioned ―price‖ during the unprompted portion, they were
later asked if the price of the bulb is something they actually do look for. We report both the
percentage of the entire sample who gave each response unprompted, and the percentage of the
entire sample who gave each response when prompted. The most popular unprompted response
in 2012 was the wattage of the bulb (54%) which was also mentioned by 42% of respondents in
the prompted follow-up (Table 5-1 on the next page). Following the 2011 pattern of responses, in
2012 wattage was the only characteristic mentioned more frequently unprompted than prompted
by the interviewer. This suggests that educational campaigns and information at the point of
purchase will be vital in helping consumers transition from a focus on the familiar incandescent
wattage to lumens when purchasing bulbs. Also mentioned with high frequency both
unprompted and prompted were the price (26% and 66%, respectively) and the bulb life (13%
and 51%, respectively). Prompted, respondents also noted that they looked for wattage
equivalency (61%), bulb shape (59%), and the ENERGY STAR label (55%).

Massachusetts Lighting Consumer Survey Report Page 27
NMR
Table 5-1: Information Looked for on Bulb Packaging
(Base: All respondents)
Information on packaging (Multiple
Response)
Unprompted
Response Prompted Response
Total Prompted and
Unprompted
2011 2012 2011 2012 2011 2012
Sample Size 582 604 582 604 582 604
Wattage 50% 54% 44% 42% 94% 96%
Price 25% 26% 66% 66% 91% 92%
Watt equivalency 5% 9%* 69% 61%* 74% 70%
Bulb life 14% 13% 47% 51% 61% 64%
Shape 3% 5%* 56% 59% 59% 64%*
ENERGY STAR label 9% 6%* 55% 55% 64% 61%
Color appearance, color temperature,
Kelvin 6% 9%* 49% 45% 55% 54%
3-way 1% 1% 39% 44%* 40% 45%*
Lumens, brightness, light output 10% 11% 20% 19% 30% 30%
Dimming 1% <1% 25% 26% 26% 26%
UL, or Underwriters Laboratories label <1% <1% 21% 25% 21% 25%
Lighting facts/energy facts label 3% 4% 20% 17% 23% 21%
CRI, or color rendition index 1% 1% 12% 12% 13% 13%
Mercury content <1% 1% 13% 12% 13% 13%
Energy usage/energy efficiency/savings on
bill 10% 7%* N/A N/A 10% 7%*
Bulb size, base size 5% 6% N/A N/A 5% 6%
Brand 3% 5%* N/A N/A 3% 5%
Matches bulb being replaced, appropriate
for my needs 3% 4% N/A N/A 3% 4%
Type of bulb 4% 3% N/A N/A 4% 3%
Where made 1% 1% N/A N/A 1% 1%
Environmentally friendly 1% 1% N/A N/A 1% 1%
Nothing 1% 4%* N/A N/A 1% 4%*
Savings on energy bill <1% 2% N/A N/A <1% 2%
Incandescent only <1% <1% N/A N/A <1% <1%
Don‘t know/Refused 7% 4%* N/A N/A 7% 4%
Other 4% 3% N/A N/A 4% 3%
* Significantly different from 2011 at the 90% confidence level.
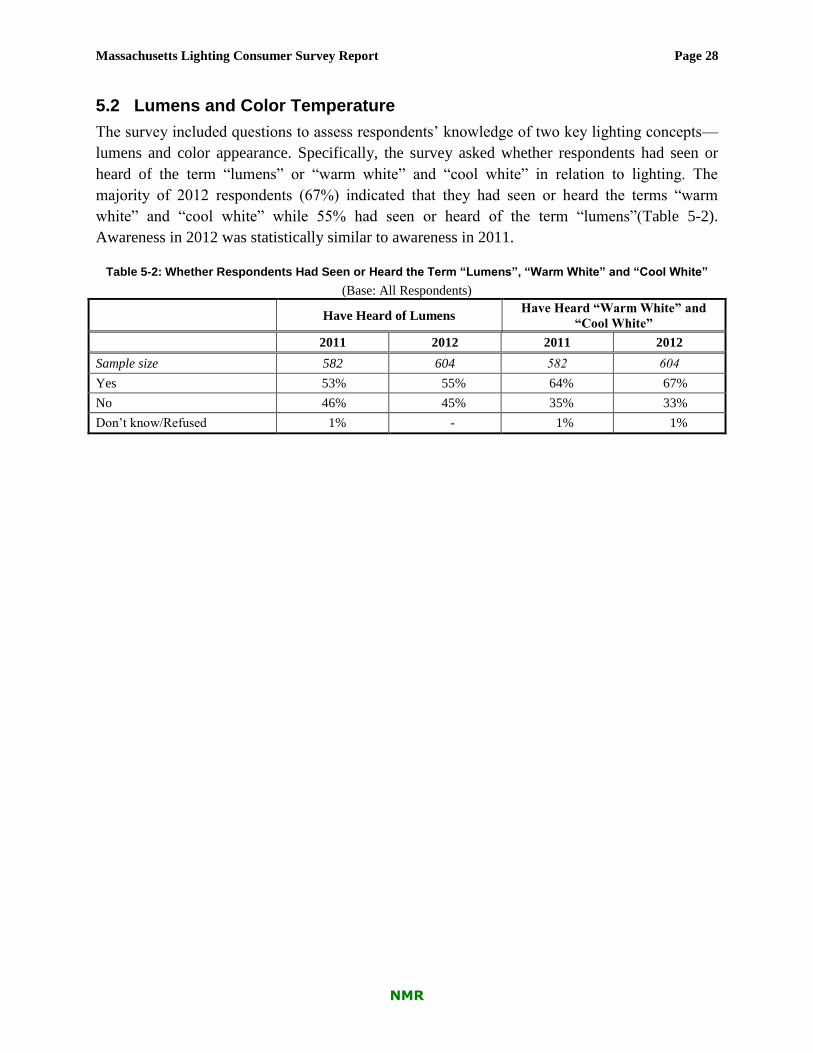
Massachusetts Lighting Consumer Survey Report Page 28
NMR
5.2 Lumens and Color Temperature
The survey included questions to assess respondents‘ knowledge of two key lighting concepts—
lumens and color appearance. Specifically, the survey asked whether respondents had seen or
heard of the term ―lumens‖ or ―warm white‖ and ―cool white‖ in relation to lighting. The
majority of 2012 respondents (67%) indicated that they had seen or heard the terms ―warm
white‖ and ―cool white‖ while 55% had seen or heard of the term ―lumens‖(Table 5-2).
Awareness in 2012 was statistically similar to awareness in 2011.
Table 5-2: Whether Respondents Had Seen or Heard the Term “Lumens”, “Warm White” and “Cool White”
(Base: All Respondents)
Have Heard of Lumens Have Heard ―Warm White‖ and
―Cool White‖
2011 2012 2011 2012
Sample size 582 604 582 604
Yes 53% 55% 64% 67%
No 46% 45% 35% 33%
Don‘t know/Refused 1% - 1% 1%

Massachusetts Lighting Consumer Survey Report Page 29
NMR
However, just because the majority of respondents had heard these key lighting terms before the
survey does not mean that they understand what they meant. For this reason, we asked those
respondents who had seen or heard of the terms ―lumens‖, ―warm white‖ and ―cool white‖ to
define them. Table 5-3 shows that the majority of respondents familiar with the term lumens
(74% of those asked or 45% of all 604 respondents in 2012) correctly understood that the term
refers to light output or brightness, and, again, the responses are very similar between 2011 and
2012.
Table 5-3: Understanding of the Term “Lumens”
(Base: Respondents who said they had seen or heard the term ―lumens‖)
Respondents‘ understanding of ―lumens‖ (Multiple Response) 2011 2012
Sample size 370 370
Light output or brightness 74% 74%
Unit of measure of lighting 2% 1%
Distance light will penetrate 2% 1%
Candlelight 2% 3%
Light color 1% 1%
The same as Watts 1% 3%
Quality of light 1% 1%
Energy emitted 1% 1%
Efficiency <1% <1%
Company or brand - 2%
Other 3% 2%
Don‘t know/Refused 16% 16%

Massachusetts Lighting Consumer Survey Report Page 30
NMR
As with the term ―lumens,‖ those respondents who had heard the terms ―warm white‖ and ―cool
white‖ also demonstrated a strong understanding of the term (83% of those asked or 60% of all
604 respondents), noting that it referred to the color appearance of the light (Table 5-4). Despite
the high levels of familiarity with the terms, the 2012 sample actually displayed lower familiarity
than the 2011 sample, in which almost every respondent correctly identified ―warm white and
cool white.‖ A greater number of the 2012 respondents mentioned ―related to your eyes/how
eyes perceive the light‖ as a description for ―warm white‖ and ―cool white‖ accounting for some
of the difference. In other words, an increasing percentage of respondents seem to be confusing
―color rendition‖ and ―color appearance.‖
Table 5-4: Understanding of the Terms “Warm White” and “Cool White”
(Base: Respondents who said they had seen or heard the terms ―warm white‖ and ―cool white‖)
Respondents‘ understanding of ―warm white‖ and ―cool white‖
– as in the color white (Multiple Response) 2011 2012
Sample size 426 434
Color appearance 92% 83%*
Heat of the bulb 5% 5%
Fluorescent/one resembles fluorescent light 3% 2%
Relates to your eyes/how your eyes perceive the light 1% 7%*
Wavelength spectrum of the light 1% 3%
Coated vs. clear bulb 1% 2%
The way you look in the bulbs light <1% <1%
Other 4% 3%
Don‘t know/Refused 14% 15%
* Significantly different from 2011 at the 90% confidence level.

Massachusetts Lighting Consumer Survey Report Page 31
NMR
6 Potential Reactions to EISA
The survey asked a series of questions to ascertain respondents‘ likely bulb choice after 100 Watt
incandescent bulbs are no longer available. The Team stresses that these findings are based on
self-reported reactions to hypothetical situations described in a survey. Actual purchase behavior
when faced with choices at the point of purchase could be very different from those reported
here.
6.1 Bulb Choice under EISA
More than two out of five respondents (41%) in the 2012 sample said they would most likely
choose a lower wattage incandescent bulb to purchase instead of a 100 Watt incandescent bulb,
differing significantly from the 34% of respondents mentioning this choice in 2011 (Table 6-1).
Roughly one in four respondents (27%) in 2012 indicated they would choose a 23 Watt screw in
CFL as their second choice, which is a smaller percentage than in 2011, but significantly so.
Approximately one in ten respondents would choose a 72 Watt screw-in halogen or a 17 Watt
screw-in LED. Only 4% of the sample would choose the least efficient option offered, a 150
Watt incandescent. Thus, the results indicate a greater preference among the 2012 respondents
than 2011 respondents for continuing to buy incandescent bulbs over other bulb types. It is
unclear why more 2012 respondents chose the lower wattage incandescent over the more
efficient options than 2011 respondents. The proclivity to buy and save extra 100 Watt
incandescent bulbs is explored in Section 6.2.
Table 6-1: Bulb Choice under EISA
(Base: All Respondents)
Bulb type 2011 2012
Sample size 582 604
A lower wattage incandescent bulb 34% 41%*
A 23 Watt screw-in CFL bulb meant to replace a
100 Watt incandescent bulb 30% 27%
A 72 Watt screw-in halogen bulb meant to replace a
100 Watt incandescent bulb 13% 11%
A 17 Watt screw-in LED bulb meant to replace a
100 Watt incandescent bulb 10% 10%
A 150 Watt incandescent bulb 4% 4%
Don‘t know/refused 9% 8%
* Significantly different from 2011 at the 90% confidence level.

Massachusetts Lighting Consumer Survey Report Page 32
NMR
All respondents, regardless of bulb choice under EISA, received a follow-up question asking
their reasons for choosing the particular bulb they favored. A popular response of both the 2011
and 2012 respondents across all bulbs was a preference for that bulb‘s particular light, color
temperature, or brightness (mentioned by 68% of those choosing a 150 Watt incandescent, 34%
of those choosing a lower wattage incandescent, 18% of those choosing a 17 Watt LED, 30% of
those choosing a 72 Watt halogen, and 19% of those choosing a 23 Watt CFL in 2012) (Table
6-2). Similar to last year, this was the most popular response for the lower wattage incandescent,
the 150 Watt incandescent (only 25 respondents, but they appeared to be very loyal to
incandescent bulbs), and the 72 Watt halogen. Alternatively, the most popular response for
choosing the 17 Watt LED or 23 Watt CFL was that these bulbs used less energy or were more
efficient (mentioned by 29% and 38% of those choosing the bulbs respectively). The long bulb
life of the LED was also a popular reason for choosing it (25%) indicating that respondents are
aware of this benefit of the LED. Familiarity with particular bulb types, fitting the necessary
fixtures, the low price of bulbs, and lowering one‘s energy bills, were also popular choices across
bulbs.

Massachusetts Lighting Consumer Survey Report Page 33
NMR
Table 6-2: Reasons for Bulb Choice under EISA
(Base: Respondents who said they would most likely use relevant bulb type)
Reasons (Multiple Response)
Lower wattage
incandescent
23 Watt CFL 72 Watt Halogen 17 Watt LED 150 Watt
Incandescent
2011 2012 2011 2012 2011 2012 2011 2012 2011 2012
Sample size 191 204 190 190 58 66 56 65 23 25
Prefer this light/color
temperature/brightness 33% 34% 12% 19%* 35% 30% 34% 18%* 65% 68%
Uses less energy/efficient 20% 21% 49% 38%* 10% 26%* 44% 29%* 6% 4%
Familiar with/already use this bulb 13% 28%* 17% 10%* 8% 12% 17% 12% 7% 8%
Fit fixtures/recommended for
fixture 8% 18%* 4% 4% 6% 3% 0% 5% 0% 4%
Low price/on sale 9% 7% 7% 9% 4% 2% 5% 2% 6% 0%
Lower energy bills 8% 5% 7% 10% 17% 2%* 10% 12% 0% 0%
Warm up quicker 2% 1% <1% 1% 1% 2% 2% 3% 6% 0%
Don‘t like CFLs because of
mercury 2% 1% 1% 1% 1% 2% 5% 3% 3% 4%
Convenience/availability/easy to
use 3% 2% 5% 3% 3% 3% 0% 2% 0% 0%
Most similar to incandescent I
used/use 1% 1% 8% 1% 13% 6% 9% 3% 0% 0%
Exchanging incandescents to other
bulbs as needed 2% 1% 1% 3% 0% 0% 2% 0% 0% 0%
Lasts longer 1% <1% 12% 5%* 3% 2% 9% 25%* 9% 0%
Good quality bulb/trustworthy 1% <1% 1% 2% 1% 2% 0% 5% 3% 4%
Not as hot 1% 5% 3% 4% 1% 3% 5% 3% 0% 0%
Because of EISA/following the
market 1% 5% 2% 1% 0% 0% 2% 0% 0% 0%
Don‘t like the government telling
me what bulb to use 1% 0% 0% 0% 0% 2% 2% 0% 0% 0%
Environmentally friendlier <1% <1% 2% 1% 0% 0% 2% 3% 0% 0%
Other 8% 5% 3% 4% 3% 3% 3% 2% 5% 0%
Don‘t know/refused 7% 3% 4% 4% 8% 14% 4% 2% 9% 0%
* Significantly different from 2011 at the 90% confidence level.

Massachusetts Lighting Consumer Survey Report Page 34
NMR
6.2 Stockpiling of Incandescents
The EISA legislation has raised concerns about ―stockpiling‖ or ―hoarding‖ incandescent bulbs,
and earlier reports delivered by NMR have documented some of the evidence internationally and
in the United States.14
More recently, information reported by the National Electrical
Manufacturers Association (NEMA) suggests that, in 2011, ―Shipments of CFLs decreased by
6.6% compared to 2010. Conversely, incandescent lamp shipments rose 16.4% during 2011. A
preponderance—62.1%—of the increase over last year occurred during [the fourth quarter].‖15
Given the EISA‘s new efficiency standards for lighting products, including the phase-out of 100
Watt incandescent bulbs, an important aspect of the present analysis was assessing respondents‘
likelihood of stockpiling these bulbs.
Across the full sample, the majority of 2012 respondents indicated that they would be very
unlikely to buy and save extra 100 Watt incandescent bulbs (66%), while a smaller percentage
indicated being very likely to do so (12%), somewhat likely to do so (12%), and somewhat
unlikely to do so (9%) (Table 6-3). The average value on the four-point likelihood scale was 3.2.
This represents a significant difference from the 59% of 2011 respondents indicating they were
very unlikely to stockpile. Comparing those who had been aware of EISA before the survey to
those who first found out about EISA during the survey reveals statistically significant
differences in the likelihood to stockpile. Specifically, those already familiar with the legislation
are more likely to say they will stockpile bulbs (17%) than those who only found out about EISA
during the survey (9%). Additionally, those unfamiliar with EISA indicated they are very
unlikely to stockpile, a significant difference from those aware of the EISA legislation (70%
versus 61%, respectively) and even from those unaware in 2011 (70% versus 63%, respectively).
As suggested in 2011, these findings suggest that the PAs may want to develop materials
targeted at those who are just learning about EISA—perhaps even explaining the legislation to
customers—but promoting the most efficient lighting options as viable, even superior, options to
incandescents.
14
NMR. Results of the Massachusetts and South Dakota 2011. 15
See http://www.nema.org/News/Pages/Shipments-of-Incandescent-Lamps-Illuminate-at-the-Close-of-2011.aspx.

Massachusetts Lighting Consumer Survey Report Page 35
NMR
Table 6-3: Likelihood of Buying and Saving Extra 100 Watt Incandescent Bulbs for Use After 2012
(Base: All Respondents)
Level of likelihood Overall Aware of EISA Not Aware of EISA
2011 2012 2011 2012 2011 2012
Sample size 582 604 327 292 255 312
Mean 3.3 3.2 3.1 3.1 3.4* Ω
3.3
1. Very likely 11% 12% 17%* 17%
* 6%
*Ω 9%
Ω
2. Somewhat likely 11% 12% 12% 13% 11% 12%
3. Somewhat unlikely 16% 9% 12% 9% 20% 9%**
4. Very unlikely 59% 66%**
60% 61% 63% 70 %
Ω**
Don‘t know/refused 3% 1% 0% <1% 1% 1%
* Significantly different from Overall at the 90% confidence level.
** Significantly different from 2011 at the 90% confidence level.
Ω Significantly different from ‗Aware of EISA‘ at the 90% confidence level.

Massachusetts Lighting Consumer Survey Report Page 36
NMR
We also gauged potential stockpiling of incandescent bulbs by asking the number of 100 Watt
incandescents purchased by respondents who had self-reported buying these bulbs in the past
three months (see Section 4.1). Among 100 Watt purchasers, the average number of 100 Watt
bulbs purchased by the 2012 respondents was 6.04, and the median value (the number occurring
at the midpoint of purchases) was four (Table 6-4). The greatest number of respondents (66%)
who had purchased 100 Watt incandescent bulbs reported purchasing only one to five of them in
the past three months, which coincides with the ―four-pack‖ of incandescent bulbs. However,
31% of respondents buying 100 Watt incandescents reported buying six or more bulbs.
Expanding the analysis to all respondents—most of whom did not buy 100 Watt incandescents—
places the findings in a broader context, indicating fairly low rates of stockpiling across the
broader population. Only 5% of the entire sample purchased 100 Watt incandescents, with a
mean purchase 0.23 bulbs per participant. Compared with the 2011 results, 2012 respondents
purchased fewer 100 Watt bulbs in smaller quantities, but this may reflect the seasonality of
lighting purchases and not movement away from 100 Watt bulbs, as we will explore in the Wave
3 survey.
Table 6-4: Quantity of 100 Watt Incandescent Bulbs Purchased
(Base: Respondents who said they had bought 100 Watt incandescent bulbs in the past three months)
Number of bulbs purchased
100 Watt Incandescent
Purchasers All Respondents
2011 2012 2011 2012
Sample size 47 28 582 604
Mean 12.50a 6.04 1.10 0.23
Median 6 4 0 0
Quantity purchased
1-5 40% 66% 3% 3%
6-10 23% 18% 2% 1%
11-25 23% 10% 2% <1%
25+ 13% 3% 1% <1%
Don‘t know/Refused 0% 3% 0% <1% a The total number of weighted bulbs purchased is 142, but multiplying 6.04 by the unweighted sample size of 28
yields a bulb count of 170. Use of the weighted sample size of 23 provides the correct answer, albeit with rounding
error.

Massachusetts Lighting Consumer Survey Report Page 37
NMR
As expected, those 2012 respondents who had indicated they were likely to stockpile 100 Watt
incandescents also self-reported purchasing more (97 bulbs) of those bulbs than the respondents
who said they would be unlikely to stockpile (45 bulbs), a similar pattern to last year (Table 6-5).
It is worth noting that those likely to stockpile in 2011 purchased significantly more 100 watt
bulbs (549 bulbs) than those likely to stockpile in 2012 (97 bulbs), but again, this may simply
indicate the seasonality of lighting purchases.
Table 6-5: Total Number of 100 Watt Incandescent Bulbs Purchased by Self-Reported Tendency to Stock Pile
(Base: Respondents who said they had bought 100 Watt incandescent bulbs in the past three months)
Stockpiling likelihood Likely to stockpile Unlikely to stockpile
2011 2012 2011 2012
Sample size 31 17 16 10
Total 100 Watt Incandescent bulbs
purchased 549 97 82 45
Massachusetts Lighting Consumer Survey Report Page 38
NMR
7 CFL Price Awareness and Satisfaction
The non-incentivized price of CFLs has risen in the past year due to the scarcity of rare earth
minerals, some of which are key components of CFLs.16
The survey asked respondents who are
somewhat or very familiar with CFLs if they had noticed a price increase and, if so, whether the
increase had prevented them from buying CFLs. The team also asked respondents who have used
CFLs how satisfied they are with them. All respondents that have used CFLs were also asked to
name things they like about CFLs and things they do not like about them. Users of dimmable
CFLs were asked to provide an assessment of those types of bulbs as well. New to the 2012
effort, respondents also indicated if their satisfaction with CFLs had increased or decreased over
the past year, the reasons for their potential change in satisfaction, and whether news stories
about CFLs had influenced their satisfaction with the bulbs.
7.1 CFL Price Awareness
The majority of 2012 respondents who were somewhat or very familiar with CFLs (45%) had
not noticed whether the price of CFLs had changed from last year to this year (Table 7-1).
Another 22% believed the price of CFLs was about the same across the time period. Of those
remaining, an equal number of respondents thought prices were lower and higher (13% each)
this year compared to last. Interestingly, recent purchasers were more likely than others to say
that the price of CFLs has stayed about the same than in the previous year (30%). As expected
the majority of respondents who did not recently purchase CFLs have not noticed a price change
from last year. Thus, recent price increases in CFLs have been largely unnoticed by the
respondents in the survey, perhaps because many of them obtained program-supported CFLs and
were not directly exposed to the price increase brought on by the scarcity of rare earth minerals
or because they had not purchased CFLs recently enough to notice the prices. Alternatively,
consumers may be less sensitive to CFL prices than previously thought, but more direct market-
based research that carefully tracks sales with changes in incentive levels would be needed to
draw this conclusion with more confidence.
16
DiClerico, Daniel. 2011. ―Shortage of rare earth metals results in higher CFL prices.‖ Consumer Reports.
September 16, 2011. Available at http://news.consumerreports.org/appliances/2011/09/shortage-of-rare-earth-
metals-stokes-controversy-around-cfls.html.
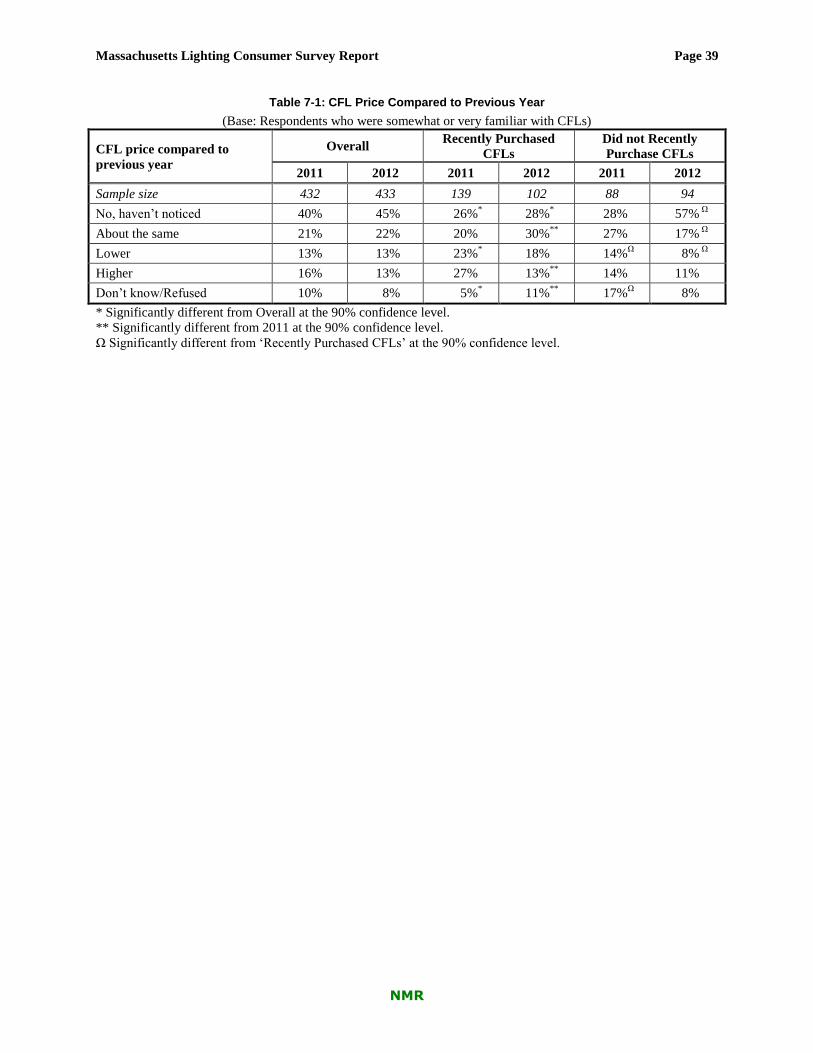
Massachusetts Lighting Consumer Survey Report Page 39
NMR
Table 7-1: CFL Price Compared to Previous Year
(Base: Respondents who were somewhat or very familiar with CFLs)
CFL price compared to
previous year
Overall Recently Purchased
CFLs
Did not Recently
Purchase CFLs
2011 2012 2011 2012 2011 2012
Sample size 432 433 139 102 88 94
No, haven‘t noticed 40% 45% 26%* 28%
* 28% 57%
Ω
About the same 21% 22% 20% 30%**
27% 17% Ω
Lower 13% 13% 23%* 18% 14%
Ω 8%
Ω
Higher 16% 13% 27% 13%**
14% 11%
Don‘t know/Refused 10% 8% 5%* 11%
** 17%
Ω 8%
* Significantly different from Overall at the 90% confidence level.
** Significantly different from 2011 at the 90% confidence level.
Ω Significantly different from ‗Recently Purchased CFLs‘ at the 90% confidence level.

Massachusetts Lighting Consumer Survey Report Page 40
NMR
After giving their estimation of CFL price compared to the previous year, the 48 respondents in
2012 who indicated CFL prices had increased revealed whether the higher price prevented them
from purchasing CFLs. The majority of respondents who had noticed an increase (55%) were not
influenced by the higher price to avoid purchasing CFLs (Table 7-2). However, two out of five
respondents (40%) did indicate that the higher price was enough to make them avoid CFLs.
Table 7-2: Whether Higher Price Prevented Recent CFL Purchases
(Base: Respondents who said they thought CFL price was higher than previous year)
Response 2011 2012
Sample size 53 48
Yes 42% 40%
No 54% 55%
Don‘t know/Refused 4% 5%
7.2 CFL Satisfaction
The survey included a question about CFL satisfaction that has been asked since the 2009
consumer survey. In the 2011 report, NMR noted a decrease in the percentage of households
very satisfied and satisfied with CFLs. The 2012 results complicate our understanding of CFL
satisfaction. Importantly, the majority of respondents in 2012 (76%) indicated that they were
somewhat to very satisfied with CFLs (Table 7-3), a 3% increase over the 2011 survey but still
lower than combined satisfaction in 2009 and 2010. Yet, in the current sample, a greater
percentage of respondents indicated they were very satisfied with standard CFLs compared to the
2011 sample (45% and 35%, respectively). The 2012 results compared with 2009 and 2010 were
in fact more similar. NMR will continue to monitor this trend in the third wave of the survey.
Table 7-3: Satisfaction with Standard CFLs
(Base: Respondents who said they had ever used a CFL on the interior or exterior of home)
Level of satisfaction 2009 2010 2011 2012
Sample size 339 313 390 414
Very satisfied 55% 50%ǂ 35%ǂƱ 45%Ʊ ǂ∞
Somewhat satisfied 31% 36% 38% 31%
Neither satisfied nor dissatisfied 7% 3% 9% 13%
Somewhat dissatisfied 3% 7% 12% 7%
Very dissatisfied 2% 3% 5% 4%
Don‘t know/Refused 2% 1% 1% <1% ǂ ―Very satisfied‖ significantly different from 2009 at the 90% confidence level.
Ʊ ―Very satisfied‖ significantly different from 2010 at the 90% confidence level.
∞ ―Very satisfied‖ significantly different from 2011 at the 90% confidence level.

Massachusetts Lighting Consumer Survey Report Page 41
NMR
Due to the concerns raised in response to the decreased levels of satisfaction found in the 2011
survey, the Team added questions in 2012 to determine if respondents‘ satisfaction with CFLs
had changed over time, and, if so, why their opinions had changed.
Respondents who indicated they use CFLs were prompted to report if their satisfaction with
CFLs has changed over the past year. More than three out of four (76%) said satisfaction with
CFLs has stayed the same, and 18% said their satisfaction had increased (Table 7-5). Only 5%
replied that they are less satisfied with CFLs now than a year ago.
Table 7-4: Change in Satisfaction with CFLs Over Past Year
(Base: Respondents who had ever used CFLs)
Has level of satisfaction with CFLs increased, decreased, or
stayed the same? 2012
Sample size 414
Increased 18%
Decreased 5%
Stayed the same 76%
Don‘t know/Refused 1%
When looking at the relationship between lighting news and CFL satisfaction, it appears that
news stories have had an influence on levels of CFL satisfaction. Of the 31 respondents who
indicated their satisfaction with CFLs increased over the past year and who had been exposed to
news stories about lighting, 67% said that news stories about CFLs were responsible for that
increase. Alternatively, of the 13 respondents whose satisfaction with CFLs decreased, 59%
indicated that news stories were responsible for the decrease. Taken together then, these findings
indicate that media attention toward CFLs has the capability to sway opinions toward the bulbs
in either direction, depending on the content of the story, but, on the whole, the influence appears
to have been more positive than negative in the past year.
Table 7-5: Whether News Stories about Light Bulbs Increased or Decreased Satisfaction with CFLs
(Base: Respondents who had read news stories about light bulbs and whose satisfaction with CFLs had changed over
past year)
Did news stories increase or decrease satisfaction with CFLs? Satisfaction
Increased
Satisfaction
Decreased
Sample size 31 13
Yes 67% 59%
No 30% 41%
Don‘t know/Refused 3% 0%
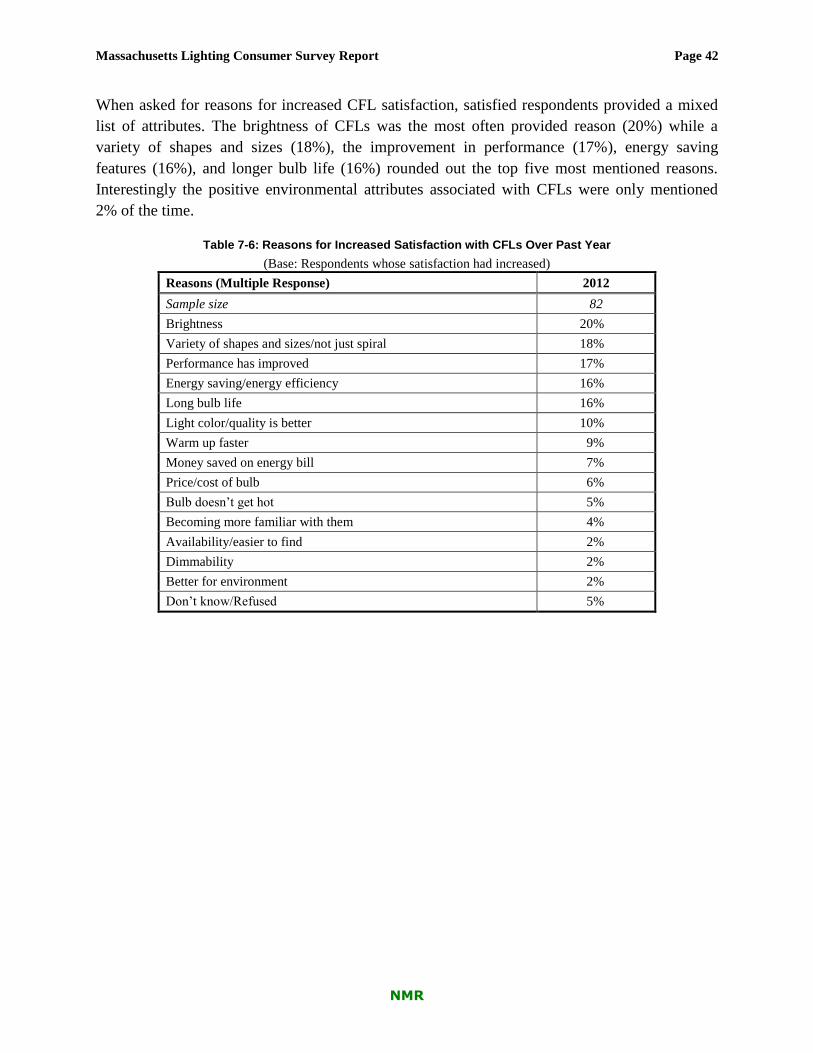
Massachusetts Lighting Consumer Survey Report Page 42
NMR
When asked for reasons for increased CFL satisfaction, satisfied respondents provided a mixed
list of attributes. The brightness of CFLs was the most often provided reason (20%) while a
variety of shapes and sizes (18%), the improvement in performance (17%), energy saving
features (16%), and longer bulb life (16%) rounded out the top five most mentioned reasons.
Interestingly the positive environmental attributes associated with CFLs were only mentioned
2% of the time.
Table 7-6: Reasons for Increased Satisfaction with CFLs Over Past Year
(Base: Respondents whose satisfaction had increased)
Reasons (Multiple Response) 2012
Sample size 82
Brightness 20%
Variety of shapes and sizes/not just spiral 18%
Performance has improved 17%
Energy saving/energy efficiency 16%
Long bulb life 16%
Light color/quality is better 10%
Warm up faster 9%
Money saved on energy bill 7%
Price/cost of bulb 6%
Bulb doesn‘t get hot 5%
Becoming more familiar with them 4%
Availability/easier to find 2%
Dimmability 2%
Better for environment 2%
Don‘t know/Refused 5%
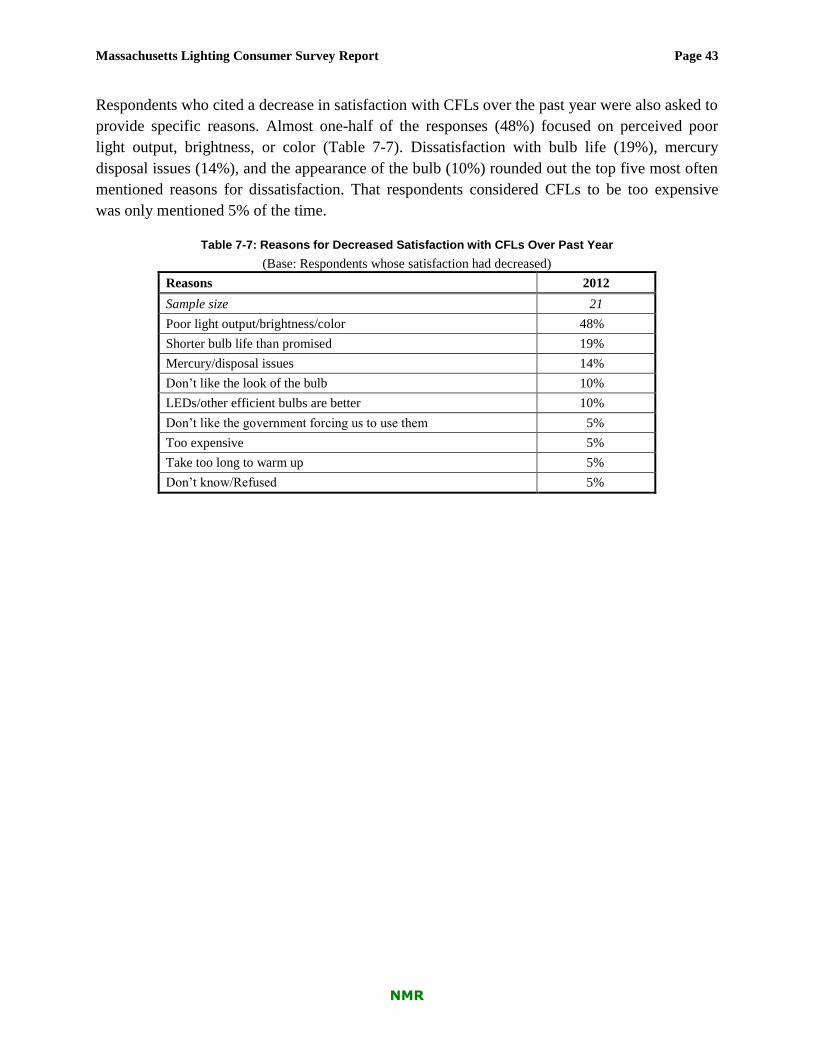
Massachusetts Lighting Consumer Survey Report Page 43
NMR
Respondents who cited a decrease in satisfaction with CFLs over the past year were also asked to
provide specific reasons. Almost one-half of the responses (48%) focused on perceived poor
light output, brightness, or color (Table 7-7). Dissatisfaction with bulb life (19%), mercury
disposal issues (14%), and the appearance of the bulb (10%) rounded out the top five most often
mentioned reasons for dissatisfaction. That respondents considered CFLs to be too expensive
was only mentioned 5% of the time.
Table 7-7: Reasons for Decreased Satisfaction with CFLs Over Past Year
(Base: Respondents whose satisfaction had decreased)
Reasons 2012
Sample size 21
Poor light output/brightness/color 48%
Shorter bulb life than promised 19%
Mercury/disposal issues 14%
Don‘t like the look of the bulb 10%
LEDs/other efficient bulbs are better 10%
Don‘t like the government forcing us to use them 5%
Too expensive 5%
Take too long to warm up 5%
Don‘t know/Refused 5%

Massachusetts Lighting Consumer Survey Report Page 44
NMR
In 2011, the Team began to ask both satisfied and dissatisfied CFLs users what they liked and
did not like about CFLs, thus providing a more complete picture of the range of opinions about
CFLs. Table 7-8 summarizes the responses, reporting results overall, but also by levels of
satisfaction. The most common reason for liking CFLs is that they save energy—named by 51%
of satisfied 2012 respondents and 31% of dissatisfied 2012 respondents. Moreover, with the
exception of the 19% of dissatisfied respondents who do not like anything about CFLs, both
groups also tended to like the longer life of CFLs and that they save money. Respondents who
were satisfied with CFLs in 2011 also appreciated their quality and brightness. Although the
satisfied 2012 sample cited these reasons as well, they were not as frequently mentioned as last
year.
Table 7-8: Reasons Respondents Like CFL Bulbs
(Base: Respondents who said they had ever used a CFL on the interior or exterior of home)
Reasons (Multiple Response) Satisfied with CFLs
a Dissatisfied with
CFLsb Total
2011 2012 2011 2012 2011 2012
Sample size 280 310 107 103 390 414
Save energy 49% 51% 36% 31% 45% 47%
Longer bulb life 36% 40% 16% 20% 30% 36%*
Save money on bills 21% 20% 10% 20%* 18% 20%
Do not like anything about
them/negative impression 3% 3% 26% 19% 9% 7%
Good quality 12% 7%* 2% 3% 9% 6%
Brighter/brightness 14% 6%* 2% 1% 10% 5%*
Don‘t get hot 12% 6%* 1% 1% 8% 5%*
Help environment 4% 6% 4% 6% 4% 6%
Convenience/easy to install 3% 3% 3% 6% 3% 4%
Type of light i.e. soft, clear 4% 8%* 1% 2% 3% 6%*
Cheaper 2% 4% 1% 3% 1% 4%*
Color/color choices 2% 1% 1% 1% 2% 1%
Durability 2% 1% 0% 1% 1% 1%
They are versatile/many uses 1% 1% 1% 1% 1% 1%
Resemble incandescents in shape <1% 1% 2% 0% 1% 1%
Other 2% 2% 1% 1% 2% 2%
Don‘t know/nothing in particular/no
preference/refused 3% 4% 13% 9% 6% 5%
* Significantly different from 2011 at the 90% confidence level. a Indicated that they were ―very satisfied‖ or ―somewhat satisfied‖ with CFLs.
b Indicated that they were ―neither satisfied or dissatisfied,‖ ―somewhat dissatisfied,‖ or ―very dissatisfied‖ with
CFLs.
Table 7-9 on the next page lists the things about CFLs that both satisfied and dissatisfied
respondents do not like. While it is not surprising that 54% of satisfied 2012 respondents
answered that there was nothing they disliked about CFLs, 38% of dissatisfied respondents
mentioned the same thing, mainly because ―neutral‖ responses were included in this group. A

Massachusetts Lighting Consumer Survey Report Page 45
NMR
much greater percentage of the 2012 respondents in both groups found nothing they disliked
about CFLs compared with the 2011 respondents. The most commonly disliked characteristic of
CFLs is their slowness to brighten, mentioned by 14% of satisfied respondents and 27% of
dissatisfied respondents. Both groups also mentioned mercury and disposal issues (7% of
satisfied and 14% of dissatisfied) and poor light color (5% of satisfied and 16% of dissatisfied).
Although mentioned by more dissatisfied respondents than satisfied ones, other common
concerns included the brightness and light output of the bulbs, their appearance, shorter than
promised life, expense, and that they do not work in certain fixtures.
Table 7-9: Reasons Respondents Do Not Like CFLs
(Base: Respondents who said they had ever used a CFL on the interior or exterior of home)
Reasons (Multiple Response) Satisfied with CFLs
a Dissatisfied with
CFLsb Total
2011 2012 2011 2012 2011 2012
Sample size 280 310 107 103 390 414
Nothing I don‘t like about them 42% 54%* 19% 38%* 36% 50%*
Slow to turn on/brighten 20% 14%* 34% 27% 23% 17%*
Mercury/disposal issues 9% 7% 24% 14%* 13% 9%*
Poor light color 8% 5% 13% 16% 10% 8%
Not bright enough 6% 5% 20% 14% 9% 7%
Poor light output 3% 1%* 15% 10% 6% 3%*
Don‘t like the look of bulb 6% 4% 7% 4% 6% 4%
Shorter bulb life than promised 4% 2% 8% 6% 5% 3%
Price/expense 7% 9% 7% 5% 7% 8%
Not suitable/don‘t fit certain fixtures 3% 7%* 3% 3% 3% 6%*
Flicker 1% <1% 1% 1% 1% <1%
Too bright 2% 1% 0% 1% 2% 1%
Buzz 1% <1% 1% 0% 1% <1%
Poor manufacturing 1% 2% 2% 0% 1% 2%
Don‘t work with dimmer switch 0% 1% 4% 1% 1% 1%
Don‘t like government forcing
consumers to buy them 0% <1% 1% 2% 1% 1%
Poor durability/break easily 6% 2%* 1% 1% 4% 2%
Not adaptable enough 1% 0% 1% 0% 1% 0%
Do not work in the cold 1% 1% 1% 0% 1% 1%
Other 2% 3% 6% 3% 3% 3%
Don‘t know/Refused 6% 1% 1% 3% 5% 1%
* Significantly different from 2011 at the 90% confidence level. a Indicated that they were ―very satisfied‖ or ―somewhat satisfied‖ with CFLs.
b Indicated that they were ―neither satisfied or dissatisfied,‖ ―somewhat dissatisfied,‖ or ―very dissatisfied‖ with
CFLs.

Massachusetts Lighting Consumer Survey Report Page 46
NMR
Respondents who have used dimmable CFLs were also asked what they did not like about these
products. As with standard CFLs, the most frequent response was that there is nothing the 2012
respondents did not like about dimmable CFLs (61%) (Table 7-10). However, though not
mentioned as frequently, concerns dimmable users cited included being slow to turn on/brighten
(6%), and not dimming to low light levels or dimming as low as incandescents (5%).
Table 7-10: Dimmable CFL Features Respondents Do Not Like
(Base: Respondents who said they had ever used a CFL on the interior or exterior of home and were somewhat or
very familiar with dimmable CFLs)
Reasons (Multiple Response) 2011 2012
Sample size 193 201
Nothing I don‘t like about them 55% 61%
Slow to turn on/brighten 9% 6%
Do not dim to low light levels/Do not dim as low as
incandescents 6% 5%
I don‘t currently use them 6% 9%
Need to replace switch/need compatible switch 3% 2%
They don‘t work well (unspecified) 2% 1%
Price/too expensive 4% 4%
Poor light color 2% 4%
Flicker 2% 2%
They are hard to find 3% 2%
Not bright enough 1% 2%
Shorter bulb life than promised 2% 4%
Mercury/disposal issues 1% 2%
Buzz 1% 2%
Poor manufacturing 2% 1%
Dislike everything about them 2% 1%
Don‘t fit in my fixtures 1% 1%
They aren‘t as efficient 1% 0%
When dimmed with other CFLs, light level or brightness is not
the same for all bulbs <1% 1%
Other 0% 2%
Don‘t know/Refused 7% 6%

Massachusetts Lighting Consumer Survey Report Page 47
NMR
8 Customer Demographics
The Team collected a standard battery of demographic and housing characteristics that help to
assess the nature of the sample. Due to the use of different sampling strategies across the four
years17
, the team we present the unweighted demographic data across the four years. The results
suggest very similar demographic characteristics of respondents across the surveys.
8.1 Housing Characteristics
The majority of respondents in all four years resided in single-family detached homes or single-
family attached homes (Table 8-1). The percentage of single-family homes is higher than in the
Massachusetts Census in all four years.
Table 8-1: Type of Home
(Base: All Respondents)
Type of home Massachusetts
Census 2009 2010 2011 2012
Sample size 2,520,419 503 381 582 604
Single-family detached house 52% 68% 65% 64% 64%
Single-family attached house
(townhouse, row house, or duplex) 5% 15%** 13% 14% 12%
Apartment building with 2-4 units 21% 6% 9% 10% 11%
Apartment building with 5 or more
units 21% 8% 11% 10% 12%
Mobile home or house trailer 1% 1% 1% <1% <1%
Other 0% 1% 1% 1% 2%
Don‘t know/Refused - 1% - <1% <1%
* Total occupied housing units
** Duplexes counted with single-family attached in 2009, but with all two-to-four unit buildings in 2010, which is
more in keeping with Census reporting.
17
The 2009 survey relied on a random digit dial survey of all landlines, while the 2010 survey also relied on a
random digit dial approach but of both landlines and cell phone lines. The 2011 and 2012 studies drew respondents
from the PAs‘ customer lists.

Massachusetts Lighting Consumer Survey Report Page 48
NMR
Respondents living in houses also revealed the decade in which their home was built. As in
previous years, the largest percentage of homes in 2012 was built before 1930, but the homes in
the survey samples still tend to be somewhat holder than those in the state overall (Table 8-2).
Table 8-2: Decade in Which Home was Built
(Base: Those living in single-family houses)
Decade Massachusetts
Census 2009 2010 2011 2012
Sample size 2,520,419 409 296 458 456
1930s or earlier 35% 26% 31% 25% 24%
1940s 6% 7% 4% 5% 4%
1950s 12% 13% 14% 13% 15%
1960s 11% 9% 10% 13% 14%
1970s 12% 11% 10% 11% 11%
1980s 11% 13% 13% 11% 13%
1990s 8% 12% 7% 9% 7%
2000 or later 7% 6% 9% 9% 9%
Don‘t know/Refused - 3% 3% 2% 2%
* Total occupied housing units
Just over three out of four respondents indicated being the owners of their homes in 2012, while
the remaining 23% rented or leased (Table 8-3). These results are not that different from 2009,
when we surveyed an even greater proportion of owners (82%), or from 2010 when the inclusion
of a cell-phone sample contributed to a slightly larger sample of renters (24%).
Table 8-3: Ownership of Home
(Base: All Respondents)
Tenure 2009 2010 2011 2012
Sample size 503 381 582 604
Own/Buying 82% 75% 78% 77%
Rent/Lease 17% 24% 21% 23
Occupied without payment or
rent 0% <1% 0% <1%
Other 0% 0% <1% 0%
Don‘t know/Refused 1% <1% <1% <1%
*Total occupied housing units

Massachusetts Lighting Consumer Survey Report Page 49
NMR
The majority of homes surveyed in 2012 were less than 3,500 square feet (96%) in size (Table
8-4). The greatest single percentage of homes in 2012 fell in the size range of 1,400 to 1,999
square feet.
Table 8-4: Size of Home
(Base: All Respondents)
Square Feet 2009 2010 2011 2012
Sample size 350 273 441 517
Less than 1,400 24% 34% 32% 32%
1,400 – 1,999 28% 25% 29% 36%
2,000 –2,499 19% 19% 17% 15%
2,500 – 3,499 16% 14% 15% 13%
3,500 – 3,999 3% 5% 4% 2%
4,000 – 4,999 3% 2% 2% 1%
5,000 or more 6% 2% 2% 2%
Don‘t know/Refused (sample size) 153 108 141 87
The numbers of rooms in respondents‘ homes are shown in Table 8-5. The most common
number of rooms per home in 2012 was evenly split between five and six (17% each), with a
slightly higher percentage of homes with five rooms instead of six, as in the other samples.
Table 8-5: Rooms in Home
(Base: All Respondents)
Total Rooms Massachusetts
Census 2009 2010 2011 2012
Sample size 2,520,419* 503 381 582 604
1 2% <1% 3% 1% 1%
2 3% 1% 2% 2% 1%
3 10% 4% 8% 7% 9%
4 15% 7% 9% 11% 11%
5 18% 14% 14% 14% 17%
6 18% 24% 20% 19% 17%
7 13% 17% 15% 14% 14%
8 10% 11% 12% 11% 14%
9 12%**
8% 9% 8% 6%
10 or more 12% 7% 12% 9%
Don‘t know/Refused - 2% <1% 1% 1%
*Total occupied housing units
** The ACS reports only 9 or more rooms.

Massachusetts Lighting Consumer Survey Report Page 50
NMR
8.2 Social Attributes
Respondents in 2012 tended to hold a Bachelor‘s degree or higher (57%), which is equivalent to
the 2009 and 2010 samples, but lower than the 2011 sample (Table 8-6).
Table 8-6: Highest Level of Education
(Base: All Respondents)
Degree Attained 2009 2010 2011 2012
Sample size 503 582 582 604
Less than high school
graduate 3% 3% 2% 2%
High school graduate
(Includes GED) 16% 15% 15% 17%
Some college or associates
degree 20% 25% 21% 23%
Bachelors degree or higher 57% 56% 61% 57%
Don‘t know/refused 3% 1% 2% 1%
*Population 25 years and over
The 2012 respondents were more likely to live alone than were respondents in 2011 (Table 8-7).
The most common household size among respondents across the three years was two. This
question was asked differently in 2009, so no comparable data are available for that year.
Table 8-7: Number of Persons Living the Home
(Base: All Respondents)
Number of household members Massachusetts
Census 2010 2011 2012
Sample size 2,520,419* 381 582 604
1 29% 21% 17% 21%
2 32% 37% 37% 39%
3 16% 15% 19% 16%
4
22%**
16% 15% 17%
5 7% 7% 5%
6 or more 3% 5% 1%
Don‘t know/refused - 1% <1% 2%
* Total occupied housing units
** The ACS reports only 4-or-more person household
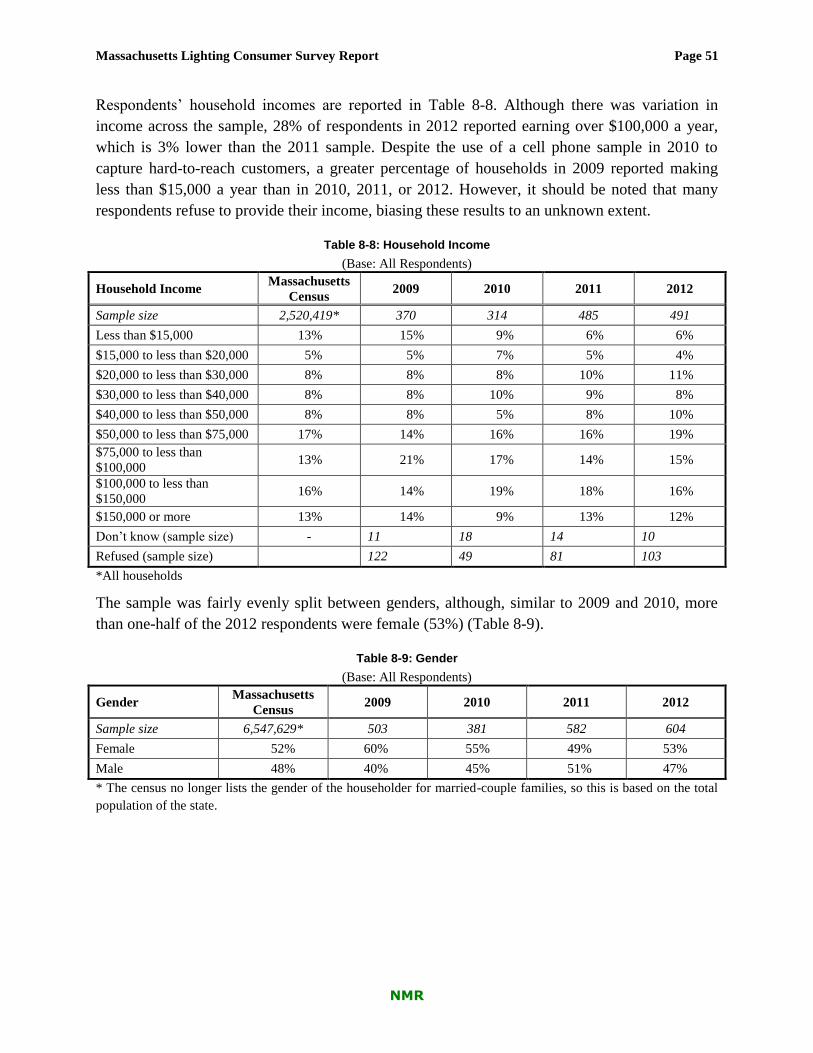
Massachusetts Lighting Consumer Survey Report Page 51
NMR
Respondents‘ household incomes are reported in Table 8-8. Although there was variation in
income across the sample, 28% of respondents in 2012 reported earning over $100,000 a year,
which is 3% lower than the 2011 sample. Despite the use of a cell phone sample in 2010 to
capture hard-to-reach customers, a greater percentage of households in 2009 reported making
less than $15,000 a year than in 2010, 2011, or 2012. However, it should be noted that many
respondents refuse to provide their income, biasing these results to an unknown extent.
Table 8-8: Household Income
(Base: All Respondents)
Household Income Massachusetts
Census 2009 2010 2011 2012
Sample size 2,520,419* 370 314 485 491
Less than $15,000 13% 15% 9% 6% 6%
$15,000 to less than $20,000 5% 5% 7% 5% 4%
$20,000 to less than $30,000 8% 8% 8% 10% 11%
$30,000 to less than $40,000 8% 8% 10% 9% 8%
$40,000 to less than $50,000 8% 8% 5% 8% 10%
$50,000 to less than $75,000 17% 14% 16% 16% 19%
$75,000 to less than
$100,000 13% 21% 17% 14% 15%
$100,000 to less than
$150,000 16% 14% 19% 18% 16%
$150,000 or more 13% 14% 9% 13% 12%
Don‘t know (sample size) - 11 18 14 10
Refused (sample size) 122 49 81 103
*All households
The sample was fairly evenly split between genders, although, similar to 2009 and 2010, more
than one-half of the 2012 respondents were female (53%) (Table 8-9).
Table 8-9: Gender
(Base: All Respondents)
Gender Massachusetts
Census 2009 2010 2011 2012
Sample size 6,547,629* 503 381 582 604
Female 52% 60% 55% 49% 53%
Male 48% 40% 45% 51% 47%
* The census no longer lists the gender of the householder for married-couple families, so this is based on the total
population of the state.
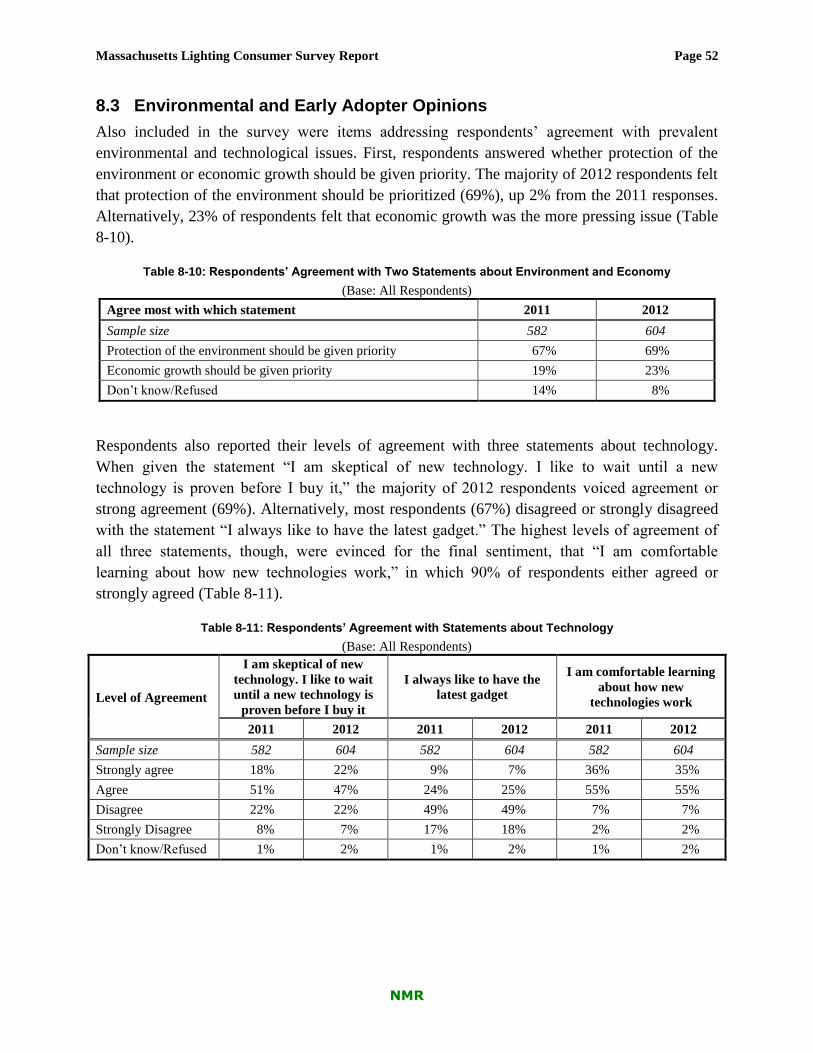
Massachusetts Lighting Consumer Survey Report Page 52
NMR
8.3 Environmental and Early Adopter Opinions
Also included in the survey were items addressing respondents‘ agreement with prevalent
environmental and technological issues. First, respondents answered whether protection of the
environment or economic growth should be given priority. The majority of 2012 respondents felt
that protection of the environment should be prioritized (69%), up 2% from the 2011 responses.
Alternatively, 23% of respondents felt that economic growth was the more pressing issue (Table
8-10).
Table 8-10: Respondents’ Agreement with Two Statements about Environment and Economy
(Base: All Respondents)
Agree most with which statement 2011 2012
Sample size 582 604
Protection of the environment should be given priority 67% 69%
Economic growth should be given priority 19% 23%
Don‘t know/Refused 14% 8%
Respondents also reported their levels of agreement with three statements about technology.
When given the statement ―I am skeptical of new technology. I like to wait until a new
technology is proven before I buy it,‖ the majority of 2012 respondents voiced agreement or
strong agreement (69%). Alternatively, most respondents (67%) disagreed or strongly disagreed
with the statement ―I always like to have the latest gadget.‖ The highest levels of agreement of
all three statements, though, were evinced for the final sentiment, that ―I am comfortable
learning about how new technologies work,‖ in which 90% of respondents either agreed or
strongly agreed (Table 8-11).
Table 8-11: Respondents’ Agreement with Statements about Technology
(Base: All Respondents)
Level of Agreement
I am skeptical of new
technology. I like to wait
until a new technology is
proven before I buy it
I always like to have the
latest gadget
I am comfortable learning
about how new
technologies work
2011 2012 2011 2012 2011 2012
Sample size 582 604 582 604 582 604
Strongly agree 18% 22% 9% 7% 36% 35%
Agree 51% 47% 24% 25% 55% 55%
Disagree 22% 22% 49% 49% 7% 7%
Strongly Disagree 8% 7% 17% 18% 2% 2%
Don‘t know/Refused 1% 2% 1% 2% 1% 2%
Massachusetts Lighting Consumer Survey Report Page 53
NMR
9 Conclusions and Recommendations
Earlier in 2012, the Team delivered the 2011 (first wave) consumer lighting report; this report
described EISA baseline conditions, as the survey coincided with the initial implementation of
the new lighting standards. Currently the PAs and EEAC Consultants are reviewing a revised
draft of the spring 2012 lighting saturation study, which also provided information on residential
lighting use during the early stages of EISA implementation. This report serves as an interim
check-in on the residential lighting market one-half year after the earliest phases of EISA
implementation. Therefore, the team refrains from drawing new conclusions or making
recommendations. Instead, we review the recommendations from the 2011 consumer survey and
the 2012 onsite saturation study in light of the findings from this current report.
Satisfaction with CFLs: The 2011 survey provided evidence that customer satisfaction with
CFLs was declining, while the onsite study demonstrated that, in fact, those dissatisfied with
CFLs used fewer of them—even though they still typically used at least some CFLs. The current
study, in contrast, found that CFL satisfaction was higher in 2012 than in 2011 but remained
below 2009 and 2010 levels. While most survey respondents indicated that their satisfaction with
CFLs had not changed, 18% reported increased satisfaction with CFLs, while 5% said their
satisfaction had decreased. Importantly, news stories about lighting influenced these changing
opinions—both the positive and the negative ones. The Team will continue to explore CFL
satisfaction in the third wave of the consumer survey and in the upcoming 2013 saturation study,
and we continue to recommend that the PAs work with the residential retail products and other
residential evaluation teams as well as program implementers to understand the dynamics of
consumer satisfaction with CFLs and LEDs more fully.
The Team also previously recommended that the PAs continue to work with program partners to
support the highest quality CFLs and LEDs on the market and that the PAs develop educational
materials that highlight the features of LEDs that consistently perform better than CFLs (e.g.,
quickness to brighten, lack of mercury, lifespan) but in a manner that does not denigrate CFLs.
We believe the current study results continue to suggest the relevance of both of these
recommendations.
A-line CFLs: Respondents to both the 2011 and 2012 study reported relatively low levels of
familiarity with A-line CFLs, and use of these bulbs is still uncommon in the homes visited for
the saturation study. However, because A-line bulbs closely resemble incandescents and can fit
into some types of fixtures that standard CFLs cannot (e.g., those in which the shade clips onto
the bulb), NMR recommended in both the 2011 study and the onsite saturation study that the
PAs focus more educational and promotional efforts on A-line CFLs. The team also suggesting
that the PAs consider thinking of them more as a ―standard‖ CFL rather than a specialty one, as
most A-line CFLs will be used in general service and not specialty applications. We believe the
2012 study results support these recommendations.

Massachusetts Lighting Consumer Survey Report Page 54
NMR
Bulb Dimmability: In the 2011 survey results, NMR noted that users of dimmable CFLs
generally tended to like them, but the most persistent complaint about them is that they do not
dim consistently or as much as other types of light bulbs. At that time, we recommended that the
PAs consider removing dimmable CFLs in favor of promoting LEDs for dimmable applications.
However, since making the recommendation, the Team has learned from various sources that
LEDs may have dimmability concerns as well. Therefore, we withdraw the recommendation and
refrain from making new recommendations about dimmable bulbs specifically. However, the
previous recommendation about continuing to promote only the highest quality energy-efficiency
bulbs certainly applies to dimmable energy-efficient bulbs.
Stockpiling of Incandescent Bulbs: The results presented for both the 2011 and 2012 surveys as
well as the onsite saturation effort suggested that about one-fourth of respondents will consider
stockpiling incandescent bulbs, and that some respondents have already started to do so.
Therefore, NMR continues to recommend that the PAs may want to consider placing a consumer
education campaign that helps consumers make more informed bulb choices, rather than simply
defaulting to the incandescent bulb with which they are most familiar. Moreover, as explained in
the onsite study, the PAs may also want to consider asking partner retailers not to repeat ―get
them while you can‖ incandescent bulb campaigns in late 2012 and 2013, as they did in late 2012
before the 100 Watt phase-out started.
Consumer Understanding of Key Lighting Concepts: While consumers are becoming more
familiar with the term ―lumens‖ and understand that it means light output or brightness, they still
buy bulbs based on wattage or wattage equivalence. Therefore, we believe that the suggestion
that the PAs continue their efforts at helping consumers make the transition from thinking about
Watts to thinking about lumens remains relevant.
A-line Halogen Bulbs: Although telephone survey respondents reported relatively high rates of
familiarity with A-line halogen bulbs, the Team found very few of these bulbs in use in onsite
households. Yet, as we noted in the onsite study, A-line halogen bulbs look almost exactly like
incandescent bulbs and it is likely that consumer are unable to distinguish between the two bulb
types in the store. The fact that halogen bulbs are labeled ―energy efficient‖ only adds to
consumer confusion; in fact, the number of consumers familiar with CFLs who identified
halogen and CFLs as using the same amount of energy rose significantly between the 2011 and
2012 studies. Therefore, we believe that our suggestion that the PAs work with other
organizations across the nation to try to convince manufacturers to remove the term ―energy
efficient‖ from halogen packaging remains relevant in light of the current survey results.

Massachusetts Lighting Consumer Survey Report Page A1
NMR
Appendix A Consumer Survey Questionnaire
The 2012 questionnaire follows. Questions highlighted in yellow have been added or
substantially changed from the 2011 survey.
Hello, my name is _______________ and I am calling from Tetra Tech on behalf of (PA). We are conducting a survey
about household lighting. I‘m not selling anything. I just want to ask you some questions about lighting in your home.
May I please speak with [INSERT NAME ON THE ACCOUNT].
[IF ACCOUNT HOLDER ISN‘T AVAILABLE, READ] Is there an adult over the age of 18 available who is
responsible for purchasing the light bulbs for your household? [IF NOT AVAILABLE, TRY TO RESCHEDULE AND
THEN TERMINATE]
[IF NECESSARY, OFFER THE CONTACT NAME FROM BELOW AS THE PERSON TO CONTACT WITH ANY
QUESTIONS ABOUT THE VALIDITY OF THE RESEARCH.]
Philip Moffitt Cape Light Compact 508-744-1279
Wendy Todd National Grid (NGrid/Massachusetts Electric) 781-907-2232
Matt Nelson NSTAR Electric 781-441-3456
Tony Fornuto Western Massachusetts Electric Company (WMECO/Northeast Utilities) 413-787-9329
Lisa Glover Unitil (Fitchburg Gas and Electric) 603-773-6483
AWARENESS OF ENERGY-SAVING LIGHT BULBS
S1. Before this call today, had you ever heard of Compact fluorescent light bulbs or
CFLs?
1. Yes
2. No
96. DON‘T KNOW
97. REFUSED
[ASK S2 IF S1 = 2, 96, 97 OTHERWISE, SKIP TO S3.]
S2. Compact fluorescent light bulbs – also known as CFLs – usually do not look like regular
incandescent bulbs. The most common type of compact fluorescent bulb is made with a
glass tube bent into a spiral, resembling soft-serve ice cream, and it fits in a regular light
bulb socket. Thinking about it again, before today, had you heard of CFLs?
1. Yes
2. No
96. DON‘T KNOW
97. REFUSED
Massachusetts Lighting Consumer Survey Report Page A2
NMR
[ASK S3 IF S1 =1 OR S2=1, OTHERWISE SKIP TO S4].
S3. How familiar are you with CFLs? Would you say that you are…?
1. Very familiar
2. Somewhat familiar
3. Not too familiar
4. Not at all familiar
96. DON‘T KNOW
97. REFUSED
S4. Another type of light bulb that is used in homes is called an L-E-D [SAY THE
LETTERS L-E-D], also known as a light emitting diode bulb. These bulbs have regular
screw bases that fit into most sockets. They are not battery-operated LEDs, holiday lights,
or decorative strands and do not need special attachments to work in regular sockets.
How familiar are you with LED light bulbs that screw into regular light sockets? Would
you say that you are…?
1. Very familiar
2. Somewhat familiar
3. Not too familiar
4. Not at all familiar
96. DON‘T KNOW
97. REFUSED
S5. Another type of light bulb is a halogen bulb. These bulbs have regular screw bases that fit
into most sockets; they do not need special attachments to work in regular sockets. How
familiar are you with halogen bulbs that screw into regular light sockets? Would you say
that you are…?
1. Very familiar
2. Somewhat familiar
3. Not too familiar
4. Not at all familiar
96. DON‘T KNOW
97. REFUSED

Massachusetts Lighting Consumer Survey Report Page A3
NMR
S6. [IF S5=1 OR 2 AND S3=1 OR 2; OTHERWISE SKIP TO S7] As far as you know,
which type of bulb uses less energy to produce light—[RANDOMIZE AND READ:
―compact fluorescent light bulbs‖ or ―halogen bulbs‖]—or do both bulbs use about the
same amount of energy? [USE SAME RANDOM ORDER PREVIOUSLY USED IN
THE QUESTION; ACCEPT ONE RESPONSE.]
1. Compact fluorescent lightbulbs use less energy
2. Halogen bulbs use less energy
3. Both bulbs use about the same amount of energy
96. DON‘T KNOW
97. REFUSED
S7. [ASK IF S3 = 1, 2, 3 OTHERWISE SKIP TOEISA1.] While most CFLs are spiral
shaped, CFLs also come in other shapes and some have special features. I‘m going to
read you a list of different types of CFLs. For each type, please tell me if you are very
familiar, somewhat familiar, not too familiar, or not at all familiar with that type of CFL.
[RANDOMIZE ORDER OF A THROUGH F]
[READ IF NECESSARY WITH EACH ITEM] Are you very familiar, somewhat
familiar, not too familiar, or not at all familiar with this type of CFLs?
a. Dimmable CFLs. This refers to a CFL that can be used with a dimmer switch to adjust
the level of brightness
b. 3-way CFLs. This refers to a CFL that has the ability to shine at 3 different levels of
brightness in a 3-way lamp
c. Flood or recessed lighting CFLs—shaped like a regular incandescent floodlight
d. Candelabra CFLs. This refers to a CFL with a small base for use in a decorative fixture,
such as a chandelier.
e. Globe CFLs. This refers to a CFL that has a round shape and might be used in a fixture,
such as a vanity light
f. A-shaped CFLs. This refers to a covered CFL that is made to look and feel like a
traditional incandescent or regular light bulb.
1. Very familiar
2. Somewhat familiar
3. Not too familiar
4. Not at all familiar
96. DON‘T KNOW
97. REFUSED

Massachusetts Lighting Consumer Survey Report Page A4
NMR
S8. [IF S7a=1 or 2; OTHERWISE SKIP TO EISA1] Do you currently use any dimmable
CFLs in your home?
1. Yes
2. No
96. DON‘T KNOW
97. REFUSED
EISA Awareness & Future Expectations
EISA1. Have you seen or read any news stories in the past year about light bulbs?
1. Yes [CONTINUE]
2. No [SKIP TO EISA3]
96. DON‘T KNOW [SKIP TO EISA3]
97. REFUSED [SKIP TO EISA3]
EISA2. [IF EISA1=1] What do you remember seeing or reading in the stories about light bulbs?
1. [RECORD VERBATIM] 96. (DON‘T KNOW)
97. (REFUSED)
EISA3. A new federal law, the Energy Independence and Security Act of 2007, restricts the sale
of 100 Watt incandescents, or regular 100 Watt bulbs, manufactured after January 1,
2012. Had you heard about this new federal law before this call?
1. Yes
2. No
96. DON‘T KNOW
97. REFUSED
EISA4. Do you currently use any 100 watt incandescent light bulbs in your home?
1. Yes
2. No
96. DON‘T KNOW
97. REFUSED
EISA5. [IF EISA4 = 2] Why don‘t you currently use any 100 watt incandescent light bulbs in
your home? [DO NOT READ RESPONSES; MULTPLE RESPONSE]

Massachusetts Lighting Consumer Survey Report Page A5
NMR
1. (They are too bright)
2. (They use too much energy)
3. (My socket says only to use a certain watt bulb/fixtures won‘t take such high wattage)
4. (Switching over to energy efficient bulbs)
5. (Switching over to lower wattage bulbs)
6. (Other [SPECIFY])
96. DON‘T KNOW
97. REFUSED
EISA6. [IF EISA4 NE 1] Do you currently use ANY incandescent light bulbs, of any wattage, in
your home?
1. Yes
2. No
96. DON‘T KNOW
97. REFUSED

Massachusetts Lighting Consumer Survey Report Page A6
NMR
EISA7. [READ ONLY IF EISA4 NE 2] We are interested to know the type of bulb you would
be likely to use instead of a 100-watt incandescent bulb once this is no longer available
for purchase. I‘m going to name different types of bulbs that may be options and after I
read the list, I‘d like you to tell me which one you would be most likely to use instead of
the 100-watt incandescent bulb. [READ ONLY IF EISA4=2] We understand that you
do not currently use any 100 Watt incandescent bulbs, but please tell me which of the
following bulb types you would be most likely to use.
The options are [READ ENTIRE LIST BASED ON INSTRUCTIONS BELOW].
THEN IMMEDIATELY ASK: Which one of these bulbs would you be most likely to
use [READ ONLY IF EISA4 NE 2] instead of the 100-watt incandescent?
[PROGRAMMER: RANDOMIZE LIST. INCLUDE 2 IN LIST ABOVE AND IN
THE ACCEPTABLE RESPONSES ONLY IF S5=1 OR 2; SIMILARLY,
INCLUDE 3 ONLY IF S3=1 OR 2 and Answers Yes at S1 or S2, AND INCLUDE 4
ONLY IF S4=1 OR 2]
BULB TYPES
1. A lower wattage incandescent bulb
2. A 72 Watt screw-in halogen bulb meant to replace a 100 watt bulb
3. A 23 Watt screw-in compact fluorescent bulb meant to replace a 100 watt
incandescent bulb
4. A 17 Watt screw-in LED [SAY THE LETTERS L-E-D] or light-emitting
diode bulb meant to replace a 100 watt incandescent bulb
5. A 150 watt incandescent bulb
96. DON‘T KNOW [ONLY ALLOW FOR ENTIRE QUESTION]
97. REFUSED [ONLY ALLOW FOR ENTIRE QUESTION]

Massachusetts Lighting Consumer Survey Report Page A7
NMR
EISA8. You said you would be most likely to instead use [IF EISA7=1 READ: a lower wattage
incandescent bulb]/[EISA7=2 READ: a 72 Watt screw-in halogen bulb][IF EISA7=3
READ: a 23 Watt screw-in compact fluorescent bulb]/[IF EISA7=4 READ: a 17 Watt
screw-in LED bulb]/[IF EISA7=5 READ: a 150 watt incandescent bulb)]. Why that
bulb?
1. [RECORD VERBATIM] 96. DON‘T KNOW
97. (REFUSED)
EISA9. How likely are you to buy extra 100 Watt incandescent light bulbs and save them for use
now that the federal law has gone into effect? Would you say you are . . . [READ
LIST]. [RECORD ONE ANSWER]:
1. Very likely
2. Somewhat likely
3. Somewhat unlikely, or
4. Very unlikely to buy and save 100 Watt incandescent light bulbs for use?
96. DON‘T KNOW
97. REFUSED
[ASK CFL USE AND SATISFATION IF S3 = 1, 2, 3, OTHERWISE SKIP TO AT1
Alternative Lighting Technologies Section.]
CFL USE AND SATISFACTION
USE1. Have you EVER used a compact fluorescent light bulb, or CFL, on the interior or exterior
of your home?
1. Yes
2. No
96. DON‘T KNOW
97. REFUSED
[IF USE1= 2, 96, 97, SKIP TO INTRO PRECEDING AT1 Alternative Lighting
Technologies Section]

Massachusetts Lighting Consumer Survey Report Page A8
NMR
USE2. Approximately how long ago did you FIRST use a compact fluorescent light bulb?
[RECORD NUMBER OF YEARS OR MONTHS, NOT A RANGE. IF LESS THAN
ONE YEAR, RECORD MONTHS.
IF ―DON‘T KNOW,‖ PROBE: Is it less than or more than five years ago? WORK
FROM THERE TO GET AN ESTIMATE.
ENTER 96 FOR MONTHS AND YEARS IF STILL ―DON‘T KNOW.‖
ENTER 97 FOR MONTHS AND YEARS IF REFUSED.]
1. Months ________
2. Years ________
96. DON‘T KNOW
97. REFUSED
USE3. Do you CURRENTLY have CFLs installed on the interior or exterior of your home?
1. Yes
2. No
96. DON‘T KNOW
97. REFUSED
USE4. [IF USE1 = 1 AND USE3=2] Why do you no longer have CFLs installed on the interior
or exterior of your home?
1. [RECORD VERBATIM] 96. (DON‘T KNOW)
97. (REFUSED)
USE5. How satisfied are you with the compact fluorescent light bulbs currently in your home or,
if you have no CFLs installed right now, the ones you have used in the past? Would you
say you are….?
1. Very satisfied
2. Somewhat satisfied
3. Neither satisfied nor dissatisfied
4. Somewhat dissatisfied
5. Very dissatisfied
96. DON‘T KNOW
97. REFUSED
USE6. Has your level of satisfaction with CFLs increased, decreased, or stayed the same over
the past year?
1. Increased
2. Decreased

Massachusetts Lighting Consumer Survey Report Page A9
NMR
3. Stayed the same [SKIP TO USE10]
96. (DON‘T KNOW) [SKIP TO USE10]
97. (REFUSED) [SKIP TO USE10]
USE7. [IF EISA1=1] Earlier, you mentioned that you had seen or read some news stories about
light bulbs. Did these NEWS STORIES [IF USE6 = 1 READ ―increase‖; IF USE6 = 2
READ ―decrease‖] your satisfaction of CFLs?
1. Yes
2. No
96. (DON‘T KNOW)
98. (REFUSED)
USE8. [IF USE6 = 1] What are the reasons for the increase in your level of satisfaction with
CFLs?
1. [RECORD VERBATIM] 96. (DON‘T KNOW)
97. (REFUSED)
USE9. [IF USE6 = 2] What are the reasons for the decrease in your level of satisfaction with
CFLs?
1. [RECORD VERBATIM] 96. (DON‘T KNOW)
97. (REFUSED)
USE10. In your experience, what do you like about compact fluorescent light bulbs? [DO
NOT READ; SELECT ALL THAT APPLY]:
1. (Save energy)
2. (Save money on bills)
3. (Good quality)
4. (Help environment)
5. (Longer bulb life)
6. (Other [SPECIFY])
7. (Do not like anything about them)
96. (DON‘T KNOW)
97. (REFUSED)

Massachusetts Lighting Consumer Survey Report Page A10
NMR
USE11. [IF S7a=1 or 2; OTHERWISE SKIP TO USE12] Previously you said that you
are familiar with dimmable CFLs. Is there anything that you do NOT like about
dimmable CFLs? [DO NOT READ; SELECT ALL THAT APPLY]
1. (Do not dim to low light levels/Do not dim as low as incandescents)
2. (When dimmed with other CFLs, light LEVEL/BRIGHTNESS is not the same for all
bulbs)
3. (When dimmed with other CFLs, light COLOR is not the same for all bulbs)
4. (Poor light color)
5. (Not bright enough)
6. (Too bright)
7. (Slow to turn on/brighten)
8. (Flicker)
9. (Buzz)
10. (Poor manufacturing (unspecified))
11. (Shorter bulb life than promised)
12. (Mercury/disposal issues)
13. (Other [SPECIFY])
14. (Nothing I don‘t like about them)
96. (DON‘T KNOW)
97. (REFUSED)
USE12. Is there anything that you do NOT like about [IF S7A = 1 or 2 SAY: ‗Other
types of‘] compact fluorescent light bulbs? [DO NOT READ; SELECT ALL THAT
APPLY]
1. (Poor light color)
2. (Poor light output)
3. (Not bright enough)
4. (Too bright)
5. (Slow to turn on/brighten)
6. (Flicker)
7. (Buzz)
8. (Poor manufacturing (unspecified))
9. (Shorter bulb life than promised)
10. (Mercury/disposal issues)
11. (Other [SPECIFY])
12. (Nothing I don‘t like about them)
96. (DON‘T KNOW)
97. (REFUSED)

Massachusetts Lighting Consumer Survey Report Page A11
NMR
ALTERNATIVE LIGHTING TECHNOLOGIES
[ASK AT1 IF S4= 1, 2, OR 3; [IF S4= 4, 96, 97 SKIP TO INTRO PRECEDING BUY1
Recent Lighting Purchases Section]
I‘d like to ask you a few questions about your use of other types of light bulbs.
AT1. Are you currently using L-E-D screw in bulbs in your home—the kind that screw into
regular light fixtures?
1. Yes
2. No
96. DON‘T KNOW
97. REFUSED
AT2. [IF AT1=1] In what types of fixtures or lamp do you have screw-in L-E-D bulbs installed
in your home? Again these are only the LEDs that screw into regular light sockets. [DO
NOT READ. ALLOW MULTIPLE RESPONSES]
1. [IF R SAYS THEY INSTALLED IT IN A PARTICULAR ROOM, PROBE TO
FIND OUT WHAT TYPE OF FIXTURE OR LAMP THE BULB IS
IN](Ceiling/overhead lighting )
2. (In an appliance)
3. (General lighting/Wherever I can)
4. (Floor/Table/Portable lamps)
5. (Ceiling fans with lighting )
6. (Holiday lighting/Candle)
7. (Outdoor)
8. (Other) [SPECIFY]
96. (DON‘T KNOW)
97. (REFUSED)
RECENT LIGHTING PURCHASES
Now I have a few questions about how you usually buy light bulbs.
BUY1. [IF EISA4=2 OR EISA6=2, READ ―Previously you told us that you don‘t currently use
[IF EISA4 = 2 = ―100 Watt‖] incandescent bulbs, but…] Have you looked for 100 Watt
incandescent bulbs, or regular 100 Watt bulbs, at any retailers in the past three months,
even if you did not buy any?
1. Yes [CONTINUE]
2. No [SKIP TO BUY8]
96. DON‘T KNOW [SKIP TO BUY8]
97. REFUSED [SKIP TO BUY8]

Massachusetts Lighting Consumer Survey Report Page A12
NMR
BUY2. [IF BUY1 = 1] In the past three months, when you looked for 100 watt incandescent
bulbs, did you find any on the shelves?
[IF NEEDED, PROBE: ―‖In the past 3 months, have you been to any store to shop for
100 Watt incandescent bulbs, but could not find any on the shelves‖?]
1. Yes—went to a store and found them on the shelves [SKIP TO BUY5]
2. No—went to a store and could NOT find them on the shelves
96. DON‘T KNOW
97. REFUSED
BUY3. [IF BUY2=2] After not finding 100 Watt incandescents at that store, did you go look for
them at another store, or on the internet?
1. Yes, went to another store
2. Yes, went to look on the internet
3. Yes, both stores and internet
4. No, did not go to another store or look on the internet [SKIP TO BUY8]
96. DON‘T KNOW [SKIP TO BUY8]
97. REFUSED [SKIP TO BUY8]
BUY4. [IF BUY3 = 1, 2, OR 3] Were you able to find 100 Watt incandescent bulbs at those
stores or on the internet in the past three months?
1. Yes, in stores
2. Yes, on internet
3. Yes, both stores and internet
4. No
96. DON‘T KNOW
97. REFUSED
BUY5. [IF BUY4= 1, 2, OR 3 OR BUY2 = 1] Have you purchased any 100 Watt incandescent
bulbs in the past three months?
1. Yes [CONTINUE]
2. No [SKIP TO BUY7]
96. DON‘T KNOW [SKIP TO BUY7]
97. REFUSED [SKIP TO BUY7]

Massachusetts Lighting Consumer Survey Report Page A13
NMR
BUY6. [IF BUY5 = 1] How many 100 Watt incandescent bulbs have you purchased in the past
three months? [RECORD ACTUAL RESPONSE; IF DON‘T KNOW PROBE FOR
BEST GUESS; USE 997 FOR 997 OR MORE, 998 FOR REFUSED, AND 999 FOR
DON‘T KNOW.]
BUY7. Now I'd like to ask you about the type of bulbs you might have bought instead of 100
Watt incandescents.
Have you purchased any light bulbs instead of 100 Watt incandescents in the past three
months?
1. Yes
2. No [SKIP TO BUY8]
96. Don't know [SKIP TO BUY8]
97. Refused [SKIP TO BUY8]
BUY7 A-E. [IF BUY4 = 4 or BUY5 = 2] What type of bulbs did you buy instead of 100
Watt incandescents? [RANDOMIZE RESPONSES A-D THEN E; MULTIPLE
RESPONSE].
A. Incandescent bulbs of another wattage [ASK FOLLOW-UP QUESTION
IMMEDIATELY]
1A. [FOLLOW-UP QUESTION]: What wattage bulbs did you buy instead of the
100 watt incandescent bulbs? [RECORD]
B. Compact fluorescent bulbs or CFLs
C. LED bulbs
D. Halogen bulbs
E. Another kind of light bulb [SPECIFY]
1. Yes
2. No
96. Don't know
97. Refused
BUY8. [IF ANSWERED ―YES‖ TO ANY IN BUY7A-E , SKIP TO BUY8A]. Now I'd like
to ask you about your purchases of other types of light bulbs. Have you purchased any
light bulbs in the past three months?
1. Yes
2. No [SKIP TO BUY9]
96. Don't know [SKIP TO BUY9]
97. Refused [SKIP TO BUY9]

Massachusetts Lighting Consumer Survey Report Page A14
NMR
BUY8 A-E. Have you purchased any of the following types of light bulbs in the past
three months? [RANDOMIZE AND READ A-G THEN H; MULTIPLE
RESPONSE]
A. [SKIP IF (BUY7B = 1) OR (S2 = 2,96, or 97 or if S3=3 or 4)] Compact fluorescent
lamps or CFLs that screw into regular light sockets
B. [SKIP IF (BUY7C = 1) OR (S4=3 or 4)] L-E-Ds that screw into regular light sockets
C. [SKIP IF (BUY7D = 1) OR (S5=3 or 4)] Halogen bulbs that screw into regular light
sockets
D. [SKIP IF (BUY5= 1) OR ( BUY7A=1)] Incandescent or regular light bulbs
E. Pin-based fluorescent tubes that can only be used in fluorescent light fixtures
F. [SKIP IF (S2 = 2,96, or 97) OR (S3=3 or 4)] Pin-based CFLs that can only be used in
special light fixtures
G. [SKIP IF S4=3 or 4] Pin-based L-E-Ds that can only be used in special light fixtures
H. OTHER [SPECIFY]
BUY9. What information do you look for on BULB packaging to help you decide which bulb to
purchase? [DO NOT READ. RECORD VERBATIM ANY RESPONSES THAT DO
NOT FIT PRECODES. ACCEPT MULTIPLE RESPONSES.]
1. (Price)
2. (Lighting Facts/Energy Facts Label)
3. (Wattage)
4. (Watt Equivalency)
5. (ENERGY STAR Label)
6. (UL, or Underwriters Laboratories Label)
7. (Lumens)
8. (CRI, or Color Rendition Index)
9. (Bulb Life)
10. (Dimming)
11. (3-way)
12. (Shape)
13. (Mercury Content)
14. (Color Appearance)
15. (Other) [SPECIFY]
16. (DON‘T KNOW)
17. (REFUSED)
Massachusetts Lighting Consumer Survey Report Page A15
NMR
BUY10. I‘m going to read a list of types of information you might look for on bulb
packaging. You may have already mentioned this, but for each item I read, please tell me
whether or not you have looked for it. [DO NOT SHOW ITEMS 1-13 RECORDED IN
BUY9. RANDOMIZE A-N, THEN READ O. RECORD AS YES/NO FOR EACH.
ACCEPT MULTIPLE RESPONSES.]
A. Price?
B. Lighting Facts Label?
C. Wattage?
D. Watt equivalency?
E. The ENERGY STAR label?
F. The UL, or Underwriters Laboratories Label?
G. Lumens?
H. CRI, or color rendition index?
I. Bulb life?
J. Dimming?
K. 3-Way ability?
L. Certain bulb shape?
M. Mercury content?
N. Color appearance?
O. Anything else I didn‘t already mention?[SPECIFY]
1. Yes
2. No
96. DON‘T KNOW
97. REFUSED
BUY11. [SKIP IF S2 = 2, 96, or 97] Have you noticed the price of CFLs at retailers being
higher, lower, or about the same this year compared to last year?
1. Higher
2. Lower
3. About the same
4. No, haven‘t noticed
96. DON‘T KNOW
97. REFUSED

Massachusetts Lighting Consumer Survey Report Page A16
NMR
BUY12. [IF BUY11=1; OTHERWISE SKIP TO P1] Did the higher price prevent you
from purchasing any CFLs that you considered buying recently?
1. Yes
2. No
96 DON‘T KNOW
97 REFUSED
Lumens & Key Lighting Knowledge
P1. Before today, have you seen or heard of the word ―lumens‖ used in relation to lighting?
1. Yes
2. No [SKIP TO P3]
96 DON‘T KNOW [SKIP TO P3]
97 REFUSED [SKIP TO P3]
P2. What does the word ―lumens‖ mean to you? [DO NOT READ. FILL IN CLOSEST
ANSWER CATEGORY OR RECORD VERBATIM. MULTIPLE ANSWERS
ALLOWED. IF RESPONDENT SAYS ‗LIGHT QUALITY‘, PROBE FOR
EXACTLY WHAT ‗QUALITY‘ THEY MEAN]
1. (Light Output or Brightness)
2. (Light Color)
3. (Same as Watts)
95 (OTHER)[SPECIFY]
96 DON‘T KNOW
97 REFUSED
P3. Have you seen or heard the terms ―warm white‖ and ―cool white‖- as in the color white -
used in relation to lighting?
1. Yes
2. No [SKIP TO E1]
96 DON‘T KNOW [SKIP TO E1]
97 REFUSED [SKIP TO E1]
P4. What do the terms ―warm white‖ and ―cool white‖ - as in the color white -mean to you?
[RECORD VERBATIM. MULTIPLE ANSWERS ALLOWED. IF RESPONDENT
SAYS ‗LIGHT QUALITY‘, PROBE FOR EXACTLY WHAT ‗QUALITY‘ THEY
MEAN]
1. [RECORD VERBATIM] 96. (DON‘T KNOW)
97. (REFUSED)

Massachusetts Lighting Consumer Survey Report Page A17
NMR
ENVIRONMENTAL, EARLY ADOPTER, REASONS FOR USE
E1. Which one of these two statements about the environment and the economy do you most
agree with—[RANDOMIZE AND READ]
1. Protection of the environment should be given priority, even at the risk of limiting
economic growth OR
2. Economic growth should be given priority, even if the environment suffers to some
extent
96. DON‘T KNOW
97. REFUSED
E2. Please tell me if you strongly agree, agree, disagree, or strongly disagree with each of the
following statements. [RANDOMIZE AND READ]
1 Strongly agree
2 Agree
3 Disagree
4 Strongly Disagree
96 DON‘T KNOW
97 REFUSED
a. I am skeptical of new technology. I like to wait until a new technology is proven
before I buy it.
b. I always like to have the latest gadget.
c. I am comfortable learning about how new technologies work.
Massachusetts Lighting Consumer Survey Report Page A18
NMR
CUSTOMER DEMOGRAPHICS
Now I have a few questions for statistical purposes only.
DEM1. What type of home do you live in? Is it a . . .?
1. Single-family detached house
2. Single-family attached house (townhouse, row house, or duplex)
3. Apartment building with 2-4 units
4. Apartment building with 5 or more units
5. Mobile home or house trailer
6. Other (Specify): _______
96. DON‘T KNOW
97. REFUSED
[ASK DEM2 IF DEM1 = 1, 2. OTHERWISE, SKIP TO DEM3.]
DEM2. When was your home built? Please stop me when I get to the appropriate category.
1. 1930s or earlier
2. 1940s
3. 1950s
4. 1960s
5. 1970s
6. 1980s
7. 1990s
8. 2000 or later
96. DON‘T KNOW
97. REFUSED
DEM3. Do you or members of your household own this home or do you rent?
1. Own/Buying
2. Rent/Lease
3. Occupied without Payment or Rent
4. OTHER (SPECIFY): __________
96. DON‘T KNOW
97. REFUSED
Massachusetts Lighting Consumer Survey Report Page A19
NMR
DEM4. Approximately how large is your home? [READ LIST IF NECESSARY]
1. Less than 1,400 square feet
2. 1,400 – less than 2000 square feet
3. 2,000 – less than 2500 square feet
4. 2,500 – less than 3500 square feet
5. 3,500 – less than 4000 square feet
6. 4,000 – less than 5000 square feet
7. 5,000 square feet or more
96. DON‘T KNOW
97. REFUSED
DEM5. How many rooms are in your home, not counting bathrooms?
[HELP RESPONDENTS COUNT ROOMS IF NEEDED, KEEPING TRACK ON A PIECE
OF PAPER OF THE # OF ROOMS AS THEY NAME THEM]
__ RECORD RESPONSE
96. DON‘T KNOW
97. REFUSED
DEM6. What is the highest level of education that the head of household has completed so far?
[READ CATEGORIES, IF NECESSARY.]
1. Less than Ninth Grade
2. Ninth to Twelfth Grade, No Diploma
3. High School Graduate (includes GED)
4. Some College, No Degree
5. Associated Degree
6. Bachelors Degree
7. Graduate or Professional Degree
96. DON‘T KNOW
97. REFUSED
DEM7. Counting yourself, how many people normally live in this household on a full time basis?
Please include everyone who lives in your home whether or not they are related to you
and exclude anyone who is just visiting or children who may be away at college or in the
military.
RECORD NUMBER OF PEOPLE ____
96. DON‘T KNOW
97. REFUSED

Massachusetts Lighting Consumer Survey Report Page A20
NMR
DEM8. Which category best describes your total household income in 2011 before taxes? Please
stop me when I get to the appropriate category.
1. Less than $15,000
2. $15,000 to less than $20,000
3. $20,000 to less than $30,000
4. $30,000 to less than $40,000
5. $40,000 to less than $50,000
6. $50,000 to less than $75,000
7. $75,000 to less than $100,000
8. $100,000 to less than $150,000
9. $150,000 or more
96. DON‘T KNOW
97. REFUSED
DEM9. [INTERVIEWER: DO NOT READ.]
Sex:
1. Female
2. Male

Massachusetts Lighting Consumer Survey Report Page A21
NMR
CFL REFERENCE (source: http://www.energystar.gov/index.cfm?c=cfls.pr_cfls_shapes):
Bulb Image Type of Bulb
Spirals
A-shaped bulbs: Made to look and feel like
traditional incandescents.
Globe: This refers to a CFL that has a round
shape and might be used in a fixture, such as a
vanity light.
Tubed
Candelabra: Small bulbs for use in decorative
fixtures where you can see the light bulb. Often
used in chandeliers
Posts, Capsules, Barrels: Covered post bulbs
for outdoor fixtures; there are also yellow "bug
light" covered posts, designed to keep away
insects.

Massachusetts Lighting Consumer Survey Report Page A22
NMR
Indoor Reflectors: Provide directional light;
recessed ceiling lights or ceiling fans.