master - jet propulsion laboratory uv definitions of abbreviations angstrom gaseous nitrogen...
TRANSCRIPT

I
5101-131 Low-Cost Solar Array Project
<" - -- • .~ ' t" ...
DOE/JPL-1012-49 Distribution Category UC-63b
MASTER
Photovoltaic Module Soiling Studies May 1978- October 1980
A. R. Hoffman C. R. Maag
November 1, 1980
Prepared for
U.S. Department of Energy
Through an agreement with National Aeronautics and Space Administration
by Jet Propulsion Laboratory California Institute of Technology Pasadena, California
(JrL rUBLICATION 00-07)
/ ., ' u
•• 1 !.., lJc,I..it>IITE_D

DISCLAIMER
This report was prepared as an account of work sponsored by an agency of the United States Government. Neither the United States Government nor any agency Thereof, nor any of their employees, makes any warranty, express or implied, or assumes any legal liability or responsibility for the accuracy, completeness, or usefulness of any information, apparatus, product, or process disclosed, or represents that its use would not infringe privately owned rights. Reference herein to any specific commercial product, process, or service by trade name, trademark, manufacturer, or otherwise does not necessarily constitute or imply its endorsement, recommendation, or favoring by the United States Government or any agency thereof. The views and opinions of authors expressed herein do not necessarily state or reflect those of the United States Government or any agency thereof.

DISCLAIMER
Portions of this document may be illegible in electronic image products. Images are produced from the best available original document.

5101-131 Low-Cost Solar Array Project
DOE/JPL-1012-49 Distribution Category UC-63b
Photovoltaic Module Soiling Studies May 1978- October 1980 A. R. Hoffman C. R. Maag
November 1, 1980
Prepared for
U.S. Department of Energy
Through an agreement with
\
National Aeronautics and Space Administratio11
by
Jet Propulsion Laboratory California Institute of Technology Pasadena. California
(JPL PUBLICATION 80-87)
.---------DISCLAIMER---------,
This boOk was prepared as an account of work sponsored l;lv en oc;encv of the United State.<; GnvmnmMr Neither the United Stat~ Government nor any ogency thereof, nor any of their employees, mal;esanv warranty, express or implied, or assumes any legal liability or responsibility for the accuracy, completeness, Of usefulness of anv information, apparatus, product, or process disclosed, or representS that its use v.ould not infringe privately owned rights. Reference he1ein to any specific
'commercial product, process. or service by trade name, trademark, manufacturer, or otherwise, does not necessarily constitute or imply its endorsement, recommendation. or favoring by tho United States Government or any agency tnereot. 1 ne v1ews and opinions of authors oxpresse<l herein do not necessarily state or reflect those of tho United States Government or any ogency thereof.

Prepared by the Jet Propulsion Laboratory, California Institute of Technology, for the Department of Energy through an agreement with the National Aeronautics and Space Administration.
The JPL Low-Cost Solar Array Project is sponsored by the Department of Energy (nOE) and forms part of the Photovoltaic Energy Systems Program to initiate a major. effort toward the development of low-cost solur arrays ..
This· report was prepared as ~n account of work sponsored by the United States Government. Neither the United States nor the United States Department of Energy, nor any of their employees, nor any of their contractors, subcontractors, or their employees, makes any warranty,. express or implied, or assumes any legal liability or responsibility for the accuracy, completeness or usefulness of any information, apparatus, product or process disdoserl, or represents that its use would not infrine~ privatelY owned ri~hts.
Reference herein. to any specific commercial product, process, 01
service by trade name, trademark, manufacturer, or otherwise, does not necessarily ~~n~titult! or imply it!i endorsement, recormnendation, or favnr•ne by ~he United SLale~ Gov~rnmcnt or ~ny ~sPnry thereof. The views aml opinions of .::~:uthors '='XflrP.~sed herein dO not II~L:t::"b5dl i.ly si..ate or re:tlcct ..:host:" uf tlu1. United St~~et (:nuPrnmPnt nr any ~g~ncy
thereof,

ABSTRACT
The retention of particulate contamination on the surface of flat-plate photovoltaic devices is adversely affecting electrical performance of outdoor-exposed modules. This report describes the results of an experimental study being performed by the Jet Propulsion Laboratory's Low-Cost Solar Array Project to characterize and understand the effects of outdoor contaminants on sensitive optical surfaces o·f flat-plate photovoltaic modules and cover materials.
Comparative electrical and optical performance data from photovoltaic modules and materials subjected to outdoor exposure at field test site~ throughout the United States have been collected and examined. The results show significant time- and site-dependence. During periods when natural removal processes do not dominate, the rate of particulate contamination accumulation appears to be largely material-independent. The effectiveness of natural removal processes, especially rain, is strongly material-dependent. Glass and acrylic top-cover materials retain fewer particles than silicone rubber does. Side-by-side outdoor exposure testing for long duration is presently the most effective means of evaluating soiling differences between materials. Changes in spectral transmission as a function of time and location and -limited scattering data are presented.
iii

\ ..
THIS PAGE.
WAS INTENTIONALLY
LEFT BLANK
·r

ACKNOWLEDGMENTS
This task report presents the results of one phase of research conducted in the Applied Mechanics Division of the Jet Propulsion Laboratory, California Institute of Technology, and was sponsored by the U. S. Department of Energy (DOE), through an agreement with the National Aeronautics and Space Administration (NASA). Many JPL people have supported these efforts. Special acknowledgement is given to A. Wilson, H. Schneider, W. Neiderheiser, F. Morelli, A. Garcia, W. Carroll, E. Cuddihy, and P. Jaffe. S. Forman, Massachusetts Institute of Technology Lincoln Laboratories (MIT/LL), Lexington MA, and A. Forestieri, NASA Lewis Research Center, have kindly provided field data from their test sites. M. Lind and T. Stewart, Battelle's Pacific North,west Laboratories, Richland WA, under contract to DOE, have provided reflectance, transmittance, and scattering information on a set of material samples submitted from two test sites. S. Witz and E. Camarena of California's South Coast Air Quality Management District have provided testing sites in Pasadena and Torrance, California, and air pollution information. The following organizations have provided testing stations in their locales: Battelle's Pacific Northwest Laboratories, Sandia Laboratories, Albuquerque NM, MIT/LL, and New York University.
v

A
I-V
JPL
LSA
p
Pmax
psig
RNHT
SCAQMD
SEM
uv
DEFINITIONS OF ABBREVIATIONS
Angstrom
Gaseous nitrogen
Current-voltage
Short-circuit current
Jet Propulsion Laboratory
Low-Cost Solar Array Project
Power
Maximum power
Pounds per square inch, gauge
Relative normal hemispherical transmittance
South Coast Air Quality Management D1strict (comprises four Southern California counties), a state agency
Scanning electron m1croscope
Ultraviolet
vi

CONTENTS
I. INTRODUCTION . • • 1
II. FIELD SOILING EXPERIMENTS: DESCRIPTION AND RESULTS • 3
A. MODULE FIELD DATA • • . 3
B. MATERIALS FIELD DATA 8
III. LABORATORY SOILING EXPERIMENTS: DESCRIPTION AND RESULTS 17
IV. DUST ASSESSMENT STUDIES • 23
v .. CONCLUSIONS . 27
VI. RECOMMENDATIONS 29
REFERENCES . • • • . . • • • . • . . . . . . • . . . . • . • • . . . . • R-1
APPENDIXES
A.
B.
Figures
1.
2.
3.
4.
5.
6.
MODULE SOILING DATA . .
MATERIALS SOILING DATA
Electrical Performance Degradation of Modules During Rain-Free Periods in Pasadena CA (1978) ...••••.
Module Soiling Without Cleaning: Pasadena CA .
Material Samples at SCAQMD Air Monitoring Site, Pasadena CA . . • • . • • . . • • • .
Relative Normal Hemispherical Transmittance Measurement Apparatus . . . . . . . •
Relative Transmission of Materials at SCAQMD Site, Pasadena CA
Some Outdoor Exposure Sites and a Typical Sample Test Rack
vii
A-1
B-1
6
6
10
10
11
13

7.
8.
9.
10.
11.
12.
13.
14.
15.
16.
17.
Tables
1.
2.
3.
4.
5.
6.
Percentage Loss in RNHT of Materials Exposed at Two Locations
Three-Layer Soiling Mechanism
Experimental Particle Deposition Chamber
Laboratory Minimodule Dust Test Sequence
Tapping Step
Vacuuming Step
Smogging Step •
Wind-Removal Simulation
Relative Retention of Particles on Module Surfaces in Laboratory and Field Tests • • • •
Particle Identification using Scanning Electron Microscopy ann EnP.rgy-Dispersive Spectroscopy •
SEM Photographs of Particles Deposited on RTV 615 Samples •••••••••• - •••
Relationship of the Climatological-Pollution Classification of Various Field Sites to the Performance of Flat-Plate Modules Fabricated with Different Top Covers •••••••••
Phase II· Outdoor Exposure Materials
Severity of Dust and Dirt Accumulation: Pasadena SCAQMD Site
Initial Dust Test Results •
Representative Percentages of Total Suspended Particulate Matter in Urban Areas •
Characterization of Soil Samples •••.••• :
viii
14
15
19
19
20
20
20
20
22
24
25
7
11
14
17
23
26

SECTION I
INTRODUCTION
As part of the national Photovoltaic Energy Systems Program, flat-plate photovoltaic modules have been exposed to outdoor weathering environments at several diff~rent application and test sites throughout the country during the last four years. One of ·the most significant causes of electrical performance degradation during that exposure has been the soiling of optical surfaces by airborne particulate matter, which causes significant optical loss by absorbing and scattering incident light. Performance degradation up to 60% has been r~ported at some outdoor sites in the United States (Reference 1). Soiling is the most pronounced cause, but it is not the only mechanism that can cause electrical performance loss resulting from the disruption of the light path to the solar cells. Other mechanisms that may contribute to optical-path degradation through the module encapsulant include: absorption of solar ultraviolet radiation, adsorption of moisture, temperature rises or temperature cycling, oxidation, chemical reaction with pollutants, interaction of the cover with dust particles, or two or more of these weathering elements acting synergistically. An earlier task report by A. Gupta (Reference 2) has addressed the photodegradation of encapsulant materials, which may be caused by solar UV acting alone (photolysis), solar UV and oxygen acting together (photooxidation), or solar UV and moisture acting together (photohydrolysis).
This report covers module-soiling investigations performed between May 1978 and October 1980 by the Engineering Area of the Low-Cost Solar Array Project (LSA) of the Jet Propulsion Laboratory (JPL), with the cooperation of LSA's Operations Area and Encapsulation Task, Technology Development Area. The investigations, which are ongoing, have the following objectives:
(1) Compile a data base from field-exposed modules and materials.
(2) Identify key physical properties of optical materials that govern soil retention.
(3) Develop technically sound test methods for evaluation of encapsula.nt materials.
(4) Develop simple laboratory tests for estimating the soiling affinities of various optical surface.materials.
(5) Set preliminary guidelines for selection of materials to be exposed to dirt or dust or both.
This report describes the results of those efforts to date and provides a reference source of available experimental data.
l

. '
. ·: i. , . . .:.'· ·.. '
.· .. :
: -TH'IS:·P·AG;E.: .. ·.,_ .. -·.-· · WAS.·INTENTlON-ALLY
LEFT BLANK
.. -· . - ..... - ..,... .... _ .. ·- ... - ~
SECTION II
FIELD SOILING EXPERIMENTS: DESCRIPTION AND RESULTS
A. MODULE FIELD DATA
Since 1976 three organizations in the photovoltaic program (NASA Lewis Research Center, Massachusetts Institute of Technology Lincoln Laboratory, and the Jet Propulsion Laboratory) have placed flat-plate modules· in outdoor exposure sites throughout the country. Some results of those field experiments have been published (References 3 through 7). Included in these reports were tabulations of·the effects of dirt on the electrical performance of the modules. The compilation and an~lysis of existing photovoltaic soiling data (i.e., development of a data base) were initial efforts in these investigations. The source materials for the data base were the referenced reports and additional information obtained directly from cognizant personnel.
Since the soiling data were· obtained from different organizations ·with various performance measurement and reporting techniques, the information had to be analyzed carefully so that meaningful comparisons and interpretations could be made. Specifically, compilation difficulties resulted from differences in the accuracy of performance measurements and differences in soiling degradation calculations and reporting methods. The technique used to measure electrical performance degradation of a photovoltaic module is to obtain current-voltage (I-V) curves and compare the electrical characteristics, e.g., maximum power (Pmax), short-circuit current (Isc), open-circuit voltage (V0 c), fill factor, etc. with previous conditions. There are two methods commonly used to obtain I-V curves on flat-plate modules: irradiation by solar simulation, specifically larg~-area pulsed solar simulators (LAPSS), and irradiation by natural sunlight. The majority of the module soiling data utilized in this report is based on I-V curves obtained using solar simulation.
Performance degradation due to soiling is typically reported as a percentage of change from a prior condition. For example, for array subsystem performance evaluation the percentage of change in Pmax from the initial condition (i.e., before deployment) to that several months after deployment is
. fr~quently reported. Some investigators (References 4 through 6) prefer to report the percentage of change in Pmax or in Isc between pre-cleaning and post-cleaning conditions. Typical cleaning procedures used by these organizations are:
(1) NASA Lewis Research Center:
A solution of Alconox-Tide is prepared and is applied with a scrub cloth; this is followed by light hand scrubbing until the scrub cloth appears clean. The mnchiles are rinsed well with tap water and then dried.

(2) MIT/Lincoln Laboratory:
A solution of Alconox is prepared and is applied with a sponge or a washcloth. (At the Mead NB site it is applied with a soft bristle brush, which is followed by light hand scrubbing.) The modules are rinsed with tap water, using a hose. A squeegee is used for drying.
(3) Jet Propulsion Laboratory:
Modules are thoroughly rinsed with tap water. A cleaning solution of Franklin Formula 707 heavy duty water-based degreaser (62.25 cc per liter of water) is applied with a sponge. For badly soiled modules a bug sponge is used. The modules are then rinsed and dried with a squeegee and thoroughly wiped with a chamois. Modules at the JPL site are washed weekly. Modules at the other sites are washed at the time of physical and electrical inspection.
With certain types of materials (e.g. silicone rubbers), distinguishing among removable dirt, permanently adhered dirt, and material obscuration because of aging is not necessarily straighttorward. This llas led to the dcve·lopment of the following expressions for calculating the percentage change in Isc=
% Total Isc change before cleaning
I DIRTY - I INITIAL = sc sc
I INITIAL (lOO)
sc
% Total nonrecoverable Isc change after cleaning
I CLEAN - I lNl '.L'J.A.L. sc sc
I INITIAL sc
% Isc change by cleaning
I CLEAN - I DIRTY sc sc = I CLEAN sc
( 1 no)
(100)
Analogous expressions for max1mum power can be obtained by changing Isc to P~ax in these equations.
Isc is probably more useful in characterizing soiling than is Pmax because Isc is known to be linear with illumination (for single~crystal silicon cells). I 8 c is also relatively insensitive to temperature and cell electrical degradation associated with series resistance changes, in marked contrast to Pmax' which is a strong function of both. This makes Isc less sensitive to cell aging and measurement conditions. Since soiling affects the illumination of the cells by absorption and scattering of incident light, Isc can be used as a direct measure of soiling of linear solar cells, especially when reporting changes between pre- and post-cleaning.
4

The percentage changes in Pmax and lsc for various modules at various sites throughout the country are given in Appendix A. From the examination of the tabulated data and of Figures 1 and 2, the following observations are made:
(1) Performance Degradation
Typical average short-term electrical performance degradation of 6 to 7% per month has been observed during rain-free periods in Pasadena CA, independent of surface materials (Figure 1). Over long periods (about 6 mo) the net accumulation, including effects of natural removal, results in measured degradation ranging from 2% for glass-surfaced modules in Arizona to 60% for silicone-surfaced modules in high-pollution city locations (Cleveland and New York City).
(2) Environmental Factors
Contamination effects on performance appear to be strongly dependent on local environmental factors. Significant differences in effects are observed at sites separated by only a few miles (Cleveland), primarily due to local pollution sources (one site was near a steel mill). Although the effect is not as pronounced, modules in lower Manhattan at New York University appear to experience greater performance degradation than do those 1n upper Manhattan, at Columbia University. Remote mountain sites, such as Mt. Washington NH and Mines Peak CO, as expected, seem to have relatively dust-free environments. Sites that have considerable precipitation throughout the year--resulting in periodic natural cleaning of surfaces--do not experience as great a performance loss as do those with less-frequent rains. Stronger bonds seem to be formed between particles and silicone-rubber module surfaces at sites with high humidity, such as Cleveland and Puerto Rico, than at sites with low humidity (Phoenix). This is manifested in relative differences in electrical characteristics in the total non-recoverable post-cleaning columns in Appendix A.
Local conditions that are likely to affect optical losses include at least some of the following factors (there may be others):
(a) Local airborne particulate ruatLer, including quantity, molecular species, optical properties (absorption coefficient and refractive index), particle size and shape, and adhesion properties (chemical and physical adsorption).
(b) Local meteorology, including type, frequency, and quantity of precipitation; humidity and dew cycles, wind, temperature cycles, and ocean influence (salt nuclei).
(c) Simultaneous or ~equential occurrences· of various combinations of pollutant and meteorological factors.
To obtain a qualitative indication of the effects of interaction of climate, pollution, and module top-cover material, lsc data from
5

~ u V'>
z:
V'> V'> 0 ....J
v -"' ~ 5
~ 4
"" v w 0
#.
Te~T 1 T~3T ~ T~3T :J IL~ I 4
5/25-6/15 6/5-7/10 6/30-7/31 7/11-8/7
TEST PERIOD
- SILICONE RUBBER
D GLASS
IL~I J
8/9- 9/5
TC~T 6
9/8- 11/6
(DATA NORMALIZED TO A 30-DAY PERIOD)
Figure 1. Electrical Performance Degradation of Modules During R~i~·~rce rerioda in Pasadena CA (1978)
40 ....... ::~~::· .. ~ L ...... :.::::........ .. .......
35 . 'RAINYSEASbNJ !
·-•"'"' - .......... :::'"""'"!
30 :::,"·,,,,, '""''"""'''.".
25 i-"'"'""
20
15
10
5
0 50 100 150 200 250
11-22-78 OUTDOOR EXPOSURE TIME !DAYS)
Figure 2. Module Soiling Without Cleaning: Pasadena, CA
6

modules exposed for extended durations were normalized to a one-month exposure and then ordered as shown in Table 1. As the abundance of airborne contaminants (especially particulates and oily aerosols) increases, the softer top cover materials, such as silicone rubber, appear to retain dirt more tightly. This type of qualitative assessment suggests that low-soiling surfaces should be hard, hydrophobic and oleophobic (i.e., lacking affinity for water and oils). Postulated mechanisms for surface soiling that is resistant to natural removal (by wind and rain, etc.) are described in References 8 and 9.
(3) Load
From the analyzed data, no conclusion could be drawn whether electrical load influences rate of accumulation. It is speculated that, because of the relative low electrical fields induced by the modules in their immediate surroundings, large differences in rates of accumulation on modules, whether open-circuited or loaded, are unlikely. An investigation is in progress to determine if high
Tahle 1. Relationship of the Climatological-Pollution Classification of Various Field Sites to the Performance of Flat-Plate Modules Fabricated With Different Top Covers
Field Sites Soft Silicone (increasing oil, Silicone Elastomers Hard contaminants, Climate logics 1 Poll~tion RTV 615 Sylg 184 Coat Glass and RH)Q Classification * Classification <0 Increasing surface hardness)
lit. Washington, 1111 Ofb: Humid micro thermal, Remote 0 0
humid continental (cool Su1IIDer) with no dry season
So. Florida Aw: Tropical savanna, Rural, near-urban -o -o -o -o more rain in Sutiii:l:er than in winter
Phoenix, AZ vicinity BWh: Dty c 1 imate, Rural le le 0 0
desert, tropical-suDtropical steppe
Mead, NE Oaf: Humid microthermal, Rural, agricultural humid continental (warm summer) with no dry season
Ft. Belvoir, VA Caf: Hum~d sub tropics 1, Rural no dry season
Lexington, HA Obf Suburban, undeveloped
Clt!vt!land, UH near airport Oaf Suburban, comm.erc is 1
Csmbridg~, !'!A nhf Suburban, ~owmcr.: ia 1 2.' ~ ·' Pasadena, CA Cs: Humid meso thermal, Suburban, residential 2e 4e Je le
dry suumcr, aub-tropical
New York City Daf Urban, comm.erc i a 1 5e 6e 5e
Cleveland, OH near steel mill Oaf Urban, commercial 8 8 8
*Based on Ref. 10 e • estimated
7

voltages resulting from long series strings for grid-power generation affects the rate of accumulation of dirt on the modules. Three minimodules from each of four manufacturers are used in the experiment. One each has an applied voltage of +1500 V relative to ground, the ser.ond from each manufacturer has -1500 V, and the third from each has no applied voltage. Plots showing changes in Isc as a function ·of time for the three minimodules from each manufacturer are given in Figure 2. Applied voltage effects are indicated by the error bars. The modules have· not been artificially cleaned during the test period. Recen~ observations on differences in rates of dirt accumulation, as measured by Isc' on modules and material samples subjected to high voltage for more than one year are indicating trends that suggest dependence.
B. MATERIALS FIELD DATA
In addition to the studies of outdoor soiling of modules, a series of experiments exposing material samples (candidate encapsulants and top cover~) to outdoor environments has been performed a~ a JPL in-house effort and by contractors for LSA's Encapsulation Task (References 10 and 11). The objectives of these experimental efforts are to determine differences in rates of accumulation and in degree of self-cleaning by natural causes.
The materials exposure investigations developed into two separate time phases. The Phase I investigation was made from May 1, 1978, to April 30, 1979,.and is reported here. The Phase II investigation started May 1, 1979, and is continuing. Its preliminary results are also reported here.
The specific objectives of the Phase I materials investigations were:
(1) To develop a data base from field-exposed materials at nearby sites.
(2) To identify physical properties of optical materials that govern soil retention.
(3) To identify key environmental factors that govern soiling levels.
The specific objectives of the Phase II materials investigations are:
(1) To deploy matcrinln for outdoor exposure at several sites throughout the country.
(2) To develop sound test methods for evaluation of encapsulant materials.
(3) To assess dust species, properties and accumulation at various sites.
(4) To develop understanding of soiling mechanisms (retention).
(5) To support the development of preliminary guidelines for selection of materials exposed to dirt or dust or both.
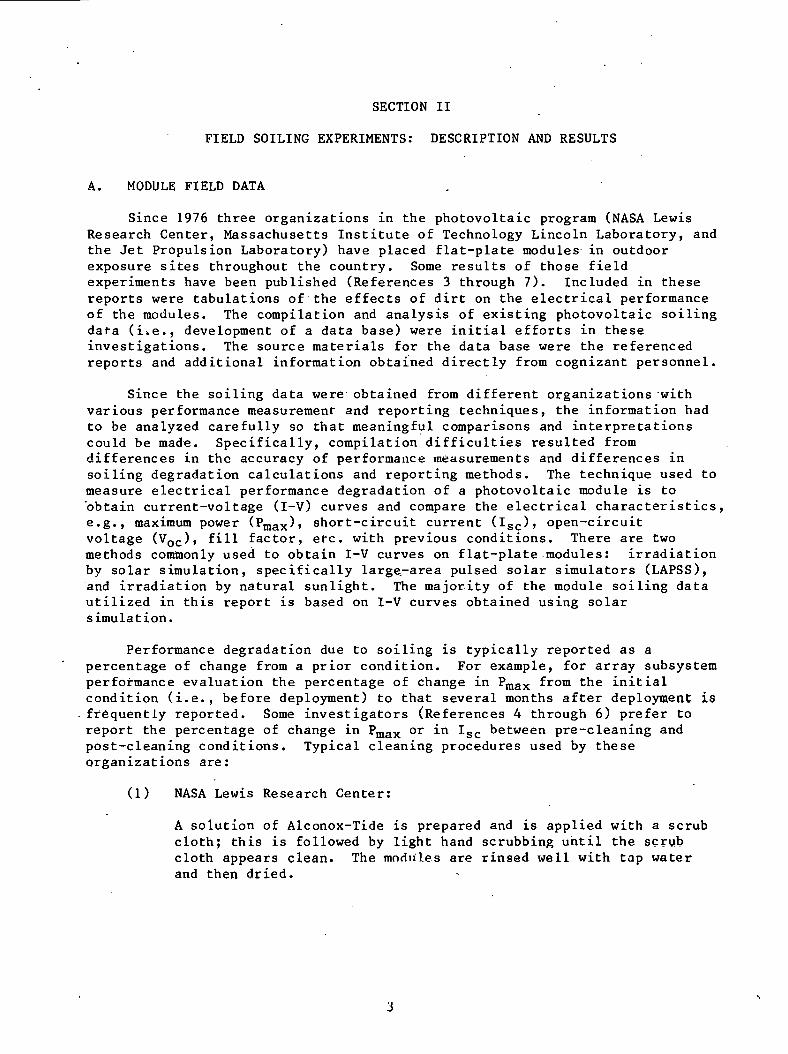
As part of Phase I, an outdoor experiment was performed by JPL with the cooperation of the South Coast Air Quality Management District (SCAQMD), a four-county special district created by the state of California. The experiment
8

consisted of placing material samples at an SCAQMD air-quality monitoring site in Pasadena CA, close to the monitoring equipment (Figure 3). Material samples 5 x 5 em were placed on fixed rack at a tilt of 45°. The materials included in the study were silicone rubber (RTV 615), soda-lime glass, and Plexiglas. Periodically during the one-year experiment, from April 1978 through April 1979, material samples were retrieved from the site and returned to the laboratory for evaluation of optical transmission. The apparatus used to make this measurement had been specially designed for the purpose; it is pictured in Figure 4. Two matched solar cells are illuminated by a beam splitter from a point source. A control sample is placed over one of the solar cells and the exposed sample over the other. The ratio of Isc measurements is then recorded. This ratio is referred to as the relative normal hemispherical transmittance (RNHT). This apparatus permits relative optical transmission measurements to be made quickly and with good repeatability. Comparisons of these measurements with more sophisticated transmission techniques are being performed in the Phase II investigations.
The results from this study for silicone rubber, glass, and Plexiglas are shown in Figure 5. During the first month and a half the rate of soil accumulation on all materials as measured by the loss of relative transmittance was about 7% per month. The dip at 82 days could not be explained by any meteorological phenomenon, although fog and possible condensation could have caused some cleaning. However, after the first significant rain of the Southern California rainy season the Plexiglas and glass samples were more extensively cleaned than was the silicone rubber. Dirt began to accumulate and the obscuration on all materials increased until another rain occurred. This pattern continued throughout the sampling period. The conclusions drawn from this experiment include the following:
(1) The rate of soil deposition is material-independent; the effectiveness of natural removal by rain is material-dependent.
(2) Average losses in relative transmittance over a one-year period were 16% for silicone rubber, and 7% to 8% for glass and Plexiglas.
(3) If exposed materials are heavily soiled, rain can cause improvements in transmission of 10% to 15% for glass and Plexiglas and 5% for silicone rubber.
An additional objective of this study with the SCAQMD was to determine the feasibility of correlating data on dust accumulation on optical surfaces with data from high-volumetric particulate-matter mea-urement equipment operated by SCAQMD. If correlation could be established and a dirt accumulation Algorithm developed, there is a wealth of data available from the federal Environmental Protection Agency (for example, the newly established 1nhalable Particulate Network) and from local communities that would permit an evaluation of site dust accumulAtions. Based on a preliminary analysis, there LS some promise of feasibility, but much more data from many sites would have to be examined and appropriate algorithms developed.
It should be emphasized that the conclusions drawn from the Phase I investigations are related to the data obtained at the Pasadena SCAQMD site; extension of these conclusions to any other siles wuuld be premature.
9
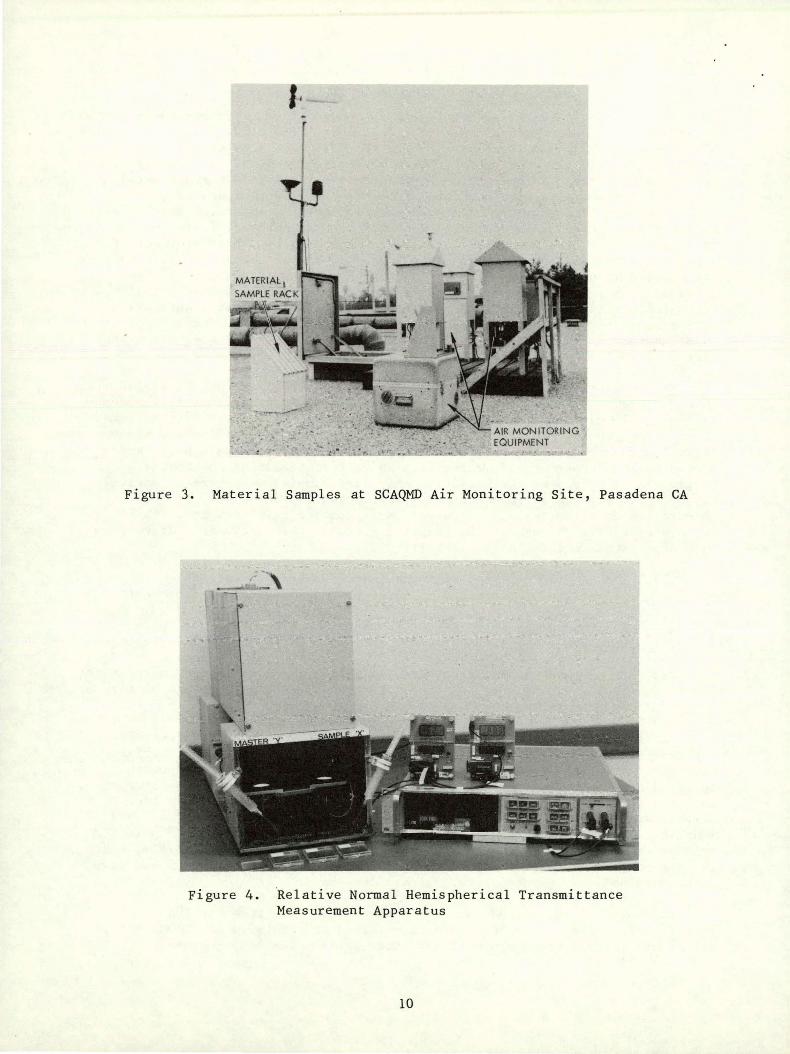
Figure 3. Material Samples at SCAQMD Air Monitoring Site, Pasadena CA
Figure 4. ·Relative Normal Hemispherical Transmittance Measurement Apparatus
10

~ z .J:z ::: <( <(
0:: 0::
>-> <( w I
..... <( u 0< ~ 15 c.. VI
:E I ...... I I J/ ..... <(
::E 0:: 0 z w > ;:: :5 ...... 0::
z VI I VI 8 0 .....
EXPOSU RE TIME. MONTHS
Figure 5. Relative Transmittance of Materials at SCAQMD Site, Pasadena
It was this limitation that led to the Phase II investigations. As shown above, the Phase II program objectives were very ambitious. It became obvious that if any sense were to be made of the overall soiling investigation, a nationwide outdoor exposure program must be established, with attendant geographical considerations. It would be necessary to select cover materials that have been used as covers or as encapsulants, or both, in the Block I and Block II module purchases and to select others in an attempt to anticipate materials that may be considered for future module purchases or that may remain in use until the end of the program. With these considerations in mind, the Phase II program was initiated.
The materials considered for placement 1n the outdoor exposure network are shown in Table 2.
Table 2. Phase II Outdoor Exposure Materials
MATERIAL
Poly (dimethyl siloxane)
Proprietary Silicone
Soda Lime Float Glass
Borosilicate Glass
Alumino Silicate Glass
Polyvinyl Fluoride
Acrylic
MANUFACTURER
General Electric
Dow Corning
Ford Motor Glass Div.
Corning Glass
Corning Glass
Dupont
Xcel Corp.
11
TYPE
RTV 615
Ql-2577
1/8 inch Window Glass
7070
0317
Tedlar 400 x RS160SE
Korad 212

Outdoor exposure locations used during the Phase II investigations were:
JPL, Pasadena CA Table Mountain, Wrightwood CA Goldstone Tracking Station, Barstow CA Pt. Vicente (U.S. Coast Guard Station), Palos Verdes CA South Coast Air Quality Management District Facility, Pasadena CA South Coast Air Quality Management District Facility, Torrance CA New York University, New York NY Massachusetts Institute of Technology, Cambridge MA Sandia Laboratories, Albuquerque NM Battelle Pacific Northwest Laboratories, Richland WA.
In order to prevent the influence of any factors other than environmental action upon the outdoor materials, a special test rack was constructed and deployed (with materials) at all outdoor exposure sites. The test rack was constructed of No. 316 stainless steel and was coated with Cat-a-Lac black epoxy, a high-quality aerospace (flight quality) black paint. In addition to the all stainless-steel construction hardware nsP.rl, rain channels were incorporated between rows of materials samples to prevent draining of naturally removed (washed away) dirt over lower samples. The surface of the test rack was painted black for two reasons: to prevent photolysis of the samples from the double pass phenomenon (bare stainless steel has a relatively high spectral reflectance below 4000 A) and to achieve an equilibrium temperature under the samples somewhere near that of an exposed module; the solar absorptance-to-hemispheric emittance ratio (a/€) for the black paint and for the typical solar cell is near unity. Figure 6 shows a sampling of the outdoor exposure sites and one of the test racks.
As noted earlier, one of the objectives of the Phase II investigation was to develop sound test methods for evaluation of encapsulant materials. In order to accomplish this, several optical and non-destructive testing techniques were employed. One such opttcal mPasllrPmPnt tPrhnirptP t.1::.c; thP ,_,se of RNHT. l'he merits of this techm.que were described in the discuss ion of the Phase I investigation above. Additional optical measurements performed by Lind and Stewart of Battelle Pacific Northwest Laboratories include: spectral transmittance (normal hemispherical and normal); spectral reflectance (normal hemispherical); and scat·tering (specular transmittance). Scanning electron microscopy measurements are being performed on all RTV 615 samples to identify density and species of deposited particulate matter.
The prel1m:nary results of this investigation (i.e., from those sites that have had at least one year of field exposure) show some interesting trends. Appendix B shows the RNHT values of nine sites in the network. Figure 7 presents a comparison· between the "cleanest" and "dirtiest" sites 1.n the Southern California area.
In addition to the RNHT data, Table 3 shows the severity of dust and dirt accumulation, in this case at the Pasadena SCAQMD site. As a direct result of the data presented in Figure 7, new mechanisms for soil accumulation and retention have been postulated, first and foremost by Cuddihy (Reference 12) and second as a lemma by the authors. An interpretation of the retention mechanisms will be published in a future report. Briefly, the data suggests that three distinct layers may form on the surface of the most heavily
12

Goldstone Site Terrain SCAQMD Monitoring Site, Pasadena
Jet Propulsion Laboratory Test Site Test Rack With Material Samples
Figure 6. Some Outdoor Exposure Sites and a Typical Sample Test Rack
contaminated materials as depicted in Figure 8. Layer A is associated with the chemical activity of the surface; ·i.e., the natural environment reacts with the surface to kill any reactive sites (free radicals) left during the manufacturing process; ergo, a high population of multivalent ions would remain on the surface. This surface would in reality be the bulk material's new surface and would be impossible to remove. As a consequence of the formation of the highly reactive layer A, additional surface contamination will accumulate on layer A until its surface energy has been reduced to a nominal level. Layer B has now been formed and would most likely be susceptible to mechanical removal. Layer C is then the "neighborhood dirt" (geographically differentiated) that accumulates on Layer B. The binding energy of Layer C to Layer B is very low--much weaker than that of rain, thus permitting natural removal. This theory suggests that material would build up on a module or material surface, decreasing power or transmission, respectively; power loss or change in transmission then would level off and, as rain or snow or other natural removal forces dominate, oscillate above this equilibrium value. If mechanical cleaning is inserted in the scenario, i.e.,
13

Table 3. Severity of Dust and Dirt Accumulation: Pasadena SCAQMD Site
MATERIAL
RTV 615
Ql-2577
Soda Lime Glass
Borosilicate Glass
Alumino Silicate Glass
Tcdlar
Korad
40
1-:r: z 30 "' :f Vl
~ 1-
20 z w '-' ~ 0..
TORRANC E SCAQMD
~ ~ ~ <l: <{ w <l:
"' "' "' "' w .__ "-
1-u :r: :r: <l: () ...J () ::::; ...J 0 ...J
I I I I
50 100 150 200 250
No . DAYS
~ <l: "'
350
HEMISPHERICAL SPECULAR TRANSMITTANCE TRANSMITTANCE
Day 0 Day 150 Day 150
0.930 0.585 0.303
0.870 0.564 0. 251
0.870 0.681 0.581
0.910 0.730 0.613
0.914 0.783 0.642
0.892 0.741 0.585
0.912 0.718 0.564
TA BLE MT
3: 40
0 z Vl Vl !: "' w
"' 0 3. Vl 3: z 0 z z 7 7 "' Z :r: :;:(:;:( u
<l: <l: z ~~ Vl
"'"' ~ "' "' Vl
30 1- 1- >->- 3: 1- <l:,_ Cl :r: T > > 0 :r: ~~
z ,_, (~ <l: <l: (~ :::> w ..... 7 ~ ::::; .L
' :r: :x: Vl ....
l I I I I I n1 20
10
50 100 150 200 250 300 350 400 450
No. DAYS
Figure 7. Percentage Loss 1n RNHT of Materials Exposed at Two Locations
removing Layer B, an almost complete recovery should occur. This is consistent with field observations. Theory also suggests tha t if no reactive oxidation occurs (i.e., no reactive sites exist), no Layer A can be formed. This appears to be the case for surfaces such as glass and acrylic materials.
14

LAYER C- "NEIGHBORHOOD DIRT" -NATURAL REMOVAL
\r---- LAYER B- SURFACE ENERGY jllll~..I..U.l.~~=.u~..I..U.l.~~~ DEPOSITION -MECHANICAL
REMOVAL
LAYER A -CHEMICALLY REACTIVE -VIGOROUS MECHANICAL AND CHEMICAL REMOVAL
AS-MANUFACTURED FRONT SURFACES OF MODULE COVER MATERIAL
Figure 8. Three-Layer Soiling Mechanism
In surmnary, the observations made duri.ng this phase of the investigation include:
1) The relative transmission of glass, polyvinyl fluoride and acrylic material samples was significantly better than that of silicone rubber and the hardcoat silicone at all sites.
2) Of the three glasses, borosilicate was effected the least by outdoor soiling, followed by aluminosilicate, then soda lime. The maximum transmission loss for all glasses was 16%, with the majority of the readings <5% loss.
3) The maximum measured transmission losses were: silicone rubber, 46%; proprietary silicone, 31%; soda lime glass, 16%; aluminosilicate glass, 14%; borosilicate glass, 13%; polyvinyl fluoride, 21%; and acrylic, 21%. All of these occurred at the Lennox, CA site.
4) At the Southern California sites, where there were washed and unwashed samples, no appreciable differences in relative transmission are noted, especially on the harder materials. Some differences are noted on the softer materials during the rain-free periods.
5) Tilt angle affected soil ·accumulation more on the softer materials (65%) than the harder materials (62%). Samples tilted at the local latitude (34°)_ had slightly more transmission loss than at the nominal test angle (450).
15

1:" .- -~-..,..~ ........ ~ .... ~·-·- ~-~-llftr ....... L ••
' . .,, - : _., \·. ~ . ·~
-·_, ;· . ~-- ,·. ·.· : .. ·:, .··• -~\- ... _. _,; .'· ,·. '.:- .. ·
·. ·: .... .:· <·· ;_T---H.· ·I:,.·s: .p·rAG:E· :- -\. 1 > \..' :_,. .-" r . : ·- - . ' fi . . ~ _. , . .'.~ .. _ q 4
WAS ~INTENTIOtN·ALLY LEFT BLANK
-- ·- ··--- _ .. --·- -- .... ~ ·- ........_ -· ~ ... -- _ ......... _,_ --· .... :- -- -- ----~ -· .... --- .. ..:. ··-
SECTION III
LABORATORY SOILING EXPERIMENTS: DESCRIPTION AND RESULTS
Early field data showed that there was considerable site-to-site variation in the performance degradation of modules attributable to soiling. Parallel with the assessment of the field data, a series of laboratory experiments was initiated. The objective of the-e experiments was to simulate contaminant deposition on test surfaces and determine factors affecting module performance.
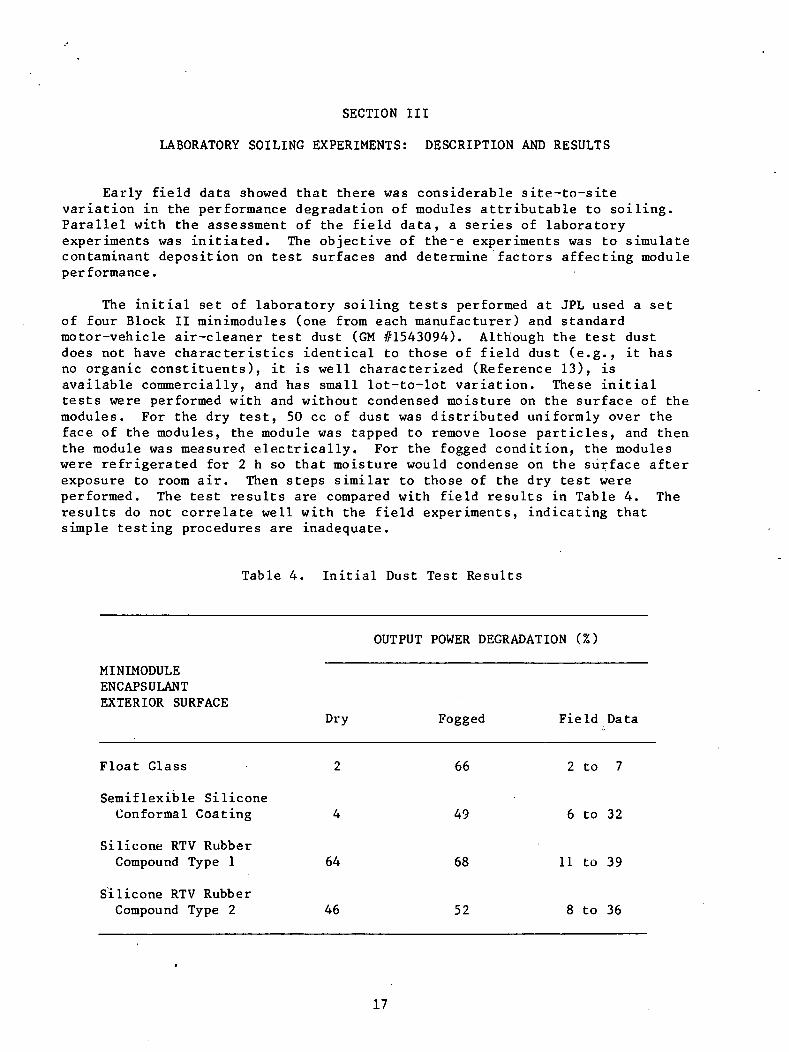
The initial set of laboratory soiling tests performed at JPL used a set of four Block II minimodules (one from each manufacturer) and standard motor-vehicle air-cleaner test dust (GM #1543094). Although the test dust does not have characteristics identical to those of field dust (e.g., it has no organic constituents), it is well characterized (Reference 13), is available commercially, and has small lot-to-lot variation. These initial tests were performed with and without condensed moisture on the surface of the modules. For the dry test, 50 cc of dust was distributed uniformly over the face of the modules, the module was tapped to remove loose particles, and then the module was measured electrically. For the fogged condition, the modules were refrigerated for 2 h so that moisture would condense on the su~face after exposure to room air. Then steps similar to those of the dry test were performed. The test results are compared with field results in Table 4. The results do not correlate well with the field experiments, indicating that simple testing procedures are inadequate.
Table 4. Initial Dust Test Results
OUTPUT POWER DEGRADATION (%)
MINIMODULE ENCAPSULANT EXTERIOR SURFACE
Dry Fogged Field Data
Float Glass 2 66 2 to 7
Semi flexible Silicone Conformal Coating 4 49 6 to. 32
Silicone RTV Rubber Compound Type 1 64 68 11 to 39
Silicone RTV Rubber Compound Type 2 46 52 8 to 36
17

In a concurrent test to explore dust-removal effects by blowing air, test dust was applied in the same manner as for the dry test. This was followed by blowing with an air hose (100 psig) 5 em (2 in.) from the modules' surface at an angle of 30°. During the blowing operation, it was observed that dust blows off to a certain point, then no more is removed. This is commonly seen when a fluid under pressure (air, GN2, or water) is directed at a surface covered with particulates, whether it be a window, a car hood, or a driveway. With the exception of the glass module, which was initially minimally degraded and showed no change·, the non-glass covered modules showed a significant improvement in electrical performance. A possible explanation is that the blowing breaks the bonds on the loosely adhered particles, especially the larger ones, which are entrained in the airstream and are blown away from the surface with the smaller-sized particles remaining behind. The net effect is less blockage of incident light, resulting in improved electrical perfor~ance of the modules. ·
A second series of dust deposition-removal experiments was performed ~n an attempt to achieve better correlation between field results and test results. These tests were performed using lHoc'k II minimodules, standard ai.r cleaner dust, and an experimental particulate deposition chamber (Figure 9). The test sequence is depicted in Figure 10. The front surface of each test specimen was preconditioned to one of the following states before dust deposition: dried, fogged, misted with a simulated smog, or a combination of these. A chill step was applied to those minimodules for which a moisture layer was desired on the surface·(i.e., fogged condition). Three rep~titions of a dusting-tapping-vacuuming step were necessary to increase the density of smaller-diameter particles (<10 J.lm) retained by the surface. (The tapping and vacuuming steps removed loosely adhered larger particles.) Figures 11 and 12 depict these steps. The simulated smog fluid was composed of several organic compounds blended in proportion by volume based on an analysis of air. pollution performed in Europe. A thin layer of the fluid was deposited on the appropriate modules using an artist's airbrush and a fume hood (Figure 13). The intent of this conditioning step was to explore the extent to which the organic film enhanced the formation of stronger bonds between the test dust and the module surface.
The results are given in Table 4. In the absence of moisture on the surface of the test item (i.e.~ dry condition), few particles adhered to the surface, whether glass or silicone rubber. This result was r.nnsi.st~;>nt with the fie_ld results in dry locations such as Phoenix. When moisture was present on the surface, the number of particles retained was significantly greater, though variable, with glass generally retaining the least. When an oily film was applied to a dry surface and then artificially dusted, the number of particles retained was greater than for the dry condition bnt sm.<~l.lP.r than for the fogged condition. The smogged and fogged conditions retained more particles than the smogged condition alone. When several smog-dust layers were applied to the module, the number of particles retained was not appreciably different from that for the single smog layer condition.
18

TEST DUST Dl SPENSER\
1 \
BLE BAFFLE
,
Figure 9 . Experimental Par t icle Deposition Ch amber
,-------, I I
I l CHILL ~ I I I I L _____ j
p. PHOTO REMOVAL (WIND) iJ. PHOTO
DUST TAP VACUUM p. PHOTO
NO. l
DUST TAP VACUUM iJ. PHOTO
NO. 2
DUST TAP VACUUM p. PHOTO
NO.3
REMOVAL (RAIN) J.LPHOTO
Figure 10 . Laboratory Minimodule Dust Test Sequence
19

Figure 11. Tapping Step Figure 12 . Vacuuming Step
Figure 13 . Smogging Step Fi gure 14 . Wind- Removal Simulation
After soiling deposition and electrical measurement, a wind-removal simulation was performed. This consisted of placing the minimodule in a specially designed vacuum box in which the standoff distance at the entry orifice was controlled to produce steady air speeds of 27 m/s (60 mph) (Figure 14) near the knife edge of the orifice. The simulated wind removal seems to result in very little improvement in electrical performance. This is probably attributable to the paucity of loosely adhered particles present on the surface at the conclusion of the deposition procedure that concluded with a vacuuming. In the field, winds could remove loosely adhered particles
20

deposited on the module surfaces. However, the amount of improvement in performance in a field array could be minimal because of the complex aerodynamics of the field, especially if barrier fences were placed to reduce wind loads on array structures. Aerodynamics of field arrays are being analytically and experimentally investigated by Sandia Laboratories and JPL contractors; see References 14 and 15.)
After electrical measurement, the minimodules were subjected to simulated rain removal. The rate simulated a moderate rain (36 mm/h) and was performed for 15 min. The post-rain electrical performance tests indicate improvements in Isc ranging from 0% to 9%. This degree of improvement is similar to what has been seen in the field on modules and materials immediately after a rain. However, the degree of improvements noted in both laboratory and field results depend on how heavily soiled the items were before the rain.
When the relative retention of the artificially dusted test samples are compared (Figure 14) with the field "by cleaning" data in Appendix A, the laboratory results envelop the field data, except for urban areas with high pollution. The absolute percentage changes are different, but the trends appear to be similar.
In summary, test results from laboratory procedures developed to date provide only fair correlation with field experiments. Side-by-side outdoor exposure testing for long durations at a variety of sites is presently the most effective means of evaluating soiling differences between candidate materials.
21

~
t-'·
()q
~
ii
(!)
I-'
V1
t-'·
:;d
::l
(!) I-'
r-'lll
Ill
rt
cr'
t-'·
0 ~
ii
(!)
Ill
rt
:;d
0 (!
) ii
rt
'<
(!) ::l
Ill
rt
::l
t-'·
P.O
::l
N
~
N
t-'·
0 (!
) /-
t)
I-'
P.t
-d
Ill
>-'3
ii
(!)
rt
00
t-'·
rt
(')
00
I-'
(!) 00
0 ::l ::s::
0 p.
~
I-'
(!)
C/)
~
ii
/-t)
Ill
(')
(!) 00
3: z 3:
0 0 c r:;::;
VI
c :;o >
(") ~
LOSS
I~
I SC
(%:•
0
FOGG
ED
I I
VI
I
"TT
r-
SMOG
GED
SMOG
GED
& fO
GGED
DR'i
~I
I .....
'
(;')
s:;: I
I
VI
I V
I
~
~
8
~D
"TT
~
6 ~
VI .....
s: z 3::
0 0 c F:;;
VI
c :;o >
(":·
..,..
,
VI
0
DRY
......
0
SMOG
GEC
FOGG
ED
LOSS
IN
ISC
(%
)
~
~
•o
~ ~
~
VI
r--1
0
8

SECTION IV
DUST ASSESSMENT STUDIES
An assessment of dust species and of the properties of dust ar.cumulating on modules and materials was initiated during the period.
The first efforts involved the review of two reports relevant to dust constituents, prepared by government agencies for different purposes.
An Environmental Protection Agency report (Reference 16) gives the results of an effort to characterize the various components and types of particles that compose ambient suspended particulate matter in urban areas. The results are summarized in Table 5. These results give quantitative and qualitative indications of the types of d i rt that could be deposited on modules if placed in representative urban areas in the United States.
Table 5. Representative Percentages of Total Suspended Particulate Matter in Urban Areas
MASS QUANTITY (%) AVERAGE SIZE (pm)
Commercial Constituents Industrial Undeveloped Mean Range
Residential
MinP.r.<~ls 65 90 8 1-62 Si02 (quartz) 29 32 CaC03 (calcite) 21 40 Al silicates 5 3 Fe 2o3 (hematite) 10 15 Other 1 1
Combustion Products 25 8 5 1-58 Soot 17 7 Fly ash 8 1 Misc. 1 1
Biological Material 3 1 24 5-82
Misc. (mostly rubber 7 1 43 13-135 from tires)
Source: Reference 16
23

The Naval Weapons Center report (Reference 17) describes the techniques of sampling and analyses of worldwide soil samples (not airborne particulate matter). Characterization of soil samples from 43 sites is given in Table 6. This data can be of some interest to module soiling investigators because soils can be made airborne by wind or vehicular traffic and can be transported across large distances with subsequent deposition on modules. From the table, the most noteworthy data is the wide range of average particle size (4 to 188 ~m) and the variety of composition evident at the various sites.
Identification of particles on a material sample (silicone rubber) cut from a module exposed at Cleveland, using SEM and energy-dispersive spectroscopy, was made. The results are depicted in Figure 16.
Particle Identification No .
1 CorttQino Si, s, Cl, K, Br
2 Pollen? l ~lny
4 QuQrtz 5 Paint 6 Water Scale 7 Wa t er Scale
Cleveland: NASA Lewis Research Center 500x
Figure 16. Particle Identification Using Scanning Electron Microscopy and Energy-Dispersive Spectroscopy
As mentioned above, non-destructive tests are being performed on all RTV 615 samples. Complete data will be presented in a forthcoming test report; presented here are the results to date. Figures 17a through 17e show 400x magnification of particulate matter deposited on the RTV 615 after 200 days at each of the five California sites. Figure 16f, lOOOx, shows the same, clearly revealing the presence of pollen (probably conifer) and diatomaceous earth. An initial assessment tends to indicate that the predominant contaminating species in the Southern California locale is kaolinite.
This material was observed even at Table Mountain (2,250 m), showing the ubiquity of airborne particulate matter in the Southern California area.
24

a 400x b 400x
c 400x d 400x
e 400x f 1000x
Figure 17. SEM Pho t ographs of Particles Deposited on RTV 615 Samples
25

Tab l e 6 . Character i zation of Soil Samples (Sour ce : Reference 17)
Location
USA
Sea-Tac, Washington
China Lake, California
Sierra Nevada (Fish Creek), California
Yuma 1 Arizona
Flagsta f[, Arizona
Four-State Corners, U.S.
Providence, Rhode Is 1 and
Harrisburg, Pennsylvania
Fairfax, Virginia
Eglin AFB, Florida
Oahu, Hawaii
Adak tl, Alaska
Adak 1/2, Alaska
Anchorage, Alaska
Kodiak, Alaska
Tanana Va 11 ey, AI ask a
l.ar i bbean and (.;en tr a 1 Amer lCB
Guatemala City , Guatemala
Ft. Clayton, Panama
Coco Solo, Panama
Bennuda
Ramey AFB, Puerto Rico
AusLralia
Innisfail, Queensland, Aust .
South Pac i fie
Agana, Guam
Fiji Island
Moore a, Tahiti
Vago P3go, Amcr1C01n S<~mo.:l
Midway Island
Suu lht-ot~l A~i<l
lwakuni, Japan
Atsugi, Japan
Sasebo , Japan
Da Nang, ViPtnam
Vnr~ar, Th.,;l,..nti
Subi c Bay, Philippine Islands
Hong Kong
N.ahn, Okinawa
Canada ~nd turo f
Alcan Highway (Dawson CreekOf>ltil .lunrtinn )
White tiorse, Yukon
Argentia, Newfoundland
Heyford, England
Other
Keplavik, Iceland
Ross Island, Antarctica
Taylor Valley, Antarctica
66.60
69.50
54.57
82.07
54.28
83.01
76.83
68.41
65.18
'~" 10 31.71
54 . 27
31.09
64.94
57 .06
81 . 43
42.74
36 . 73
44 . 50
2.1 1
36.53
32.81
14.09
43 . 99
15.69
13.25
0 1, 29.99
67.94
32.54
69 .RJ
80 . 21
77.37
39 . 07
74.75
(J7. !:19
68 . 14
15.73
69.77
31 .34
44. 17
60 . 77
AlzOJ
14.12
13.22
18.85
5 . 80
18 . 31
6. 22
11.41
13 . 22
14 . 16
I.'""
21 . 73
25.49
13.79
15.84
16.39
7. 15
20 .07
25.86
24.55
I. 75
7 . 10
28.32
26.75
23 . 01
2.15
6.08
Pli1
22. 14
16.17
26.la5
12 .la6
7.61
8 . ?0
29.22
11.9la
12 . l:J
13.22
9. 79
7.40
23.86
14.36
12 . 96
Composition (percent by weighd 8
3 . 70
3 . 97
10.37
1.30
10.57
I. 37
2 . 23
5. 35
7 . 28
0 . 31
26 . 32
1.80
2. 30
5.69
6.66
3 . 37
7 . 41
16.71
10.08
o. 79
J. 33
22 . 69
15 . 37
12 . 23
1.93
6 . 2?
0 . ?!:1
2 1. 37
4.85
15.40 ..,_, 8 . 69
3 . ?7
15 . 34
2.59
it. J9
6.1•8
3.13
3.49
4 . 99
15 . 25
13.89
7.08
0. 73
o. 28
1.10
I. 37
o. 90
0.63
0 . 28
2 . 85
o. 93
o. 33
o.?J
MnO
0.08
0 . 13
o. lla
0.03
0.10
CaO MgO
0.58 3.17
5 . 47 1.15
6. 71 3 . 20
4. 84 I. 55
4.33 2.44
2.00 0.65
I .64 0 . 43
1.10 1.63
2.28 1. 35
0.60 0 . 94
ll.lt5 4.37
2.86 0 . 49
o. 70 1.84
I. 98 I. 54
1.80 1.44
) . 4) 1.1)
0.37 0.44
0.21 0 . 99
50.05 o. 95
25.43 0. 75
0.75 0.55
12.28 O.laO
3.76 2.98
35.58 2.22
J?.2J J.(JJ
~1.12 l.ZJ
2.88 0.91
2 . 92 0 . 89
1.02 1.96
0.31 0.63
0.68 0 . 08
O.G7 0.29
I. 70 0.20
0 . 40
0.85
0.60
0.48
O.ta7
3. 55
1.08
0.06
0 . 06
O.llt
0.22
0.12
0 . 84 0.13
5 . 37 1.46
7. 75 3.65
5.66 1. 88
1.39 1. 19
4.42 0.48
3.89 I. 27
9.27 8.61
5.61 4 . 74
0.57
0 . 05
0.27
0.33
0 . 29
3.30
I. 10
l.lal
1.83
2.25
Na 2o
0.67
0.15
2.33
0. 77
O. (JJ
0 . 88
1. 8 1
0.42
2.86
2.95
NOU:: Absence of data in composition section does not mean oxides were not presentj depends on tes t ing technique.
aAll metals reported aa oxides . btgnition loss: I hour at 1292°F . "Any minor amou n-t"'""Vt T102 would be 1ncluded in the Al203 value. dPorosity too high, out of range . Particles are large fused agglomerates which crush to micron si.r.e particles.
26
lgnitionb loss Density
% g/cm3
8.30
2. 58
3.00
2 . 75
5 . 38
2.87
la. 75
7.46
6 . 39
14.62
0.40
44. 7R
4.19
II .34
I. 5l
17.99
12.23
12.38
42.46
24.20
12 . 06
27 . 3 1
7 . 63
36.69
28 . 63
16 . 'i7
2 . 14
13.97
6 .?3
3. 35
u .93
13.27
5 .QO
0.41
7 , 91
3 . 96
63.88
8. 34
15.99
o. 79
2.11
2. 543
2 . 685
2 . 796
2.646
3. 274
2 . 777
2. 718
2. 711
2 . 735
4.546
2.899
1.077
2. 728
2. 387
2 . 690
2. 796
4 . 239
4 . 500
2.699
2.93
3 . 08
3 . 239
3.03
2.93
3. 20
l. 7lhJ
1. 1Q I
2.626
5. 128
2. 700
2. 7]:)
). . 6)4
2.851
l· 70
2. 73 1
')_ . 744
2 . 476
I. 34
2.97
3. 368
3.09
2.98
Average particle
34
61
36
47
>25
20
10
19
13
188
" 35
10
45
19
II
II
26
17
jt) ,,
32
20
l h
14
2 1
20
19
12
10

· SECTION V
CONCLUSIONS
The following conclusions have been drawn ·.from these soiling investigations:
(1) Electrical performance degradation of photovoltaic modules resulting from accumulation of particulate matter on optical surfaces shows significant time- and site-dependence ranging from 2% to 60% power loss.
(2) During periods when natural removal processes do not dominate, the rate of particulate-matter accumulation appears to be largely material-independent.
(3) The effectiveness of natural removal processes, especially rain, is strongly material-dependent. Thus, natural removal mechanisms must be addressed when determining differences in soil retention between candidate materials for optical surfaces.
(4) Top cover materials· of glass, polyvinyl fluoride, and acrylic retain fewer particles than does silicone rubber. Silicone hardcoat does not appear to decrease particle retention of uncoated silicone rubbers (RTV 615 and Sylgard 184) significantly.
(5) High voltages relative to ground may affect the rate of accumulation of dirt on some modules and top cover materials after extended exposure.
(6) Test results from laboratory procedures developed to date have provided ·only fair correlation with field experiments. Side-by-side outdoor exposure testing for long durations at a variety of sites is presently the most effective means of evaluating soiling differences between candidate materials.
(7) .Mechanisms based on surface energy considerations have been postulated on the accumulation of surface contamination adherance to module surfaces. A three layer model has been suggested.
27

THIS PAGE
WAS INTENTIONALLY
LEFT BLANK

SECTION VI
RECOMMENDATIONS
1. Electrical performance degradation should be reported 1n terms of changes in Isc•
2. Follow-on soiling investigations should include the following considerations:
(a) Rates of dirt accumulation on various materials at several sites throughout the country should be gathered and analyzed carefully. Analysis should include spectral transmittance measurements and correspondence of results with local meteorology and pollution data.
(b) Effects of particulate constituents and particle size on spectral transmittance loss should be determined; e.g., what kinds of particles cause significant absorption and scattering of incident light for flat-plate photovoltaics?
(c) A small effort in laboratory soiling test apparatus should be continued with the objective of developing a design and materials screening test. Principal problems to be addressed center on the lack of correlation currently found between laboratory results and field results. Facets of this problem likely include test dust constituents (i.e., an appropriate test dust mixture); the moisture condition of the test dust; the test chamber, and the test surface and the technique of dust deposition (gravity settling vs impingement).
(d) The feasibility of using EPA's newly established Inhalable Particulate Network results as a data source for developing algorithms for site-dependent dirt accumulation should be determined.
(e) Surface treatments for inhibiting the adhesion of particulate matter to a surface (e.g. by reducing surface energy) should be investigated.
3. Cleaning economics for distributed systems (especially residential) should be studied. It is not obvious how much cleaning effort a typical user could be expected to perform as well as what techniques could be applied. An initial effort in this area has been completed recently (Reference 18).
29

REFERENCES
1. "Progress Report 1 for the Period May 1979 to August 1979 and Proceedings of the 12th Project Integration Meeting," LSA Project Document 5101-112, Jet /repulsion Laboratory, Pasadena, California (internal document).
2. Gupta, A., "Photodegradation of Polymeric· Encapsulants of Solar Cell Modules," LSA Project Task Report 5101-77, Jet Propulsion Laboratory, Pasadena, California, August 10, 1978 (internal document).
3. Anagnostou, E., and Forestieri, A., "Endurance Testing of First Generation (Block I) Couunercial Solar Cell Modules," Thirteenth IEEE Photovoltaics Specialists Conference, 1978, pp. 843-846.
4. Forman, S., "Field Testing and Evaluation of Photovoltaic Module Performance," Thirteenth IEEE Photovoltaics Specialists Conference, 1978, pp. 41-46.
5. Murphy, E., and Forman, S., "Measuring Dirt on Photovoltaic Modules," MIT/LL C00-4094-37, 12 March 1979.
6. Forman, S., and Themelis, .P., "Physical and Electrical Degradation of Photovoltaic Modules After Exposure in Terrestrial Environments," 14th Intersociety Energy Conversion Engineering Conference, August 5-10, 1979, pp. 225-229.
7. Jaffe, P., "LSA Field Test Annual Report, August· 1977-August 1978," LSA Project Task Report 5101-85, Jet Propulsion Laboratory, Pasadena, California, September 15, 1978 (internal document).
8. Sheratte, M., "Cleaning Agents and Techniques for Concentrating Solar Collectors," MDC G8131 (Sandia Albuquerque Contract Report), McDonnell Douglas Astronautics, Huntington Beach, California, September 1979.
9. Cuddihy, E., "Encapsulation Materials Status to December 1979," LSA Project Task Report 5101-144, Jet Propulsion Laboratory, Pasadena, Cal.i.fornia, January 15, 1980 (intl?rn:~l cincument),
10. "Investigation of Test Methods, Material Properties, and Processes for Solar Cell Encapsulants, Annual Report," DOE/JPL-954527-78/8 (JPL Contract Report), Springborn Laboratories, Inc., Enfield, Connecticut, June 1978.
11. "Develop Silicone Encapsulation Systems fo-r Terrestri<ll Silicon Solar Arrays, Fifth Quarterly Progress Report," DOE/JPL-954995-79/5 (JPL Cuiitract Report), Dow Corning Corp., Midland, Michigan, July 1979.
12. Cuddihy, E., personal couununication, June 1980.
13. Johnston, P.R., "The Particle-Size Distribution in AC Fine Test Dust," Journal of Testing and Evaluation, Vol. 6, No. 2, March 1978, pp. 103-107.
K-1

14. Poreh, M., Peterka, J. A., Cermak, J. E., "Wind Tunnel Study of Wind Loads on Photovoltaic Structures," Colorado State University, Ft. Collins, Colorado (to be included as part of Bechtel Contract Report /fr05-6195).
15. Mi11er, R., and Zinunerman, D., "Wind Loads on Flat Pfate Photovoltaic Array Fields," DOE/JPL 954833-79/2 (JPL Contract Report), Boeing Engineering and Construction Co., Seattle, Washington, September 1979.
16. "National Assessment of the Urban Particulate Problem: Volume II --Particle Characterization," EPA-450/3-76-025, U.S. Environmental Protection Agency, Research Triangle Park, North Carolina, July 1976.
17. Kuletz, E., and Schafer, H., "SurvPy 0f and Study on·sand and Dirt," NWC TP 5170, Naval Weapons Center, China Lake, California, August 1971.
18. "Operation and Maintenance Cost Data for Residential Photovoltaic Modules/Panels," DOE/JPL 955614-80/1, (JPL Contract Report), Burt Hill Kosar Rittlemann Associates, Butler, Pennsylvania, July 1980.
R-2

APPENDIX A
MODULE SOILING DATA
The percentage of change in Pmax and Isc for various modules at various sites across the country is tabulated in this Appendix. The information is organized by manufacturer code (A, B, c, or D); top-cover ~aterial (silicone rubber, glass, or silicone hardcoat) and a block-purchase designator indicating module generation (I, off-the-shelf module type, 1976; II, modules fabricated to meet a uniform set of design and test requirements, 1977). Also indicated in the table are the number of modules on which the performance data is based, the field site location, a climatological and pollution classification of the site, tilt of the modules from horizontal, whether or not the modules were providing power to a load, the duration of the exposure, and the percentage of change in Isc and Pmax• The change percentages were calculated using the expressions given in Section II. The current-voltage characterizations (I-V curves) on which these calculations were based contain measurement inaccuracies due to such causes as differences in spectral content of the light sources, differences in reference standards (e.g., air mass and temperature), and operator error. The raw data measurements have not been corrected for these inaccuracies.
A·l

Table A-1. Effeets of Field 3oiling on Module Perfo::-mance (Mfr J..; Outer Cover, Float Glass)
Ch.arge in Isc (%) Change tn Pmax (%)
"' c OJ 0 OJ .... . ... " :l ... :l OJ OJ
" " "' "' .... Oil .... 00 OJ 0 " 0 ·lJ .0 c -~ OJ .0 c -~
.0 :.: :l "- ~ "' .... 00 " "' .... 00 0:: 6 ,:::, X -~ " c c 0 " c c 0 :l .... 1"1 .... OJ "' .... .... OJ "' . ...
.... z ·o OJ OJ 00 > OJ c OJ 00 > OJ c .... " ..... "' c 0-< "' "' c 0-< "' "'-" " :l 0 .... u u OJ .... u u OJ ... u OJ "' .... c .... OJ I .... .... c .... OJ I .... OJ 0 .0 0 OJ .. ,, ~ " .... u "' "' "' ... .... u 0::.-< 6 .u. ..... .... OJ _, c "' .... QJ .... c "' OJ<Q :l Field Site Clas ~- i fica tion Ti~t Loa:! X "' 0.-< ~ 0 0 :>.. 0.-< 0 0 0 :>.. t.:>~ z "' "" C-4U E-.;;: p.. "' !-<U f-<ZP.. "'
I 3 DSET Desert, Open )!.0 oc 161 d 05/77 - ll/77 -3 -2 +1 Phoenix, AZ
I NASA Lewis Sub~rban L(O oc 74 d 10/76 - 01/77 +2 +2 0 +1 0 -1 Cleveland, OH! near llirport 83 d 03/77 - 05/i7 -3 +3 +6 -5 +1 +6
::t> 32 d 06/77 - 07/77 0 0 0 -1 -3 -1
I 54 d 07/77 - 09/i7 +3 +3 0 0 -2 -2 N 57 d 09/77 - ll/i7 +1 +2 +1 -1 +1 +2
230 d 03/77 - 1-l/77 -7
I Air Polll;tion Ct~ Industrial 40:> oc 81 d 10/76 - 01/?7 -4 +2 +6 -6 +2 +7 Cle·:eland, OH near Steel Mi 11 90 d 03/77 06/77 -4 +2 +6 -5 0 +5
30 d 06/77 - 07/77 -2 -1 +1 -4 -4 0 54 d 07/77 - 09/i7 -1 '1-2 +3 -4 -3 +1 58 d 09/77 - 11/77 -5 0 +5 -6 -1 +5
230 d 03/77 - ll/17 -7
I .)ubtropical Testi3g Su":>tropical 5(• cc I yr 09/76 09/77 +: •2 +I -1 +1 +3 Miami, FL
I So. Florida Testing Sub t :opica 1 ;.c (): 1 yr 10/76 - lOin ·-] -I +2 -5 . -6 -I Miami, FL
I Solar Testing Subtro?i-:a 1 LSC oc I yr 09/76 - 09/7i -3 -3 0 -I -I 0 Fompano Beach, FL
* % Improvement from ~oile.J c e-nd i:t i on eel ermined by obtainir:g per fc·rmance data before and aEter cleanin:; ·using techniques listed on Page 2 oc Open Circuit

Table A-1. Effects of Field Soiling on Module Performance (Mfr A; Outer Cover, Float Glass) (Continuation 1)
Change 1n Isc (%) Change in Pmax (%)
"' " (J 0 Q) .... ... ::> ... ::> Q) Q)
... -c "' "' .-< 00 ..... 00 Q) 0 ... 0 Q) .D " -~ OJ .D " {(
.D :.:;. ::> 0.. ... "' .... 00 ... "' .... 00
" 6 0 >< 0 ... " " 0 ... " " 0 ::> ..... "' ~ Q) "' .... ~ Q) "' .... .... z 0 Q) Q) 00 > Q)
" Q) 00 > o;
" ... ... ..... "' " O.-< "' "' " o~ "' "'~ ... ::> 0 .... u u Q) .... u " Q) ... u Q) "' .-< " .-< Q) I .-< .-< " .... Q) I ....
Q) 0 .D 0 Q) "' "' "' ... ... u "' "' "' ....... u C.-< 6 0.. ... ... Q) ... " "' ... Q) ... " v,
"'"' ::> Field Site CLassification Tilt Load >< "' 0.-< 0 0 0 >. O.-< 0 0 0 >. u~ z "' 0 E-<U E-<ZP. "' E-<U E-<ZP. "'
Carib. Testing Tropical so oc 1 yr 09/76 - 09/77 +1 +3 +1 -6 -2 +3 C.abuas, PR
I 12 Sci. & Ind. Museum Metropolitan 45° Yes 10 mo 07/7? - 05/78 -3 -1 +2 -7 -4 +3 Chicago, IL
> 9 ME/LL Subt:rban 45° oc 7 mo 05/77 - 12/77 +2 I (...; Lexingto,, MA
2 NYU Net•·opo li tan 45° oc 6 mo 01/73 - 06/78 -12 -2 +10 -12 -2 +10 2 NYC, NY 5 mo 07 /7B - 12/78 -2e +6e +8 -7e Oe +7 2 6 mo 01/79 - 06/79 -49e -Be +45 -30e -20e +13
2 •:olumbia u ~:etropoli.tan 45° oc 6 mo 01/78 - 06/78 -11 +3 +13 -12 0 +12 -:<Y:, NY
2 Mt. Washington Mount a in, Open 45° oc 8 mo 10/77 - 06/78 +2 2 NH 1 yr 10/77 - 10/78 -1e 0 +1 -1 0 +1
. 2 NlT Net copo li tan 45° oc 5 mo 08/77 - 01/78 -14 -7 +8 -15 -9 +6 2 Cambridbe, MA 6 mo 01/78 - 06/78 -6e -1e +4 -10e -7 +3
6 mo 06/78 - 01/79 -6e -1e +5 -20e -15e +6
* % Improvement fron so i 1 ed condition determined by obtaining performance data be fore and after cleaning using techniques listed on Page 2 oc (•pen Circuit
e <?stimated by con paring field module and reference module I-V curves

Table A-2. Effects of Field S0ili~g on Module Perfor~ance (Mfr B; Outer Cover, RTV 615)
Change in Isc (%) Change in Pmax (%)
U) c Q) 0 Q) ... " .... " Q) "' ... .,
"' U) - 00 -00 Q) 0 ... 0 Q) .D c ~ Q) .D c ,,
.D :>: " 0. ... "' .... 00 ... "' .... 00 c 13 Q .. 0 ... c c 0 ... c c 0 " ..... "' ..... Q) "' .... ..... Q) "' . ... .... z 0 Q) Q) 0() > Q) c Q) 00 > Q) c .... ... ..... "' c o- "' "' c o- "' "'"" ... " 0 .... u u Q) .... u u Q) ... u Q) U) -c -Q) I - -c -Q) I -Q) 0 .D 0 Q) "' "' "' ... .... u "' "' "' ... .... u c- e; 0. .... .... Q) .... c U) .... Q) .... c U)
Q)<Q " Field Site Classific1'tion Tilt .. "' o- 0 0 0 "' o- 0 0 0 "' o~ z Load "' Q E-<U E-<Zo.. "' E-<U E-<ZO.. "'
3 DSET [teser t, Open 340 :JC 161 d 0'>/77 - 11/77 -11 -2 +9 Phoenix, A:.
I NASA Lewis ~uburban 4JO JC 74 d 10[76 - J1/77 -8 -I +7 -8 -1 +8 Cleveland, OH rear Airport 83 d 03!77 - J5/77 -14 -7 +8 -15 -7 +9
32 d 06/77 - •)7/77 -10 -8 +1 -11 -10 +1 ;J> 54 d 07/77 - o)9/i7 -8 -8 0 -9 -9 0 I ~ 57 d 09/77 - ll/77 -II -10 +2 -n -10 +I
230 d 03/77 - ll/77 -11
Air Pollution Ctr Industrial 40° oc 81 d 10/76 - 01/77 -34 -3 +32 -35 -4 +32 Cleveland, OH near Steel Mi 11 90 d 03/77 - 06/77 -31 -11 +23 -34 -14 +23
30 d 06/n - 07/77 -21 -15 +7 -23 -17 +7 54 d 07/77 - 09/77 ° -21 -14 +8 -23 -17 +8 58 d 09/17 - 11/77 -23 -17 +13 -29 -17 +14
230 d 03/77 - ~ 1/77 -39
Subtropica 1 Test ir,g Subtropica~ :.o C•C 1 yr 09/'6 - 09/77 -11 -10 +2 -12 -9 +3 Miami, FL
I So. Florida Testing Subtropica 1 cO cc 1 yr 10/''6 - 10/77 -13 -11 +2 -13 -9 +4 M:ami, FL
I Solar Test i·1g Subtropical :.s·o cc 1 yr '09/~6 - 09/77 -8 -6 +2 -9 -8 +2 Pompano Bea:h, FL
I Carib. Test.ng Tropical so oc 1 yr 09/~6 - O~i77 -25 -20 +6 -20 -13 +8 Caguas, PR
* % Improvemer.t from so~1ed condition determined by ob~e.i:1ing pecfor'llance dcta befcre and after clcani•g using techniques listed on Page 2 oc Open Circuit

Table A-2. Effects of Field Soiling on Module Performance (Mfr B; Outer Cover, RTV 615) (Continuation 1)
Change in 1sc (%) Change in Pmax (%)
Cl) c QJ 0 QJ ..... .... ... " u " QJ QJ
... "0 "' Cl) ..... U) ..... oJ QJ 0 ... 0 QJ .0 c -~ QJ .0 c -~
.0 :>: " 0.. ... "' .... 00 ... "' ·~ 00 c 13 .... 0 >< 0 ... c .5 0 ... c c 0 "
.., ..... QJ "'
..... QJ "'
.... .... :z 0 QJ QJ 00 :> QJ c QJ c.o :> '" c u ... ..... "" c Q.-< "' "" c Q.-< "' "'-"' ... " 0 .... u u QJ .... u u QJ
... u QJ Cl) ..... c ..... QJ I ..... ..... c ..... QJ I ..... "' 0
.0 0 QJ "' "' "' ... u u "' "' "' ... u u C.-< 13 0.. u u QJ u c Cl) u QJ u c "' .,., " Field Site Classif:cation Tilt Load >< "' 0 -·
0 0 0 ;>, 0.-< 0 0 0 ;>, o~ :z .., 0 f-<U f-<:ZP.. "" f-<U f-<:ZP.. "" II JPL Suburban 34° oc 1 yr 12/77 - 12/7B -26 -2B
Pa.sade:ta, CA
II MIT l~etrc·po~itan 45° oc 5 rna OB/77 - 01/7B -12e +2e +13 +13 2 Camb-:-ijge,MA 6 rna 01/7B - 06/7B -26e -13e +16 -30e -16e +16
6 mo 06/7B - 01/79 -27e -17e .;.12 -35e -32e +5
>- II 15 MIT/LL Suburba:1 45° oc I 2 mo 05/77 - 07/77 -3e Oe +2 +3 VI 15 Lexington, 1-'rA 9 mo 07/77 - 04/7B -Be -5e +4 +B
17 11 mo 05/77 - 04/7B -12e -3e +9 +10
II NYU Metropolitan 45° oc 5 mo 06/77 - 12/77 -25e -3e +23 +19 NYC, NY 5 mo 01/7B - 06/7B "-34e -14e +24 -41e -24e +23
1 yr 06/77 - 06/7B -41e -14e +31 -43e -15e +33 2 5 mo 07/7B - 12/7B -30e -Be +23 -34e -12e +25
6 mo 01/79 - 06/79 +43
II Columbia u Metropclitan 45° oc 5 mo 06/77 - 12/77 -25e Oe +25 +21 NYC, NY 5 mo 01/7B - 06/7B -32e -12e +23 -34e -16e +21
1 yr 06/77 - 06/7B -39e -12e +31 -42e -19e +29 2 6 mo 01/79 - 06/79 -47e -Be +40 -61e -33e +43
seas. II B Irr ig~ tion Project Agricultura 1 15° to 60° YES 5 mo 07/77 - 12/77 -7e +3e +10 +7
25 MeaC., NE 7 mo 07/77 - 02/7B +2e +10e +B + 11 2B 9 mo 07/77 - 04/7B -lle -4e +7 -16e -10e +6 2B 12 mo 07/77 - 07 /7B 7 to 11 2B 14 mo 07/77 - 09/7B 9 to 16
*Late Block I' A!l Block II, III e = Estimated

Table A-3 .. Effects of Field Soili~ on M::>dule Performa:1ce (Mfr C; Ou.ter Cover, Sylgard 184)
Chmge in Isc (%) Change in Pmax (%)
"' g llJ llJ .... ... ... ;:J .., ;:J llJ llJ ... "0 "' "'
.... 01) .... 00 llJ 0 / ... 0 llJ .0 t: ;. llJ .0 t: ;.
.0 :E ;:J Q. ... "' ·.< 00 ... "' ... 00 t: e Q >< 0 ... t: t: 0 ... " " 0 ;:J .... l<l .... llJ "' ... .... llJ "' . .. ... z 0 llJ llJ 00· > llJ
" llJ 00 > llJ " .., ... .... "' " O.-< "' "' " O.-< "' "'""' ... ;:J 0 ·.< u u llJ ... u u llJ ... u llJ "' .... t: .... llJ I .... .... t: .... llJ I .... QJ 0 .0 0 QJ "' "'
,. ... .., u "' "' "' ... ... u , .... e Q. ... ... llJ ... " "' ... llJ ... " "' llJ"' ;:J
Field Site Cassification Tiit Load >< "' ·o .... 0 0 0 » 0.-< 0 0 0 » u~ z o..J Q E-<U E-<ZP.. "' E-<U E-<ZP.. "'
I 3 DSET Desert, Open 3~0 oc 161 d o5rn - 11/77 -11 -2 -9 Phoenix, AZ
I NASA Lewis St:burban ~co C•C 74 d 10/76 - J1/77 -7 0 +8 -10 -2 +8 Cleveland, :•H near Airport 83 d 03/77 - 05/77 -13 -4 +10 -16 -6 +10
;t> 32 d 06/77 07/77 -6 -4 +3 -9 -10 -1 I 54 d 07/77 09/77 -6 -5 +2 -12 -9 +4 0' 57 d 09/77 - L 1/77 -11 -6 +5 -11 -9 +2
230 d 03/77 - 11/77 -14
I Air Polluti.::m Ctr Ir.dt:strial .. o:> oc 81 d 10/16 01/77 -27 -1 +26 -28 -3 +26 Cleve land, (lH near Steel Mill 90 d 03/17 - 06/77 -26 -5 +23 -29 -8 +23
30 d 06/•7 - 07/77 -19 -8 +12 -17 -11 +6 54 d 07/•7 - 09/77 -16 -7 +9 -20 -14 +7 58 d 09/''7 - 11/77 -23 -10 +14 -24 -12 +26
230 d 03/"7 - 11/77 -36
I Suo tropical [esdng su:,tropical s.=> O•: 1 yr o9r6 - 09/77 -<;; -5 +4 -9 -1 +8 Miami, FL
I So. Florida Test in~; su·nropica 1 s=> O•: 1 yr 1or6 - 10/77 -3 +1 +4 -10 -6 +5 Miami, FL
I Sola:- Testir.g Su;Hropical qs.=> oc 1 yr 09/~6 - C9/77 -11 -6 +4 -15 -12 +3 Pompano Beach, n
I Carib Testir;l: 7ropica 1 s·> oc 1 yr 09/;6 - 09/77 -14 -6 +9 -14 -5 +9 Caguas, PR
* % Improvement £rom soi:ed cor.di~ion ile:ermined by· ::>btairing performance data be for~ and after clean:~ using techniques li'sted on Page 2 oc Open Circuit

Table A-3. E:fects of Field Soiling on Module Performance (Mfr C; Outer Cover, Sylgard 184) (Continuation 1)
Change in lsc (I.) Change in Ptr.ax (%)
<ll c <;) 0 Q) ... "
~ " Q) Q) ,, <ll - 00 -00 ... " ... 0 Q) .D c -!< "' .D c -:<
'"' 0
" Q. ... "' ..... 00 ... "' ..... 00 .D :>::
Cl >< 0 ... c .s 0 ... c c c = .... "' .... Q) "'
..... Q) "'
..... 0 " <;) Q) 00 > Q) c Q) 00 > Q) c ·~ z 0 ... ..... "" c o...,. "' "" c a- "' ~
" 0 ..... u u Q) .... u u Q)
"-"' ... <ll - c Q) I - - c Q) I -... u <;) 0 Q) "' '" ., ... ~ u "' "' "' ... ... u
'"' 0 .D c.. ... ... Q) ... c <ll ... Q) ~ t: (/)
c- 5 >< " a ..... 0 0 0 "' a- C· 0 0 "' Q)"" " field Site Classification Ti 1 t Load "' Cl f-<U f-<Z"- "" f-<U f-.Z"- "" '-'~ "'
II Nt. Washing ton Mountain, Open 45° oc I yr 10/77 - 10/7B -13e -12e +1 -1e Oe +1 NH
II HIT, ~et~opolitan 45° oc 5 rna OB/77 - 01/7B -21 -B d5 -22 -9 +14 O:ambr i dge, MA 6 rna Ol/7B - 06/7B -19 -5 +15 -9 -B +16
6 :>
rna 06/7B - 01/79 -19e -5e +14 -27e +10e +34 I
-.J II NY:J Met7opolitan 45° oc 5 rna 06/77 - 12/77 -25e -2e +24 +20 :-IY·:, NY 5 rna 01 /7B - 06/7B -34e -11e +26 -26e +5e +29
1 1 yr 06/77 - 06/7B -41e -12e +34 -37e +1e +3B 2 5 rna 07 /7B - 12/7B -23e -3e +21 -Be +15e +20 2 6 rna 01/79 - 06/79 -69e -15e +64 -60e -17e +52
II Columbic u Netropolitan 450 oc 5 rna 06/77 - 12/77 -17e Oe •20 +12 NYC, NY 5 rna 01/78 - 06/7B -25e -12e +22 -18e +Be +25
I yr 06/77 - 06/7B -39e -12e +33 -33e +6e +37 i 6 rna 01/79 - 06/79 -4Be -Be +43 -57E' -16e +49
seas. II 12 lrr igat ion Project Agricultural JSO to 61)0 YES 3 rna 07/77 - 10/77 -7e -3e +4 +5
6 ~lead, NE 5 rna 07/77 - 12/77 -4e +4e +8 +7 12 7 rna 07/77 - OB/7B -le +Be +6 +7 12 9 rna 07/77 - 04/7B -JOe -Se +5 +5
*Late Block I' All B~ock II, Ill e = Estimated

Table A-4. Effects of Field Soiling on ~'1odul2 Performance (Hfr D; Outer Cover, Dow Corning Xl-2577)
Change in lsc (%) Change in Pmax (%)
.. " 01 0 01 .... " " ....
=- 01 01 ... -o "' II.• .... 00 ..... 00
"' 0 ... C· "' .t:J " ;c "' .t:J " -lc .t:J ;,;:: " c. ... "' .... 00 .... "' .... 00
" s Q ~ 0 .... " " 0 .... " " 0 " ..... "' ..... "' "' .... ..... "' "' .... .... ;z 0 "' v tO > "' " "' 00 > "' " .... ... ..... "' c 0.-< "' '"' " C.-< "' "'-"' 1- " 0 .... u u "' .... u u "' ... u .. <I) .... " .... "' I .... .... "
.... "' I ..... "' 0 .c:. 0 "' '11 "' <U .... .... u "' "' "' .... ... u .:..-. ~ 0. .... .... "' .... " <I) .... "' .... " ... "'"' z Field Site· Classi ficatio;, ':"i 1 t Load >< "' 0..-< 0 0 0 >. 0.-< 0 0 0 >. u~ "' Q f-<U E-<:Z"" "' f-<U E-<:Z"" "'
3 DSET Desert, Open 340 oc 161 d 05/77 - 11/77 -6 -2 -4 Ptoenix, -'-Z
NASA Lewi; Suburban :.oo oc 74 d 10/76 - 01/77 -10 -3 +7 -9 -3 +6 Cleveland, OH near Airport 83 d OJ;/77 - 05/77 -17 -9 +9 -18 -10 +9
32 d 06/77 - 07/77 -11 -11 0 -12 -15 -3 ;:t> 54 d 07177 - 09/77 -9 -7 +2 -10 -10 0 I 57 d 09177 11/77 -12 +1.0 +3 -12 -8 +4 00 -
230 d 03177 - 11/77 -10
Air Pol lucien Ctr Industrial .. oo oc 81 d 101 76 - 01/77 -32 -13 +28 -31 -9 +25 Cleveland, OH near Steel Niil 90 d 03'77 - 06/77 -30 -12 +20 -32 -13 +22
30 d 06'77 - 07/77 -18 -14 +10 -20 -17 +4 54 d 07'77 - 09/77 -20 -13 +12 -22 -16 +7 58 d 09'77 - 1 L/77 -26 -14 +13. -25 -14 +12
230 d 03'77 - 11/77 -32
Subtropicrul Testing Subtropical so oc 1 yr 09'76 - 09/i7 -11 -8 +4 -10 -9 +2 Miami, FL
So. Florid3 Te:sting Sub t:-opica 1 • so oc 1 10.'76 10/77 -6 -3 +4 -7 -4 +4 yr -l1iami, FL
Solar Testing Subtropical :.so oc 1 yr 09."76 - 09/77 -12 -6 +6 -20 -7 +14 Pompano Be3ch. FL
Carib. Tes:in€ Tropica 1 so oc 1 yr 09;76 - 09/77 -12 -7 +5 -20 -18 +3 Caguas,. PR
* % Imp~c·vement from S•J i 1 ed cone itl en determir.ed b; OJ :a.ining performance data be fc·re ar.d after c1ean:ng using techniques listed on Page 2 oc Open Circuct

> ....,
Table A-4. Effe2ts of Field Soiling on Module Performance (Mfr D; Outer Cover, Dow Corning Xl-2577) (Continuation 1)
Change in 1sc (%) Change in Pmax (%)
(I) <= <lJ 0 <lJ ..... .... ::> '-' ::> <lJ <lJ
.... " "' (I) ..-< 01: ..-< 00 <lJ 0 .... 0 <lJ .0 <= ;c <lJ .0 <= ;c
.0 :>: ::> Cl. .... "' ..... 00 .... "' ..... 00 <= e c: " 0 .... <= <= 0 .... <= <= 0 ::> ..... "' ..... <lJ "'
..... ..... <lJ "' . .... :.-1 z 0 <lJ <lJ 00 > <lJ <= <lJ 00 > <lJ <= '-' .... ..... "" <= C.-< "' "" " 0.-< "' "'""' .... ::> 0 ..... u u <lJ ..... u u <lJ .... u <lJ (I)
..-< " ..-< <lJ I ..-< ...... " ..-< <lJ I ......
<lJ 0 .0 0 <lJ "' "' "' .... '-' u "' "' "' .... '-' u
"'"' e Cl. '-' '-' <lJ '-' <= (I) '-' <lJ '-' " (I)
<lJOO ::> Field Site Classification Tilt Load " "' 0.-< 0 0 0 ,., 0.-< 0 0 0 ,., u~ ;z; "' Q E-<U E-<ZP.. "" E-<U E-<ZP.. ""
seas. II MeradcO!I Suburban 15° to 62° YES 2 yr 04/7 7 - 04/79 +15 +15
Ft. Bel,;oir, VA
II 1 MIT 11et:ropolitan 45° oc 5 mo OB/77 - Ol/7B -12e +le +13 -14e -4e +10 2 Cambridge, MA 6 mo Ol/7B - 06/7B -14e -Be +7 -23e -1Be +6
6 mo 06/7B - 01/79 -16e -6e + 11 -3le -20e +3
II 3 MlT /LL Suturban 45° oc 5 mo Ol/7B 05/7B -l3e -lOe +4 -Be -5e +3 Lexington, MA
II 2 N'!U Metropolitan 45° oc 6 mo 01/7B - 06/7B -31e -11e +23 -31e -10e +24 3 N'!C, NY 5 mo 07/7B - 12/7B -25e -Be +19 -4Be -1Be +17 3 6 mo 01/79 - 06/79 -57e -23e +47 -41e -26e +20
*Late Block I' All Block II, III e = Estimc.ted

f ~-· _._...- --- ---- ...
' . ' '
THIS PAGE I ..
WAS IN'i'E'NTIONALLY · . · LEFT BLANK .
' ' ~ ' .
. '•
-- ~--'"' -·~+ - ". -~- ... -- --- _ ............ ~ ....... - . ... - ...... ~- . -~ '-- __ ,_,._- ... .. - --·...... ... ... _ . -·-· .. ,_ ___ - -~· ....
,. .
A-to

APPENDIX B
MATERIALS SOILING DATA
Transmission loss for seven representative top-cover materials subjected to soiling conditions at five sites in Southern California and four sites in the rest of the country is tabulated in this appendix. In Table B-1, the unwashed samples are identical samples of the same material placed in the sample rack at the same time with one being retrieved at the appropriate sampling interval. The sample is stored for subsequent analysis and studies. The washed samples (Southern California sites only) are retrieved, measured, washed using a standard soap and water procedure, and returned to the field. Transmission measurements were made using the apparatus shown in Figure 4. In Table B-2, transmission loss for seven top cover materials as a function of the applied voltage (+1500 V, 0) to the materials rack is tabulated.
B-1

Table B-1. Materials Soiling D:tta., Natiomvide Exposure Sites: Percentage Transmission Loss
Accum. Si.icone Proprietary Glass Glass Polyvinyl Exposure. Exposure R:~bber Silicone Glass (alumino- (Boro- Fluoride Acrylic
Retrceval Du;at ior. Duratior. (RTV 515) (QI-2577) (Soda Lime) silicate) silicate) (Tedlar) (KORAD 212) )ite o .. te clays days W(%• U(%) W(%) U(%) W(%) U(%) WI%) U(:t) W(%) U(%) W(%) U(%) W(%) U(%)
6-8-:-9 33 33 9 11 7 8 3 3 3 4 2 3 4 3 5 5 7-24-79 46 79 17 20 13 17 9 11 8 11 9 12 10 4 13 14 8-28-79 35 114 15 25 13 23 5 16 7 15 6 16 7 17 10 16
JPL 10-12-79 45 159 19 30 15 27 5 12 5 10 5 10 5 12 7 12 Pasadena, CA 11-H-79 -46 205 21 28 12 19 4 4 2 4 3 4 3 4 6 6 Tilt: 34° 1-10-79 -44 249 2£. 24 12 . 16 4 4 3 3 2 2 2 1 3 3 Placement: 2-25-79 46 295 31 26 15 17 4 4 ~ 3 2 3 1 2 4 4 5/7 I 79 4-9- T:l 44 339 3< 28 1<> 17 3 4 2 0 1 1 3 4 5
5-23-!10 44 383 36 lost 20 18 4 5 3 1 1 4 4 7 7
6-18-79 35 35 9 8 6 7 2 3 2 2 1 2 3 3 4 5 7-24- •9 37. 72 13 15 9 14 5 9 j 9 4 10 7 11 9 12 8-28-•9 35 107 12 19 10 18 5 12 :; 13 3 14 7 14 7 ·14
JPL 10-12-79 .;.5 152 14 25 12 23 3 10 L 6 3 8 6 11 6 8 tJ:j Pasadena, :A 11-27-79 .06 198 15 24 10 17 2 3 .. 3 2 3 3 3 4 5 I
N Tilt: 45<> 1-10- !9 44 242 16 24 10 16 3 3 ~ 3 1. 2 1 2 3 3 Placement: 2-25-80 .. 6 288 23 29 12 15 6 5 2 2 4 4 3 4 3 5/15/79 4-9-80 "'-'+ 332 24 27 14 17 4 3 2 0 1 3 3 3 3
5-23-80 <.4 376 28 31 18 20 6 5 5 3 1 2 7 4 8 6
5-31-;19 :o 30 8 9 5 6 4 6 4 5 4 5 6 7 B 7-5-79 '3.7 67 11 14 9 12 5 6 5 6 5 5 5 7 8 B 8-14- i'9 lAJ 107 14 21 10 17 6 8 6 12 6 11 6 11 9 13
SCAQMD 9-28-73 45 152 16 31 11 27 7 12 6 14 8 12 8 16 11 19 Pasadena, CA 11-12--79 l6 197 15 26 10 20 3 3 3 3 4 3 4 6 6 Tilt: 45° 12-27-:79 l6 242 16 26 10 19 3 3 .! 3 2 1 3 4 5 5 Placement: 2-12-S;) ~ 288 25 33 16 32 6 6 6 5 3 3 6 5 7 6 5/1/79 3-27-8) 43 331 .23 25 13 17 4 3 4 2 1 3 3 5 5
5-12-&l 45 376 28 33 15 20 6 4 5 4 .. 5 6 3 4 7 6
NOTE: W: Washed U: Unwashe:l

Ta-::>le B-l. Materials Soiling Data; Nationwide Exposure Sites: Percentage Transmission Loss (Continuation 1)
Accum. Silicone Proprietary Glass Glass Polyvinyl Exposure Exposure Rubber Silicone Glass (Alumino- (Boro- Fluoride Acrylic
Retrieval Dura don Duration (RTV 615) (QI-2577) (Soda Lime) silicate) silicate) (Tedlar) (KORAD 212) Site Date days days W(%) u:%> W(%) U(%) W(%) ll(%) W(%) U(%) W(%) U(Z) W(%) U(%) W(%) U(%)
7-23-79 46 46 16 19 12 15 10 11 11 9 10 12 13 12 15 9~4-79 43 89 14 28 11 24 8 16 13 6 13 7 21 8 2i
SCAQMD 10-22-79 48 137 9 20 8 14 2 8 1 1 0 0 1 5 3 3 Lennox, Cit. 12-10-79 49 186 23 28 14 23 7 8 6 13 6 7 7 9 4 11 Tilt' 45° 1-28-80 49 235 23 23 9 16 3 2 1 1 1 I 1 1 3 3 Placement:· 3-7-80 49 284 26 27 9 17 4 4 3 3 4 3 2 3 4 5 6/7/79 5-5-80 49 333 29 30 11 19 3 4 2 3 2 2 3 4 6 5
6-23-'80 58 381 33 38 16 21 10 8 7 8 6 6 7 7 6 6 8-11-so 49 430 39 46 19 31 12 15 12 14 12 13 15 16 10 16
6..:14~79 28 28 4 4 3 2 2 3 1 2 1 2 1 3 4 4 7-23-79 . 39 67 6 8 4 4 4 5 3 4 2 3 3 5 6 6
USCG 9-4-79 43 110 6 11 3 6 3 4 3 6 1 3 2 5 4 8 Pt. Vicente, CA 10'-23-79 49 159 7 13 4 6 1 2 3 4 0 0 0 0 2 3 Tilt: 45" 12-10-79. 48 207 14 23 6 7 4 4 4 4 4 4 4 5 4 5 Placemf!nt: 1-28-79 49 256 19 15 5 5 2 1 1 1 1 5 0 0 1 0
o:l 5/11/75 3-17-80 49 305 21 18 4 6 1 2 2 2 2 2 0 0 1 1
u 5-6-80 50 355 26 24 7 7 2 3 2 2 1 0 1 4 2 4 u 6;-18-80 43 398 34 ·lost 9 9 5 5 4 5 3 3 4 6 5 7
7-17-79 68 68 2(a) 8 2(a) 4 l(a) 2(a) 2. l(a) 2 2(a) 2 2(a)
8-22-79 37 105 2 4 2 1 1 2 0 1 1 1 0 0 2 2 Table Mountain 10-8-79 49 154 8 13 3 3 1 2 2 2 2 2 1 1 2 2 Wrightwood, CA 11-26-79 49 203 12 13 3 4 2 2 2 2 2 2 1 1 2 2 Tilt: 4!:0 1-14-80 49 252 19 7 3 3 1 9 2 2 0 1 0 0 2 2 Placement: 4-22-80 99 351 16 15 3 3 0 0 0 0 0 0 0 4 2 5/10/79 6-10-80 49 400 16 16 3 4 1 1 1 1 1 0 1 3
7-8-80 28 428 17 15 6 5 .2 2 1 1 0 1 4 4 7-28-80 20 448 16 18 3 4 1 2 Q 0 0 0 3 4
5-30-79 21 21 1 1 1 1 1 2 3 3 7-8-79 39 60 4 4 2 1 8 4 1 2 3
Goldstone, CA 8-27-79 50 110 3 5 2 2 2 2 1 0 1 1 2 2 Tilt: 45° 10-15-79 49 i59 (b). 4 6 2 2 1 2 0 0 0 1 2 3 Placemen~: 12-3-79 49 208 5 8 3 4 2 2 0 1 2 2 3 3 5/9/79 1-21-80 49 257 5 6 2 2 2 2 1 2 1 1 2
3-10-80 49 .306 4 6 2 3 1 2 1 0 1 0 1 4-28-80 49 355 4 8 0 2 0 0 0 0 1 0 0 6-18-80 51 406 8 2 3 2 3 0 3 2 3 4
OOTE: w: Washed u: Ur1washed
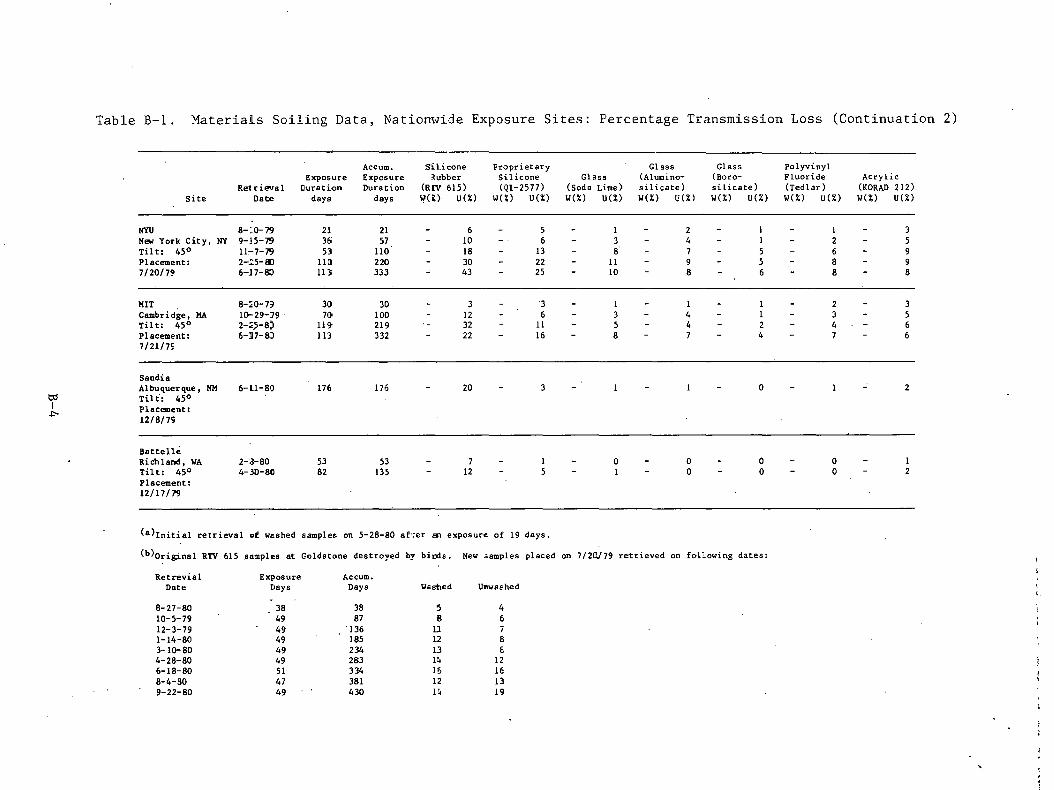
Table B-1. :iaterials Soiling Data, Nationwide Exposure Sites: Percentage Transmission Loss (Continuation 2)
Accum. :S'il.icone Froprietary Glass Glass Polyvinyl Exposure Expcsure ~ubber Silicone Glass (Alumino- (Boro- Fluoride Acrylic
Retrieval Ourati·on Duration (Rrv 615) (QI-2577) (Soda Lime) si li·:ate) silicate) (Tedlar) (KORAD 212). Site Date days days w<n U(%) W(%) U(%) W(%) U(%) W(%) U(%l W(%) U(%) W(%) U(%) W(%) U(%)
NYU 8-:.o-7"9 21 21 6 5 1 2 I I 3 New York City, NY 9-i5-7"9 35 57 10 6 3 4 I 2 5 Tilt: 45° 11-7-79 53 110 18 13 8 7 5 6 9 Placement: 2-'.::5-lll 11[) 220 30 22 11 9 5 8 9 7/20/79 6-J7-80 113 333 43 25 10 8 6 8 8
MIT 8-::o-B 30 30 3 '3 1 1 2 3 Cambridge, MA 1()-29-79 . 70 100 12 6 3 4 1 3 5 Tilt: 45° 2-:<,5-8, 119' 219 32 11 5 4 2 4 6 Placement: 6-]7-SJ 113 332 22 16 8 7 4 7 6 7/21/7S
Sandia Albuquerque, NM 6-Ll-80 176 176 20 3 0 2
o;:l Tilt: 45° I Placement: ~
12/8/75
Battelle RiChland, WA 2-3-80 53 53 7 1 0 0 0 0 1 Tilt: 45° 4-3D-8D 82 135 12 5 1 0 0 0 2 Placement: 12/17/79
(a)Initial retrieval af washed samples on 5-28-80 af·:er at exposure of 19 days.
(b)original RTV 615 samples at Goldstone destroyed b:; binds. New .;amples placed on 7/20/79 retrieved on foEowing dates:
Retrevial Exposure Accum. Date Days Days Yasned U11washed
'· 8-27-80 38 38 5 4 10-5-79 49 87 8 6 12-3-79 49 '136 ll i 1-14-80 49 185 12 8 3-lQ-80 49 234 13 6 4-28-80 49 283 l!t 12 6-18-80 51 334 l!i lE 8-4--~0 47 381 12 13 9-22-80 49 430 I'+ 19

Table B-2. High-Voltage at JPL, Pasadena, CA (450 Tilt); % RNHT Loss
RETRIEVAL DATE
MATERIAL VOLTAGE 2/11/80 5/16/80 7/16/80 10/28/80 (Initial (Relative D = 271- D = 95 . D = 61 D = 104 Placement to Ground) D9 = 366 D = 366 Da = 427 Da = 531 a 5/17/79)
% RNHT LOSS
Silicone +1500 25 32 36 60 Rubber -1500 25 30 33 47 (RTV 615) 0 24 31 35 51
Proprietary +1500 19 19 24 49 Silicone -1500 19 19 23 30 Ql-2577 0 19 19 24 36
Glass +1500 9 11 13 26 (Soda Lime) -1500 9 11 14 21
0: 7 5 10 18
Glass +1500 6 8 11 19 (Alumino- -1500 8 12 15 27 silicate) 0 6 4 7 15
Glass +1500 6 9 13 21 (Boro- -1500 9 11 17 39 silicate) 0 5 6 6 15
Polyvinyl +1500 9 12 15 29 Fluoride -1500 10 15 16. 40 (Tedlar) 0 4 5 7 21
Acrylic +1500 9 15 16 35 (Korad 212) -1500 10 17 17 33
0 6 7 7. 23
NOTE: n = Exposure Duration Since Previous Retrieval Date (days) Da· = Accumulated Exposure Duration (days)
B-5