master limited partnerships (mlps) & the u.s. energy renaissance
TRANSCRIPT
1
Cushing® MLP Asset Management, LPSwank Capital, LLC8117 Preston Road, Suite 440Dallas, Texas 75225214.692.6334www.swankcapital.com
CONFIDENTIAL – NOT FOR PUBLICATION OR REDISTRIBUTION
This is not an offering and is provided for informational purposes only.
Master Limited Partnerships (MLPs) & The U.S. Energy Renaissance4th Quarter UpdateNovember 8, 2012

2
DisclosuresCushing® MLP Asset Management, LP, which is an investment adviser registered with the Securities and Exchange Commission under the Investment Advisers Act of 1940 (“Cushing”) is a wholly-owned subsidiary of Swank Capital, LLC.
All information provided herein is for informational purposes only and should not be relied upon to make an investment decision. Past performance results relate only to the time periods indicated and are not at indication of, nor a reliable proxy for future performance. This presentation is being furnished on a confidential basis to the recipient, and is neither an offer to sell nor a solicitation of any offer to buy any securities, investment products or investment advisory services. The information contained in this document is the most recent information available to Cushing (except otherwise noted), however all of the information herein is subject to change without notice. Certain information included in this document is based on information obtained from sources considered to be reliable, however no representation may be made with respect to the accuracy or completeness of such data.
Certain information contained in this presentation may constitute “forward-looking” statements, which can be identified by the use of forward-looking terminology such as “may,” “will,” “should,” “expect,” “estimate,” or “believe” or other variations thereof. Due to various risks and uncertainties, actual events or results may differ materially from those reflected or contemplated in such forward-looking statements.
This presentation is not an advertisement for any product or service offered by Cushing® or its affiliates and is not intended for public use or distribution. This presentation is intended exclusively for use only by registered investment professionals. This presentation is not to be reproduced or redistributed to any other person without the prior consent of Cushing®.
3
Table of Contents / Agenda
I. Introduction to Cushing® MLP Asset Management & MLPs Pages 4 – 12
II. Key Drivers - The U.S. Energy Renaissance and It’s Implications Pages 13 – 25
III. Current Landscape - MLP Performance, Valuations & Capital Markets Pages 26 – 30
IV. Opportunities - MLP Subsector Focus & Investment Opportunities Pages 31 – 35
V. Investment Options - Strategies Across the Energy Supply Chain Pages 36 – 37
VI. Question & Answers
4
I. IntroductionCushing® MLP Asset Management & MLPs

5
The Hub for MLP and Energy Income Investors
« Cushing® manages over $2.2 billion1 in AUM.
« Our dedicated team of research analysts has robust exposure to energy infrastructure investing through prior roles as energy consultants, energy engineers, investment banking underwriters and asset allocators.
« Our Founder, Jerry Swank, has 38 years of experience and is a thought leader in the MLP space. Cushing® was created to build on his extensive energy research and investing experience.
« Cushing® offers a broad range of MLP investment options built on a centralized core of MLP research.
Founded in 2003 and headquartered in Dallas, Texas
1) As of September 30, 2012
1973 1981 1987 1997 2003 2006 2007 2009 2010 2012
Jerry Swank begins career in research and investing
First MLP launches
Congress passes legislation thatredefines MLP landscape and focuses it on energy investments
Rich Kinder forms KMP and is first to utilize MLP structure to anchor infrastructure growth strategy
Cushing's parent,Swank Capital,launches the firm’s first MLP hedge fund with plans to expandinto long-only as market matures
Cushing® launches additional hedge funds and begins management of Institutional, long-only portfolios
Cushing®
launches MLP closed-end fund
The Cushing® 30 MLP Index launches – the first equally weighted benchmark
Cushing® launches MLP open-end fund
Cushing® launches closed-end Royalty Trust fund
Cushing® launches open-end Royalty Trust fund
Cushing® launches closed-endRenaissance Fund
The Evolution of the MLP industry and Cushing® MLP Asset Management
6
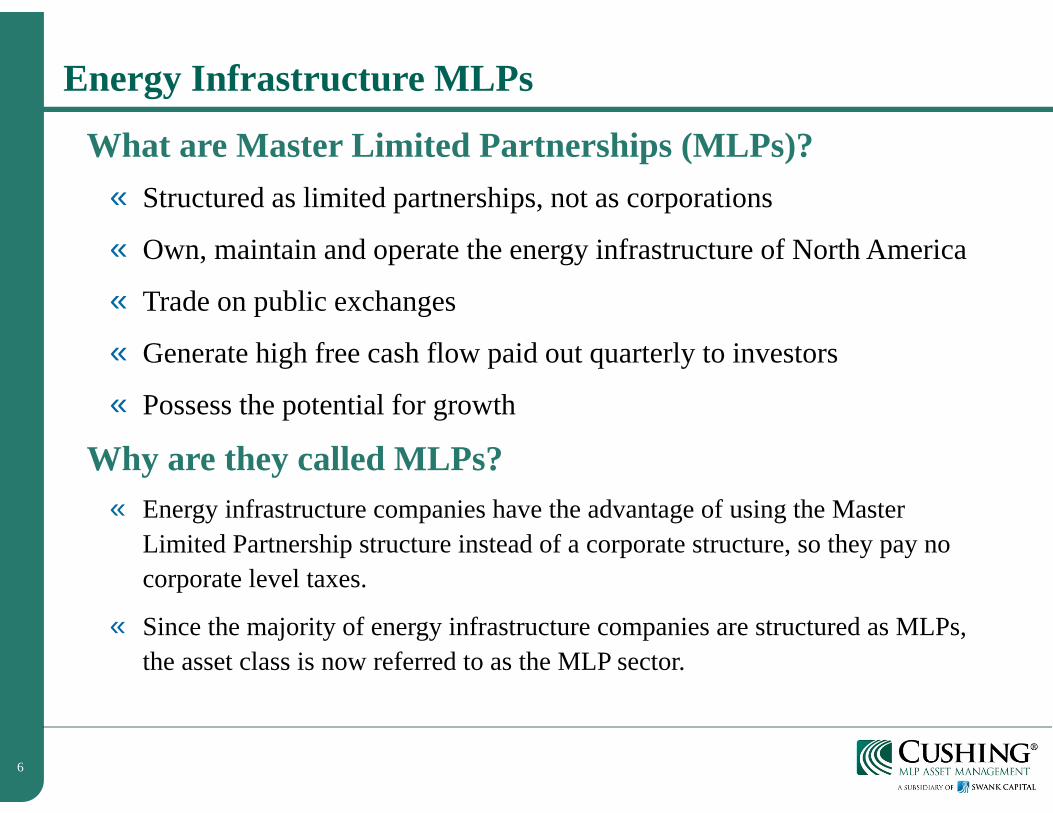
Energy Infrastructure MLPs
What are Master Limited Partnerships (MLPs)?« Structured as limited partnerships, not as corporations
« Own, maintain and operate the energy infrastructure of North America
« Trade on public exchanges
« Generate high free cash flow paid out quarterly to investors
« Possess the potential for growth
Why are they called MLPs?« Energy infrastructure companies have the advantage of using the Master
Limited Partnership structure instead of a corporate structure, so they pay no corporate level taxes.
« Since the majority of energy infrastructure companies are structured as MLPs, the asset class is now referred to as the MLP sector.

7
The Energy Value Chain
Companies which own or rely on energy infrastructure assets
Cushing® Expertise
Downstream
Product Uses
Commercial
Industrial
Residential
Refining
Midstream-Energy Infrastructure
Transportation and Storage
Pipeline
Gathering
Treating and Processing
Toll Road Business Model
Attractive distributions
Growth opportunity
Upstream
Oil and natural gas production
Drilling
Production
8
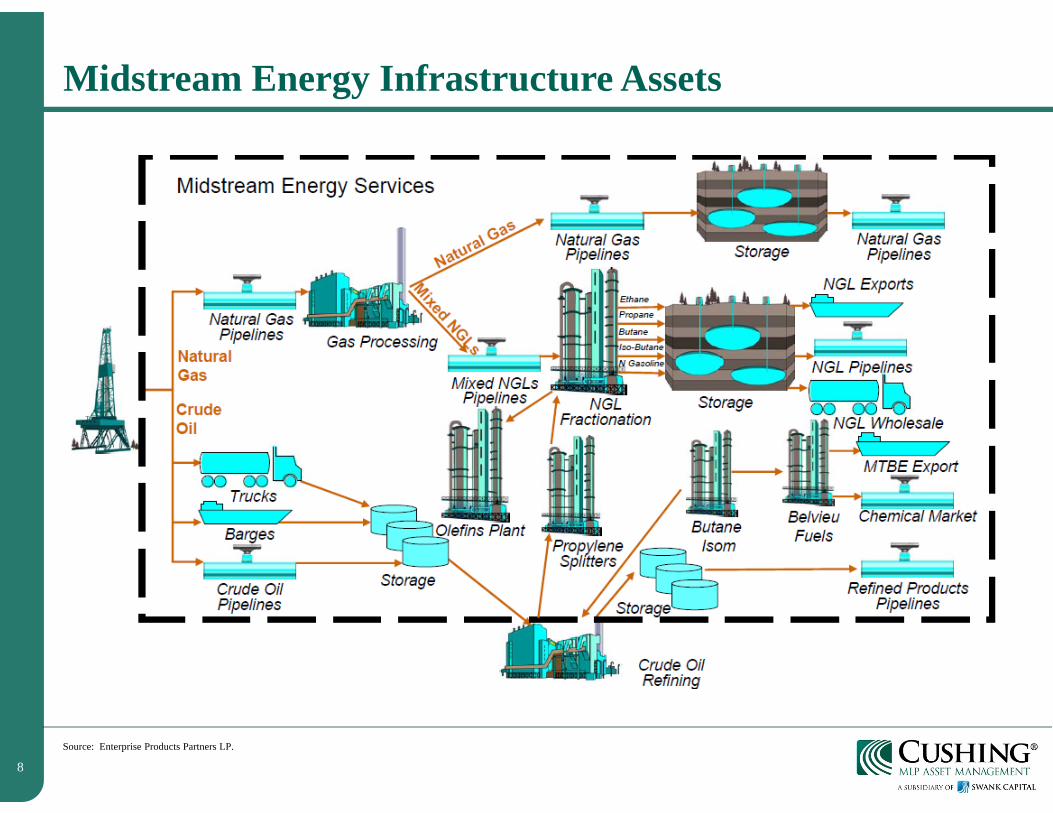
Midstream Energy Infrastructure Assets
Source: Enterprise Products Partners LP.
9
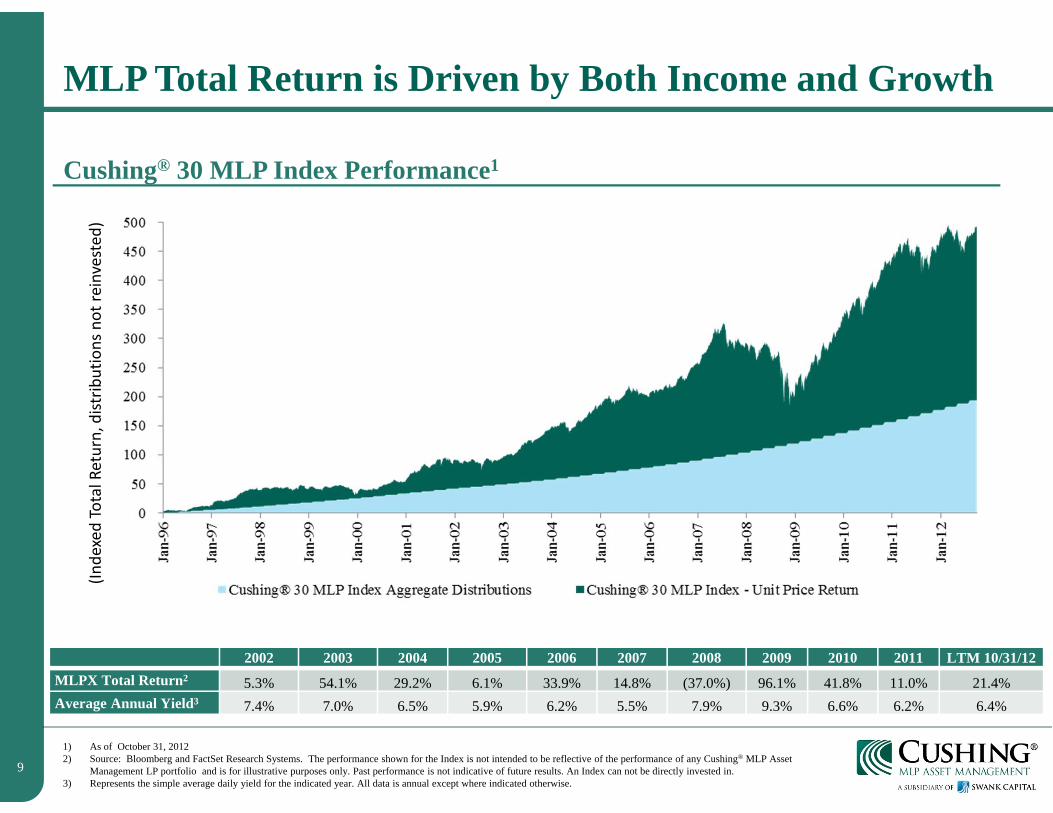
MLP Total Return is Driven by Both Income and Growth
1) As of October 31, 20122) Source: Bloomberg and FactSet Research Systems. The performance shown for the Index is not intended to be reflective of the performance of any Cushing® MLP Asset
Management LP portfolio and is for illustrative purposes only. Past performance is not indicative of future results. An Index can not be directly invested in.3) Represents the simple average daily yield for the indicated year. All data is annual except where indicated otherwise.
Cushing® 30 MLP Index Performance1
2002 2003 2004 2005 2006 2007 2008 2009 2010 2011 LTM 10/31/12MLPX Total Return2 5.3% 54.1% 29.2% 6.1% 33.9% 14.8% (37.0%) 96.1% 41.8% 11.0% 21.4%Average Annual Yield3 7.4% 7.0% 6.5% 5.9% 6.2% 5.5% 7.9% 9.3% 6.6% 6.2% 6.4%
(Indexed Total Return, distrib
utions not re
invested
)
10
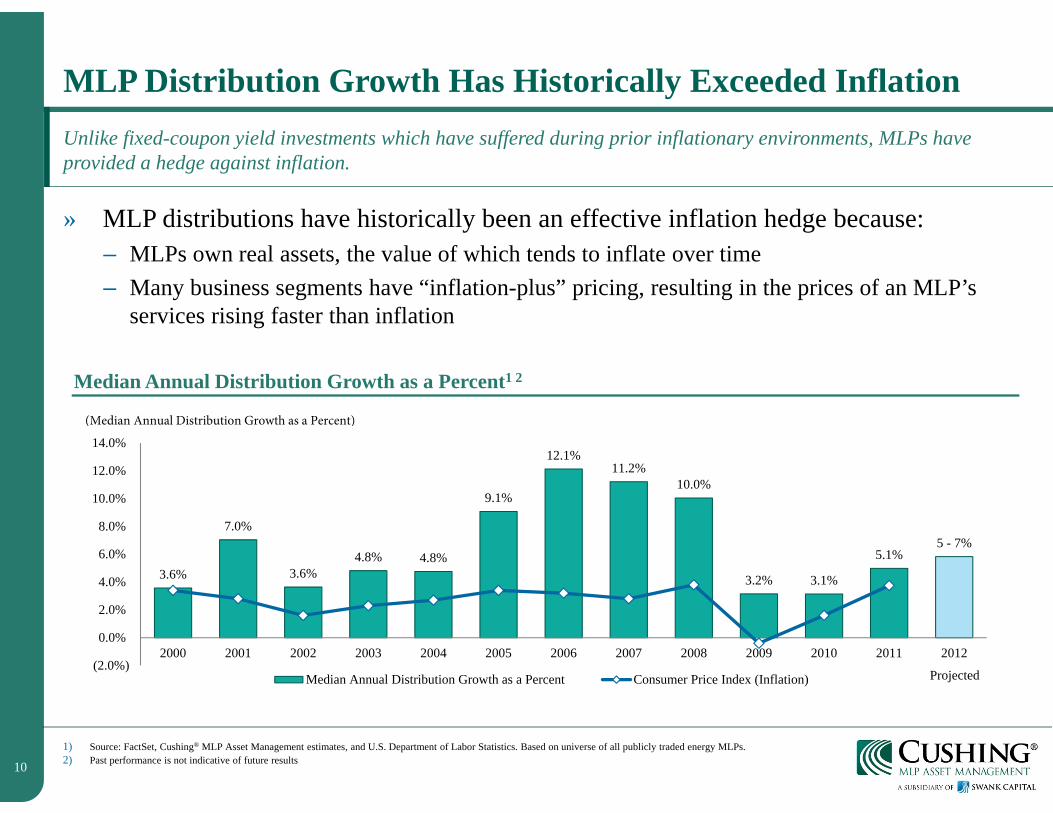
MLP Distribution Growth Has Historically Exceeded Inflation
» MLP distributions have historically been an effective inflation hedge because:– MLPs own real assets, the value of which tends to inflate over time– Many business segments have “inflation-plus” pricing, resulting in the prices of an MLP’s
services rising faster than inflation
Unlike fixed-coupon yield investments which have suffered during prior inflationary environments, MLPs have provided a hedge against inflation.
1) Source: FactSet, Cushing® MLP Asset Management estimates, and U.S. Department of Labor Statistics. Based on universe of all publicly traded energy MLPs.2) Past performance is not indicative of future results
Median Annual Distribution Growth as a Percent1 2
3.6%
7.0%
3.6% 4.8% 4.8%
9.1%
12.1% 11.2%
10.0%
3.2% 3.1%
5.1% 5 - 7%
(2.0%)
0.0%
2.0%
4.0%
6.0%
8.0%
10.0%
12.0%
14.0%
2000 2001 2002 2003 2004 2005 2006 2007 2008 2009 2010 2011 2012
Median Annual Distribution Growth as a Percent Consumer Price Index (Inflation)
(Median Annual Distribution Growth as a Percent)
Projected
11
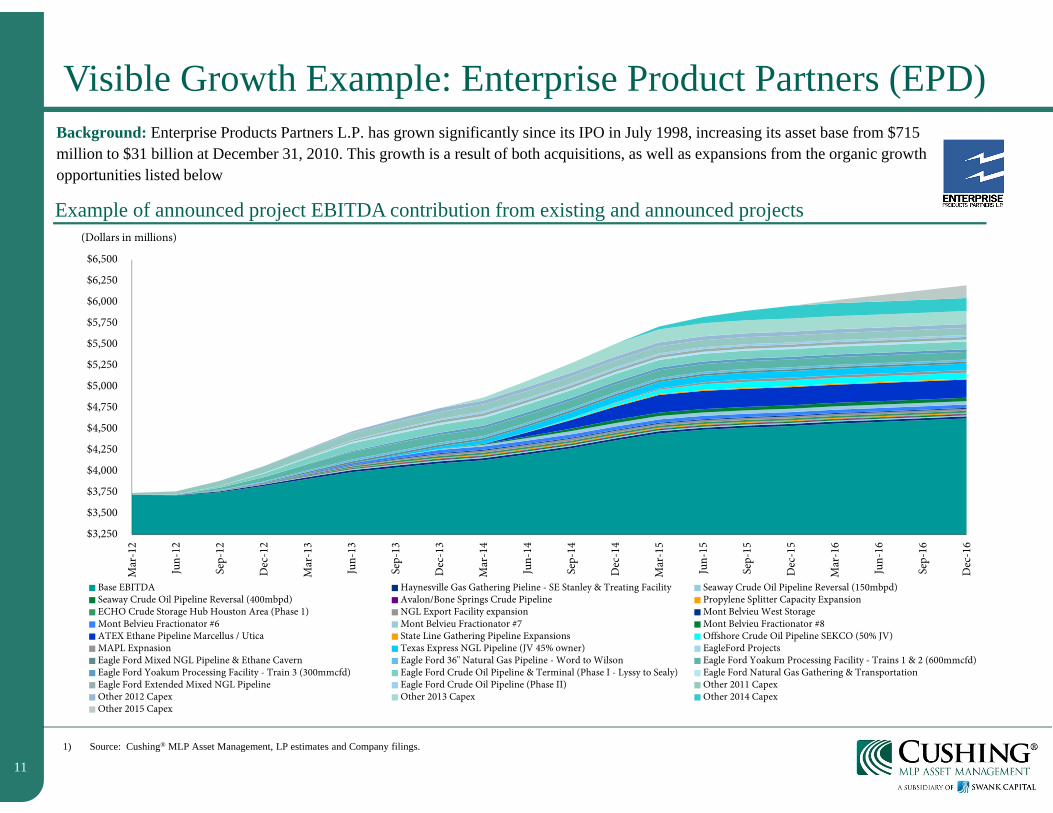
Visible Growth Example: Enterprise Product Partners (EPD)
1) Source: Cushing® MLP Asset Management, LP estimates and Company filings.
Background: Enterprise Products Partners L.P. has grown significantly since its IPO in July 1998, increasing its asset base from $715 million to $31 billion at December 31, 2010. This growth is a result of both acquisitions, as well as expansions from the organic growth opportunities listed below
Example of announced project EBITDA contribution from existing and announced projects
$3,250
$3,500
$3,750
$4,000
$4,250
$4,500
$4,750
$5,000
$5,250
$5,500
$5,750
$6,000
$6,250
$6,500
Mar
-12
Jun-
12
Sep-
12
Dec
-12
Mar
-13
Jun-
13
Sep-
13
Dec
-13
Mar
-14
Jun-
14
Sep-
14
Dec
-14
Mar
-15
Jun-
15
Sep-
15
Dec
-15
Mar
-16
Jun-
16
Sep-
16
Dec
-16
Base EBITDA Haynesville Gas Gathering Pieline - SE Stanley & Treating Facility Seaway Crude Oil Pipeline Reversal (150mbpd)Seaway Crude Oil Pipeline Reversal (400mbpd) Avalon/Bone Springs Crude Pipeline Propylene Splitter Capacity ExpansionECHO Crude Storage Hub Houston Area (Phase 1) NGL Export Facility expansion Mont Belvieu West StorageMont Belvieu Fractionator #6 Mont Belvieu Fractionator #7 Mont Belvieu Fractionator #8ATEX Ethane Pipeline Marcellus / Utica State Line Gathering Pipeline Expansions Offshore Crude Oil Pipeline SEKCO (50% JV)MAPL Expnasion Texas Express NGL Pipeline (JV 45% owner) EagleFord ProjectsEagle Ford Mixed NGL Pipeline & Ethane Cavern Eagle Ford 36" Natural Gas Pipeline - Word to Wilson Eagle Ford Yoakum Processing Facility - Trains 1 & 2 (600mmcfd)Eagle Ford Yoakum Processing Facility - Train 3 (300mmcfd) Eagle Ford Crude Oil Pipeline & Terminal (Phase I - Lyssy to Sealy) Eagle Ford Natural Gas Gathering & TransportationEagle Ford Extended Mixed NGL Pipeline Eagle Ford Crude Oil Pipeline (Phase II) Other 2011 CapexOther 2012 Capex Other 2013 Capex Other 2014 CapexOther 2015 Capex
(Dollars in millions)
12
MLPs Offer Unparalleled Attributes
» Attractive yield among income-oriented vehicles
» Superior risk-adjusted total return potential
» Provide energy market exposure with less risk than E&P companies
» Diversification instrument with low historical correlation to other asset classes
» MLPs have historically been an effective inflation hedge
13
II. Key DriversThe U.S. Energy Renaissance and It’s Implications
14
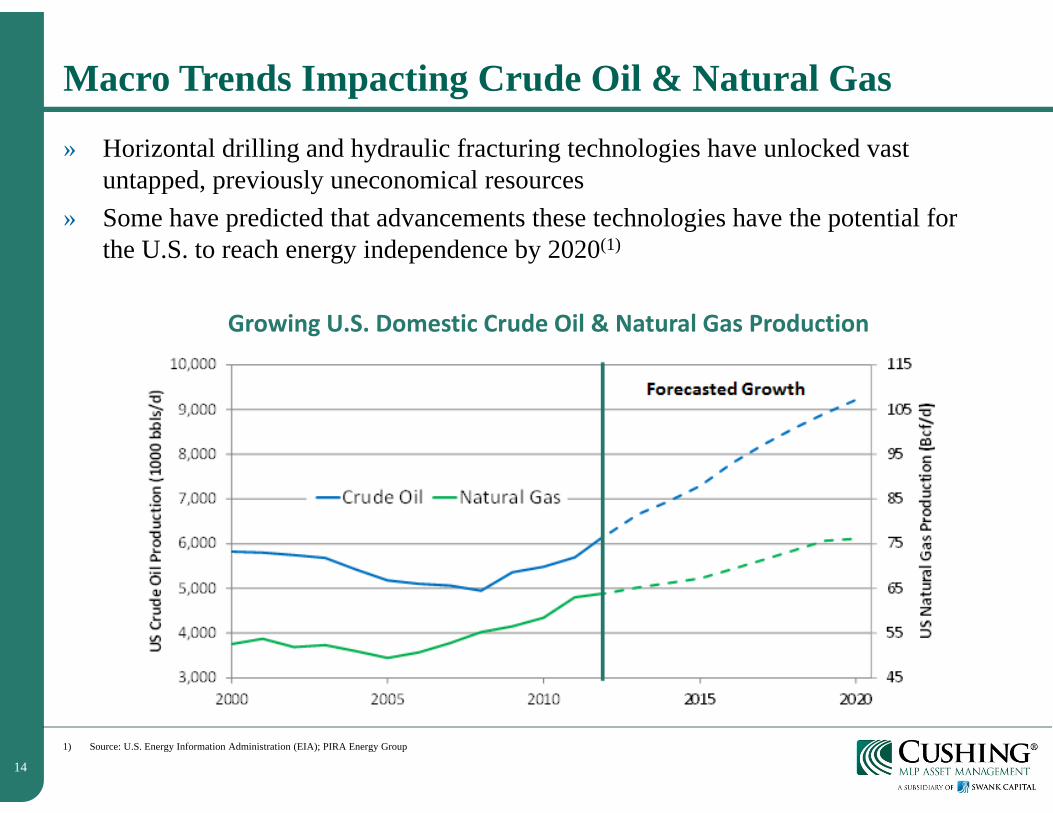
Macro Trends Impacting Crude Oil & Natural Gas
» Horizontal drilling and hydraulic fracturing technologies have unlocked vast untapped, previously uneconomical resources
» Some have predicted that advancements these technologies have the potential for the U.S. to reach energy independence by 2020(1)
1) Source: U.S. Energy Information Administration (EIA); PIRA Energy Group
Growing U.S. Domestic Crude Oil & Natural Gas Production
15
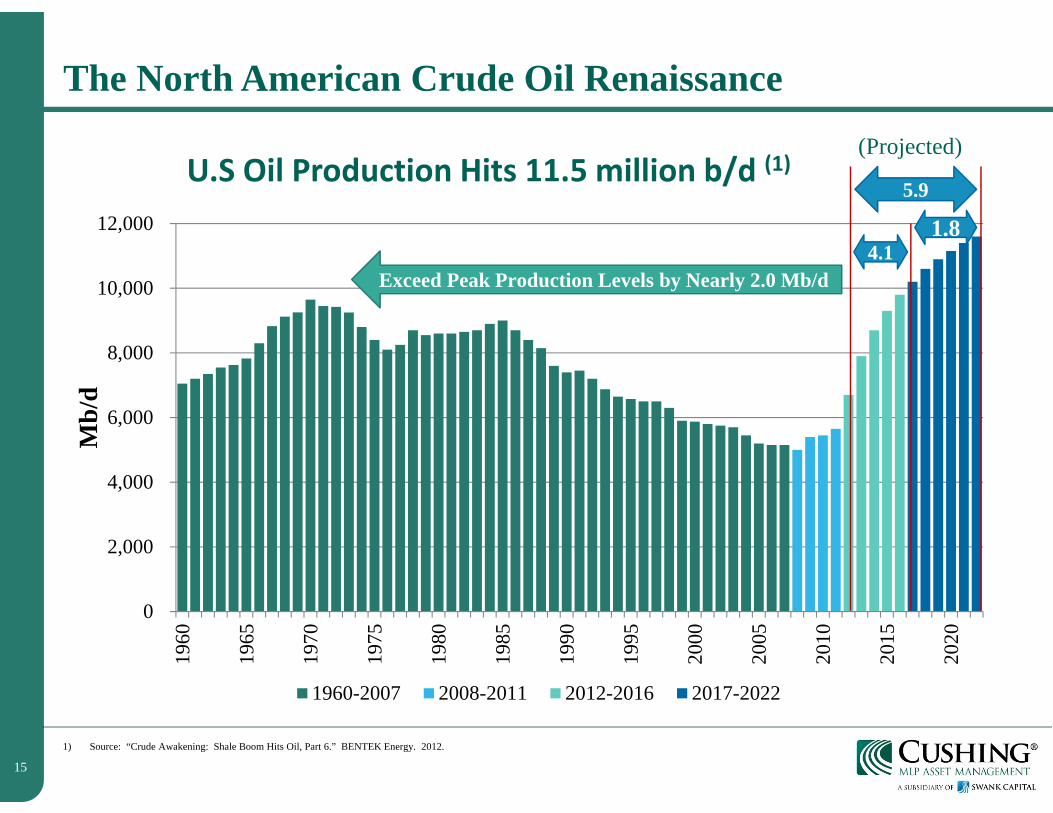
The North American Crude Oil Renaissance
1) Source: “Crude Awakening: Shale Boom Hits Oil, Part 6.” BENTEK Energy. 2012.
0
2,000
4,000
6,000
8,000
10,000
12,000
1960
1965
1970
1975
1980
1985
1990
1995
2000
2005
2010
2015
2020
Mb/
d
1960-2007 2008-2011 2012-2016 2017-2022
5.9
4.11.8
Exceed Peak Production Levels by Nearly 2.0 Mb/d
(Projected)U.S Oil Production Hits 11.5 million b/d (1)
16
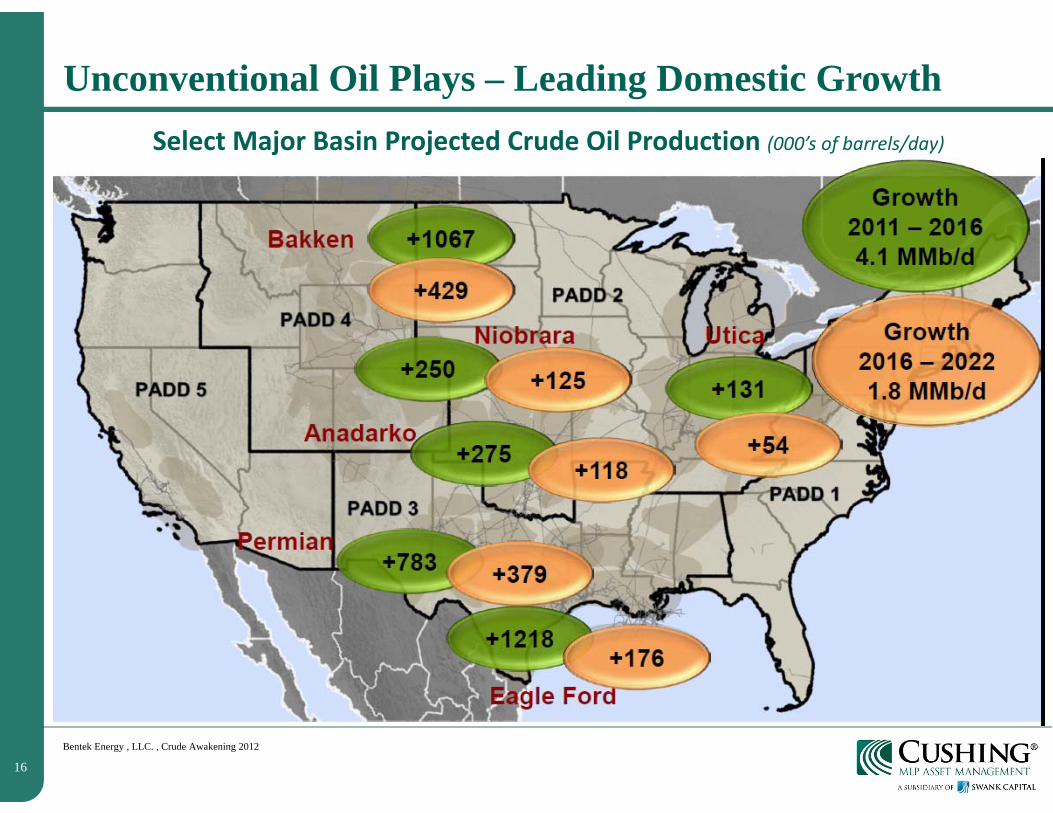
Unconventional Oil Plays – Leading Domestic Growth
Bentek Energy , LLC. , Crude Awakening 2012
Select Major Basin Projected Crude Oil Production (000’s of barrels/day)

17
North American Crude Flows and Pricing Differentials
Source: “Crude Awakening: Shale Boom Hits Oil, Part 6.” BENTEK Energy. 2012.
Onshore production growth has quickly surpassed current pipeline takeaway capacity
18
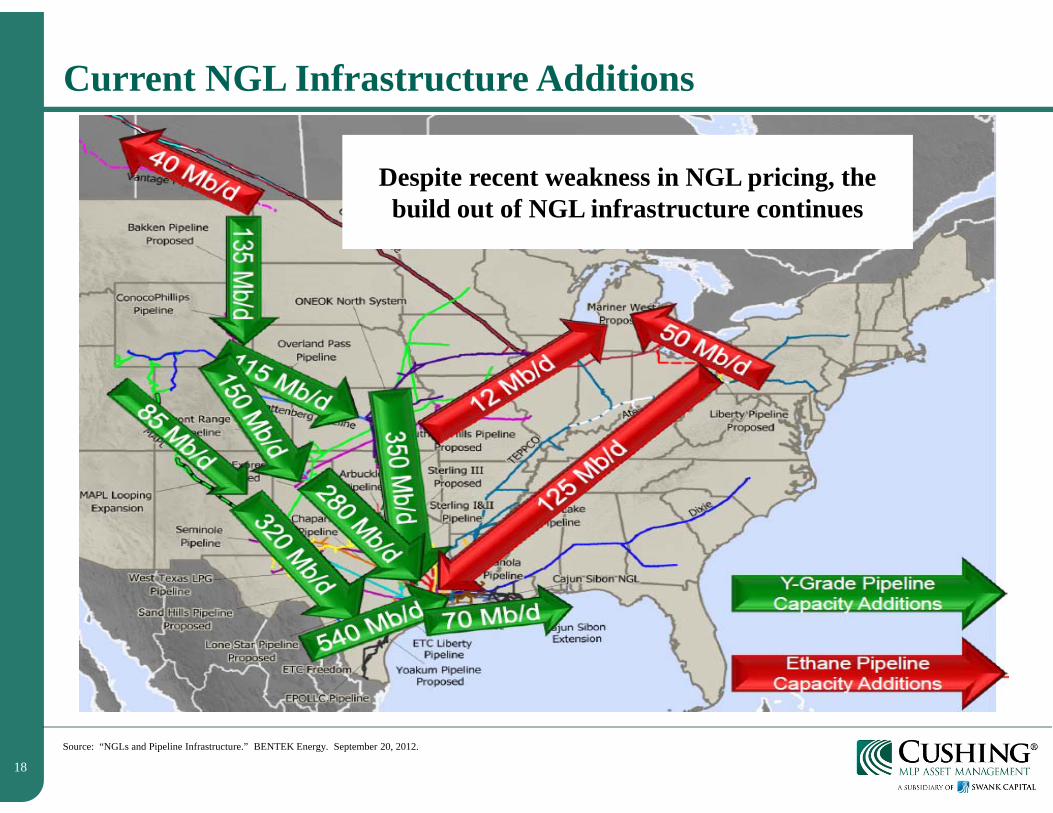
Current NGL Infrastructure Additions
Source: “NGLs and Pipeline Infrastructure.” BENTEK Energy. September 20, 2012.
Despite recent weakness in NGL pricing, the build out of NGL infrastructure continues
19
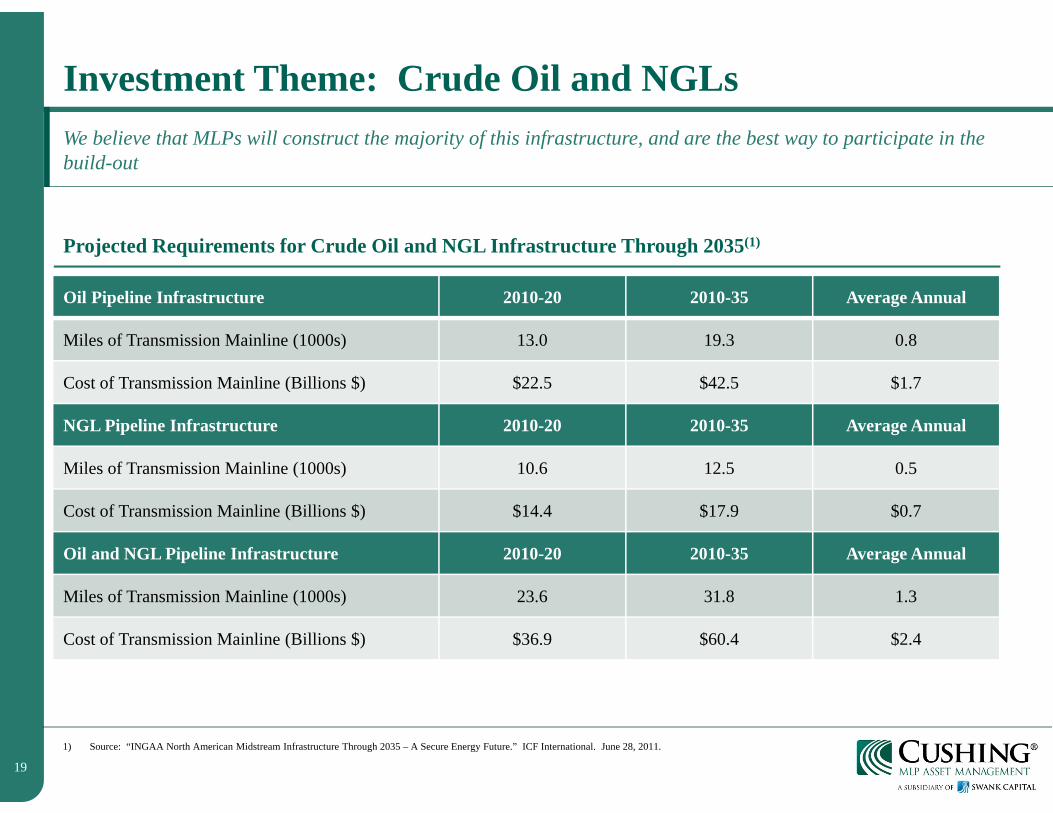
Investment Theme: Crude Oil and NGLs
Projected Requirements for Crude Oil and NGL Infrastructure Through 2035(1)
We believe that MLPs will construct the majority of this infrastructure, and are the best way to participate in the build-out
1) Source: “INGAA North American Midstream Infrastructure Through 2035 – A Secure Energy Future.” ICF International. June 28, 2011.
Oil Pipeline Infrastructure 2010-20 2010-35 Average Annual
Miles of Transmission Mainline (1000s) 13.0 19.3 0.8
Cost of Transmission Mainline (Billions $) $22.5 $42.5 $1.7
NGL Pipeline Infrastructure 2010-20 2010-35 Average Annual
Miles of Transmission Mainline (1000s) 10.6 12.5 0.5
Cost of Transmission Mainline (Billions $) $14.4 $17.9 $0.7
Oil and NGL Pipeline Infrastructure 2010-20 2010-35 Average Annual
Miles of Transmission Mainline (1000s) 23.6 31.8 1.3
Cost of Transmission Mainline (Billions $) $36.9 $60.4 $2.4

20
Technology Driving Huge Supply Growth
U.S Natural Gas Production, historical & estimated

21
Impact of Shale Gas Supply and New Pipeline Infrastructure
Source: TransCanada, Changing Dynamics – The Utica Shale Gas Play, September 2012
22
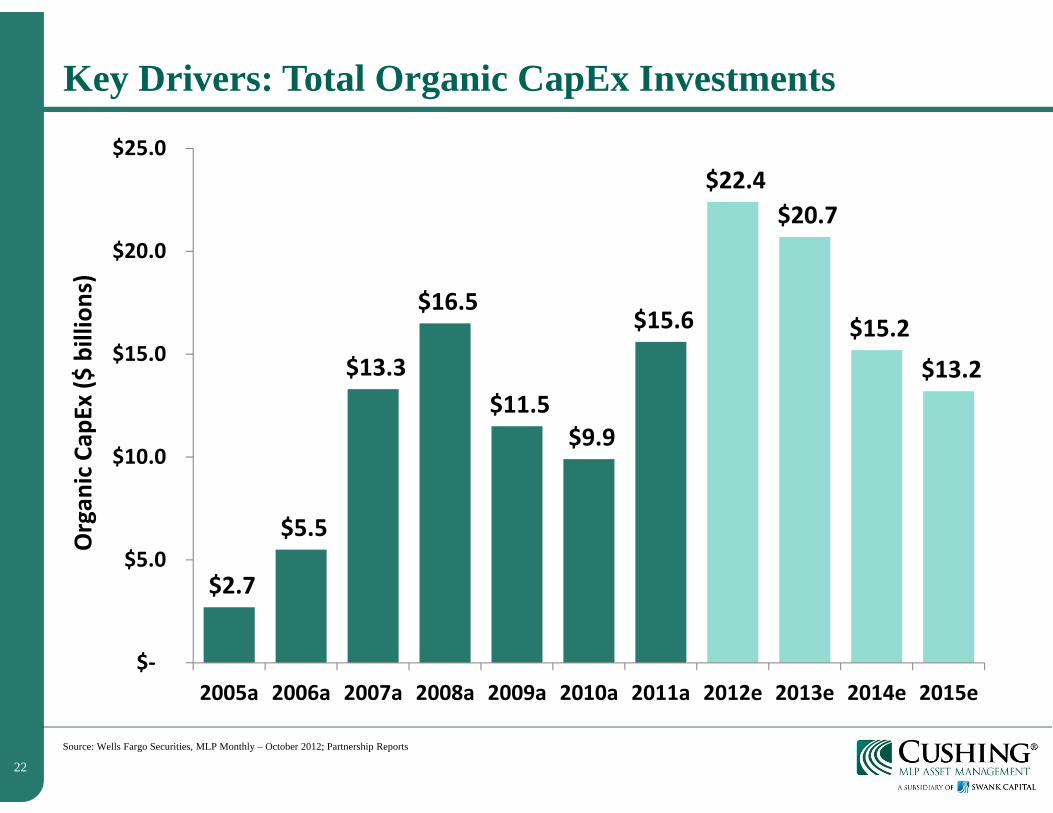
Key Drivers: Total Organic CapEx Investments
Source: Wells Fargo Securities, MLP Monthly – October 2012; Partnership Reports
$2.7
$5.5
$13.3
$16.5
$11.5 $9.9
$15.6
$22.4 $20.7
$15.2 $13.2
$‐
$5.0
$10.0
$15.0
$20.0
$25.0
2005a 2006a 2007a 2008a 2009a 2010a 2011a 2012e 2013e 2014e 2015e
Organ
ic Cap
Ex ($
billions)
23
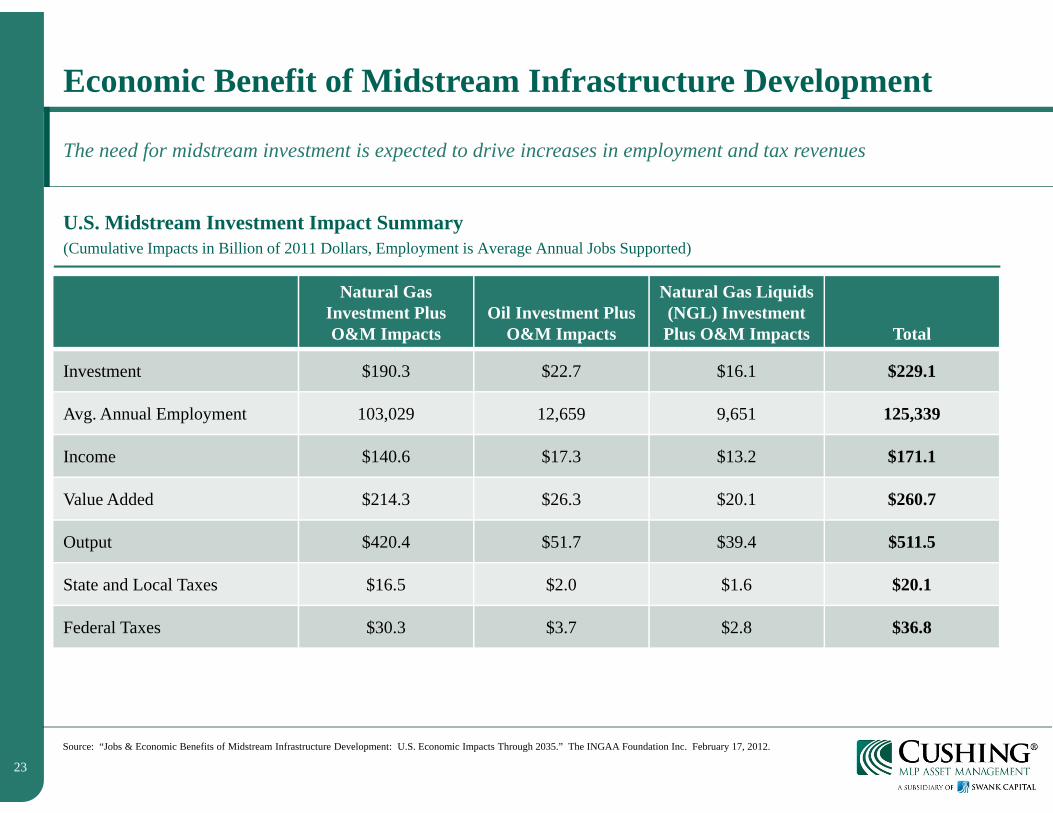
Economic Benefit of Midstream Infrastructure Development
U.S. Midstream Investment Impact Summary(Cumulative Impacts in Billion of 2011 Dollars, Employment is Average Annual Jobs Supported)
The need for midstream investment is expected to drive increases in employment and tax revenues
Source: “Jobs & Economic Benefits of Midstream Infrastructure Development: U.S. Economic Impacts Through 2035.” The INGAA Foundation Inc. February 17, 2012.
Natural Gas Investment Plus O&M Impacts
Oil Investment Plus O&M Impacts
Natural Gas Liquids (NGL) Investment Plus O&M Impacts Total
Investment $190.3 $22.7 $16.1 $229.1
Avg. Annual Employment 103,029 12,659 9,651 125,339
Income $140.6 $17.3 $13.2 $171.1
Value Added $214.3 $26.3 $20.1 $260.7
Output $420.4 $51.7 $39.4 $511.5
State and Local Taxes $16.5 $2.0 $1.6 $20.1
Federal Taxes $30.3 $3.7 $2.8 $36.8
24
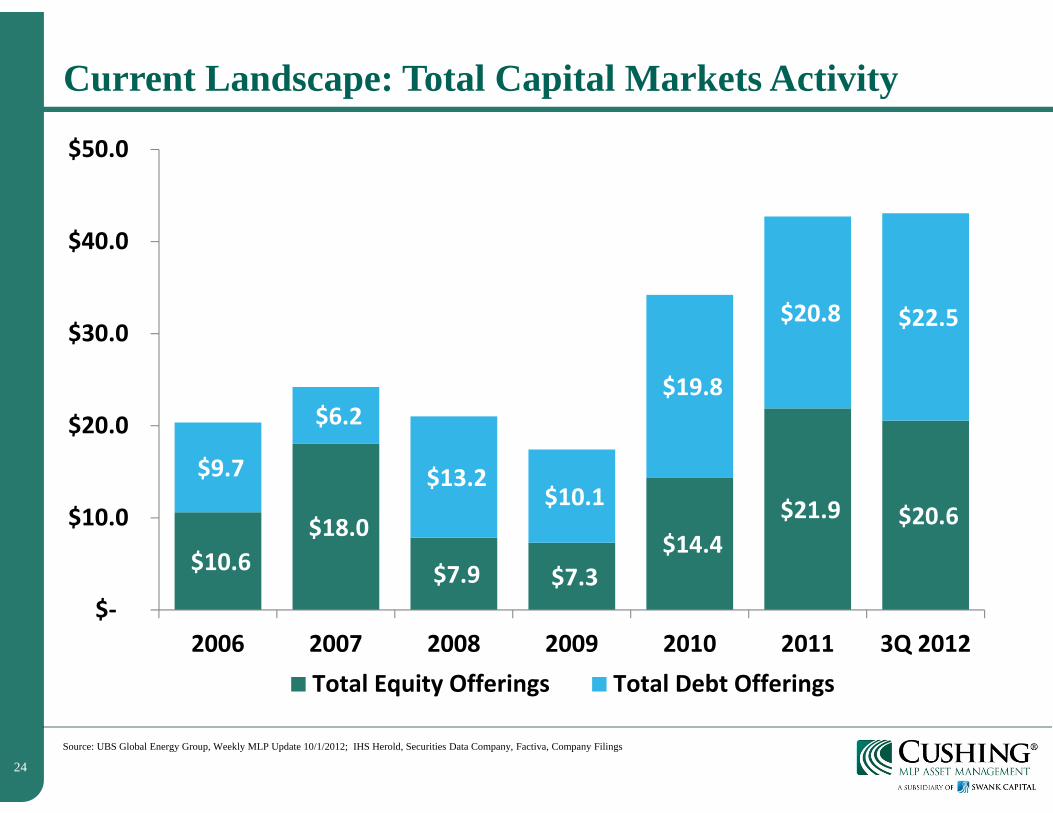
Current Landscape: Total Capital Markets Activity
Source: UBS Global Energy Group, Weekly MLP Update 10/1/2012; IHS Herold, Securities Data Company, Factiva, Company Filings
$10.6 $18.0
$7.9 $7.3 $14.4
$21.9 $20.6
$9.7
$6.2
$13.2 $10.1
$19.8
$20.8 $22.5
$‐
$10.0
$20.0
$30.0
$40.0
$50.0
2006 2007 2008 2009 2010 2011 3Q 2012Total Equity Offerings Total Debt Offerings
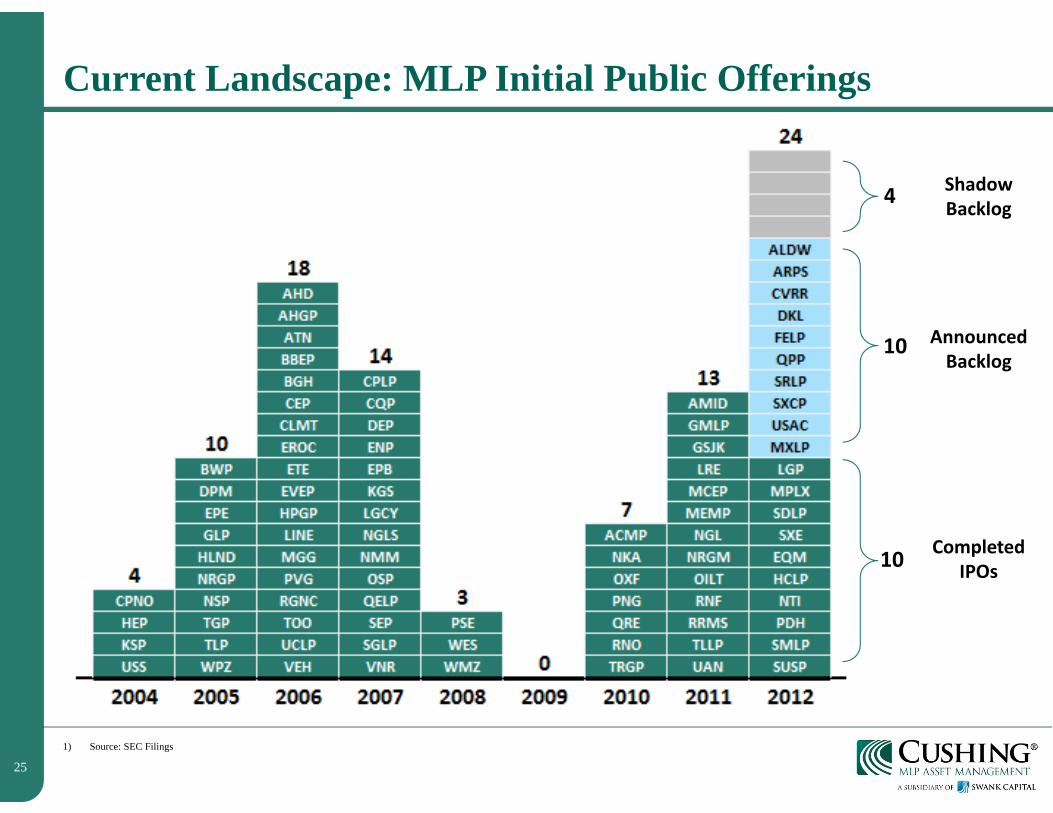
25
Current Landscape: MLP Initial Public Offerings
1) Source: SEC Filings
10
10
4 ShadowBacklog
AnnouncedBacklog
CompletedIPOs

26
III. Current LandscapeMLP performance, valuations, & capital markets
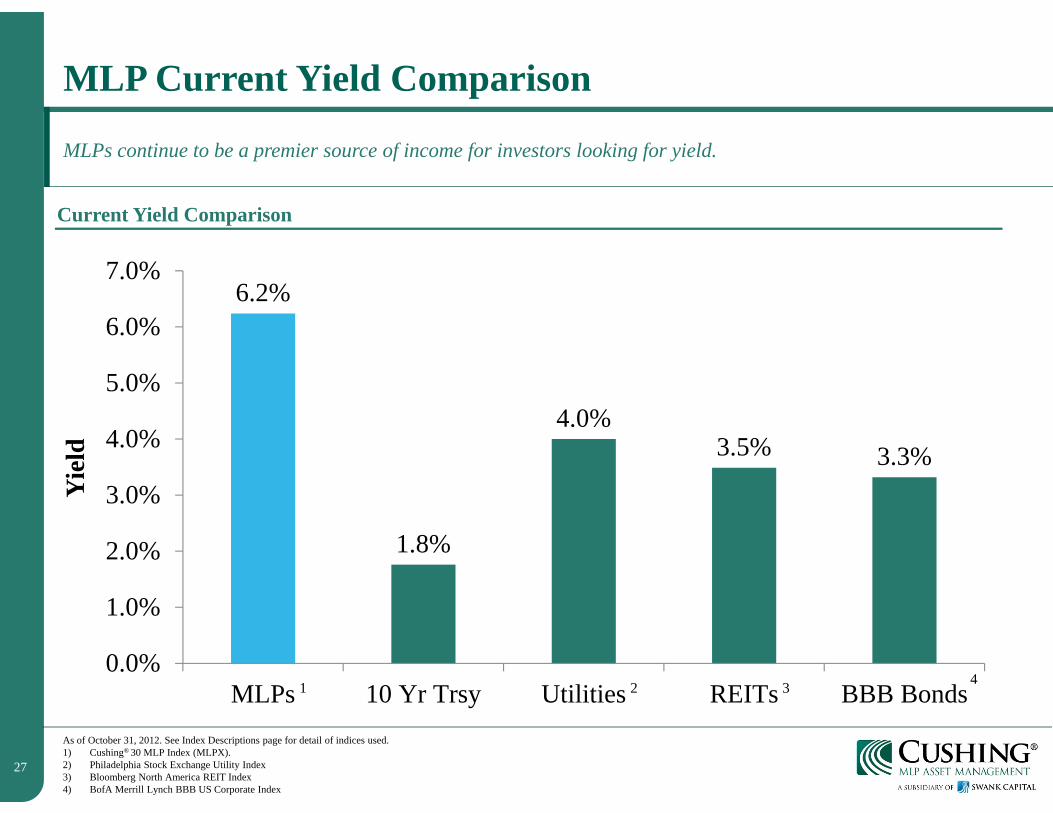
27
MLP Current Yield Comparison
MLPs continue to be a premier source of income for investors looking for yield.
As of October 31, 2012. See Index Descriptions page for detail of indices used. 1) Cushing® 30 MLP Index (MLPX). 2) Philadelphia Stock Exchange Utility Index3) Bloomberg North America REIT Index4) BofA Merrill Lynch BBB US Corporate Index
Current Yield Comparison
6.2%
1.8%
4.0%3.5% 3.3%
0.0%
1.0%
2.0%
3.0%
4.0%
5.0%
6.0%
7.0%
MLPs 10 Yr Trsy Utilities REITs BBB Bonds
Yie
ld
1 2 3 4
28
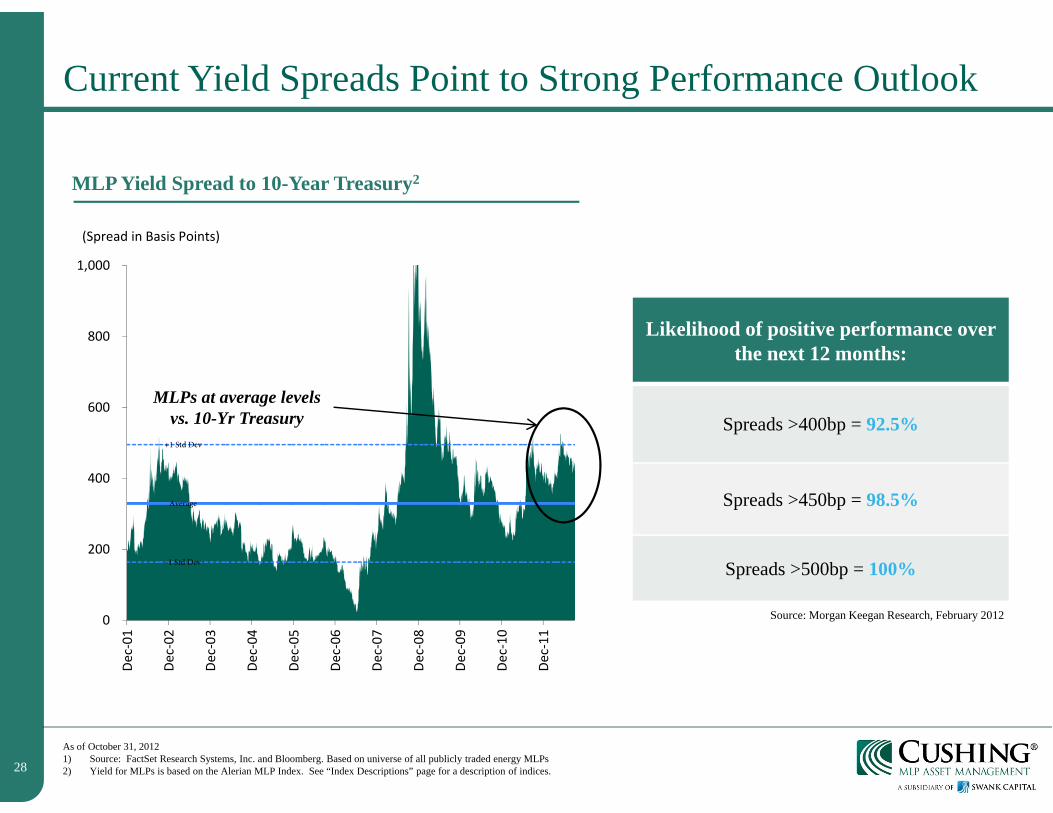
Current Yield Spreads Point to Strong Performance Outlook
As of October 31, 20121) Source: FactSet Research Systems, Inc. and Bloomberg. Based on universe of all publicly traded energy MLPs2) Yield for MLPs is based on the Alerian MLP Index. See “Index Descriptions” page for a description of indices.
Average
+1 Std Dev
-1 Std Dev
0
200
400
600
800
1,000
Dec‐01
Dec‐02
Dec‐03
Dec‐04
Dec‐05
Dec‐06
Dec‐07
Dec‐08
Dec‐09
Dec‐10
Dec‐11
(Spread in Basis Points)
MLP Yield Spread to 10-Year Treasury2
Likelihood of positive performance over the next 12 months:
Spreads >400bp = 92.5%
Spreads >450bp = 98.5%
Spreads >500bp = 100%
Source: Morgan Keegan Research, February 2012
MLPs at average levels vs. 10-Yr Treasury
29
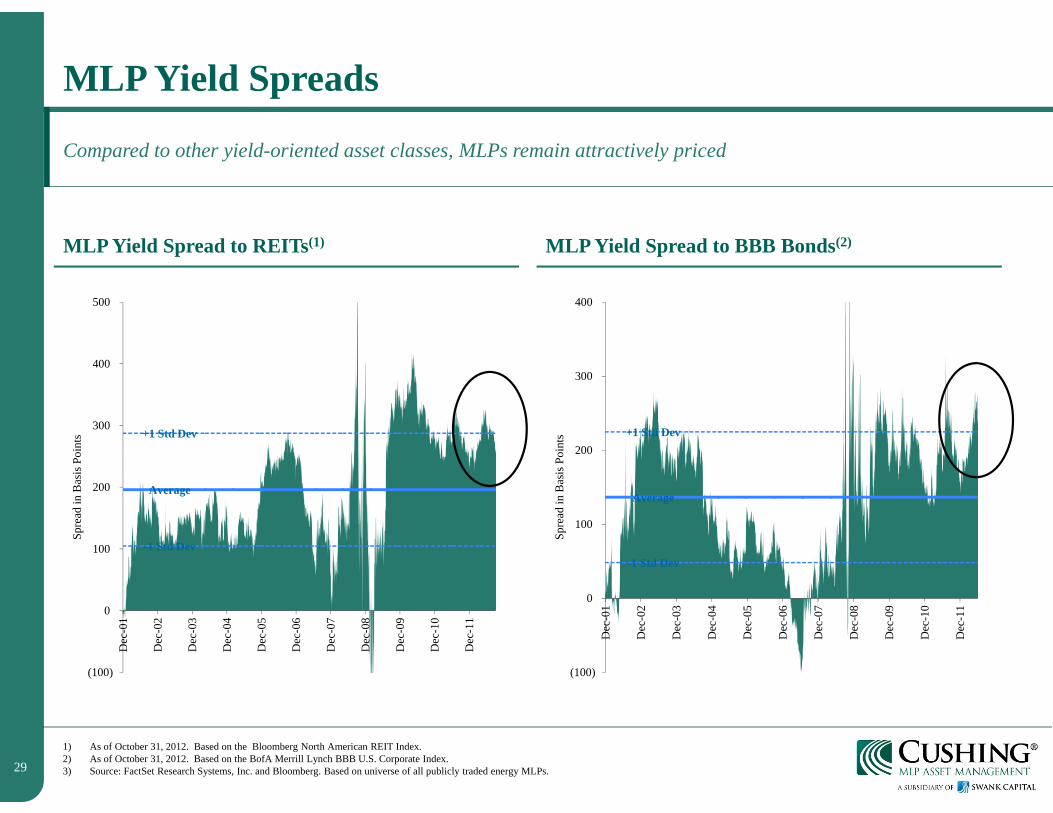
MLP Yield Spreads
MLP Yield Spread to REITs(1) MLP Yield Spread to BBB Bonds(2)
Compared to other yield-oriented asset classes, MLPs remain attractively priced
1) As of October 31, 2012. Based on the Bloomberg North American REIT Index.2) As of October 31, 2012. Based on the BofA Merrill Lynch BBB U.S. Corporate Index.3) Source: FactSet Research Systems, Inc. and Bloomberg. Based on universe of all publicly traded energy MLPs.
Average
+1 Std Dev
-1 Std Dev
(100)
0
100
200
300
400
500
Dec
-01
Dec
-02
Dec
-03
Dec
-04
Dec
-05
Dec
-06
Dec
-07
Dec
-08
Dec
-09
Dec
-10
Dec
-11
Spre
ad in
Bas
is P
oint
s
Average
+1 Std Dev
-1 Std Dev
(100)
0
100
200
300
400
Dec
-01
Dec
-02
Dec
-03
Dec
-04
Dec
-05
Dec
-06
Dec
-07
Dec
-08
Dec
-09
Dec
-10
Dec
-11
Spre
ad in
Bas
is P
oint
s

30
MLP Price to DCF Valuations
Historical Price to LTM DCF for the MLP Universe
Current price to DCF multiples remain within historical ranges
Source: FactSet Research Systems., as of September 30, 2012.
10.0x
13.6x
10.3x
4.6x
7.1x
11.7x
11.1x
10.2x
4.0x
5.0x
6.0x
7.0x
8.0x
9.0x
10.0x
11.0x
12.0x
13.0x
14.0x
Dec
-01
Jun-
02
Dec
-02
Jun-
03
Dec
-03
Jun-
04
Dec
-04
Jun-
05
Dec
-05
Jun-
06
Dec
-06
Jun-
07
Dec
-07
Jun-
08
Dec
-08
Jun-
09
Dec
-09
Jun-
10
Dec
-10
Jun-
11
Dec
-11
Jun-
12
+/- 1 Standard Deviation LTMA Price to Cash Flow Long-Term Average

31
IV. OpportunitiesMLP Subsector Focus & Investment Opportunities
32
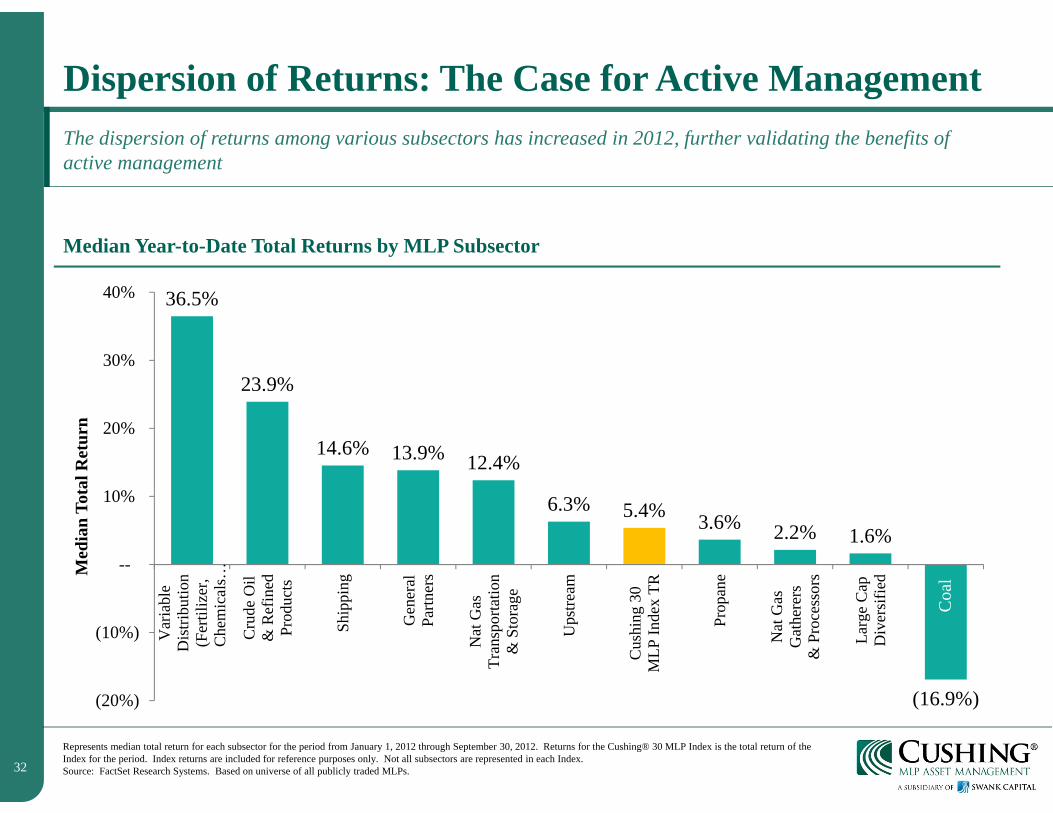
Dispersion of Returns: The Case for Active Management
Median Year-to-Date Total Returns by MLP Subsector
The dispersion of returns among various subsectors has increased in 2012, further validating the benefits of active management
Represents median total return for each subsector for the period from January 1, 2012 through September 30, 2012. Returns for the Cushing® 30 MLP Index is the total return of the Index for the period. Index returns are included for reference purposes only. Not all subsectors are represented in each Index.Source: FactSet Research Systems. Based on universe of all publicly traded MLPs.
36.5%
23.9%
14.6% 13.9% 12.4%
6.3% 5.4% 3.6% 2.2% 1.6%
(16.9%)(20%)
(10%)
--
10%
20%
30%
40%
Var
iabl
eD
istri
butio
n(F
ertil
izer
,C
hem
ical
s…
Cru
de O
il&
Ref
ined
Prod
ucts
Ship
ping
Gen
eral
Partn
ers
Nat
Gas
Tran
spor
tatio
n&
Sto
rage
Ups
tream
Cus
hing
30
MLP
Inde
x TR
Prop
ane
Nat
Gas
Gat
here
rs&
Pro
cess
ors
Larg
e C
apD
iver
sifie
dMed
ian
Tota
l Ret
urn
Coa
l
33
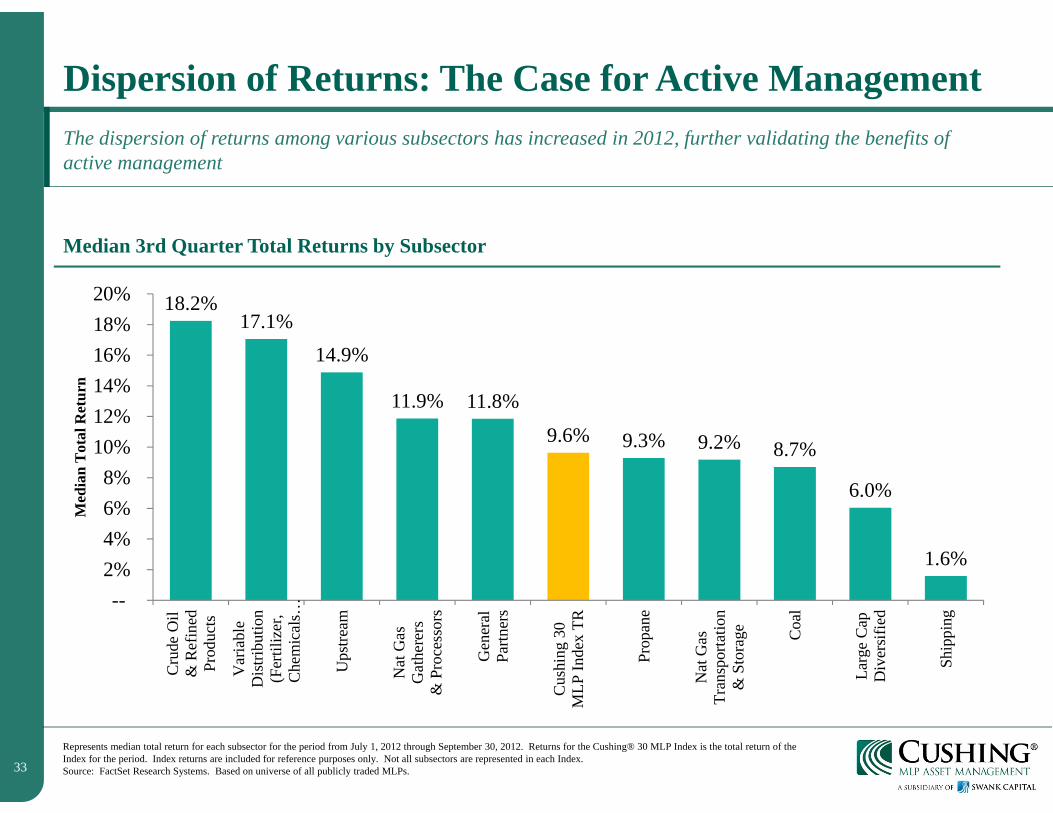
Dispersion of Returns: The Case for Active Management
Median 3rd Quarter Total Returns by Subsector
The dispersion of returns among various subsectors has increased in 2012, further validating the benefits of active management
Represents median total return for each subsector for the period from July 1, 2012 through September 30, 2012. Returns for the Cushing® 30 MLP Index is the total return of the Index for the period. Index returns are included for reference purposes only. Not all subsectors are represented in each Index.Source: FactSet Research Systems. Based on universe of all publicly traded MLPs.
18.2% 17.1%
14.9%
11.9% 11.8%
9.6% 9.3% 9.2% 8.7%
6.0%
1.6%
--2%4%6%8%
10%12%14%16%18%20%
Cru
de O
il&
Ref
ined
Prod
ucts
Var
iabl
eD
istri
butio
n(F
ertil
izer
,C
hem
ical
s…
Ups
tream
Nat
Gas
Gat
here
rs&
Pro
cess
ors
Gen
eral
Partn
ers
Cus
hing
30
MLP
Inde
x TR
Prop
ane
Nat
Gas
Tran
spor
tatio
n&
Sto
rage C
oal
Larg
e C
apD
iver
sifie
d
Ship
ping
Med
ian
Tot
al R
etur
n
34
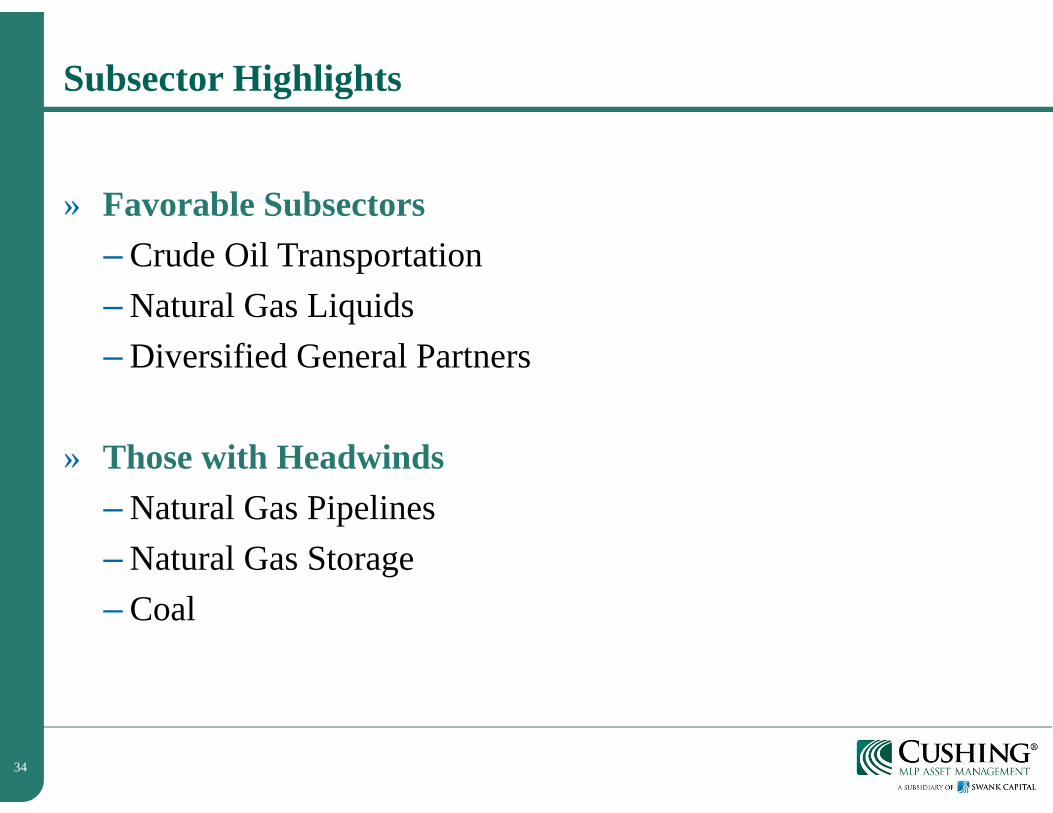
Subsector Highlights
» Favorable Subsectors– Crude Oil Transportation– Natural Gas Liquids– Diversified General Partners
» Those with Headwinds– Natural Gas Pipelines– Natural Gas Storage– Coal

35
Fundamental Themes & Investment Thesis
» Continuing Fundamental Themes– $250 Billion – Energy Infrastructure investment over this decade and
beyond to drive significant earnings and distribution growth.1
– Crude Oil and Natural Gas Liquids (NGLs) are our preferred MLP sub-sector focus.
– Continued move of midstream assets from major integrated oil & gas, utilities and E&P companies into the MLP structure via asset sales or creation of more MLPs.
» Investment Thesis– Stable, domestic yield equities will continue to attract investor dollars.
– Dispersion of returns (“haves” vs. “have nots”) across MLP universe continues to increase stock selection struggle.
36
V. Investment OptionsStrategies Across the Energy Supply Chain

37
The Energy Value Chain
Companies which own or rely on energy infrastructure assets
Cushing® Expertise
Downstream
Product Uses
Commercial
Industrial
Residential
Refining
Midstream-Energy Infrastructure
Transportation and Storage
Pipeline
Gathering
Treating and Processing
Toll Road Business Model
Attractive distributions
Growth opportunity
Upstream
Oil and natural gas production
Drilling
Production

38
Cushing® MLP Asset Management, LPSwank Capital, LLC8117 Preston Road, Suite 440Dallas, Texas 75225214.692.6334www.swankcapital.com
CONFIDENTIAL – NOT FOR PUBLICATION OR REDISTRIBUTION
This is not an offering and is provided for informational purposes only.
Questions & Answerswww.swankcapital.com
888-777-2346

39
Index Descriptions
Indices are included for comparison purposes only. Portfolios managed by Cushing® MLP Asset Management, LP may be more or less diversified than the indices and each index may reflect the performance of positions that are not within a particular portfolio’s investment strategy.
The Cushing® 30 MLP Index tracks the performance of 30 publicly traded MLP securities that hold midstream energy infrastructure assets in North America.
The Cushing® 30 MLP Index and The Cushing® MLP High Income Index are the exclusive property of Cushing® MLP Asset Management, LP which has contracted with Standard & Poor’s Financial Services LLC (the “Master Agreement”) (“S&P”) to maintain and calculate each index. Standard & Poor’s® and S&P® are registered trademarks of Standard & Poor’s Financial Services LLC. “Calculated by S&P Custom Indices” and its related stylized mark(s) are service marks of Standard & Poor’s Financial Services LLC and have been licensed for use by Cushing® MLP Asset Management, LP. S&P and its affiliates shall have no liability for any errors or omissions in calculating either index .
Alerian MLP Index is a capitalization-weighted index of the 50 most prominent energy master limited partnerships. Bloomberg North America REIT Index is a capitalization-weighted index of North American Real Estate Investment Trusts having a market capitalization of $15 million or greater. The BofA Merrill Lynch BBB US Corporate Index is a subset of The BofA Merrill Lynch Corporate Index including all securities rated BBB1 through BBB3, inclusive.