master of engineering in civil engineering
TRANSCRIPT
MASTER OF ENGINEERING IN CIVIL ENGINEERING
Engineering ,
OCTOBER, 1985
BY
of
OFKHULNA-MONGLA ROAD
A PROJECT. REPORT
DESIGN CONSIDERATION
.. "1111I111!~1!!11I11111I1~-~ .._- ~-- --
to the
. ,
Bangladesh University Of Engineering & Technology, Dhakain partial fulfilment of the requirement for the degree
Submitted
(
" '
r.14
\
1,,
I

DESIGN CONSIDERATION
OFKHULNA-MONGLA ROAD
A PROJECT REPORT
BY
MAHMOOD OMAH IMAM
(Mr. Syed Noor-Ud-deen Ahmed)
Associate Professor,Dept. of Civil Engg.HUET, Dhaka.
-~(Dr. Alamgir M. HoqueProfessor,Dept. of Civil Engg. ,BUET, Dhaka.
~~a.;",,, CA.!..:(Dr. Md. Hossain Ali)Associate Professor,Dept. of Civil Engg. ,HUET, Dhaka.
ii
Chairman
Member
Member
October, 1985
!.

iii
other degree.
that the project workbeen performed by me and
been submitted for any
DECLARATION
hereby declareherewith haswork has not
~(MAHMOOD OMAR IMAM)Signature of the student
I
submittedthat this

ABSTRACT
For designing any road some design criteria is requiredto be fixed up, which is governed by the importance of the ro-ad. The design speed, design life, side slope, horizontal andvertical curves, maximum rate of superelevation and capacityof the road are the vital aspects to be taken into considerat-ion in designing a road or highway. It is not possible to pro-ceed with the design of a road before the design criteria. arefixed up.
The specifications and design criteria adopted in theKhulna-Mongla Road Project have been reviewed in this report.An analysis of Traffic loads, Traffic analysis, the Designconsiderations and the Pavement evaluation have also been re-viewed and findings of the same have been furnished in thechapter: 3, 4, 5, 6 and 7.
Traffic loads mainly carried by the trucks indicatesthat the loadings adopted in the design of pavement of Khulna-Mongla Road were reasonable. The Bangladesh Transport Survey(BTS) study moreover indicates that a differentiation in load-ings between inter-district (in the case of this road,port-de-rived) and intra-district (local) traffic could more accurate-ly represent loading behaviour in the area. It is noted thataccess to the Khulna-Mongla Road will be limited and that con-trol of vehicle loads on the road should be relatively easy.
The Traffic analysis based on the historical trafficdata, population growth, changing vehicle owership patternsand the likely demands on the transportation system which willbe made by the Mongla Port. On the basis of this analysis thetraffic projections have been made ...
In designing pavement of the Khulna-Mongla Road Project,the consultant followed London RRL, Road Note: 29 and London
iv

TRRL, Road Note: 31, which is also followed by the R&H Depar-tment in designing road pavements.London RRL, Road Note: 29is applied, when traffic volume is large and London TRRL,RoadNote: 31 is applied traffic volume is less.
According to London RRL, Ro~d Note: 29 the pavementlife of Khulna-Mongla Road comes to 20 years as against a li-fe of 12 years according to London TRRL,Road Note: 31 for thesame traffic load i.e 2.3 MESAL considered in Khulna-MonglaRoad.
•
v. ,..
'"r""-.

ACKNOWLEDGEMENT
I wish to express my appreciation for the help andconstructive comments given by my supervisor, MR. SYED NOOR-UD-DEEN AHMED,Associate professor, Civil Engineering Departm-ent for the preparation of this dissertation. I am also grat-eful to MR. M.M. POWER, Resident Engineer, Snowy MountainsEngineering Corporation, Australia for his help and sincereco-operation of this dissertation.
I would like to extend my thanks to all teachers ofthe Bangladesh University Of Engineering & Technology for th-eir kind help and sincere co-operation throughout the courseof my study at the Engineering University.
Finally, I express my sincere and profound gratitudeto my mother, brothers and sister who have been very patientand understanding through the two years of my course, andhave encouraged me to make this year as fruitful as possible.
vi
-

CONTENTS
3.2 The ESAL Method of Traffic Load Assessment 11
i
2
3
1
5
iiiivvi
viii
Xill
Xl
vii
~,
15
18
20
Page
3.3.1 Lower-Bound Estimate of DesignTraffic loads
3.3.2 Upper-Bound Estimate of DesignTraffic loads
,
4.1 Introduction
3.3 Design Traffic Loads ,for Khulna-Mongla 15Road Project
2,2 Geometric besiqn Standard
2.1 Classification of Roads
3.1 Assessm~nt of Traffic Ldads for Pavement 11"Desiqn.
1.1 General
1.2 Objectives
Title page
DeclarationAbstractionAcknowledgements
List of Tables
Dedication
Contents page
List of Figures
Chapter 1 INTRODUCTION
Chapter 2 CLASSIFICATION OF -ROADS AND GEOMETRICDESIGN STANDARDS
Chapter 3 TRAFFIC LOADS
Chapter 4 TRAFFIC ANALYSIS

CONTENTS
4.2.1 Basis of Projections of Port Handling 2121 .
24
27
23
22
22
26
26
23
29
30
28
30
32
32
23
Page
5.1.2.2 Base Course Design
5.1.2 Full period Thickness Design
5.1.2.1 Subbase Design
4.4.1 Bus Traffic
4.4.2 Truck Traffic
4.3.1 Projected Local Traffic Volumes
4.4.3 Light Vehicle Traffic
IX
5.1.1 General
5.1.4 Preliminary Design by London TRRL,Road Note: 31
5.1.3 Designs for stage Construction
5.2.1 Subbase Design
5.2.2 Surfacing Design
5.2.3 Base Course Design
4.3 Local Traffic
4.4 Traffic Forecasts
4.2 Port Traffic
5.1 Flexible Pavement Designs by London TRRL, 26Road Note: 31
5.2 Flexible Pavement Designs by London RRL, 30Road Note: 29
Chapter 5 PAVEMENT DESIGN

CONTENTS
6.1 Design of Pavement in Khulna-Mongla Road 35
32
32
40
4554
39
36
66
. 33
Page
5.3.1 Introduction
5.3.2 ADB Pavement Design
5.3 Earliar Pavement Designs
5.4 Pavement Design Adopted In Khulna-Mongla 34Road
6.2 Alternative Structural designsChapter 7 PAVEMENT EVALUATION OF KHULNA-MONGLA ROAD
7.1 Introduction
7.2 Pavement Evaluation Methodology7.3 Analysis of Results
Chapter 8 FINDINGS AND RECOMMENDATIONS.
Chapter 6 STRUCTURAL DESIGNS OF PAVEMENT
x
APPENDIX-A BENKLEMAN BEAM
.BIBLIOGRAPHY

LIST OF TABLES
"
8
4
5
6
7
7
9
9
10
14
18
17
15
25
29Xl
Road Classification and Ge.ometric StandardsAs per R & H Department
Description
Maximum Grades In Percent
Minimum Length for Superelevation Run Off forPavements
Minimum Sight Distance in feet
Normal Pavement Cross Slopes
Geometric Design Standard
Extra Width on Curves With Radius Less than2460 ft
Factors for Converting Numbers of Axles to the 13Equivalent Number Of Standard 8200kg(18000lb)Axles
Maximum Degree of Curve and Minimum Radius forDifferent values of Maximum Superelevation
Equivalence Factors
Design Loading and Roadway Width for Bridgesand Culverts
Estimated Load Distributions on Vehicles (% 'ofAUW Carried by Axle)
Estimated Average Daily Traffic for Khulna-Mongla 20Road
Lower-Bound Estimate of Accumulative EquivalentTraffic Loads
Upper-Bound Estimate of Accumulative EquivalentTraffic Loads
Subbase Thicknesses for various Design lifes
Subbase Thickness Required for Full-life Pavement 27
Khulna-Mongla Road Project ,Projected AverageDaily Traffic
2-1
2-5
2-4
2-6
2-2
2-3
2-9
3-1
2-7
2-8
3-3
3-4
3-2
4-1
5-25-1
4-2
. 3-5
Table

Table
5-3
5-4
7-17-2
7-3
7-47-5
7-6
LIST OF TABLES
Description Paqe
Total Pavement Thickness for Various Design 30Lifes
Subbase Thickness Requirement 31Sub-Section Breakdown 43
Statistical Presentation of Benkleman Beam 44Average Deflections per Sub-SectionModuli of elasticity and Allowable Deflections 46for Pavement (Khulna-Mongla Road) from ElasticTheory .
Representative Deflections 50
Years of Service (from fatigue cracking theory) 52against Accumulative Equivalent Standard AxleLoads (ESAL'S)
Summary of Findings from Fatigue Cracking Theory 5.3
Xll

Figures.
Figure- 1
Figure- 2
Figure- 3
Figure- 4
Figure- 5
Figure- 6
Figure- 7
•
LIST OF FIGURES
Map of Bangladesh
Locality Map of Khulna-MonglaRoad Project
A Typical Roadway Section
Pavement Section For 1st 9.7 Miles
Pavement Section For Last 12.74 Miles
Maximum Tolerable Deflections
Accumulative axle loads vs. yearsof service
xiii
Page Nos.
xv
XVI
5-1
6-::1
6-3
51
52

AASHO
ADB
CBR
DMR
DTN
ESAL
MESAL
NAASRA
SAL
SARC
ABBREVIATIONS
American Association of State Highway OfficialAsian Development Bank
California Bearing Ratio
Department of Main Roads
Design Traffic Number
Equivalent Standard Axle Load 1,'>
Million Equivalent Standard Axle Load
National Association of Australian State RoadAuthorities
Single Axle Load
South Asian Regional Co-Operation
XIV
•

zo •
•••
n.
.,.
eo.
20.
•••
~••~J~'~.},. 22... ... ).. '
':.1
'0
.,.20
.,.
seAL £ IN MILES
'0 0,
I" D I A
.,.
•••
BENGAL
'0.
BANGLADESH.0.
OF
OF
e••
MAPeo.
BAY
II.
INDI A
ee.
u.
JL.
u.
• •
II.
II.

Z2~ 15'
89-+5'
2Z'!.'!oo' ,
Scale: 1: 250,000 ".
LOCATION MAP
KHUL NA - MONGLA ROAD PROJe CT
END OF GC- i
XVI
FIG. 2
~"- !IS'
HON8l.A
, I , , I , ".,~,~''-'''''''''''''-
B7id,lS
MIri ••\Ied. "'•••.01.U•••",d<llle<l. "'.a.d.RQilOOOoY, broad 9""9"RailwdY,1rl •.•.e1" 9Q"""
Riv•.•• oT wQ'-rcnQll .••tl.
., •• &0'~ 22°_50
)of
START OF 6C-1~
"!45' .l~-4'

Chapter 1
..~..
INTRODUCTION
General
1. Tne design must be adequate for the estimated fu-ture traffic volume both average daily traffic and de-sign peak hour, for the character of vehicles and forthe design speed.
Geometric design is intimately related to the capabi~lities and limitations of the roadw~y user and his vehicle.Traffic volume, speed and composition are three major itemsto be considered in striving to provide safe, efficient andeconomic traffic operations.
The location of a highway and its design elements areinfluenced to a considerable degree by the topography, physi~cal features and land use of the area traversed. These arepositive design controls and information regarding them isessential. Topography is a major factor in determining the.physical location of rural highway and generally affects the.alignment, gradients, sight distance, cross-section and otherdesign elements.
1
In preparing the design of a new road or the redesignof an old one, the highway engineer must give .attention to.the following basic considerations :
1.1
The principal design criteria for highways are: Tra-ffic Volume, Character and Composition of traffic, 'designspeed and control of access. These determine the pricipa1geometric features of a road. Other controls and criteriasuch as topograpy, Physical features, Capacity, safety andeconomics are important, but are either reflected in the ma~jor controls or have to do with more detailed design featur-.es which are not included in the general designation.

2. The design must be safe for driving and shouldinstill confidence in the majority of drivers.
3. The design must be consistent and must avoidsurprise changes in alignment, grade or sight dist-andce.
4. The design must be complete. It must includethe necessary roadside treatment and provide essen~tial traffic control devices, such as markings andsigns and proper lighting.
5. The design must be as economical as possible re-lativeto initial costs and maintenance costs.
1.2 Objectives
This study has been made with. the following objecti-ves:
1. To study the specifications adopted for the Khu-lna-Mongla Road Project.
2. To study the design criteria adopted for theKhulna-Mongla Road Project.
3. To analyse the design considerations and to givecomment on the justificationfdr adopting the same.
2

Chapter 2
CLASSIFICATION OF ROADS AND GEOMETRICDESIGN STANDARDS
2.1 Classification of Roads:
In the absence of standard classification it was
becoming very difficult to adopt suitable geometric standards
for different types of roads/highways in Bangladesh.
Therefore the Road system in Bangladesh has been
classified into five categories on the basis of their traffic
volume, socio-economic and strategic importance etc. These
are : (1) National Highways (2) Regional Highways (3) District
Roads (4) Feeder Roads (5) Rural Roads.
"Traffic flow" is no doubt -the main criteria on which
the classification should be based. But the level of tr"ffic
flow as is used in developed countries, can not be used as it
is for our situation, because the traffic composition and side
conditions of our roads (such as our roads are mostly multi-
purpose roads with liberal accessibility to predestrians,
animals, besides its use for drying of. foodgrains etc.) are
completely different from that of developed countries. In view
of this, a reduced level of traffic flow has been adopted as
the basis of our road classification.
Categories and their specifications are given inTable 2-1.
3

Tnhlc 2-1
ROAD CLASSIFICATION AND GEOHETRIC STMlDARD:J
AS PER R & Ii DEPARTHENT
Remarks
There shallnot be morethan one na-tional hihg-ways for aregion.
9'-0"(2.74)
6' -0"(1. 83)
9'_0"(2.74)
9'-0"(2.74)
121-0"(3.66)
11 '-a"(3.35)
J2'-0"(3.66)
12'-0"(3.66)
12'-0"(3.66)
J8'-O"(5.49)
18':....0"(5.49)
22'-0"(6.7)
i Shoulder:Pilvement:Width ,with in :
leach side;
8'-0"(2.44)
12'-0"(3.66)
CrestlHdth
24 '-0"(7.32)
16'_0"(4.88)
24'-0"(7.32)
36'-0"(10.98)
36'-0"(10.98)
110' _0"(12.12)
40'-0"(12.12)
Definition
Roads connectingvillages and fa-rms to localmarkets.
Road connectingUnion HQs/marketswith the Thana HQof road system.
Roads connectingmosques, ~"el.lsand differentparts of thevillate.
Roads connec-ting H.Q. andother growthcentres with thearteria! rO<1dsystem
Roads connec-ting district1I.Q.with sub,...Divisional andinter Sub-Divis-ional connection.
Highw:lY connec-ting differentreg ions
Hightvnys connec-ting national c~p-ital with differe-nt regional andin tern<t t ionalHighways.
Figures within perenthesis are in meters.
R & 11Department.
4
RURAL ROADS
Type 9f Roads
Category-B
Category-A
FEEDER ROADS:
VillageRoads
Thana Roads
Union Road
Category-A
Category-B
District Roads
Regional High-ways.
ARTERIAL ROADS:
National High-ways.
Source
Note :
2.
1.
3.
2.
3.
1.
I
51. :No. ~,

Table 2-2
GEOMETRIC DESIGN STANDARD
1
18
15
20
10'-0"
50 40 30
40 30 25
30 25 20
2 2 or 1 111' or9 ' 9'-0" 12'-0"
each for2 lanes, .12'-0"forsinglelane
5
Bangladesh Road Classification And Geometric DesignStandards, Planning Commission, July 1980.
a) Flat Topographyb) Rolling Topo-
graphyc) Mountainous
Topography
2.2 Geometric Design Standard:
Commensurate with the above classification the follo-wing geometric design standards are recommended for adoptionas shown in Table 2-2, 2-3, 2-4, 2-5, 2-~, 2-7, 2-8 and 2-9.
4. Width of lane infeet
3. Number of lanes
2. Design Speed (mph)
Source
S1. : Class of Roads :Nati- : , , ,No. ; standards :onal , Regional: District: Feeder :Rural, I I ,
1. Volume of traffic 500 200-500 50-200 0.50in PCE or (in 1990) (in 1990) (in 1990)(Per hour in both abovedirection)
D.esign I Maximum I Total Minimum Maximum :MaximHm.I Ispeed I I e&f. Radius design of:degreesI e ,(mph) I I (ft) curve :of curveI I, , (aegree) : (rounded)I ,
20 0.04 0,20 230 24.00 24.0030 0.06 0.22 328 17.50 18.0040 0.06 0.21 508 11.30 11.5050 0.06 0.20 833 6.90 7.00
Note
Source
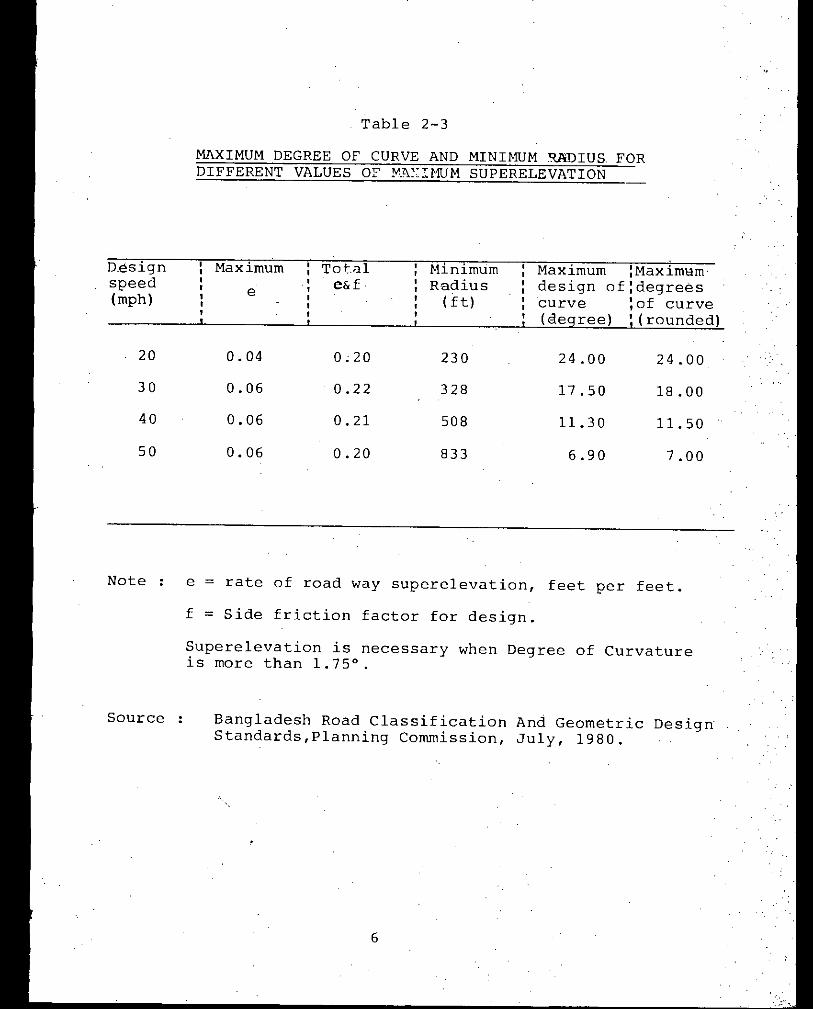
Table 2-3
MAXIMUM DEGREE OF CURVE AND MINIMUM~IUS FORDIFFERENT VALUES OF MZ\,:::MUMSUPERELEVATION
e = rate of road way superelevation, feet per feet.
f = Side friction factor for design.
Superelevation is necessary when Degree of Curvatureis more than 1.75°.
Bangladesh Road Classification And Geometric DesignStandards,Planning Commission, July, 1980.
6

Table 2-4
EXTRA WIDTH ON CURVES WITH RADIUS LESS THAN 2460FT.
tangent of18' wide pavementDesign speed (MPH)
30 : 40
on,,,,,,0.00 0 2 0 00.00 0 2 0 00.00 2 2.50 0 2.02.00 2 2.50 2 2 .02.00 2 2 2.502.50 3 2 2.503.00 23.50 2.50
7
Widening in feet for 2 lane pavements on curvesfor width of pavement22' wide pavementDesign speed (MPH)
30: 40 : 50
Table 2-5
MINIMUM LENGTH FOR SUPERELEVATIONRUN OFF FOR PAVEMENTS
Bangladesh Road Classification And GeometricDesign Standards, Planning Commision, July, 1980.
Bangiadesh Road Classification And Geometric DesignStandards, Planning Commission, July, 1980,
of:,,,,,,,,
Superelevation: L = Length of run off in feet for designRate , speed in,
feet per feet , 20 , 30 40 50, , .
0.02 50 100 125 1500.04 50 100 125 1500.06 50 110 125 1500.08 50 145 170 190
Source
DegreeCurve
4 to 5
6
78
9 to 1011-1314 - 1718 - 21
Source

8
Table 2-6
MAXIMUM GRADES IN PERCENT
Bangladesh Road Classification And Geometric DesignStandars, Planning Commission, July 1980.
Sight Distance :
,.
Type of , Design speed (mph)I
Topography I 20 30 , 40 50,I
Flat 6 6 5 4Rolling 7 7 6 5Mountainous 9 9 8 7
Source
For stopping sight distance,height of eye 3.75 feetand height of object 0.50 feet, from the road surface. Forpassing sight distance, height of eye 3.75 feet and heightof object 4.50 feet from the road surface.
Minimum stopping sight distance for all highways andpassing sight distance for 2-lane highways shall be as shown inTable2-7.Criteria for measuring sight distance, both verticaland horizontal, shall be :
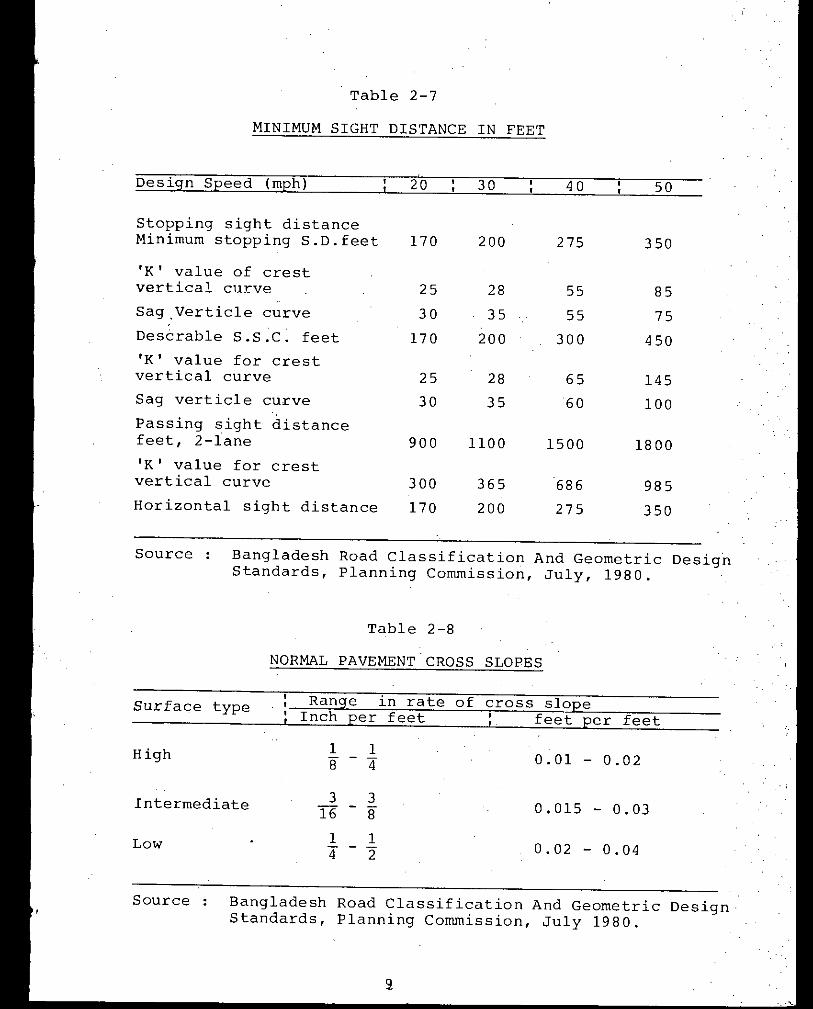
High 1 1 0.01 0.028 - 4" -
Intermediate 3 3 0.015 0.0316 - 8' -
Low 1 1 0.02 0.044" - "2 -
Design Speed (mph) 20 30 40 50
Stopping sight distanceMinimum stopping S.D.feet 170 200 275 350'K' value of crestvertical curve 25 28 55 85Sag. Verticle curve 30 35 55 75Descrable S.S.C. feet 170 200 300 450'K' value for crestvertical curve 25 28 65 145Sag verticle curve 30 35 60 100Passing sight distancefeet, 2-lane 900 1100 1500 1800'K I value for crestvertical curve 300 365 686 985Horizontal sight distance 170 200 275 350
Source Bangladesh Road Classification And Geometric DesignStandards, Planning Commission, July, 1980.
Table 2-8
Table 2-7
Range in rate of cross slopeInch per feet : feet per feet
NORMAL PAVEMENT CROSS SLOPES
MINIMUM SIGHT DISTANCE IN FEET
Bangladesh Road Classification And Geometric DesignStandards, Planning Commission, July 1980.
Surface type
Source

4. Feeder Roads 22'
10
Bangladesh Road Classification And Geometric DesignStandards, Planning Commission, July, 1980.
Table 2-9
DESIGN LOADING AND ROADWAY WIDTH FOR BRIDGESAND CULVERTS
5. Rural Roads
Source
Chapter 3
TRAFFIC LOADS
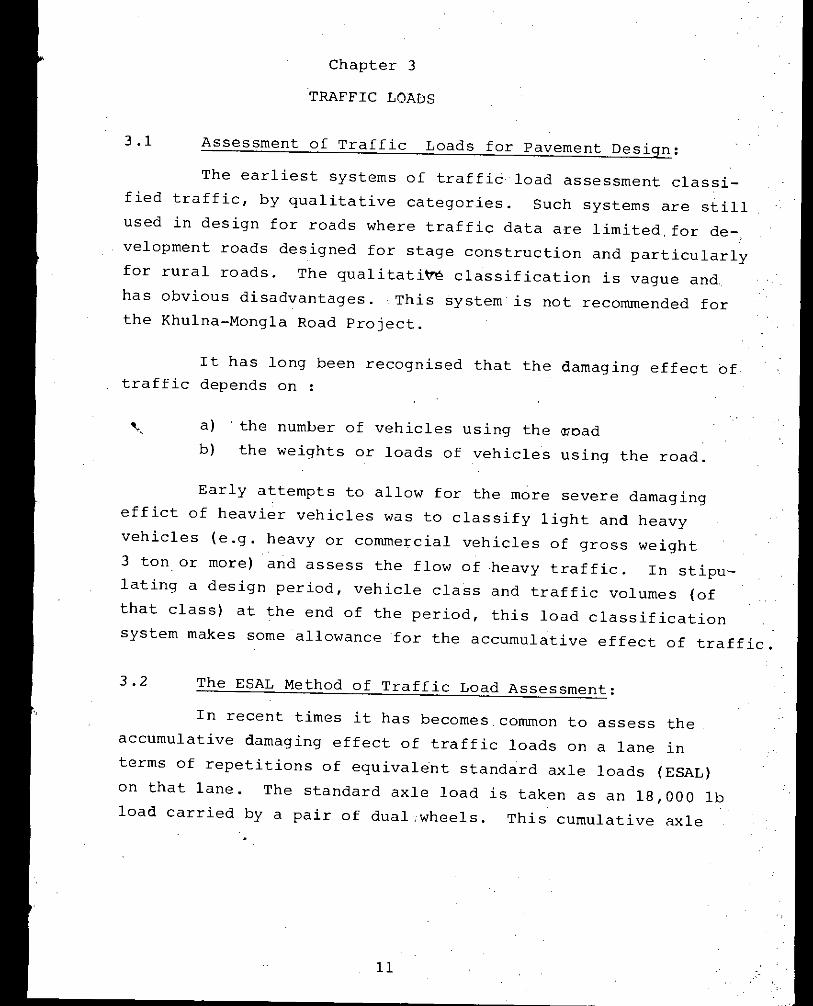
3.1 Assessment of Traffic Loads for Pavement Design:
The earliest systems of traffid load assessment classi-fied traffic, by qualitative categories. Such systems are stillused in design for roads where traffic data are limited, for de-,velopment roads designed for stage construction and particularlyfor rural roads. The qualitati~ classification is vague andhas obvious disadvantages. This system is not recommended forthe Khulna-Mongla Road Project.
It has long been recognised that the damaging effect oftraffic depends on :
, a)' the number of vehicles using the ~oadb) the weights or loads of vehicles using the road.
Early attempts to allow for the more severe damagingeffict of heavier vehicles was to classify light and heavyvehicles (e.g. heavy or commercial vehicles of gross weight3 ton or more) and assess the flow of heavy traffic. In stipu-lating a design period, vehicle class and traffic volumes (ofthat class) at the end of the period, this load classificationsystem makes some allowance for the accumulative effect of traffic.
3.2 The ESAL Method of Traffic Load Assessment:
In recent times it has becomes common to assess theaccumulative damaging effect of traffic loads on a lane interms of repetitions of equivalent standard axle loads (ESAL)on that lane. The standard axle load is taken as an 18,000 lbload carried by a pair of dual;wheels. This cumulative axle
11
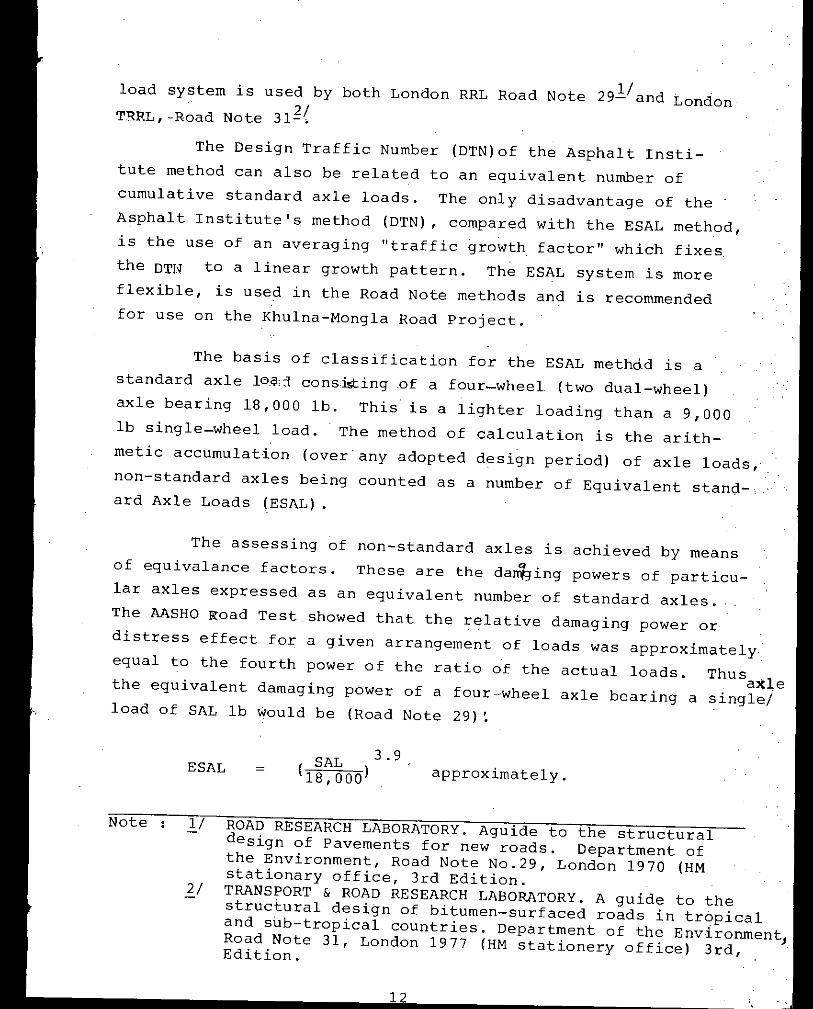
The basis of classification for the ESAL methcid is astandard axle lOq,j consisting of a four-wheel. (two dual-wheel)axle bearing 18,000 lb. This is a lighter loading than a 9,000Ib single-wheel load. The method of calculation is the arith-metic accumulation (over any adopted design period) of axle loads,non-standard axles being counted as a number of Equivalent stand-,ard Axle Loads (ESAL).
The assessing of non-standard axles is achieved by meansof equivalance factors. These are the da~ing powers of particu-lar axles expressed as an equivalent number of standard axles.The AASHO Road Test showed that the relative damaging power ordistress effect for a given arrangement of loads was approximatelyequal to the fourth power of the ratio of the actual loads. Thus.
lax ethe equivalent damaging power of a four--wheel axle bearing a single/load of SAL Ib would be (Road Note 29) ~
"
approximately.
1
SAL 3.9(18,000)=
ROAD RESEARCH LABORATORY. Aguide to the structuraldesign of Pavements for new roads. Department ofthe Environment, Road Note No.29, London 1970 (HMstationary office, 3rd Edition.TRANSPORT & ROAD RESEARCH LABORATORY. A guide to thestructural design of bitumen-surfaced roads in tropicaland sub-tropical countries. Department of the Environmen~Road Note 31, London 1977 (HM stationery office) 3rd, .Edition.
ESAL
1/
}j
load system is used by both London RRL Road Note 291/and LondonTRRL,-R~ad Note 31~(
The Design Traffic Number (DTN)of the Asphalt Insti-tute method can also be related to an equivalent number ofcumulative standard axle loads. The only disadvantage of theAsphalt Institute's method (DTN), compared with the ESAL method,is the use of an averaging "traffic growth factor" which fixes.the DTN to a linear growth pattern. The ESAL system is moreflexible, is used in the Road Note methods and is recommendedfor use on the Khulna-Mongla Road Project.
Note

The subject currently of most debate in the ESAL methodof traffic load assessment is the equivalence of different arr~angements of loads. The assessment of damaging power of non-standard axles was obtained in terms of ESAL by means of equi-valence factors are shown in Table 3-1. The load distributionson vehicles are shown in Table 3-2.
Table 3-1FACTORS FOR CONVERTING NUMBERS OF AXLES TO THEEQUIVALENT NUMBER OF STANDARD 8200 KG (18000 1b)AXLES
Axle load Equiva1ance factorKg 1b910 2000 0.0002
1810 4000 0.00252720 6000 0.013630 8000 0.044540 10000 0.085440 12000 0.26350 14000 0.37260 16000 0.68160 18000 1.09070 20000 1.69980 22000 2.4
10890 24000 3 .611740 26000 5.212700 28000 7.213610. 30000 9 .914520 32000 13.315430 34000 17.616320 36000 22.917230 38000 29.418140 40000 37.319070 42000 47,019980 44000 58.020880 46000 72.021790 48000 87.0
Source : Road Note 31. ,'.,

14
Table 3-2
Monthly Report No. 39, Khulna-Mongla Road.
ESTIMATED LOAD DISTRIBUTIONS ON VEHICLES (% OF AUWCARRIED BY AXLE) .
Loading Case Front Axle Rear AxleEmpty Trucks Original Design 67 33
Recommended Loading 50 50Full Trucks Original Design 42 58
Rated capacity 40 60Recommended Loading 33 67Over loaded case 25 75
Empty buses Original design 50 50Recommended loading 40 40
Full Buses Original design 50 50Rated capacity 40 60Recommended loading 37 63Over loaded case 37 63
Source
The equivalence factors depend on wheel and axlespacings, tyre sizes, the relative importance of scuffingand other variables, but typical equivalence factors may beadopted as follows (for unit load on any axle arrangement) •are shown in Table 3-3.

15
Traffic projections include a large proportion of non-motorised vehicular traffic and non-vehicular traffic whichwould have little damaging effect on pavements.
•
;
1.01.50.6
Factors
Lower-bound Estimate of Design Traffic Loads
The lower-bound estimate of traffic loads considers onlythree categories or vehicle namely :
a) Trucksb) Busesc) Jeeps, Cars and Taxis.
In order to provide an upper-bound and a lower-boundestimate of traffic loads for the purpose of pavement design,traffic loads have been analysed both to include and to excludelight and non~motorised traffic. For the upper-bound estimatea switch from light and non-motorises traffic to heavier vehi~cles has been assumed.
3.3.1
3.3 Design Traffic Loads for Khulna-Mongla Road Project
Source Monthly Report No. 1 in Khulna-Mongla Road Project.
Table 3-3
EOUIV~~ENCE FACTORS
Type of axle and wheels
Single axle, dual wheels, damaging powerSingle axle, single wheels, damaging powerTandem axles, dual wheels, damaging power

a) Trucks.
As for the ADB Appraisal Mission Report, 7 ton capacitytrucks have been assumed with a load factor of 0.67. Typicallytwo-axle trucks, the front axle having two wheels, the rearaxle four wheels.
Equivalance factors for full and empty trucks can beestimated as followes (refer to Table 3~2) .
i) Empty Truck - Front axle = 1.5 x 0.0025 ESAL= 0.0038 ESAL
Rear axle = 1.0 x 0.0002 ESAL= 0,0002 ESAL
Total = 0.0040 ESALii) Full Truck - Front axle = 1.5 x 0.08 ESAL
= 0.12 ESALRear axle = 1.0 x 0.20
= 0.20 ESALTotal = 0.32 ESAL
equivalenceHence the averag':'/factor of the envisaged truck traff ic
is estimated to be 0.21 ESAL/truck.The truck-load flow is expected to be asymmetric and
as a consequence the design load contributed by trucks is assumedto be two-thirds of the total two-way truck-load flow.
b) Buses
It has been assumed that the average load per bus is45 passengers. Assuming in addition baggage and other freightto the order of 10%. The average bus load can be estimated at,say, 2.7 tons.
Assuming equal distribution of load between two 2 wheel.axles the equivalent traffic load per bus is approximately 0.03ESAL. Bus traffic should be equally distributed between theMongla and Khulna directions.
16

Table 3-4
c) Cars, Jeeps and Taxis
602
1981-200157824
0.30421266
Design Period1981 -1991: 1981-1996:
258 4068 15
0.09 0.17
17
134
1981-1986130
4
0.04
Monthly report No. I, Khulna-Mongla Road Project.
LOWER-BOUND ESTIMATE OF ACCUMULATIVE EQUIVALENTTRAFFIC LOADS(103 ESAL)
The lower-bound Estimate of design traffic load esti-mates are shown in Table 3-4.
Assuming a gross vehicle weight of 1.5 tons for carsetc. with the load distributed equally between two 2-wheelaxles, the equivalent load per car is approximately 0.0004 ESAL.
The loads imposed by private cars donot contributesignificantly to the structural damage caused to road pave-ments by traffic. Therefore for the purposes of structuraldesign, cars can be ignored and only the total number andthe axle loading of the commercial vehicles that will use theroad during its design life need to be considered. In thiscontext a commercial vehicle is defined as any goods or public'service vehicle that has an unloaded weight of 1.5 tons or more.However, to demonstrate this point, the equivalent traffic loadwhich can be attributed to cars and other light vehicles hasbeen calculated as shown Table 3-4
Source
VehiclecategoryTrucksBusesCar etc.
Total :

18
Table 3-5
1981-2001
6022.31.5
25.9
632
Upper-Bound Estimate of Design Traffic Loads:3.3.2
UPPER-BOUND ESTIMATE OF ACCUMULATIVEEQUIVALENT TRAFFIC LOADS
(103 ESAL)
In developing an upper-bound estimate. of design trafficloads it is assumed that the traffic projections are adequatebut, in addition to the base traffic loads estimated of thischapter that the higher traffic will switch to heavier vehiclesas follows :
a) Auto-rickshaw/baby taxi traffic will switch to minibusesb) Motor-cycle/bycycle traffic will switch to taxisc) Rickshaw/pedestrian traffic will switch to busesd) bullock-cart traffic will switch to light commercial
vehicle s.
The total upper~bound design traffic load estimates areshown in table 3-5.
Vehicle Design Periodcategory 1981-1986 1981-1991 , 1981-1996,
Base Traffic 134 266 421LCV's 0.5 1.0 1.6Cars etc. 0.3 0.6 1.0Buses 5.8 11.6 18.2Total 141 279 442
Note : LCV's are light commercial vehicles such as minibuses;pick -ups etc.
Source Monthly report No.1, Khu1na-Mong1a Road .•

The additional traffic loads which would result narely cha-nge the estimated damaging power of the total traffic. Forstructural design purposes, the damaging power of the truc-ks predominate. It is important, however, that the totalvolume of traffic (rather than the ESAL Load) will largelydetermine the amount of surface wear which will occur.
19

Chapter-4
TRAFFIC ANALYSIS
4.1 Introduction:In Khulna-Mongla Road, the traffic analysis is based on
historical traffic data, population growth, changing vehicleownership patterns and the likely demands on the transporta-tion system which will be made by the Mongla port. On the. basisof this analysis the following traffic projections have beenmade. The projection are intended to be conservative(Upper-bo-und) estimates are shown in Table 4-1.
Table 4-1ESTIMATED AVERAGE DAILY TRAFFIC FOR KHULNA-MONGLA ROAD
Traflice :Average YearCategory :growth 1981 1986 1991 1996 2001: % P.A.
I
*A.D.T in P.C.ETrucks & Buses 4 1431 1755 2157 2637 3198I.ight Motorised 8 125 192 284 398 532vehicles.
Total for Motor 4 1556 1947 2441 3035 3750vehicles.
NOn-Motorisedvehicles (Bullock 3 1193 1383 1603 1858 2154Carts,Bicycles etc .)
eTotal all vehicles 4 2749 3330 4044 4893 5884
Pedestrians 3 2470 2863 3319 3848 4461•
Note: * P.C.E = Passenger Car EquivalanceSource: Monthly Report No:l,'Khulna-Mongla Road Project
20
\.
4.2 Port Traffic:The traffic projections for the project
consisted of two main components : traffic derived from thenew port. and the local traffic. The port-derived traffic pre-dominated in determining pavement design.The "local" trafficpredominated in determining geometric design.
In the design it was assumed that 675,000tonsper annual (P.a) initially would be deverted to road transpo-rt via the Khulna-Mongla Road and that port-derived trucktraffic would thereafter grow at an annual rate of about 3%.
4.2.1 Basis of Projections of Port Handling:In making the projections it has been assu-.
med that the political climate and economic growth of Bangladesh will not deteriorate. It has been assumed that total cargohandled by the port will grow steadily from a level of about1.4million tons in 1972 to 1.8million tons in 1980,thereafterto grow a rate of 3% p.a.to 2.1 million tons in 1985,and ther-eafter to grow at a rate of 2.5% p.a. to about 3.0 million tonsin 2000.
Historically import cargo growth has beengreater at the port than the growth in export cargo handled.In 1978 imports exceeded exports by more than 0.3 million tons(or by approximately 50% of the total export volume handled) .This asymmetry of flow, if reflected in the loads diverted totrucks, would result in a concentration of truck loads in onelane and hence increase pavement design loads. It has thereforebeen assumed that the growth of imports at least initiallywill continue to grow at a faster rate than exports .
.It has been assumed that import cargo fromthe port will grow steadily from a level of about 0.75 milliontons in 197~ to about 1.15 million tons .in 1980,thereafter togrow at a rate of 4.5% p.a. to 1.4 million tons in 1985 and
21
A.. I).".

First year 26
Twentieth 56
0.6 million tons0.65 million tons0.7 million tons1.0 million tons
2.5% p.m. to about 2.0 millionestimates of export cargo hand-
* 1972* 1980* 1985* 2000
,
*Lower-bound estimate--
Tenth year 38
First year 100
Tenth year 156
* Upper-bound estimate--
4.3.1 Projected Local Traffic Volumes:The estimates of local traffic can be
summarised as follows, in terms of total two-way average dailytraffic:
Twentieth year 231
4.3 Local Traffic:In the short-term, locally-derived traffic poten-
tial in the region must be lower than in nearly regions where --roads already exist. In the long-term the locally-derived tra-ffic potential for the project road would also be relativelylow because of the relatively low population in the area andbecause of the large areas or low-lying and/or salt-affectedterrain with low agricultural potential in the region.
thereafter to grow at a rate oftons in 2000. The correspondingled at the port are as follows:

The lower-bound estimate includes approximately 46% trucks,39% buses and 15% light vehicles, the Upper-bound 35% trucks,38% buses and 27% light vehicles.
4.4 Traffic Forecasts
4.4.1 Bus Traffic:
The ADB Appraisal Mission carried out acomparative analysis of the costs of passenger transport byriver launch and by bus and determined that passenger trafficbetween Khulna and Mongla would be significantly cheaper bybus. With the assistance of Roads and Highways Department(RHD), origin-destination surveys were also carried out,whichindicated that some 705,000 passengers would be induced to div-'.ert from river launches to buses.
In summary at present it could be estimatedthat potentially some 955,000 passengers per annum could beexpected to utilize bus services on the Khulna-Mongla Road.Thiswould be equivalent to approximately 57 buses/day.
The Bangladesh Transport Survey(Nov.1974)concluded that passenger travel in rural areas is growing atapproximately 6% P.a.Considering the population growth in theKhulna District it has been assumed that bus traffic will grow(Until 1981, Potentially) initially at a rate of about 10% perannum. During the periods 1981-1991 and 1991-2001 respectivelygrowth rates of 8% per annum and 6% per annum respectively havebeen assumed.
4.4.2 Truck Traffic:The ADB Appraisal Mission estimated that the
five berths at Mongla(Proposed for completion in 1980) wouldhave a thrqugh-put capacity of 675,000 tons/P.a. with handlingby labour. Because of the cost advantage of road transport(tr~ucks) over river barges this wharfside cargo is expected to betransported to Khulna by trucks. With the possibility of twofurther wharves being put into operation at some later stage
23

and to allow for the possible development of local trucktraffic based on agriculture,it has been assumed that thetruck traffic will grow at an annual rate of about 3%P.a.should the projected increase in the district!s truck fleetoccur.
4.4.3 Light Vehicle Traffic:
The ADB Appraisal Mission considered thatgenerally,economic activity in the project area would generate insignificant traffic (Insignificant that iS,in its effecton the feasibility of the project). For the purposes of tra-ffic prediction for design however an estimate of the indu-ced traffic(increased agricultural production,heightened bu-siness interaction between Khulna and Mongla etc.) is requi-red.
.The ratio of light motorised vehicles tobuses is expected to decline from 3.6 in 1981 to 1.3 in 2001.This compares with an average ratio of 2.6 for the Jessore--Khulna Road traffic counts. It has been assumed for the pu-rpose of traffic projection that the ratio of light motorvehicles to buses will be approximately 1.5 and that the li-ght motor vehicles will consist of cars, auto-rickshaws andmotor cycles in proportion to their projected numbers by re-gistration.
It has been assumed that bicycle,rickshaw,animal-drawn cart and pedestrian traffic will grow at about3% P.a.
Based on the above data, the followingestimates of traffic on the Khulna-Mongla Road Project canbe made are shown in Table 4-2.
24

Table 4-2KHULNA-MONGLA. ROAD PROJECTPROJECTED AVERAGE DAILY TRAFFIC
Trucks 394 457 530 614 712
Buses 83 128 189 265 354
Jeeps,Cars&Taxis 52 92 153 238 348
Auto-Rickshaws & 14 19 25 30 35Baby TaxisMotor Cycles 59 81 106 130 149
Bicycles 1247 1446 1676 1943 2252
Rickshaws 1138 1319 1529 1773 2055
Bullock-Carts 29 34 39 45 52
Pedestrians 2470 2863 3319 3848 4461
Source: Monthly Report No:1, Khulna-Mongla Road Project
25
Average Daily Traffic in Year1981 : 1986 : 1991: 1996: 2001
Vehicle Category
PAVEMENT DESIGN
Chapter 5
26
!! TRANSPORT & ROAD RESEARCH LABORATORY. A guide to thestructural design of bitumens - surface roads intropical and sub-tropical contries, Department ofthe Environment, Road Note 31, London, 1977.(HM stationery office), 3rd Edition.
For greater traffic loads upto about 2.5 million ESAL.alternative designs are allowed-
Double surface dressing, 8 inch base, variable subbase2 inch bituminous concrete, 6 inch base, variablesubbase.
5.1 ~lexible Pavement Designs by London TRRL, Road Note 31. 1/ .5.1.1 General. London TRRL, Road Note 31- specl-
fically allows for stage construction within the followingconstraints,
Note
The design system is fixed on a double surface dressingwith a standard base thickness of 6 inches (with variable thick-ness of subbase to allow for different subgrade strengths) fortraffic loads of up to about 0.5 million ESAL (Per lane) .
5.1.2 Full Period Thickness Design. The first possibilityfor flexible pavement thickness design is to design for theinitial construction of a pavement to accommodate the estimateddesign traffic loads for the full design period (i.e. for 32000ESAL). According to the Road Note 31 design method, such a pave-ment would consist of an eight inch upper layer (either 2 inches
"In general for roads which will carry not more thanabout 300 commercial vehicles per day (in both directions) atthe time of construction, the most economical solution will beto choose a double surface dressing on a 6 inch base initiallyand to add a 2 inch bituminous surfacing some yean later".

27
FULL-LIFE PAVE~lliNT
Subbase Design5.1.2.1
SUBBASE THICKNESS REQUIRED FOR
Table 5-1
Source: Monthly Report No:l,Khunla-Mongla Road Project
Subgrade CBR Value Minimum Subbase Thickness 'Design Thic-(% ) ,
(mm) (Inches) 'kness (Inches)I
2 430 16.9 17
3 325 12.8 134 250 9.8 105 200 7 .9 86 160 6.3 6.57 120 4 ..7 5
8-24 100 3;9 4
The subbase to be provided accordingto London TRRL, Road Note 31 will normally be a naturally-occu-
of bituminousconcreteplus 6inches of granular base or a double bitumin-ous surface dressing plus 8 inches of base) overlying a subbaseof variable thickness (thickness varying according to subgra-de strength) .
The subbase thickness required (acco-rding to the design CBR values of the subgrade) are shown inTable 5-1.

28
* Cement
Base Course Design :5.1.2.2
* Cement or Lime-Stabilised soil
* Crushed rock
gravel* Mechanically-Stable natural gravel or Crushed
ring gravel or gravel-sand-clay should have a CBR of 25% ormore at the density and moisture content expected in the field.However if good subbase material is scarce, the quality of the.material used beneath the top 4 'inch layer of the subbase canbe relaxed, provided it has a CBR of at least 8% when tested atthe worst moisture condition likely to occur.
For the Khulna-Mongla Road locally occuring materialswhich meet the above requirements for subbase have not been found.Investigations are proceeding to determine whether local materialscould be stabilised (either machanically or with cement) tosatisfy these requirements.If such a stabilised material proveseconomical it will consist of a mixture of several of the follo~wing :
In Bangladesh the typical base coursematerial used in a bitumen- bound penetration macadam which wouldalso be of adequate quality.
* Bitumen-Stabilised sand
* Imported (ex-Sylhet or ex-India) aggregate
* Local silt-sands
* Local silt-clay
London TRRL, Road Note 31 designcharts are arranged on the assumption that the base course willconsist of one of the following materials :

5.1.3. Designs For Stage Construction:
For an initial pavement design to accommodatethe 5 year, 10 year or 15 year design traffic loads, because thedesign loads are less than 0.5 million ESAL, by London TRRL, RoadNote 31 an initial construction consisting of
* Double surface dressing
* 6 inch base course
* Variable thickness subbasewould be acceptable.
The variable subbase thickness, according to the above threedesign lives are showes in Table 5-2.
Table 5-2
SUBBASE THICKNESSES FOR VARIOUS DESIGNLIFES
Subgrade CBR Subbase Thickness For Design Lifes Of:IStrength 5 years 10 years I 15 yearsI, ,
% '(mm) ,(inches) (mm) ,{inches) :(mm) I (inches), , ,I
2 420 16.5 450 17.7 470 18.5
3 320 12.6 340 13.4 360 14.24 260 10.2 275 10.8 285 11. 25 210 8.3 225 8.9 235 9 .36 170 6 .7 180 7.1 190 7.57 130 5.1 140 5.5 150 5.9
8-24 100 3 .9 100 3;9 100 3.9
Source : Monthly Report No : 2, Khulna-Mongla Road Project
A comparison of total pavement thickness for 5 year, 10 year,15 year and 20 year designs are showes in Table 5-3. In acc-ordance with normal practice the thickness of a surface dressing
29

30
Table 5-3
,15 year :20 year(inches) :(inches),
I
10 year,(inches)
5 year(inches)
Total Pavement Thickness For Design Lives Of:'
TOTAL PAVEMENT THICKNESS FOR VARIOUSDESIGN LIVES
* 6" base course
5.1.4 Preliminary Design By London TRRL,Road Note 31
* 2" bituminous concrete
Source Monthly Report No:2, Khulna-Mongla Road Project
* Variable subbase thickness (according tosubgrade strength) .
2 22.5 23.7 24.5 24.93 18.6 19.4 20.2 20.84 16.2 16.8 17.2 17.85 14 .3 14.9 15.3 15.96 12.7 13 .1 13.5 14.37 11.1 11.5 11. 9 12.7
8-24 9.9 9 .9 9.9 9.9
(%)
is ignored (as it does not contribute significantly to thestructural strength of the pavement) .
Subgrade CBR
For the purpose of preliminary design costcomparisons the Road Note 31 design can be summarised as cons-isting of :
5.2 Flexible Pavement Designs By London RRL, Road Note 29
5.2.1 Subbase Design:For design traffic loads up to 0.5
million ESAL a subbase of CBR value 20% or more is satisfactory;

Table' 5-4
31
17.0
13 .0
10.08.56.56.06.0
Design Thicknessinchesmm inches
425 16.7320 12.6250 9.8205 8.1155 6 .1150 5.9150 5.9
Subbase Thickness Minimum
SUBBASE THICKNESS REQUIREMENT
Monthly Report No:2, Khulna-Mongla RoadSource
2
34
5
6
78-24
Note:Granular subbase(Type 1)- Crushed rock, crushed slag, cru-shed concrete orwell-burnt non-plastic shale (alter-nat-ively crushed well-burnt bricks); the material is coarse(3 inches maximum size) but well-graded and non-plastic.Granular subbase(Type 2) - Natural sands, gravels, cruS-hed rock, crushed slag, crushed concrete or well burntnon-plas.tic shale (Crush well-burnt bricks): the materialis coarse (3 inches maximum size) but well graded (altho-ugh th~ grading limits are more open than for Type 1) ;thefines shall have a maximum plasticity index of 6%.
Subgrade CBR(% )
for traffic in excess of 0.5 million ESAL (the case with theKhulna-Mongla Road), the minimum subbase CBR strength is 30%.Actual CBR strength testing is not required for ~aterials co-nforming to the specified requirements of Type 1 subbase,Type 2subbase containing more than 10% retained on the 20.0mm BSSieve (3/4 inches) nor for standard stabilised materials. Allof these materials can be assumed to fulfil the CBR 30% requ-irement without CBR testing.
Subbase thicknesses required for the full 20 yeardesign life by London RRL, Road Note 29 are shown in Table 5-4;

5.2.2 Surfacing DesignIn the London RRL, Road Note 29 design
method, for the design traffic loads estimated, a surfacingcourse of at least 63mm (2.5 inches) is required. This is atwo-layer course consisting of an upper 3/4 inch- thicknesswearing course of rolled asphalt or equivalent, overlaying13/4 inch thickness .of rolled asphalt, dense bitumen macadam,or single course bitumen. macadam.
5.2.3 Base Course Design
A variety of basecourse (road basel mate-rials are allowed by London RRL, Road Note 29. For the designtraffic loads estimated, the basecourse design thickness requ-ired for the various alternatives are :
* 3 inches rolled asphalt road base
* 3.5 inches dense macadam road base
* 5.5 inches soil cement, cement boundgranular material or lean concrete.-
* 5.5 inches wet-mix and dry-bound maca-dam road base.
5.3 Earlier Pavement Designs
5.3.1 Introduction
Owing to the scarcity and cost of provid-ing naturally occuring aggregate for pavement construction, Wh-ole brick or crushed brick is invariably use (in BangladeshI forsubbase and base courses with a-wearing surface which is asphal-.tic concrete. Since it takes about 300 tons of imported coal tomake enough bricks to form a road 1 mile long, 18 feet wide and13 inches thick.
Suggested alternatives for study are:alThe importation by waterways of suitable hard•.
stone from India.b) Using soil stabilisation techniques. Because of
32
the widespread availability of low plasticityand non-plastic subsoils the potential for (lime)stabilisation of alluvial flood plain soils wasinvestigated.
The possibility of providing a bituminous surface tre-atment instead of a more expensive bituminous concrete surfacinghas also been considered. However, in view. of the relativelyhigh traffic volumes it is considered that maintenance costswould make a bituminous surface treatment uneconomical.
* Bitumen stabilisation is only economically effectivefor virtually non-plastic materials;the only locallyavailable such materials are silt-sands of little mec-hnical strength and stabilisation of these materialswith bitumem would be very expensive.
* Lime stabilisation is particularly effective with twotypes of material -
Plastic highly-active(e.g. montmorillonite) clays.Well-graded materials of low but slightly excess-ive plasticity (e.g. plasticity index from about12% to 20%) neither of which are available in theproject area.
The possibility of stabilisation to achieve low-cost pavementmaterials is being pursued from two view points :
* Mechanical stabilisation of local materials with impor-ted aggregate
* Cement stabilisation of local materials.
5.3.3 ADB Pavement Design
The ADB Assessment of pavement requirementswas necessarilX conservative, being an aid appraisal mission. Itis considered that the final pavement design may be less expensivethan that considered by ADB namely :
33

* 3 inch sand layer.
5.4 Pavement Design Adopted In Khu1na-Mong1a Road:
The RHD made the following provision for pavement in theproject proforma
* 2 inch dense bituminous concrete
* 1\ inch bitumen surface
* 5 inch bitumen macadam
* 9 inch brick base
* Brick soling
* 3 inch grouted bituminous macadam
* 3 inch water-bound macadam
* 10 inch subbase
34 . . "

ISUBGRAD,ECBR 40;.
Normal ground surface
I "-4 Cte~t 40-0 !
• J Ii,' 'I18f. 9! 22 & 24 I 8 & 9 I... Shoulder , pav,ement : Shoulder
, I~. 1 3°/. I.. 'I ...,,0/0 s~ I. ' ~ BASE CBR, BOo/. ~
___ --4--- _---- I ---
SUBBASE C~R 250;.30/0_50/0
.'.,.'V
0<.'-'\..
<
FIG. 3 A TYPICAL ROADWAY SECTION
5-I
~.
.- .",
35
Chapter 6
3" grouted bituminous macadam
3" Water-bound macadam
HI" Sub-base*
*
*
STRUCTURAL DESIGNS OF PAVEMENT
Over a subgrade with CBR 4% minimum.
The RHD requested a reduction of the pavement to:
* 2" dense bituminous concerete
The original pavement design consisted of:
* 2" dense bituminous concrete
* 3" grouted bituminous macadam
* 4" Water-bound macadam
* 10"Sub-base
6.1 Design of Pavement in Khu1na-Mong1a Road
In accordance with Road Note 31, this pavement would
have a design traffic capacity of at least 0.95 MESAL which
for the design loads recommended, and a design life of atleast 12 years.
In accordance with Road Note 29, this pavement would
have a design traffic capacity of at least 2.5 MESAL and adesign life of 20 years.
This pavement would have a capacity in the range0.65-1.20 MESAL.
For the order of traffic estimated for the
Project road, a check of pavement deflections under load is
advisable to preclude fatique craking in the surface. This
is particularly important in pavements which include bound
layers as these are more sensitive to deflection is a gravel
pavement will tolerate approximately twice the deflection of
a pavement containing thick bound layers~
Both the original and modified (by RHD) pavements
include a substantial thickness of bitumen bound material.
A deflection check using the NAASRA method indicates that the
pavements have a traffic capacity of 1.5 MESAL (life of 14
years) for the briginal design and a traffic capacity of at
least 0.95 MESAL (life of 10 years) for the modified design.
To achieve the 20 year life capacity for the road
(2.3 MESAL) means that, either, a thicker pavement is cons-
tructed now or, that the pavement is overlayed with bitumin-
ous concrete or a waterbound macadam with bituminous seal as
the traffic load approaches the roads capacity.
6.2 Alternative Structural designs:
The following alternative designs assume a subgradestrength of CBR.4% minimum .
•
The first alternative is to design for a 20-year
life in the upper-bound case; for a design capacity of
approximately 6.24 MESAL, well in excess of the capacity of
36

37
water-bouna macadam:
3.0" dense bituminous concrete
4.3" bitumen macadam
flush seal
8" water-bound macadam
10.9" sub-base (CBR 30% minimum)
13.5" sub-base (CBR 25% minimum]
**
*
**
For an approximate 10-year life in the upper-bound
*
In this case Road Note 31 applied and indicates:
These various design imply "laye~ equivalence•
be used and the following alternative pavements are indicated:
the Road Note 31 method. For such loads Road Note 29 must
29 indicates the following alternative designs:
case and a 20-year life at the recommended loads, a pavement
capacity of approximately 2.3 MESAL is required and Road Note
beina annroximately equivalent to the following thickness of
factors" for the various materials, one inch of each material.
For First 9.7 miles of road (GC 1 & 2)
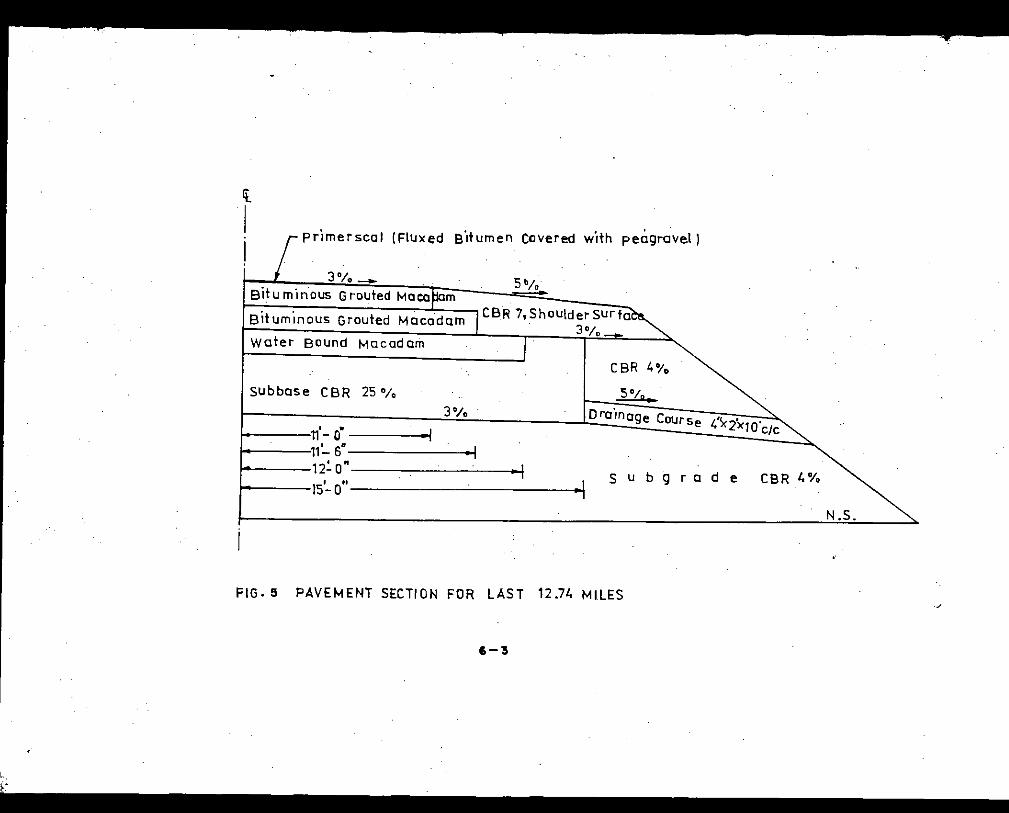
For RBmaining 12.4 miles of road (GC 5)
22" water-bound macada~
19" water-bound macadam
19" water bound macadam
1 .0"
0.85"
0.80"
1.65"bituminous macadam
sub-base (CBR 30% min.)
38
bituminous concrete
For 6.25 MESAL
sub-base (CBR 25% min.)
For 2,3 MESAL
Surface dressing (Primer - Seal)6" bitumen macadam comprising two equal layers3" water bound macadam base course10" sub-base (Two equal layers)
Surface dressing (Primer - Seal)5" bitumen macadam' (Two equal layers)4" water bound macadam base course10" sub-base (Two equal layers)
For original design
*
*
*
*
*
*
The "structure equivalence" of the various design
The following pavement designs adopted -
is thus

primerseal (Fluxed Eiitumen Covered with Peagravel)
'''''1 I w.e .M.
sub 9 r Q de CBR 4'10
CBR 4'10
5 %
!- -Ora inage Course 4"x iXlO'cio
~~ -Shoulder surfaceCBR 7% 3'/0_
3%
, • "112.012'.6' I13'.0" • I16'.0" .1
J.%Bit. Pen. MQC.12nd lay.,
B'd. Pen.MQc.llSt
SubbQse CBR 25'10
tiII
•co
~+
FIG.4 PAVEMENT SECTION FOR 1ST 9.7 MILES
i-Z
primerscal (Fluxed B'ltumen Covered w'rth peagravel)
5 u b 9 r a d e CBR
5°/Q.
Dra'mage Course 4''xixl0'c/C
5'/0
CBR 4'10
CBR 7,ShoulderSurfa3%
3%
11'- o' .111~6" .112: O. • IISI-O" •.l
3% __
situ m'lnous Grouted Maca
water Bound Macadam
Subbase CBR 250;.
Ii.
II
FIG.5 PAVEMENT SECTION FOR LAST 12.74 MILES/
6-3
L..
j.:

Chapter 7PAVEMENTEVAlUATIONOFKHULNA- MJNGIA ROAD'
7,1 Introduction:
'Ihe pavementdesign review for Khulna-M:mg1a!bad consequentlyentailed a corrp1ete review of the design loading: Cargo carried, Passange-
rs carried, Gross loads of vehicles, Distribution of loads on vehicles,
Danagingeffects of axle loads, Channelisation of traffic,etc. SnowyM:Jun-tains Corporation, Australia was confirmed that the life of the original
design according to LondonRRLi!bad Note 29 was probably 20 years(UsingLondonTRRL,RoadNote 31 at least 12 years). The conclusion of the reviewwas that the original design should be adequate but that a p.ased constru,..ction approach be adopted incorporating rronitoring of traffic and pavementperfomance and control of loads.
Pavementdesign review was done by the SnowyM:JuntainsEnginee-ring Corporation, Australia by the request of Roadsand HighwayDeparbnent.
!bads and Highv.ayDeparbnentrequested because they have no, well control- 'led bituminous concrete batching plants, v.h.enKhulna-Mongla!bad were con-structed. 'l'heoriginal design included a 2" bituminous concrete surfacing,
therefore RHDrequested a review "of the design, to enable construction forat least a 10 year life, but without use of bituminous concrete.
The various designs (Including the original design for the pro-ject) were also checked against fatigue cracking by meansof the newNAASRA
deflection methodv.h.ichwas not available at the time of the original pave--ment design. 'Ihis design method, designs against surface cracking v.h.idJ.
could pennit penetration of surface water into the pavEmentstructure ulti,..
mately causing a deep-seated failure resulting fran weakeningof the lowerlayers of the pavementand of the sub-grade.
In pavEmentevaluation report of SnowyMountainsEngineeringCorporation, Australia have confirmed that the original pavementdesign,ac-
cording to the CBRmethods, was structurally adequate for the re-evaluated
best-est:imate to traffic loads. The deflection checks h~ver indicated
that to sane degree the !bad Notemethodsappeared not to cater adequately
39

at this point in time, it is not possible to monitor the tra-
7.2 Pavement Evaluation Methodology
40
Department of Main ~oads.DMR =
The Benkleman Beam was selected as the most appropri-ate means of evaluating the pavement by deflection criterion,The Transient Test Method, as detailed in TRRL laboratory Re-ports 835, 935 and LR 525 was adopted.
these loads. These tasks will have to await the arrival of the
ferries and the commissioning of the port.
the port of Mongla has yet to be commissioned. Consequently,
for the Rupsa River crossing at Khulna, are yet to arrive and
Khulna-Mongla Road is currently only serving light
ffic, vehicle loads and the performamce of the pavement under
traffic as the two ferries, to be provided under the project
for fatigue cracking of stiffer naterials such as bituminous =ncrete andbitumen-penetrationnacadam. 'Thedeflectionchecks indicatedbe adequateunder the re - evaluated best-estinateof traffic loads for sanewhere inthe range of 9 years to 17 years.
The methodology finally selected for evaluation of thecondition of the pavement was that incorporated in the D~Rl/(NSW) publication, pavement thickness Design, (M.R.Form 76) •
The timing of the investigation was considered of prime imp-ortance as it-was viewed as vital to conduct the deflectiontesting at a time which most closely approximated the worst
"Construction of pavement without Bituminous contrete"highlighted what may be construed as a deficiency in the CBRpavement design methods of Road Notes 29 and 31, namely perfo-rmance of pavement incorporat'ing thick bound layers from a
,fatigue cracking viewpoint.

condition, that of the soaked condition. The 1983 Monsoon inthe project area, was most severe with the rains beginnings in: ,- , .
early May and continuing until the third week of october.Therainfall recorded in this period was 68.17 inches comparedwith the average of 60.74 inches. The Benkleman Beam surveycommenced virtually the day the rains ceased and the prevai-ling on-shore or Southerly winds swung to the North. Thedeflections were thus recorded under, most probably, theworst conditions the pavement will have to endure during itsservice life especially considering the fact that the waterproving surfacing, the primerseal, was not completed untilwell into the Monsoon. It ca~ reasonably be assumed that thedeflections recorded would in fact be maximum deflections.
Transient deflection tests were conducted at 100 ft.intervals for both wheelpaths in both carriageways. Adjust-ment of measured deflections are normally made to correctfor moisture and temperature. As stated previously the inv-estigation was conducted when the subgrade was at its weakestcondition so no correction for moisture was considered nec-essary. It is interesting to note that the literature on thesulject. indicates that increases in deflections of over 60%can be expected from Dry Season measurements to Wet Seasonmeasurements.
The prevailing temperatures in October and Novemberwere very high and correction for temperature correction me-thods have been postulated for many different parts of theworld. Some such methods examined were those for Kenya,Malaysia, Australia and the United Kingdom. Hundreds of Testswere carried out at selected locations at different times ofthe day and tibth deflection and temperature measurements were
41
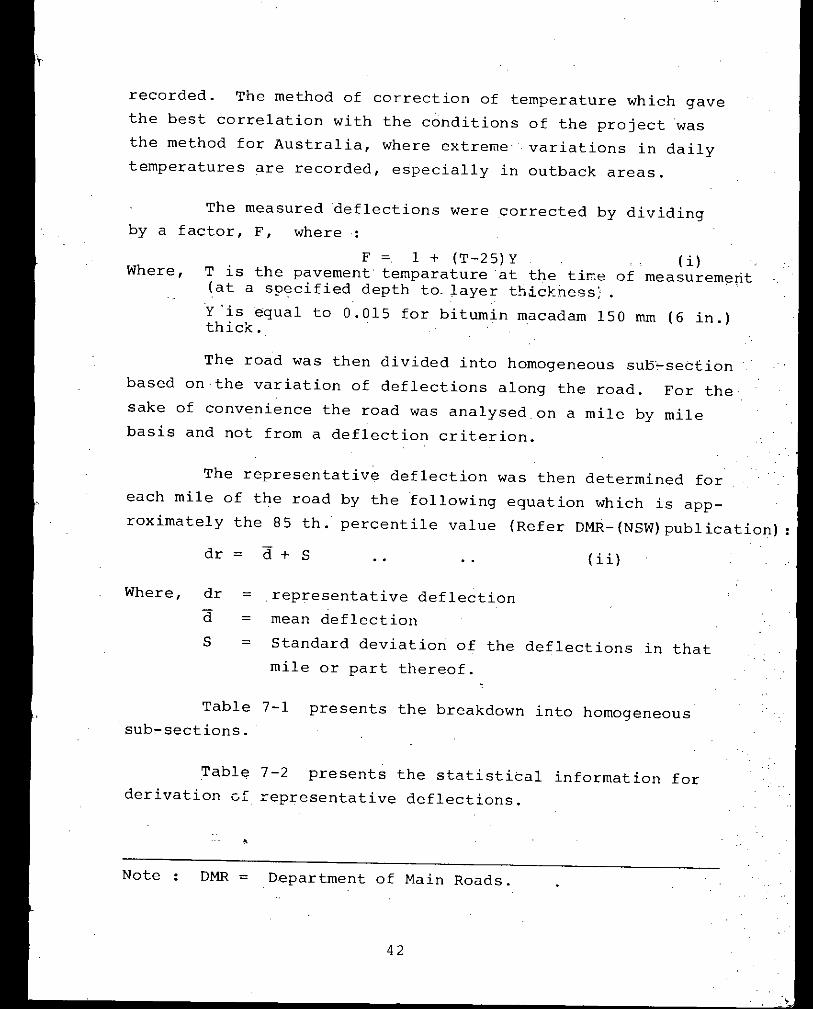
Table 7-1 presents the breakdown into homogeneoussub-sections.
The measured deflections were corrected by dividingby a factor, F, where:
(ii)
42
representative deflectionmean deflectionStandard deviation of the deflections in thatmile or part thereof.
dr = d + S
dr =d =S =
DMR = Department of Main Roads.
The road was then divided into homogeneous suB~sectionbased on the variation of deflections along the road. For thesake of convenience the road was analysed on a mile by milebasis and not from a deflection criterion.
recorded. The method of correction of temperature which gavethe best correlation with the c6nditions of the project wasthe method for Australia, where extreme" variations in dailytemperatures are recorded, especially in outback areas.
F = 1 + (T-25)Y (i)Where, T is the pavement' temparature at the time of measurem",rt
(at a specified depth to. layer tJ:d.ckness;.y'is equal to 0.015 for bitumin macadam 150 mm (6 in.)iliict. . .
The representative deflection was then determined foreach mile of the road by the following equation which is app-roximately the 85 tho percentile value (Refer DMR-(NSW) publication)
Where,
Table 7-2 presents the statistical information forderivation 0[ representative deflections.
Note
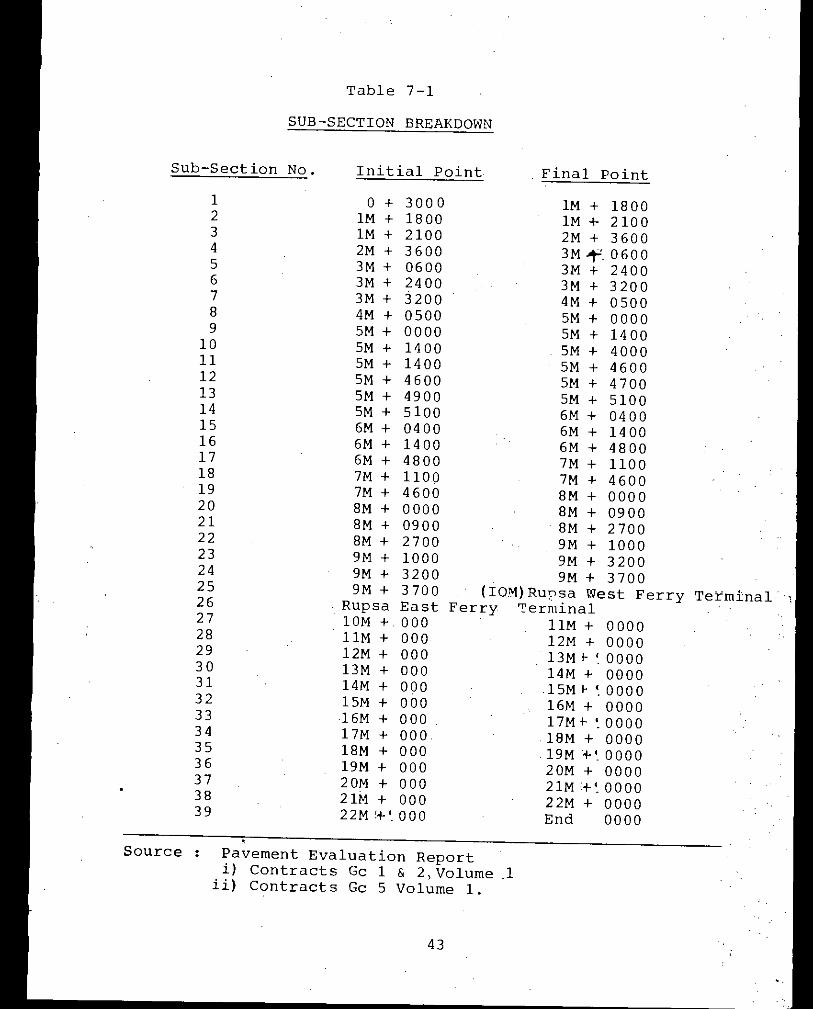
Table 7-1SUB-SECTION BREAKDOWN
Sub-Section No. Initial Point Final Point1 0 + 3000 1M + 18002 1M + 1800 1M + 21003 1M + 2100 2M + 36004 2M + 3600 3M f. 06005 3M + 0600 3M + 24006 3M + 2400 3M + 32007 3M + 3200 4M + 05008 4M + 0500 5M + 00009 5M + 0000 5M + 140010 5M + 1400 5M + 400011 5M + 1400 5M + 460012 5M + 4600 5M + 470013 5M + 4900 5M + 510014 5M + 5100 6M + 040015 6M + 0400 6M + 140016 6M + 1400 6M + 480017 6M + 4800 7M + 110018 7M + 1100 7M + 460019 7M + 4600 8M + 000020 8M + 0000 8M + 090021 8M + 0900 8M + 270022 8M + 2700 9M + 100023 9M + 1000 9M + 320024 9M + 3200 9M + 370025 9M + 3700 (IOM)Ru?sa West Ferry Terminal.26 Rupsa East Ferry ~erminal27 10M + 000 11M + 000028 11M + 000 12M + 000029 12M + 000 13M f- ' 000030 13M + 000 14M + 000031 14M + 000 15M t-~000032 15M + 000 16M + 000033 16M + 000 17Mt-~000034 17M + 000 IBM + 000035 IBM + 000 .19M+'000036 19M + 000 20M + 000037 20M + 000 21M+~000038 21M + 000 22M + 000039 22M :+'. 000 End 0000.
Source Pavement Evaluation Reporti) Contracts Gc 1 & 2,Volume 1ii) Contracts Gc 5 Volume 1.
43
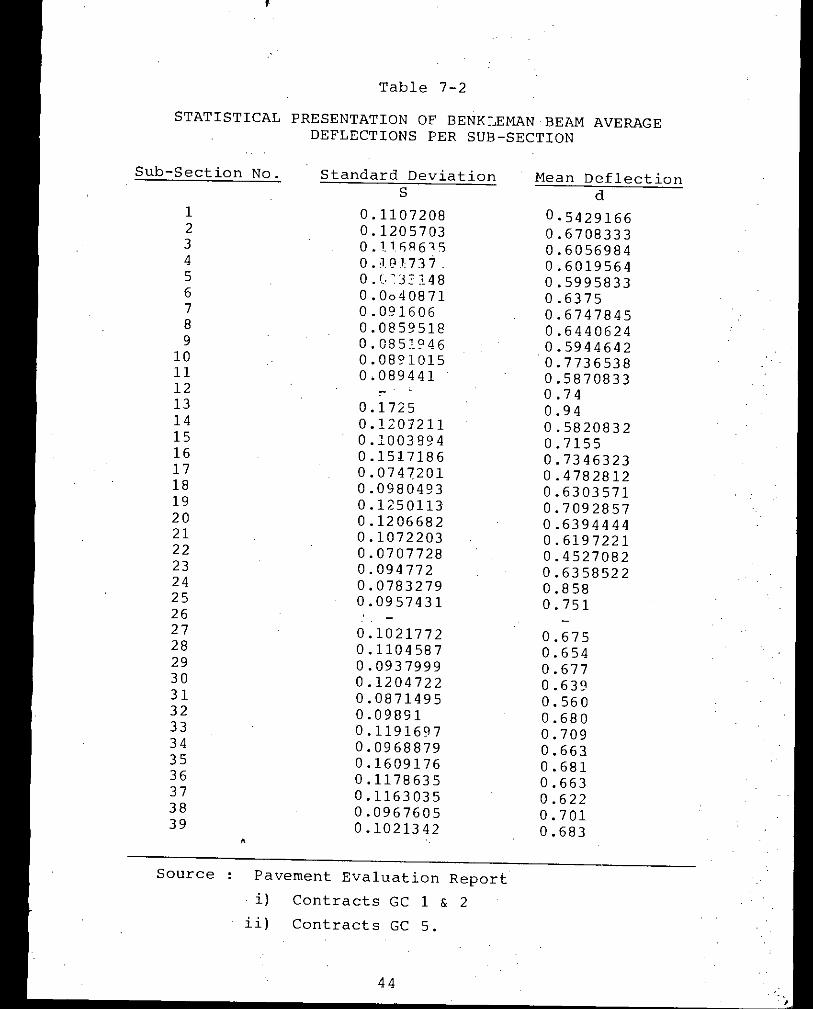
Table 7-2
STATISTICAL PRESENTATION OF BENK~EMAN BEAM AVERAGEDEFLECTIONS PER SUB-SECTION
Sub-Section No. Standard Deviation Mean DeflectionS d
1 0.1107208 0.54291662 0.1205703 0.67083333 0.11fiR6V; 0.60569844 0.Hn737. 0.60195645 o .(,~J = 148 0.59958336 0.0040871 0.63757 0.091606 0.67478458 0.0859518 0.64406249 0.085'.,,46 0.594464210 0.08,,1015 0.773653811 0.089441 0.587083312 - 0.7413 0.1725 0.9414 0.1207211 0.582083215 0.1003894 0.715516 0.1517186 0.734632317 0.0747201 0.478281218 0.0980493 0.630357119 0.1250113 0.709285720 0.1206682 0.639444421 0.1072203 0.619722122 0.0707728 0.452708223 0.094772 0.635852224 0.0783279 0.85825 0.0957431 0.7512627 0.1021772 0.67528 0.1104587 0.65429 0.0937999 0.67730 0.1204722 0.63931 0.0871495 0.56032 0.09891 0.68033 0.1191697 0.70934 0.0968879 0.66335 0.1609176 0.68136 0.1178635 0.66337 0.1163035 0.62238 0.0967605 0.70139 0.1021342 0.683•
Source Pavement Evaluation Reporti) Contracts GC 1 & 2
ii) Contracts GC 5.
44
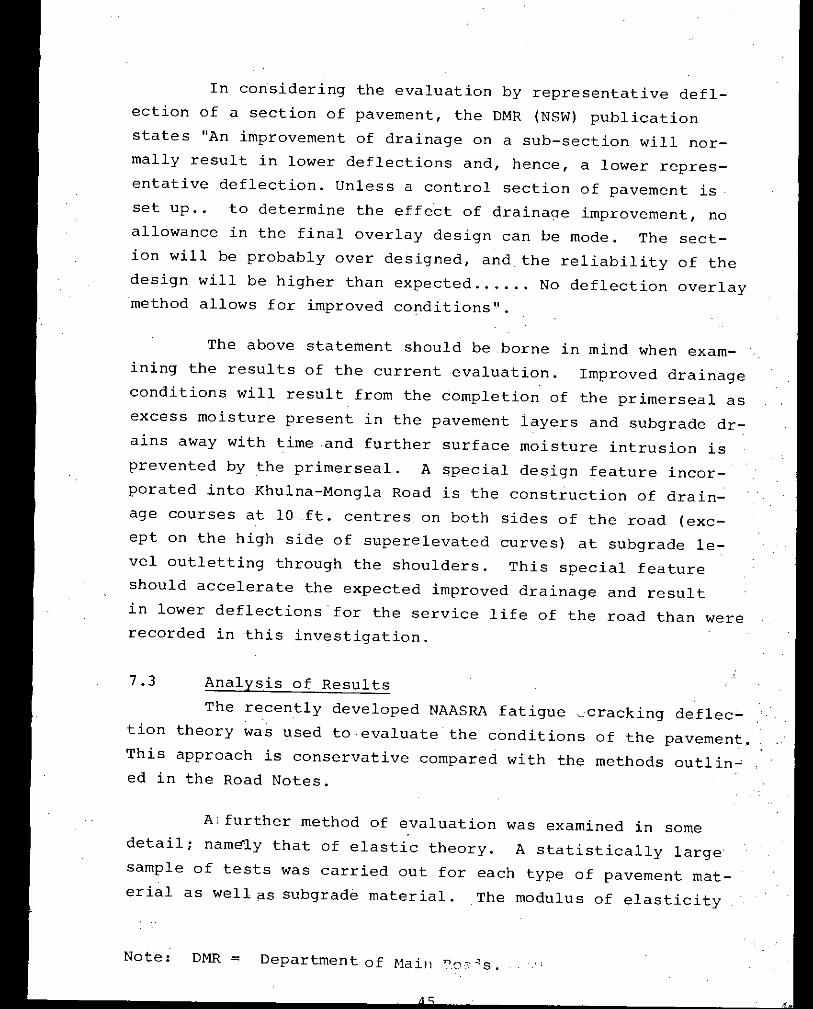
In considering the evaluation by representative defl-ection of a section of pavement, the DMR (NSW) publicationstates "An improvement of drainage on a sub-section will nor-mally result in lower deflections and, hence, a lower repres-entative deflection. Unless a control section of pavement isset up .. to determine the effect of drainaqe improvement, noallowance in the final overlay design can be mode. The sect-ion will be probably over designed, and the reliability of thedesign will be higher than expected No deflection overlaymethod allows for improved conditions".
The above statement should be borne in mind when exam-ining the results of the current evaluation. Improved drainageconditions will result from the completion of the primerseal asexcess moisture present in the pavement layers and subgrade dr-ains away with time and further surface moisture intrusion isprevented by the primerseal. A special design feature incor-porated into Khulna-Mongla Road is the construction of drain-age courses at 10ft. centres on both sides of the road (exc-ept on the high side of superelevated curves) at subgrade le-vel outletting through the shoulders. This special featureshould accelerate the expected improved drainage and resultin lower deflections for the service life of the road than wererecorded in this investigation.
7.3 Analysis of ResultsThe recently developed NAASRA fatigue ~cracking deflec~
tion theory was used to evaluate the conditions of the pavement.This approach is conservative compared with the methods outlin~ed in the Road Notes.
A further method of evaluation was examined in somedetail; nam~ly that of elastic theory. A statistically largesample of tests was carried out for each type of pavement mat-erial as well as subgrade material. The modulus of elasticity
Note: DMR = Department of Main no, "s.
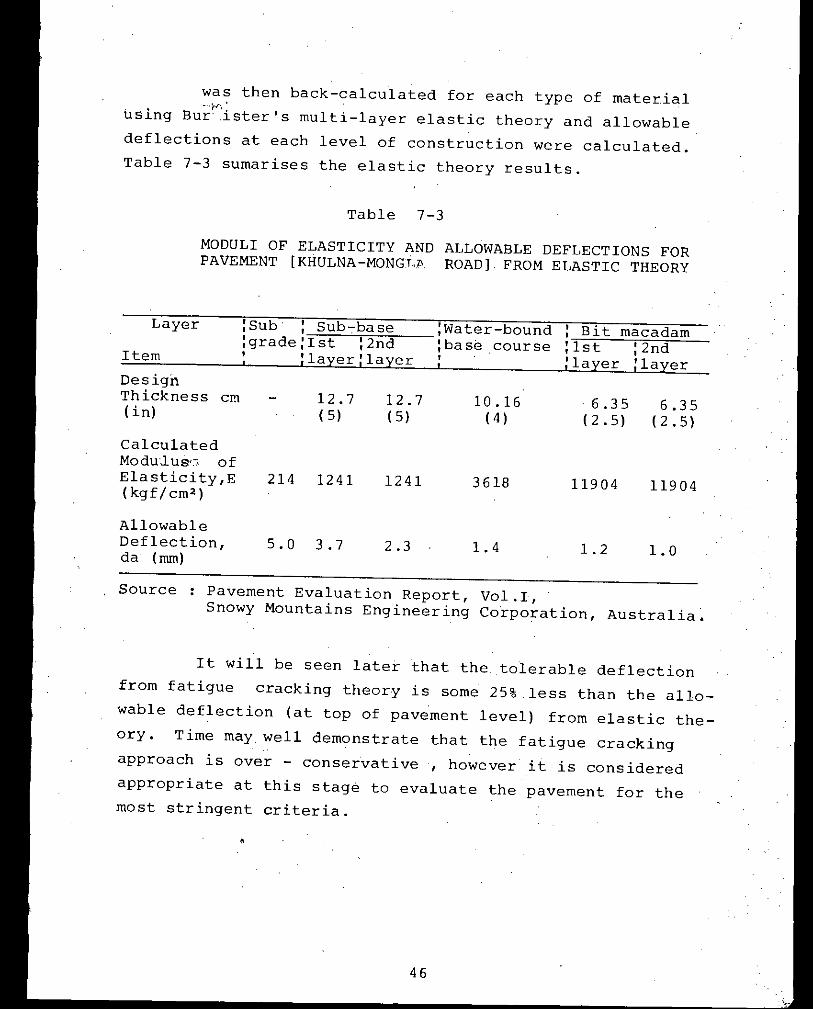
was then back-calculated for each type of material--.M' .
using Bur .ister's multi-layer elastic theory and allowabledeflections at each level of construction were calculated.Table 7-3 sumarises the elastic theory results.
Table 7-3
MODULI OF ELASTICITY AND ALLOWABLE DEFLECTIONS FORPAVEMENT [KHULNA-MONGJ,I' ROAD]. FROM ELASTIC THEORY
Layer :Sub' , Sub.,.base :Water-bound , Bit. macadam, ,:grade:Ist :2nd :base course :lst :2ndItem , :layer;layer , :layer :layer,
DesignThickness cm 12.7 12.7 10.16 .6.35 6.35(in) (5) (5) (4) (2.5) (2.5)CalculatedModu'~us'~:ofElasticity,E 214 1241 1241 3618 11904 11904(kgf/cm2)
AllowableDeflection, 5.0 3 .7 2.3 1.4 1.2 1.0da (rom)
Source: Pavement Evaluation Report, Vol.I,Snowy Mountains Engineering Corporation, Australia~
It will be seen later that the. tolerable deflectionfrom fatigue cracking theory is some 25% less than the allo-wable deflection (at top of pavement level) from elastic the-ory. Time may well demonstrate that the fatigue crackingapproach is over - conservative , however it is consideredappropriate at this stage to evaluate the pavement for themost stringent criteria.
46

The original pavement design was prepared for a ~ave-ment life which catered for 1.0 MESAL. (one million equivalentstandared axle loads) however the 1981 Pavement Design Reviewsubsequently considered a best-estimate to traffic loads,aft-er examination of the then new data, of 2.3 MESAL. This figu-re allows for a certain amount of overloading, comparativewith similar roads in Bangladesh, however does not cater forthe extreme overloading case as it was assumed that load con-trols will be implemented. The Review stated that, if over-loading was permitted to continue unchecked, the road communi~cation network of Bangladesh would be bankrupted rapidly.
At this stage it is pertinent to state that the cons-truction of Khulna-Mongla Road posed some unique problems froma geotechnical view point. The road is located entirely with-in the tidal zone and traverses very recently deposited alluv-ial materials. The surrounding land, especially in the lowerreaches, is inundated for the greater part of the year. Thereis a great scarcity of material suitable for embankment con-struction, however detailed materials searches and selectiveborrowing made it possible to construct an embankment whichyielded the design subgrade CBR (soaked) value of 4% at 95%standard or proctor compaction. Extensive field and labora-tory testing confirmed that the design subgrade CBR value wasneR~jwriohthowever the result was that the composition of theembankment (and subgrade) varies significantly along the roadwith some materials being for more susceptible to soaking thanothers. The breaking down of the road (first 9.7 miles) into26 homogeneous subsections on a deflection basis highlightsthis and each subsection nearly perfectly coincides with ,ch-.anges in the nature of the subgrade material.
In the last 12.4 miles, the shortage of suitable em-bankment material was for more critical and for large areas;
47

material had to be dredged from isolated pockets of sand (lo-cated by extensive materials searches) and pumped, in somecases will over a miles, for hydraulic placement as embankment.
other unique, for Bangladesh, measures adootp.n.on theproject to overcome the difficult geotechnical conditions arelisted below :
the incorporation of a sand filter layer in theembankment to minimise the effect of capillaryrise in the embankment,
the incorporation of drainage courses at 10 ft.centres along the road except in sections of sandembankment, to improve pavement and subgrade dra-inage properties.
the need to stage construct the high fill approa-ches to the bridges.
the need to preload the embankments at the bridgesites to minimise the downdrage effects on theabutment pile groups.
all embankments were constructed with a 10% heightsurcharge to accelerate the expected time depende-nt settlement so as to provide a stable road-bedprior to pavement construction.
incorporation of settlement - plates along theroad to enable monitoring of the settlement as ittgok place and assessment of when settlement wascomplete.
48

the need to past-load many of the Khal crossingswhich were infilled and where it was not physica-lly possible to compact the infill material. Inthe last 12.7 miles, area it was not economicallyfeasible to Post-load the rest number of khal cr-ossings.
Now to evaluate the results of the Benkleman Beamdeflection investigation, numerical charting of the deflec-tion results for the four wheelpaths considered. Table 7-4,presents from equation (ii) and compares them with the tote-rable deflection for the pavement design as calculated fromthe NAASRA fatique cracking method, and with the allowabledeflection from elastic theory.
Table 7-5 presents the number of years of servicethat can be expected from the pavement, based on fatigue crack~ing theory, against the accumulative equivalent standard axleloads for the best-estimate to traffic loads as recommended inthe 1981 Pavement Design Review.
From Table 7-4, it can be seen that the whole first9.7 mil section and the remaining 12.4 mile section of thepavement satisfy the allowable deflection of 1.0 mm. fromelastic theory. Accordingly from elastic theory it can beconcluded that a design life of 20+ years can be expectedfrom the pavement.
,.
49

Table 7-4
REPRESENTATIVE DEFLECTIONS
Sub- Length of I Representa-: Predicted PredictedISection sub-section: tive Def1e-: Traffic Pavementft I ction I Capacity lifeI I
I dr (mm) I (MESAL) (Years), I
1 4080 0.65 3.8 26':'2 300 0.79 1;4 153 6780 0.72 2.3 204 2280 0.70 2.5 215 1800 0.68 3.0 246 800 0.71 2 .4 207 2580 0.76 1;7 178 4780 0.72 2 .3 209 1400 0.68 3.0 2410 2600 0.85 1;0 1211 600 0.67 3 .2 2512 100 0.74 1;9 1813 200 1;11 0.3 614 580 0.70 2 .5 2115 1000 0.81 1;5 1616 3400 0.88 0.9 1217 1580 0.55 11.0 26+18 3500 0.72 2 .3 2019 .680 0.83 1;1 1320 900 0.76 1;7. 1721 1800 0.73 .2.1 1922 3580 0.52 ,19.0 2&*23 2200 0.73 2.1 1924 500 0.93 o .7 1025 1540 0.84 1;1 132627 5280 0.78 '1;5 1628 5280 0.76 1;7 1729 5280 0.76 1;7 1730 5280 o 75 1;8 1831 5280 0!75 3.8 2~32 5280 0.76 1;7 1733 5280 0.81 1;3 1434 5280 0.75 1;8 1835 5280 0:85 1;0 1236 5280 0.78 1;5 1637 5280 0.73 2.1 1938 • 5280 0.80 1;4 1539 2900 0.78 1;5 16
Source Pavement Evaluation Report.\
i) Contract GC 1 & 2 (ii) Contract GC 5 .
(\:-~. \ .56

1.1013.10"
,i
I
. 1.10"3.10'
FIG.6 MAXIMUM TOLERABLE DEFLECTIONS
2x10'
TOTAL NUMBER OF EQUIVALENT STANOARO AXLES IN ONE DIRECTION•
0'21.10'
1,4
'1,6
EEzz0
•••0'"..J•••'"Q'"0•••••a:~en
'"..JlD••a:'"'..J0
••.. 0,4 .',

3.8
3-6
3.4
3'2
3.0
2.8
2.6
2.4
2.2~CD0 2.0)(
.J~ 1.8.,'"~., 1.60~0.J 1.4
'".J)(~ 1.2
'":::I- 1.0~.J~:E 0.8:>uu~
0.6
0.4
0.2
-------~. YEARS OF SURVICE
20 22 24 26 28 30

Table 7-5
Table 7-6 summarises the findings from fatigue cracking.theory (First 9.7 miles of the road pavement)
15.6%17.9%66.1%
0.0340.3320.8611.5932.4933.598
percentage of Road with thispredicted life17.8%74.4%7.8%
Percentage of Road with thispredicted life
0.4%
, Accumulative Axle loads (Millions of ESAL'S),
1
6
11
162126
Pavement Evaluation Report.Snowy Mojntains Engineering Corporation, Australia.
Predicted pavementlife (years)
12-1415-1920 +
Table 7-6, summarises the findings from fatigue crackingtheory (Remaining 12.4 miles of road)
YEARS OF SERVICE (FROM TAFIGUE CRACKING THEOTY)AGAINST ACCUMULATIVE EQUIVALENT STANDARD AXLE
LOADS (ESAL'S)
Table 7-6SUMMARY OF FI'}DItlGCLF."<OMFA.TIGUE C~;'\CKINGTHEORY
(First 9.7 miles of the road pavement)
Table 7-6SUMMARY OF FINDINGS FROM FATIGUE CRACKING THEORY
(Remaining 12.4 miles of road pavement)
Source
Predicted pavementlife (years)
5-910-1516-1920 +
Year of Service
The extensive sub-grade investigation programme ensuredthat the design sub-grade CBR was achieved prior to handing overof sections of embankment to .the contractor for pavement construc-tion.
Chapter 8
FINDINGS AND RECOMMENDATIONS
Findings
From the detail investigation of traffic and load datadesign methodology and pavement evaluation of Khulna-MOnglaroad it is resonable to conclude that the pavement design ob-jectives will be achived with respect to both structural ade-quacy and pavement performance. Other major finding and obser-vation are summarise are follows
1) ESAL method of equivalent load calculation has beenone of the best method for estimating the traffic load for pave-ment design because it takes into consideration both the numberof vehicles and the loads of vehicles. For Khulna-Mongla roadthe average equivalence factors are estimated to be 0.21 ESAL/Truck, 0.03 ESAL/Bus and 0.0004 ESAL/Car or Jeep or Taxis.
2) On the basis of the equivalent factor as statedabove the lower bound estimates for the accumulative equivalenttraffic load are estimated to be 134 x lO~, 266 x 10~, 421 X 103and 602 x 103 ESAL for design periods 1981-1986, 1981-1991,1981-1996 and 1981-2001 respectively. The upper bound estimatesfor equmulative equivalent traffic loads for simillar periodsare 141 x 103, 27~ X 103, 442 x 103 and 632 x 103 respectively.Upper bound estimates of equivalent traffic loads differ fromlower bound estimates by approximately 5%.
3) The estimated motor vehicle traffic on averagedaily basis is 1556 for the year 1981, the projected motor vehi-cle traffic for the 2001 is 3750 vehicles/day on average dailybasis. This reflet on annual average growth of approximately7%. In contruct the annual average growth of Non-motorisevehicle (bullock carts, bicycles etc). for Khulna-Mongla roadis about 4%. Numerically, the quamtum of Non-motorise vehicleis 1193 for the year 1981 and 2154 for the year 2001.
54
4) The estimated export cargo to be handle by theMongla port for the year 2000 is determine to be 1.0 milliontons while the quentity of import cargo for the same year isdetermine to be the 2.0 million tons. Relative to the baseyear these reflect average annual growth of 2.2% for exportcagro and 5.5% for import cargo.
5) Base on alternate pavement design the followingpavement structure are selected for Khulna-Mongla road.
First 9.7 miles of road
Surface dressing (Primer - seal)6" bitumen macadam compresing two equal layers10" sub-base (Two equal layers)
Remaining 12.4 miles of road
Surface dressing (Primer - seal)5" bitumen macadam (Two equal layers)4" water bound macadam base course10" sub-base (Two equal layers)
6) From an analysis of benkleman beam deflection estu-dies on the basis of elastic theory, a pavement life in excessof 20 years may be achieved.
From an analysis of benkleman beam deflection data onthe basis of fatic cracking theory it is enticepited that thefirst 9.7-mile section of the pavement may achieved a life inexcess of the .RHD stipulated 10 yearsi with 84% of the roadachieving in excess of 20 years life.
From fatigue cracking theory, the remaining 12.4 mileof the pavewent may achieve a life in excess of the RHD stipu-lated 10 years, with 82;2% of the road achieving in excess of15 years life and 7.8% achieving in excess of 20 years life.
55

Recommendations :
It has not been possible at this time to evaluatethe accuracy of the projected best estimate to traffic loadsas adopted from the 1981 pavement design as the port of Monglahas yet to be commissioned, the Road is only open to lighttraffic and the ferries for the Rupsa River crossing has notyet arrived. During the post construction pavement evalua-tion for the remaining portion of the Road, it is proposed,with the assistance of RHD to conduct traffic counts and axleload surveys to gain an initial impression of the accuracy ofthe 1981 projection. It will be worth while to do this type ofsurvey on a regular and continuing basis throughout the service:life of the Pavement to enable rational and scientific apprai-sal of when pavement will require to be strengthened.
As stated in the body of this report the best-estima-te to traffic loads was adopted based Qn data available. Itmay be mentioned that Khulna-Mongla Road is ideally suitedfor implementation of traffio load controls since there isonly one point of entry at Khu1na and similarly at Mongla.
The pavement is expected to achieve the desired li£eproviding load controls are implemented and the pavement struc-ture is properly maintained in future. Bangladesh has obtainedan infra structural asset in Khu1na-Mongla Road of high qualityand standard and it would be unfortunate to see the huge capitalinvestment wasted through lack of proper maintenance. The roadhas been designed so as to minimise maintenance
56
needs however the two items detailed below warrant spec-ific attention :
the water proof surfacing adopted for Khulna-Mon-gla Road is a primerseal which is a technical inno-vation to Bangladesh. The finished product is verysatisfactory and was achieved using labour- intens.'ive methods. The cost of this type of surfacing issignificantly cheaper than the conventional \ inchthick seal coat, yet should achieve a similar lifeof 3-5 years. The surfacing should be maintainedto prevent water intrusion into the pavement layersand soaking of the subgrade with the resultant weak-ening of the pavement and reduction in pavement life.It is recommended that inspect.ions of the surfacingbe carried out well in advance of each Monsoon andthe necessary, repairs,if any be carried out to asimilar standard. These inspection would also enableproper planning. and budgetting for re-sealing when itbecomes necessary.
the road only traverses "high ground" in a few placesand it is important that the table drains in the-se locations be maintained and cleaned on a regularbasis. The drainage courses installed as a specialfeature for the road must not be obstructed. The out-lets through the embankment batters are hidden fromview (by grassing), however the local village peopleshould be discouraged from placement of fill up ag-ainst the road embankment for shops or other suchpurposes as such a practice would render the drainage'coUrses ineffective. If such filling is considereddesirable from a social view point, a table drain
57

should be constructed between the road embankmentand the filling with access provided by culvert pip-es,bamboo br"idges or similar structures.
Regular maintenance of a minimal nature should becarried out to maximise the life of ;'{huJ)'i.a-.~IonglaRoad.
58
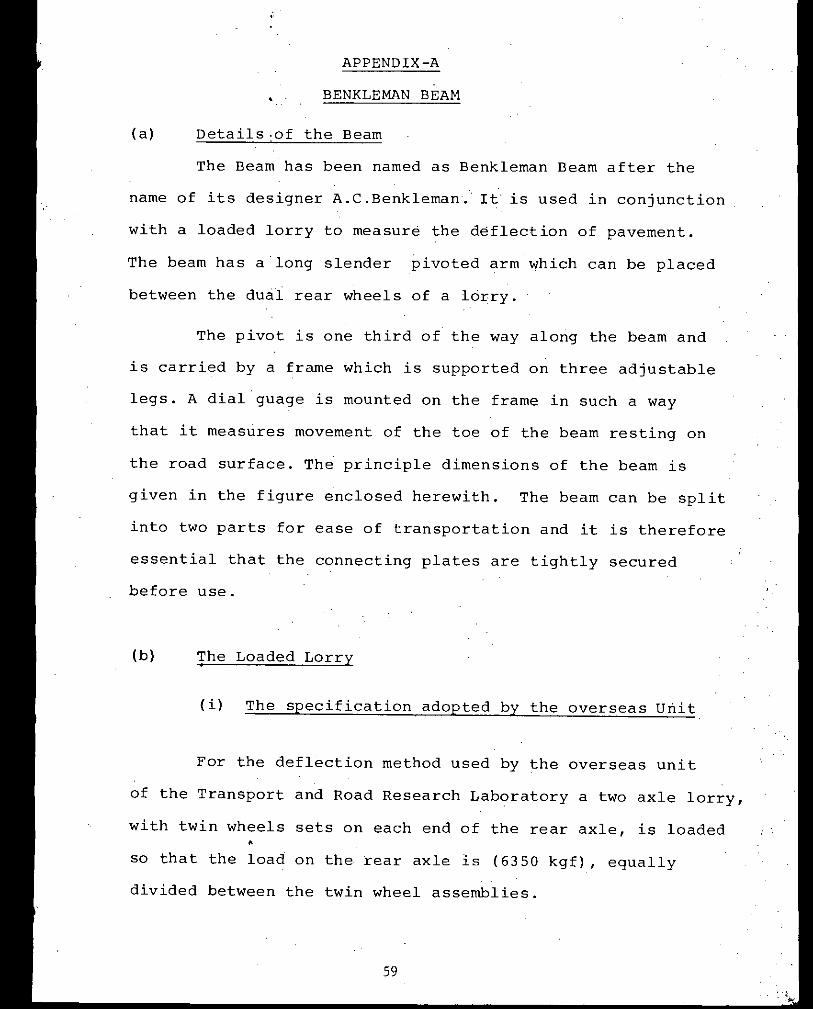
APPENDIX-A
BEN KLEMAN BEAM
(a) Details-of the Beam
The Beam has been named as Benkleman Beam after the
name of its designer A.C.Benkleman. It is used in conjunction
with a loaded lorry to measure the deflection of pavement.
The beam has along slender pivoted arm which can be placed
between the dual rear wheels of a lorry.
The pivot is one third of the way along the beam and
is carried by a frame which is supported on three adjustable
legs. A dialguage is mounted on the frame in such a way
that it measures movement of the toe of the beam resting on
the road surface. The principle dimensions of the beam is
given in the figure enclosed herewith. The beam can be split
into two parts for ease of transportation and it is therefore
essential that the connecting plates are tightly securedbefore use.
(b) The Loaded Lorry
(i) The specification adopted by the overseas Unit
For the deflection method used by the overseas unit
of the Transport and Road Research Laboratory a two axle lorry,
with twin wheels sets on each end of the rear axle, is loaded•
so that the load on the rear axle is (6350 kgf) , equally
divided between the twin wheel assemblies.
59

.herewith.
Blocks of dense concrete or boxed scrap metal are
acceptablePreferred
100-150 mm
Similar to that shown ihFigure 2.
85 psi25-40 mm( > 30 mm is recommended)
6350 kgf :!: 5%3175 kgf :!: 5%(2300-3300 kgf)3.85 m (approx.)7.50x208.25 x 209.00 x 20
Specifications
60
Tyre pressureGap between 'walls of dualrear wheelsGap between contact area ofdual rear wheelsContract area of twin rearwheels
tyres. If the tyres other than.those recommended. are used then
Rear axle loadDual wheel loadFront axle loadWheel baseTyre size
The general dimensions and weights of the vehicles
Characteristics
Table 1. Details of vehicles suitable for deflection testing
the tyre pressures may have to be adjusted to achieve contact
areas as indicated in the Table I below and Figure 2 enclosed
because it is normally easier to obtain correct gap between
use of cross-ply tyres rather than radial tyres is recommended
the walls of the tyres on the dual wheels with cross-ply
recommended for use are given the in the table below. The
magnitude of th~ axle load to change.
ble of absorbing or trapping water which would cause the
the load should not be able to move, nor should it be capa-
ideal materials for loading the lorry. It is important that

(ii) Other Specifications
A common alternative to the specification as given
in the above table involve the use of vehicles with a reaD.
axle load of 8165 kgf, with consequently larger tyr~s.
Care must be taken however not to confuse the deflection
criteria applicable to one axle load with those applicable
to the other. The advantage of using 6350 kgf rear axle
load are that a smaller lorry can be used and running
costs will be generally lower. With few exceptions the
mangitudes of the deflections measured in the two cases
are directly proportional to the wheel loads used.
(c) Methods of using the Benkleman Beam
9
Thre are two basic methods which are commonly usedfor operating the deflection beam
(i) The Transient Deflection Test
This type of test has been adopted for measuring def-
lections in the United Kingdom and is the method used by the
overseas unit of the Transport and Road Research Laboratoryin Developing countries.
The procedure is to mark the test point in the verge
side wheelpath and to possition the lorry parallel to the road
edge with its rear axle 1.3m behind the test point. The Lorry
61

is sligned such that when it mvoes towards the test point
the test point bisects the distance between the tyres of
the verge side dual wheels. With the lorry in the initial
stationary position a deflection beam is positioned centrally
between the dual rear. wheels with its measuring toe resting
on the test point, 1.3 m in front of the rear axle. By using
the adjustable legs and the 'built in' spirit level the frame
of the beam is levelled transversely and having checked the
alignment of the beam and adjusted it if necessary, the
locking system on the beam is released. Adjustment of the
rear foot will ensure that the free end .of the sunshade is
clear of the beam and that there is adequate travel of the
dial guage spindle to record the deflection.
The vibrator is switched on and the dial gauge scale
is rotated until a reading of zero is indicated. After the
completion of preparation for test, the lorry can be driven
forward at creep speed to a point such that the rear axle
is not less than 5 m beyond the test points. The time taken
for the lorry to move the distance from the starting positionshould be between 9 toll. seconds.
Sometimes during the period between setting the dial
gauge to zero and the actually starting to move, the dial
gauge reading may change slightly. It is recommended that
this new reading is recorded as the initial reading rather
than resetting the dial gauge to zero.
62

6
deflection and the difference between the maximum and final
Maximum permissible differencebetween the two tests
(x 102 mm)
2'3456
Repreatability of duplicate deflection test
1010:"3031-5151-100
100
ii) The rebound deflection test :
The rebound deflection test differs from the previous
test in that the dual wheels are positioned immediately above
Mean deflection(x 102 mm)
loading and recovery deflections in the transient test.
and the difference between the tests should be within limits,
Two tests are generally carried out on each test point
Records are kept of the initial maximum and final dial
reading is proportional to the transient recovery deflection.
must be doubled to obtain the actual deflection and recovery
reading is proportional to the' transient recovery deflection.
of the road surface. The transient deflection is the mean of the
Because the lengths of the arms of the pivoted team are in the
ratio' of 2:1 the differences between the dial gauge readings
maximum readings is proportional to the transient loading
ratio:. of 2:1 the differences between the maximum and final
recommended in the table given below.
Table 2
gauge readings. The difference between the initial and the
_Because the lengths of the arms of the pivoted beam are in the

the test points and the toe of the beam is placed on the test
speed until the wheels are far enough away to have no influence
upon the deflection beam. The final dial 1auge reading is
recorded and the rebound deflection can be influenced by the
length of time during which the loading wheels are stationary
over the test point. Care must be taken over the procedure
used. The rebound test is not recommended by the overseas
unit of the Transport and Road Research Laboratory for thefollowing reason :
(i) In the rebound test with the wheels located directly
over the test point at the start of the deflection test,
greater plastic flow will be induced in susceptible materials
because of the time during which the wheels remain stationary
in this position ..When the lorry is driven forward the road
surface rebounds but an indeterminate amount of recovery
of the displaced surfacing material can occur. There is thus.
no clear indication from the simple rebound test when plasticflow occurs.
•
64
.,

a 2.44mb 1.22mc O.30md 0.91me a.6lm
Effective lengih'2.74m
Sinote1001
Twinfeet
pivot.
r160-180
l100-150
~
I J_-1--- II
-+-2.10 250
FiQ.' RANGE OF DIAt"ENSIONS FOR THE CONTACT'AREAS OF THE
DEFLECTION L.ORRY T YRE S.
(0 im ensions in millim'etres l
Ini1l01 positionof wheeisintrons{eht~8st
,__L,, I,-----,
Effective length of beam
FiQ. I DIAGRAMMATIC REPRESENTATION OF THE DE'FLECTION BEAM
Beom
\---~\ '__ I
,,7"--- ---\. 1-----
Ia
f "I:_d+c • 1".,,~+ + \\ I
\I
To.Dimensions
TO.

1.
3.
4.
5.
6.
7.
I .
8.
9.
10.
11.
12.
BIBLIOGRAPHY
A.J. Scale, A Summary of the NAASRA Pavementthickness design Manual, August 1978.
A Policy on Geometric Design of Rural Hyghways1965 by AASHO.
Materials Investigation Report, Khulna-Mongla Road" Project Volume I., .
Monthly Progress Reports, Khulna-Mongla RoadProject, Reports 1 to 78.
Pavement Evaluation Report, Khulna-MonglaRoad Project,GC 1 and. 2, GC 5, Volume I.
Principles of pavement design by Yoder.
ROAD RESEARCH LABORATORY. A guide to thestructural design of Pavements for new roads;Department of the Environment, Road NoteNo. 29, London 1970 (HM Stationary office,3rd Edition) .
Roads and Highways department, BangladeshRoad Research Laboratory. A Guide.to theDesign and construction of Bitumen SurfaceRoads in Bangladesh, February 1979.
Specification, Khulna-Mongla Road Project,Volume II.
TRANSPORT AND ROAD RESEARCH LABORATORY. Aguide to the structural design of bitumenssurface roads in tropical and sub-tropicalcouhtries, Department of the Environment,Road Note No. 31, London, 1977. (HM Station-ery office), 3rd Edition.
Techni"cal Proposal (September 1977)
The project Inception Report (January 197
66