master of science in conservation biology town
TRANSCRIPT
Visual health assessment of parous female
southern right whales (Eubalaena australis) off
the southern Cape coast, South Africa
Master of Science in Conservation Biology
FitzPatrick Institute of African Ornithology,
University of Cape Town
Sandra Hörbst
February 2019
Supervisors - Professor Coleen L. Moloney & Dr Els Vermeulen
Univers
ity of
Cap
e Tow
n

The copyright of this thesis vests in the author. No quotation from it or information derived from it is to be published without full acknowledgement of the source. The thesis is to be used for private study or non-commercial research purposes only.
Published by the University of Cape Town (UCT) in terms of the non-exclusive license granted to UCT by the author.
Univers
ity of
Cap
e Tow
n

i
Plagiarism declaration
I know that plagiarism is wrong. Plagiarism is using another’s work and to pretend that it is
one's own. Each contribution to, and quotation in, this thesis from the work or works of
other people has been attributed and has been cited and referenced. I acknowledge that
copying someone else's assignment or essay, or part of it, is wrong, and declare that this is
my own work. This thesis is my own work. I have not allowed, and will not allow, anyone to
copy my work with the intention of passing it off as his or her own work.
Signature:
Date: 7th February 2019
ii
Table of Contents
Plagiarism declaration .............................................................................................................................. i
Table of Contents .....................................................................................................................................ii
Acknowledgments ................................................................................................................................... iii
Abstract ................................................................................................................................................... 1
Introduction ............................................................................................................................................. 2
Southern right whale reproduction ..................................................................................................... 3
Southern right whale migration .......................................................................................................... 4
Visual health assessments ................................................................................................................... 5
Southern right whale diet and breeding success ................................................................................ 6
Aims and objectives of the study ........................................................................................................ 8
Methods .................................................................................................................................................. 8
Photo Identification data..................................................................................................................... 8
Health assessment variables ............................................................................................................... 9
Scoring and consistency analysis ....................................................................................................... 17
Parity ................................................................................................................................................. 18
Statistical analysis of health assessment scores in relation to environmental indicators and
reproductive success ......................................................................................................................... 19
Results ................................................................................................................................................... 19
Parameter scoring ............................................................................................................................. 19
Parity ................................................................................................................................................. 23
Analysis of health assessment scores in relation to environmental indicators and reproductive
success ............................................................................................................................................... 23
Discussion .............................................................................................................................................. 28
Health variables ................................................................................................................................. 28
Health assessment in relation to environmental indicators and reproductive success ................... 29
Relevance of the study ...................................................................................................................... 31
Limitations of the study ..................................................................................................................... 32
Implications and future research ...................................................................................................... 32
Conclusion ............................................................................................................................................. 33
References ............................................................................................................................................. 35
Appendices ............................................................................................................................................ 41
iii
Acknowledgments
I am exceedingly grateful to my supervisors, Dr Els Vermeulen and Professor Coleen L.
Moloney for their guidance and advice throughout the study. Particularly, I would like to thank
Els for her endless encouragement, passion for southern right whales and inspiring me to
accomplish this project. As well as sharing her office with me during the analysis and always
being there to answer any question, giving quick feedback and corrections. I would like to
specially thank Coleen for her valuable time, sharing statistical knowledge, answering related
questions as well as her help with stylistic matters and corrections of the thesis. I truly
appreciate both supervisors and could have not asked for better support. I would also like to
thank the Mammal Research Institute Whale Unit, University of Pretoria for their long-term
dataset and hard work during the field season collecting this valuable data on southern right
whales. Additionally, I'd like to thank Dr Claire Charlton for a good cooperation establishing
the methodology as well as her advice during analysis. Thanks to Toby Rogers for his time and
feedback during write-up. Thanks to all the lecturers and the CB class 2018 for sharing their
knowledge during the year. Lastly, I'd like to thank Monika Spielmann and Hennie Odendal for
their endless support in difficult times and patience throughout the year.

1
Abstract
The long-term monitoring of the South African southern right whale population has revealed
a decrease in sightings along the coast and an increase of calving intervals within the last few
years, causing changes in the species´ demographics causing a decrease in annual population
growth rate (6.5% y-1). Because reproductive success is linked to body condition, the purpose
of this study was to conduct a visual health assessment based on overhead photographs from
the annual aerial southern right whale surveys and detect potential links between visual
health condition of parous females and the increased calving intervals. Additionally, it was
aimed to find relationships between visual health of parous females and environmental
indices of the Southern Ocean, representing food availability. To allow global comparison of
the results, the method used for the visual health assessment was developed in collaboration
with international southern right whale researchers from Australia and South Africa. The
health indices were adapted from a visual health assessment method developed for northern
right whales and include body condition, skin condition, the presence of cyamids around the
blowholes and rake marks on the skin. The results showed that these health variables derived
from overhead photographs were sufficient to detect visual health changes over time. Within
the study period (2005 – 2017), there were two years in which whales had a significant
decreased visual health (i.e. increased health score) than average; 2008 and 2014. No direct
link between the observed health condition and calving intervals could be found, possibly due
to the lack of data on calving intervals post-2014 as well as the assessment of breeding females
only (i.e. breeding females are in good enough conditions to reproduce). However, significant
relationships were found between visual health and Southern Ocean productivity (p< 0.001)
and climate indices (p < 0.05) with a 0-year lag. These results clearly indicate a link between
southern right whale visual health condition and Southern Ocean food availability in one
feeding ground, suggesting that this may be the primary feeding ground for parous females
during pregnancy. Understanding the links between visual health, reproductive success and
climate/food availability helps to understand changes in the population’s demographics and
to predict the resilience of the species. Additionally, the standardization of the method allows
for global comparison.
Keywords: Health assessment ∙ Right whales ∙ Reproduction ∙ Body condition

2
Introduction
Southern right whales (Eubalaena australis) were severely hunted, especially during the first
half of the 19th century, in at least 16 identified whaling grounds (IWC 2001). Estimates suggest
that in 1920 only 60 adult females remained in the global population (Baker & Clapham 2004).
Their common name "right whale" is thought to originate from whalers as they were
considered the “right” whale to hunt globally, as they occur nearshore with predictable
distributions, swim slowly and float when dead. Although southern right whale were
protected in the 1930's Convention (D'Amato & Chopra, 1991; Kobayashi 2005) illegal catches
from the Soviet Union continued until the 1970s (Tormosov et al. 1998) and may have delayed
the species’ recovery by almost two decades (Baker & Clapham 2004). However, since the late
1970s, the South African population of southern right whales is increasing, and the most
recent rate of increase has been estimated at 6.5% y-1 (Brandão et al. 2018). However, a
decrease in sightings of unaccompanied adults (males and non-calving females) along the
southern Cape coast has been noted since 2009 as well as a decrease of cow-calf pairs since
2015 (Findlay et al. 2016; Vermeulen et al. 2018; Figure 1).
Figure 1: Number of unaccompanied adults and cow-calf pairs sighted in South Africa in annual aerial southern right whale surveys conducted in October each year. Graph from Vermeulen et al. 2018, p.16.
Moreover, the observed calving intervals have increased over the last few years (Figure 2),
from a three-year to a four- and even five-year calving interval (Brandão et al. 2018;

3
Vermeulen et al. 2018). Similar trends of increased calving intervals within the last few years
were observed in the Australian southern right whale population (Charlton et al. 2018). This
decrease in calving events (i.e. increase in calving intervals) will have negative impacts on the
population demography of the species. Therefore, understanding variations in body condition
among parous female southern right whales and how it impacts their calving success and
potential demographic changes is important to predict resilience of the population to external
stressors.
Figure 2: The number of female southern right whales (Eubalaena australis) off South Africa with three-, four-
and five-year calving intervals to previous calving event, from 2005 to 2017.
Southern right whale reproduction
Female southern right whales usually give birth to their first calf at an age of eight years,
thereafter normally giving birth every three years (Cooke et al. 2001; Brandão et al. 2011).
Their three-year calving cycle includes one year of gestation, one year for nursing and raising
the calf and one year of rest to recover and stock up fat reserves (Greene & Pershing 2004).
However, reproduction is costly and females who are not able to accumulate enough fat
because of decreased food availability are not likely to reproduce successfully (i.e. produce
offsprings). In general, a minimum level of fat reserve is required in mammals for ovulation
and successful reproduction (Frisch 1984; McEvoy & Robinson 2003). This relationship
between body fat and ovulation has also been observed in baleen whales, such as fin whales

4
(Balaenoptera physalus) where fecundity (measured as ovulation rate) was correlated to body
fat condition (Lockyer et al. 1986). Miller et al. (2011) showed showing that trends in blubber
thickness correspond to the reproductive cycle of northern right whales and that right whales
have the largest amount of body fat before the start of pregnancy.
Calving intervals of four- and five-years had been noted in a few instances, both in the
northern and southern hemisphere (Knowlton et al. 1994; Cooke & Rowntree 2003; Best 2005;
Kraus 2007), before the recent increase in the South African southern right whale population.
These instances of increased calving interval were interpreted as calving failures (Knowlton et
al. 1994, Burnell 2001). Four-year calving intervals can either result from failure to initiate
pregnancy (and therefore the females will spend an extra year resting), or abortion of the
foetus in early stages of gestation (and the female can shift immediately to resting) (Knowlton
et al. 1994). A five-year calving interval is interpreted as a loss of the foetus in the late stages
of gestation, resulting in the female resting until the next mating season (Knowlton et al.
1994). A five-year interval can also be interpreted as a death of the new-born calf, where the
female will again rest until the next mating season (i.e. three-year interval plus a two-year
interval; Knowlton et al. 1994). Two-year calving intervals of southern right whales are often
not documented, especially in cases where the calf died before the annual survey of cow-calf
pairs took place ( Burnell 2001; Marón et al. 2015).
Southern right whale migration
Southern right whales usually occur between 60° S and 20° S, spending austral winter and
spring at the low latitude breeding grounds and summer and fall at the high latitude feeding
grounds (Cummings 1985; Reeves & Kenney 2003). Mate et al. (2011) have shown that
southern right whales off the South African coast migrate to locations between 37°-45°S and
some south of 52°S, possibly associated with the Sub Tropical Convergence and Arctic Polar
Front. In the austral winter, reproducing females migrate to shallow coastal regions for
calving, with the major breeding grounds found in Argentina, Australia, South Africa, New
Zealand, Chile and Peru (Reilly et al. 2013; Galetti et al. 2014). Female southern right whales
show strong site fidelity (Best 2000, Burnell 2001; Charlton et al. 2018), causing genetic
differentiation between these four major breeding grounds (Patenaude et al. 2007;
Valenzuela et al. 2008). Southern right whales also show a clear preference for sheltered
5
shallow bays with a narrow temperature range at their breeding area (Elwen & Best 2004;
Keller et al. 2006; Pirzl 2008). In spring southern right whales start returning to their feeding
grounds in colder regions with high productivity (Tulloch et al. 2018) to stock up their fat
reserves after fasting at their breeding grounds for up to four months (Burnell 2001; Charlton
2017).
Body condition, affected by feeding success, has been shown to affect both survival and
reproductive success of northern right whales (Eubalaena glacialis) (Pettis et al. 2004). Sub-
Antarctic waters (southern right whale feeding grounds) with higher Sea Surface
Temperatures (SSTs) than normal cause a decline in krill density (Trathan et al. 2006). Such
shortage of food availability has been shown to affect blubber thickness (i.e. energy reserve)
of right whales, affecting their energy balance and reproduction (Miller et al. 2011). In line
with this, it is hypothesised that the increased calving intervals observed in the South African
population in recent years (2009-2017, Figure 1) could be caused by a decrease in body
condition and overall health.
Visual health assessments
Health is defined by Stedman (2005 p.641) as "the state of the organism when it functions
optimally without evidence of disease or abnormality". To assess the health of wildlife,
methods such as tracking population abundance, reproduction and mortality have been used
to date (Fowler & Siniff 1992). Visual health assessment methodologies are repeatable and
have been conducted for terrestrial and marine mammals (Lowman et al. 1976; Bradford et
al. 2008; Joblon et al. 2014; Morfeld et al. 2014). Body fat or body condition measurements
have been used to indicate reproductive success and survivorship in terrestrial and marine
mammals (Guinet et al. 1998; Schulte-Hostedde et al. 2001). Body condition scoring for
mammals was first developed for ewes by Jeffries (1961) using a 0 to 5 scale, where higher
scores indicate better health (i.e. fatter sheep). This method was adapted for dairy cows by
Lowman et al. (1976) and used across the globe. The visual health assessment method was
further developed by defining the condition scores using photographs and a short text
description (Earle 1976; Grainger & McGowan 1982).

6
Assessing the health of free ranging whales is difficult because of limited visibility of the entire
body (Pettis et al. 2004). However, body condition changes have been detected using aerial
photographs in gray whales (Eschrichtius robustus) (Perryman & Lynn 2002), humpback
whales (Megaptera novaeangliae) (Christiansen et al. 2016) and southern right whales (Miller
et al. 2012; Christiansen et al. 2018). A visual health assessment method for northern right
whales was established by Pettis et al. (2004) using selected physical variables from archived
photographs, showing changes in body condition of females in calving and non-calving years.
The results of Pettis et al. (2004) suggested that changes in body condition and overall health
can be detected visually from photographs and can be related to reproductive success.
Southern right whale diet and breeding success
Little is known about the diet of southern right whales, but from historic data it is suggested
that they feed mainly on krill south of the polar front and on copepods north of 50°S
(Tormosov et al. 1998). This latitudinal difference in diet can be explained by the distribution
of Antarctic krill (Euphausia superba), which occur at high latitudes between the Polar Front
and the Antarctic Shelf (Atkinson et al. 2004). Based on data from illegal Soviet whaling,
southern right whales from the South African population are historically known to feed in
three main areas of the Southern Ocean (Tormosov et al. 1998; Figure 3).

7
Figure 3: Southern right whale (Eubalaena australis) feeding grounds from the South African population. Figure from Best & Folkens (2007) and as named by Van den Berg (2018); Feeding ground A is a broad band of the south-eastern Atlantic Ocean associated with the Subtropical Convergence from Tristan da Cunha to the Cape, feeding ground B is a smaller area between40°-50°S around the Crozet Islands and feeding ground C is a diffuse area of the Southern Ocean south of 52°S (Tormosov et al, 1998).
Although data collection on krill exists (Atkinson et al. 2004), the methods used are not always
consistent (Leaper et al. 2006). Nevertheless, a relationship has been detected between krill
abundance and physical environmental factors (Murphy et al. 1998; Trathan et al. 2003). This
implies that environmental variables such as chlorophyll a concentrations or SSTs can be used
to show the relationships between food availability and reproductive success with various lag
times. A study conducted in South Georgia showed a relationship between SST anomalies and
the breeding success of land-based predators relying on krill (Forcada et al. 2005; Trathan et
al. 2006) as well as southern right whales in Argentina (Leaper et al. 2006).
A recent study in South Africa showed correlations of El Niño/Southern Oscillation (measured
through the following climate indices: Oceanic Niño Index, Antarctic Oscillation and Southern
Oscillation index), Sea Ice extent (September Antarctic sea ice extent) and chlorophyll a
concentrations, with the abundance of southern right whale cow-calf pairs sighted along the
South African coast (Van den Berg 2018). In Brazil, a positive correlation was found between
the number of southern right whale calves at the breeding grounds and prey availability at

8
their feeding grounds at a 0-year lag (Seyboth et al. 2016), suggesting that the reproductive
success of southern right whales is influenced by food availability during early months of
gestation (Seyboth et al. 2016). Additionally, an increase in calving intervals to five-years was
found to correlate with El Niño events in the Argentinean southern right whale population off
Península Valdés (Leaper et al. 2006). Increased calving intervals during the 1990s, seen in
North Atlantic right whales, have also been linked to possible food limitations (Kraus 2007).
Aims and objectives of the study
The aim of this study is to measure health condition of parous female southern right whales
based on the method described in Pettis et al. (2004) to identify variations in visual health
condition over time and assess the relationship between external health indicators and
reproductive success (measured through calving intervals). Further, the intention is to assess
the relationship between observed health and environmental variables in the Southern
Ocean.
More specifically, the objectives of this study are to:
• Conduct a qualitative visual assessment of external health condition of parous female
southern right whales using overhead photographs.
• Test the hypothesis that changes in visual health condition over time are related to
changes in reproductive success.
• Test whether there are relationships between visual health condition and
climate/biological indices representing food availability.
• Standardise the methodology for measuring visual health condition in southern right
whales to facilitate comparability of results on a global scale.
Methods
Photo Identification data
A 13-year dataset (2005-2017) of aerial overhead identification (ID) photographs of parous
female southern right whale was obtained from a 39-year long database from the Mammal
Research Institute Whale Unit, University of Pretoria (Best 1990). These photographs were
9
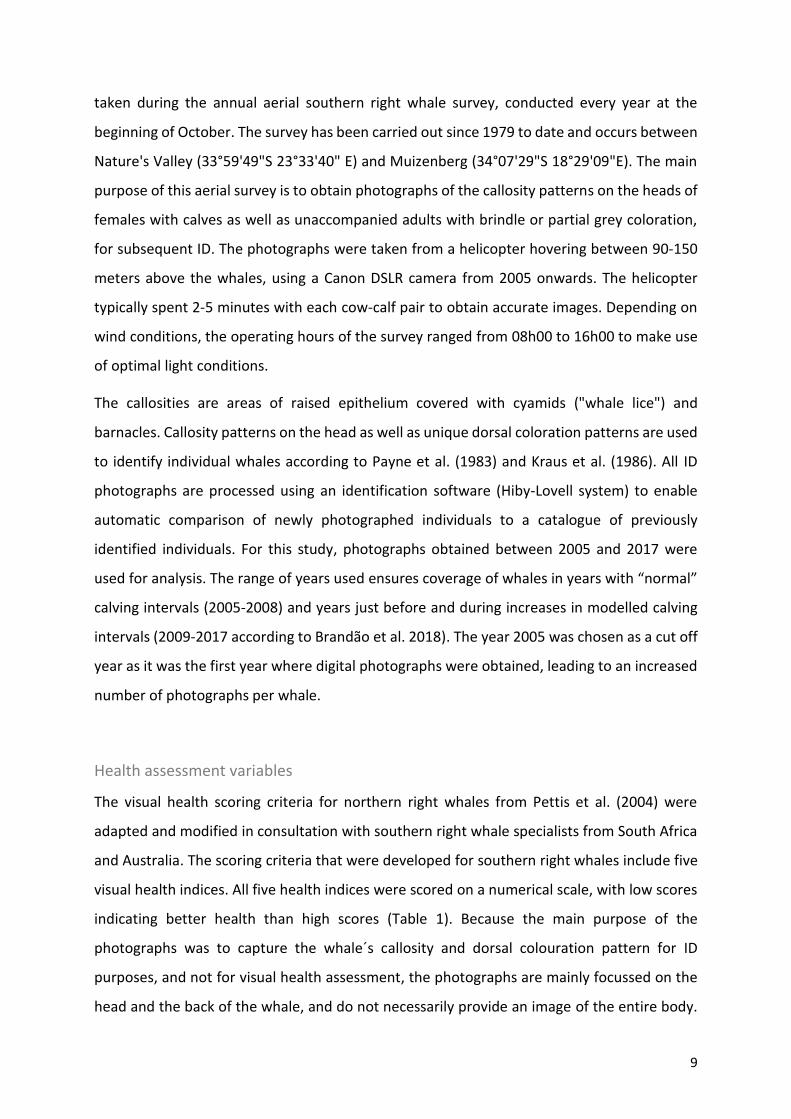
taken during the annual aerial southern right whale survey, conducted every year at the
beginning of October. The survey has been carried out since 1979 to date and occurs between
Nature's Valley (33°59'49"S 23°33'40" E) and Muizenberg (34°07'29"S 18°29'09"E). The main
purpose of this aerial survey is to obtain photographs of the callosity patterns on the heads of
females with calves as well as unaccompanied adults with brindle or partial grey coloration,
for subsequent ID. The photographs were taken from a helicopter hovering between 90-150
meters above the whales, using a Canon DSLR camera from 2005 onwards. The helicopter
typically spent 2-5 minutes with each cow-calf pair to obtain accurate images. Depending on
wind conditions, the operating hours of the survey ranged from 08h00 to 16h00 to make use
of optimal light conditions.
The callosities are areas of raised epithelium covered with cyamids ("whale lice") and
barnacles. Callosity patterns on the head as well as unique dorsal coloration patterns are used
to identify individual whales according to Payne et al. (1983) and Kraus et al. (1986). All ID
photographs are processed using an identification software (Hiby-Lovell system) to enable
automatic comparison of newly photographed individuals to a catalogue of previously
identified individuals. For this study, photographs obtained between 2005 and 2017 were
used for analysis. The range of years used ensures coverage of whales in years with “normal”
calving intervals (2005-2008) and years just before and during increases in modelled calving
intervals (2009-2017 according to Brandão et al. 2018). The year 2005 was chosen as a cut off
year as it was the first year where digital photographs were obtained, leading to an increased
number of photographs per whale.
Health assessment variables
The visual health scoring criteria for northern right whales from Pettis et al. (2004) were
adapted and modified in consultation with southern right whale specialists from South Africa
and Australia. The scoring criteria that were developed for southern right whales include five
visual health indices. All five health indices were scored on a numerical scale, with low scores
indicating better health than high scores (Table 1). Because the main purpose of the
photographs was to capture the whale´s callosity and dorsal colouration pattern for ID
purposes, and not for visual health assessment, the photographs are mainly focussed on the
head and the back of the whale, and do not necessarily provide an image of the entire body.

10
For this reason, a quantitative body assessment was not carried out in this study. Photographs
for the visual health assessment were further evaluated on the percentage of whales' body
length seen above water (guided by figure 2 of Christiansen et al. 2018).
1. Body condition – qualitative
The score for body condition was based on the estimation of the relative amount of
subcutaneous fat (Pettis et al. 2004). This was done by examining the prominence of
accumulated fat in the neck area ("neck roll") posterior to the blowholes, as described
by Rowntree (1999). The same area was evaluated during body condition scoring for
delphinids (Joblon et al. 2014). The score is based on dorsal convexity or concavity just
posterior to the blowholes. When viewed laterally, right whales in good conditions
have a flat or slightly rounded convex shape or fat roll posterior to the blowholes.
Whales considered to be in poor body condition show concavity in the same area
posterior to the blowholes. Right whales in extremely poor condition can have
"humps" posterior to the blowholes and even show a dip behind this hump (Pettis et
al. 2004). The visual assessment of body fat condition was scored on a scale of 0-1,
with scores falling into one of the following four categories (Table 1): "excellent"
"good", "medium" and "poor" (C. Charlton unpublished data; Figure 4). The “excellent”
body condition is an additional score (not used by Pettis et al. 2004) and is assigned to
whales whose area posterior to the blowholes showed severe convexity and no
differentiation of the neck roll (C. Charlton unpublished data).

11
Figure 4: Body condition scores for southern right whales (Eubalaena australis) using overhead photographs
and based on the prominence of the fat roll posterior to the blowholes: a) 'excellent', showing no
differentiation in the fat roll, b) 'good', showing a flat area behind the blowholes, c) 'medium', showing a slight
concavity, and d) 'poor', body condition showing concavity or a dip posterior to the blowholes.
12
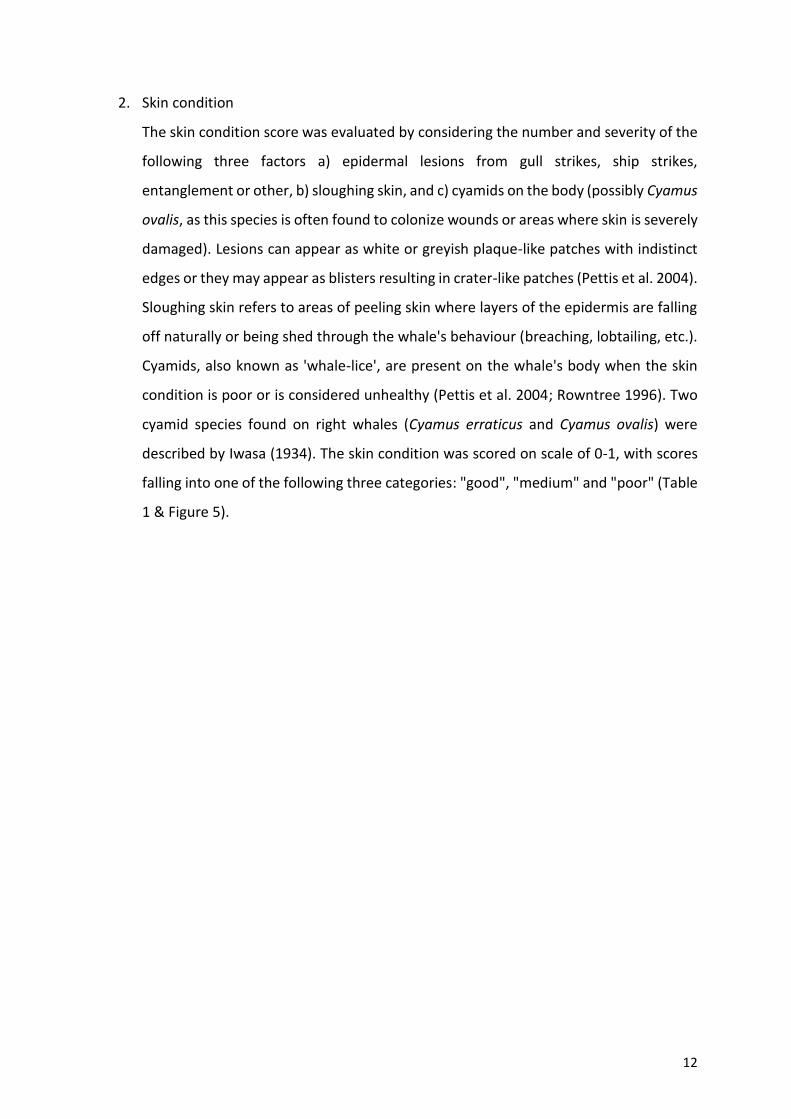
2. Skin condition
The skin condition score was evaluated by considering the number and severity of the
following three factors a) epidermal lesions from gull strikes, ship strikes,
entanglement or other, b) sloughing skin, and c) cyamids on the body (possibly Cyamus
ovalis, as this species is often found to colonize wounds or areas where skin is severely
damaged). Lesions can appear as white or greyish plaque-like patches with indistinct
edges or they may appear as blisters resulting in crater-like patches (Pettis et al. 2004).
Sloughing skin refers to areas of peeling skin where layers of the epidermis are falling
off naturally or being shed through the whale's behaviour (breaching, lobtailing, etc.).
Cyamids, also known as 'whale-lice', are present on the whale's body when the skin
condition is poor or is considered unhealthy (Pettis et al. 2004; Rowntree 1996). Two
cyamid species found on right whales (Cyamus erraticus and Cyamus ovalis) were
described by Iwasa (1934). The skin condition was scored on scale of 0-1, with scores
falling into one of the following three categories: "good", "medium" and "poor" (Table
1 & Figure 5).

13
Figure 5: Skin condition scores of southern right whales (Eubalaena australis) based on presence and severity of
lesions, skin sloughing and cyamid coverage on the whale's body: a) 'good', showing black skin with no lesions,
sloughing or cyamids, b) 'medium', showing some lesions, sloughing or cyamids, and c) 'poor', showing severe
lesions, sloughing or cyamids.

14
3. Cyamids around blowholes
The incidence of cyamids around the blowholes was evaluated on a two-point scale for
presence and number of cyamids. Whale-lice are known to occur around the blowhole
region of cetaceans when the whale is injured or affected by other stressors like
entanglement (Osmond and Kaufman 1998). Cyamids around blowholes were scored
on scale of 0-1, with scores falling into one of the following two categories: "absent"
or "present" (Table 1 & Figure 6).
Figure 6: Scores for cyamids around the blowholes of southern right whales (Eubalaena australis) based on
incidence, number and size of patches. a) 'absent', with no or few cyamids around the blowholes and b) 'present',
with cyamids around the blowholes
4. Rake marks
The definition of rake marks in this study is not consistent with that of Pettis et al.
(2004), which defines rake marks as parallel lines in the skin occurring only anterior to
the blowholes of the whale and often seen on whales chronically entangled. However,
in this study rake marks are predatory in origin, as described by George et al. (1994),
representing bites or tooth rake marks. The visual assessment was based on presence-

15
absence, number, brightness, depth of the rake marks and area affected. Rake marks
were scored on scale of 0-1, with scores falling into one of the following three
categories: "good", "medium" and "poor" (Table 1 & Figure 7).
Figure 7: Rake mark scores of predatory origin in southern right whales (Eubalaena australis) based on presence-
absence, number, brightness, depth and area around blowholes. a) 'good' condition, no rake marks are visible,
b) 'medium', a few rake or bite marks are visible, and c) 'poor' many rake marks are present.
16
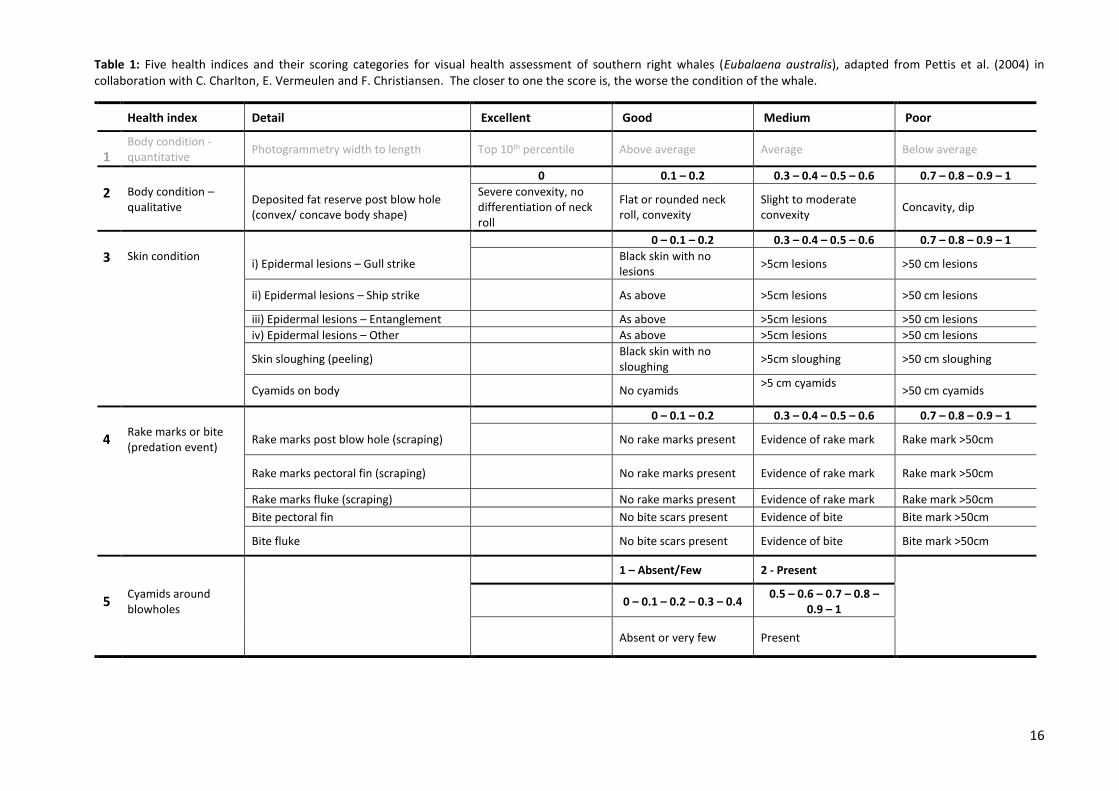
Table 1: Five health indices and their scoring categories for visual health assessment of southern right whales (Eubalaena australis), adapted from Pettis et al. (2004) in collaboration with C. Charlton, E. Vermeulen and F. Christiansen. The closer to one the score is, the worse the condition of the whale.
Health index Detail Excellent Good Medium Poor
1 Body condition - quantitative
Photogrammetry width to length Top 10th percentile Above average Average Below average
0 0.1 – 0.2 0.3 – 0.4 – 0.5 – 0.6 0.7 – 0.8 – 0.9 – 1
2 Body condition – qualitative
Deposited fat reserve post blow hole (convex/ concave body shape)
Severe convexity, no differentiation of neck roll
Flat or rounded neck roll, convexity
Slight to moderate convexity
Concavity, dip
0 – 0.1 – 0.2 0.3 – 0.4 – 0.5 – 0.6 0.7 – 0.8 – 0.9 – 1
3 Skin condition i) Epidermal lesions – Gull strike
Black skin with no lesions
>5cm lesions >50 cm lesions
ii) Epidermal lesions – Ship strike As above >5cm lesions >50 cm lesions
iii) Epidermal lesions – Entanglement As above >5cm lesions >50 cm lesions
iv) Epidermal lesions – Other As above >5cm lesions >50 cm lesions
Skin sloughing (peeling)
Black skin with no sloughing
>5cm sloughing >50 cm sloughing
Cyamids on body No cyamids
>5 cm cyamids
>50 cm cyamids
0 – 0.1 – 0.2 0.3 – 0.4 – 0.5 – 0.6 0.7 – 0.8 – 0.9 – 1
4 Rake marks or bite (predation event)
Rake marks post blow hole (scraping) No rake marks present Evidence of rake mark Rake mark >50cm
Rake marks pectoral fin (scraping) No rake marks present Evidence of rake mark Rake mark >50cm
Rake marks fluke (scraping) No rake marks present Evidence of rake mark Rake mark >50cm
Bite pectoral fin No bite scars present Evidence of bite Bite mark >50cm
Bite fluke No bite scars present Evidence of bite Bite mark >50cm
1 – Absent/Few 2 - Present
5 Cyamids around blowholes
0 – 0.1 – 0.2 – 0.3 – 0.4 0.5 – 0.6 – 0.7 – 0.8 –
0.9 – 1
Absent or very few Present

17
Scoring and consistency analysis
For this study, 61,913 digital images were examined of 1,450 uniquely identified female
southern right whales from 2005 to 2017. The year 2005 was chosen as the cut-off year due
to the introduction of digital photography; females photographed before 2005 were ignored
even if they were sighted during the study period. Photographs in which the female is clearly
visible were used to score the four health variables. If a reliable score could not be assigned,
because of bad image quality or low percentage of body visibility, “not applicable” was
assigned and that particular sighting of the female was removed from the data set. To evaluate
the quality of the photographs, the image quality and the visibility of the water was assessed
for all photographs (combined) available for a female in a given year (Table 2).
Table 2: Scores (1-3) assigned to quality of photographs and visibility of the water used in visual health
assessment of southern right whales (Eubalaena australis).
Based on the four health assessment variables, a Total Score (TS) of external body condition
was calculated for each female, using weighted values of the different health variables: 45%
for body condition, 27.5% for skin condition, 17.5% for cyamids around blowholes and 10%
for rake marks. This weighting differs from the average weighing used in the study by Pettis et
al. (2004). The weighting was subjective but based on prior knowledge from the literature.
Subcutaneous fat was identified as the most important contributor to TS and is based on the
findings from Miller et al. (2011) showing that trends in blubber thickness correspond to the
reproductive cycle of northern right whales. Therefore, body condition was given the most
weight calculating TS. Skin condition was considered a slightly less important indicator of
health, as sloughing skin (partially or full) can be periodic and a natural way to replace old skin
(Reeb et al. 2007), or can be caused by the whales' behaviour (Fortune et al. 2017). Cyamids
Scores
Image quality 1 2 3
Sharp photographs the
features to be scored
clearly visible
Some pictures were blurry
and the 'to be scored
features' partially visible
Most/all photographs were
of bad quality and blurry
and the features were
difficult or not visible
Visibility of water
1 2 3
Water was clear and features (e.g. sloughing skin, injuries) could be seen through the water
Water was slightly murky and the 'to be scored features' were not clearly visible
Water was murky and impossible to see anything of the 'to be scored features' or the whale

18
around the blowholes are known to indicate stress or bad health (Knowlton and Kraus 2001)
but might not necessarily affect the accumulation of subcutaneous fat. Therefore, it was
assumed that this factor made only a small contribution to the whale's reproductive ability
and the contribution of this variable was weighted less than 20%. Lastly, rake marks (predatory
of origin, as defined in this study) were given the least importance, because although they can
affect reproduction, they do not necessarily affect long-term feeding behaviour to restore fat
reserves.
In addition to the subjective weighting, a principal component analysis (PCA) was conducted
to visualize the relation among principal components of the four health score variables. Should
PC 1 explain most of the variability in the data, the results would be used to create an
alternative total score. The mean TSs for each year were compared using an ANOVA to detect
whether there was a difference in health between the various years during the study period.
To check for consistency in scoring, a randomised controlled trial (double-blind approach) was
carried out. Two experienced southern right whale researchers additionally scored the four
health variables of 10 females randomly selected using a routine in R (Core version 3.5.1;
RStudio Team 2018) from the data set of photographs from 2005 to 2017. Inter-researcher
consistency among all three researchers for the four health score variables was compared
using Fleiss' Kappa test for agreement (Conger 1980; Fleiss 1971; Fleiss et al. 2003).
Parity
Parity is the state of a female in relation to having given birth to a viable offspring. It is known
to affect the body condition scores in other mammals; multiparous (i.e. have given birth to
more than one offspring over time) females have better body condition than primiparous (i.e.
have given birth to an offspring for the first time) females, as these latter females still invest
some energy towards the growing process (Gallo et al. 1996). Females scored in a certain year
that were seen before with a calf were assumed to be multiparous whereas females seen for
the first time with a calf were assumed to be primiparous. The weighted total health score of
primiparous and multiparous females over the study period was compared using a t-test.

19
Statistical analysis of health assessment scores in relation to environmental indicators
and reproductive success
Generalized additive models (GAMs) were used to test if the health scores of female southern
right whales can be explained by climatic and biological indicators. Four climate indices were
used to represent the state of the ecosystem: Oceanic Niño Index (ONI), Antarctic Oscillation
(AAO), Southern Oscillation Index (SOI) and September Antarctic sea ice extent (SASIE). The El
Niño/Southern Oscillation indices were obtained from Van den Berg (2018) Table 1 (Appendix
1) as suggested by the NOAA Climate Predictor Centre database
(http://www.cpc.ncep.noaa.gov/). SASIE values were derived from Van den Berg (2018) Table
1 as suggested by the National Snow & Ice Data Centre (https://nsidc.org/data/seaice_index/).
In addition, mean January chlorophyll a concentrations (mg/𝑚 3) over one year were obtained
from Van den Berg's (2018) Table 1 (through https://www.oceancolour.org/) for the three
known feeding grounds (Figure 2).
To test whether individual health scores can be used as a predictor of reproductive success,
measured through the length of the calving interval, the health scores were related to each
female´s calving interval using GAMs. First, the health scores were compared to the previous
calving interval (i.e. years between current and previous calf). Additionally, the health scores
were compared to the next calving interval (i.e. years between the current calf and next calf).
Changes in health scores over the course of the study period were investigated to identify if
the health scoring assessment can detect a change in calving interval using a Kruskal Wallis
test. All statistical analyses were carried out in R Core version 3.5.1 (RStudio Team, 2018). For
analyses and visualisation, the following packages in R Core v 3.5.1 were used: 'nlme' version
3.1-137 (Pinheiro et al. 2018), 'mgcv' version 1.8-26 (Wood et al. 2016), 'ggplot2' version 3.1.0
(Wickham, 2016) and 'irr' version 0.84 (Gamer et al. 2012), 'stats' version 3.6.0 (Miller, 1981;
Yandell, 1997).
Results
Parameter scoring
In total, 41,215 photographs out of a total of 61,913 were utilized for the visual health
assessment based on the visibility of the whale's body in the photograph (i.e. whale breaking
the surface). These images resembled 1,450 uniquely identified females over various sightings
or 2,674 non-unique females (i.e. representing the number of encounters that were available
20
for health assessment). After evaluation of the different health variables, 118 non-unique
females were excluded from further analyses due to missing values (NAs) in any of the four
health variables. This selection procedure lead to 40,438 images of 2,556 non-unique females
(1,777 multiparous females and 779 primiparous females) used for further analyses. The body
condition and cyamids around blowholes (especially when closed) were particularly difficult
to observe in aerial photographs. This resulted in NA's being assigned to body condition (n =
66) and cyamids around blowholes (n = 73) more often than rake marks (n = 9) and skin
condition (n = 5).
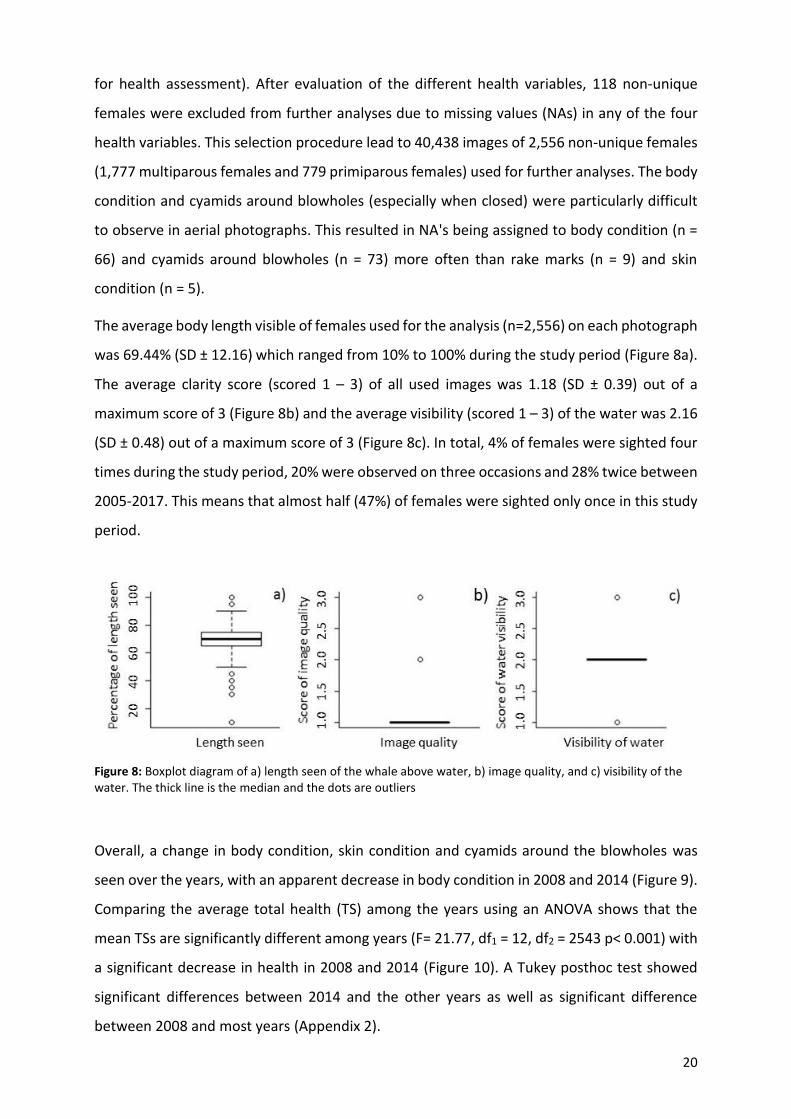
The average body length visible of females used for the analysis (n=2,556) on each photograph
was 69.44% (SD ± 12.16) which ranged from 10% to 100% during the study period (Figure 8a).
The average clarity score (scored 1 – 3) of all used images was 1.18 (SD ± 0.39) out of a
maximum score of 3 (Figure 8b) and the average visibility (scored 1 – 3) of the water was 2.16
(SD ± 0.48) out of a maximum score of 3 (Figure 8c). In total, 4% of females were sighted four
times during the study period, 20% were observed on three occasions and 28% twice between
2005-2017. This means that almost half (47%) of females were sighted only once in this study
period.
Figure 8: Boxplot diagram of a) length seen of the whale above water, b) image quality, and c) visibility of the water. The thick line is the median and the dots are outliers
Overall, a change in body condition, skin condition and cyamids around the blowholes was
seen over the years, with an apparent decrease in body condition in 2008 and 2014 (Figure 9).
Comparing the average total health (TS) among the years using an ANOVA shows that the
mean TSs are significantly different among years (F= 21.77, df1 = 12, df2 = 2543 p< 0.001) with
a significant decrease in health in 2008 and 2014 (Figure 10). A Tukey posthoc test showed
significant differences between 2014 and the other years as well as significant difference
between 2008 and most years (Appendix 2).

21
Figure 9: Scatter plot showing health condition variables for parous female southern right whales (Eubalaena australis) over the study a) Body condition evaluated from 2005-2017, b) skin condition evaluated from 2005-2017. c) incidence of cyamids around blowholes evaluated from 2005-2017, and d) presence of rake marks evaluated from 2005-2017. Red line indicates smooth regression line (formula = y ~ s (x, bs = "ps") with standard error displayed in grey.

22
Figure 10: Mean total health scores (± SE) for parous female southern right whales (Eubalaena australis), indicating decreased health (i.e. increased score) in 2008 and 2014. The letters a, b, c, d above the line indicate which statistical population(s) the years fall into and are a result of the Tukey posthoc test.
The PCA on the four health score variables of parous females showed that principal
component one (PC 1) accounted for 46.2 %, principal component two (PC 2) for 38.8% and
collectively describe 85 % of the variability in the data, whereas principal components three
(PC 3) and four (PC 4) explained only 7.9 % and 7.1 % respectively. Body condition, skin
condition and cyamids around the blowholes are equally contributing to PC 1 and only rake
marks are not well covered (Table 3). Additionally, it was revealed that the total health score
is similar to the results of the PCA analysis showing that rake marks are essentially excluded
from PC 1. The mean PC 1 scores averaged across the study period show similar trends of
decreased health in 2008 and 2014 (Figure 11). However, as PC 1 could only explain less than
50% of the variability in the data, no alternative score was created.
Table 3: Contribution of the four health score variables to principal components.
Contribution Dim.1 (PC 1) Dim.2 (PC 2) Dim.3 (PC 3) Dim.4 (PC 3)
Body condition 27.69 6.05 65.48 0.78
Skin condition 36.31 3.82 14.27 45.60
Cyamids around blowholes 34.95 6.79 14.25 44.00
Rake marks 1.04 83.33 6.00 9.62

23
Figure 11: Mean PC 1 score (± SE) for parous female southern right whales (Eubalaena australis), indicating
decreased health (i.e. increased score) in 2008 and 2014.
The results of Fleiss' Kappa test, which compared agreement among the scores assigned by
three researchers for all four health scores of 10 individuals (Kw = 0.57, z = 10.60, p <0.001),
suggested moderate agreement (Landis & Koch,1977). Comparing the different health score
variables among the researchers, there is poor agreement for body condition (Kw = -0.195, z =
-1.26, p= 0.208) and skin condition (Kw = -0.027, z = -0.20, p = 0. 842) but 100% agreement for
cyamids around the blowholes and rake marks (Kw = 0/0, z = 0/0, p = 0/0).
Parity
Comparison of parity using the TS displayed no significant difference between primiparous
and multiparous female southern right whales over the study period (t= 0.086, df= 1431.2, p=
0.932). Therefore, further analyses were conducted using both primiparous and multiparous
females combined.
Analysis of health assessment scores in relation to environmental indicators and
reproductive success
Results of the GAM relating TS to environmental indicators showed that ONI, SOI, AAO, SASIE,
'year' and chlorophyll a in feeding ground A (Appendix 3) were significantly related to total
health of reproducing female southern right whales with a 0-year lag (Table 4). Additionally, a
GAM was run with body condition, skin condition, cyamids around blowholes and rake marks

24
as separate response variables. Results indicated a link between the various health indicators
(Appendix 4).
Table 4: Results of the generalized additive model relating TS to year and data for various climate and biological
indices potentially influencing the health score of female southern right whales (Eubalaena australis) off the
South African coast. Significant values are displayed in bold. * p < 0.05, ** p < 0.01 and *** p< 0.001.
Response variable
Explanatory variable
edf (empirical
distribution function)
R-sq. (adj)
Deviance expl.
p-value
TS ONI (Oceanic Niño Index) 2.269
0.089 9.31%
0.011 *
AAO (Antarctic Oscillation) 1.000 0.016 *
SOI (Southern Oscillation Index) 2.166 < 0.001 ***
SASIE (Sept. Antarctic sea ice extent) 1.003 < 0.001 ***
Year 1.000 < 0.001 ***
Chlorophyll a (feeding ground A) 1.000 < 0.001 ***
Chlorophyll a (feeding ground B) 1.000 0.435
Chlorophyll a (feeding ground C) 1.000 0.860 .
Comparing the four health score variables to previous calving intervals (excluding primiparous
females), only rake marks and year had a significant effect (Table 5). Median calving intervals
increased with a decreased health (i.e. increased score for body condition, cyamids around
blowholes & rake marks; Figure 12) but the results were not significant (Table 6). Comparing
the four health score variables to next calving event (including primiparous and multiparous
females but excluding 1,424 non-unique females which had no next calving interval within the
study period) showed no significant influence, except for rake marks (Table 5). Similar to the
results in Figure 12, there was some variability in calving intervals across scores for the
different health variables, but the results were not statistically significant (Figure 13 & Table
6).

25
Table 5: Results of the generalized additive model comparing calving intervals to the four health score parameters. Significant-values are displayed in bold. * p < 0.05, ** p < 0.01 and *** p < 0.001.
Response variable
Explanatory variable edf R-sq. (adj)
Deviance expl.
p-value
Previous calving interval
Body condition 1.00
0.07 7.07%
0.923
Skin condition 1.01 0.506
Cyamids around blowholes 2.74 0.476
Rake marks 2.38 < 0.001 ***
Year 1.00 < 0.001 ***
Next calving interval
Body condition 1.00
0.01 1.65%
0.624
Skin condition 1.34 0.726
Cyamids around blowholes 1.00 0.214
Rake marks 1.00 < 0.001 ***
Year 1.00 0.400
Table 6: Results of Kruskal-Wallis tests comparing calving intervals among scores for four health score variables.
Calving interval Health score parameter χ2 df p-value
Previous Body condition 13.81 10 0.182
Skin condition 7.49 10 0.678
Cyamids around blowholes 3.21 6 0.783
Rake marks 13.59 10 0.193
Next Body condition 6.34 10 0.786
Skin condition 8.68 9 0.467
Cyamids around blowholes 8.75 6 0.188
Rake marks 12.5 8 0.130

26
Figure 12: The calving interval from previous calf in relation to health scores for parous female southern right
whales (Eubalaena australis). The boxes indicate interquartile ranges, the thick line is the median and the dots
are outliers a) Body condition b) Skin condition c) Cyamids around blowholes d) Rake marks.

27
Figure 13: The calving interval to next calf in relation to health scores for parous female southern right whales
(Eubalaena australis). The boxes indicate interquartile ranges, the thick line is the median and the dots are
outliers a) Body condition b) Skin condition c) Cyamids around blowholes d) Rake marks.

28
Discussion
Health variables
Although images for this study were obtained from a 39-year database, only those collected
from 2005 onwards were used due to the introduction of digitalised photography, which
provided better image quality for the assessment. Conducting a visual health assessment using
overhead photographs is more subjective than a semi-quantitative measurement, but the use
of a 12-year dataset of overhead photographs provides a much larger dataset and allows for
retrospective analyses. The analysed photographs were initially taken for ID purposes, but this
study showed that they also can be used for a visual health assessment. Results of this study
clearly indicated annual fluctuations of visual health of parous female southern right whales
during their stay at breeding grounds off the southern Cape coast. More specifically, a
significant reduction in health could be detected in 2008 and 2014. Using weighted scores in
this study differ from the average score used in the study by Pettis et al. and make a
comparison of the health between southern- and northern right whales difficult. However,
the subjective weighting of the total score has been supported by the PCA results, indicating
that rake marks are the least important contributor to indicate health of female southern right
whales.
Results of this study further showed that there was no significant difference in visual health
of multiparous and primiparous females. This suggests that both multiparous and primiparous
females are influenced by the same phenomena (possibly food shortage in their feeding
grounds) causing a similar decrease in health. Additionally, it may suggest that multiparous
females evaluated in the study are not in ideal breeding condition and therefore do not show
a significant difference to primiparous females, as it is known through other studies that
primiparous mammals still invest energy and nutrients towards growing (Gallo et al. 1996).
Comparison of inter-rater reliability between the researchers showed overall moderate
agreement (Landis & Koch,1977). While there was 100% agreement for cyamids around
blowholes and rake marks, there was reduced agreement on body condition and skin
condition scores, which is concerning because the condition scores have high weightings in
calculating the total health score. This difference could arguably be a result of the different
experience of each researcher in scoring, or the difficulty of seeing body condition in some
overhead photographs. At the same time, only a small sample size was used for the inter-rater
reliability test, which might affect the overall result. The guidelines for Fleiss' Kw scale are not
29
commonly accepted and may be more harmful than useful (Gwet 2010) when interpreting the
inter-rater reliability results. However, the use of archived data increases the effectiveness of
this method for retrospective analysis. Pettis et al. (2004) has shown sufficient objectivity of
visual health assessment method conducted on northern right whales. Comparing results to
other studies, care is still required to account for the difference in scoring. However, when
using the method within the same study (health assessment conducted by one researcher) it
is a consistent method to detect changes of health among individuals and years.
Health assessment in relation to environmental indicators and reproductive success
Results also showed that visible health of parous female southern right whales was related to
climatic variables on a 0-year lag. This confirms the findings of Van den Berg (2018) who
revealed that the abundance of southern right whales in South Africa is correlated with ocean
productivity and Southern Ocean climate conditions at different lag times. More specifically,
Van den Berg (2018) indicated that strong El Niño conditions in 2015-2016 seemed to be
correlated with the decrease in sightings of cow-calf pairs off the South African coast with a
0-year lag. Relations between global climate indices and whale breeding success were also
found by Leaper et al. (2006) at Península Valdés, Argentina. However, the relationship of
visual health and climatic index SASIE needs to be interpreted carefully at a 0-year lag, as SASIE
is measured in September when the female southern right whales are at their breeding
grounds. Therefore, SASIE will affect food availability for the next feeding season only.
However, previous studies have shown that krill density is linked to sea ice extent (Loeb et al.
1997; Atkinson et al. 2004), which affects food availability and therefore southern right whale
breeding success (Leaper et al. 2006). Therefore, further analysis of the link between SASIE
and visual health condition, at various time lags, should be considered for future research.
Additionally, chlorophyll a concentrations in feeding ground A (as named by Van den Berg,
2018) were found to have a significant negative relation with visual health of parous female
southern right whales. This suggests that only one feeding ground would immediately affect
females' visual health and ultimately reproductive success. This is in accordance with the
findings of Van den Berg (2018) who indicated positive correlations at a 2-year time lag
between chlorophyll a concentrations at feeding ground A and abundance of southern right
whale calves off the southern Cape coast. Although no other feeding ground seemed to
immediately affect visual health of female southern right whales, Van den Berg (2018) did find

30
correlations between calf abundance and chlorophyll a concentrations in feeding ground C at
two different time-lags. However, correlations between climate indices and visual health
conditions on various time-lags could not be investigated in this study and need further
examination.
The study by Seyboth et al. (2016) also showed that the reproduction of southern right whales
is directly influenced by food availability. Right whale feeding success is complex and
influenced by several biological and environmental processes (Hilsta et al. 2009) and therefore
should not be simplified by ignoring potential lagged effects and misinterpreted. Relations of
climate indices and health of female southern right whales were compared with a 0-year lag
in this study. However, the mean chlorophyll a concentrations were measured in January and
reflect a 10-month lag, as the assessed whales were photographed during the annual aerial
survey conducted in October. This 10-month lag therefore could influence health condition
seen at the breeding grounds when parous females calve. The decreased visual health in 2008
and 2014 can be assumed to be a result of poor food availability in the feeding season during
pregnancy. Successful reproduction (ovulation, sustaining pregnancy, etc.) requires a
minimum body condition, which is attained through fat storage over several consecutive years
(Seyboth et al. 2016), suggesting that not only the year of pregnancy is linked to visible bad
health condition. Therefore, further investigation of relationships between visual health and
chlorophyll a concentrations (at the three feeding grounds) at different time-lags is needed to
fully understand the links between food availability and visual health condition in parous
female southern right whales.
Relating females' visual health variables to previous calving interval indicated only level of rake
marks as a predictor. Similar results were found when relating visual health variables to the
next calving intervals. However, the number of rake marks observed was very low in this study.
In fact, rake marks have the lowest contribution to explain the health of female southern right
whales as suggested by the PCA results.
The visual health assessment did not show a relationship between the visual health condition
of parous female southern right whales and calving intervals. However, this could be because
all females assessed were in a good enough condition to breed (i.e. females who were not
able to breed were not photographed and therefore not assessed in this study). The lack of a
clear relationship between health condition and calving intervals could also be caused by a
small number of females which calved post-2014 (when visual health condition significantly

31
decreased and four- and five-year calving intervals peaked), leading to a much smaller sample
size for analysis of health in relation to next calving interval. Nevertheless, in 2008 the visual
health of the female right whales was observed to decrease (i.e. increased health score) and
afterwards calving intervals have started to increase, indicating that females take an extra
year of rest after visually bad health and only manage to breed in subsequent years. Similar
trends occurred in 2014, when visual health of females decreased (i.e. increased health score)
and the frequency of four- and five-year calving intervals increased. Further analyses are
required in a few years’ time, when more data on calving intervals post-2014 will be available,
as body condition in northern right whales is positively correlated to calving intervals,
suggesting recovery of subcutaneous fat reserve during the time between calves (Miller et al.
2011). However, this study supports the hypothesis formulated by Van den Berg (2018) that
continuous years of low food availability may have had accumulating effects on the female
southern right whales' health (at least for the period of 2011-2014, when health reached a
minimum), affecting their reproductive success and associated demographics.
Relevance of the study
Understanding the relationship of health condition of parous female southern right whales
and how it relates back to reproductive success and climate is important to predict population
trends and the resilience of the species to a fast-changing environment. Body condition is
tightly connected to reproductive success in right whales (Miller et al. 2011; Leaper et al. 2006)
and other marine mammals (Atkinson & Ramsey 1995). Therefore, in addition to calf
reproduction, understanding variations in health and body condition of parous females in
relation to the state of the environment can be useful for making informed management
decisions. The southern right whale´s three-year breeding cycle consists of one year of
gestation, one year for nursing and another year to rest and recover (Greene & Pershing 2004).
If a female southern right whale is not able to stock up on subcutaneous fat in her year of rest,
she is likely to not reproduce successfully. However, females might still reproduce if the fat
storage is not fully saturated. This would be seen visually and potentially leads to poor overall
health and can be detected through visual assessments. Pettis et al. (2004) have demonstrated
that a visual health assessment is a viable tool that can be applied to right whales using
photographs, showing differences in body condition of reproducing and resting females. While
studies have examined marine mammal reproductive success by analysing reproductive

32
output in relation to effects of climate and food availability (Lockyer 1986; Leaper et al. 2006;
Miller et al. 2011; Seyboth et al 2016; Van den Berg, 2018), this study related attempted to
use visual measures visual measures of health condition and link these to reproductive success
and climatic indices. Although the results are not conclusive, there are indications that there
might be links between health condition and reproductive success of female southern right
whales.
Limitations of the study
The visual health assessment analyses were limited by several factors, including the
photograph quality and angle. The study relied on visibility of the animal in the photographs
(i.e. above water). Photographs of bad quality and visibility were unsuitable for the visual
assessment and resulted in exclusion from the analyses or NAs being assigned. Due to the
nature of the photographs and their collection, a quantitative analysis (i.e. photogrammetry)
of the southern right whale females could not be conducted for the South African population.
Additionally, the prominence of accumulated fat in the neck area is not always clearly visible
from aerial photographs. Also, this study did not account for the females' stage of lactation
when photographed during the annual survey, assuming that all births occurred at a similar
time. Miller et al. (2011) showed a decrease in blubber thickness between the second and
fourth month of lactation for southern right whale females, showing a seasonal change of
body condition in lactating females. Another study by Miller et al. (2012) showed that lactating
females became thinner between the sampling at the beginning of the calving season and at
the end. Further, the study is limited by only showing association, but no causation of the
increased calving interval. It is also important to mention that this study focuses on breeding
females and does not assess the entire population.
Implications and future research
Decreasing health of female southern right whales along the South African coast will impact
demographics and decrease sightings along the Southern Cape coast further. Marón et al
(2015) showed that an increase in calving interval will lead to a decrease of population growth.
Therefore, a decreased health of parous female southern right whales could lead to a further
decrease in sightings, especially of cow-calf pairs. A notable decrease in unaccompanied adults
has also been detected since 2009 (Findlay et al. 2016). This decreased presence of southern
33
right whales at their breeding ground may not only have biological implications for the species,
but also economic impacts for South Africa as a nation. South Africa is a world-famous
destination for boat- and land-based whale watching, especially the Western Cape Province
(O'Connor et al. 2009). Boat-based whale-watching relies entirely on unaccompanied
southern right whales during the austral winter months, due to the regulations of this activity
(it is prohibited to approach cow-calf pairs). On the other hand, land-based whale watching is
almost exclusively focused on southern right whale cow-calf pairs (O'Connor et al. 2009),
which prefer the nearshore areas and are easy to spot from land along the Western Cape
coast. Therefore, the decreased presence of this species along the South African coast can
severely impact this multimillion-dollar industry.
The results presented in this study could only be obtained due to the long-term nature of the
utilised data series. It is clear that long term-datasets are important to find relations between
baleen whale health and associated demographics as well as climate changes. Therefore, the
continuation of the southern right whale monitoring program is of vital importance in times
of environmental change. Also, a global standardization of the methodology is recommended
to allow better comparison of data between breeding grounds. Additionally, the relationships
between health and climatic and biological indicators of food availability need further and
more detailed assessment.
Conclusion
A visual health assessment on parous female southern right whales was conducted using a 13-
year dataset of overhead photographs. Results showed significant temporal changes of visual
health within the study period. Although no direct links could be detected with increased
calving intervals, results indicate a relationship with Southern Ocean environmental indices.
The negative relationship with chlorophyll a concentrations at feeding ground A suggests that
this might be the primary feeding ground utilized by pregnant females, but the links between
food availability and climate indices are complex and need further investigations. The
standardization of methodology with Australian and South African researchers allows
comparison of results on a global scale. Nonetheless, it is suggested that the survey methods
across populations also should be standardized to ensure even better comparison (including
the quantitative assessment of the South African population). Further, a reassessment in a

34
few years' time is highly recommended, once more data are available of calving intervals post-
2014, to fully understand the links between health and reproductive success of southern right
whales from the South African population.

35
References
Atkinson SN, Ramsay MA. 1995. The effects of prolonged fasting of the body composition and reproductive success of female polar bears (Ursus maritimus). Functional Ecology 9: 559-567.
Atkinson A, Siegel V, Pakhomov E, Rothery P. 2004 Long-term decline in krill stock and increase in salps within the Southern Ocean. Nature 432: 100-103.
Best PB. 2000. Coastal distribution, movements and site fidelity of right whales (Eubalaena australis) off South Africa, 1969–1998. South African Journal of Marine Science 22: 43-55.
Best PB. 1990. Natural markings and their use in determining calving intervals in right whales off South Africa. South African Journal of Zoology 25: 114-23
Best PB. 2005. Trends in the southern right whale population wintering in South African waters, 1971-2003. Journal of Cetacean Research and Management. IWC document SC/56/SH5.
Best PB, Folkens PA. 2007. Whales and dolphins of the southern African subregion. Cambridge University Press, Cambridge.
Baker CS, Clapham PJ. 2004. Modelling the past and future of whales and whaling. Trends in Ecology and Evolution 19: 365-371.
Bradford AL, Weller DW, Ivashchenko YV, Burdin AM, Brownell Jr RL. 2008. Seasonal and annual variation in body condition of western gray whales off northeastern Sakhalin Island, Russia. Publications, Agencies and Staff of the U.S. Department of Commerce 129.
Brandão A, Best PB, Butterworth D. 2011. Monitoring the recovery of the southern right whale in South African waters. IWC document SC/S11/RW18.
Brandão A, Vermeulen E, Ross-Gillespie A, Findlay K, Butterworth DS. 2018. Updated application of a photo-identification based assessment model to southern right whales in South African waters, focussing on inferences to be drawn from a series of appreciably lower counts of calving females over 2015 to 2017. Unpublished report (SC/67B/SH/22) presented to the 67Bth IWC scientific committee (Southern Hemisphere Subcommittee), Bled, Slovenia 2018.
Burnell SR. 2001. Aspects of the reproductive biology, movements and site fidelity of right whales off Australia, Journal of Cetacean Research and Management (Special Issue) 2: 89–102.
Charlton CM. 2017. Population demographics of Southern Right Whales (Eubalaena australis) in Southern Australia. Doctor of Philosophy Thesis. Curtin University, Western Australia.
Charlton C, Bannister J, McCauley RD, Brownell Jr RL, Ward R, Salgado-Kent C, Burnell S. 2018. Demographic parameters of southern right whales (Eubalaena australis) off Australia. Unpublished report (SC/67B/INFO/22 Rev1) presented to the 67Bth IWC scientific committee (Southern Hemisphere Subcommittee), Bled, Slovenia 2018.
Christiansen F, Dujon AM, Sprogis KR, Arnould JP, Bejder L. 2016. Noninvasive unmanned aerial vehicle provides estimates of the energetic cost of reproduction in humpback whales. Ecosphere 7: e01468.10.1002/ecs2.1468.

36
Christiansen F, Vivier F, Charlton C, Ward R, Amerson A, Burnell S, Bejder L. 2018. Maternal body size and condition determine calf growth rates in southern right whales. Marine Ecology Progress Series 592: 267-281.
Conger AJ. 1980. Integration and generalisation of Kappas for multiple raters. Psychological Bulletin 88: 322-328.
Cooke J, Rowntree V. 2003. Analysis of inter-annual variation in reproductive success of South Atlantic right whales (Eubalaena australis) from photo-identifications of calving females observed off Península Valdés , Argentina , during 1971–2000. Unpublished report (SC/55/O) presented to the IWC scientific committee, Berlin, Germany 2003.
Cooke JG, Rowntree V, Payne R. 2001. Estimates of demographic parameters for southern right whales (Eubalaena australis) observed off Península Valdés, Argentina. Journal of Cetacean Research and Management (Special Issue) 2: 125−132
Cummings WC. 1985. Right whales, Eubalaena glacialis (Muller, 1776) and Eubalaena australis (Desmoulins, 1822) Ridgway SH, Harrison R, (Eds.). Handbook of Marine Mammals, vol. 3, The Sirenians and Baleen Whales. Academic Press, London.
D’amato A, Chopra SK. 1991. Whales: their emerging right to life. American Journal of International Law 85: 21-62.
Earle DF. 1976. A guide to scoring dairy cow condition. Journal of the Department of Agriculture, Victoria 74: 228.
Lowman BG, Scott NE, Somerville SH. 1976. Condition scoring of cattle. East of Scotland College of Agriculture. Animal Production, Advisory and Development Department. Edinburgh School of Agriculture.
Elwen SH, Best BP. 2004. Environmental factors influencing the distribution of southern right whales (Eubalaena australis) on the south coast of South Africa II: Within bay distribution. Marine Mammal Science 20: 583-601.
European Space Agency, Plymouth Marine Labaratory. 2018. Ocean Colour-CCI. Available at: https://www.oceancolour.org/browser/.
Findlay K, Thornton M, Wilkinson C, Vermeulen E, Hoerbst S. 2016. Report on the 2016 Mammal Research Institute Whale Unit Southern Right Whale Survey , Nature’s Valley to Lambert’s, South Africa. Unpublished report (SC/67A/SH/05 Rev1) presented at the 67Ath IWC scientific committee, Bled, Slovenia 2017.
Fleiss JL. 1971. Measuring nominal scale agreement among many raters. Psychological Bulletin
76: 378-382.
Fleiss JL, Levin B, Paik MC. 2003. Statistical methods for rates and proportions, 3rd Edition.
John Wiley & Sons, New York.
Fortune SM, Koski WR, Higdon JW, Trites AW, Baumgartner MF, Ferguson SH. 2017. Evidence
of molting and the function of “rock-nosing” behavior in bowhead whales in the eastern
Canadian Arctic. PLoS One 12: e0186156.
Frisch RE. 1984. Body fat, puberty and fertility. Biological Reviews 59: 161-188.
Forcada J, Trathan PN, Reid K, Murphy EJ. 2005. The effects of global climate variability in pup production of Antarctic fur seals. Ecology 86: 2408-2417.

37
Fowler CW, Siniff DB. 1992. Determining population status and the use of biological indices in the management of marine mammals. McCollough DR, Barrett (Eds.) In Wildlife 2001: Populations. Springer, Dordrecht. 1025-1037.
Galletti Vernazzani B, Cabrera E, Brownell R L Jr. 2014. Eastern South Pacific southern right whale photo-identification catalog reveals behavior and habitat use patterns. Marine Mammal Science 30: 389–398.
Gallo L, Carnier P, Cassandro M, Mantovani R, Bailoni L, Contiero B, Bittante G. 1996. Change
in body condition score of Holstein cows as affected by parity and mature equivalent milk
yield. Journal of Dairy Science 79: 1009-1015.
Gamer M, Lemon J, Fellows I, Puspendra S. 2012. irr: Various coefficients of interrater reliability and agreement. R package version 0.84.
Grainger C, McGowan AA. 1982. The significance of pre-calving nutrition of the dairy cow. Occasional Publication, New Zealand Society of Animal Production, New Zealand.
George JC, Philo LM, Hazard K, Withrow D, Carroll GM, Suydam R. 1994. Frequency of killer whale (Orcinus orca) attacks and ship collisions based on scarring on bowhead whales (Balaena mysticetus) of the Bering-Chukchi-Beaufort seas stock. Arctic 1994: 247-255.
Greene CH, Pershing AJ. 2004. Climate and the conservation biology of North Atlantic right whales: the right whale at the wrong time? Frontiers in Ecology and the Environment 2: 29-34.
Guinet C, Roux JP, Bonnet M, Mison V. 1998. Effect of body size , body mass , and body condition on reproduction of female South African fur seals (Arctocephalus pusillus) in Namibia. Canadian Journal of Zoology 76: 1418-1424.
Gwet KL. 2010. Handbook of inter-rater reliability: the definitive guide to measuring the extent of agreement among multiple raters. Advanced Analytics, Gaithersburg MD, 208pp.
Hlista BL, Sosik HM, Traykovski LVM, Kenney RD, Moore MJ. 2009. Seasonal and interannual correlations between right-whale distribution and calving success and chlorophyll concentrations in the Gulf of Maine, USA. Marine Ecology Progress Series 394: 289-302
Iwasa M. 1934. Instructions for use two species of whale lice (Amphipoda, Cyamidae) parasitic on right whales. Journal of the Faculty of Science Hokkaido Zoology 3: 33-39.
IWC (International Whaling Commission). 2001. Report of the workshop on the comprehensive assessment of right whales: a worldwide comparison. Journal Cetacean Research and Management 2: 1-60.
Jefferies BC. 1961. Body condition scoring and its use in management. Tasmanian Journal of Agriculture 32: 19-21.
Joblon MJ, Pokras MA, Morse B, Harry CT, Rose KS, Sharp SM, Niemeyer ME, Patchett KM, Sharp WB, Moore MJ. 2014. Body condition scoring system for delphinids based on Short-beaked common dolphins (Delphinus delphis). Journal of Marine Animals and their Ecology 7: 5-13.
Keller CA, Ward‐Geiger LI, Brooks WB, Slay CK, Taylor CR, Zoodsma BJ. 2006. North Atlantic right whale distribution in relation to sea‐surface temperature in the southeastern United States calving grounds. Marine Mammal Science 22: 426-445.
Knowlton AR, Kraus SD, Kenney RD. 1994. Reproduction in North Atlantic right whales (Eubalaena glacialis). Canadian Journal of Zoology 72: 1297-1305.

38
Knowlton AR, Kraus SD. 2001. Mortality and serious injury of northern right whales (Eubalaena glacialis) in the western North Atlantic Ocean. Journal of Cetacean Research and Management (Special Issue) 2: 193-208.
Kobayashi L.. 2005. Lifting the International Whaling Commission's moratorium on commercial whaling as the most effective global regulation of whaling. Environs: Environmental Law and Policy Journal 29: 177.
Kraus SD, Moore KE, Price CA, Crone MJ, Watkins WA, Win, HE, Prescott JH. 1986. The use of photographs to identify individual North Atlantic right whales (Eubalaena glacialis). Report international Whaling Commision 10: 145-51.
Kraus SD. 2007. High investment, low return: the strange case of reproduction in Eubalaena glacialis. In Kraus SD, Rolland R, Rolland SSRM, (Eds.). The urban whale: North Atlantic right whales at the crossroads. Harvard University Press, Cambridge. 172-199.
Leaper R, Cooke J, Trathan P, Reid K, Rowntree V, Payne R. 2006. Global climate drives southern right whale (Eubalaena australis) population dynamics. Biology Letters 2: 289-292.
Lockyer C. 1986. Body fat condition in Northeast Atlantic fin whales, Balaenoptera physalus, and its relationship with reproduction and food resource. Canadian Journal of Fisheries and Aquatic Sciences 43: 142-147.
Loeb V, Siegel V, Holm-Hansen O, Hewitt R, Fraser W, Trivelpiece W, Trivelpiece S. 1997. Effects of sea-ice extent and krill or salp dominance on the Antarctic food web. Nature 387: 897.
Marón CF, Rowntree VJ, Sironi M, Uhart M, Payne RS, Adler FR, Seger J. 2015. Estimating population consequences of increased calf mortality in the southern right whales off Argentina. Unpublished report (SC/66A/BRG/1) presented to the IWC scientific committee, San Diego, United States 2015.
Mate BR, Best PB, Lagerquist BA, Winsor MH. 2011. Coastal, offshore, and migratory movements of South African right whales revealed by satellite telemetry. Marine Mammal Science 27: 455-476.
McEvoy TG, Robinson JJ. 2003. Nutrition and its interaction with reproductive processes. In: Holt WV, Pickard AR, Rodger JC, Wildt DE (Eds.) Reproductive science and integrated conservation. Cambridge University Press, Cambridge. 42-56.
Miller RG. 1981. Simultaneous statistical inference (Second edition). Springer, New York. 299pp.
Miller CA, Reeb D, Best PB, Knowlton AR, Brown MW, Moore MJ. 2011. Blubber thickness in right whales Eubalaena glacialis and Eubalaena australis related with reproduction, life history status and prey abundance. Marine Ecology Progress Series 438: 267-283.
Miller CA, Best PB, Perryman WL, Baumgartner MF, Moore MJ. 2012. Body shape changes associated with reproductive status, nutritive condition and growth in right whales Eubalaena glacialis and Eubalaena australis. Marine Ecology Progress Series 459: 135-156.
Morfeld KA, Lehnhardt J, Alligood C, Bolling J, Brown JL. 2014. Development of a body condition scoring index for female African elephants validated by ultrasound measurements of subcutaneous fat. PLoS One 9: e93802.

39
Murphy EJ, Watkins JL, Reid K, Trathan PN, Everson I, Croxall JP, Priddle J, Brandon MA, Brierley AS, Hofmann E. 1998. Interannual variability of the South Georgia marine ecosystem: biological and physical sources of variation in the abundance of krill. Fisheries Oceanography 7: 381-390.
National Snow & Ice Data Center. 2018. Sea Ice Index. Available at: https://nsidc.org/data/seaice_index/. Accessed December 2018.
NOAA. 2018. Climate Predictor Centre. Available at: http://www.cpc.ncep.noaa.gov/. Accessed December 2018.
O’Connor S, Campbell R, Cortez H, Knowles T. 2009. Whale Watching Worldwide: tourism numbers, expenditures and expanding economic benefits, a special report from the International Fund for Animal Welfare. Yarmouth MA, United States, prepared by Economists at Large. 73-77
Osmond MG, Kaufman GD. 1998. A heavily parasitized humpback whale (Megaptera novaeangliae). Marine Mammal Science 14: 146-149.
Patenaude NJ, Portway VA, Schaeff CM, Bannister JL, Best PB, Payne RS, Rowntree VJ, Rivarola M, Baker CS. 2007. Mitochondrial DNA diversity and population structure among southern right whales (Eubalaena australis). Journal of Heredity 98: 147-157.
Payne R, Brazier O, Dorsey EM, Perkins JS, Rowntree VJ, Titus A. 1983. External features in southern right whales (Eubalaena australis) and their use in identifying individuals. Communication and behavior of whales. Westview Press, Boulder, Colorado. 371-445.
Perryman WL, Lynn MS. 2002. Evaluation of nutritive condition and reproductive status of migrating gray whales (Eschrichtius robustus) based on analysis of photogrammetric data. Journal of Cetacean Research and Management 4: 155-164.
Pettis HM, Rolland RM, Hamilton PK, Brault S, Knowlton AR, Kraus SD. 2004. Visual health assessment of North Atlantic right whales (Eubalaena glacialis) using photographs. Canadian Journal of Zoology 82: 8-19.
Pinheiro J, Bates D, DebRoy S, Sarkar D, R Core Team. 2018. nlme: Linear and Nonlinear Mixed Effects Models. R package version 3.1-137.
Pirzl R. 2008. Spatial ecology of Eubalaena australis: habitat selection at multiple scales Ph.D. thesis, School of Life and Environmental Sciences, Deakin University, Melbourne.
R Core Team. 2018. R: A language and environment for statistical computing. R Foundation for Statistical Computing, Vienna, Austria.
Reeb D, Best PB, Kidson SH. 2007. Structure of the integument of southern right whales, Eubalaena australis. The Anatomical Record 290: 596-613.
Reeves RR, Kenney RD. 2003. Baleen whales: Right whales and allies. Wild Mammals of North America: Biology, Management and Conservation, 2nd Edition. Feldhamer GA, Thompson BC, Chapman JA, (Eds.). Johns Hopkins University Press, Baltimore, Maryland. 425-463.
Reilly SB, Bannister JL, Best PB, Brown M, Brownell Jr RL, Butterworth D, Clapham PJ, Cooke J, Donovan GP, Urbán J, Zerbini AN. 2013. Eubalaena australis, southern right whale view. IUCN Red List Threat Species.
Rowntree VJ. 1996. Feeding, distribution, and reproductive behavior of cyamids (Crustacea: Amphipoda) living on humpback and right whales. Canadian Journal of Zoology 74: 103-109.
40
Rowntree VJ. 1999. Does the size of a female right whale’s neck roll predict the condition of her calf? In Abstracts in the proceedings of the 13th Biennial Conference on the Biology of Marine Mammals: 163. Maui, Hawaii, 27 November–3 December 1999.
Schulte-Hostedde AJ, Millar JS, Hickling GJ. 2001. Evaluating body condition in small mammals. Canadian Journal of Zoology 79: 1021-1029.
Seyboth E, Groch KR, Dalla Rosa L, Reid K, Flores PAC, Secchi ER. 2016. Southern right whale (Eubalaena australis) reproductive success is influenced by krill (Euphausia superba) density and climate. Scientific Reports 6: 1-8.
Stedman TL. 2005. Stedman’s medical dictionary. 27th ed. Lippincott Williams and Wilkins, Baltimore, Maryland.
Tormosov DD, Mikhaliev YA, Best PB, Zemsky VA, Sekiguchi K, Brownell Jr RL. 1998. Soviet catches of southern right whales (Eubalaena australis), 1951–1971. Biological data and conservation implications. Biological Conservation 86: 185-197.
Trathan PN, Brierley AS, Brandon MA, Bone DG, Goss C, Grant SA, Murphy EJ, Watkins JL. 2003 Oceanographic variability and changes in Antarctic krill (Euphausia superba) abundance at South Georgia. Fisheries Oceanography 12: 569-583.
Trathan PN, Murphy EJ, Forcada J, Croxall JP, Reid K, Thorpe S. 2006. Physical foraging in the southwest Atlantic: ecosystem controll. In Top predators in marine ecosystems. Boyd IL, Wanless S, Camphuysen CK, (Eds.). Cambridge University Press, Cambridge. 28-45.
Tulloch VJ, Plagányi ÉE, Matear R, Brown CJ, Richardson AJ. 2018. Ecosystem modelling to quantify the impact of historical whaling on Southern Hemisphere baleen whales. Fish and Fisheries 19: 117-137.
Valenzuela LO, Sironi M, Rowntree VJ, La Sala L, Pozzi L, Mohamed N, Musmeci L, Andrejuk J, Uhart M, Chirife A, Maron C. 2008. Population genetic structure of living and dead southern right whales (Eubalaena australis) off Península Valdés, Argentina. Journal of Cetacean Researchand Management 62: 1-12.
Van den Berg, G. 2018. Linking climate and ocean productivity to the prevalence of southern right whales (Eubalaena australis) in South African waters. Honours Thesis, University of Stellenbosh, Stellenbosh, South Africa.
Vermeulen E, Wilkinson C, Thornton M, Peters IT, Findlay K. 2018. Report on the 2017 Mammal Research Institute Whale Unit Southern Right Whale Survey, Nature’s Valley to Lamberts Bay, South Africa. Unpublished report (SC/67B/SH/01) presented to the 67Bth IWC scientific committee (Southern Hemisphere Subcommittee), Bled, Slovenia 2018.
Wood SN, Pya N, Saefken B. 2016. Smoothing parameter and model selection for general
smooth models. Journal of the American Statistical Association 111: 1548-1563.
Wickham H. 2016. ggplot2: Elegant Graphics for Data Analysis. Springer, New York.
Yandell BS. 1997. Practical Data Analysis for Designed Experiments. Chapman & Hall, London.
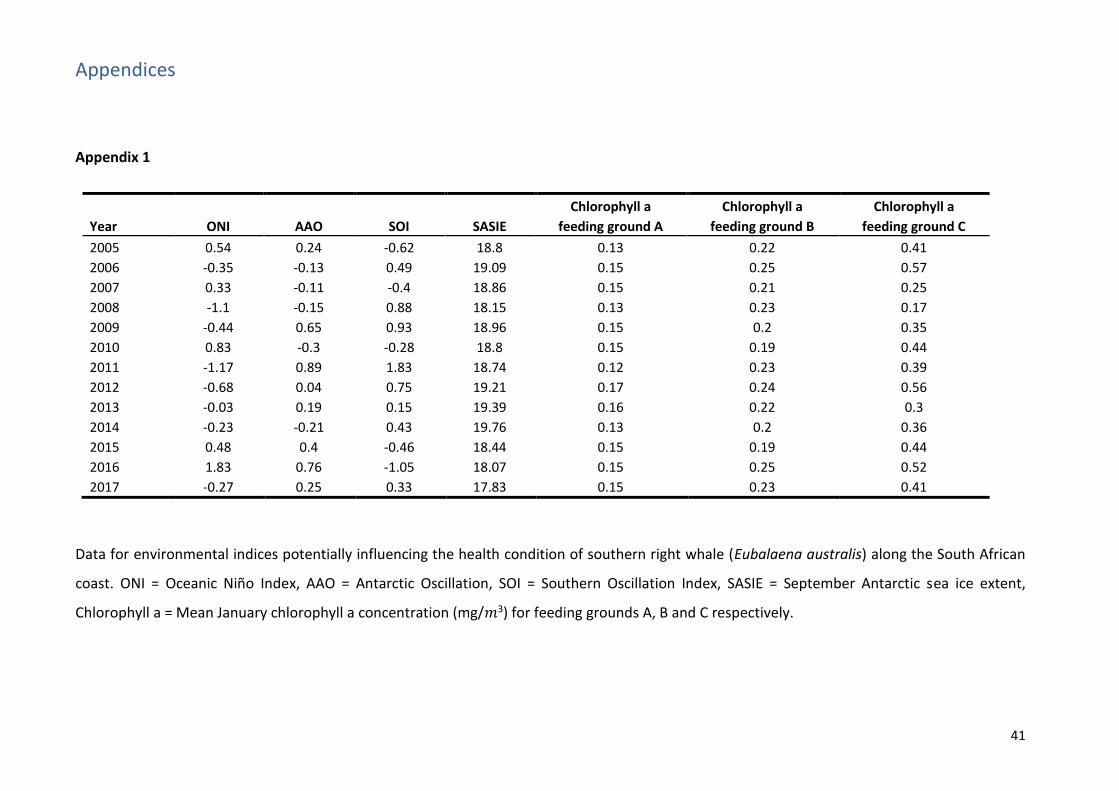
41
Appendices
Appendix 1
Chlorophyll a Chlorophyll a Chlorophyll a
Year ONI AAO SOI SASIE feeding ground A feeding ground B feeding ground C
2005 0.54 0.24 -0.62 18.8 0.13 0.22 0.41
2006 -0.35 -0.13 0.49 19.09 0.15 0.25 0.57
2007 0.33 -0.11 -0.4 18.86 0.15 0.21 0.25
2008 -1.1 -0.15 0.88 18.15 0.13 0.23 0.17
2009 -0.44 0.65 0.93 18.96 0.15 0.2 0.35
2010 0.83 -0.3 -0.28 18.8 0.15 0.19 0.44
2011 -1.17 0.89 1.83 18.74 0.12 0.23 0.39
2012 -0.68 0.04 0.75 19.21 0.17 0.24 0.56
2013 -0.03 0.19 0.15 19.39 0.16 0.22 0.3
2014 -0.23 -0.21 0.43 19.76 0.13 0.2 0.36
2015 0.48 0.4 -0.46 18.44 0.15 0.19 0.44
2016 1.83 0.76 -1.05 18.07 0.15 0.25 0.52
2017 -0.27 0.25 0.33 17.83 0.15 0.23 0.41
Data for environmental indices potentially influencing the health condition of southern right whale (Eubalaena australis) along the South African
coast. ONI = Oceanic Niño Index, AAO = Antarctic Oscillation, SOI = Southern Oscillation Index, SASIE = September Antarctic sea ice extent,
Chlorophyll a = Mean January chlorophyll a concentration (mg/𝑚3) for feeding grounds A, B and C respectively.

42
Appendix 2
Results from the Tukey posthoc test for TS, showing the difference and significance of total health score between the various years over the study
period. Significant values are displayed in bold.
Year Difference p adj. Year Difference p adj. Year Difference p adj. Year Difference p adj.
2006-2005 0.015 0.898 2015-2006 -0.001 1.000 2016-2008 -0.046 0.067 2015-2011 0.022 0.458
2007-2005 -0.002 1.000 2016-2006 -0.013 0.999 2017-2008 -0.029 0.118 2016-2011 0.010 1.000
2008-2005 0.047 <0.001 2017-2006 0.004 1.000 2010-2009 0.003 1.000 2017-2011 0.027 0.180
2009-2005 -0.008 1.000 2008-2007 0.049 <0.001 2011-2009 0.000 1.000 2013-2012 -0.002 1.000
2010-2005 -0.004 1.000 2009-2007 -0.006 1.000 2012-2009 0.031 0.016 2014-2012 0.065 <0.001
2011-2005 -0.008 0.999 2010-2007 -0.002 1.000 2013-2009 0.029 0.023 2015-2012 -0.009 0.999
2012-2005 0.023 0.330 2011-2007 -0.006 1.000 2014-2009 0.096 <0.001 2016-2012 -0.021 0.961
2013-2005 0.021 0.421 2012-2007 0.025 0.237 2015-2009 0.022 0.471 2017-2012 -0.004 1.000
2014-2005 0.088 <0.001 2013-2007 0.023 0.311 2016-2009 0.009 1.000 2014-2013 0.067 <0.001
2015-2005 0.014 0.968 2014-2007 0.090 <0.001 2017-2009 0.027 0.188 2015-2013 -0.007 1.000
2016-2005 0.002 1.000 2015-2007 0.016 0.926 2011-2010 -0.004 1.000 2016-2013 -0.019 0.979
2017-2005 0.019 0.787 2016-2007 0.004 1.000 2012-2010 0.027 0.096 2017-2013 -0.002 1.000
2007-2006 -0.017 0.812 2017-2007 0.021 0.682 2013-2010 0.025 0.133 2015-2014 -0.074 <0.001
2008-2006 0.032 0.008 2009-2008 -0.055 <0.001 2014-2010 0.092 <0.001 2016-2014 -0.086 <0.001
2009-2006 -0.023 0.240 2010-2008 -0.052 <0.001 2015-2010 0.018 0.791 2017-2014 -0.069 <0.001
2010-2006 -0.019 0.587 2011-2008 -0.055 <0.001 2016-2010 0.006 1.000 2016-2015 -0.012 1.000
2011-2006 -0.023 0.230 2012-2008 -0.025 0.153 2017-2010 0.023 0.463 2017-2015 0.005 1.000
2012-2006 0.008 1.000 2013-2008 -0.027 0.062 2012-2011 0.031 0.015 2017-2016 0.017 0.995
2013-2006 0.006 1.000 2014-2008 0.041 <0.001 2013-2011 0.029 0.022
2014-2006 0.073 <0.001 2015-2008 -0.034 0.018 2014-2011 0.096 <0.001

43
Appendix 3
Graph displaying the mean health score for parous female southern right whales (+SE) over
the study period and the mean chlorophyll a concentrations of feeding ground A in January
over the same period of time.

44
Appendix 4
Results of the generalized additive model relating the four health variables with each other
and with the year of sighting. Significant-values are displayed in bold. * p < 0.05, ** p < 0.01
and *** p< 0.001.
Response variable
Explanatory variable edf R-sq. (adj)
Deviance expl.
p-value
Body condition Skin condition 1.96
0.06 6.72%
0.048 *
Cyamids around blowholes 1.00 0.022 *
Rake marks 1.00 0.891
Year 7.83 < 0.001 ***
Skin condition Body condition 1.00
0.04 4.88%
0.056 .
Cyamids around blowholes 1.32 < 0.001 ***
Rake marks 1.54 0.473
Year 7.65 < 0.001 ***
Cyamids around Body condition 1.00
0.04 4.49%
0.029 *
blowholes Skin condition 3.63 < 0.001 ***
Rake marks 3.54 < 0.001 ***
Year 6.52 < 0.001 ***
Rake marks Body condition 1.57
0.01 0.97%
0.521
Skin condition 1.00 0.559
Cyamids around blowholes 3.38 0.059 *
Year 1.57 0.030 *