master of technology (dual degree) in metallurgical and...
TRANSCRIPT
STUDY OF WEAR, AGING AND CORROSION BEHAVIOUR OF
ALUMINIUM-3%MAGNESIUM-10%SILICON CARBIDE COMPOSITE
A thesis submitted in partial fulfilment of the requirements for the degree of
Master of Technology (Dual Degree)
In
Metallurgical and Materials Engineering
By
ALOK RANJAN SAHOO
ROLL NO. 710MM1097
Department of Metallurgical and Materials Engineering
National Institute of Technology
Rourkela, Odisha
India
2015

2 | P a g e
STUDY OF WEAR, AGING AND CORROSION BEHAVIOUR OF
ALUMINIUM-3%MAGNESIUM-10%SILICON CARBIDE COMPOSITE
A thesis submitted in partial fulfilment of the requirements for the degree of
Master of Technology (Dual Degree)
In
Metallurgical and Materials Engineering
By
ALOK RANJAN SAHOO
ROLL NO. 710MM1097
Under the guidance of
Dr. Subash Chandra Mishra
Department of Metallurgical and Materials Engineering
National Institute of Technology
Rourkela, Odisha
India
2015
3 | P a g e
Metallurgical and Materials Engineering Department
National Institute of Technology,
Rourkela, Odisha,
India
CERTIFICATE
This is to certify that the REPORT entitled “STUDY OF WEAR, AGING AND
CORROSION BEHAVIOUR OF ALUMINIUM-3%MAGNESIUM-10%SILICON
CARBIDE COMPOSITE” submitted by ALOK RANJAN SAHOO (ROLL NO.
710MM1097) in fulfilment of the requirements for the award of Master of Technology
Degree in Metallurgical and Materials Engineering at the National Institute of
Technology, Rourkela is an authentic work carried out by him under my supervision and
guidance. To the best of my knowledge, the matter embodied in this report has not been
submitted to any other University/ Institute.
Date: 25/05/2015
Prof. Dr. S.C. Mishra
Dept. of Metallurgical and Materials Engg.
National Institute of Technology, Rourkela.
4 | P a g e
ACKNOWLEDGEMENT
I avail this opportunity to extend my hearty indebtedness to my guide Prof. S. C. Mishra,
Dept. of Metallurgical and Materials Engineering, NIT, Rourkela for his invaluable
guidance, motivation, untiring efforts and meticulous attention at all stages during my course of
work.
I express my sincere thanks to Prof. S C Mishra, Head of the Department of
Metallurgical and Materials Engineering, NIT, Rourkela for providing me the necessary
facilities in the department. I am also grateful to Mr. Sumant Kumar Samal for his constant
concern and encouragement for execution of this work.
I also express my sincere gratitude to Mr. Asutosh Pattanayak and Subrat Kumar
Bhuyan for his timely help during the course of work.
I am also thankful to Mr. Ranjan Kumar Behera, Metallurgical & Materials
Engineering, for his co-operation in experimental work.
I am greatly thankful to all the staff members of the department and all our well-wishers,
classmates and friends for their inspiration and help.
Alok Ranjan Sahoo
Roll No. 710MM1097

5 | P a g e
CONTENTS
Page
Certificate 3
Acknowledgement 4
List of figures 7
Abstract 9
Chapter-1. Introduction 10
1.1 Background and Motivation 11
1.2 Objective of the present work 13
Chapter-2. Literature Review 14
2.1 Aluminium alloys 15
2.2 Aluminium-Magnesium alloys 15
2.3 Aluminium Metal Matrix Composite (AMC) 16
2.4 Tribology 17
2.5 Wear 18
2.6 Strengthening mechanisms in PRMMCs 21
2.7 Corrosion of Aluminum Alloys 23
2.8 Uses of Aluminum and their alloys 26
Chapter-3. Experimental set up and methodology 27
3.1 Introduction 28
3.2 Sample Preparation 28
3.3 Wear test 29
3.4 Stereo Microscope 30
3.5 Profilometer 31

6 | P a g e
3.6 Aging Experiment 32
3.7 Corrosion Experiment 33
Chapter- 4. Results and Discussion 34
4.1 Introduction 35
4.2 Wear Test Analysis 36
4.3 Worn surface microstructure 43
4.4 Aging analysis 44
4.4.1 SEM analysis 45
4.4.2 XRD analysis 47
4.5 Corrosion Behaviour 50
4.5.2 EDX Analysis 51
4.5.3 SEM Analysis 52
Chapter- 5. Conclusions 55
5.1. Conclusions 56
5.2. Recommendation for Future Work 57
REFERENCES 58
7 | P a g e
LIST OF FIGURES
Fig. 2.1 The mechanism of pitting corrosion of aluminium
Fig. 3.1 Pin on disc wear test machine
Fig. 3.2 Stereo microscope of Physical Metallurgy Lab, NIT Rourkela
Fig. 3.3 Stylus ProfilometerVeecoDektat, Electrometallugy Lab, NIT Rourkela
Fig. 3.5 Scanning Electron Microscope (SEM) machine in Metallurgical and
Materials Engineering Department, NIT, Rourkela, Odisha, India
Fig. 3.5 Scanning Electron Microscope (SEM) machine in Metallurgical and
Materials Engineering Department, NIT, Rourkela, Odisha, India
Fig. 4.1 XRD pattern of the Al-3%Mg-10%SiC composite sample at room
temperature
Fig. 4.2 Optical Image of the Al-3%Mg-10%SiC composite sample at room
temperature
Fig. 4.3 Graph between cumulative weight loss and cumulative sliding time at
different applied loads like 70N, 80N, 90N. 100N
Fig. 4.4 Graph between cumulative weight loss and applied load used in wear test
Fig. 4.5 Graph between cumulative weight loss and sliding distance at different
applied loads like 70N, 80N, 90N. 100N
Fig. 4.6 Graph between cumulative weight loss and sliding time at different rpms
like 200, 300, 400, 500, 600, 700
Fig. 4.7 Graph between cumulative weight loss and sliding speed
Fig. 4.8 Graph between surface roughness of the worn sample and applied load
Fig. 4.9 Graph between co-efficient of friction and sliding time at different applied
loads like (a) 70N (b) 80N (c) 90N (d) 100N
Fig. 4.10 worn surface of the specimen
Fig. 4.11 Optical Micrograph of the worn surface at different applied loads like 70N,
80N, 90N, 100N
Fig. 4.12 the Al-Mg Phase Diagram
Fig. 4.13 SEM micrograph of The composite sample at room temperature
8 | P a g e
Fig. 4.14 SEM Image of the al-3%Mg-10%SiC composite sample solution treated at
250 C for 1hr. and aged at four different temperatures showing Micro-
vicker’s Hardness (a) 1200C (b) 1500C
Fig. 4.15 SEM Image of the al-3%Mg-10%SiC composite sample solution treated at
250 C for 1hr. and aged at four different temperatures showing Micro-
vicker’s Hardness (c) 1800C (d) 2200C
Fig. 4.16 XRD analysis of the composite solution treated at 2500C for 1hr. and aged
at 1200C
Fig. 4.17 XRD analysis of the composite solution treated at 2500C for 1hr. and aged
at 1500C
Fig. 4.18 XRD analysis of the composite solution treated at 2500C for 1hr. and aged
at 1800C
Fig. 4.19 XRD analysis of the composite solution treated at 2500C for 1hr. and aged
at 2200C
Fig. 4.20 Graph between Wt. of the corroding sample and no. of days exposed to sea
water
Fig. 4.21 EDX analysis of normal composite sample
Fig. 4.22 EDX analysis of the corroded sample
Fig. 4.23 SEM micrograph of normal composite sample before exposure to sea water
Fig. 4.24 SEM micrograph of the composite sample after 1 week exposure to sea
water
Fig. 4.25 SEM micrograph of the composite sample after 3 weeks exposure to sea
water
Fig. 4.26 SEM image of the sample kept in sea water after 6 weeks showing pitting
corrosion
Fig. 4.27 Enlarged view of a pit showing pitting corrosion
9 | P a g e
ABSTRACT
Aluminium based metal matrix composites (MMCs) offer potential for advanced structural
applications when high specific strength and modulus, as well as good elevated temperature
resistance along with light weight and for marine applications. In the present work, aluminium-
magnesium-silicon carbide composite (Al-3%Mg-10%SiC) developed using a stir casting
technique is studied for wear, aging and corrosion behaviour. The wear behaviour of the
composite is investigated at room conditions at four different loads, 70N, 80N, 90N, 100N and
with varying sliding speeds, i.e. 200, 300, 400, 500, 600, 700 rpm's, using a pin-on-disk wear
testing machine. Then the composite was solution treated at a temperature of 250 C for 1hr and
then aged at four different temperatures viz. 120 C, 150 C, 180 C, and 220 C to study the aging
behaviour of the composite. The composite is kept in sea water for 42 days and the weight loss
was measured in every 7 days to study the corrosion behaviour. Variation of cumulative mass
loss with the applied load, sliding speed, sliding distance and friction co-efficient was studied
from the pin-on-disk experiment. Microstructural characterization of the surfaces, micro-
hardness measurement, and surface roughness studies of the worn surface are also made. The
aging and corrosion mechanism is established with the aid of XRD analysis and scanning electron
microscopy. It is found that, addition of silicon carbide to the Al-Mg matrix composite improves
the wear resistance and hardness. Also, ageing process further improves the wear resistance and
hardness. The dominant corrosion mechanism is found to be by pitting corrosion phenomena.
Key words: sliding speed, sliding distance, aging, pitting corrosion

10 | P a g e
Chapter1
INTRODUCTION
• Background and Motivation
• Objectives of the present piece of investigation
11 | P a g e
INTRODUCTION
1.1 Background and Motivation:
The advancement of composite materials has turn into a defining moment in the historical
backdrop of science and innovation as it allows the synergizing of clear properties of its fixings,
namely the reinforcement phase and the bulk matrix phase and suppresses the deficiencies of
each of them [1]. The composite materials in light of metals and their alloys which are termed as
metal matrix composites (MMCs) have adapted broad research everywhere throughout the world
amid the previous 20 years as they are discovered to be suitable competitor materials for basic
and mechanical applications in aerospace sector, marine sector, defense sector and general
engineering applications. The remarkable capacity of MMCs to bring together the reinforcement
(generally ceramic material) properties (high quality and versatile modulus) with that of the
metallic stage (high flexibility and durability) makes them fit for bearing higher pressure and
shear loadings furthermore sustainability at elevated temperatures[2,3].
The use of aluminum based MMCs (AMCs) is expanding in a variety of industries of commercial
values as they give extraordinary points of interest over traditional solid materials regarding more
stiffness and specific strength, enhanced high temperature wear resistance capacities,
customizable coefficient of thermal extension (CTE) and resistance to thermal fatigue. The
applications of AMCs includes gears and braking system in automobiles, fuel access door covers
and ventral fins in automobiles, golf club shafts, bicycle frames, track shoes in military tanks,
flywheels, ice hockey sticks, Cryostats, rocket turbine housing, missile nose tips, etc. [4-6].
AMCs with reinforcement in the form of particles are picking up significance because of their
isotropic properties when compared with fiber and whisker reinforcements which display
anisotropic mechanical properties. These particulates reinforced metal matrix composites
(PRMMCs) show high strength, hardness, and wear and corrosion resistance [4,7]. They have
predominant plastic framing potential than fiber and whisker reinforced composites which thusly
decreases their manufacturing expense. The properties of PRMMCs rely on the size and
properties of the strengthening particles, interparticle spacing, and particle-matrix interface
condition and shape and volume fraction of the particle [1].

12 | P a g e
PRMMCs can be fabricated through a variety of manufacturing routes such as powder metallurgy,
diffusion bonding (solid state processing), stir casting, melt infiltration, spray deposition (liquid
state processing) and in-situ processing techniques [8]. The powder metallurgy course is the most
favored course of creation for PRMMCs since it holds the upside of minimizing deleterious
reaction between the metal and the ceramic reinforcement phase during processing. Besides, the
effect of segregation and the tendency to formation of intermetallic phases is reduced in powder
metallurgy processing when contrasted with preparing in liquid state [1, 9].
The mechanical and physical properties of aluminum-magnesium based metal matrix composites
(MMCs) have made themselves appealing for car, space, marine and aerospace applications.
Different experimental procedures are utilized to produce such MMCS, which incorporate
different routines to create valuable designing shapes, for example, superplastic transformations,
and these may be utilized to deliver fundamental Metal Matrix Composite master alloys, for
example, powder processing alloys or melt infiltration. Because of the complexity of some of the
other processes, the last two strategies are the most broadly utilized, and the requirement for new
manufacturing facilities in some different cases. A cheap experimental technique based on the
stirring process has been proposed, that can deliver composites by conventional aluminum
casting and foundry practices [10].
In any case, the absence of wettability between most ceramic particles and the liquid aluminum
and most ceramic particles is the prime trouble of the mixing procedure, which creates just
composites with a low wt. % up to 5% ceramic particles. The additions of SiC particles to Al_4%
Cu refines its micro structure and improves the elastic modulus and yield strength, whereas the
ductility and ultimate tensile strength are decreased. Decreasing the wetting angle between SiC
particles and liquid Al has tackled this issue by an exceptional treatment. Al_4% Cu strengthened
with distinctive weight percents of SiC particles, running from 0 to 30 wt. %, have been tried and
created [11].
13 | P a g e
The tribological or wear properties of the Al–Mg–Cu compounds were fundamentally enhanced
by the addition of SiC particles; be that as it may, wear and abrasion resistance of the
composites was much higher than that of the unreinforced aluminum and Al-Mg alloys. The
applied load was mainly carried by SiC precipitates which resist abrasion effects. The addition
of SiC particles created a significant change of wear and corrosion resistance of Al–4wt%Mg–
Cu compounds. The vicinity of SiC in Tribo film between two surfaces in contact brings about
three-body abrasion and wear system which increased the coefficient of friction [10].
1.2 Objectives of the present work:
To study the wear behaviour of the Al-3%Mg-10%SiC composite sample varying various
parameters like:
i. Time
ii. Applied load
iii. Sliding speed
iv. Sliding distance
v. Surface roughness
To discuss the conditions of various parameters that can reduce co-efficient of friction
and wear and improve the mechanical processes of the composite.
To improve the hardness of the composite and reduce wear by the age hardening
mechanism by finding a proper aging temperature.
To study the corrosion behaviour and to find the corrosion mechanism responsible for the
corrosion occurring when the composite is exposed to sea water.
14 | P a g e
Chapter2
LITERATURE SURVEY
• Aluminium alloys
• Aluminium-Magnesium alloys
• Aluminium Metal Matrix Composite (AMC)
• Tribology
• Wear
• Strengthening mechanisms in PRMMCs
• Corrosion of Aluminum Alloys
• Uses of Aluminum and their alloys
15 | P a g e
LITERATURE SURVEY
2.1 Aluminium alloys:
• Aluminium (Al) is the 2nd-most plentiful element on earth.
• Studies show that 10% weight reduction equals 5.5% growth in fuel economy.
• The growing demand to reduce energy consumption, resource depletion, air pollution and
race to economic growth has led to the exploitation of Aluminium and its alloys.
Properties of Aluminum alloys [12]:
• Aluminium alloys exhibit high strength to weight ratios.
• Al-alloys cover a wide range of values of strength, ranging from 10 Nmm-2 for elastic
limit of pure Al to 500 N mm-2 for 7000 series alloys.
• Aluminium alloys are sufficiently ductile to be used in structural applications.
• These alloys do not lose strength at low temperatures, in fact Al-Mg alloys show increase
in their strength at low temperatures.
• They are corrosion- resistant and possess good weldability.
• They exhibit high tensile strength.
• Many Al alloys developed provide strength, wear resistance and hardness at elevated
temperatures.
2.2 Aluminium-Magnesium alloys:
Aluminium has several series in its nomenclature based on elements, it alloys with.
For example, 3XXX for alloying with manganese, 5XXX for alloying with
magnesium and 6XXX for alloying with magnesium and silicon.
Advantages of magnesium additions to Aluminium:
1) Magnesium has two thirds the weight of Aluminium, thus addition of Magnesium to
Aluminium leads to decrease in the density of the alloy.
2) Magnesium has higher specific strength than Aluminium. Thus the addition of
Magnesium results in increased strength of alloy as compared to Aluminium.
3) Magnesium addition leads to an increase in the strength to weight ratio. Thus the alloys are
more suitable for automobile and aircraft parts as it increases the fuel efficiency.
16 | P a g e
4) Addition of magnesium to aluminium results in precipitation and age hardening of alloy. Thus
the strength is significantly increased.
5) The most important advantage of Magnesium addition is that it improves the wettability of
solid ceramic reinforcement in Aluminium metal matrix composites.
Better wettability would result in more homogeneous distribution of reinforcement particles in
the matrix.
6) Magnesium also improves the formability and castability of aluminium.
2.3 Aluminium Metal Matrix Composite (AMC):
Aluminum based Metal matrix composites (AMCs) allude to the class of superior lightweight
aluminum driven material systems. The reinforcement particles in AMCs could be in the form of
whisker or particulates, continuous or discontinuous fibers, in volume and weight fractions
ranging from a few percent to 60%. Properties of AMCs can be custom-made to the requests of
distinctive modern applications by suitable mixes of reinforcement, matrix and processing route
[15].
Advantages of AMC:
1) Greater strength
2) Reduced density (weight)
3) Improved stiffness
4) Controlled thermal expansion coefficient
5) Improved high temperature properties
6) Enhanced and tailored electrical performance
7) Thermal/heat management
8) Improved damping capabilities.
9) Improved abrasion and wear resistance
10) Control of mass (especially in reciprocating applications)
Advantages of SiC addition:
• SiC is one of the best widely used ceramic reinforcements in Aluminium metal matrix
composites.
• SiC have high corrosion resistance, high thermal conductivity, low thermal expansion
coefficient, high hardness and good refractory properties.

17 | P a g e
• The addition of SiC to aluminium improves its strength and other thermal and mechanical
properties.
• SiC improves strength of the alloy and the elevated temperature hardness.
2.4 Tribology:
Tribology nomenclature is derived from a Greek word “tribos” means rubbing. Tribology
or wear is the science and technology of interacting or contact surfaces in relative motion and the
practices related thereto; their design, friction, lubrication and wear [16].
The economic aspect of tribology:
• It has been estimated that about 30% of the energy generated in the industrial parts of the
world is consumed ultimately in friction processes.
• In highly industrialized countries like England, Japan or the republic of Germany, some
$2,000 million per annum are lost as a result of wear processes.
• Even if these figures are taken as rough estimates, they clearly indicate the importance
of tribology for conservation of energy and materials [17].
Importance of tribological studies:
• Tribological characterization is, accordingly, critical for increasing material life and
performance. Especially in the fields of aerospace, automotive and tooling, where failures
from contact and wear can be calamitous.
• Tribology is essential in advanced hardware in which sliding and moving between
surfaces happen.
• In automobiles, brakes, bolts, nuts, clutches, tires etc., friction is used as a productive
friction. Unproductive wear and friction takes place in valuable auto parts like engines,
cams, gears, bearings etc.
• Friction and wear cost plenty of money in the form of energy loss and material loss. It
prompts diminish in national efficiency. Lessening in wear and friction can prompt
personal satisfaction. Subsequently tribology information is critical and huge for capital
saving.
• Hence this specific composite has been examined for tribological properties [17].

18 | P a g e
2.5 Wear:
Wear is the harm caused by a material surface because of the relative movement with
other reaching surfaces which for the most part results in useless material misfortunes. Wear can
bring about removal of material from either or both the reaching surfaces. Wear is characterized
as "the damage to a strong surface, generally involving the progressive loss of material, because
of relative movement between two moving surfaces [18].
But for engineering aspects, wear can be characterized in the accompanying ways:
1) Wear is a harm to the material surface which brings about "loss of material" from the surfaces.
Aside from material losses, Wear has different perspectives to it.
2) As wear alludes to the harm to the reaching surfaces, wear can be alluded to "the movement
of material" at first glance, regardless of the fact that it doesn't include material loss from the
surface.
3) A third part of wear which incorporates the harm to the surface, yet not material loss or
dimensional changes. An indication of this method of wear may be by the development of various
systems of breaks at first glance. This mode gets to be noteworthy with optically transparent
materials. Consequently wear is the harm to the material surface which unfavorably influences
the life and execution of the part.
Types of Wear
Wear can be classified into different types depending on if it occurs in dry or lubricated
conditions or types of wearing contacts. Dry friction, which is the primary concern in the absence
of lubricants or dry condition, is defined as the friction under not intentionally lubricated
conditions. But it is well known that it is friction under lubrication by atmospheric gases,
especially by oxygen [19].
On the basis of type of wearing contacts, wear is either:
(i) Single-phase wear where one solid causes material removal from the sliding surface against
which it is in relative motion.
(ii) Multi-phase wear, where wear, from a solid, gas or liquid acts as a carrier for a secondary
phase that really produces the wear.
19 | P a g e
A fundamental method for classifying wear was first outlined by Burwell and Strang [20].
Later Burwell [21] modified the classification to include five distinct types of wear, namely
(1) Abrasive
(2) Erosive
(3) Adhesive
(4) Corrosive
(5) Surface fatigue
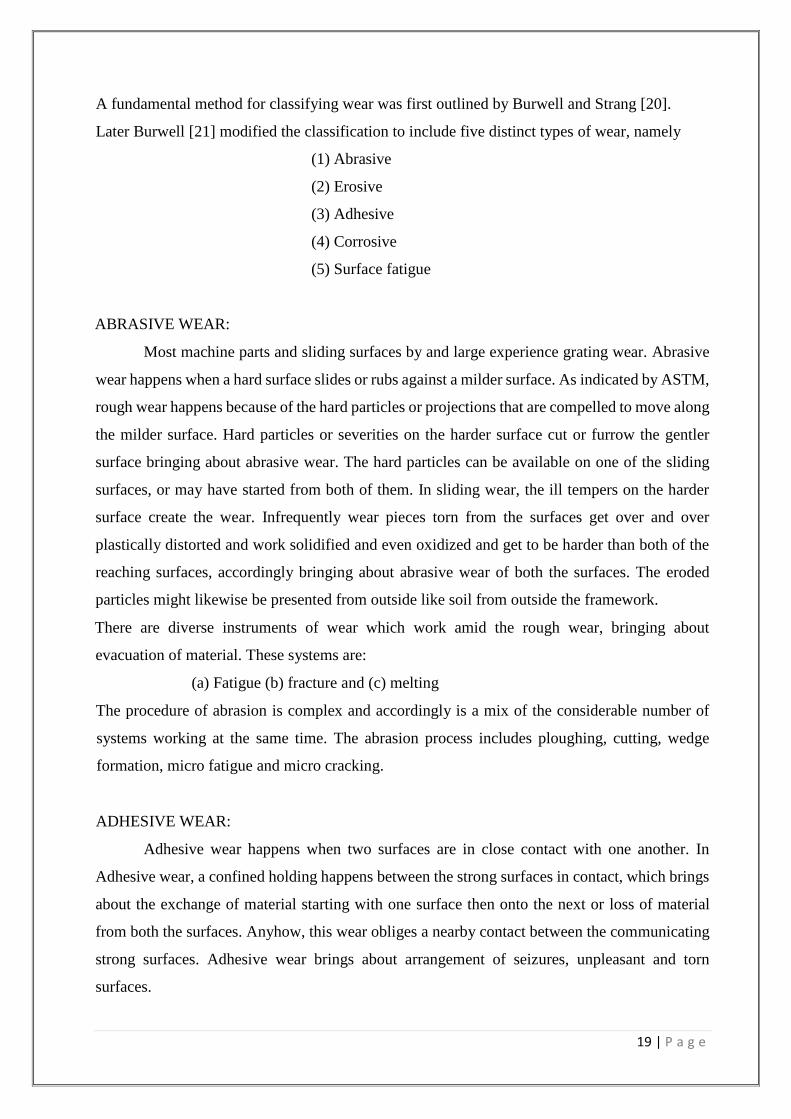
ABRASIVE WEAR:
Most machine parts and sliding surfaces by and large experience grating wear. Abrasive
wear happens when a hard surface slides or rubs against a milder surface. As indicated by ASTM,
rough wear happens because of the hard particles or projections that are compelled to move along
the milder surface. Hard particles or severities on the harder surface cut or furrow the gentler
surface bringing about abrasive wear. The hard particles can be available on one of the sliding
surfaces, or may have started from both of them. In sliding wear, the ill tempers on the harder
surface create the wear. Infrequently wear pieces torn from the surfaces get over and over
plastically distorted and work solidified and even oxidized and get to be harder than both of the
reaching surfaces, accordingly bringing about abrasive wear of both the surfaces. The eroded
particles might likewise be presented from outside like soil from outside the framework.
There are diverse instruments of wear which work amid the rough wear, bringing about
evacuation of material. These systems are:
(a) Fatigue (b) fracture and (c) melting
The procedure of abrasion is complex and accordingly is a mix of the considerable number of
systems working at the same time. The abrasion process includes ploughing, cutting, wedge
formation, micro fatigue and micro cracking.
ADHESIVE WEAR:
Adhesive wear happens when two surfaces are in close contact with one another. In
Adhesive wear, a confined holding happens between the strong surfaces in contact, which brings
about the exchange of material starting with one surface then onto the next or loss of material
from both the surfaces. Anyhow, this wear obliges a nearby contact between the communicating
strong surfaces. Adhesive wear brings about arrangement of seizures, unpleasant and torn
surfaces.
20 | P a g e
SURFACE FATIGUE WEAR:
Fatigue is the failure caused by dynamic loading. Repeated loading can bring about wear
as well. In this way the surface wear which is because of break emerging from material weariness
is characterized as surface weakness wear. A network of micro cracks is formed below the
material surface due to the dynamic loading. At the point when these splits are subjected to cycles
of repeated loading and unloading, they propagate. After reaching the critical size, these
subsurface micro cracks grow rapidly and emerge at the surface, thus resulting in removal of flat
sheets of detached particles. The presence of the well-used out surface incorporates sharp and
angular edges around the pits framed.
COROSSIVE WEAR:
Corrosion is the degradation of a material because of some physiochemical responses
with the encompassing environment. Corrosive wear may be characterized as the progressive
weakening of an unprotected metal surface because of communications with the encompassing
media, similar to salts, acids and gasses. Thin films are formed on the material surface because
of distinctive tribochemical responses. Metals for the most part respond with oxygen to shape
oxides. These oxides shape a layer over the metal and may bring about the development of layers
of scales at first glance, as the interfacial bond in low with the basic metal or composite. The
surface comprises of unpleasant pits, miseries, holes. Corrosive wear is unsafe as it may bring
about complete disintegration of the metal.
EROSION WEAR:
Erosive wear can be characterized as metal removal because of impingement of strong
particles on the material surface. The solid particles which impact the surface is at some velocity
and thus possess momentum and kinetic energy. On striking the surface the particles dissipate
their momentum and energy to the material surface bringing about the removal of material and
formation of grooves. Erosion may be brought about by strong particles or even by a gas or a
fluid, which could possibly convey strong particles, impinging on a surface. The effect of the
erodent causes the wear to happen. Erosion wear brings about critical harm to auxiliary materials
if there should be an occurrence of sand blasting or in pipelines carrying slurry and thus should
be taken care of.

21 | P a g e
2.6 Strengthening mechanisms in PRMMCs:
Even with using particles which have superior properties, it is not possible to effectively
transfer the load from the matrix to it through the interface. So, for explaining the strengthening
of MMCs due to particle inclusion, a simple concept based on stress transfer mechanisms cannot
be solely employed.
1. Strain hardening
The dramatic increase in the number of dislocation-dislocation interactions facilitates strain
hardening which reduces dislocation mobility. So, larger stresses are required for further
deformation to take place. Thus, it increases the strength and hardness of the composites. The
variation of strength of metal crystals as a function of dislocation density is shown in the figure
below.
2. Grain boundary strengthening
This strengthening occurs when the grain boundary operates as a barrier to the motion of glide
dislocations. In PRMMCs, the particles inhibit the grain growth of the matrix by pinning down
of dislocations at the grain boundaries. So grain refinement occurs which enhances both the
strength and toughness of the composite.
3. Solid solution strengthening
The restriction of dislocation movement due to the presence of solute atoms constitutes solid
solution strengthening which usually occurs in matrix alloys. Interaction occurs between the
strain fields of the solute atoms and the dislocations present in the lattice.
4. Precipitation hardening
Precipitates nucleate in the matrix alloy when the solute concentration exceeds the solubility
limit. These precipitates obstruct the dislocation motion and thus strengthen the composite.
The nucleation and growth of these precipitates depend on the solutionizing temperature, cooling
rate and the ageing kinetics.
22 | P a g e
5. Dispersion strengthening
The particles act as a barrier to the dislocation motion and facilitates looping of the dislocation
around them. This is known as orowan bowing mechanism. Once a dislocation passes through
the particles, residual loops of dislocations are formed around each particle.
Orowan strengthening is given by Gb/l, where G is the modulus of rigidity of the matrix, b is the
Burgers vector, and l the particle spacing.
6. Aging
Age hardening or aging process, is a heat treatment process used to increase the high temperature
strength or yield strength of malleable or ductile materials, including most structural and
fundamental alloys of aluminium, magnesium, titanium, nickel and many stainless steels. The
crucial necessities of age hardening are second stage particles. These particles upset or repudiate
the movement of dislocations all through the entire lattice. You can figure out if second phase
particles will precipitate into solution or not from the solidus line on the phase diagram for the
secondary particles. Physically, such strengthening mechanism can be credited both to modulus
and size impacts, and to surface or interfacial energy. The vicinity of hard second stage particles
regularly causes lattice distortions. These lattice distortions give result when the precipitate
particles contrast from the host molecules in size and crystallographic structure. Bigger
precipitate particles prompts a compressive anxiety while smaller precipitate in a host lattice that
leads to a tensile stress. Dislocation defects present likewise make a stress field. Over the
dislocation there is a high compressive stress present and beneath there is a high tensile stress.
Different Aging Techniques:
Natural Aging:
Aging of a material, in which room temperature is taken as aging temperature, is referred as
natural aging.
Artificial Aging:
Artificial aging of a metal matrix composite (MMC) is the heat treatment at elevated temperatures
so as to get the changes in the chemical and mechanical properties of an alloy as a result of the
rolling, forging and casting process. Generally, the physical and chemical properties of newly
rolled, forged and cast metals artificially change and settle very slowly at room temperature.
Artificial aging will accelerate such changes more rapidly at elevated temperatures. This process
affirms accuracy and quality in close tolerance specifications. It also helps companies and
23 | P a g e
manufacturers make the machine-ready parts available more quickly to machinists and
distributors.
2.7 Corrosion of Aluminum Alloys:
Numerous boat superstructures and fluid load holders are made of aluminum because of its low
weight and worthy quality. The most well-known aluminum alloys for utilization in corrosive
situations, for example, seawater are the 5xxx and 6xxx arrangement composites, which show
sufficient quality and amazing corrosion resistance. These arrangement are very suitable in
different marine structures, apparatus and port structures. Alloy 6063 is a heat treatable
aluminum-magnesium-silicon composite. It gives great blend of extrudability and mechanical
properties. It additionally reacts well to cleaning substance lighting up, anodizing and coloring
[22].
Ship cargo containers are presented to ocean environment. Not just the outside of the load
compartments are presented to corrosive environment, the inward compartments are likewise
presented to corrosive fluid media. Marine corrosion is a lasting issue to move vessel as well as
ports and anything kept in the ocean or presented to the ocean environment for a time of time.
Corrosion is a fundamental process which assumes an essential part in financial matters and
security.
The term 'aqueous corrosion' portrays most of the most troublesome issues experienced when
metal material is in contact with ocean water. Different techniques have been utilized to decrease
corrosion. A few procedures and systems have been produced to combat corrosion efficiency are
consistently being looked for after, as a consequence of extreme amount spent on corrosion every
year. The utilization of inhibitor for the control of corrosion of shore and seaward metal and
compounds which are in contact with the forceful marine environment is an acknowledged
practice [23].

24 | P a g e
Benzoate mixes offer fascinating conceivable outcomes for corrosion restraint and are
specifically noteworthy due to their protected utilization and high solvency in water. Corrosion
inhibitors appear to be appealing in view of their minimal effort and simple taking care of,
contrasted with other preventive strategies. Ordinarily inhibitors are mostly chemicals that
cooperate with a metallic surface, or the environment this surface is uncovered, giving the surface
a certain level of insurance. Inhibitors regularly work by adsorbing themselves on the metal
surface by framing a film and lessening corrosion.
Clearly, corrosion can't be kept away from, however its seriousness can be lessened to a lower
greatness.
Aluminum and its compounds are isolated into two wide classes, castings and fashioned or
mechanically worked items. The recent is subdivided into heat treatable and non-heat treatable
combinations, and into different structures delivered by mechanical working. The corrosion
resistance of metal aluminum is subordinate upon a defensive oxide film. This film is stable in
fluid media when the pH is between around 4.0 and 8.5. The oxide film is normally self-
recharging and incidental scraped spot or other mechanical harm of the surface film is quickly
repaired.
Various transformation coatings have been created with their fundamental reason not just being
the insurance of aluminum from consumption additionally the change of paint grip. A standout
amongst the most broadly utilized pretreatments in the aeronautic trade is the chromium (VI)
based Alodine 1200S offered by Henkel. It gives a double capacity of going about as an against
destructive layer and enhancing the grip of paints and cements. Grilli et al have reported that the
disappointment of a lap shear joint collected from an Alodine covered substrate of 6xxx
composite and an epoxy glue is basically binding in the cement stage [6]. Moreover, Alodine
1200S is stable more than an extensive variety of pH, and gives the substrate a low surface
electrical resistance, this being a vital component for aviation applications [24].
25 | P a g e
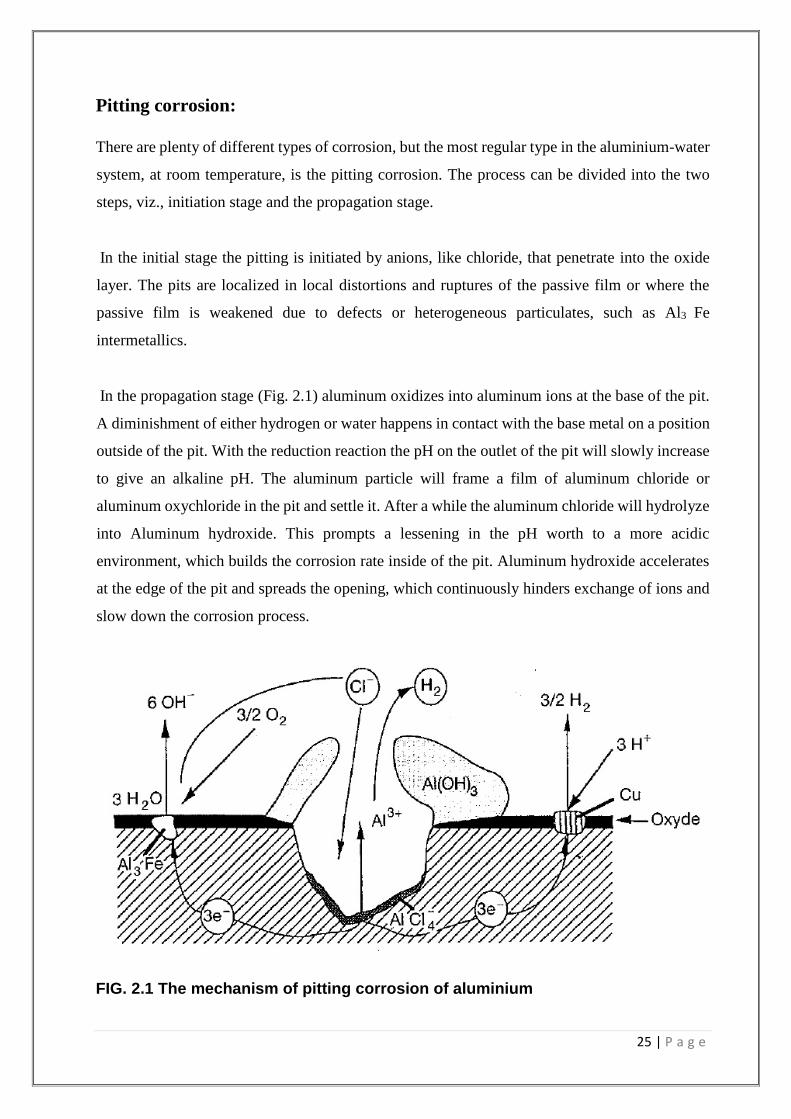
Pitting corrosion:
There are plenty of different types of corrosion, but the most regular type in the aluminium-water
system, at room temperature, is the pitting corrosion. The process can be divided into the two
steps, viz., initiation stage and the propagation stage.
In the initial stage the pitting is initiated by anions, like chloride, that penetrate into the oxide
layer. The pits are localized in local distortions and ruptures of the passive film or where the
passive film is weakened due to defects or heterogeneous particulates, such as Al3 Fe
intermetallics.
In the propagation stage (Fig. 2.1) aluminum oxidizes into aluminum ions at the base of the pit.
A diminishment of either hydrogen or water happens in contact with the base metal on a position
outside of the pit. With the reduction reaction the pH on the outlet of the pit will slowly increase
to give an alkaline pH. The aluminum particle will frame a film of aluminum chloride or
aluminum oxychloride in the pit and settle it. After a while the aluminum chloride will hydrolyze
into Aluminum hydroxide. This prompts a lessening in the pH worth to a more acidic
environment, which builds the corrosion rate inside of the pit. Aluminum hydroxide accelerates
at the edge of the pit and spreads the opening, which continuously hinders exchange of ions and
slow down the corrosion process.
FIG. 2.1 The mechanism of pitting corrosion of aluminium

26 | P a g e
2.8 Uses of Aluminum and their alloys:
Automobile Industry:
• Aluminum is an ideal metal to replace heavier metals in cars owing to its characteristic
properties like good formability, corrosion resistance, high strength, high stiffness to
weight ratio, and recycling properties.
• It is used in power-train, chassis body structure and air-conditioning. Wrought aluminum
is gaining its purpose in heat shields, bumper reinforcements, air-bag housings, pneumatic
systems and seat frames.
• The high strength to weight ratio is the prime reason for its use in the automotive sector
as it leads to less fuel consumption.
• Aluminium-Magnesium alloys are used in disc brakes, forged wheels which experience
extreme loading conditions [13].
Aircraft Industry:
• Aluminum, alloys with different element and finds its application in high working
temperature and also in the low temperature region of highly loaded parts with high
resistance to corrosion under stress.
Space equipment:
• High values of specific strength and its high rigidity provides high longitudinal stability,
which enables it to be used in tanks, inner tank and casing of the rocket.
Structural Applications:
• Light weight and corrosion resistance makes it an ideal choice for its use in structural
applications.
• The extrusion fabrication process helps it possible to increase the geometrical property of
the entire cross-section by designing a shape that simultaneously gives the lowest weight
and the most structural efficiency.
• It is easy to obtain stiffened shapes without using built-up sections, thus avoiding welding
or bolting.
• Lightness helps it easy to have simpler erection, transport of fully fabricated components
and reduction of the load transmitted to foundations.
• Al-Mg alloys are used in electrical contact resistors [14].
Aluminum also is used for packaging, in containers (beverage cans).
Aluminum is also used in cryogen conditions in contact with liquid H2O, H2 and He.

27 | P a g e
Chapter3
EXPERIMENTAL
SET UP AND METHODOLOGY
• Introduction
• Sample Preparation
• Wear test
• Stereo Microscope
• Profilometer
• Aging Experiment
• Corrosion Experiment

28 | P a g e
EXPERIMENTAL SET UP AND METHODOLOGY
3.1 Introduction:
This chapter deals with the details of the experimental techniques followed in this study.
An Aluminium-3%Magnesium-10% silicon carbide alloy block of dimension 100mm x 100mm
x 30mm is prepared by stir casting route in an induction heating furnace.
Three cylindrical samples of diameter 10mm and a height of 30 mm were cut from the block
using a highly calibrated lathe machine for the wear test. Wear behaviour of these samples was
studied by conducting several wear tests on computerized Ducom friction and wear monitor pin
on-disc wear test machine. The microstructures of the damaged/worn samples and the crack
morphology of the surfaces were observed under Stereoscope. Profilometric studies were done
to study the surface roughness.
Then five samples were sliced from the main sample for the aging treatment. The composite was
solution treated at a temperature of 250 C for 1hr and then aged at four different temperatures
viz. 120 C, 150 C, 180 C, and 220 C to study the aging behaviour of the composite. The micro
hardness was measured with the Microvicker’s hardness testing machine. Then SEM and XRD
analysis is done to get the details of the phases present.
A slice of the composite sample is kept in sea water for 6 weeks (42 days) and the weight loss
was measured with the help of an electronic weighing machine in every 7 days to study the
corrosion behaviour. Then the SEM analysis is done to get the corrosion mechanism.
The following gives a detailed overview of the steps taken for different tests.
3.2 Sample Preparation:
The Al-3Mg-10SiC composite has been fabricated by using stir casting technique. A modified
stir casting technique for preparation of the Al-Mg alloy is designed using low cost scrap Mg,
using a plunger for making the alloy addition. A mild steel cylinder container is coated with
aluminium and used to hold the aluminium melt. A hollow spindle which has its stirrer blades
attached to motor and V-belt arrangement for better stirring. The plunger rod is attached to
perforated capsule which holds the magnesium. Aluminium blocks are melted in the crucible at
temperature of 800oC and stirred at 500 rpm. Magnesium turnings are added one after another
through the hollow spindle. The magnesium is released after the aluminum foil coating melts and
the Mg dissolves in 15 seconds. Then the reinforcement SiC particles are added in the similar
manner. The melt is poured into moulds and cooled. Then samples of the required dimensions
are cut for the wear and other tests.
29 | P a g e
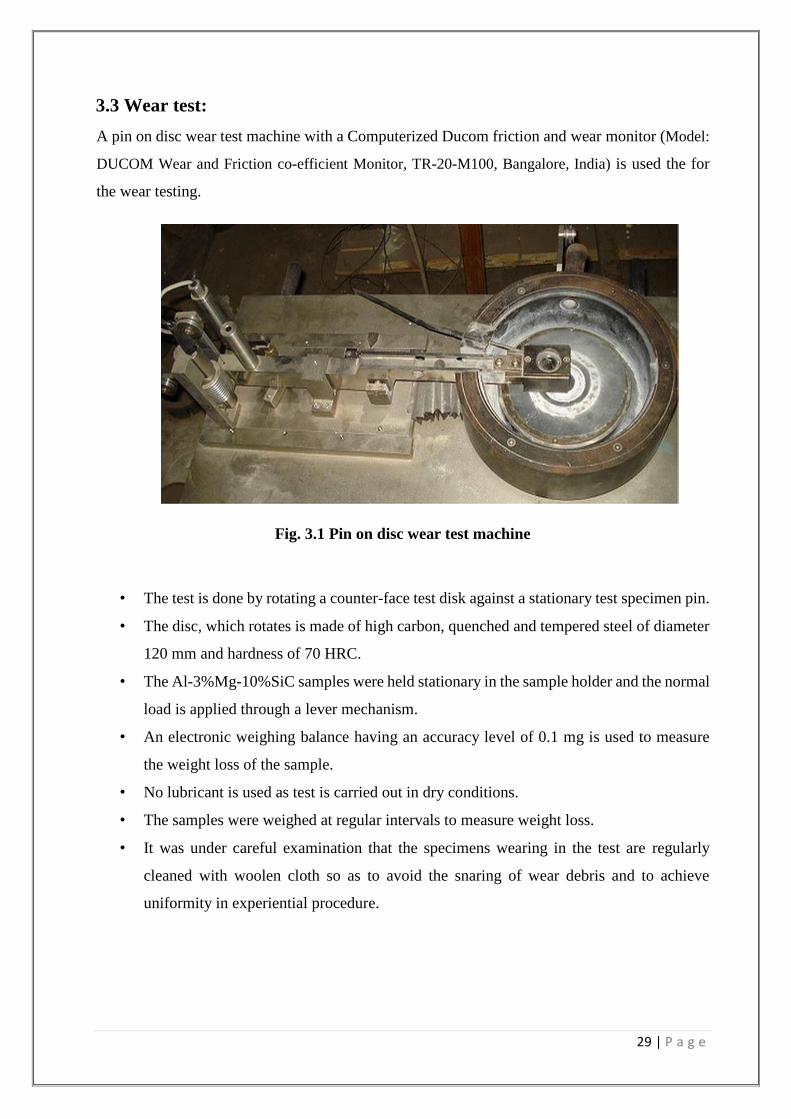
3.3 Wear test:
A pin on disc wear test machine with a Computerized Ducom friction and wear monitor (Model:
DUCOM Wear and Friction co-efficient Monitor, TR-20-M100, Bangalore, India) is used the for
the wear testing.
Fig. 3.1 Pin on disc wear test machine
• The test is done by rotating a counter-face test disk against a stationary test specimen pin.
• The disc, which rotates is made of high carbon, quenched and tempered steel of diameter
120 mm and hardness of 70 HRC.
• The Al-3%Mg-10%SiC samples were held stationary in the sample holder and the normal
load is applied through a lever mechanism.
• An electronic weighing balance having an accuracy level of 0.1 mg is used to measure
the weight loss of the sample.
• No lubricant is used as test is carried out in dry conditions.
• The samples were weighed at regular intervals to measure weight loss.
• It was under careful examination that the specimens wearing in the test are regularly
cleaned with woolen cloth so as to avoid the snaring of wear debris and to achieve
uniformity in experiential procedure.

30 | P a g e
• The tests were done by varying one among the below mentioned parameters and
keeping the other parameters constants:
1) time
2) applied load
3) sliding speed
4) sliding distance
Stereo microscope was used to analyze the crack morphology of the worn surfaces of sample.
3.4 Stereo Microscope:
The stereo microscope is a type of optical microscope and does not uses transmitted light instead
uses light reflected from the surface of an object. The instrument uses two different optical paths with
different objective and eyepieces to give different angles to the right and left eyes. This arrangement
gives a 3-D visualization of the sample being tested. The difference between the light microscope
and stereo microscope is that stereo microscope uses reflected light whereas light microscope uses
transmitted. The reflected light allows experimentation on specimens that would otherwise be too
opaque or too thick for microscopy.
Fig. 3.2 Stereo microscope of Physical Metallurgy Lab, NIT Rourkela
Then the Profilometer was used to analyze the roughness of the worn surfaces of the sample.

31 | P a g e
3.5 Profilometer:
Profilometer is used to study surface roughness of the worn samples. An amplified plot of the
surface profile was generated with some average parameters such as Ra.
Fig. 3.3 Stylus Profilometer VeecoDektat,
Electrometallugy Lab, NIT Rourkela
Stylus Profilometer is basically used in industries and research work to measure surface finish. The
Profilometer have been in use in research and industries for a very long time. Originally an amplified
plot of the surface profile was generated with some average parameters such as Ra. These parameters
were obtained by means of a suitable meter and a simple electronic circuit. By the end of 1970 digital
computers were added, and the data acquisition system revolutionized. A large varieties of data were
obtained upon digitization.
Stylus
One of the most basic component in stylus Profilometer is the stylus, a tip which actually grazes
the surface and act as a sensor. It acts in the same as skin, eyes, etc. as an interface between the
outer environment and the brain. Stylus tip material, form, size and force are the important
parameters in this case.
Gauge
The interface between the stylus and the inner electronics is known as gauge in technical terms.
Gauge contains some crucial electronics that control the tracking force and sends a feedback as
a result of any changes in roughness that helps the stylus tip to move over the surface without
damaging itself. The gauge gives an output that amplifies and demodulates the electronic signals.
It then converts the digital signal to user comprehensible language and stores the result for
analysis.
Stylus
Stylus
32 | P a g e
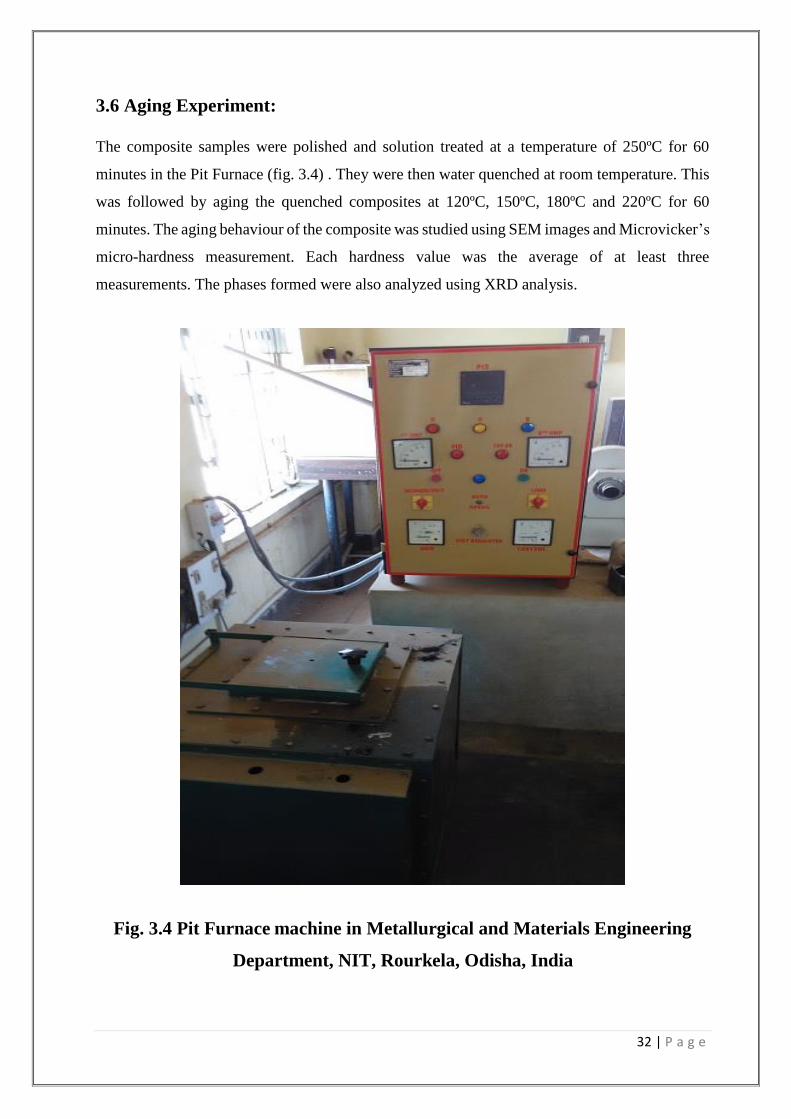
3.6 Aging Experiment:
The composite samples were polished and solution treated at a temperature of 250ºC for 60
minutes in the Pit Furnace (fig. 3.4) . They were then water quenched at room temperature. This
was followed by aging the quenched composites at 120ºC, 150ºC, 180ºC and 220ºC for 60
minutes. The aging behaviour of the composite was studied using SEM images and Microvicker’s
micro-hardness measurement. Each hardness value was the average of at least three
measurements. The phases formed were also analyzed using XRD analysis.
Fig. 3.4 Pit Furnace machine in Metallurgical and Materials Engineering
Department, NIT, Rourkela, Odisha, India
33 | P a g e
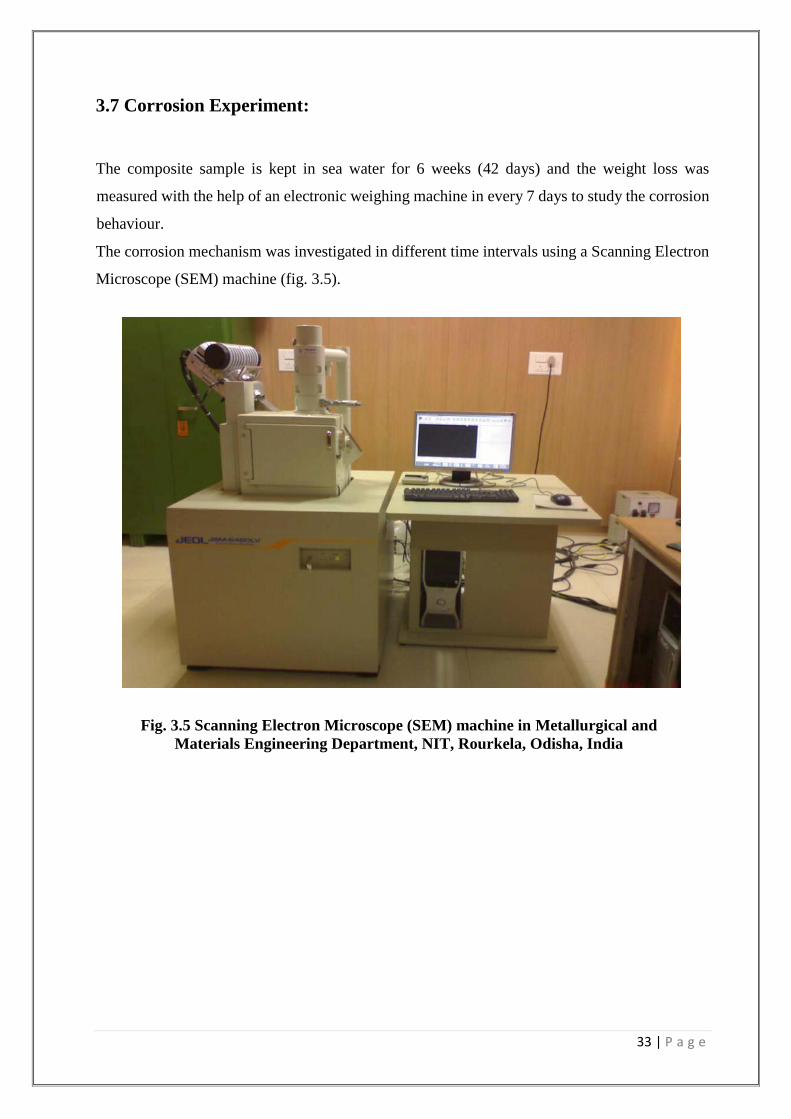
3.7 Corrosion Experiment:
The composite sample is kept in sea water for 6 weeks (42 days) and the weight loss was
measured with the help of an electronic weighing machine in every 7 days to study the corrosion
behaviour.
The corrosion mechanism was investigated in different time intervals using a Scanning Electron
Microscope (SEM) machine (fig. 3.5).
Fig. 3.5 Scanning Electron Microscope (SEM) machine in Metallurgical and
Materials Engineering Department, NIT, Rourkela, Odisha, India

34 | P a g e
Chapter4
RESULTS AND DISCUSSION
• Introduction
•Wear Test Analysis
Worn surface Microstructure
Aging behaviour Analysis
Corrosion behaviour Analysis
35 | P a g e
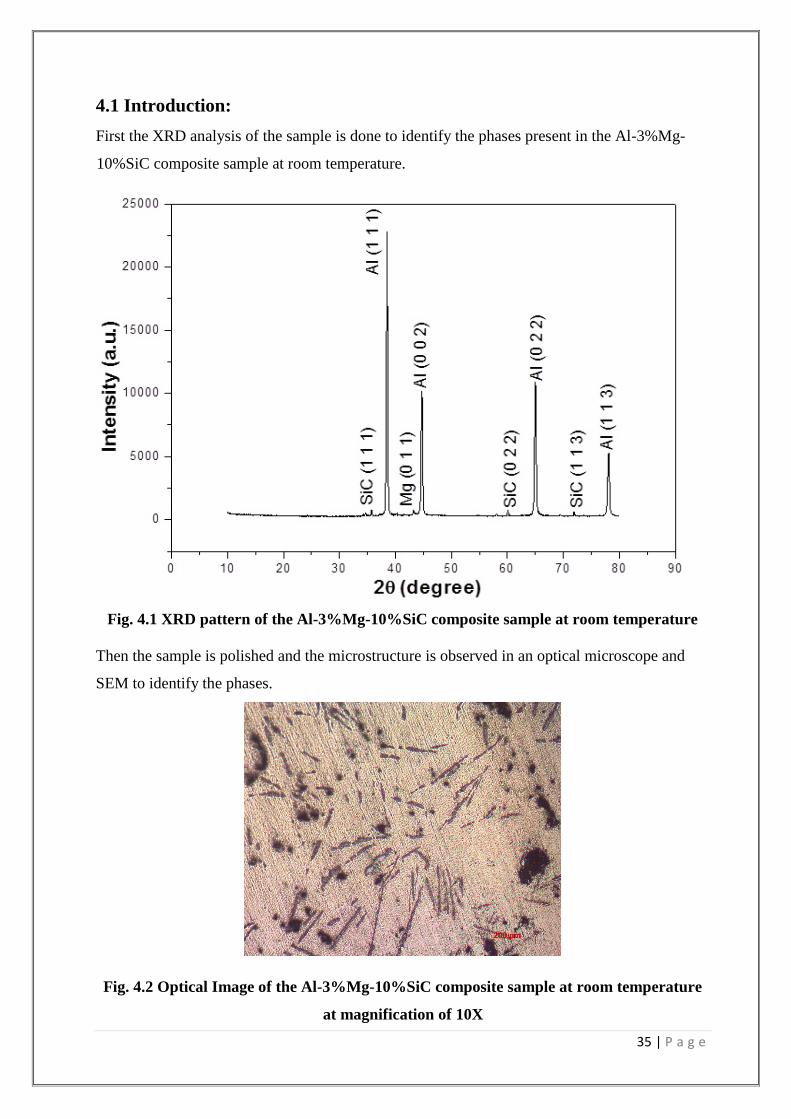
4.1 Introduction:
First the XRD analysis of the sample is done to identify the phases present in the Al-3%Mg-
10%SiC composite sample at room temperature.
Fig. 4.1 XRD pattern of the Al-3%Mg-10%SiC composite sample at room temperature
Then the sample is polished and the microstructure is observed in an optical microscope and
SEM to identify the phases.
Fig. 4.2 Optical Image of the Al-3%Mg-10%SiC composite sample at room temperature
at magnification of 10X

36 | P a g e
4.2 Wear Test Analysis:
The wear behaviour of the composite is investigated at r4.2oom conditions at four different
loads, 70N, 80N, 90N, 100N and with varying sliding speeds like 200, 300, 400, 500, 600, 700
rpms, using a pin-on-disk wear testing machine. The wt loss was measured using a weighing
machine. The track diameter was held constant at 90mm.
Following curves were plotted using the data.
The graph shows the variation in wear with sliding time at four different applied loads.
Fig. 4.3 Graph between cumulative weight loss and cumulative sliding time at
different applied loads like 70N, 80N, 90N. 100N
As the sliding time increases wt. of the sample decreases constantly which increases the
cumulative wt. loss. But at higher sliding time wear rate decreases.
Initially the surface becomes rough, so the sliding movement occurs in very small areas
at the peaks and over time the peaks break and the contact area is increased. So the
0
0.005
0.01
0.015
0.02
0.025
0.03
12 24 36 48 60 72 84
CU
MU
LA
TIV
E W
T L
OS
S (
GM
)
CUMULATIVE TIME (MIN)
WEAR W.R.T. VARYING APPLIED LOAD
100N
70N

37 | P a g e
flattening of the surface occurs, which leads to decrease in the co-efficient of friction and
wear at the higher sliding time. Thus sliding over a longer period of time leads to decease
in wear and loss of the metal.
As load increases, deeper grooves are created because of increased pressure and
temperature. So wt. loss is more leading to higher wear at higher loads.
Fig. 4.4 Graph between cumulative weight loss and applied load used in wear test
But as the applied load increases the rate of wt. loss decreases, leading to lower wear
rate. Because at higher loads the grooves become smooth and in dry condition which
can be observed from the optical micrograph of the worn surface. So there is a decrease
in co-efficient of friction leading to decrease in wear rate.
0
0.05
0.1
0.15
0.2
0.25
0.3
70 80 90 100
CU
MM
UL
AT
IVE
WT
. L
OS
S(G
M)
APPLIED LOAD(N)
WEAR W.R.T. APPLIED LOAD

38 | P a g e
Fig. 4.5 Graph between cumulative weight loss and sliding distance at different applied
loads like 70N, 80N, 90N. 100N
Fig. 4.6 Graph between cumulative weight loss and sliding time at different rpms like 200,
300, 400, 500, 600, 700
0
0.005
0.01
0.015
0.02
0.025
0.03
0.035
0.04
0.045
4 8 12 16 20 24 28
CU
MM
UL
AT
IVE
WT
LO
SS
(GM
)
TIME(MIN)
WEAR VS SLIDING SPEED AT LOAD=100N
700
600
500
400
300
200
RPM
0
0.005
0.01
0.015
0.02
0.025
0.03
0 500 1000 1500 2000 2500 3000 3500 4000
CU
MU
LA
TIV
E W
T L
OS
S (
GM
)
SLIDING DISTANCE (METER)
WEAR vs SLIDING DISTANCE
100N
90N
80N
70N

39 | P a g e
As the sliding distance and sliding speed increases, the amount of wear increases, but
the wear rate decreases at higher sliding distance and sliding speed. Because sliding
over long distances and at higher sliding speeds causes hardening of the surface layer
composition of the waste debris and reduces the wear rate.
Fig. 4.7 Graph between cumulative weight loss and sliding speed
Higher sliding speed leads to decrease in surface roughness, Decreased surface roughness and a
small quantity of wear debris decrease the co-efficient of friction. So wear rate decreases at higher
sliding speeds.
0
0.05
0.1
0.15
0.2
0.25
0.3
0.35
0.4
0.45
200 300 400 500 600 700
NE
T W
T.
LO
SS
(G
M)
SLIDING SPEED (RPM)
WEAR VS SLIDING SPEED

40 | P a g e
Fig. 4.8 Graph between surface roughness of the worn sample and applied load
The surface roughness of the worn surface were measured by using Profilometer and the
Ra value was plotted against varying applied load.
The increase in load leads to higher surface temperature leads to gradual flattening of the
protrusions, resulting in steady state and higher slide speed at high temperature, which
reduce the shear force, reduce the surface roughness as well as the co-efficient of friction.
0
2
4
6
8
10
12
14
16
18
20
70 80 90 100
RO
UG
HN
ES
S (
RA
IN
MIC
RO
ME
TE
R)
LOAD (N)
SURFACE ROUGHNESS VARIATION
41 | P a g e
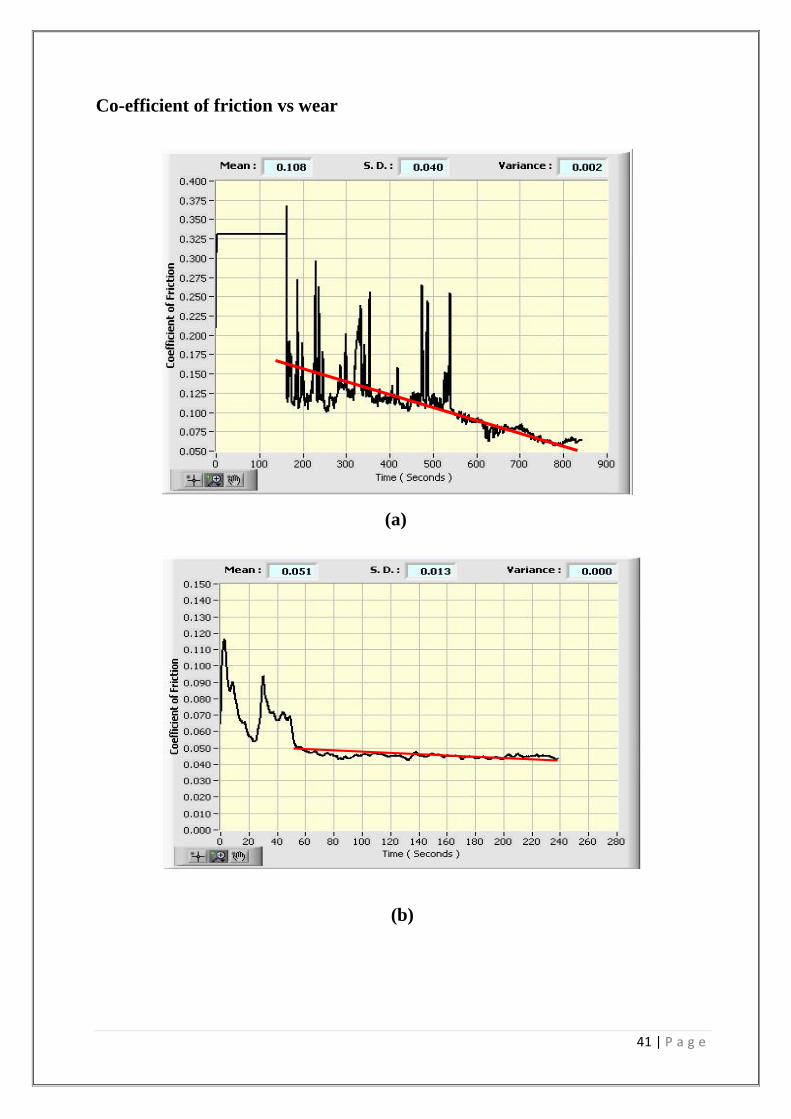
Co-efficient of friction vs wear
(a)
(a)
(b)
(b)

42 | P a g e
Fig. 4.9 Graph between co-efficient of friction and sliding time at different applied
loads like (a) 70N (b) 80N (c) 90N (d) 100N
Initially the surface becomes rough, so the sliding movement occurs in very small areas at the
peaks and over time the peaks break and the contact area is increased. So the flattening of the
surface occurs, which leads to decrease in the co-efficient of friction.
(c)
(c)
(d)
(d)
43 | P a g e
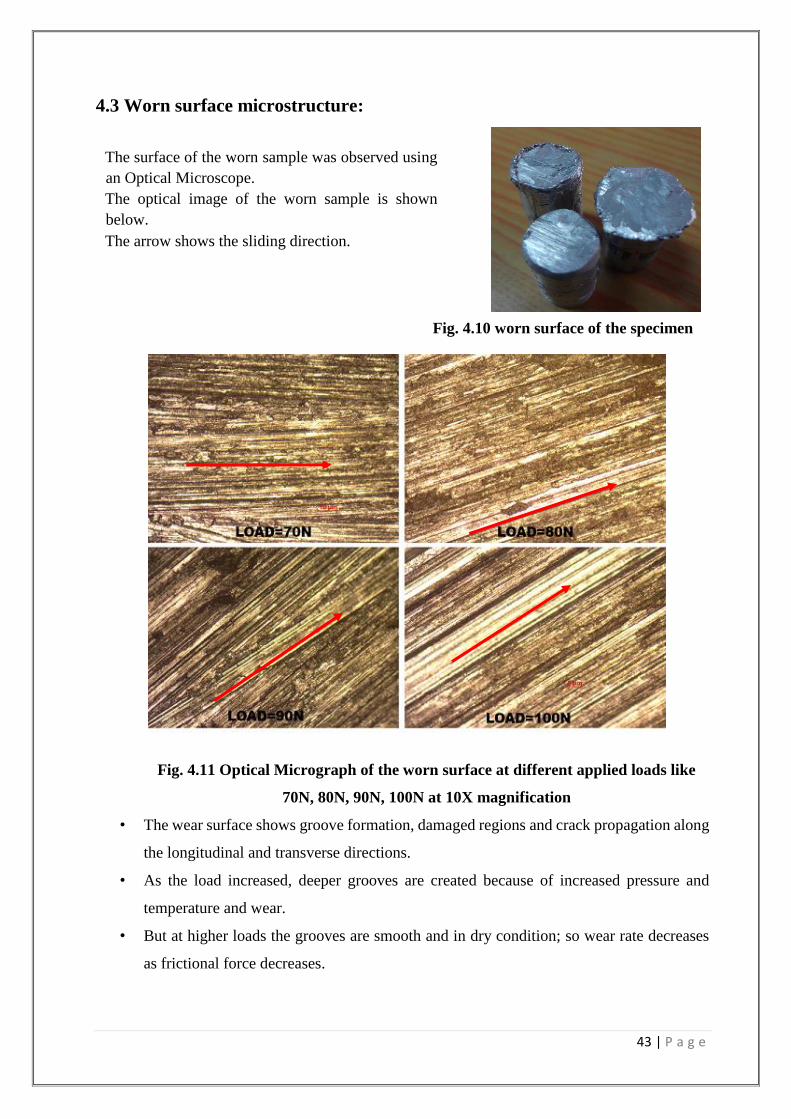
4.3 Worn surface microstructure:
Fig. 4.11 Optical Micrograph of the worn surface at different applied loads like
70N, 80N, 90N, 100N at 10X magnification
• The wear surface shows groove formation, damaged regions and crack propagation along
the longitudinal and transverse directions.
• As the load increased, deeper grooves are created because of increased pressure and
temperature and wear.
• But at higher loads the grooves are smooth and in dry condition; so wear rate decreases
as frictional force decreases.
Fig. 4.10 worn surface of the specimen
Worn surface of the specimen
The surface of the worn sample was observed using
an Optical Microscope.
The optical image of the worn sample is shown
below.
The arrow shows the sliding direction.

44 | P a g e
4.4 Aging analysis:
The composite samples were polished and solution treated at a temperature of 250ºC for 60
minutes. They were then water quenched at room temperature. This was followed by aging the
quenched composites at 120ºC, 150ºC, 180ºC and 220ºC for 60 minutes. The aging behaviour
of the composite was studied using XRD analysis, SEM images and Microvicker’s micro-
hardness measurement. Each hardness value was the average of at least three measurements.
The temperature for solution treatment was chosen to be 2500C from the Al-Mg phase diagram.
Fig. 4.12 The Al-Mg Phase Diagram
From the Al-Mg phase diagram it is clear that at 3% Mg we get a homogeneous Al phase at a
temperature more than around 2300C. This is the reason that 2500C is chosen as the solution
treatment temperature.
Then the sample was aged at different temperatures to get an increase in hardness by precipitation
hardening mechanism due to the formation of SiC precipitates at the grain boundaries.

45 | P a g e
4.4.1 SEM Analysis:
Fig. 4.13 SEM micrograph of The composite sample at room temperature
Aging temp=120 C
Hardness=90.8HV
Aging temp=150 C
Hardness=94.3HV (a)
(a)
(b)
(b) Fig. 4.14 SEM Image of the al-3%Mg-10%SiC composite sample solution treated at 250 C for 1hr.
and aged at four different temperatures showing Micro-vicker’s Hardness (a) 1200C (b) 1500C

46 | P a g e
The Microvicker’s hardness of the composite sample at room temperature is 67.4HV.
So at an aging temperature of 1200C, there is an increase in micro hardness value of the composite
due to the formation of more SiC precipitates as compared to the unaged sample.
The peak hardness value is observed at an aging temperature of 1500C. The reason is clear from
the SEM images. The SEM image of 1500C aging temperature shows the formation of maximum
no. of fine SiC precipitates. So the hardness is maximized due to precipitation hardening.
At the aging temperature of 180C there is a clear vision of grain growth of SiC particles which is
the prime reason of a sharp decrease in hardness value at 180C.
At the aging temperature of 220C the SiC particles start dissolving. So there is a decrease in the
no of SiC precipitates, which leads to a decrease in the hardness value.
Fig. 4.15 SEM Image of the al-3%Mg-10%SiC composite sample solution
treated at 250 C for 1hr. and aged at four different temperatures showing
Micro-vicker’s Hardness (c) 1800C (d) 2200C
Aging temp=180 C
Hardness=78.8HV
Aging temp=220 C
Hardness=82.3HV
(c)
(c)
(d)
(d)

47 | P a g e
4.4.2 XRD ANALYSIS:
Fig. 4.16 XRD analysis of the composite solution treated at 2500C for 1hr. and aged at
1200C
Fig. 4.17 XRD analysis of the composite solution treated at 2500C for 1hr. and aged at
1500C

48 | P a g e
The XRD analysis of the composite solution treated at 2500C for 1hr. and aged at 1200C and
1500C shows the formation of complex phases like Al0.95Mg0.05, which may be the reason for the
higher hardness value of the aged samples than the unaged ones.
Also Al0.95Mg0.05 may help in the formation of more no. of SiC precipitates at the grain
boundaries.
Fig. 4.18 XRD analysis of the composite solution treated at 2500C for 1hr. and aged at
1800C
The XRD analysis of the composite solution treated at 2500C for 1hr. and aged at 1800C does
not show any formation of complex phases like Al0.95Mg0.05, which may be the reason for lower
hardness value.

49 | P a g e
Fig. 4.19 XRD analysis of the composite solution treated at 2500C for 1hr. and aged at
2200C
The XRD analysis of the composite solution treated at 2500C for 1hr. and aged at 2200C shows
large intensity Al peaks. So the precipitates are dissolved in the large Al matrix, which may be
the reason for lower hardness value.
50 | P a g e
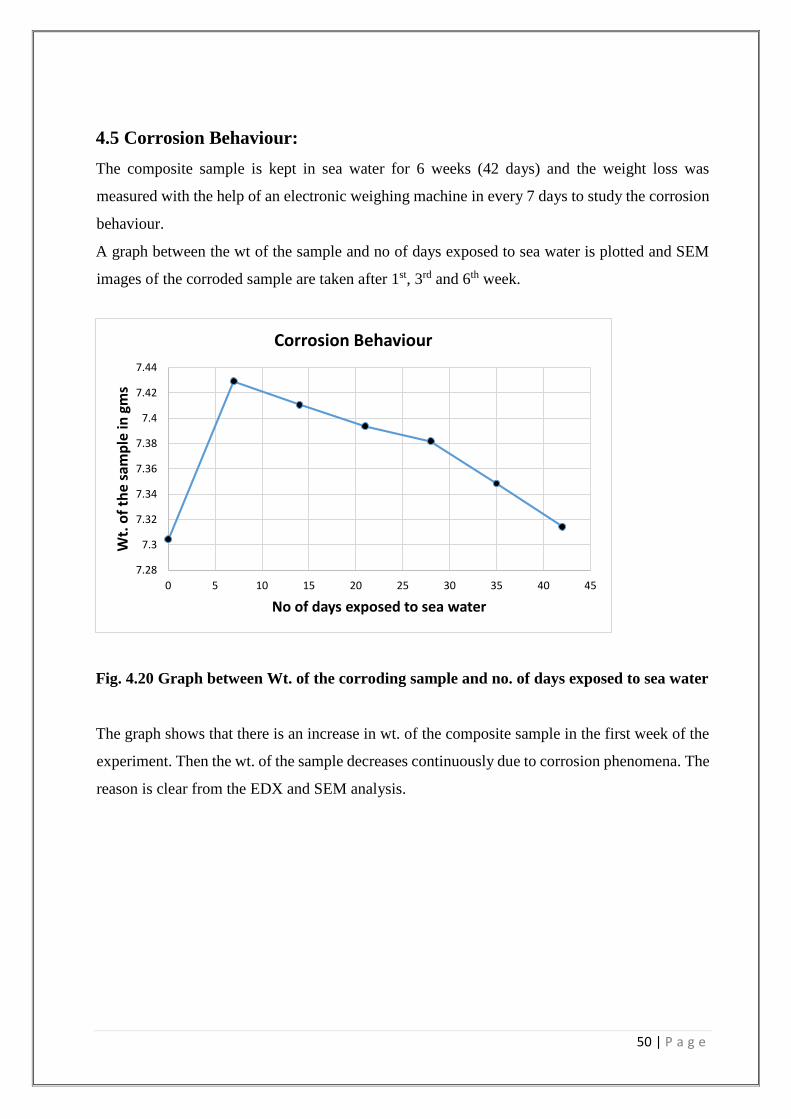
4.5 Corrosion Behaviour:
The composite sample is kept in sea water for 6 weeks (42 days) and the weight loss was
measured with the help of an electronic weighing machine in every 7 days to study the corrosion
behaviour.
A graph between the wt of the sample and no of days exposed to sea water is plotted and SEM
images of the corroded sample are taken after 1st, 3rd and 6th week.
Fig. 4.20 Graph between Wt. of the corroding sample and no. of days exposed to sea water
The graph shows that there is an increase in wt. of the composite sample in the first week of the
experiment. Then the wt. of the sample decreases continuously due to corrosion phenomena. The
reason is clear from the EDX and SEM analysis.
7.28
7.3
7.32
7.34
7.36
7.38
7.4
7.42
7.44
0 5 10 15 20 25 30 35 40 45
Wt.
of
the
sam
ple
in g
ms
No of days exposed to sea water
Corrosion Behaviour

51 | P a g e
4.5.1 EDX Analysis:
The EDX analysis of the normal composite only shows the presence compounds containing Al,
Mg, Si, whereas the EDX of the corroding sample conforms the formation of compounds
containing Sodium, Chlorine, Sulfur, Iron along with Al, Mg & Si on the composite sample
surface which is absorbed from the sea water. This is the prime reason for the increase of the wt.
of the composite after 1st week of the exposure to sea water.
The SEM image of the corroding surface also conforms the formation of a large amount of
compounds on the composite surface.
Element Weight% Atomic%
O K 17.65 26.59
Mg K 1.85 1.84
Al K 71.03 63.45
Si K 9.47 8.13
Totals 100.00
Element Weight% Atomic%
O K 49.23 62.56
Na K 0.01 0.01
Mg K 10.38 8.68
Al K 30.13 22.70
Si K 4.97 3.60
S K 1.45 0.92
Cl K 0.61 0.35
Fe K 3.23 1.17
Totals 100.00
Fig. 4.21 EDX analysis of normal composite
sample
Fig. 4.22 EDX analysis of the corroded sample
EDX analysis of the corroded sample
52 | P a g e
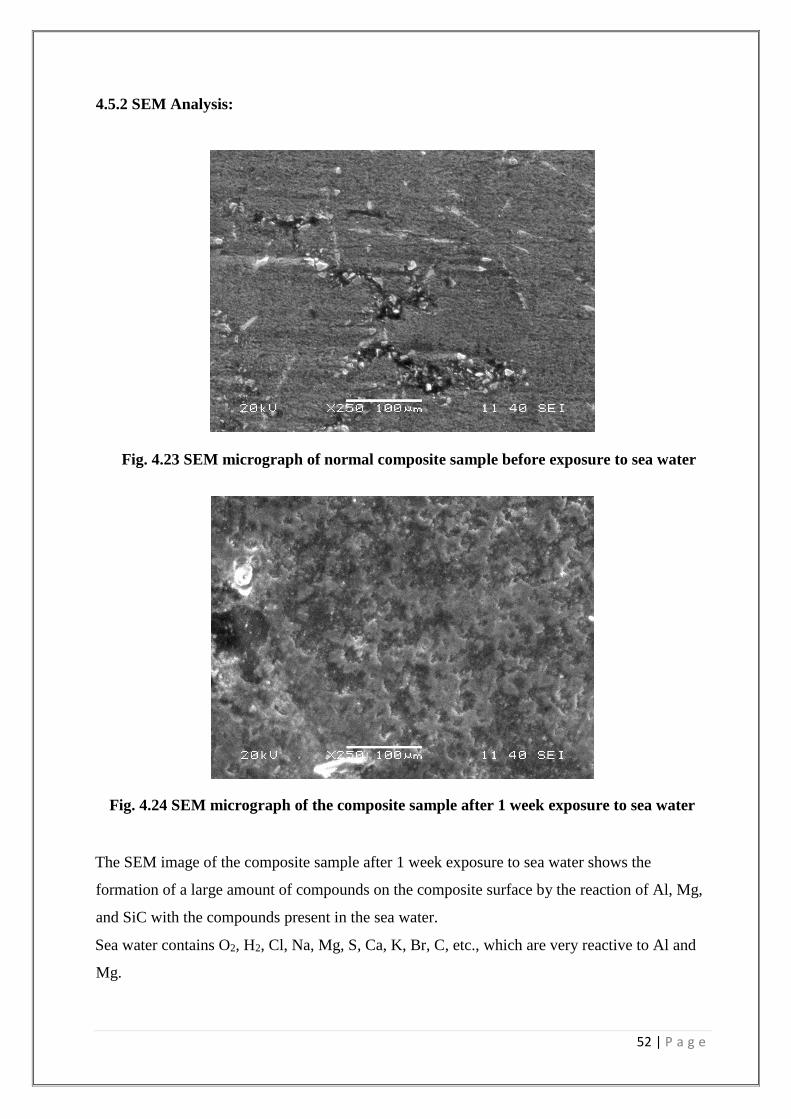
4.5.2 SEM Analysis:
The SEM image of the composite sample after 1 week exposure to sea water shows the
formation of a large amount of compounds on the composite surface by the reaction of Al, Mg,
and SiC with the compounds present in the sea water.
Sea water contains O2, H2, Cl, Na, Mg, S, Ca, K, Br, C, etc., which are very reactive to Al and
Mg.
Fig. 4.23 SEM micrograph of normal composite sample before exposure to sea water
Fig. 4.24 SEM micrograph of the composite sample after 1 week exposure to sea water

53 | P a g e
The wt. of the corroding sample decreases continuously after 1st week till 6th week. The SEM
micrograph of the composite sample after 3 weeks exposure to sea water shows that the
compounds formed due to the corrosive attack on the sample surface are removed continuously
causing wt. loss of the sample. Then fresh surface is exposed to the sea water for fresh attack.
The SEM image shows large corroded portions which are again exposed to fresh corrosive attack.
Fig. 4.25 SEM micrograph of the composite sample after 3 weeks exposure to sea water

54 | P a g e
The corroded portions initiate pits for the starting of pitting corrosion. Then the corrosive
elements present in the sea water like Na, Cl, S etc. attack around the pit boundary to form bigger
pits and more wt. loss.
Fig. 4.26 SEM image of the sample kept in sea water after 6 weeks showing pitting corrosion
Fig. 4.27 Enlarged view of a pit showing pitting corrosion

55 | P a g e
Chapter 5
CONCLUSIONS
• Conclusions
• Scope for Future Work

56 | P a g e
CONCLUSIONS
• In the initial stage of sliding time and sliding distance the weight loss suffered by the
material almost increases linearly and continuously with increasing sliding time and
sliding distance, indicating a completely steady-state behavior.
• But sliding for long time and sliding over long long distances causes hardening of the
surface layer compounds of the waste debris and decreases the wear rate.
• As load increases, deeper grooves are created because of increased pressure and
temperature. So wt. loss is more leading to higher wear at higher loads. But as the applied
load increases rate of wt. loss decreases leading to lower wear rate. Because at higher
loads the grooves become smooth and in dry condition.
• Al-3%Mg-10%SiC composites possess improved wear resistance and hardness value as
compared with unreinforced Al-Mg alloy during sliding. Improved wear and abrasion
resistance of composites can be credited to the presence of hard SiC particles which
reduce the ability or propensity for material flow at the metal surface.
• Increase in the sliding time, sliding speed, applied loading, and sliding over very long
distances, reduce wear rate. Thus, maintaining an appropriate sliding speed and normal
applied load levels can reduce co-efficient of friction, i.e., frictional force, wear and
improve the mechanical properties.
• SiC improves the elevated or high temperature strength and hardness of the alloy.
• Furthermore, SiC particles in the matrix act as pinning points to hold the wear debris
particles on the wear surface, and due to this some of the debris get accumulated around
these SiC particles. All these facts result in less wear in the Al-Mg-SiC composite as
compared to the unreinforced Al-Mg alloy.
• Because of improved high temperature strength, resistance to plastic flow of matrix on
worn surface and subsurface, this composite exhibits higher load pressure as compared to
the alloy.
• Age hardening process increased the hardness of the Al-Mg-SiC composite significantly
by the formation of more no. of SiC precipitates.
• Peak hardness was observed at the ageing temperature of 1500C because of the formation
of maximum no. of SiC precipitates on the Al-Mg matrix.
• At a temperature of 180 C and more the sample was observed to be over aged leading to
grain growth of the SiC precipitates and thus showed lower hardness value.
57 | P a g e
• The composite was found more prone to pitting corrosion when it was exposed to sea
water containing O2, H2, Cl, Na, Mg, S, Ca, K, Br, C, etc.
SCOPE FOR FUTURE WORK
Erosion wear behaviour of the Aluminium-3%Mg-10%SiC Metal Matrix Composite
(MMC) sample.
Effect of different corrosive media on the corrosion behaviour of the Aluminium-
3%Mg-10%SiC Metal Matrix Composite (MMC) sample.
Effect of temperature on the wear and corrosion behaviour of the Aluminium-3%Mg-
10%SiC Metal Matrix Composite (MMC) sample.

58 | P a g e
References
59 | P a g e
References
[1] T. S. Srivatsan, T. S. Sudarshan, and E. J. Lavernia. "Processing of discontinuously-
reinforced metal matrix composites by rapid solidification.” Progress in Materials Science 39,
no. 4 (1995): p. 317-409.
[2] K. Dash, B. C. Ray, and D. Chaira. "Synthesis and characterization of copper–alumina
metal matrix composite by conventional and spark plasma sintering." Journal of Alloys and
Compounds 516 (2012): p. 78-84.
[3] M. Gupta, S. Qin, and L. W. Chin. “Effect of particulate type on the microstructure and
heat-treatment response of Al-Cu based MMCs”, Journal of material processing and
technology, 65 (1997): p. 245-251.
[4] M. E. Smagorinski, P. G. Tsantrizos, S. Grenier, A. Cavasin, T. Brzezinski, and G. Kim.
"The properties and microstructure of Al-based composites reinforced with ceramic particles."
Materials Science and Engineering: A 244, no. 1 (1998): p. 86-90.
[5] Comprehensive of composite materials, volume 6, chapter 6.05, “Metal matrix composites”.
[6] J. S. Shelley, R. LeClaire, and J. Nichols. "Metal-matrix composites for liquid rocket
engines." Journal of Metals 53, no. 4 (2001): p. 18-21.
[7] M. M. Sharma, M. F. Amateau, and T. J. Eden. "Aging response of Al–Zn–Mg–Cu spray
formed alloys and their metal matrix composites." Materials Science and Engineering: A 424,
no. 1 (2006): p. 87-96.
[8] M. K. Surappa, "Aluminium matrix composites: Challenges and opportunities." Sadhana 28,
no. 1-2 (2003): p. 319-334.
[9] S. Naher, D. Brabazon, and L. Looney. "Development and assessment of a new quick quench
stir caster design for the production of metal matrix composites." Journal of Materials Processing
Technology 166, no. 3 (2005): p. 430-439.
[10] Adel Mahamood Hassan, Abdalla Alrashdan, Mohammed T. Hayajneh, Ahmad Turki
Mayyas. “Wear behavior of Al–Mg–Cu–based composites containing SiC particles” Tribology
International 42 (2009): p. 1230–1238.
[11] Sharmilee Pal, R. Mitra, V. V. Bhanuprasad, “Aging behaviour of Al–Cu–Mg alloy–SiC
composites, Materials Science and Engineering.” A 480 (2008): p. 496–505.
[12] Kaufman J. Gilbert, Rooy Elwin L. “Aluminium alloy casting: Properties, Process and
Applications.” ASM International, December 2004.

60 | P a g e
[13] Miller W.S. , Zhuang L. , Bottema J. , Wittebrood A.J. , Smet P. De , Haszler A. ,
“Vieregge A. Recent development in aluminium alloys for the automotive industry.” Materials
Science and Engineering A280 (2000): p. 37–49.
[14] Mazzolani Federico, “Aluminium alloy structures.” London: Chapman & Hall, 1995.
[15] Surappa M. K. “Aluminium matrix composites: Challenges and Opportunities.” Sadhana
Vol. 28, Parts 1 & 2, February/April 2003: p. 319–334.
[16]- Si-wei Zhang, “Tribology of elastomers.” Elsevier, 2004: p. 2.
[17] Horst Czichos, “Tribology: a systems approach to the science and technology of friction,
lubrication and wear.” Elsevier, 2009: p. 11.
[18] Williams John Austin, “Engineering Tribology.” New York, Cambridge University
Press, 2005: p. 165.
[19] Soda N., “Wear of some F.F.C metals during unlubricated sliding part-1.Effects of load,
velocity and atmospheric pressure on wear.” Wear. Volume33, (1975): p. 1-16.
[20] Burwell J.T. and Strang C.D, “Metallic wear.” Proc. Soc (London), 212A May 1953:
p. 470-477.
[21] Burwell J .T. “Survey of possible wear mechanisms.” Wear. Volume1, (1957/58):
p. 119-141.
[22] A. Pardo, M.C. Merino, A.E. Coy, R. Arrabal, F. Viejo, E. Matykina, “Corrosion
behaviour of magnesium/aluminium alloys in 3.5 wt.% NaCl” Corrosion Science 50 (2008):
p. 823–834.
[23] Rajan Ambat, Naing Naing Aung, W. Zhou, “Evaluation of microstructural effects on
corrosion behaviour of AZ91D magnesium alloy.” Corrosion Science 42 (2000): p. 1433-1455.
[24] W. B. Wan Nik, O. Sulaiman, A. Fadhli, R. Rosliza, “Corrosion behaviour of aluminum
alloy in seawater.” The International Conference on Marine Technology 11-12 December
2010, BUET, Dhaka, Bangladesh.