master thesis _ factors affecting customer loyalty
TRANSCRIPT

1 | P a g e
Geneva Business School
Master Program in International Management
Factors affecting customer loyalty
(Within Saudi Mobile Telecommunication Industry)
Authors:
Mohamed Ali Salem, 343
Supervisor: Prof. Mokhtar Al Hashmi

2 | P a g e
Acknowledgements
It’s a pleasure to present our sincere thanks to all people who supported us to accomplish this
thesis through their time , effort and motivited words. also we express our appreciation to our
supervisor Prof. Mokhtar Al Hashmi for his time, valued advices and helpful guidance.
We would like to thank all the students in Geneva Business School, who participated in the
survey, without precious replies to the questionnaire we undoubtedly cannot achive this stage.
Thank you all for your help and valuable time and your motivation make us ambitious to complete
that way to next achievement.

3 | P a g e
Table of contents
Acknowledgements ..................................................................................................................................... 2
CHAPTER 1: Introduction ............................................................................................................................ 7
1.1. Introduction ...................................................................................................................................... 7
1.2. Research Background ........................................................................................................................ 7
1.3. Research Model ................................................................................................................................ 9
1.4. Statement of the Problem: ............................................................................................................... 9
1.5. Aim of the Study ............................................................................................................................. 11
1.6. Research Questions ........................................................................................................................ 11
1.7. Significant of the study ................................................................................................................... 12
1.8. Structure of the thesis .................................................................................................................... 12
1.9. Scope, Assumptions, and Limitations of the Study ......................................................................... 13
1.10. Definition of terms .......................................................................................................................... 14
CHAPTER 2: Literature review ................................................................................................................. 15
2.1. Introduction .................................................................................................................................... 15
2.2. Relationship Marketing ................................................................................................................... 15
2.3. Service quality ................................................................................................................................. 16
2.4. Price perception .............................................................................................................................. 18
2.5. Trust ................................................................................................................................................ 19
2.6. Satisfaction ...................................................................................................................................... 21
2.7. Customer loyalty ............................................................................................................................. 22
CHAPTER 3: Methodology ........................................................................................................................ 24
3.1. Introduction .................................................................................................................................... 24
3.2. Research Method ............................................................................................................................ 24
3.3. Research Design .............................................................................................................................. 25
3.3.1. Research Model .............................................................................................................................. 25
3.4. Population ....................................................................................................................................... 26
3.5. Sampling plan .................................................................................................................................. 26
3.6. Questionnaire Design ...................................................................................................................... 26
3.7. Reliability ......................................................................................................................................... 27
CHAPTER 4: Presentation of Data/Empirical Data ................................................................................ 28
4.1. Introduction .................................................................................................................................... 28

4 | P a g e
4.2. Sampling analysis ............................................................................................................................ 28
4.2.1. Respondents’ Nationality ................................................................................................................ 28
4.2.2. Respondents’ Age ........................................................................................................................... 29
4.2.3. Respondents’ Gender ..................................................................................................................... 29
4.2.4. Respondents’ Occupation ............................................................................................................... 30
4.2.5. Respondents’ Operator ................................................................................................................... 31
4.2.6. Respondents’ multiple Cell Numbers ............................................................................................. 32
4.2.7. Secondary Mobile network Operator ............................................................................................. 33
4.2.8. Home Network Operator ................................................................................................................ 34
4.2.9. Respondents’ Package .................................................................................................................... 34
4.2.10. Years of Using the Line .................................................................................................................... 35
4.2.11. Factors affecting selection for Cell network ................................................................................... 36
4.2.12. Respondents’ Change behavior ...................................................................................................... 37
CHAPTER 5: Analysis of Data ................................................................................................................... 39
5.1. Introduction .................................................................................................................................... 39
5.2. Statistical Analysis ........................................................................................................................... 39
5.3. Data Reliability ................................................................................................................................ 39
5.4. Reliability Statistics ......................................................................................................................... 39
5.5. Frequencies ..................................................................................................................................... 40
5.5.1. Service quality ................................................................................................................................. 40
5.5.2. Price ................................................................................................................................................ 41
5.5.3. Value offered .................................................................................................................................. 43
5.5.4. Trust ................................................................................................................................................ 44
5.5.5. Satisfaction ...................................................................................................................................... 45
5.5.6. Customer Loyalty ............................................................................................................................ 46
CHAPTER 6: Discussion and Interpretation of Findings ........................................................................ 48
6.1. Introduction .................................................................................................................................... 48
6.2. Finding ............................................................................................................................................. 48
6.2.1. Findings from sampling analysis ..................................................................................................... 48
6.2.2. Finding of the survey results ........................................................................................................... 48
CHAPTER 7: Conclusion ............................................................................................................................. 50
7.1. Introduction: ................................................................................................................................... 50
7.2. Conclusion ....................................................................................................................................... 50

5 | P a g e
7.3. Recommendations .......................................................................................................................... 50
7.4. Limitations....................................................................................................................................... 51
8. Bibliography: ................................................................................................................................... 53
Appendix .................................................................................................................................................... 55
Research questionnaire .............................................................................................................................. 55
Figure List
Figure 1: Research Model ............................................................................................................................. 9
Figure 2 Research Model ............................................................................................................................ 25
Figure 3 - Respondents Nationality ............................................................................................................. 28
Figure 4- Respondents' Age ........................................................................................................................ 29
Figure 5- Respondents' Gender .................................................................................................................. 30
Figure 6 - Respondents’ Occupation ........................................................................................................... 31
Figure 7 - Respondents’ Operator ............................................................................................................... 32
Figure 8 - Multiple Cell Numbers ................................................................................................................ 33
Figure 9 - Secondary Cell Operator ............................................................................................................. 34
Figure 10 - Home Network Operator .......................................................................................................... 34
Figure 11 - Respondents’ Package .............................................................................................................. 35
Figure 12 - Years of Using the Line .............................................................................................................. 36
Figure 13 - Factors affecting selection for Cell network ............................................................................. 37
Figure 14 - Respondents’ Change behavior ................................................................................................ 38
Figure 15- Question orders (service quality)............................................................................................... 41
Figure 16- Question orders (Price) .............................................................................................................. 43
Figure 17- Question orders (Value offered) ................................................................................................ 44
Figure 18- Question orders (Trust) ............................................................................................................. 45
Figure 19- Question orders (Satisfaction) ................................................................................................... 46
Figure 20- Question orders (Loyalty) .......................................................................................................... 47
Table List
Table 1- Reliability Statistics ....................................................................................................................... 39
Table 2- Service quality ............................................................................................................................... 41
Table 3- Price............................................................................................................................................... 42
Table 4- Value offered................................................................................................................................. 43

6 | P a g e
Table 5- Trust .............................................................................................................................................. 45
Table 6- Satisfaction .................................................................................................................................... 46
Table 7- Customer Loyalty .......................................................................................................................... 47

7 | P a g e
CHAPTER 1: Introduction
1.1. Introduction
This research is conducted to explore the key aspects influence the Saudi customers’
buying behavior towards the Mobile network providers and how these aspects influence
consumer trust, satisfaction level thus the brand loyalty.
The introduction chapter allows readers to put the scope of the research into perspective.
Besides, it will explain the purpose of research.
The research background, research problem, research questions, research structure,
definitions of relevant academic terms and limitation will be presented throughout the
search sections .
1.2. Research Background
There are a lot of companies that competing with similar products and services in the
same markets (Amish,2009). As the competitive surroundings becomes rougher,the main
problem is to retain and keep loyal customers who will participate in a profitable
relationship for a long term with the organizations (Tseng, 2007).
Many studies mentioned that the long and loyal customer relationships are valuable for
a company in increasing sales and profits (Reichheld & Sasser, 1990). Other studies
support the views to believe the customer loyalty is one of the sustainable sources of
competitive advantage (Bharatwaj et al., 1993).
The telecom industry is one of the main industries in the world and provide many
communications channels like; voice , data, and the internet fiber optic.
Telecommunication influences the global economy and Telecommunications services
revenue worldwide will grow from $2.2 trillion in 2015 to $2.4 trillion in 2019 — a
combined average growth rate of 2.3 percent — according to a new report from Insight
Research Corp.
The rivalry is becoming stiff and to keep the sustainable competitive advantage, telecom
industry is obliged to provide more ideas with new innovation, invest more capital and
dedicate more sources for customer satisfaction, and it depends on the ongoing
relationships of its clients for long term success and that will happen through a long-term
repeat purchase business, where a high level of participation from the customers is must.
(Hurley, 2004).

8 | P a g e
Today's Cell phone is a pervasive tool for consumer look after to enjoy life. Mobile phones
exceeded its role of communications to become more advanced to become a part of the
user daily live. It has become such an important feature of a user's daily life and behavior
that it has moved from being a just a 'technological object' to a key and major 'social
object'.
This Research explores and present a clear insights of the factors affecting the Saudi
customers’ loyalty towards the Mobile network provider and in details how these factors
influence the level of trust, satisfaction and accordingly the customer loyalty. This
Research examines the diversity in the importance given by various people groups during
the cycle of choosing a cell phone network operator.
Recently, Cell phones communication has been spread exceptionally in all corner around
the world, and Saudi Arabia is not exceptional. Saudi Arabia has adopted information and
communications technologies as tools for development. In Saudi Arabia, Cell phone
companies started to penetrate the market after 1998.
In Saudi Arabia operators licensed By Communications and IT Commission (CITC) looking
for engaging customers into their networks. Different measures are being taken by
Mobile network operators to survive in the market.
All Mobile operators are struggling to earn more new clients into their networks and
retain the existing. This trend results in a very hard competition. The deferent measures
are taken by different operators including reducing tariffs to provide free SMS and
Megabytes, and free calls at off-peak periods.
This Research aims to investigate the influence of all taken endeavors and actions from
the operator’s side on Mobile phone customers in selecting their Mobile network
operators and improve their brand loyalty.
9 | P a g e
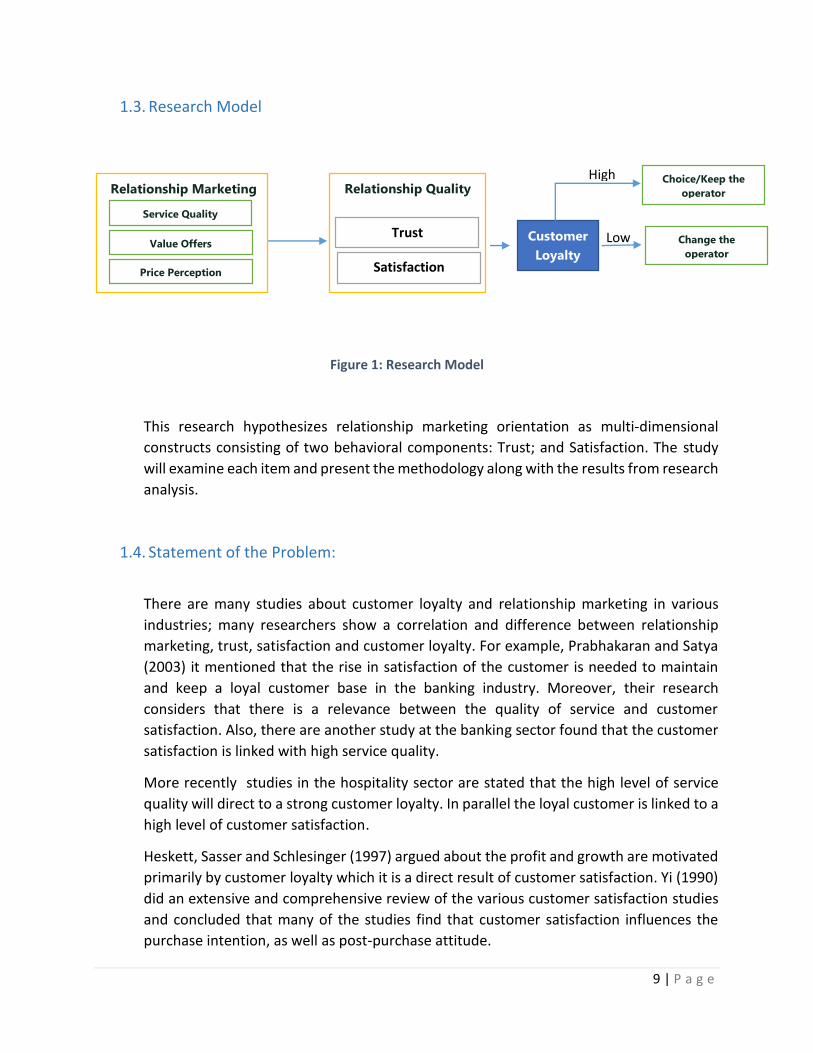
1.3. Research Model
Figure 1: Research Model
This research hypothesizes relationship marketing orientation as multi-dimensional
constructs consisting of two behavioral components: Trust; and Satisfaction. The study
will examine each item and present the methodology along with the results from research
analysis.
1.4. Statement of the Problem:
There are many studies about customer loyalty and relationship marketing in various
industries; many researchers show a correlation and difference between relationship
marketing, trust, satisfaction and customer loyalty. For example, Prabhakaran and Satya
(2003) it mentioned that the rise in satisfaction of the customer is needed to maintain
and keep a loyal customer base in the banking industry. Moreover, their research
considers that there is a relevance between the quality of service and customer
satisfaction. Also, there are another study at the banking sector found that the customer
satisfaction is linked with high service quality.
More recently studies in the hospitality sector are stated that the high level of service
quality will direct to a strong customer loyalty. In parallel the loyal customer is linked to a
high level of customer satisfaction.
Heskett, Sasser and Schlesinger (1997) argued about the profit and growth are motivated
primarily by customer loyalty which it is a direct result of customer satisfaction. Yi (1990)
did an extensive and comprehensive review of the various customer satisfaction studies
and concluded that many of the studies find that customer satisfaction influences the
purchase intention, as well as post-purchase attitude.
Relationship Marketing
Service Quality
Value Offers
Price Perception
Relationship Quality
Trust
Satisfaction
Customer
Loyalty
Choice/Keep the
operator
Change the
operator
High
Low

10 | P a g e
Although, there is no insight or research conducted to study factors affecting the
customer loyalty in the telecom industry in Saudi Arabia.
So, Research is adopting the concept that there is a solid connection between the quality
of services, values offered and price and customer trust, satisfaction and customer loyalty
connected with each other within many industries.
People in Saudi Arabia has become a busy day by day and more professional than the
previous. They need to share more information with each other because of the
demographics have changed as a result of the globalization era.
Smart Mobile phone sets injected a huge variation change in the telecom sector in Saudi
Arabia. Communications structure has also changed. People in different professions and
income levels use the Cell phone extensively for this purpose the professional and
personal purpose too.
Women come out of the four walls; They work with male hand in hand. They are dealing
with different types of professions. In this case the information necessary to respond to
the changing environment.
Saudi Arabia has five Mobile Network Operators licensed to do business in the country.
Three are currently in real operation. These are STC, which is the largest, Mobily, and Zain
and the other two are virtual Mobile network operators. These are Lebara and Verizon.
Based on the research some new Mobile network operators being licensed from time to
time by Communications and IT Commission (CITC).
This makes competition in the telecommunications market very stiff. All Mobile Network
Operatores are struggling to earn more new customers into their networks and retain the
existing customer as well.
The problem is determining which factor influenced more the consumers during the
selection cycle of their mobile network operators and the factors affect the existing
customer’s trust and satisfaction thus the brand loyalty.
Today, it becomes imperative to know factors that directly influence consumers'
purchasing of cell phone services decisions. Moreover, also it is important to differentiate
between the purchasing behavior in choosing between the various Mobile phone
operators and change aspects referring to the reasons that affect the change and the
connection between that and the customer's trust and their satisfaction level.

11 | P a g e
1.5. Aim of the Study
This study aims to cover lacks of previous studies. The study can cover what customers
buy, what features do they look for, the factors that influence the procedures of making
a purchase decision, and the level of satisfaction. All of which are useful in the perfect
understanding of the pattern of consumer behavior.
By reviewing the connection between each construct in the search digram as (figure 1) ,
It is planned for this study to test the connection between the six structures in the shape
of (Service Quality, Value offers, Price Perception, Trust, Satisfaction, and Customer
loyalty), which could be a reference to the Saudi telcom industry. Also, evaluate the
impact of mentioned factors on customer loyalty in the Saudi Mobile telecom sector.
The research was aimed to address the below specific objectives;
1. To find the connection between service quality and customer loyalty in Saudi
telecom industry.
2. To recognizethe the connection between price and customer loyalty in Saudi
telecom industry.
3. To determine the relationship between added value and customer loyalty in Saudi
telecom industry.
4. To discover out that the factors which influence customers to choose Mobile
phone operators.
5. To find out the reasons behind the customers switching to other Mobile phone
operators.
6. To get more intelligence information whether there are any differences among
consumers groups regarding the factors influencing Mobile phone operators’
choice.
1.6. Research Questions
Mobile network providers have applied many relationship marketing methods to reality.
However, many of those methods did not work efficiently; there are phenomena it
shows that often happens behavior convert between most of the targeted customers.
In order to solve this phenomena our research is raised several questions as below;
1. What is the connection between service quality, value offers, price perception
and trust, customer satisfaction in Saudi telecom industry?

12 | P a g e
2. Is there a relation between trust, satisfaction, and customer loyalty in Saudi
telecom industry?
3. What are the Factors Influencing Consumers’ mobile phone operators’ choice
Decisions?
4. What are the features Influencing Consumers’ mobile phone operators’
Switching Behavior?
1.7. Significant of the study
The finding of this study will assist mobile operators in their work and the strategic plan
for marketing. The outcomes of this research in an integrated comprehensive framework
for directors of mobile network operatore in Kingdom of Saudi Arabia to grasp the vital
relationship between different dimensions of service quality, price and added value and
how the relation quality could be enhanced. It is clear that there is no in-depth study
covering these issues. This research is a step in the extensive coverage of the gap.
This research provides all of the development theory of academics and practical
implementation of the marketing managements.
It is anticipated that the mobile operators are concerned about their clients in response
to the differentiation factors published as they are helpful for marketers to realize the
effectiveness of differentiation factors result from the consumer perspective. Marketers
may consider the evidence from these findings and improve customer retention and
satisfaction strategies.
It is also predictable that the society will gain advantages from the outputs of this research
because this will serve the knowledge base in Saudi Arabia. Academic world will get many
values, the telecom industry and the rest of the service industries.
Research was expected to include all cell phone users of mobile operators in Saudi Arabia.
However, the geographical scope is restricted to Riyadh city, the main city in the Kingdom
of Saudi Arabia, which is the most densely populated capital with a relatively high lifestyle
and become more focused on cell phone users.
This research is restricted to only three differentiation factors (service quality, price, and
added value).
1.8. Structure of the thesis

13 | P a g e
This study organized into seven chapters, chapters one to seven. Chapter one present the
background and the motivation behind the study, objectives, questions, significance of
the study and research scope.
Chapter two introduce the review of literature relevant to the research scope, providing
excerpt of previous studies relating to the study objectives.
Chapter three present the methodology including design of the research, sampling plan,
method of data collection and data analysis.
Chapter four presents the analyzed collected data while chapter five describe the tools
used in the empiracal literature while chapter six discuss and interpret the finding ,
chapter seven includes the limitation , summary, conclusions, and recommendations.
1.9. Scope, Assumptions, and Limitations of the Study
This research was conducted to explore and understand the perception of behavioral
consumer choice of providers of mobile communications services and the impact of this
factors on the customer loyalty.
A general notion, consumers' perception is wide, according to the quality of service, price,
and availability of the product, promotion, etc.
The competition between providers of mobile phone services in Kingdom of Saudi Arabia
is stiffer than before. They compete for the acquire of new customers and retain existing
customers by price adoption.
According to the study, service quality, values offers, and price are also important factors
to a large extent the impact on consumers in the vast Mobile phone market in Saudi
Arabia.
However, one of the main limitation that this research is still expected to be a need for
further research efforts to study the additional variables (corporate image; brand image)
in Saudi Arabia.
The Mobiel phone market is the biggest in Saudi Arabia, the other concern is that the
finding of this study is not directly comparable with those of other research studies, there
is virtually no previous research to measure all of these factors combine to perceive
consumers of Mobile phone operators sectors at once.

14 | P a g e
Also, the measurement of the factors that affect the perception of consumers in the
telecommunications industry, making it difficult to compare because of the lack of related
literature.
This research focused only on a few of the factors that are taken from literature and
theories that affect customer perception towards mobile phone operators’ customers. In
addition, several other factors, like consumer learning and memory, and the changing
demographics like education, lifestyle, and the effect of gender can also affect consumer
decision towards the service providers.
1.10. Definition of terms
Term Definition
ICT information and communications technology
Ported Number Ported Numbers are those transferred from the original Mobile network to another with the same Prefix of their original Network.
VMNO Virtual Mobile Networks (MVNO), is a wireless
communications services provider that does not
own the wireless network infrastructure over
which the MVNO provides services to its
customers. An MVNO enters into a business
agreement with a Mobile network operator to
obtain bulk access to network services at
wholesale rates, then sets retail prices
independently.
(En.wikipedia.org, 2016)
CITC Communications and information technology commission

15 | P a g e
CHAPTER 2: Literature review
2.1. Introduction
Embodies this chapter review of the literature relevant to the subject of research and
classified into three thematic areas; relationship marketing, relationship quality and
customer loyalty. Discuss these thematic areas in the details of the theory, and also from
the results of previous work or literature.
2.2. Relationship Marketing
Relationship Marketing is a way of marketing expanded and exposed from the consumer
direct response, marketing focusing on building a long-term connection with customers
instead of individual transactions.
Relationship marketing includes the client to study the behavior and understand it such
as needs , wants and demands by supplying a group of products or services.
Grönroos defined relationship marketing as activities performed to develop and enhance
a successful long-term relationship with clients. (Gronroos, 2007)
Hougaard defined relationship marketing as a behavior relationship marketing for the
company to establish and maintain a profitable relationship with customers for win win
situation. (Hougaard et al., 2002)
Grönroos mentioned that the purpose of relationship marketing is to identify and
establish, maintain, and enhance relationships with customers and other stakeholders.
(Gronroos, 2007)
The marketing theory of the relationship includes the success of the results related to
particular aspects of the cooperative relations that characterize successful relational
exchange. (faculty.mu.edu.sa, 2016)
Arnett and Badrinaray depicted the jurisdiction of relationship marketing and the
company's ability to identify, develop, and manage collaborative relationships with the
main clients of trust and commitment to the relationship and communications.
(faculty.mu.edu.sa, 2016)
Wolf and others (2001) Explained that the different results of satisfaction and loyalty have
come to different relationship terms.

16 | P a g e
Relationship marketing is a takeoff from the traditional transactional behavior to develop
clients as partners.
With intense competition, an other model which is focused on customers and
relationships instead of markets and products now is required.
2.3. Service quality
Service quality defined as an attitude or judgment relating to the overall excellence or
superiority of the service. Also, it expressed as a difference between expectations and
perception of a customer regarding service performance. Likewise, according to
Gronroos’s study, service quality is a comparison between customer expectations with
the service they perceive to have received. In another word, service quality defined as a
tool that evaluate the gap between expectations and perception of a customer. The
importance of the service quality in this era of fierce competition cannot neglect.
Kim et al. stated that to survive and remaina competitive advantage, all businesses should
develop the quality of service that ultimately will lead towards customer’s satisfaction
and loyalty. Study of Huang & Liu stated that higher level of service quality is supposed to
be an efficient way to improve customer satisfaction, trust, and loyalty. Therefore,
researchers derived that service quality maximize the perceived value, trust, and
customer satisfaction.
Leisen and Vance defined quality of service as one of the main tools to assist in creating
the significant competitive advantage when it is a useful differentiation factor.
The quality of service was started in the 1980s and the trend has been spread all over the
world when marketers realized that only quality products can be ensured the competitive
advantage. (Wall et al., 2002)
As a result, the quality of service can use as a competitive advantage and which is linked
to customer satisfaction and also leads to the consumer and to buy in the future and
loyalty
In particular, consumers prefer quality service at aprice, and other cost elements fixed.
(Boer and Holt, 2005).
It has become an important side distinct products and services exhibit. (Wall et al., 2002)
According to them, it is also a competitive advantage to continue at the time that other
competitors are not able to replicate the benefits of service quality. Moreover, the
necessary quality of service for the provider of telecommunications service to ensure the

17 | P a g e
quality of service for the establishment and maintenance of loyalty and customer
profitability (Zeithaml, 2000; Leisen and Vance, 2001).
Condition of service delivery systems can allow business executives to learn about the
real customer feedback and satisfaction on their telecommunications services. Since
reflecting the quality of customer expectations about the product or service.
In fact, consumer perception of the quality of service at the time he or she will decide
next whether or not to buy the service may better explain repeat purchasing behavior.
(raco.cat, 2016)
Crosby and others. (2003) Examined how to create perceptions of quality and maintain in
the minds of consumers. Description of Phusavat and Kanchana (2008) represents the
quality as a main competitive priority. Given the quality of the most of the weight of
36.4%, while the provision of services, and customer-focus, and expertise in 20.4, 12.9
and 12.5% respectively. The weights of the remaining 9.8% of the costs and 8.0% for
flexibility.
From another perspective, Omotayo attempted to find the connection between customer
retention and customer loyalty in the telecom industry in Nigeria. They got that, if
retention is not managed in a proper way customer loyalty perhaps will be lost. Their
research provided a strong relationship between satisfaction and retention in the
communication industry in Nigeria. The findings of the study showed strong support for
the application of customer service to enhance customer retention. The results also
revealed that the participants in this study have an affirmative effect of the ability of their
own telecommunications company to meet their changing needs. (saycocorporativo.com,
2016)
Quality always one of the main concern to the consumers, based on their individual
purchasing power, buying behavior, and demand, and taste, and standards of fashion and
is clear that competitive markets that offer important differentiation strategies.
Therefore, it seems an absolute necessity for the mobile communications service provider
to directly communicate with potential consumers to measure the quality attributes are
possible.
In the Mobile phones sector in China. They visualize factors with quality service and
precedents to assess the overall quality of service to customers, rather than the
dimensions or composition components. Here, the results was that competition between
the two mobile phone providers is more tough than before. This rivalry is not only to

18 | P a g e
guarantee the quality of the network, a huge investment in network expansion and
upgrading but also to acquire and retain customers through reducing the price.
2.4. Price perception
Price considered as an instrument that highly affects the purchasing behavior of the
customer and it is a major element in the improvement of marketing strategies and
creating customer satisfaction and trust. The researchers agree on the fact that a
perception price is a vital tool in determining the behavior of large customers, either
because it increases or decreases customer satisfaction and trust Understanding the
behavior of the client towards price perception assists the companies to develop such
pricing strategies that create customer trust and satisfaction.
The consumer pays a certain monetary or financial value for the service. The price has a
major influence on the buying behavior. Price may vary perception of one individual to
another. Sometimes, the highest price that may adversely affect the consumer's decision
to buy (Ping and Wang, 2006). It has a price perception also the relationship with search
Price (Lichtenstein et al., 1993).
Price plays a main role, especially in the telecommunications market to providers of
mobile communications service (Coleman, 2000). This includes the purchase price, rental
and call fees
Oliver (1997) realized that the consumer makes the relationship between price and
service quality. Two methods can measure Price perception:
One is the price reasonable, and the other is value for money (Cheng et al., 2008). More
than once, and the customer is a high price as a reflection of good quality (Chitty et al.,
2007). Research has shown that confidence and satisfaction may affect the price by (Kim
et al.,2008).
Customers usually choose service providers to rely heavily on the perceived price.
monetary value customer are ready to pay is different due to his needs and wants. Thus,
perceptions price for the similar service or product may differ between individuals. Price
increases seen by consumers may adversely affect the prospects of buying (Ping and
Wang., 2006).
If the consumer understands the price as equity, they are willing to make this deal with
the provider.Based service on previous studies, Zheng et al. (2008) suggested that the
perception of the price can be measured by two dimensions: the first is affordability,
which reflects the way in which the price is seen by customers as compared to that of
competitors. Another is value for money, which means the relative position of the service
provider regarding the price.In a year, are considered high-quality services to more

19 | P a g e
expensive than their counterparts with low-quality (Chitty et al., 2007). Many researchers
pointed out that satisfaction influences the price of customer perception and confidence
(Oliver 0.1999; Ping Wang 2006; Cheng et al. 2008; Kim et al-2008) Customers usually turn
mainly due to some pricing issues, for example, is seen rising prices, and pricing practices
unfair or deceptive (Ping and Wang, 2006).
Therefore, to increase customer loyalty, it is essential for service firms to manage their
customers' price perceptions actively.
Example; implementation of attractive pricing, and provide a mixture at a reasonable
price, low price, without reducing quality and so on.
Price is the medium of exchange with may enable us to get a product or a service.‟
Researchers like Ali et al., (2010) posit that customers are disinclined to disburse less to
have satisfaction this implies that low prices directly associated with a high degree of
satisfaction and high quality associated with higher customer satisfaction. A satisfied
customer would have more price forbearance.‟ According to Jacoby and Olson, Whoever
is of two types objective price (the actual price of the product) and perceived price (the
consumer encodes the price). "
2.5. Trust
Trust, which exists when one party has confidence in an exchange partner’s reliability and
integrity, is a central component in all relational exchanges (Morgan and Hunt, 1994). As
Dwyer, Schurr, and Oh (1987) argue, trust is important because it provides a basis for
future collaborations. In social psychology, a consensus emerges that trust consists of two
essential elements, Confidence in the partner and trust in the partner welfare.
Honesty is the belief that one’s partner stands by its word. Benevolence is the belief that
one’s partner is interested in the company’s Social welfare, and will not take unexpected
actions which will have an adverse impact on the business (Geyskens and Steenkamp,
1995). It seems that if partners in a trust relationship with each other more, they are more
emotionally and less consciously weighing the benefits against the costs of such
relationship.
They are more emotionally and less consciously weighing the benefits against the
expenses of such a relationship (Wetzls et al., 1998). Kramer (1999) assumed that the
confidence of both thinking and feeling aspects to it and that confidence and socially
oriented. He knew logical confidence choice by recognition of the motives of others.
Mishra (1996) assumed that there are four dimensions of trust (i.e., reliability, openness,
and efficiency, and anxiety) found that communication is crucial to show all aspects of the
trust (Mishra et al., 2008).

20 | P a g e
In the development of trust and expectations trustors "cognition about secretaries
concerned.
Therefore, the development of trust to be inconclusive to establish a successful long-term
relationship between all parties concerned considered. In the face of complex service
markets, customers tend to act and make a purchase decision based on previous
experiences consuming (Doney and Cannon, 1997).
Customers will have trust in the ability of service providers are likely to be willing to
commit to the service to meet the expectations of the relationship (Morgan and Hunt,
1994). Even when they are a changing environment, customers believe that the service
provider will take into account the interests of customers, rather than do anything
harmful to the development of relations (Liu et al., 2008). Meyer and others (1995).
Customers will have trust in the ability of service providers are likely to be willing to
commit to the service to meet the expectations of the relationship (Morgan and Hunt,
1994). Even when they are a changing environment, customers believe that the service
provider will take into account the interests of customers, rather than do anything
harmful to the development of relations.
Perception of organizational trust by proposing three key elements such as the ability
trustee, charity trustee, and guardian of safety. These three dimensions were provided
more support and adopted by many researchers to trust in subsequent studies. (Lin and
Deng, 2005; Aydin Ozer 0.2005; Tian et al., 2008). In addition to a cumulative process in a
relationship was considered to construct trust by the party's ability to implement its
obligations on an ongoing basis (Doney and Cannon, 1997; Aydin Ozer, 2005). Confidence
is imperative for long-term relationships and enhances customer loyalty.
According to Errol the level of someone’s trust in another party’s capability and his/her
performance based on expected ethical principles is defined as trust. (Errol et al., 2005).
Believe of one party that another party will fulfill his/her need is known as Trust. It has
been discussed broadly in literature. (Errol et al., 2005)]. Trust lead to long-term loyalty
and relationship between two parties becomes stronger (Singh & Sirdeshmukh, 2000).
According to Rauyruen and Miller (2007), there two level of trust. Customer’s trust on one
specific sales representative is at first level. Whereas trust on the institution is at the
second level. If trust exists, then it is obvious that person is likely to purchase something.
Customer’s belief on trust regarding service is the delivery of quality services that meets
customer’s expectations. (Anderson&Weitz, 1989). According to Herbig (1994),
corporates reputation is the stability of its activities over time. Trust has the highest
importance in assessing the quality of products and services from customers‟ viewpoint
as reputation originates from the quality of its goods and services. (Paul et al., 2009).

21 | P a g e
2.6. Satisfaction
Satisfaction has defined as a consumer’s evaluative judgment related to the pleasurable
level of consumption-related fulfillment (Oliver, 1996). Similarly, perceived service quality
conceptualized as the comparison of service expectations with real performance
expectations. Particularly in recent years, the relationship between service quality and
customer satisfaction has received much attention.
Last intermediary relationship, relationship satisfaction, when the client has the affective
or emotional state toward a relationship.Relationship satisfaction exclusivelyreflects
customer satisfaction with the relationship is different from the customer's satisfaction
with the overall exchange (Palmatier et al., 2006).
Other researchers have suggested that this mediation is simply the quality of the global
mediator relationship indicators.
It is a comprehensive assessment of the strength of the relationship, "and the perception
as a multi-dimensional construct that captures the many different aspects of the
relationship of exchange (De Wolf, Odekerken- Schröder, and Iacobucci, 2001).
There is a focal point for discussion is the causal path between the quality of service and
satisfaction. Also, there is considerable debate about the distinctive nature of these
concepts conceptual. The prevailing view is that the effects of satisfaction Quality, Quality
is the ancestor of sense to satisfaction (Iacobucci et al., 1996). Cronin and Taylor (1992)
and in support of experimentally that the service quality is the precedent of consumer
satisfaction (Wetzls et al., 1998). Therefore, we suggest that the trust, commitment,
communication, interdependence, and satisfaction are key dimensions of the
relationship-oriented marketing.
Oliver (1997, 1999), satisfaction as a fun and amusement meet that touched by customers
in consumption.
It means the consumer senses that consumption achieves some need, desire, goal, or so
forth, and this is a fun fulfilled" (Oliver, 1999, P.34).
In the marketing literature relationship, as it was believed to be a customer satisfaction
KPI to assess the quality of the relationship between the service provider and the
customer expectations concerning the costs and benefits of the relationship depends
mainly on experience, and experience satisfactory increase the motivation and the
likelihood that the individual remains in the relationship (Murray, 2005) behaves .
Repurchase Customer Satisfaction It follows the basic needs of clients associated with the
product (Guzzo., 2010). Zeithaml and Bitner (2000), defined customer satisfaction as it is

22 | P a g e
the response of the customer to the service he received from achieving his desires and
expectations of his requirements.
Defines customer satisfaction as providing the required service to customers, which may
generate a positive attitude towards a particular brand used (Mayaki et al. 2011; Radwan
et al., 2013). According to Fornell (1992), and customer satisfaction is customer position
after the use of a particular product.
In this sense, thinking of satisfaction as the rule that "feature or sometimes the product
or service itself, it provides a unique level of achievement of the relevant consumption."
We can review customer retention response.
Thus service providers, the very evocative command to understand the degree of insight
into the customer services.
It is Previous evident studies that there has been much debate about whether service
quality is the quality of the service record of customer satisfaction (Parasuraman 1994,
Zeithaml 1996).
The quality of service contributes significantly to enhance customer satisfaction
(Levesque and McDougall, 1996; McDougall and Levesque, 2000). For example, Cronin
and Taylor "s (1992) model SERVPERF verify the theoretical framework of health as it is
assumed the service quality and customer satisfaction we have a causal relationship.
Gamal Nasser (2002) to ensure that the pivotal quality in the banking dimensions
positively linked to customer satisfaction. Moreover, research made in
telecommunications services showed that the service is bumping customer satisfaction
quality (Tong, 2004; Kuo et al., 2009; Lee, 2010).
2.7. Customer loyalty
Griffin (1995) divides customers into four categories: inertia loyalty, latent loyalty,
premium loyalty, and no loyalty. The "inertia loyalty" category represents customers who
repurchase a specific service without emotional attachment. Customers who included in
the "latent loyalty" category are those who feel attached to a specific product or service
while they purchase the product infrequently. The third type is the "premium loyalty" that
is related to customers who have a high repeat the visit or purchase rate for a specific
service with high level of emotional attachment to this service. The "no loyalty" category
represents in customers who have no attachment to a specific product or repurchase
intention (Griffin, 1995).The following definitions of customer loyalty contain three major
keys in defining loyalty: first is that the clients' needs met and second are the pleasant
feeling that created from the first key and third is the frequent patronage over a given
period that occurs as a result of the first two keys.

23 | P a g e
Customer loyalty has been defined as constancy of preference over a certain length of
time (Blackwell et al. 1984). Retail store loyalty is defined as a biased, behavioral reaction,
established over time, by some decision-making element, concerning one or more
substitute stores out of a collection from the same sort and as a function of a
psychological series of actions (Jacoby & Kyner 1973). Loyalty has been pointed out as a
long-term promise to return, including both frequent patronage and a pleasant feeling
(Dick & Basu 1994).The following definitions of customer loyalty view loyalty from
competition. Customer loyalty happens when "the customer feels so strongly that you
can best meet his or her relevant needs that your competition virtually excluded from the
consideration set and the customer buys almost exclusively from you referring to you as
'their restaurant' or 'their hotel'" (Smith, 1998). Loyalty is the probability of a customer's
coming back to a hotel and that customer's eagerness to act as a partner in the firm
(Bowen & Shoemaker, 1998). Therefore, companies that implement customer loyalty
programs desire to guard their market share against opponents, take high-value
customers from them, and retain and increase the number of high-value customers
(Dunn, 1997).In "Finding Customers: Market Segmentation," Bull and Passewitz (1999)
discuss two markets: (1) Undifferentiated Marketing focuses on the needs that customers
have in common and relies on mass advertising. It succeeds the most when there is low
competition in the same market. (2) Differentiated Marketing focuses on target
marketing in specialized market segments. This form of marketing builds greater loyalty
by recognizing the needs of specific target customers. The authors define market
segmentation as "dividing a larger market into submarkets based upon different needs or
product preferences." They conclude that those businesses that direct their marketing
efforts toward making customers aware of the special benefits (quality, low price, or
convenience) of their product, benefit the most from their marketing efforts. In the
current study, differentiated commercialization of international restaurants in Jeddah
examined by identifying their customers' needs.
The main topic in the marketing of customer relationship is' get and keep customers. Also,
think of a customer loyalty to be the most valuable asset of the company, and therefore
it is necessary for providers to keep the loyalty of customers who will make a profit in the
long term for business organizations (Tseng, 2007).
The Department of customer loyalty and loyalty to the general attitudes and behavioral
(Aydin Ozer, 2005). It describes the customer loyalty positions attitude towards loyalty
through customer preference measure, purchase intent, and resource prioritization, and
recommendation prepared. On the other hand; behavioral loyalty respect to the shares
buys, buy frequency (Ibid.) Evidence suggests that the relationship stronger commitment
to re-render care to repeat buyers. Wolf and others. (2001) Behavioral loyalty building
defined as a compound based on the purchasing frequency of the consumer and the
amount spent in retail stores compared to the amount devoted to other retailers from
whom the consumer buys.

24 | P a g e
Found Morgan and Hunt (1994), a significant relationship between the level of the buyer's
commitment to the relationship and acquiescence to him, the tendency to leave their
cooperation, which considered as behavioral outcomes of relationships. It has been
identified several factors to influence customer loyalty.
CHAPTER 3: Methodology
3.1. Introduction
This Section started with an exegesis of the used method for this research, followed by
sampling, questionnaire design, data collection, and finally the reliability, validity and
statistical analysis tool is explained.
3.2. Research Method
The aim of the research was to evaluating the factors affecting customer loyalty towards
mobile network provider in Saudi Arabia and to test the proposed theory about the
relation between relationship marketing ( Service quality, added value, and price ),
relationship quality, ( satisfaction and trust) and customer loyalty and quantitative
method is used in this research. The research explains in some questions correlation
between customer experience and its impact on customer loyalty.
Survey and sampling method was used for data collection and analysis, and secondary
data was there as a support tool. Survey and interviews were conducted to collect the
required information for the case

25 | P a g e
3.3. Research Design
3.3.1. Research Model
Figure 2 Research Model
Relationship Marketing
Service Quality
Value Offers
Price Perception
Relationship Quality
Satisfaction
Customer
Loyalty
Choice/Keep the
operator
Change the operator
High
Trust
Service Quality
Customer Service
Internet Speed
Coverage
Offers Variety
Tariff
International rate

26 | P a g e
3.4. Population
A population is a whole group that the survey focuses on . (Jacobsen, 2002)
The sample is the group of the population that is targeted for evaluation. (Bryman, 2003)
The scope of selection is focused on the Saudi mobile telecom sector. Due to the research
is studied from customers’ point of view and study targeted the mobile telecom industry
in Saudi Arabia. The volume of population was a total number of mobile subscriptions
which is around 51 million by the end of Q1 2016.
(Mcit.gov.sa, 2016)
Information was gathered from the customers because this study’s aim was investigating
on the customer loyalty from external clients’ perspectives. The population was expected
to include the people who are consuming the mobile phone services from Saudi telecom
service providers. However, it is noteasy for researchers to communicate with a big
number of sample, as the sample size is a critical question in practice.
The decision about the size of the sample requires to take into account the time and cost,
the need for precision, and a variety of further considerations. (Bryman, 2003)
Due to the limit of time and costs, the population is changed to target Al Riyadh city.
3.5. Sampling plan
The sampling plan used in this survey was the stratified random sampling method. The
population was categorized into three; STC, Mobily, and Zain. After categorization,
random sampling under each category was done.
The focus on respondents was the Cell phone users within AL Riyadh city with keen
emphasis on the customer service centers of the firms for ease of accessibility. The choice
of AL Riyadh city was due to the presence of a high number of people that are likely to
be using the services (Voice, data, SMS) of the three Mobile operators compared to other
areas, and thus captures the viewpoints of a broad cross-section of Cell phone users.
Due to time and resource constraints, the particular sample size chosen is 120 cell phone
users.
3.6. Questionnaire Design

27 | P a g e
Yin has determinded five traditional methods of gathering and analyzing data in business
research. It includes experiments, survey, and analysis of archival information, histories
and case studies. (Yin, 1994).
The study used survey as the primary method of data collection for this research. In this
survey, the primary data was collected by structured questionnaires. The secondary data
was gathering through various literature reviews and articles.
The survey design prepared by the team and the questioner was informed by qualitative
phase to explore the consumer behavior.
In this survey, closed questions are defined. The questionnaire was built from three parts
and 15 points see (Appendix 1).
The team met with a total of 75 master students to share with them the questionnaire
ask their help beside the online survey. At the end of survey, there are 120 persons
interacted with the questionnaire.
3.7. Reliability
Reliability concerned with issues of consistency of measures. (Bryman, 2003), Research
needs to be sure that all indicators are related to each other.
It can be tested by Cronbach’s alpha method. The result of 0.6 and above considered as
an acceptable level of internal reliability. (wikipedia.org , 2016)

28 | P a g e
CHAPTER 4: Presentation of Data/Empirical Data
4.1. Introduction
This section present the data collected from the survey and the data is collected
randomly irrespective of the different category of the people in the form of a
questionnaire, and the sample size is 120 respondents and the research team collected
the results of questionnaire through a face to face meeting, on phone and some time by
electronic survey web services. Then we combined all the collected data regardless the
collection channel to one poll and after this we applied our analysis tools on it.
4.2. Sampling analysis
4.2.1. Respondents’ Nationality
Nationality is one of the factors that may impact the selection of the mobile
operator. Therefore the interviewees were requested to expose their nationality,
and the statistics are shown in below chart (Figure 3).
Figure 3 - Respondents Nationality
Source: Research Data
Egyptian Filpino French IndiaJordaini
anLebanen Pakistani Saudi Sudan Syrian Yemeni
Value 38% 1% 1% 18% 7% 1% 2% 28% 1% 3% 2%
38%
1% 1%
18%
7% 1% 2%
28%
1% 3% 2%0%
5%
10%
15%
20%
25%
30%
35%
40%
Axi
s Ti
tle
RESPONDENTS’ NATIONALITY

29 | P a g e
The statistcs refer to that the majority of the interviewees (72%) were
expatriates from different ten countries while the Saudi’ interviewees were
around (28%).
4.2.2. Respondents’ Age
Age is one of the factors that may influence ownership of a Cell phone. Therefore
the respondents were requested to indicate their age brackets, and the results are
shown in below chart (Figure 4).
Figure 4- Respondents' Age
Source: Research Data
The statistcs refer to that the majority of the interviewees (68%) were within the
30-40 years age bracket. Those between 40-50 years constituted (17%) while
those above 50 years only (1%) and those between 20-30 years constituted (15%)
of the sample
4.2.3. Respondents’ Gender
20th 30th 40th 50th
Value 15% 68% 17% 1%
15%
68%
17%1%
0%
10%
20%
30%
40%
50%
60%
70%
80%
RESPONDENTS’ AGE

30 | P a g e
The interviewees were asked first to indicate their gender. The relevant
responses are summarized in chart below (Figure 5).
Figure 5- Respondents' Gender
Source: Research Data:
As shown in above (92%) of the respondents were male.
4.2.4. Respondents’ Occupation
The study also sought to establish the occupation of the interviewees. They were
therefore asked to indicate their occupation and results are presented in the below
chart (Figure 6).
Female8%
Male92%
RESPONDENTS’ GENDER

31 | P a g e
Figure 6 - Respondents’ Occupation
Source: Research Data
As the results of above chart show, various professions were represented in the
study. However, the majority were employees comprising 43%, followed by
management (36%), mainly comprising labor at (18%).
4.2.5. Respondents’ Operator
To determine respondents’ choice of Cell service provider results were
tabulated as summarized in below chart (Figure 7).
Employee Executive Housewife Labor Management
Value 43% 3% 2% 18% 36%
43%
3% 2%
18%
36%
0%
5%
10%
15%
20%
25%
30%
35%
40%
45%
RESPONDENTS’ OCCUPATION

32 | P a g e
Figure 7 - Respondents’ Operator
Source: Research Data
According to the findings as presented in above chart, some 63% of the
respondents owned STC lines, 21% of them owned Mobily and 14% owned Zain
lines while those who owned Virigin is 2%.
4.2.6. Respondents’ multiple Cell Numbers
The interviewees were asked to indicate how many Cell number they have. The
relevant responses are summarized in chart below (Figure 8).
Mobily STC Virigin ZAIN
Value 21% 63% 2% 14%
21%
63%
2%14%
0%
10%
20%
30%
40%
50%
60%
70%
RESPONDENTS’ OPERATOR

33 | P a g e
Figure 8 - Multiple Cell Numbers
Source: Research Data:
As shown in above (53%) of the respondents have a multiple Cell number.
4.2.7. Secondary Mobile network Operator
The interviewees were asked to indicate the secondary Cell operator. The
relevant responses are summarized in chart below (Figure 9).
No47%Yes
53%
MULTIPLE MOBILE NUMBERS
Lebara Mobily STC ZAIN
Value 2% 35% 54% 10%
2%
35%
54%
10%
0%
10%
20%
30%
40%
50%
60%
SECONDARY MOBILE OPERATOR

34 | P a g e
Figure 9 - Secondary Cell Operator
Source: Research Data
According to the findings as presented in above chart, some 54% of the
respondents owned STC lines, 35% of them owned Mobily and 10% owned Zain
lines while those who owned Lebara is 2%.
4.2.8. Home Network Operator
The interviewees were asked to indicate the type of Cell number network. The
relevant responses are summarized in chart below (Figure 10).
Figure 10 - Home Network Operator
Source: Research Data
As shown in above (19%) of the respondents switched to another Cell
operator of the same number while the remaining (81%) are keeping the
same operator.
4.2.9. Respondents’ Package
Ported Number19%
Orginal operator81%
HOME NETWORK OPERATOR

35 | P a g e
The study sought to establish the tariff platform upon which the Cell telephone
lines used by the respondents were based and the findings were as shown in
below chart (Figure 11).
Figure 11 - Respondents’ Package
Source: Research Data
The findings indicate that the post-paid tariff platform was the one most
owned by the respondents at 62.4%. The pre-paid tariff arrangement was
much less popular coming far behind at 38%.
4.2.10. Years of Using the Line
Interviewees were further asked to indicate the number of years that they
had been using their lines and the study findings were as summarized in
below chart (Figure 11).
Postpaid62%
Prepaid38%
RESPONDENTS’ PACKAGE

36 | P a g e
Figure 12 - Years of Using the Line
Source: Research Data
The study findings provide the following facts, 54% of Interviewees have
used their cell phone lines for 1-4 years, 26% of them have used their lines
for 4-7 years, 23% of them have used their lines for 7-9 years while 12%
showed that they had used their lines for over a decade. Less half of the
Interviewees indicated that they had used their lines for more than 5 years
showing that most subscribers were very experienced in Cell telephone
use and more likely to give reliable information.
4.2.11. Factors affecting selection for Cell network
In making a choice between the available service providers in the market,
various factors are deemed to come into play. The Interviewees were
asked to mention factors that they considered important in their choice of
a Cell service provider in order of importance starting with the most
important factor. The results were as shown in chart (Figure 13).
6%
10%
13%
24%
4%
8%
15%
3% 3% 2%
12%
0%
5%
10%
15%
20%
25%
30%
1 2 3 4 5 6 7 8 9 1 0 M O R E 1 0
YEARS OF USING THE LINE

37 | P a g e
Figure 13 - Factors affecting selection for Cell network
Source: Research Data
According to the research findings as presented in above chart, 38% of
Interviewees preferred the service quality as the main factor to select the Mobile
network operator while 31% of Interviewees selected the tariff as a primary factor
to choose the Mobile network operator and the customer service came in the
third place with 13%.
4.2.12. Respondents’ Change behavior
Interviewees were further asked to indicate the change operator’s
decision if they get the factor they selected as a Factor affecting selection
for Mobile network and the study findings were as summarized in below
chart (Figure 14).
Servicevariety
CoverageInternational
rateInternetSpeed
CustomerService
TariffServiceQuality
Value 2% 3% 6% 8% 13% 31% 38%
2% 3% 6% 8%13%
31%
38%
0%
5%
10%
15%
20%
25%
30%
35%
40%
45%
FACTORS AFFECTING SELECTION FOR MOBILE NETWORK

38 | P a g e
Figure 14 - Respondents’ Change behavior
Source: Research Data:
As shown in above (58%) of the interviewees maybe turn the Mobile
network operator in case got their Factor affecting selection for Cell
network.
I don't know23%
Maybe58%
Never19%
RESPONDENTS’ CHNAGE BEHAVIOR

39 | P a g e
CHAPTER 5: Analysis of Data
5.1. Introduction
This section will present the results of sample analysis; the data is presented on a tables
and charts as an output of SPSS data processing results, followed by the data analysis.
The aim of this stage is defined the relation between the search methodology elements
and nature of that relation and their impact on the customer loyalty.
5.2. Statistical Analysis
The outputs of the survey were analyzed using descriptive analysis technique. There are
many basic techniques for analyzing quantitative data.In this research, the study used
the software of SPSS for Windows to analyze the exploratory factors.
SPSS Given the scales of items for a construct, the Cronbach’s alpha’s are calculated to
assess the reliability of those items.
5.3. Data Reliability
In this survey, there are total 120 feedbacks from the sample population. All the
feedbacks are complete for the eight constructs that this study focused on, it is necessary
to measure the internal reliability of each construct with its different number of items.
5.4. Reliability Statistics
Cronbach's Alpha Number of Items
.867 27
Table 1- Reliability Statistics
To test the reliability, the Cronbach’s alpha are calculated for items designed for the same
construct. If Cronbach’s alphas larger than 0.6 that is mean the reliability is accepted as

40 | P a g e
per most social science research so in this research the Cronbach's Alpha is .867 which is
mean the reliability of this research is accepted.
5.5. Frequencies
5.5.1. Service quality
Questions
Strongly agree
Agree Neutral Disagree Strongly disagree
Mea
n
Stan
dar
d
Dev
iati
on
Ord
er
Gen
eral
Tr
end
Number Number Number Number Number
% % % % %
Your mobile network operator following your requests with high priority and in reasonable time
80 29 8 3 0
4.55 .732 2 Strongly
agree 66.7% 24.2% 6.7% 2.5% 0%
The customer service of your operator are always willing to support you.
51 61 3 5 0
4.32 .722 5 Strongly
agree 42.5% 50.8% 2.5% 4.2% 0%
The required actions to your complaints are always taken seriously and quickly.
68 46 4 2 0
4.50 .648 3 Strongly
agree
56.7% 38.3% 3.3% 1.7% 0%
Your mobile network operator is a constant in providing qualified services.
53 65 2 0 0
4.43 .529 4 Strongly
agree 44.2% 54.2% 1.7% 0% 0%
Your operator offers customized services to satisfy customers’ need.
34 72 12 2 0
4.15 .657 6 Agree
28.3% 60% 10% 1.7% 0%
Your operator offer information
88 28 2 2 0 4.68 .594 1 Strongly
agree

41 | P a g e
on time when there are new services.
73.3% 23.3% 1.7% 1.7% 0%
Table 2- Service quality
In Table 2, the question no.6 (This operator presents information at the right time when there
are new services) is ordered as the first one on mean 4.68 with general trend “Strongly agree”.
Figure 15- Question orders (service quality)
5.5.2. Price
Questions
Strongly agree
Agree Neutral Disagree Strongly disagree
Mea
n
Stan
dar
d
Dev
iati
on
Ord
er
Gen
eral
Tr
end
Number Number Number Number Number
% % % % %
Your operator did dynamic action to support you to know the pricing of products and services policies.
86 28 4 2 0
4.65 .63 2 Strongly
agree
71.7% 23.3% 3.3% 1.7% 0%
4.55
4.32
4.5
4.43
4.15
4.68
3.8
3.9
4
4.1
4.2
4.3
4.4
4.5
4.6
4.7
4.8
Your mobilenetwork operator
following yourrequests with high
priority and inreasonable time
The customerservice of youroperator are
always willing tosupport you.
The requiredactions to yourcomplaints arealways takenseriously and
quickly.
Your mobilenetwork operator
is a constant inproviding qualified
services.
Your operator offers customized services to satisfy customers’ need.
Your operator offerinformation on
time when thereare new services.
Mean

42 | P a g e
Your operator provide an attractive pricing schema of products and services.
86 23 6 5 0
4.58 .773 3 Strongly
agree 71.7% 19.2% 5% 4.2% 0%
Your operator offers a reasonable rates of the services.
86 30 2 2 0 4.67 .599 1
Strongly agree
71.1% 25% 1.7% 1.7% 0%
My operator offers a supple price for the provided service.
55 52 100 3 0
4.33 .735 4 Strongly
agree 45.8% 43.3% 8.3% 2.5% 0%
I will keep my operator unless the prices moved up for the same service.
46 66 5 3 0
4.29 .666 5 Strongly
agree 38.8% 55% 4.2% 2.5% 0%
Table 3- Price
In Table 3, the question no.3 (This operator offers a reasonable rates of the services.) is ordered
as the first one on mean 4.67 with general trend “Strongly agree”.
4.65
4.58
4.67
4.334.29
4.1
4.2
4.3
4.4
4.5
4.6
4.7
Your operator diddynamic action to
support you to knowthe pricing of productsand services policies.
Your operator providean attractive pricingschema of products
and services.
Your operator offers areasonable rates of the
services.
My operator offers asupple price for the
provided service.
I will keep my operatorunless the prices
moved up for the sameservice.
Mean

43 | P a g e
Figure 16- Question orders (Price)
5.5.3. Value offered
Questions
Strongly agree
Agree Neutral Disagree Strongly disagree
Mea
n
Stan
dar
d
Dev
iati
on
Ord
er
Gen
eral
Tr
end
Number Number Number Number Number
% % % % %
My operator provides an offers that worth the money
68 46 4 2 0 4.50
.648 1 Strongly
agree 56.7% 38.3% 3.3% 1.7% 0%
There is a benefits from the offers provided by my operator
53 65 2 0 0
4.43 .529 2 Strongly
agree 44.2% 54.2% 1.7% 0% 0%
My operator proposed rewards that were what I wanted.
34 72 12 2 0
4.15 .657 4 Agree
28.3% 60% 10% 1.7% 0%
There is a high probability to achieve the proposed reward.
70 44 3 3 0
4.31 .591 3 Strongly
agree 58.3% 36.7% 2.5% 2.5% 0%
Table 4- Value offered
In Table 4, the question no.1 (This operator provides promotional offers were worth the
money) is ordered as the first one on mean 4.50 with general trend “Strongly agree.”
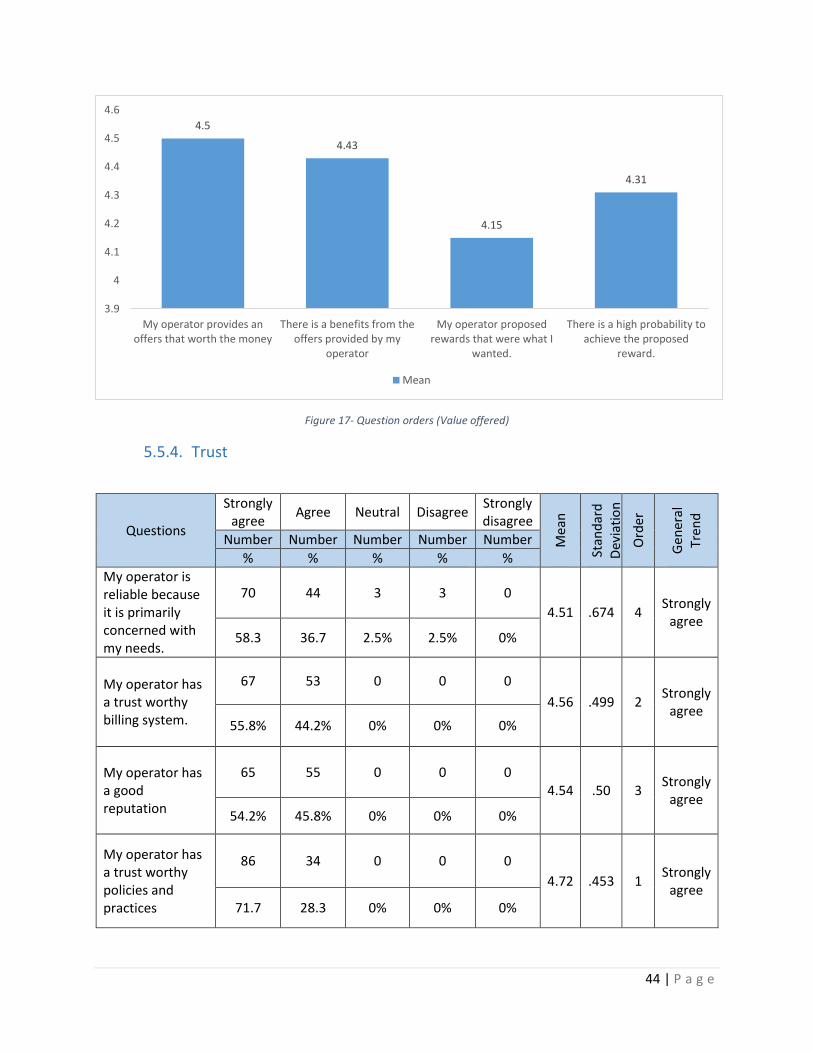
44 | P a g e
Figure 17- Question orders (Value offered)
5.5.4. Trust
Questions
Strongly agree
Agree Neutral Disagree Strongly disagree
Mea
n
Stan
dar
d
Dev
iati
on
Ord
er
Gen
eral
Tr
end
Number Number Number Number Number
% % % % %
My operator is reliable because it is primarily concerned with my needs.
70 44 3 3 0
4.51 .674 4 Strongly
agree 58.3 36.7 2.5% 2.5% 0%
My operator has a trust worthy billing system.
67 53 0 0 0
4.56 .499 2 Strongly
agree 55.8% 44.2% 0% 0% 0%
My operator has a good reputation
65 55 0 0 0 4.54 .50 3
Strongly agree
54.2% 45.8% 0% 0% 0%
My operator has a trust worthy policies and practices
86 34 0 0 0
4.72 .453 1 Strongly
agree 71.7 28.3 0% 0% 0%
4.5
4.43
4.15
4.31
3.9
4
4.1
4.2
4.3
4.4
4.5
4.6
My operator provides anoffers that worth the money
There is a benefits from theoffers provided by my
operator
My operator proposedrewards that were what I
wanted.
There is a high probability toachieve the proposed
reward.
Mean

45 | P a g e
This operator provides a secure services
83 37 0 0 0 4.43 .496 5
Strongly agree
69.2% 30.8% 0% 0% 0%
Table 5- Trust
In Table 5, the question no.4 (This operator has trustworthy policies and practices) is ordered as
the first one on mean 4.72 with general trend “Strongly agree”.
Figure 18- Question orders (Trust)
5.5.5. Satisfaction
Questions
Strongly agree
Agree Neutral Disagree Strongly disagree
Mea
n
Stan
dar
d
Dev
iati
on
Ord
er
Gen
eral
Tr
end
Number Number Number Number Number
% % % % %
I am satisfied with the quality service provided by the operator.
51 69 0 0 0 4.43 .496 1
Strongly agree
42.5% 57.5% 0% 0% 0%
I am satisfied with the
33 80 7 0 0 4.22 .537 3 Strongly
agree
4.51
4.564.54
4.72
4.43
4.25
4.3
4.35
4.4
4.45
4.5
4.55
4.6
4.65
4.7
4.75
My operator is reliablebecause it is primarily
concerned with myneeds.
My operator has atrust worthy billing
system.
My operator has agood reputation
My operator has atrust worthy policies
and practices
This operator providesa secure services
Mean

46 | P a g e
professionalism of my operator. 27.5% 66.7% 5.8% 0% 0%
I am satisfied with the performance and response of the customer service of my operator.
44 76 0 0 0
4.37 .484 2 Strongly
agree 36.7% 63.3% 0% 0% 0%
I willing to continue using mobile services from my current operator for a long time.
33 80 7 0 0
4.22 .537 3 Strongly
agree 27.5% 66.7% 5.8% 0% 0%
Table 6- Satisfaction
In Table 6, the question no.1 (I am satisfied with the quality and method of the overall service
provided by the operator.) is ordered as the first one on mean 4.43 with general trend “Strongly
agree”.
Figure 19- Question orders (Satisfaction)
5.5.6. Customer Loyalty
4.43
4.22
4.37
4.22
4.1
4.15
4.2
4.25
4.3
4.35
4.4
4.45
I am satisfied with thequality service provided by
the operator.
I am satisfied with theprofessionalism of my
operator.
I am satisfied with theperformance and responseof the customer service of
my operator.
I willing to continue usingmobile services from my
current operator for a longtime.
Mean

47 | P a g e
Questions
Strongly agree
Agree Neutral Disagree Strongly disagree
Mea
n
Stan
dar
d
Dev
iati
on
Ord
er
Gen
eral
Tr
end
Number Number Number Number Number
% % % % %
Even if another operator’ price is lower, I will go on using my current provider.
72 48 0 0 0
3.60 .492 3 Agree
60% 40% 0% 0% 0%
I will tell other people a good things about my operator..
68 34 0 0 0
4.72 .453 1 Strongly
agree 71.7 28.3 0 0 0
I will encourage friends to select the services offered by my operator.
83 37 0 0 0
4.69 .465 2 Strongly
agree 69.2 30.8 0 0 0
Table 7- Customer Loyalty
In Table 7, the question no.2 (I am willing to say positive things about this operator to other people.) is
ordered as the first one on mean 4.72 with general trend “Strongly agree”.
Figure 20- Question orders (Loyalty)
3.6
4.72 4.69
0
0.5
1
1.5
2
2.5
3
3.5
4
4.5
5
Even if another operator’ price is lower, I will go on using this
provider.
I will tell other people a goodthings about my operator.
I will encourage friends andrelatives to use the services
offered by this operator.
Mean

48 | P a g e
CHAPTER 6: Discussion and Interpretation of Findings
6.1. Introduction
This chapter is allocated to express the findings of this after achive the last stage of this
research and started with the research methodology, survey design, data collection and
data analysis. This section will also interpret the results, and discuss their implications.
6.2. Finding
6.2.1. Findings from sampling analysis
Based on consumer preference, majority of the peoples are preferred STC as a
main Mobile network operators.
Based on age of the group, most of the respondents 63% , are using STC, who are
in the category of up to 30 years.
Based on the analysis 38% of Interviewees preferred the service quality as the
main factor to select the mobile network operator while 31% of Interviewees
selected the tariff as a primary factor to choose the mobile network operator and
the customer service came in the third place with 13%.
6.2.2. Finding of the survey results
Service quality, values offers, and price are considered as an essential for develop
a long-term relationship with customers to get a joint benefits for both parties.
Therefore,this research was conducted to exmaine the impact of relationship
marketing tactics (Service quality, Price, Added value) on relationship quality
(Trust and Satisfaction), and in turn, affect the customer loyalty within on Saudi
Mobile telecommunication market. The results of the survey can be concluded as
below:
The three relationship marketing tactics (Service quality, values offers, and price
perception ) are positively connected to relationship quality. Values offered tactic
show the lowest connection to customer trust and satisfaction. This implicit that

49 | P a g e
the value adding activities applied by the telecom service providers, such as
reward refund, are not adequately perceived by respondents group.
Trust and satisfaction are related to loyalty positively. Finding also provides a
statistics supporting previous studies that higher level of trust and satisfaction
perceived by customer , affect positively the loyalty level achieved by service
providers.

50 | P a g e
CHAPTER 7: Conclusion
7.1. Introduction:
The aim of this section is concluding the objectives and finding of this research, then the
theoretical academics, limitation and valid recommendation for the future researches
and studies and how these could utilize the finding of this research in proper way and all
of this will be discussed.
7.2. Conclusion
The main goal of the study is providing a better understanding of the main factors
affecting the Saudi customers’ behavior towards the Mobile network providers. Then
how these factors influence the level of consumer trust, satisfaction thus the brand
loyalty as well as to explore the variation in the importance given by different customer
groups while choosing Mobile phone operators.
In today's competitive markets, customers are quick to give up the services that do not
meet their expectations. The facility which customers can move from their current
service provider to another, to be successful, a telecom service providers require to
supply the highest levels of service quality and performance, customers’ positive
experiences with rich services, and comprehensive service quality management.
The study found that both consumer groups stayers, and switchers, pay more
importance to the service quality and price while choice, and purchase mobile phone
operators' services. It was also found features affecting to choice and cause behind
switching to other mobile network provider are somewhat similar. So, service providers
should emphasize on the explored features to attract new customers and retain old
customers as well as to increase market share.
7.3. Recommendations
The research's findings should also support the government impress upon Mobile phone
operators in Saudi Arabia to improve the services.

51 | P a g e
CITC must provide all the efforts to formulate and implement policies for Mobile services,
in particular, which are create value, relatively cheaper, the reliability of the service, and
uniform ‘call rates’.
The Mobile phone service providers should establish the appropriate factors that
influence the decisions of consumers. This research has identified the most important of
these factors (service quality and Price) which if utilized by the service providers
effectively could positively affect consumer response to their marketing strategies.
Understanding the customer and responding effectively to their needs is inevitable in this
day and age of increased competitiveness in the marketplace. Mobile phone service
providers should therefore prioritize and re-focus their efforts on the most value-adding
market initiatives.
7.4. Limitations
This research evaluated the tactics that affect customer satisfaction and trust that will
improve and maintain the loyalty, through the survey method. This research has some
limitations as follow;
This research still expect that more research efforts are needed to evaluate other
variables (corporate image; brand image) with the current study variables in Saudi mobile
phone market with larger samples.
The other issue is that this study’s finding cannot be compared directly with other
researches, as there is no previous studies that measuring all discussed factors combine
on consumers’ perception of mobile phone operators sectors at once.
Also, there is a lack of related literature that is making it difficult to draw comparisons
between factors affecting consumers’ perception in the telecom sectors were measured.
This study examined only a few factors taken from theories and research that influence
customers’ perception towards the mell phone operators. In additions, there are other
factors such as consumers learning, memory, demographic variables like users’ ethnicity,
education, income level and can look at the effects of gender, and lifestyle on the
behavior of buying and all these factores may influence consumers’ perception towards
service providers
The study is quantitative and could not evaluate the dilemma in-depth. The qualitative
studies needed to be carried out to examine the details pertaining to key factors affecting
the Saudi customers’ behavior towards the mobile network providers and how these
factors influence the level of consumer trust, satisfaction thus the brand loyalty.

52 | P a g e
Also, the research’s sample size was small. Researchers should work to increase the size
of the survey’s sample to produce more efficient dissemination of results to be more
accurate. Researchers may also widen the area of the study to cover consumers in the
various places since this study was limited to only Al Riyadh citizen. A cross-country
analysis might be an appropriate study to consider having a more global perspective of
the phenomenon.

53 | P a g e
8. Bibliography:
1) Amish, T. (2009). An Analysis of Customer-pull Factors and the Process of Store Loyalty.
13th ed. Paradigm, p.91.
2) Bryman, A. and Bell, E. (2003). Business Research Methods. New York:Oxford University
Press Inc.
3) Tseng, Y. (2007). The Impacts of Relationship Marketing Tactics on Relationship Quality
in Service Industry. pp. 310-315.
4) Reichheld, F. and Sasser, E. (1990). Zero Defections. Quality Comes to Service. Harvard
Business Review, pp. 105-111.
5) Bharatwaj, S.G., Varadarajan, P.R. and Fahy, J. (1993). Sustainable competitive
advantages in service industries, pp. 83-99.
6) En.wikipedia.org. (2016). Cell virtual network operator. [online] Available at:
https://en.wikipedia.org/wiki/Cell_virtual_network_operator [Accessed 28 Sep. 2016].
7) Mcit.gov.sa. (2016). ICT Reports. [online] Available at:
http://www.mcit.gov.sa/Ar/MediaCenter/Pages/Reports.aspx [Accessed 7 Sep. 2016].
8) Yin, R. K. (1994). Case Study Research: design and methods, London. Sage Publication
Inc.
9) wikipedia.org. (2016). Cronbach alpha. [online] Available at:
https://en.wikipedia.org/wiki/Cronbach%27s_alpha [Accessed 4 Sep. 2016].
10) Gronroos, C. (2007). Service management and marketing. Chichester, West Sussex,
England: J. Wiley & Sons.
11) Hougaard, S. and Bjerre, M. (2002). Strategic Relationship Marketing.
12) faculty.mu.edu.sa. (2016). The Influence of Relationship Marketing Tactics on Customer’s
Loyalty. [online] Available at:
http://faculty.mu.edu.sa/public/uploads/1360926400.1117relationship%20mark32.pdf
[Accessed 4 Sep. 2016].
13) Bowen, J. T. and Shoemaker, S. (2003). A Strategic Commitment, pp.31-46.
14) raco.cat. (2016). Dimensions of Perceived Service Quality in Higher Education Virtual
Learning Environments. [online] Available at:
http://www.raco.cat/index.php/RUSC/article/viewFile/284650/372878 [Accessed 4 Sep.
2016].
15) saycocorporativo.com. (2016). Service Quality, Corporate Image And Customer’s
satisfaction Towards Customers Perception: An Exploratory Study On Telecom Customers
In Bangladesh. [online] Available at:
http://www.saycocorporativo.com/saycoUK/BIJ/journal/Vol5No1/Article_6.pdf
[Accessed 4 Sep. 2016].
16) Anderson, J. and Narus, J. (1990). A Model of Distributor Firm and Manufacturer Firm
Working Partnerships. Journal of Marketing, 54(1), p.42.

54 | P a g e
17) Bansal, H. (2005). "Migrating" to New Service Providers: Toward a Unifying Framework
of Consumers' Switching Behaviors. Journal of the Academy of Marketing Science, 33(1),
pp.96-115.
18) Bitner, M., Booms, B. and Tetreault, M. (1990). The Service Encounter: Diagnosing
Favorable and Unfavorable Incidents. Journal of Marketing, 54(1), p.71.
19) Cheng, T., Lai, L. and Yeung, A. (2008). The Driving Forces of Customer Loyalty.
International Journal of E-Business Research, 4(4), pp.26-42.
20) Crosby, L., Evans, K. and Cowles, D. (1990). Relationship Quality in Services Selling: An
Interpersonal Influence Perspective. Journal of Marketing, 54(3), p.68.
21) Garbarino, E. and Johnson, M. (1999). The Different Roles of Satisfaction, Trust, and
Commitment in Customer Relationships. Journal of Marketing, 63(2), p.70.
22) Geyskens, I., Steenkamp, J. and Kumar, N. (1998). Generalizations about trust in
marketing channel relationships using meta-analysis. International Journal of Research
in Marketing, 15(3), pp.223-248.
23) Grönroos, C. (2004). The relationship marketing process: communication, interaction,
dialogue, value. Journal of Business & Industrial Marketing, 19(2), pp.99-113.
24) Wilson, D. and Jantrania, S. (1994). Understanding the Value of a Relationship. Asia-
Australia Marketing Journal, 2(1), pp.55-66.
25) Wulf, K., Odekerken-Schröder, G. and Iacobucci, D. (2001). Investments in Consumer
Relationships: A Cross-Country and Cross-Industry Exploration. Journal of Marketing,
65(4), pp.33-50.
26) Svengren, L. (1993). Case study methods in design management research. Design
Studies, 14(4), pp.444-456.
27) Patterson, P. and Smith, T. (2003). A cross-cultural study of switching barriers and
propensity to stay with service providers. Journal of Retailing, 79(2), pp.107-120.
28) Oliver, R. (1999). Whence Consumer Loyalty?. Journal of Marketing, 63, p.33.
29) N'Goala, G. (2007). Customer switching resistance (CSR). International Journal of Service
Industry Management, 18(5), pp.510-533.
30) Search.proquest.com. (2016). A consumer -based assessment of alliance performance:
An examination of consumer value, *satisfaction and post -purchase behavior -
ProQuest. [online] Available at:
http://search.proquest.com/docview/305366305/abstract [Accessed 31 Aug. 2016].
31) Yi, Y. and Gong, T. (2008). If employees “go the extra mile,” do customers reciprocate
with similar behavior?. Psychology and Marketing, 25(10), pp.961-986.
32) Huang, W., Schrank, H. and Dubinsky, A. (2004). Effect of brand name on consumers'
risk perceptions of online shopping. Journal of Consumer Behaviour, 4(1), pp.40-50.
33) Hougaard, S. and Bjerre, M. (2002). Strategic relationship marketing. Frederiksberg:
Samfundslitteratur.
34) Spath, D. and Fahnrich, K. (2007). Advances in services innovations. Berlin: Springer.

55 | P a g e
Appendix
Research questionnaire
1) Personal information
Name : ----------------------------------------- -----------------------------------
Age :
10th 20th 30th 40th + 50th
☐ ☐ ☐ ☐ ☐
Nationality : --------------------------------------------------
Gender :
Male Female
☐ ☐
Job Position :
Student Housewife Crafts Labor Employee Management Executive Business owner
☐ ☐ ☐ ☐ ☐ ☐ ☐ ☐
2) Mobile network Operator Details
Multiple Cell Numbers :
Yes No
☐ ☐
If (Yes) Count of Cell Numbers :
2 3 More
☐ ☐ ☐
Purpose of the Additional Cell Numbers :
Family Business Other
☐ ☐ ☐
Main Mobile network Operator :
STC Mobily ZAIN Lebara Virigin
☐ ☐ ☐ ☐ ☐
Years of ownership

56 | P a g e
Additional / Secondary Mobile network Operator:
STC Mobily ZAIN Lebara Virigin
☐ ☐ ☐ ☐ ☐
Years of ownership
Count of Numbers
Package:
Cell Number Postpaid Prepaid
Main ☐ ☐
Secondary
☐
☐
Charging Method:
Cell Number Online Scratched Card
Main ☐ ☐
Secondary
☒
☐
Ported Number* :
Cell Number Yes No
Main ☐ ☐
Secondary
☐
☐
Ported Numbers are those transferred from original Mobile network to another with the same number.
If (Yes) New Operator
STC Mobily ZAIN Lebara Virigin
☐ ☐ ☐ ☐ ☐
Years of ownership
3) Customer Experience
a. Service quality
1) Your mobile network operator following your requests with high priority and in reasonable time
Strongly agree Agree Neutral Disagree Strongly disagree
☐ ☐ ☐ ☐ ☐

57 | P a g e
2) The customer service of your operator are always willing to support you.
Strongly agree Agree Neutral Disagree Strongly disagree
☐ ☐ ☐ ☐ ☐
3) The required actions to your complaints are always taken seriously and quickly.
Strongly agree Agree Neutral Disagree Strongly disagree
☐ ☐ ☐ ☐ ☐
4) Your mobile network operator is a constant in providing qualified services.
Strongly agree Agree Neutral Disagree Strongly disagree
☐ ☐ ☐ ☐ ☐
5) Your operator offers customized services to satisfy customers’ need.
Strongly agree Agree Neutral Disagree Strongly disagree
☐ ☐ ☐ ☐ ☐
6) Your operator offer information on time when there are new services.
Strongly agree Agree Neutral Disagree Strongly disagree
☐ ☐ ☐ ☐ ☐
b. Price
7) Your operator took effective ways to help you to know the pricing of products and services
policies.
Strongly agree Agree Neutral Disagree Strongly disagree
☐ ☐ ☐ ☐ ☐
8) Your operator provide an attractive pricing schema of products and services.
Strongly agree Agree Neutral Disagree Strongly disagree
☐ ☐ ☐ ☐ ☐
9) Your operator offers a reasonable rates of the services.
Strongly agree Agree Neutral Disagree Strongly disagree
☐ ☐ ☐ ☐ ☐
10) My operator offers a supple price for the provided service.

58 | P a g e
Strongly agree Agree Neutral Disagree Strongly disagree
☐ ☐ ☐ ☐ ☐
11) I will keep my operator unless the prices moved up for the same service.
Strongly agree Agree Neutral Disagree Strongly disagree
☐ ☐ ☐ ☐ ☐
c. Value Offered
12) My operator provides an offers that worth the money.
Strongly agree Agree Neutral Disagree Strongly disagree
☐ ☐ ☐ ☐ ☐
13) There is a benefits from the offers provided by my operator.
Strongly agree Agree Neutral Disagree Strongly disagree
☐ ☐ ☐ ☐ ☐
14) My operator proposed rewards that were what I wanted.
Strongly agree Agree Neutral Disagree Strongly disagree
☐ ☐ ☐ ☐ ☐
15) There is a high probability to achieve the proposed reward.
Strongly agree Agree Neutral Disagree Strongly disagree
☐ ☐ ☐ ☐ ☐
d. Trust
16) My operator is reliable because it is primarily concerned with my needs.
Strongly agree Agree Neutral Disagree Strongly disagree
☐ ☐ ☐ ☐ ☐
17) My operator has a trust worthy billing system.
Strongly agree Agree Neutral Disagree Strongly disagree
☐ ☐ ☐ ☐ ☐

59 | P a g e
18) My operator has a good reputation.
Strongly agree Agree Neutral Disagree Strongly disagree
☐ ☐ ☐ ☐ ☐
19) My operator has a trust worthy policies and practices.
Strongly agree Agree Neutral Disagree Strongly disagree
☐ ☐ ☐ ☐ ☐
20) This operator provides a secure services.
Strongly agree Agree Neutral Disagree Strongly disagree
☐ ☐ ☐ ☐ ☐
e. Satisfaction
21) I am satisfied with the quality service provided by the operator.
Strongly agree Agree Neutral Disagree Strongly disagree
☐ ☐ ☐ ☐ ☐
22) I am satisfied with the professionalism of my operator.
Strongly agree Agree Neutral Disagree Strongly disagree
☐ ☐ ☐ ☐ ☐
23) I am satisfied with the performance and response of the customer service of my operator.
Strongly agree Agree Neutral Disagree Strongly disagree
☐ ☐ ☐ ☐ ☐
24) I willing to continue using mobile services from my current operator for a long time.
Strongly agree Agree Neutral Disagree Strongly disagree
☐ ☐ ☐ ☐ ☐
f. Customer loyalty

60 | P a g e
25) Even if another operator’ price is lower, I will go on using my current provider.
Strongly agree Agree Neutral Disagree Strongly disagree
☐ ☐ ☐ ☐ ☐
26) I will tell other people a good things about my operator.
Strongly agree Agree Neutral Disagree Strongly disagree
☐ ☐ ☐ ☐ ☐
27) I will encourage friends to select the services offered by my operator.
Strongly agree Agree Neutral Disagree Strongly disagree
☐ ☐ ☐ ☐ ☐
End of survey