master thesis project improving biometric log detection
TRANSCRIPT

Author: Nijat RajabliSupervisor: Welf LöweExaminer: Morgan EricssonReader: Rafael Messias MartinsSemester: HT 2020Course Code: 4DV50ESubject: Computer Science
Master Thesis Project
Improving Biometric Log Detectionwith Partitioning and Filtering of theSearch Space

Contents
1 Introduction 21.1 Background and Motivation . . . . . . . . . . . . . . . . . . . . . 21.2 Problem Statement . . . . . . . . . . . . . . . . . . . . . . . . . . 31.3 Research Questions . . . . . . . . . . . . . . . . . . . . . . . . . . 41.4 Contributions . . . . . . . . . . . . . . . . . . . . . . . . . . . . . 41.5 Target groups . . . . . . . . . . . . . . . . . . . . . . . . . . . . . 51.6 Ethical considerations . . . . . . . . . . . . . . . . . . . . . . . . . 51.7 Report Structure . . . . . . . . . . . . . . . . . . . . . . . . . . . . 5
2 Method 62.1 Formalization of the Problem Statement . . . . . . . . . . . . . . . 62.2 Scientific approach . . . . . . . . . . . . . . . . . . . . . . . . . . 72.3 Literature review . . . . . . . . . . . . . . . . . . . . . . . . . . . 72.4 Controlled experiments . . . . . . . . . . . . . . . . . . . . . . . . 7
3 Literature Review 93.1 Search and Selection . . . . . . . . . . . . . . . . . . . . . . . . . 9
3.1.1 Automatic Search . . . . . . . . . . . . . . . . . . . . . . . 93.1.2 Inclusion and Exclusion Criteria . . . . . . . . . . . . . . . 103.1.3 Snowballing . . . . . . . . . . . . . . . . . . . . . . . . . 10
3.2 Tree Log Identification . . . . . . . . . . . . . . . . . . . . . . . . 103.3 Tree Log Detection and Segmentation . . . . . . . . . . . . . . . . 113.4 Content-Based Image Retrieval . . . . . . . . . . . . . . . . . . . . 12
4 Partitioning and Filtering Approaches 134.1 Preprocessing . . . . . . . . . . . . . . . . . . . . . . . . . . . . . 13
4.1.1 Log-end Segmentation . . . . . . . . . . . . . . . . . . . . 134.1.2 Rotational Pre-alignment Strategy . . . . . . . . . . . . . . 15
4.2 Filtering Based on Log-end Geometry . . . . . . . . . . . . . . . . 164.3 Partitioning by Unsupervised Clustering . . . . . . . . . . . . . . . 17
5 Experiments 205.1 Model Configurations . . . . . . . . . . . . . . . . . . . . . . . . . 21
5.1.1 Filtering Approaches . . . . . . . . . . . . . . . . . . . . . 215.1.2 Partitioning Approaches . . . . . . . . . . . . . . . . . . . 22
5.2 Results . . . . . . . . . . . . . . . . . . . . . . . . . . . . . . . . . 23
6 Findings and Discussion 246.1 Threats to Validity . . . . . . . . . . . . . . . . . . . . . . . . . . . 25
6.1.1 Internal Validity . . . . . . . . . . . . . . . . . . . . . . . 256.1.2 External Validity . . . . . . . . . . . . . . . . . . . . . . . 25
7 Conclusion and Future Work 267.1 Conclusion . . . . . . . . . . . . . . . . . . . . . . . . . . . . . . 267.2 Future Work . . . . . . . . . . . . . . . . . . . . . . . . . . . . . . 26
References 28

Abstract
Tracking of tree logs from a harvesting site to its processing site is a legalrequirement for timber-based industries for social and economic reasons. Bio-metric tree log detection systems use images of the tree logs to track the logsby checking whether a given log image matches any of the logs registered inthe system. However, as the number of registered tree logs in the databaseincreases, the number of pairwise comparisons, and consequently the searchtime increase proportionally. Growing search space degrades the accuracy andthe response time of matching queries and slows down the tracking process,costing time and resources. This work introduces database filtering and par-titioning approaches based on discriminative log-end features to reduce thesearch space of the biometric log identification algorithms. In this study, 252unique log images are used to train and test models for extracting featuresfrom the log images and to filter and cluster a database of logs. Experimentsare carried out to show the end-to-end accuracy and speed-up impact of the in-dividual approaches as well as the combinations thereof. The findings of thisstudy indicate that the proposed approaches are suited for speeding-up tree logidentification systems and highlight further opportunities in this field.
1

1 Introduction
In this section, the general overview of the research topic, problem statement, re-search questions and objectives, the contributions of the study as well as the targetgroup that might have an interest in the study, and the report structure are presented.
1.1 Background and Motivation
Lumber-based industries are required to trace the used logs from the place they arecut to the place they are processed. One of the main reasons for this requirement isillegal logging. Besides undermining the law, illegal harvesting of timber is one ofthe direct contributors to deforestation and an indirect contributor to global warm-ing, soil erosion, and loss of biodiversity [1, 2]. Considering the environmentaland economic impact of illegal logging, within the EU, the EU Timber Regulation(EUTR) was defined and is in effect since 2013. Thus, companies that trade timberhave become legally obliged to trace the logs they are processing [3].
Currently, several approaches that leverage software technologies are used totrace the logs, with each having its own shortcomings. The simplest solution fromthe technological perspective is to physically tag each log with an image of a QRcode in the forest right after they are cut and scan this code to add the log to thesystem. When the log reaches the destination for processing, the QR code of eachlog is scanned to check if the log is in the system. However, this process is slow asit includes manual steps and bears the risk of QR tags falling off from the logs orbeing damaged during transportation.
Other approaches use the visual images of the logs to identify logs, by usingcomplex deterministic algorithms or machine learning. These algorithms use thelog images taken in the harvesting site to generate unique fingerprints and registerthem in the system. Then, when a log arrives at the processing site, a photo of thelog is taken again to check if the log is registered in the system. However, thesemethods come at a very high computational cost as they suffer from a scalabilityproblem, which is the main focus of this study.
Machine learning (ML) involves the study and development of model-basedcomputer algorithms that can learn and improve automatically using a given setof data, referred to as training data [4]. Training data might or might not includethe expected output values for each input. When output values for each input areprovided, this process is called supervised learning. On the other hand, when theground truth output values are unknown or not provided in the learning process, it isreferred to as unsupervised learning. In this study, both supervised and unsupervisedlearning algorithms are utilized. Supervised ML algorithms use the training data toapproximate a complex function in the learning phase by setting the parameters fora function class minimizing the error at (training) data points [5]. An unsupervisedlearning technique called clustering used in this work aims at grouping similar datapoints together.
Deep Learning (DL) is a sub-field of ML concerned with algorithms that useneural networks that consists of layers of linear and non-linear activation func-tions and uses gradient-based optimization [6]. In comparison to traditional MLapproaches, DL algorithms can process the data in its raw form and extract relevantparts from the data. In this study, a specific type of neural networks, ConvolutionalNeural Networks (CNNs), is used for feature extraction. CNNs are specifically de-signed to efficiently handle data that is in a multi-dimensional array form. CNNs are
2

widely used in computer vision applications since images are either in 2D (black-and-white images) or in 3D (colored images) array format. For these data types,CNNs are considered to be superior to conventional neural networks for their abil-ity to better generalize to the unseen data [7].
1.2 Problem Statement
Simplified pipelines for tree log registration in the harvesting site and matching inthe processing site are presented in figures 1.1 and 1.2 respectively. In the reg-istration process, a fingerprint for the tree log image is generated by a functiongenerate_fingerprint and stored in the database. In the processing site, a new im-age of the log is taken to query it in the system. To find a match for a given log,every fingerprint in the database should be checked against the fingerprint of thequery image to get a match score. This is done by providing a tree log fingerprintthat we want to find and a set (database) of fingerprints. The set is searched for amatch with a function identify_fingerprint that returns match scores for every pairof fingerprints that are compared. The pair with the highest match score is selected,and if the match score is higher than a given threshold, the pair is considered to bea match otherwise no match is found. Therefore, as the database size increases theresponse time of the algorithm increases proportionally. Furthermore, increasingthe size of the search space has the potential to increase the rate of false positives asthe number of similar logs increases in the database.
Due to IP and NDA restrictions, the identify_fingerprint implementation isonly used as a black box. Therefore, the scientific challenge of the project is tospeed up the current black box solution without knowing, let away changing thissolution.
Figure 1.1: Tree log registration
3

Figure 1.2: Tree log matching
1.3 Research Questions
The tree log identification algorithm prototype used in this study implements thefunction generate_fingerprint and identify_fingerprint with a certain accuracy.The goal of the project is to bring the prototype implementation to the productionlevel meeting the requirements at the processing site. That is, the project is onlyconcerned with improving the identify_fingerprint process.
For this purpose reducing the search space by filtering or partitioning the databaseinstead of searching in the set of all the registered logs is proposed. Filters are de-fined as functions that reduce the given search space based on specific feature val-ues. A formalization of the filter functions is presented in section 2.1 and the usedfilters are explained in detail in section 4.2. Success is defined as the clear assess-ment of feasibility, speed-up gain, and accuracy cost of the filtering and partitioningapproaches. Speed-up gain is defined as the quotient of the response times of thebaseline over the new approach. Accordingly, the overarching research question ofthis study is whether or not there exist efficient ways to effectively filtering or par-titioning a set of biometric log fingerprints prior to the actual identification. Threesub-questions will be answered:• RQ1: Is it possible to use partitioning and filtering to speed up the identifica-
tion process without changing the black-box identification approach? Whatis the achievable speed-up?
• RQ2: Is it possible to use partitioning and filtering, and at the same time tokeep the accuracy of the identification process without changing the black-box identification approach? What is the achievable accuracy?
• RQ3: In what way will cascading the filters impact the efficiency and accu-racy of the identification process?
While the goal is to speed up the tree log identification process in this study, theeffect of a smaller search space in the rate of false positives is also reported.
1.4 Contributions
This study contributes to the development of tree log identification systems byspeeding-up the identification process. To the best of my knowledge, based onthe results of the literature review process, there is no other study that addresses thescalability problem of tree log recognition systems. Furthermore, the study presents
4

a robust and fast CNN-based tree log segmentation approach for preprocessing thelog images, contributing to further research regarding not only speeding-up but alsothe development of tree log-identification algorithms.
1.5 Target groups
The objective and results of this study might be of interest to the researchers as wellas companies in the timber-based industries. Furthermore, the approaches used inthis study might be relevant to the researchers in the field of biometric verificationand recognition. Schraml et al. [8] refer to the resemblance of human fingerprintand iris to the tree logs. Similarly, other biometric applications that use images anda pairwise comparison of identities registered in the system such as palm and faceauthorization systems might also benefit from the reduction of the search space andthus the methods used in this study.
1.6 Ethical considerations
The experiments in this study do not use any data regarding people and their identi-ties, and therefore there are no ethical concerns involved in conducting and reportingof the experiments.
1.7 Report Structure
The thesis is organized as follows. First, section 2 presents the research methodol-ogy used in this study. Then, section 3 discusses the results of related work. Section4 presents our partitioning and filtering approaches proposed to speed up the treelog identification system. Next, in section 5, experiments to evaluate the perfor-mance and the accuracy of the partitioning and filtering approaches are shown. Theresults and findings of the experiments are then discussed in section 6. Finally, thesummary of the study and its results as well as the future research directions of thetopic are presented in section 7.
5

2 Method
In this section, first, a formalization of the research problem is provided and thenthe methodology that is used to answer the research questions is described. In thisstudy literature review and controlled experiments are used to address the objectivesof the study.
2.1 Formalization of the Problem Statement
Let I be a set of log images, F be a set of unique image identifiers called fin-gerprints, and fs and fs ′ be the set of fingerprints generated and registered in thedatabase. A special null identifier f0 ∈ F identifies an unknown image. The powerset of F is denoted by P(F ). The functional requirements of the problem can beformalized with three functions:
generate_fingerprint : I → F (1)identify_fingerprint : P(F )× I → F (2)
filter_fingerprint : P(F )× I → P(F ) (3)
where
identify_fingerprint(fs , i) =
{f, f = generate_fingerprint(i) ∧ f ∈ fs
f0, otherwise(4)
filter_fingerprint(fs , i) = fs ′ such that (5)|fs ′| � |fs| ∧ identify_fingerprint(fs ′, i) = identify_fingerprint(fs , i)
There are two geographically separated sites at which log images I are taken,harvesting and processing site. At the harvesting site, generate_fingerprint gener-ates a unique fingerprint of log images contributing to a set of generated fingerprintsfs , a subset of all possible such fingerprints F . At the production site, the functionidentify_fingerprint identifies a log based on a new image of the same log or elsereturns f0 if no matching fingerprint has been created and added to fs before. Due todifferent images taken of one and the same log at the two sites and also due to agingand possible transport damages of the logs, the identification and filtering functions(2) and (3) are probabilistic, i.e., (4) and (5) only hold with certain probabilities< 1.
It is possible to nest several filter functions filter_fingerprint (actually imple-mentations thereof). Each filter_fingerprint function takes a set of fingerprintsand returns a reduced set of fingerprints with the requirement that using the re-duced set as an input to identify_fingerprint function yields the same result asproviding the initial set of fingerprints. Thus, each reduces the problem size foridentify_fingerprint . Let [filter 1, . . . , filtern] be a sequence or cascade of filter_fingerprintimplementations. The corresponding identification process at processing site is de-fined by the composite function:
identification_process : P(F )× I → F (6)
where
identification_process(fs , i) = (7)
6

identify_fingerprint(filtern(. . . filter 1(fs , i) . . . , i), i)
Note that identification_process has the same signature as identify_fingerprint (2)and fulfills its requirements (4).
For achieving the goal, the following approaches are assessed:• Partitioning the set of generated fingerprints fs of logs• Filtering the set of log fingerprints prior to the actual identification using de-
terministic and neural network-based implementations of the filter_fingerprintfunction (cascade of filters [filter 1, . . . , filtern])
• Combination of partitioning and filtering.
2.2 Scientific approach
First, a literature review is performed to get an insight into the problem domain andthe approaches used to answer relevant research problems. Then, quantitative datathat is collected through controlled experiments are used to evaluate and comparethe approaches proposed in this work.
2.3 Literature review
A four-phase literature review is performed to provide an overview of available re-search work and evaluate the state-of-the-art in the field of study. The literaturereview is performed using the guidelines provided by Snyder [9]. In the first phaseof the literature review, namely, the design phase, the focus is on problem formu-lation, research questions, and defining a search strategy based on these. This stepis demonstrated in section 3.1.1. In the second stage, the literature search is con-ducted. Section 3.1.2 presents the inclusion and exclusion criteria that are used inthe literature search process to filter out results that are not relevant or beneficialfor answering the research questions. The search results are extended by applyingforward and backward snowballing to the resulting studies in section 3.1.3. This isfollowed by the analysis phase where found information is analyzed and evaluated.Then, based on the findings, the review is structured and written in in sections 3.2and 3.3.
2.4 Controlled experiments
Experimental research is based on the experiment or observation and its conclusionsare derived from the data and not from a theory. Experimental research should berepeatable and verifiable by applying the documented steps. This is done by design-ing end-to-end experiment pipelines that can simulate the actual real-life processes.Thus, the researcher has control over the whole experiment including the indepen-dent variables. In this study, experiments are run for each proposed approach. Anapproach can consist of a single filter or partitioning model or sequence or cascadeof models. Therefore, what approach currently is used is an independent variableand its accuracy and performance are dependent variables. Results of the experi-ments are used both to create new approaches in an iterative manner and to evaluatethe optimal approach. The control over the experiments should ensure that changesin the independent variable are indeed the reason for the change in the dependentvariables, if any change is observed [10].
7

The experimental setup and configurations of this study are presented in section5. In each iteration one variable or parameter of the experimental setup is changedin a controlled manner and its effect on the dependent variables is reported. Throughsuch iterations, optimal values for the parameters are evaluated.
8

3 Literature Review
A literature review is performed to provide an overview of available research workin the area of interest as well as in the relevant fields that might help answer theresearch questions.
3.1 Search and Selection
In this section, the search and selection process is documented. The review is con-ducted in four steps. In the first step, an automatic search is performed in electroniclibraries using a search query. In the next step, studies are selected based on inclu-sion and exclusion criteria. Then, recursive forward and backward snowballing isperformed to find relevant studies that were not found within the first step. Finally,found studies are grouped into relevant categories and analyzed in detail in sections3.2 and 3.3.
3.1.1 Automatic Search
For automatic search, the following indexing systems and electronic libraries areused: Scopus, Web Of Science, ACM Digital Library, and IEEE Explore. Accord-ing to Petersen et al. [11], these databases have the highest and most completecoverage in the field of software engineering. Additionally, Google Scholar is usedas a complementary search engine as suggested by Wohlin [12].
The following search query is used to search in title, abstract and key fields ofthe studies:
( ( ( ( timber OR lumber OR wood* OR tree OR biometric ) W/2 log ) ) AND (identif* OR trace* OR match* OR recogni* OR detect* OR classif* OR filter* OR
segment* OR cluster* ) AND image* )
The asterisk (*) operator is used to match all the words that start with the givencharacter sequence. For example, classif* matches the words "classify", "classifi-cation" or "classifier". However, all such relevant words need to be added to thesearch query when using Google Scholar as it does not support the asterisk wild-card. Likewise, some of the words need to be fully written for searching on IEEEExplore as it limits the number of wildcards to be used to 7. The operator W/2 isa Scopus-specific proximity operator which indicates that there can be at most 2words between the given keywords in the text. Since the word "log" is commonlyused in the field of computer science as an abbreviation of logarithm function or inthe context of keeping a log (i.e. error log), usage of the proximity operator helps tolimit the results to studies that are only related to timber logs. The equivalent prox-imity operator is NEAR/2 in Web of Science and AROUND(2) in Google Scholarsearch engines. Since ACM Digital Library and IEEE Explore do not have prox-imity operators, AND operator is used instead. Automatic search yields 69 searchresults on Scopus and 65 search results on Web of Science indexing systems. Lackof proximity operators leads to thousands of results on the ACM Digital Library and285 results on IEEE Explore. Usage of the proximity operator on Google Scholardoes not work as expected in a complex query and thus returns thousands of resultsas well.
9

In this study, studies regarding database similarity were not considered due tothe limitation that there is no access to the features generated by the blackbox algo-rithm. Features are stored into a binary file and loaded into the algorithm directly tomake a comparison of the two log fingerprints.
3.1.2 Inclusion and Exclusion Criteria
Following inclusion (I) and exclusion (E) criteria are applied to the results of theautomatic search in order to select relevant studies:
I1 Studies focusing on tree log identification,I2 Research work focusing on pre-processing of timber log images,E1 Studies related to tree log identification systems that do not use 2D cam-
era log-end images for matching (i.e. hyperspectral camera images, 3Dmodels, or x-ray images).
First, the abstract of the study is read to assess the relevance of the study accordingto the selection criteria. If a decision cannot be made solely based on the abstract,the full text is reviewed to decide whether to keep or exclude the study. Selectioncriteria are applied to the first 200 results of each library in automatic search, sortedby relevance. After applying inclusion and exclusion criteria, 13 results are selectedas primary studies.
3.1.3 Snowballing
Recursive forward and backward snowballing activity as defined in [12] is per-formed on 13 selected studies. This process yields 1 additional study by Barret[13].
3.2 Tree Log Identification
According to Schraml et al., [8] and [3], the first study on biometric log identifica-tion using cut log faces is carried out by Barret [13]. The study utilizes orientationindependent pseudo-Zernike polynomial moments to represent the shape informa-tion of the cross-section of the logs and patterns created by saw cuts. While themethod is shown to achieve high accuracy, it is mentioned that its test-set is toosmall to validate the results [13].
There are several challenges in tree log identification. One is that, during trans-portation, tree logs are subject to temporal variations in shape and color as a con-sequence of natural factors such as humidity and light. There are also longitudinalvariations that occur when log ends are cut or when pictures are taken from dif-ferent ends of the log when generating the log fingerprint and when identifying it.Schraml et al. [14] evaluate the impact of these variations on biometric log recog-nition by experimenting on cross-section images of 35 slices of the same tree log,captured in different time periods. In addition to these variations, surface varia-tions that are resulted from saw kerf are investigated in [3]. These two studies showthat it is possible to overcome known real-world factors to develop reliable tree logidentification algorithms.
Schraml et al. [15] illustrate the extraction of geometric features of the cross-section images of tree logs and provides experimental results on their biometricperformance based on 150 cross-section images of different logs. The experiments
10

show that out of 14 geometric features evaluated, Zernike moment of order 10 cal-culated based on the cross-section of the logs has the highest discriminative powerfollowed by pith distances and centroid distances as defined in [15].
Based on the resemblance between the human iris and tree pith and also humanfingerprints and tree rings, Schraml et al. [8] investigate whether established ap-proaches for iris and fingerprint detection can be applied to identify tree logs. Thestudy concludes that using the algorithms developed for both iris and fingerprintidentification individually with optimal configurations, a 100% tree log detectionrate can be achieved. Experiments in the study show that cross-section fingerprintenhancement as defined in [3, 8, 14] improves the results of fingerprint configura-tions while it deteriorates the error rates in iris configurations.
However, Schraml et al. [8] do not consider a wide range of scale and rota-tion variations of tree logs, which makes it less applicable to real-life situations.To address these challenges, the same authors have published another study [16]that evaluates three different rotational pre-alignment approaches, complementingtheir previous work. After considering the rotational variations, Schraml et al. [16]conclude that the best configurations presented in the study can achieve detectionrates above 93%. The result suggests that available studies in iris and fingerprintidentification can be used as complementary resources in this study.
3.3 Tree Log Detection and Segmentation
For batch processing, it is important to extract individual logs from an image oflogs, for instance, when they are already loaded into a truck. Additionally, the back-grounds of individual log images need to be removed in order to separate the logarea and extract its features. Therefore, detection and cross-section segmentation oftree logs is essential to biometric log identification applications [17].
Gutzeit and Voskamp [18] introduce a fully automated approach that utilizesobject detection for detecting individual logs in a pile and a graph-cut algorithm forthe segmentation of timber logs. In the study, the best performance for wood logsegmentation is achieved by an improved version of the KD-NN algorithm whichwas introduced in a previous study by Gutzeit et al. [19]. KD-NN algorithm isdefined as a combination of a density estimation algorithm that utilizes k-d treesfor efficiency and a graph-cut algorithm and works well on low-quality images.However, it fails when images are not taken by predefined rules, for instance whenthe pile of woods is not in the middle of the photo. Such strict restrictions on imageacquisition are loosened in the improved version of the algorithm in [18].
The cross-section segmentation approach proposed in [17] relies on similaritiesbetween neighboring blocks of an image. The algorithm uses the pith location esti-mation algorithm shown in [20] to locate the pith and use its surrounding areas asstarting points for the region growing process. The experiments of the study useimages of individual logs that are all taken from nearly the same distance.
Herbon et al. [21] introduce a completely automated approach that takes theimage processing technique proposed by Rahman et al. [22] as a basis. The ap-proach consists of a pipeline that utilizes Local Binary Patterns, Haar-like features,and Histograms of Oriented Gradients (HOG) detector. According to the results ofthe experiments in [21] and [23], the method by Herbon et al. [21] outperforms theapproach in [18].
Chiryshev et al. [23] combine the HOG detector with the Random Decision
11

Forest algorithm to extend the existing approaches and also provide a detailed com-parison of them. While utilization of the Random Decision Forest algorithm out-performs the method by Gutzeit and Voskamp [18], it still performs slightly worsethan the one in [21].
Samdangdech and Phiphobmongkol [24] do not provide a comparison of theirmethod with any of the previous methods using their dataset. However, they men-tion that their approach is not time efficient and their review suggests that it is infe-rior to the image processing technique proposed in [22].
3.4 Content-Based Image Retrieval
Content-Based Image Retrieval (CBIR) is the process of automatically fetching im-ages by extracting certain visual features, such as colors, patterns, and edges, fromthe images [25]. To the best of our knowledge, based on the literature review search,no CBIR approach is used in tree log identification systems. The success of a CBIRapproach heavily depends on the selected features [26], and these features are spe-cific to each different task. This work does not include pattern recognition or fea-ture engineering techniques due to the scarcity of research and domain knowledgeon tree log-ends and patterns of pith and annual rings. There exist successful CBIRmodels such as DELG (standing for DEep Local and Global features) by Bingyi etal. [27] and DELF (standing for DEep Local Feature) by Hyeonwoo et al. [28] thatare applied to the specific task of landmark identification and retrieval. However,these models are trained and tested only on a specific class of images. Therefore,in this study, pre-trained models that have been successful in a dataset with a greatvariety of different images are used to extract low-level features and perform exper-iments.
12

4 Partitioning and Filtering Approaches
4.1 Preprocessing
In the tree log identification process, each log is photographed at different loca-tions at different times and sometimes with different camera set-ups or technolo-gies. Hence, two images of the same log to be matched against are likely to havedifferent backgrounds, a distance of the log to the camera, and orientation of thelog-end, as logs can get rotated during transportation. Therefore it’s crucial to pre-process the log images so that an image taken in the harvesting site is comparable toan image taken in the processing site. Preprocessing of log images is performed intwo steps: log-end segmentation and rotational log-end orientation alignment. Thefollowing sections 4.1.1 and 4.1.2 describe these steps in detail.
4.1.1 Log-end Segmentation
In contrast to the papers [18, 21, 22, 23, 24], all images used in this work includesingle complete log entities only, i.e. only one log cross-section is extracted fromeach image. Therefore, the problem of cross-section segmentation can be solvedas a binary classification problem where every pixel is classified as either "log" or"non-log". For this purpose, the use of a Convolutional Neural Network (CNN)utilizing transfer learning is proposed. Transfer learning is the utilization of pre-trained networks to benefit from the knowledge gained from a larger dataset. Thisessentially enables the training of large neural networks with a small amount ofdata [29]. In this work, we experiment with the U-Net architecture [30] integratedwith two different backbone models namely MobileNetV2 [31] and EfficientNet-B3 [32]. The implementation of the integration of these models can be found in[33]. Both models are used for the encoder (down-sampling) part of the U-Netarchitecture and are initialized with the weights trained for the ImageNet dataset.ImageNet dataset consists of millions of natural images that are classified into 1000classes [34] and is widely used for semantic segmentation in biomedical studies[29]. The encoder takes the input and outputs a feature map or vector that representsthe input. Thus, the input is "down-sampled" to a smaller, encoded representationof the input that retains the important information about the input such as edges andpatterns in the input image. Using a pre-trained model is useful to detect the edgesin the images more easily since the model has already been trained on differentimages and has learned to extract the relevant edge and pattern information fromthe images.
After initializing the model with pre-trained weights to improve convergence,the model is trained with original plus augmented tree log images. For each datapoint, an image is provided as an input, and a manually drawn ground truth maskis provided as the output as shown in Figures 4.3a and 4.3b. For training, 151 outof 252 log images are selected and for each image 32 new augmented images aregenerated, making up a total of 4983 training data points. The augmentation processconsists of rotating images by a degree from 0 to 360, changing contrast, addingGaussian noise, changing brightness, and shearing by -15 to 15 degrees in both axes.All the parameters defined in each step (e.g. degree of rotation or Gaussian noiseparameters) are set randomly for each image. Ground truth masks are augmented inparallel with their corresponding images, however only geometrical transformationsteps of the augmentation are applied to the masks. The remaining 50 and 51 images
13

(a) Original image (b) Ground truth mask (c) Predicted mask
Figure 4.3: Cross-section segmentation of a log-end image
are used as is to make up the validation and test sets respectively.Both models are trained in 2 epochs with the Adam [35] optimizer. The number
of log pixels and background pixels and their ratio to each other is different in eachimage. This leads to an imbalanced classification problem where a lower weightis assigned to the class with less number of samples. Therefore, the loss functionof the optimization problem is defined as a combination of dice loss proposed byMilletari et al. [36] and focal loss presented by Lin et al. [37], as these losses aredemonstrated to be effective at mitigating the problem of imbalanced datasets:
total_loss = dice_loss+ focal_loss (8)
The learning rate has been set to 10−4 initially and is reduced automatically duringthe learning if the model stops improving.
The performance comparison of the models in the test set is presented in Table4.1. Accuracy is calculated as the percentage of correctly identified pixels out ofall pixels in the ground truth mask. U-Net + EfficientNet-B3 configuration onlyslightly outperforms U-Net + MobileNetV2 in average accuracy, however, the latterhas significantly lower minimum accuracy, meaning that in segmentation of someimages it performs much worse than the former.
Architecture Parameters Depth Min. Accuracy Mean Accuracy Max. Accuracy
U-Net + MobileNetV2 6,502,786 164 83.8% 98.3% 99.6%
U-Net + EfficientNet-B3 17,867,833 418 90.2% 98.7% 99.6%
Table 4.1: Comparison of segmentation models
Comparison of the performance of log-end segmentation with CNN models tothe approach by Schraml and Uhl [17], named EMD (based on Earth Mover’s Dis-tance), is shown in Table 4.2. Segmentation error is defined as the percentage ofthe difference between the predicted and ground-truth masks as defined in [17]. Inthe table, mean segmentation error (Mean) and standard deviation (StDev) of thesegmentation errors throughout the test set are shown. It should be noted that thetest set used in this study is different than the one used in [17] and that it is smalleras it contains 51 images compared to 108 images in [17]. Furthermore, in this
14
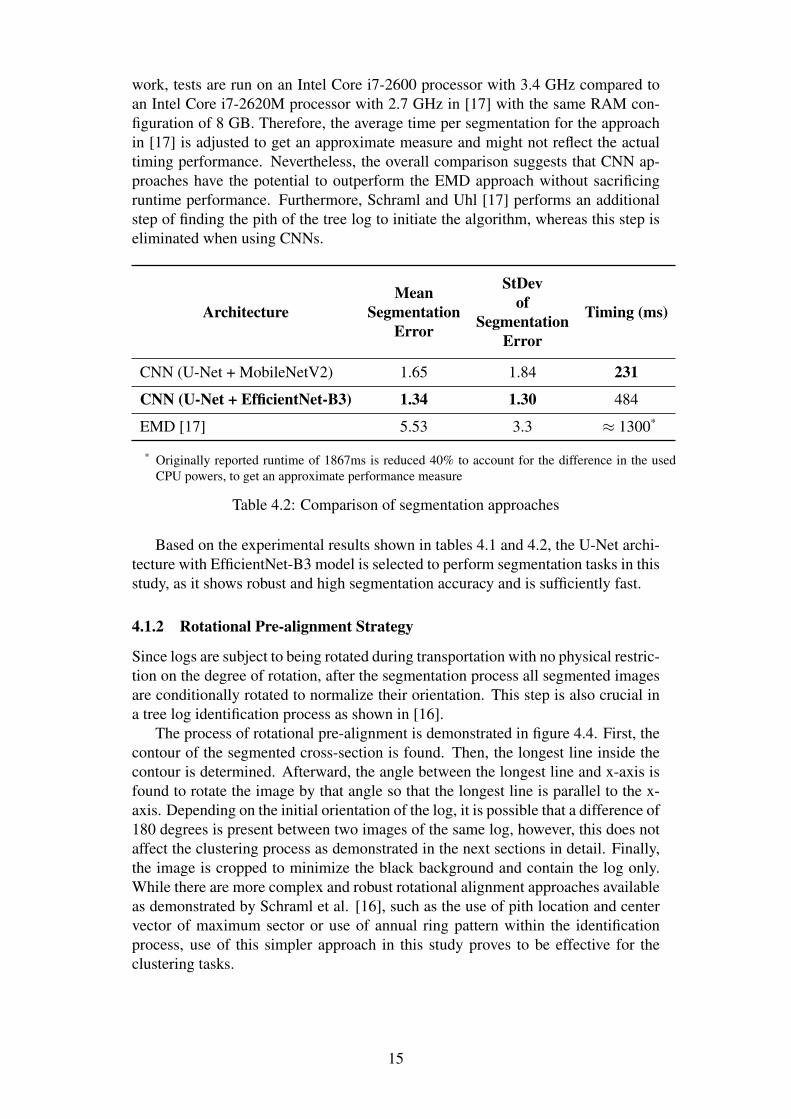
work, tests are run on an Intel Core i7-2600 processor with 3.4 GHz compared toan Intel Core i7-2620M processor with 2.7 GHz in [17] with the same RAM con-figuration of 8 GB. Therefore, the average time per segmentation for the approachin [17] is adjusted to get an approximate measure and might not reflect the actualtiming performance. Nevertheless, the overall comparison suggests that CNN ap-proaches have the potential to outperform the EMD approach without sacrificingruntime performance. Furthermore, Schraml and Uhl [17] performs an additionalstep of finding the pith of the tree log to initiate the algorithm, whereas this step iseliminated when using CNNs.
ArchitectureMean
SegmentationError
StDevof
SegmentationError
Timing (ms)
CNN (U-Net + MobileNetV2) 1.65 1.84 231
CNN (U-Net + EfficientNet-B3) 1.34 1.30 484
EMD [17] 5.53 3.3 ≈ 1300*
* Originally reported runtime of 1867ms is reduced 40% to account for the difference in the usedCPU powers, to get an approximate performance measure
Table 4.2: Comparison of segmentation approaches
Based on the experimental results shown in tables 4.1 and 4.2, the U-Net archi-tecture with EfficientNet-B3 model is selected to perform segmentation tasks in thisstudy, as it shows robust and high segmentation accuracy and is sufficiently fast.
4.1.2 Rotational Pre-alignment Strategy
Since logs are subject to being rotated during transportation with no physical restric-tion on the degree of rotation, after the segmentation process all segmented imagesare conditionally rotated to normalize their orientation. This step is also crucial ina tree log identification process as shown in [16].
The process of rotational pre-alignment is demonstrated in figure 4.4. First, thecontour of the segmented cross-section is found. Then, the longest line inside thecontour is determined. Afterward, the angle between the longest line and x-axis isfound to rotate the image by that angle so that the longest line is parallel to the x-axis. Depending on the initial orientation of the log, it is possible that a difference of180 degrees is present between two images of the same log, however, this does notaffect the clustering process as demonstrated in the next sections in detail. Finally,the image is cropped to minimize the black background and contain the log only.While there are more complex and robust rotational alignment approaches availableas demonstrated by Schraml et al. [16], such as the use of pith location and centervector of maximum sector or use of annual ring pattern within the identificationprocess, use of this simpler approach in this study proves to be effective for theclustering tasks.
15
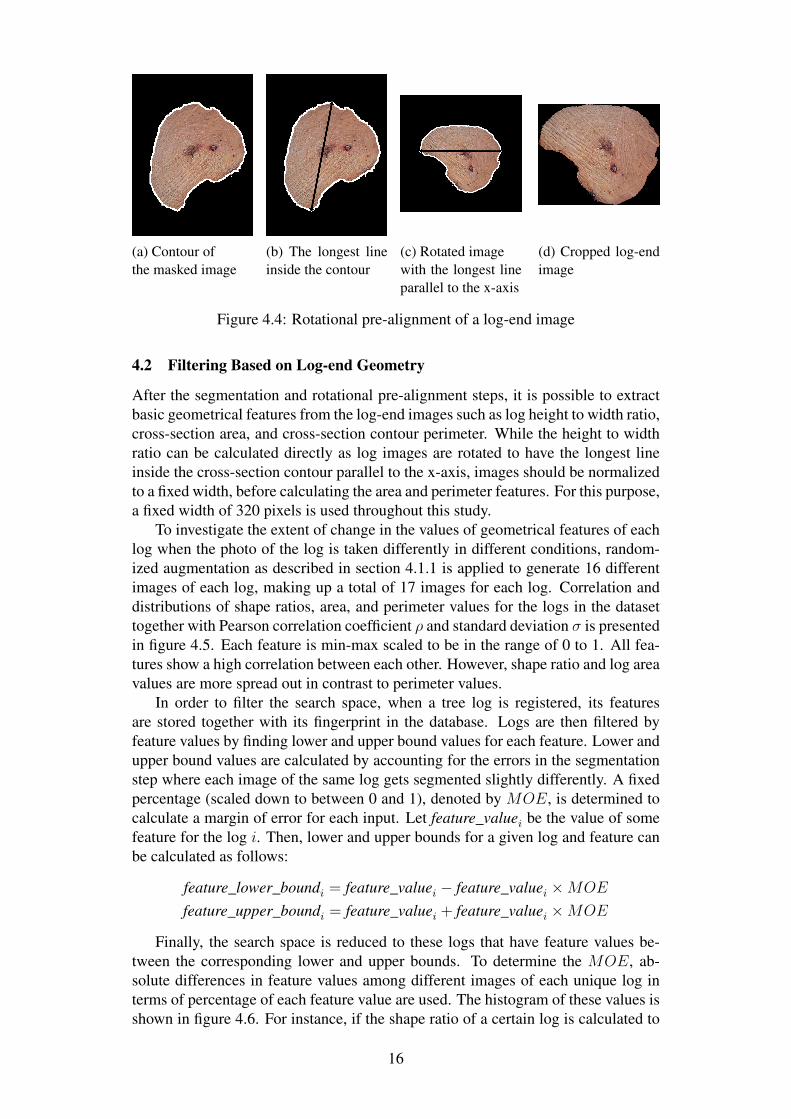
(a) Contour ofthe masked image
(b) The longest lineinside the contour
(c) Rotated imagewith the longest lineparallel to the x-axis
(d) Cropped log-endimage
Figure 4.4: Rotational pre-alignment of a log-end image
4.2 Filtering Based on Log-end Geometry
After the segmentation and rotational pre-alignment steps, it is possible to extractbasic geometrical features from the log-end images such as log height to width ratio,cross-section area, and cross-section contour perimeter. While the height to widthratio can be calculated directly as log images are rotated to have the longest lineinside the cross-section contour parallel to the x-axis, images should be normalizedto a fixed width, before calculating the area and perimeter features. For this purpose,a fixed width of 320 pixels is used throughout this study.
To investigate the extent of change in the values of geometrical features of eachlog when the photo of the log is taken differently in different conditions, random-ized augmentation as described in section 4.1.1 is applied to generate 16 differentimages of each log, making up a total of 17 images for each log. Correlation anddistributions of shape ratios, area, and perimeter values for the logs in the datasettogether with Pearson correlation coefficient ρ and standard deviation σ is presentedin figure 4.5. Each feature is min-max scaled to be in the range of 0 to 1. All fea-tures show a high correlation between each other. However, shape ratio and log areavalues are more spread out in contrast to perimeter values.
In order to filter the search space, when a tree log is registered, its featuresare stored together with its fingerprint in the database. Logs are then filtered byfeature values by finding lower and upper bound values for each feature. Lower andupper bound values are calculated by accounting for the errors in the segmentationstep where each image of the same log gets segmented slightly differently. A fixedpercentage (scaled down to between 0 and 1), denoted by MOE, is determined tocalculate a margin of error for each input. Let feature_valuei be the value of somefeature for the log i. Then, lower and upper bounds for a given log and feature canbe calculated as follows:
feature_lower_boundi = feature_valuei − feature_valuei ×MOE
feature_upper_boundi = feature_valuei + feature_valuei ×MOE
Finally, the search space is reduced to these logs that have feature values be-tween the corresponding lower and upper bounds. To determine the MOE, ab-solute differences in feature values among different images of each unique log interms of percentage of each feature value are used. The histogram of these values isshown in figure 4.6. For instance, if the shape ratio of a certain log is calculated to
16

Figure 4.5: Correlation and distributions of geometrical cross-section features
be 0.9 in its first image taken in the forest and 0.93 in the image that is taken laterin the processing site, the absolute difference between the two values is 0.03 andabsolute percentage difference is 0.03/0.93 = 3.2%. All these absolute percentagedifferences are collected and a specific percentile is defined to determine theMOE.This percentile parameter is defined as the α parameter. If α is set to 0.99, then 99thpercentile of the absolute percentage differences is determined to be the MOE. Forinstance, in the training set, in the figure 4.6, 99% of all the absolute percentagedifferences are less than 10%. Thus, if we set the α to be 99% we determine theMOE to be equal to 10%. Reducing the α means that MOE will decrease and therange of feature values will be smaller. In this case, there will be more logs thatfall out of the range and therefore a higher rate of error in filtering. On the otherhand, increasing the α will increase the accuracy, however, since the range becomeslarger and larger, too many logs will fall in the range and the search space will notbe reduced much. Therefore, the trade-off between filtering accuracy and runtimespeed-up is evaluated in section 5.
4.3 Partitioning by Unsupervised Clustering
Geometrical features extracted from the outer shape of the log-end cross-sectionsprovide very limited filtering capabilities as the features are not uniformly dis-tributed. Other than filtering, logs can also be clustered into a fixed number ofclusters and these clusters can be used to partition the database. During the regis-tration process, log fingerprints can be stored in a specific partition determined bythe log image cluster. Then, while matching, instead of searching for a match in thewhole database, the query image’s cluster can be used to limit the search space tothe partition the log belongs to.
17

Figure 4.6: Differences in feature values among different images of the same log interms of percentage of each feature value
18
For this purpose, in this study different feature extraction approaches are inves-tigated. Extracted features are used to train an unsupervised learning model andcluster log images into a specific number of clusters. One way to extract featuresis to rely on transfer learning which was proven to be effective in the segmentationstep. Models that are trained on a very large database of millions of images, partic-ularly for classification tasks, can be used to extract different geometrical featuresfrom the cross-section. Schraml et al. [15] have presented that visual features suchas annual ring patterns or those related to pith have highly reliable discriminativepower to identify the logs. The incentive behind the use of CNN approaches isto potentially capture such features from the images and analyze their effectivenessfor the use of unsupervised learning approaches such as K-means, Gaussian mixturemodels, or agglomerative clustering.
The objective of the K-means is to partition similar data points into k clusters.This is done by initializing the algorithm with k centroids each representing themean of each cluster and grouping the data points that are closest to the centroidtogether to form a cluster. K-means model uses a circle, or a hyper-sphere in higherdimensions, with its center on the centroid to define cluster boundaries with a radiusequal to the distance of the furthest data point in the cluster. In contrast, Gaussianmixture models can have more flexible boundaries by accounting for the variancein each feature as shown in figures 4.7a and 4.7b. Agglomerative clustering, on theother hand, starts by placing each data point in its own cluster, and then based on thesimilarities of the data points (e.g. based on the Euclidean distance between them),it merges the closest data points together in a hierarchical bottom-up approach toform larger clusters. However, agglomerative clustering models are only used to fitthe data and cannot make predictions on the new data. For this reason, training datais labeled with the clusters determined by the agglomerative clustering model, anda simple neural network classifier with three layers is trained to make predictionson the test dataset. The first layer of this neural network is in the shape of input fea-tures and has no activation, the second layer has 16 nodes with ReLU activation andthe last layer is used to predict the classes and therefore has the number of nodesequal to the number of clusters. Since agglomerative clustering model cannot makepredictions by design, the neural network classifier acts as a copy of the agglom-erative clustering model to make predictions. The model is trained with the labelsthat are generated by the agglomerative clustering model and reproduces its resultsas is. Therefore, the model is not fine-tuned further as it cannot perform better thanthe agglomerative clustering model itself.
For feature extraction, segmented and rotationally aligned log images are used.Images are preprocessed according to the preprocessing rules of the feature extrac-tion model used and fed into the model to eventually get a one-dimensional featurevector. To compensate for the errors in the rotational alignment step, every image isrotated from 45 to 315 degrees with 45-degree steps. Average values of the featuresof the original and rotated images are used as the final feature for the original im-age. Details of the CNN models used in this study for feature extraction are shownin table 4.3. Feature count is the size of the final feature vector after max pooling.ImageNet accuracy is the classification accuracy of the model tested on the Ima-geNet dataset [34]. The performance of the unsupervised clustering approach withdifferent configurations is discussed in section 5.
19

(a) K-means (b) Gaussian mixture model (c) Agglomerativeclustering dendrogram
Figure 4.7: Visualization of unsupervised clustering approaches
Model Feature count ImageNet [34] accuracyXception [38] 2048 79.0%ResNet50V2 [39] 2048 74.9%ResNet152V2 [40] 2048 78.0%InceptionV3 [41] 2048 77.9%MobileNetV2 [31] 1280 71.3%DenseNet201 [42] 1920 77.3%EfficientNet-B4 [32] 1792 82.6%
Table 4.3: Feature extraction models
5 Experiments
In the experimental evaluation, the performance of the filtering and partitioning ap-proaches, as well as combinations of them, are assessed. Furthermore, the effectsof different configurations of the approaches on the speed-up (how many times theprocess is sped up), rate of false positives, and false negatives are described. Thefalse-positive rate is defined as the number of pairs of logs that are matched incor-rectly over the number of all compared pairs. The false-negative rate is calculatedby dividing the number of match requests that did not result in a match while amatch was expected (e.g. the log is registered in the database but could not befound) by the total number of match requests.
In all experiments, 252 unique logs and their 16 randomly augmented versions,as described in the section 4.1.1, are used. A 10-fold cross-validation as demon-strated in 5.8 is performed in every experiment to report the results. In each fold,unique logs are split into 90% training logs and 10% test logs. All images of thelogs in the training set is used for training the models. For each unique log in thetest dataset, a pair of log images are selected out of 17 (1 original + 16 augmented)images randomly. One of the images in each pair is registered in the database as theimages taken in the harvesting site. The other half of the log images are assumed tobe photos taken in the processing site to check if they match a log in the database.This process is repeated 10 times for each fold and the mean metrics of these 10 iter-ations are stored as the final metrics of the fold. After the whole process is repeatedfor each fold, min., mean, and max. metrics of the folds are reported.
Tree log matching is performed by an external tool that is used as a black box.Two end-points of the black-box API have been used: generate_fingerprint and
20

Figure 5.8: 10-fold cross-validation
match_fingerprints. Given a log image, generate_fingerprint returns a log fin-gerprint file as described in figure 1.1. A pair of fingerprints is provided as an inputto match_fingerprints, which returns a match score for the pair. Match scoresfor the query fingerprint and every fingerprint in the search space are collected andthe pair with the highest score is selected. If the given score is greater than the -1threshold, the pair is considered to be a match, otherwise, no match is found in thesearch space.
5.1 Model Configurations
In this section, different models and their configurations are evaluated. Models arechosen based on two metrics: accuracy and speed-up. The trade-off between thetwo metrics is defined as accuracy/speed-up score. The accuracy/speed-up score iscalculated as a weighted sum of the accuracy and speed-up ratios that are normal-ized between 0 and 1. Since it is more critical to meet the response time than theaccuracy in the current application scenario, we defined the weights such that thespeed-up is more important than the accuracy (by 25%):
normalized_accuracy + normalized_speed_up× 1.25
Filtering or clustering accuracy is defined as the percentage of correctly filtered orclustered images. An image is filtered or clustered correctly if given a query image(taken in the processing site), the corresponding image (taken in the harvesting site)is present in the reduced search space. Speed-up is the run-time performance gainof reducing the search space in terms of how many times the identification processis sped up. Since each fold has 26 test logs in it, the maximum speed-up that can beachieved in the experiments is equal to 26 times.
5.1.1 Filtering Approaches
Different configurations of α parameter that determines the magnitude of the marginof error are assessed with different filtering models. Figures 5.9a, 5.9b and 5.9cshow the accuracy and speed-up trade-offs for the filtering models based on shaperatio, log-end area and perimeter values respectively. Optimal α values are selectedby the highest accuracy/speed-up scores: α = 0.96 for log-end area and perimetermodels, and α = 0.97 for the shape ratio model.
21

(a) Filtering by shape ratio
(b) Filtering by log-end area
(c) Filtering by perimeter
Figure 5.9: Accuracy and speed-up trade-offs for filtering models
5.1.2 Partitioning Approaches
Publicly-available state-of-the-art classification models are evaluated for their fea-ture extraction abilities on the logs dataset. Images are preprocessed based on themodel requirements and fed into the models. Features are extracted as describedin the section 4.3 and by using a max-pooling layer on top of each model. Thesefeatures are then used to train an unsupervised K-means model with 10 clusters.Clustering accuracy and speed-up metrics after the cross-validation is shown in ta-ble 5.4. While EfficientNet-B4 model has the highest speed-up, it performs poorlyin terms of accuracy. Considering the small differences in speed-ups among themodels, accuracy is taken as the primary merit, and therefore ResNet50V2 is se-lected for further evaluation.
Clustering accuracy Speed-up (times)Model Min. Mean Max. Min. Mean Max.Xception 76 85 92 5.07 6.41 7.37ResNet50V2 87 93 99 5.77 6.68 9.28ResNet152V2 86 92 96 5.77 6.46 8.05InceptionV3 85 91 96 4.56 6.12 7.43MobileNetV2 85 89 96 4.67 6.31 7.41DenseNet201 83 89 94 5.99 6.83 7.71EfficientNet-B4 80 89 96 5.76 6.94 7.97
Table 5.4: Comparison of feature extraction models
Next, using the ResNet50V2 model as a feature extractor, three unsupervisedlearning models are evaluated with 10 clusters. Cross-validation results of the ex-
22
periment is shown in the table 5.5. While the Gaussian mixture model outperformsthe k-means model in terms of accuracy, it has a significantly lower speed-up gain.Furthermore, the k-means model also slightly outperforms the agglomerative clus-tering model, as it has better clustering accuracy and equally good speed-up gain.
Clustering accuracy Speed-up (times)Model Min. Mean Max. Min. Mean Max.Agglomerative clustering 84 91 96 5.37 6.82 8.27K-means 87 93 99 5.77 6.68 9.28Gaussian mixture model 88 94 97 2.73 4.81 7.56
Table 5.5: Comparison of unsupervised learning approaches
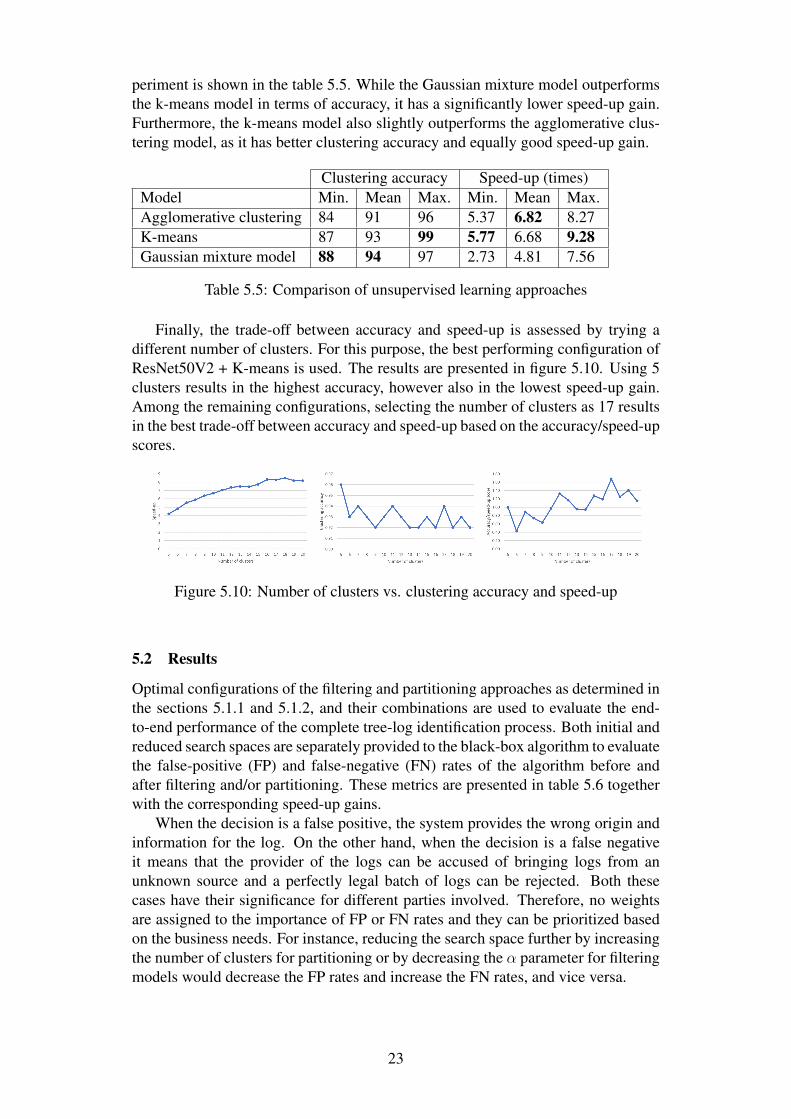
Finally, the trade-off between accuracy and speed-up is assessed by trying adifferent number of clusters. For this purpose, the best performing configuration ofResNet50V2 + K-means is used. The results are presented in figure 5.10. Using 5clusters results in the highest accuracy, however also in the lowest speed-up gain.Among the remaining configurations, selecting the number of clusters as 17 resultsin the best trade-off between accuracy and speed-up based on the accuracy/speed-upscores.
Figure 5.10: Number of clusters vs. clustering accuracy and speed-up
5.2 Results
Optimal configurations of the filtering and partitioning approaches as determined inthe sections 5.1.1 and 5.1.2, and their combinations are used to evaluate the end-to-end performance of the complete tree-log identification process. Both initial andreduced search spaces are separately provided to the black-box algorithm to evaluatethe false-positive (FP) and false-negative (FN) rates of the algorithm before andafter filtering and/or partitioning. These metrics are presented in table 5.6 togetherwith the corresponding speed-up gains.
When the decision is a false positive, the system provides the wrong origin andinformation for the log. On the other hand, when the decision is a false negativeit means that the provider of the logs can be accused of bringing logs from anunknown source and a perfectly legal batch of logs can be rejected. Both thesecases have their significance for different parties involved. Therefore, no weightsare assigned to the importance of FP or FN rates and they can be prioritized basedon the business needs. For instance, reducing the search space further by increasingthe number of clusters for partitioning or by decreasing the α parameter for filteringmodels would decrease the FP rates and increase the FN rates, and vice versa.
23

Model(s) InitialFP rate
Filtered/paritioned
FP rate
InitialFN rate
Filtered/partitioned
FN rateSpeed-up (times)
Shape ratio 0.06 0.04 0.23 0.27 2.28
Log-end area 0.06 0.03 0.23 0.28 3.04
Perimeter 0.06 0.05 0.23 0.27 1.91
Unsupervised clustering 0.06 0.02 0.23 0.31 8.27
Shape ratio+ log-end area 0.06 0.03 0.23 0.29 3.85
Unsupervised clustering+ shape ratio 0.06 0.01 0.23 0.32 12.85
Unsupervised clustering+ log-end area 0.06 0.01 0.23 0.32 13.84
Unsupervised clustering+ shape ratio+ log-end area 0.06 0.01 0.23 0.33 15.31
Table 5.6: Performance of the tree-log identification algorithm before and afterfiltering and/or partitioning
6 Findings and Discussion
The experimental results indicate that it is possible to speed-up the tree log identifi-cation algorithm by reducing the search space through both filtering and partition-ing. Accordingly, individual research questions can be answered as follows:• RQ1: It is possible to speed-up the tree log identification process, with-
out changing the black-box algorithm, by providing a reduced search spaceof fingerprints rather than all fingerprints in the database to the algorithm.The combination of partitioning and filtering approaches achieves an overallspeed-up of 15.31 times.
• RQ2: Use of partitioning and filtering approaches improves the FP rate whileincreases the FN rate. While using the configuration to achieve the maximumspeed-up, FP rate reduces by 5% while FN rate increases by 10%.
• RQ3: Using the unsupervised clustering model and log-end area based fil-tering model together improves the speed-up significantly without sacrificingmuch accuracy. However, cascading shape ratio and log-end area filteringmodels results in a very small speed-up gain as the used features are stronglycorrelated, as shown in figure 4.5.
One of the important findings of the study is regarding log-end segmentation.Achieving high segmentation accuracy is important as it directly affects the qualityof rotational pre-alignment of the log images and consequently that of geometricalfeature extraction. The use of CNNs to solve the log-end segmentation problem inthis study shows to be very effective compared to the earth mover’s distance (EMD)approach by Schraml and Uhl [17]. The results also suggest that U-Net architectureand transfer learning can be effective tools for solving segmentation problems ofsimilar nature.
Also, it is worth pointing out that, the ImageNet accuracy of feature extrac-
24

tion models used do not correlate with their effectiveness in log image clustering.EfficientNet-B4 model has the highest accuracy in the ImageNet tests, however, itperforms poorly in feature extraction compared to the inferior ResNet50V2 model.Likewise, the number of features does not seem to affect the clustering accuracy oflog images. These results suggest that the choice of a feature selection model fora specific application should not solely be based on the model’s accuracy on theImageNet dataset.
6.1 Threats to Validity
In this section potential threats to the internal and external validity of the conductedexperiments are presented.
6.1.1 Internal Validity
All experiments in this study are carried out in a deterministic way. Thus, randomseeds are initialized to get the same results in repeated runs of the whole experimen-tal pipeline. Furthermore, the same log images are used to report the initial metricsand the metrics after filtering and/or partitioning. Therefore, there are no knownfactors that could affect the FP and FN rates, and the speed-up gain other than theuse of filtering and/or partitioning approaches.
6.1.2 External Validity
The main threats to the external validity of the research results are the use of aug-mented images and the size of the dataset.
Throughout the study, augmented images are used to simulate the differences inthe images taken in harvesting and processing sites. As mentioned in the literaturereview, Schraml et al. [14] shows that logs are subject to temporal and longitudinalvariances. While image augmentation used in this study sufficiently accounts forthe conditions in which the log images are taken, it does neither account for thephysical changes in the log-end itself nor for dirt or snow covering the log-end.
In this study, 252 unique log images that are significantly diverse in terms ofcolor, shape, size, and background are used. While the number of unique logs usedin this study is more than the number of logs used in the studies regarding log-endidentification such as [15, 3] or [8], the size of the dataset still puts a limitationon the generalization of the used configurations. Experiments with a larger datasetare necessary to determine the extent the approaches used in this study can scaleto. Nevertheless, the study presents a variety of approaches and a pipeline for de-veloping and testing different configurations and promising results for use of theseapproaches in tree log identification processes.
25

7 Conclusion and Future Work
7.1 Conclusion
In this study, the scalability issue of a biometric tree log identification system isaddressed. Through experiments, the following research questions are answered:• RQ1: Is it possible to speed-up the tree log identification process through
partitioning and filtering of the search space without modifying the underly-ing matching algorithm?
• RQ2: How does partitioning and filtering approaches affect the accuracy ofthe identification system?
• RQ3: How does cascading of different methods to reduce the search spaceaffect the timing performance and accuracy of the identification system?
The findings of this study show that the use of filtering and partitioning approachesis promising to speed-up tree log identification processes without changing the un-derlying matching algorithm, which answers research question RQ1. The accuracyof the identification system is not significantly affected by filtering and partition-ing approaches. With the optimal configurations of the approaches, the end-to-endfalse-positive rate of the identification system decreases by 5% whereas the false-negative rate raises by 10%, cf. RQ2. Furthermore, cascading multiple methodstogether achieves the optimal speed-up of 15.31 times, outperforming the sepa-rate use of these methods, without sacrificing the accuracy, cf. RQ3. Results of aliterature review in the field of log-end biometrics is provided to present the state-of-the-art approaches in tree log identification, as well as preprocessing of log-endcross-section images. Furthermore, a new approach that uses Convolutional NeuralNetworks (CNNs) and transfer learning for log-end segmentation is proposed. Theresults indicate that CNNs are able to effectively and with high accuracy solve theproblem of log-end segmentation.
7.2 Future Work
Although the results of this study are very promising, further experiments on a largerdataset with real-world data that includes temporal and longitudinal variances ofthe logs should be performed in future work. Additionally, future work can investi-gate the use of feature extraction methods used in tree log identification processes,which are mentioned in the literature review, for partitioning by unsupervised learn-ing models. Additionally, CBIR approaches can be reviewed in order to improvethe features that are extracted using transfer learning by further training the modelsthrough similarity learning losses such as triplet loss [43] and contrastive loss [44].The accuracy of the partitioning approaches can also be increased by adding thelogs that are further from their cluster centers to the other closest clusters to formoverlapping clusters. This, however, would decrease the speed-up and the trade-offbetween accuracy and speed-up needs to be further investigated. Another approachthat can be investigated is the use of hashing of images such as locality-sensitivehashing or perceptual hashing to speed up the look-up times in the database search.Parallelization of the matching process can also be investigated and used togetherwith the filtering and partitioning approaches. Each pair in the reduced search spacecan be matched in parallel and the resulting match scores then be used to deter-mine the final response of the identification process. Furthermore, domain-specificknowledge regarding individual logs such as age and type can be used to classify
26

the logs into a predetermined set of classes to further reduce the search space. Thismight also be achieved by using a feature extractor such as the one used in thisstudy and applying a supervised learning algorithm instead of an unsupervised oneto learn and predict these specifications. Lastly, the use of k-dimensional trees —binary trees with leafs being k-dimensional vectors and non-leafs a splitting hyper-plane that divides the vector-space into two parts — can be investigated to be usedwith the features in the filtering step as these data structures have successfully beenapplied in search problems involving multidimensional search keys.
27
References
[1] P. Fearnside, “Deforestation in brazilian amazonia: History, rates, and conse-quences,” Conservation Biology, vol. 19, no. 3, pp. 680–688, 2005.
[2] A. Nemoto, “Illegal logging and forest certifications: An approach for forestryand wood industry sectors toward global warming issues,” Kami,Parupu Gi-jutsu Taimusu/Japanese Journal of Paper Technology, vol. 48, no. 6, pp. 9–15,2005.
[3] R. Schraml, J. Charwat-Pessler, A. Petutschnigg, and A. Uhl, “Towards theapplicability of biometric wood log traceability using digital log end images,”Computers and Electronics in Agriculture, vol. 119, pp. 112–122, 2015.
[4] T. M. Mitchell, Machine Learning, 1st ed. USA: McGraw-Hill, Inc., 1997.
[5] C. M. Bishop, Pattern Recognition and Machine Learning (Information Sci-ence and Statistics). Berlin, Heidelberg: Springer-Verlag, 2006.
[6] J. Schmidhuber, “Deep learning in neural networks: An overview,” NeuralNetworks, vol. 61, pp. 85 – 117, 2015.
[7] Y. LeCun, Y. Bengio, and G. Hinton, “Deep learning,” Nature (London), vol.521, no. 7553, pp. 436–444, 2015.
[8] R. Schraml, H. Hofbauer, A. Petutschnigg, and A. Uhl, “Tree log identifica-tion based on digital cross-section images of log ends using fingerprint andiris recognition methods,” Lecture Notes in Computer Science (including sub-series Lecture Notes in Artificial Intelligence and Lecture Notes in Bioinfor-matics), vol. 9256, pp. 752–765, 2015.
[9] H. Snyder, “Literature review as a research methodology: An overview andguidelines,” Journal of Business Research, vol. 104, pp. 333–339, 2019.
[10] K. Nallaperumal and A. Krishnan, Engineering Research Methodology AComputer Science and Engineering and Information and CommunicationTechnologies Perspective, 12 2013.
[11] K. Petersen, S. Vakkalanka, and L. Kuzniarz, “Guidelines for conducting sys-tematic mapping studies in software engineering: An update,” Informationand Software Technology, vol. 64, pp. 1–18, 2015.
[12] C. Wohlin, “Guidelines for snowballing in systematic literature studies and areplication in software engineering.” Association for Computing Machinery,2014.
[13] W. Barrett, “Biometrics of cut tree faces,” 2008, pp. 562–565.
[14] R. Schraml, J. Charwat-Pessler, and A. Uhl, “Temporal and longitudinal vari-ances in wood log cross-section image analysis.” Institute of Electrical andElectronics Engineers Inc., 2014, pp. 5706–5710.
[15] R. Schraml, A. Petutschnigg, and A. Uhl, “Validation and reliability of the dis-criminative power of geometric wood log end features,” vol. 2015-December.IEEE Computer Society, 2015, pp. 3665–3669.
28

[16] R. Schraml, H. Hofbauer, A. Petutschnigg, and A. Uhl, “On rotational pre-alignment for tree log identification using methods inspired by fingerprint andiris recognition,” Machine Vision and Applications, vol. 27, no. 8, pp. 1289–1298, 2016.
[17] R. Schraml and A. Uhl, “Similarity based cross-section segmentation in roughlog end images,” IFIP Advances in Information and Communication Technol-ogy, vol. 436, pp. 614–623, 2014.
[18] E. Gutzeit and J. Voskamp, “Automatic segmentation of wood logs by com-bining detection and segmentation,” Lecture Notes in Computer Science (in-cluding subseries Lecture Notes in Artificial Intelligence and Lecture Notes inBioinformatics), vol. 7431 LNCS, no. PART 1, pp. 252–261, 2012.
[19] E. Gutzeit, S. Ohl, J. Voskamp, A. Kuijper, and B. Urban, “Automatic woodlog segmentation using graph cuts,” Communications in Computer and Infor-mation Science, vol. 229 CCIS, pp. 96–109, 2011.
[20] R. Schraml and A. Uhl, “Pith estimation on rough log end images using localfourier spectrum analysis,” 2013, pp. 32–39.
[21] C. Herbon, K. Tönnies, and B. Stock, “Detection and segmentation of clus-tered objects by using iterative classification, segmentation, and gaussian mix-ture models and application to wood log detection,” Lecture Notes in Com-puter Science (including subseries Lecture Notes in Artificial Intelligence andLecture Notes in Bioinformatics), vol. 8753, pp. 354–364, 2014.
[22] A. Rahman, S. Yella, and M. Dougherty, “Image processing technique to countthe number of logs in a timber truck,” 2011, pp. 372–378.
[23] Y. Chiryshev, A. Kruglov, and A. Atamanova, “Automatic detection of roundtimber in digital images using random decision forests algorithm.” Associa-tion for Computing Machinery, 2018, pp. 39–44.
[24] N. Samdangdech and S. Phiphobmongkol, “Log-end cut-area detection in im-ages taken from rear end of eucalyptus timber trucks,” M. J. Sawangphol W.,Ed. Institute of Electrical and Electronics Engineers Inc., 2018.
[25] Y. Liu, D. Zhang, G. Lu, and W.-Y. Ma, “A survey of content-based image re-trieval with high-level semantics,” Pattern Recogn., vol. 40, no. 1, p. 262–282,Jan. 2007.
[26] S. Hamreras, R. Benítez-Rochel, B. Boucheham, M. A. Molina-Cabello, andE. López-Rubio, “Content based image retrieval by convolutional neural net-works,” in International Work-Conference on the Interplay Between Naturaland Artificial Computation. Springer, 2019, pp. 277–286.
[27] B. Cao, A. Araujo, and J. Sim, “Unifying deep local and global features forimage search,” 2020.
[28] H. Noh, A. Araujo, J. Sim, and B. Han, “Image retrieval with deep local fea-tures and attention-based keypoints,” CoRR, vol. abs/1612.06321, 2016.
29

[29] G. Litjens, T. Kooi, B. Bejnordi, A. Setio, F. Ciompi, M. Ghafoorian, J. van derLaak, B. van Ginneken, and C. Sánchez, “A survey on deep learning in medi-cal image analysis,” Medical Image Analysis, vol. 42, pp. 60–88, 2017.
[30] O. Ronneberger, P. Fischer, and T. Brox, “U-net: Convolutional networks forbiomedical image segmentation,” Lecture Notes in Computer Science (includ-ing subseries Lecture Notes in Artificial Intelligence and Lecture Notes inBioinformatics), vol. 9351, pp. 234–241, 2015.
[31] M. Sandler, A. Howard, M. Zhu, A. Zhmoginov, and L.-C. Chen, “Mo-bilenetv2: Inverted residuals and linear bottlenecks.” IEEE Computer So-ciety, 2018, pp. 4510–4520.
[32] M. Tan and Q. Le, “Efficientnet: Rethinking model scaling for convolutionalneural networks,” vol. 2019-June. International Machine Learning Society(IMLS), 2019, pp. 10 691–10 700.
[33] P. Yakubovskiy, “Segmentation models,” https://github.com/qubvel/segmentation_models, 2019.
[34] O. Russakovsky, J. Deng, H. Su, J. Krause, S. Satheesh, S. Ma, Z. Huang,A. Karpathy, A. Khosla, M. Bernstein, A. Berg, and L. Fei-Fei, “Imagenetlarge scale visual recognition challenge,” International Journal of ComputerVision, vol. 115, no. 3, pp. 211–252, 2015.
[35] D. Kingma and J. Ba, “Adam: A method for stochastic optimization.” Inter-national Conference on Learning Representations, ICLR, 2015.
[36] F. Milletari, N. Navab, and S.-A. Ahmadi, “V-net: Fully convolutional neuralnetworks for volumetric medical image segmentation.” Institute of Electricaland Electronics Engineers Inc., 2016, pp. 565–571.
[37] T.-Y. Lin, P. Goyal, R. Girshick, K. He, and P. Dollar, “Focal loss for denseobject detection,” vol. 2017-October. Institute of Electrical and ElectronicsEngineers Inc., 2017, pp. 2999–3007.
[38] F. Chollet, “Xception: Deep learning with depthwise separable convolutions,”vol. 2017-January. Institute of Electrical and Electronics Engineers Inc.,2017, pp. 1800–1807.
[39] K. He, X. Zhang, S. Ren, and J. Sun, “Deep residual learning for image recog-nition,” vol. 2016-December. IEEE Computer Society, 2016, pp. 770–778.
[40] K. He, X. Zhang, S. Ren, and J. Sun, “Identity mappings in deep residualnetworks,” Lecture Notes in Computer Science (including subseries LectureNotes in Artificial Intelligence and Lecture Notes in Bioinformatics), vol. 9908LNCS, pp. 630–645, 2016.
[41] C. Szegedy, V. Vanhoucke, S. Ioffe, J. Shlens, and Z. Wojna, “Rethinkingthe inception architecture for computer vision,” vol. 2016-December. IEEEComputer Society, 2016, pp. 2818–2826.
30

[42] G. Huang, Z. Liu, L. Van Der Maaten, and K. Weinberger, “Densely connectedconvolutional networks,” vol. 2017-January. Institute of Electrical and Elec-tronics Engineers Inc., 2017, pp. 2261–2269.
[43] F. Schroff, D. Kalenichenko, and J. Philbin, “Facenet: A unified embeddingfor face recognition and clustering,” CoRR, vol. abs/1503.03832, 2015.
[44] R. Hadsell, S. Chopra, and Y. LeCun, “Dimensionality reduction by learningan invariant mapping,” in 2006 IEEE Computer Society Conference on Com-puter Vision and Pattern Recognition (CVPR’06), vol. 2, 2006, pp. 1735–1742.
31