master thesis - s u€¦ · alan wiech geochemistry master thesis 45hp 5 these mats are a result of...
TRANSCRIPT

Degree Project in Geochemistry 45 hp
Master Thesis
Stockholm 2016
Department of Geological SciencesStockholm UniversitySE-106 91 Stockholm
Sweden
A Biomarker Study of Carbon Cycling in the ShallowSubmarine Hydrothermal Sediments of
Milos Island (Greece)
Alan Wiech

Alan Wiech Geochemistry Master Thesis 45hp
1
Abstract
The arsenic rich shallow submarine area surrounding Milos is affected by constant
hydrothermalism, due to the subduction of the African plate under the Eurasian plate.
Sediments affected by hydrothermalism in this area can be characterized into different
microbial mat communities, which are affected by different physico-chemical conditions.
Though these mats have been studied, the drivers of primary production, which are
imperative in tracing the geochemical cycles of trace metals and for supporting life in
this arsenic-rich environment, have yet to be studied in detail. This study therefore
seeks to contribute to this understanding by coupling a lipid biomarker analysis to
molecular microbial analysis of DNA to further constrain the processes that drive the
structuring of microbial communities in the shallow submarine hydrothermal system of
Milos. This together with compound specific δ¹³C isotope ratios of the lipid biomarkers
to distinguish the dominant carbon source together with the bulk sediment of δ¹³C-DIC,
-POC and -TOC to see if recent hydrodynamic processes are seen in the sediment
records. From this a comprehensive lipid biomarker interpretation is constructed from
the various sediments, together with RuBisCO and rTCA abundances. This indicated that
the organism’s abundance and diversity increase in the periphery and the outer regions
of the hydrothermal vent field. The same is seen through depth in the different regions,
with the microbial mats most likely affected by the sharp temperature rise. The carbon
isotope values from the two microbial mat lipids indicated that the most likely carbon
source for organism’s biosynthesis is dissolved CO₂. Furthermore, this study showed for
the first time that the main carbon fixation pathway in all sediment sites was the
RuBisCO (form II) for the chemoautotrophic and photoautotrophic organisms. This is an
important finding as the most active carbon fixation pathway in deep-sea hydrothermal
systems is the rTCA cycle. For future studies involving carbon fixation pathways in
submarine hydrothermal vent systems, the hydrothermal vent field around the island of
Milos is an ideal research location with high RuBisCO (II) activities. If there is a
connection between RuBisCO (II) and arsenic in the environment these future studies
could give a better understanding of how organisms survived in the early Earth
environments.

Alan Wiech Geochemistry Master Thesis 45hp
2
Contents
1. Introduction ................................................................................................................................... 4
2. Background .................................................................................................................................... 6
2.1. Study Area & Shallow Submarine Hydrothermal Vent Systems of Milos Island ............... 6
2.2. Biomarkers as proxies of life in geological environments ................................................... 7
2.3. Classification of organisms based on their metabolism .................................................... 10
3. Objectives ..................................................................................................................................... 14
4. Material and methods .................................................................................................................. 15
4.1. Core sampling ........................................................................................................................ 15
4.2. Sediment carbon isotope analysis, dissolved inorganic carbon (δ13C-DIC), particulate
organic carbon (δ13C-POC) and total organic carbon (δ13C-TOC) ............................................ 17
4.3. Reference pure microbial culture analysis ......................................................................... 17
4.4. Extraction of lipids from reference microbial cultures ...................................................... 18
4.5. Sediment lipid extraction ..................................................................................................... 19
4.6. Solid phase chromatography ............................................................................................... 19
4.7. Methylation and Silylation ................................................................................................... 21
4.8. Gas-chromatography Mass Spectrometry (GC-MS) ........................................................... 22
4.9. Lipid calculations .................................................................................................................. 22
4.10. Isotopic ratio mass spectrometer (IRMS) ......................................................................... 23
4.11. High Performance Liquid chromatography mass spectrometry (HPLC-MS) ................ 23
4.12. Gene abundances involved in carbon fixation pathways ................................................ 24
5. Results. .......................................................................................................................................... 25
5.1. TOC ......................................................................................................................................... 25
5.2. δ¹³C of DIC and POC .............................................................................................................. 26
5.3. Lipid analysis on collected samples .................................................................................... 29
5.4. Lipid distributions ................................................................................................................ 29
5.5. Lipid analysis of bacterial and archaeal pure cultures ...................................................... 33
5.6. Archaeol and GDGTs obtained with HPLC-MS .................................................................... 34
5.7. Isotopic signature of lipids (IRMS data) and their isotopic fractionation ........................ 36
5.8. rTCA, RuBisCO (I) and RuBisCO (II) signatures ................................................................. 36
6. Discussion ..................................................................................................................................... 40
6.1. DIC and POC ........................................................................................................................... 40
6.2. Lipid abundances affected by hydrothermal transition zones. ......................................... 40
6.3. The presence of Sterols. ....................................................................................................... 42
6.4. The presence of Hopanoids. ................................................................................................. 43
6.5. The identified GDGTs. ........................................................................................................... 43

Alan Wiech Geochemistry Master Thesis 45hp
3
6.6. Culture lipid analysis ............................................................................................................ 45
6.7. Isotopic lipid signatures indicating a mixed source from methanotrophs ...................... 45
6.8. RuBisCO (II) dominated throughout the sites .................................................................... 47
7. Conclusions .................................................................................................................................. 49
8. Acknowledgements...................................................................................................................... 50
9. References .................................................................................................................................... 51
10. Appendix .................................................................................................................................... 61

Alan Wiech Geochemistry Master Thesis 45hp
4
1. Introduction
Marine hydrothermal vent systems, usually represented by high biological
productivity (Nakagawa & Takai 2008), occur near seismically and volcanically active
sea-floor spreading regions such as the East pacific Rise (e.g. Amend et al 2011; Bennett
et al 2011), the Mid-Atlantic Ridge (e.g. Kelley et al., 2001; Amend et al 2011) and the
Volcanic arc in Mediterranean (e.g. Kilias et al., 2013; Price et al., 2013a, 2013b;
Godelitsas et al., 2015). One of the most seismically active regions on Earth is situated in
the Aegean Sea. This activity, which is a result of the subduction of the African plate
under the Eurasian plate
(Dando et al., 1994), produces
hydrothermal activity and gas
venting along the Hellenic
Volcanic Arc (HVA) (figure 1),
dating to at least five million
years ago (Kilias et al., 2013).
Here different shallow
submarine hydrothermal vent
systems are affecting many of
the islands in this region.
Greece’s island of Milos,
situated on the HVA, is
characterized by the largest
known shallow submarine
hydrothermal system that mainly expels carbon dioxide arsenic –rich fluids, along with
minor traces of H2, H2S and CH4 (Dando et al., 1995; Breuer and Pichler, 2013; Price et
al., 2013a, 2013b; Godelitsas et al., 2015). These submarine low-temperature venting
systems have in some cases precipitated iron and manganese oxides (Cronan et al.,
1995; Hein et al., 2000; Chi Fru et al., 2013; 2015), leading to an enrichment of nutrients
such as Na+, Ca2+, K+, SiO2, Mn2+ and NH3 (Fitzsimons et al., 1997), which are essential for
stimulating microbial life. However, the hydrothermal fluid that is expelled from these
systems are a net source of arsenic in these environments (Godelitsas et al., 2015).
In shallow submarine hydrothermal areas of Milos, there are sediments that can be
characterized into different group types containing Yellow-, White- and Brown- mats.
Figure 1. Hydrothermalism is affecting the regions were the
Hellenic Volcanic Arc is situated. This due to the subduction of
the African plate at the Hellenic trench area (reprinted from
Gilhooly et al. 2014).

Alan Wiech Geochemistry Master Thesis 45hp
5
These mats are a result of different hydrothermal conditions, which cause different
precipitations at the sediment-water interface and are often associated with microbial
mats (Dando et al., 1995a; Price et al., 2013a). The yellow mat, located in the most
hydrothermally active area, is mainly composed of elemental sulfur, which is condensed
on sand grains, at temperatures of up to 95°C at 2 cm sediment depth (Dando et al.,
1995b). Usually the yellow mat is surrounded by a white mat, which has a lower
temperature range of 40 to 95°C, composed of precipitated white amorphous silica and
sulfur (Dando et al., 1995a; Fitzsimons et al., 1997; Wenzhöfer et al., 2000). The
precipitated white mats are assumed to be linked to microbial activity with sulphide-
tolerant species. Moving outwards from the white mats are the brownish mats, which
are also affected by the hydrothermal activity but with a lower temperature range, with
values below 40°C at 2 cm sediment depth (Dando et al., 1995b; Wenzhöfer et al., 2000).
Ranging between 0.5 and 6 meters in diameter, these brownish mat areas are comprised
mainly of Mn-oxides and arsenic sulfides precipitated from the hydrothermal vents
(Dando et al., 1995b; Wenzhöfer et al., 2000; Price et al., 2013b).
The diversity of the microbial communities varies across the different mats
(Sievert et al., 1999; Price et al., 2013a). However, the drivers of primary production,
which are imperative in tracing the geochemical cycles of trace metals and for
supporting life in this arsenic-rich environment, have yet to be studied in detail. Though
Price et al 2013a suggested that specific Alpha- and Beta-proteobacteria could play an
important role in the arsenic cycling. Moreover, understanding the issues concerning the
effect of toxic levels of arsenic on microbial community structures distribution and
function, both in the sediments and the water column is far from complete. Although
Milos is the largest known shallow submarine hydrothermal system (Dando et al.,
1995a), no related biomarker studies coupled with carbon fixation pathways has been
produced from these areas. This study therefore seeks to contribute to this
understanding by coupling a lipid biomarker analysis to molecular microbial analysis of
DNA to further constrain the processes that drive the structuring of microbial
communities in the shallow submarine hydrothermal system of Milos. Importantly,
some hydrothermal deposits of Milos contain deposits that have been proposed as
modern banded iron formation (BIF) analogues attributed to microbial processes (Chi
Fru et al., 2013, 2015). Therefore a deep understanding of the microbial activity in the
hydrothermal vent fields may reveal new insights into our understanding of
Alan Wiech Geochemistry Master Thesis 45hp
6
biogeochemical processes that operated in the Precambrian oceans, 3.8-1.8 billion years
ago when BIFs formed (Bekker et al., 2010).
2. Background
2.1. Study Area & Shallow Submarine Hydrothermal Vent Systems of Milos Island
Beneath the Mediterranean the African plate is continuously being subducted
underneath the Eurasian plate, forming a Volcanic Arc with hydrothermal vent systems.
Out of all the hydrothermal systems in the Aegean Sea (Kilias et al., 2013), the areas
surrounding the island of Milos are the most studied (e.g. Dando et al., 1995; Breuer and
Pichler, 2013; Price et al., 2013a, 2013b; Godelitsas et al., 2015), mainly due to the
diversity of hydrothermal vents, and the easy accessibility for sampling and researching
in-situ processes. Price et al., (2013b) has shown that these low temperature
hydrothermal vent systems are primary sources of arsenic, this because the fluid
discharges have high arsenic (As) concentrations. Price et al., (2013b) analyzed pore
fluids and sediments from diffuse hydrothermal venting in both Palaeochori and Spathi
Bays, Milos, with both high and low saline hydrothermal fluids, and recorded the highest
As concentrations for any submarine hydrothermal system (as high as 78 µM in the low
saline fluids). In addition to arsenic, these systems also expel large volumes of gases in
the form of carbon dioxide (CO2, 54 - 90%), with minor signals of hydrogen (H2),
hydrogen sulfide (H2S) and methane (CH4), due to slab and mantle subduction, and
degassing of carbonates in the
sediments (Dando et al., 1995a &
1999). Moreover, the seep fluid is
enriching the areas with Na+, Ca2+, K+,
SiO2, Mn2+ and NH3, encouraging
microbial conditions, as they use these
as nutrients in their metabolic
processes (Dando et al., 1995;
Fitzsimons et al., 1997).
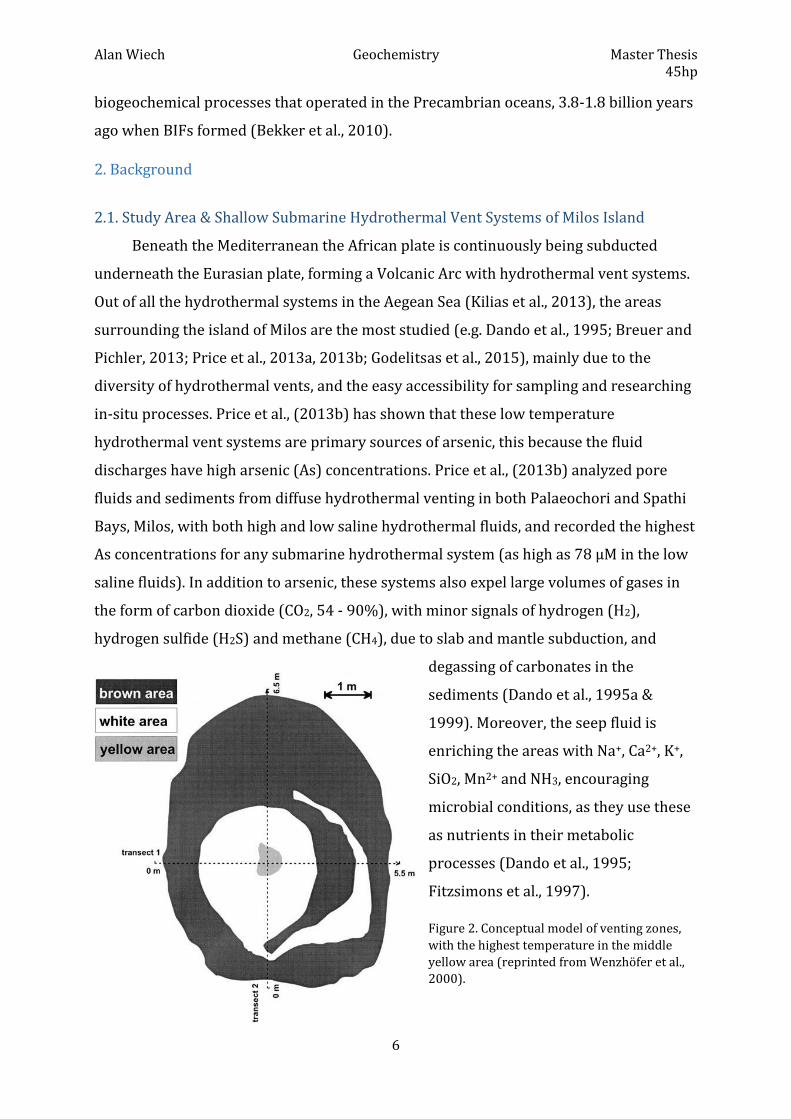
Figure 2. Conceptual model of venting zones,
with the highest temperature in the middle
yellow area (reprinted from Wenzhöfer et al.,
2000).

Alan Wiech Geochemistry Master Thesis 45hp
7
Dando et al (1995a) & Fitzsimons et al (1997) discovered three geochemically
distinct zones in the Milos hydrothermal system, with each being characterized by
distinct temperature zones (figure 2). These are the yellow-, white- and brown areas,
and due to the dynamic hydrodynamics in these oceans (e.g. tides, currents and micro-
earthquakes) the mats are constantly disappearing and re-appearing (Yücel et al., 2013).
The yellow area is in the inner vent area and is influenced by the most hydrothermal
activity, out of the three zones (Dando et al., 1995a; Fitzsimons et al., 1997; Wenzhöfer
et al., 2000), though this was not present in this study. For the white area, in the sharp
interface between hot fluid seepage and cold-seawater, Yücel et al. (2013) revealed that
this (white) area had the strongest vent fluid influence and an overlap of O2 with free
sulfide at the surface sediment, which are conductive for the growth of sulfur-oxidizing
bacteria (Yücel et al., 2013). Amorphous silica with silica nodules and elemental sulfur
forms a white precipitate presumably together with microbial processes (Dando et al.,
1995b). Using in situ micro-sensors Wenzhöfer et al (2000) presented evidence for a
microcirculation in the hydrothermal vent outlet, this through the convective cells,
caused by the gas seepage, sucking down O2 leading to oxidation of the upstreaming H2S.
Finally, further away where the induced circulation is reduced, the brown area is
present. This area is characterized by even less hydrothermal activity and having MnO2
be partly responsible for the brown precipitate (Wenzhöfer et al., 2000). Even though
these areas, affected by dynamic hydrodynamics (Yücel et al., 2013), have been studied,
the organisms metabolic processes have yet to be researched and understood.
2.2. Biomarkers as proxies of life in geological environments
Life on Earth is diverse, the most abundant being microbial organisms. Capable of
surviving in the most unique environments, microbes are divided into three domains of
life in the phylogenetic tree (figure 3). These include: Eukarya; and the prokaryotes
Bacteria and Archaea (Woese et al., 1990). The eukaryotic domain consists of organisms
with membrane-bound nuclei and complex organelles (Woese et al., 1990), whereas the
prokaryotes are mainly characterized by single-cells (unicellular organisms) with no
membrane-bound cell nucleus or organelles (Starr et al., 1981). To protect intercellular
structures from the harsh extracellular conditions of the environment, all organisms
have lipid membranes surrounding their cellular structures. Lipid membranes allow the
passage of water; inorganic ions; consumption (carbon fixation); and waste byproducts

Alan Wiech Geochemistry Master Thesis 45hp
8
from internal reactions (Peters et al.,
2005). Almost all organisms have a
lipid bilayer surrounding the cell
membrane and nucleus (figure 4). At
opposite ends of the lipid bilayer are
hydrophilic polar head groups
(phosphate-based) connected to a
glycerol, with either an ester or ether
bond, connected to the two non-polar
tail groups (hydrophobic
hydrocarbon chains), all together
called phospholipids (Peters et al.,
2005). For bacteria and eukaryotic
organisms the head groups are
connected to the hydrophobic core
(usually a double layered hydrocarbon chain), with a glycerol backbone and ester-
bonds. However, archaeal lipids can have either a mono- or double layered hydrophobic
core with ether-bonds on the hydrocarbon chain connecting to the glycerol and polar
head group (figure 4) (Peters et al., 2005).
Organisms have evolved differently to adapt to changes in temperature. Bacteria
and eukaryota have fatty-acid tail groups connecting to their head group in the
phospholipid. To adapt to higher temperatures, the lengths of the fatty acids are often
regulated, unsaturations and/or cyclic lipids are introduced. Conversely lipid chains are
often longer when the organisms need to adapt to/tolerate higher temperatures.
Bacteria insert hopanoids as their cyclic lipids, while eukaryotes insert sterols, both of
which increase membranes stiffness and stability (Timmis 2010). Another mechanism
which increases the fluidity in the membrane, are iso or anteiso branched-chain acids in
the phospholipids (Harwood & Russel, 1984). Archaeal organisms introduce isoprenoid
sidechains, which are comprised of a five carbon structure with different lengths, as the
main structural compounds in their phospholipids (figure 4). To increase the resistance
and to become more thermally stable the addition of cyclopentyl rings are introduced
(in the tail part of the phospholipid). This makes them more densely packed and more
rigid, which in turn increases their tolerability to higher temperatures (Peters et al.,
Figure 3. A 16S rRNA gene phylogenetic tree showing
the three key domains of life (Stan-Lotter and
Fendrihan, 2012).

Alan Wiech Geochemistry Master Thesis 45hp
9
2005). Identifying specific lipid structures, recovered from the hydrothermal vent field
in Milos, could give a better understanding on how well the organisms have adapted to
these environment and also indicate which environments are the most habitable.
Figure 4. Lipid
membrane structure
of prokaryotes and
eukaryotes. Almost all
organisms have
bilayer membranes.
However, some
prokaryotes have
monolayers (reprinted
as seen in Peters et al.,
2005).
One of the ways to investigate the preservation of organic matter in soils and
sediments is by analyzing lipid biomarkers. Lipid biomarkers are preserved due to their
high resistance to biodegradation, either through sedimentation or diagenesis, where
the organic matter undergoes a chemical, physical, or biological change after its
deposition. Due to the strong carbon to carbon bonded lipid membranes, the lipids
retain enough information to link compounds such as steranes (sterols) and hopanes
(hopanoids) to eukaryotes and bacteria, respectively (Mackenzie et al., 1982). E.g.
cholesterol are biosynthesized predominantly by animals while phytosterols (sitosterol
or stigmasterol) by plants (Galea & Brown 2009). Moreover, to be able to synthesize
sterols in any case, the presence of oxygen is an absolute requirement (Galea & Brown
2009). Hopanes, on the other hand, do not need oxygen in their synthesis. Using a lipid
extraction method these lipids could bring light on what kind of organisms (eukaryotes
or prokaryotes) are dominantly present in Milos’s hydrothermal vent area.
For archaeal lipid traces, isoprenoid glycerol dialkyl glycerol tetraethers (GDGTs) and
isoprenoid glycerol dialkanol diethers (GDDs) are used to identify archaeal biomass and
information on how they were preserved (Liu et al., 2012; Lincoln et al., 2013).
Structured in isoprenoid chains, GDGTs can contain both cyclopentane and cyclohexane
moieties. E.g. the non-thermophilic Crenarchaeota, classified as Thaumarchaeota
(Smittenberg et al., 2005b; Schouten et al., 2013), can biosynthesizes GDGTs containing

Alan Wiech Geochemistry Master Thesis 45hp
10
0-; 1-; 2-; and 3- cyclopentane moieties in conjunction with a crenarchaeol and its
region-isomer (both containing four cyclopentane moieties and a cyclohexane moiety),
and has been found in marine, lacustrine and terrigenous settings (Lincoln et al., 2013;
Smittenberg et al., 2005b; Pearson et al., 2008). However, it has also been suggested that
the crenarchaeol may also be a biomarker for the biosynthesis of a thermophilic
ammonia oxidizing crenarchaeon “Candidatus Nitrosocaldus yellowstonii”, which grows
optimally at 72°C and under slightly alkaline conditions, producing high abundances of
crenarchaeol (Pearson et al., 2008; Lincoln et al 2013), which is more suitable for this
hydrothermal area. By identifying these GDGTs from the sediments from the
hydrothermal vent area of Milos, these could shed light on which archaeal organisms are
present in the systems. However, it is worth noting that recent studies suggest that
GDGTs are not limited to archaea, but can also be produced by bacteria, producing
branched GDGTs (Schouten et al., 2013 & references therein).
Lipids are vital components of cell membranes, which provide structural support
for microbial cells (Jungblut et al., 2009). Some lipids are ubiquitous while other are
specific to certain microorganisms (Casteñada & Schouten, 2011). Therefore, certain
lipids found in the geological environments can be traced back to a group of organisms
or specific processes (e.g. Zimmerman & Canuel, 2000; Coolen et al., 2004; Smittenberg
et al., 2005). This will be one of the main focusses in this study.
2.3. Classification of organisms based on their metabolism
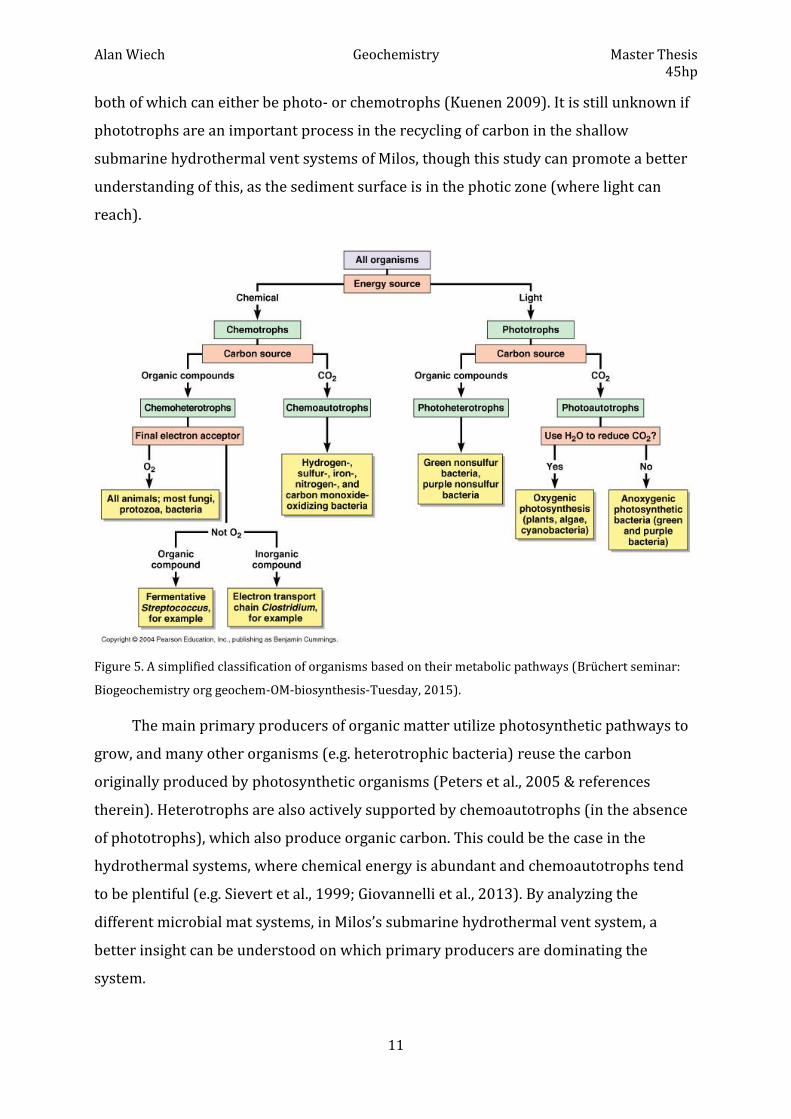
Organisms can further be classified based on their primary energy-consuming
mechanisms: autotrophic, heterotrophic, phototrophic, chemotrophic, or by a compound
using multiple terms (figure 5). Autotrophs reduce carbon dioxide (inorganic carbon)
with energy obtained either from a light- (photoautotroph) or a chemical source
(chemoautotroph). Chemoautotrophs utilize electron donors from inorganic chemical
sources (e.g. H2 or H2S) to synthesize organic compounds from CO2, making them
primary producers in extreme environments such as hydrothermal vent systems
(Nakagawa & Takai 2008). On the other hand, heterotrophs gain their carbon from
organic compounds, where light is used as an energy source for photoheterotrophs,
through anabolic (requiring energy) or catabolic (releasing energy) reactions, and
chemoheterotrophs use aerobic (oxygen) or anaerobic (in the absence of oxygen)
reaction pathways (Peters et al., 2005). There are also examples of lithotrophs that use
inorganic substrates in their biosynthesis, and organotrophs that use organic substrates,
Alan Wiech Geochemistry Master Thesis 45hp
11
both of which can either be photo- or chemotrophs (Kuenen 2009). It is still unknown if
phototrophs are an important process in the recycling of carbon in the shallow
submarine hydrothermal vent systems of Milos, though this study can promote a better
understanding of this, as the sediment surface is in the photic zone (where light can
reach).
Figure 5. A simplified classification of organisms based on their metabolic pathways (Brüchert seminar:
Biogeochemistry org geochem-OM-biosynthesis-Tuesday, 2015).
The main primary producers of organic matter utilize photosynthetic pathways to
grow, and many other organisms (e.g. heterotrophic bacteria) reuse the carbon
originally produced by photosynthetic organisms (Peters et al., 2005 & references
therein). Heterotrophs are also actively supported by chemoautotrophs (in the absence
of phototrophs), which also produce organic carbon. This could be the case in the
hydrothermal systems, where chemical energy is abundant and chemoautotrophs tend
to be plentiful (e.g. Sievert et al., 1999; Giovannelli et al., 2013). By analyzing the
different microbial mat systems, in Milos’s submarine hydrothermal vent system, a
better insight can be understood on which primary producers are dominating the
system.

Alan Wiech Geochemistry Master Thesis 45hp
12
Organisms that photosynthesize (phototrophs) e.g. green plants and some bacteria (e.g.
green-; purple bacteria; and cyanobacteria), biosynthesize through this simplified
reaction (1):
2𝐻2 𝐴 + 𝐶𝑂2
𝑙𝑖𝑔ℎ𝑡→ 2𝐴 + 𝐶𝐻2
𝑂 + 𝐻2 𝑂 (1)
Reaction 1. Here H2A = H2O and 2A = O2, for cyanobacteria and green plants; while for bacteria H2A is
some oxidizable substrate and 2A is the product of the oxidation (reprinted as seen in Peters et al., 2005).
Reaction (1) can either be used by aerobic (oxygenic photosynthesis) or anaerobic
(anoxygenic photosynthesis) organisms (Peters et al., 2005). In addition to light energy
sources, for photosynthesis to occur, the presence of nutrients, such as fixed nitrogen,
phosphates and key metals are important, thus limiting photosynthetic organisms to
terrestrial and the photic zones in lakes and oceans where relevant nutrients are
abundant. Because the main input of nutrients into aquatic environments are through
runoff, lakes usually have more nutrients than oceans, as they are enclosed by land, and
hence have a higher primary productivity (Lerman & Baccini 1978). The Earth is in a
sense balanced by photosynthesis- and respiration reactions, which is essentially
reaction 1 in the opposite direction (Peters et al., 2005).
Although most organisms that we are familiar with occur in “normal” or
“moderate” environments, and grow optimally in ~20-45°C (mesophiles), many other
organisms have adapted to grow optimally in environments considered as “extreme”
(Stan-Lotter & Fendrihan 2012). Extreme environments can be characterized by one or
several physico-chemical parameters (e.g. high/low temperature, pH and pressure). The
organisms in these environments are called extremophiles, meaning that they thrive in
extreme environmental conditions (Stan-Lotter & Fendrihan 2012). Of the three main
domains, archaea are the organisms most commonly inhabiting extreme environments
(figure 3), although they have also been found in “moderate” environments, as non-
extremophiles (Delong, 1998). Being that Milos’s hydrothermal vent areas are
influenced by physico-chemical zones, these environments should be ideal for some
extremophiles, which will be analyzed using a lipid extraction of the sediments.
Photoautotrophs and chemoautotrophs store different energy sources (light or
reduced mineral) for work in their cellular structures in the form of ATP (Adenosine

Alan Wiech Geochemistry Master Thesis 45hp
13
triphosphate) and NADPH (reduced nicotine adenosine phosphate). This energy is
utilized for the fixation of carbon. For example in phototrophic organisms such as plants
and cyanobacteria, CO2 is fixed through the use of the Calvin Benson cycle (Calvin-
Benson-Bassham Cycle (CBB)). Chemoautotrophs, like those inhabiting hydrothermal
vent ecosystems, can use several metabolic pathways for CO2 fixation, including the
Calvin Benson cycle, reductive tricarboxylic acid cycle (rTCA or reverse Krebs cycle),
acetyl-CoA pathway, dicarboxylate/4-hydroxybutyrate cycle and 3-
hydroxypropionate/4-hydroxybutyrate cycle (some of which have been measured in
this study) (Minic & Thongbam 2011 & references therein). In hydrothermal vent
systems, the carbon fixation through the assimilation of CO2 is an important
biosynthesizing process for autotrophs (Oulas et al., 2016). As seen in figure 6, the
Calvin Benson cycle uses the enzyme Ribulose 1,5-bisphosphate carboxylase/oxygenase
(RuBisCO) to fix CO2 into organic carbon, which can come in four forms (Berg et al.,
2010; Nakagawa & Takai 2008). RuBisCO (I), (II) and (III) synthesize CO2 in the same
way, by the use of RuBisCO and the difference between them being the sizes and
amounts of subunits in the cycle. RuBisCO (IV) is a RuBisCO-like protein which is not
involved in the CO2 fixation (Nakagawa & Takai 2008). Moreover, RuBisCO (II) is usually
abundant in high CO2 environments (Hayes 2001) which could be the case in the
hydrothermal area of Milos, as the gas venting is mainly composed of CO2. Though there
is no information for the presence of RuBisCO in this area, this study will attempt to
provide the first results of RuBisCO activities in the shallow submarine hydrothermal
system of Milos. Elsaied & Naganuma (2001) recorded activities from different
organisms utilizing RuBisCO (form I and II) in deep-sea and deep-sea hydrothermal
vents, proving that there is a presence of primary producers utilizing the CBB cycle.
The rTCA cycle (figure 6) is an alternative strategy to the Calvin Benson cycle, used
when the energy source is limited (low energy environments). This since the CBB cycle
requires more ATP molecules (nine) than that of the rTCA cycle (five). Campbell & Cary’s
(2004) study showed higher activities of the rTCA pathway from free-living
microorganisms in deep-sea hydrothermal vent systems. This because the cycle requires
significantly less ATP in its CO2 fixation, thus playing an important role in hydrothermal
vent environments where the energy availability is limited (Oulas et al., 2016).
Differences in the carbon fixation pathways will be explored in this study, together with
the use of stable carbon isotope analysis of lipid, to see if these shallow submarine

Alan Wiech Geochemistry Master Thesis 45hp
14
hydrothermal vent system’s main biosynthetic pathways differ from the deep-sea
hydrothermal systems, where rTCA is most promptly seen (e.g. Campbell & Cary 2004;
Elsaied & Naganuma 2001).
Figure 6. Two of the autotrophic CO2 fixation pathways, rTCA (reverse Krebs cycle) and CBB (Calvin
Benson cycle). The main enzymes in these pathways are coenzyme A and RuBisCO, respectively (Minic &
Thongbam 2011).
3. Objectives
The main objective of this study is to create the first comprehensive lipid
biomarker interpretation of sediments from the microbial mats in the shallow
submarine hydrothermal system of Milos, Greece. To help unveil ongoing microbial
metabolic processes and temporal dynamics through time, lipid biomarkers together
with compound specific isotopes (as they are often well preserved), in different
sediment types, and different carbon fixation activities will be analyzed. Through this
they will be linked to organisms and/or particular processes from the environment in
which the lipids had been deposited in (Peters et al., 2005; Castañeda and Schouten
2011). Subsequently, a better understanding of how these organisms are affected by
changes in the hydrothermal system can be understood and thus fluctuations related to
hydrothermal activity can be reconstructed. This will also increase existing knowledge

Alan Wiech Geochemistry Master Thesis 45hp
15
on microbial contribution to hydrothermal vent field biogeochemical processes, which
expected to further provide potential insights into biological activity that may have
prevailed early Earth’s oceans that were at least 3-4 times more hydrothermally active
than today (Baross & Hoffman 1985).
These objectives will be answered by:
1. Identifying and measuring the abundances of lipid biomarkers from distinct
sedimentary habitats characterized by visually different mat covers.
2. Generating preselected quantitative polymerase chain reactions of key gene
sequences from this hydrothermal system, to understand recent and past
biological processes.
3. Measuring compound specific δ¹³C isotope ratios of the lipid biomarkers to
distinguish the dominant carbon source together with the bulk sediment of δ¹³C-
DIC, -POC and -TOC to see if recent hydrodynamic processes are seen in the
sediment records.
4. Material and methods
4.1. Core sampling
At the Spathi bay, located at 36°40’N; 24°31’E, on the southeast region of Milos
Island (figure 7), a total of three areas were sampled, the white and brown microbial
mats, and a sandy reference area which was not visibly affected by the hydrothermal
emissions. Samples were collected with polycarbonates push core tubes and capped
with rubber stoppers underwater by a scuba diver. Duplicate cores were acquired for
geomicrobiological survey and three replicates for chemistry, with pre-drilled
polycarbonate tubes for pore water extraction for geochemical and isotopic analysis. In
the field, each core was sliced, under anoxic conditions, using N2 gas, in an anaerobic
glove bag. Sections were taken every 2 cm and stored in 50ml Falcon tubes on dry ice,
transported and frozen at -80°C in the laboratory at Stockholm University. Porewater
was extracted using rhizones pore water samplers attached to depressurized exetainer
bottles. These samples were stored upside down at 4°C until they were analyzed for DIC
carbon isotopic composition. Following this, one push core per site was sliced in the
anaerobic glove bag every 2 cm for bulk δ13C isotopic analysis and C:N ratios. These
were also placed in 50 ml Falcon tubes and stored under N₂ in an anoxic bag, which was
frozen on dry ice, shipped and frozen at -20°C in the laboratory at Stockholm University.

Alan Wiech Geochemistry Master Thesis 45hp
16
Figure 7. Map of the island of Milos, Greece. Arrows depict sampling area and gas emissions, from Dando
et al. (1995) are depicted by dots (modified from Price et al., 2013).

Alan Wiech Geochemistry Master Thesis 45hp
17
4.2. Sediment carbon isotope analysis, dissolved inorganic carbon (δ13C-DIC), particulate
organic carbon (δ13C-POC) and total organic carbon (δ13C-TOC)
By measuring the bulk sediments different carbon isotopes and the specific lipid
compounds an interpretation will be made to understand the carbon source for
organisms in each site. The δ13C-DIC and δ13C-POC were analyzed in Denmark, at the
Nordic Center for Earth Evolution, while the δ13C-TOC was analyzed at Stockholm
University using a duplicate core (taken from close proximity of the first cores) that
would be used for the total lipid extraction method. Using a GC-IRMS (Thermo-Scientific
– Delta plus) each sample was measured compared with the internal bicarbonate
standard together with international standards (IAEA NBS-18-Calcite (of -5.014‰VPDB
±0.035) and IAEA-LSVEC Lithium Carbonate (of -46.6‰ ±0.2)). The ratios of the carbon
isotopes (13C/12C) were reported in delta (δ) notations with respect to Vienna-PeeDee
Belemnite (VPDB). The delta notation is in units per mil (‰) following formula (2):
δ(‰) = ( 𝑅𝑠𝑎𝑚𝑝𝑙𝑒
𝑅𝑠𝑡𝑎𝑛𝑑𝑎𝑟𝑑− 1) ∗ 1000 (2)
Here R= the isotopic ratio, i.e. 13C/12C.
For the TOC and POC the samples were freeze-dried, homogenized and acid-
treated with hydrogen chloride (HCl) to ensure that no carbonate carbon would
contaminate the results of the analysis. The POC samples were then analyzed on an EA-
IRMS (Thermo–Delta V Advantage Isotope Ratio MS, EA Flash 2000 Organic elemental
analyzer, SDU Odense), compared to IVA standard Protein (δ13CVPDB = -26.98 and IVA
standard Urea δ13CVPDB = -45.38). While the TOC samples were run on a Carlo Erba
NC2500 elemental analyzer, coupled to a Finnigan MAT Delta+ mass spectrometer, at
Stockholm University. The δ13Corg was reported in parts per mil (‰) relative to Vienna
Pee Dee Belemnite (VPDB) as seen in formula (2), and the total organic carbon was
reported in %.
4.3. Reference pure microbial culture analysis
The microbial cultures selected here have been found in the HVA and will be
correlated with the lipids found in the different sediment sites.
Cultures selected for analysis:
Archaea: Methanoculleus bourgensis strain MAB1 (courtesy given by Anna Neubeck)
methanogen.

Alan Wiech Geochemistry Master Thesis 45hp
18
Bacteria: Geobacter Sulfurreducens (DSM number 12127) Fe and metal reducing,
Marinobacter santoriniensis (DSM number 21262) As (III)-oxidizer and
As (V) reducer.
Mariprofundus ferrooxydans (DMS number 23021) Fe-oxidizer.
The cultures were grown at Stockholm University in the Department of Geological
Sciences following the protocols provided from DSMZ [Deutsche Sammlung von
Mikroorganismen und Zellkulturen; microbial organism institute]. Biomass harvesting
was followed by centrifugation (20 min at 11000g) and supernatant removed using a
pipette. Less than 1 gram biomass was recovered and freeze-dried.
4.4. Extraction of lipids from reference microbial cultures To compare the lipids from the different sites with the microbial cultures that had
been identified in the HVA, an extraction method was implemented (modified from
Yamoah et al., 2016). The freeze-dried cultures were placed into combusted vials that
had been rinsed with dichloromethane (DCM) beforehand to ensure that no residue
contaminants would affect the sample results. For the extraction of the total lipid
extracts, a 1ml solvent solution, consisting of DCM/MeOH (methanol) (2:1 volume to
volume [v/v]), had been added into each vial. The cultures were then placed in an
ultrasonicator for 15min, to agitate the extracts. The solvent was then extracted into
new vials and the procedure was repeated 5 times. The extracted solvent from the
cultures extracts was then blown down, using nitrogen gas fitted to a heated plate (set to
about 25°C) to concentrate the extracts prior to storage in the freezer where they
awaited further analysis.
Because the extracted cultures may have sulfur in them, it has to be removed from
the samples prior to analysis. This since the sulfur will affect the background in the
GCMS analysis. Also to effectively recover fatty acids and alcohols from the extracts a
methylation method (adding methyl esters to compounds) and silylation method
(replacing a proton with a trimethylsilyl group) had been performed on these samples.
The sulfur removal, methylation- and silylation- methods would additionally be done on
the Milos site samples and are thus be covered in detail below (section 4.6. & 4.7.).

Alan Wiech Geochemistry Master Thesis 45hp
19
4.5. Sediment lipid extraction
A lipid analysis was performed to obtain information about the microbial presence
in the different sites in Milos. The lipid extraction method for the site samples followed a
similar method description to Smittenberg et al (2005; 2005b) and Yamoah et al. (2016).
Each sample was freeze-dried, weighed and placed into vials that had been combusted
and pre-rinsed with DCM (same as the cultures). The samples that were selected are
denoted below in table 1. The extraction of each sample was made by adding a known
volume of DCM/MeOH (2:1 v/v), about 3 times more than the sediment volume, and was
followed by vortexing the contents and placing them in the ultrasonicator for 15min and
finally centrifuged for 2min. The solvents were then extracted into new vials and the
procedure was repeated 4 more times. Finally the samples were blown down using
nitrogen gas fitted with a heated plate (25°C). The samples were then weighed, to record
the dry weight of the extracts, and then kept in the freezer.
Table 1. Depth and weight of samples from each sampled area.
Sand sed. Weight [g] Brown mat Weight [g] White mat Weight [g]
0-2 cm 8.287 0-2 cm 8.038 0-2 cm 5.075
6-8 cm 7.230 6-8 cm 7.452 6-8 cm 7.592
10-12 cm 8.613 16-18 cm 8.512 12-14 cm 8.422
4.6. Solid phase chromatography
The solid phase extraction is preformed to separate the different compounds in the
extracts and make the analytical testing more successful. This was done by eluting the
extracts into different polarity fractions going from least polar compounds
(hydrocarbons) to more polar compounds (fatty acids) (figure 8). Before the solid phase
chromatograph could proceed, two methods had to be set up prior to the solid phase
chromatography. 1st the Back Extracted Water: Pouring together a mixture of deionized
(MilliQ) water and DCM, with a ratio of 15:1 (v/v) respectively, in a large separation
funnel. Carefully, due to buildup of overpressure, the funnel is shaken to mix these
together, then letting the phases separate and draining the DCM out. This method was
repeated again twice and then the back extracted water was ready and placed in a bottle

Alan Wiech Geochemistry Master Thesis 45hp
20
with a lid. This is
done to ensure that
the water used in
the solid phase
chromatograph
does not have any
organic compounds.
2nd was the 5%
deactivated silica
gel. Weighing a 19:1
(v/v) amount of
pre-combusted
silica gel together
with back extracted
water in a bottle.
The bottle was then
shaken and left to equilibrate overnight. This will give better defined chromatographic
zones from the fraction separation (Cahnman 1957).
The extracted samples were dissolved in a small amount of DCM. To this a small
amount of 5% deactivated silica gel was added to ensure that all the extracts would be
absorbed into the silica gel, which was followed by drying the gel using only a heated
plate. From here pipette columns were prepared, using cotton wool to plug the bottom,
then adding 5% deactivated silica gel. These were then rinsed using three solvents
(MeOH, DCM and finally hexane), to ensure as much as possible, that no contaminants
would be present. After this, the absorbed silica gel was added to the column. Here the
extracts would be separated into three fractions going from least polar and then
increasing the polarity to more and more polar. 1st Fraction (F1) was eluted using only
hexane, 2nd Fraction (F2) was eluted using hexane/DCM (1:1 v/v) and the 3rd Fraction
(F3) was eluted using DCM/MeOH (1:1 v/v). Each fraction was eluted 3 times into the
same fraction vial, and then blown down using nitrogen gas.
To remove the sulfur mentioned earlier, from F1, F2 and the cultures, they had to
be cleaned using copper. This was done by filling a column with cotton wool, at the
Figure 8. Schematic figure of a solid phase chromatograph (made by Kweku
Afrifa Yamoah).

Alan Wiech Geochemistry Master Thesis 45hp
21
bottom, and adding about 2cm depth of copper powder. To activate the copper it was
rinsed with 1N HCL and then rinsed once with distilled water, three times with MeOH,
DCM and then finally with hexane. Separately F1 and F2 were then pipetted on and
rinsed with hexane/ethyl acetate (1:1 v/v), blown down again and finally a fixed amount
of hexane/ethyl acetate was added into each vial and thus ready for the analysis on the
GCMS.
4.7. Methylation and Silylation
To be separate the alcohols and fatty acids, the F3 fraction samples and the
bacteria/archaea cultures were all methylated and silylated. Methylation was performed
to make the samples less reactive (Sjöberg 2014), by adding a methyl ester group (CH3-
group) to the fatty acids present in the samples, thus making it easier to separate and
detect the peak compounds on the GCMS. A simplified reaction of the methylation
reaction is shown in reaction (3).
𝑅𝐶𝑂𝑂𝐻 + 𝐶𝐻3𝑂𝐻 ↔𝐻+ 𝑅𝐶𝑂𝑂𝐶𝐻3 + 𝐻2𝑂 (3)
Methylation of fatty acids (HTML 1).
The methylation procedure started by re-dissolving the samples (both the F3
samples and bacterial/archaeal cultures) in 0.2 ml DCM, then an addition of 1.5 ml
MeOH and 0.3 ml of HCL (8% conc.). The samples were then vortexed and incubated
overnight at 45°C. After this, 0.5 mg of pre-combusted Na₂CO₃ was added together with
1ml of hexane and 1 ml of back extracted water, followed by a vortex of the samples and
finally left to let the phases separate. From this the upper hexane layer was transferred
into new vials and blown down.
To separate the fatty acid methyl esters (FAmEs) from the alcohols, one more step
had to be made before the silylation. This was only done with the F3 from the sediment
samples due to the complexity of the samples in comparison to the cultures.
A column was filled with a small piece of cotton wool in the bottom and 5% deactivated
silica gel to about 2/3 of the column, then adding the methylated F3 absorbed extract to
the column. The column was then eluted with solvents to produce a F3a fraction and a
F3b fraction. For F3a (which holds the FAmEs) it was eluted three times with
hexane/DCM (1:1 v/v), and for F3b (alcohols and tetra-ethers) it was eluted three times
with pure ethyl acetate. The F3a samples were then blown down and a known amount of

Alan Wiech Geochemistry Master Thesis 45hp
22
hexane/ethyl acetate (1:1 v/v) was added. After this the F3a samples were now ready
for the GCMS analysis.
F3b and the culture samples finally went through the silylation procedure before
they were analyzed. Silylation introduces the replacement of a proton with a silyl group
(R1R2R3Si-O-R4, where R4 is an alkyl group), to enhance the volatility of the compounds.
However, the trimethylsilyl esters that are introduced are sensitive to any traces of
water (as water may slow or completely stop the reaction) and it is imperative that
there are no traces of water in the sample before or after the procedure. This is also
done to simplify the detection and separation of the lipid peaks in the GCMS.
The procedure was started by transferring the samples into GCMS vials and then
being blown down. After this 20 µl of pyridine was added along with 20 µl of BSTFA
(N,O-bis [trimethylsilyl] trifluoroacetamide). Samples were then place in a 60°C oven for
25 min. After this, a known amount of hexane/ethyl acetate was added and subsequently
the samples were ready for the GCMS analysis.
4.8. Gas-chromatography Mass Spectrometry (GC-MS)
For the identification of individual lipids the samples were analyzed using a
Shimadzu GCMS-QP2010 Ultra, equipped with an AOC-20i auto sampler and a split-
splitless injector operated in splitless mode. A Zebron ZB-5HT Inferno GC column (30 x
0.25 mm x 0.25 µm) was used for separation using pure helium as the carrier gas. Each
sample was injected into the GC at an oven temperature of 60°C. After 2 min, the oven
temperature was raised to 180°C at a rate of 15°C minute¯¹, and then raised again to
320°C at a rate of 4°C minute¯¹, where it was held for 20 min.
A selected ion monitoring (SIM) method was used for analysis, as the detection of
the instrument is enhanced and selective for only specific ions. In the SIM scan the
selected ions were indicative of a specific hopanoid lipid fragment of m/z 191 over the
entire run time.
4.9. Lipid calculations To calculate the relative concentrations of the lipids in the samples, a standard,
with a known concentration of 40 ng µl-1, was analyzed together when the samples were
run on the GCMS. This standard was composed of n-alkanes from C₂₁₋₄₀ and was run
three times at different intervals. The concentration calculated is relative to the standard
because there are no specific standards for the lipid biomarkers that were identified.

Alan Wiech Geochemistry Master Thesis 45hp
23
The relative concentration of each identified lipid follows this calculation method
(formula 4):
𝐿𝑖𝑝𝑖𝑑 𝑤𝑖𝑡ℎ 𝐶𝑥 [𝑛𝑔 𝑔−1𝑑𝑤 𝑠𝑎𝑚𝑝𝑙𝑒] =
(𝐴𝑟𝑒𝑎 𝑜𝑓 𝐺𝐶𝑀𝑆 𝑝𝑒𝑎𝑘 ∗ µ𝑙 𝑖𝑛𝑗𝑒𝑐𝑡𝑒𝑑
𝐴𝑣𝑒𝑟𝑎𝑔𝑒 𝑎𝑟𝑒𝑎 𝑜𝑓𝐺𝐶𝑀𝑆 𝑝𝑒𝑎𝑘 𝑓𝑜𝑟 𝐶𝑥 𝑆𝑡𝑎𝑛𝑑𝑎𝑟𝑑 [𝑎𝑟𝑒𝑎𝑛𝑔 µ𝑙−1
] ∗ µ𝑙 𝑖𝑛𝑗𝑒𝑐𝑡𝑒𝑑) ∗ µ𝑙 𝑉𝑜𝑙𝑢𝑚𝑒 𝑜𝑓 𝑠𝑎𝑚𝑝𝑙𝑒 𝑣𝑖𝑎𝑙
𝑔 𝑑𝑤 𝑠𝑎𝑚𝑝𝑙𝑒 (4)
Where x is the number of the carbons; and dw is the dry weight.
4.10. Isotopic ratio mass spectrometer (IRMS)
By measuring the carbon isotope signatures of specific lipid compounds (fatty
acids), the fractionation factor could be measured and correlated to carbon fixation
pathways (section 4.12.). For stable carbon isotopic signatures of specific lipid
compounds, the samples were run using an IRMS that measures differences in the
abundances of the 13C/12C of specific lipid compounds. Because the samples had been
methylated (CH3), isotopic signature was corrected from the biomarkers to get an
accurate δ13C result from the samples. This was done by methylating a known standard,
in this case phthalic acid with δ13C= -29.98 ±0.01‰ (relative to VPBD), and running it
run through the same IRMS analysis as the samples.
As will be seen in the results, the surface samples were the ones with the highest
concentration of biomarkers (high concentration is needed to detect and isolate the
different biomarkers). Hence these samples, an internal standard (with known isotopic
δ13C signatures) and the phthalic acid standard were all analyzed for δ13C values, using a
Thermo Finnigan Delta V Plus mass spectrometer fitted with a Trace Ultra GC 2000, GC
Isolink II and Conflo IV system. With a constant flow, helium was used as a carrier gas
with the gas chromatograph oven temperature programmed from 100 to 250°C at a rate
of 20°C min¯¹, then increasing to 340°C at a rate of 5°C min¯¹, holding for 18 min. The
peaks where then identified through the use of the GCMS peaks, and thus acquiring the
δ13C. Subsequently the δ13C values were adjusted for their methylated group, by
removing the values of these in the samples measured values.
4.11. High Performance Liquid chromatography mass spectrometry (HPLC-MS)
Further analyzing the extracted samples on a HPLC-MS the GDGTs would be
identified. Prior to the analysis the samples had been filtered in and dissolved in 9:1

Alan Wiech Geochemistry Master Thesis 45hp
24
(v/v) MeOH:DCM. The filtration was performed to ensure no flow problems through the
HPLC columns. The samples were analyzed on a Dionex Ultimate 3000RS HPLC system
coupled via an atmospheric pressure chemical ionization (APCI) interface to a Thermo
Scientific TSQ quantum access MAX triple stage quadrupole max mass spectrometer.
Peak separation was performed on a Kinetex XB C18, 1.7 µm, 150 x 2.10 mm column
from Phenomenex, with reverse phase chromatographic setting set to: Mobile phase
solution of A was MeOH with 0.04 % formic acid and mobile phase solution of B was
isopropyl alcohol (IPA) with 0.04 % formic acid (Lanekoff & Karlsson, 2010; Zhu et al.,
2013; Rattray et al., in prep). With a column temperature set to 45 °C and a flow rate of
0.2 ml min¯¹. The program of the initial composition of the mobile phases were set to 60
% of A and 40 % of B holding for 1 minute raping to 50 % to 50 % of each mobile phases
solution at 20 minutes, then held for 15 minutes and subsequently reduced to the initial
starting volumes of 60 % and 40 % of A and B respectively. The samples were kept at
room temperature during the analysis using an injected volume of 10 µl, with a total run
time of 45 minutes.
4.12. Gene abundances involved in carbon fixation pathways
With the use of polymerase chain reactions targeting specific key gene sequences,
either for RuBisCO or rTCA cycle, the detection, and diversity, of microorganisms that
utilize the RuBisCO cycle and/or rTCA cycle can be made (Campbell et al., 2003; Elsaied
& Naganuma 2001). Here quantitative polymerase chain reactions (qPCR) of key
bacterial and archaeal 16S ribosomal (rRNA) gene copies g-1 in the sediment of each site
(not shown in the results or discussion) and three small key subunit (rRNA) gene
sequences involved in inorganic carbon fixation (two RuBisCO [form I and II] units and
one rTCA unit) was conducted by Dr. Nolwenn Callac, a postdoc at the department of
geological Sciences, Stockholm University. Following this method will provide valuable
information on the specific microbial taxa (not shown in results or discussion) and the
metabolic pathways (Coolen and Gibson 2009) present in each site. The targeted subunit
gene sequences include: aclB, targeting key gene subunits fragments for the rTCA cycle;
and, cbbL and cbbM, targeting fragments of the genes encoding the RuBisCO form I and
II in the CBB cycle, respectively,

Alan Wiech Geochemistry Master Thesis 45hp
25
5. Results.
5.1. TOC
Analytical results shown in table 2 indicate that the total organic carbon contents
are very low (figure 9), with the highest mean values (0.04%) acquired from the sand
reference sediments lacking mat cover. The brown- and white microbial mats have
slightly less mean values of 0.0237% & 0.03%, respectively. The white and brown mat’s
TOC seem to decrease and increase at the same depths while the sands TOC behaves in
the opposite direction to them. The white and brown values decrease from about 0.022
to 0.02 until 5cm, where after there is an increase in TOC to 0.03% and 0.04% (for the
white and brown, respectively), that then steadily decreases with depth.
In the sand the TOC is steady at 0.03% until 5cm where it decreases to 0.022% and
then increases to 0.026% and then decreases slightly to 0.023%. All sites are depleted in
δ¹³C-TOC, with the sand sediment having the most depleted δ¹³C (-20.13‰), though not
far from the brown- and white microbial mat values that averaged -19.69‰ & -19.96‰,
respectively.
Table 2. Bulk total carbon isotope results from the three investigated sediment types.

Alan Wiech Geochemistry Master Thesis 45hp
26
Figure 9. TOC [%] through depth [cm] for the three sediment types.
5.2. δ¹³C of DIC and POC
A detailed list of the isotopic carbon δ¹³C values of the DIC and POC is presented in
table 3 (also see figure 10).
The δ¹³C-POC stays rather uniform in the range of -18‰ to -20‰, through depth
both the microbial mats, while the sand sediment stays uniform with δ¹³C-POC values of
-17‰ to -19‰, though there is a depletion in the deepest point going to -36‰.
However, in the δ¹³C-DIC the values differ more. In the white microbial mat site, the
δ¹³C-DIC becomes more enriched with depth, going from δ¹³C-DIC 0.64‰, at the
surface, to δ¹³C-DIC of 14‰ in the deepest point. The trend is similar in the brown
microbial mat site though not as extreme as in the white core. Here the surface values
are at 3.94‰ while at the deepest point is enriched with δ¹³C-DIC values of 10.7‰
which is lower but still enriched and higher than the white mat. The sand reference site
was more stable and uniform with δ¹³C-DIC value in the range of to 4.67‰ in the
surface, to 3.62‰ in the deepest point. When comparing the δ¹³C values of the DIC and
POC there seems to be a clear increase in the microbial mats, while the sand sediment
stays uniform. In the white the Δ¹³C (difference between the δ¹³C values of DIC and POC)
increases rapidly with depth, the brown mat shows the same though not as extreme
(table 3).
0
2
4
6
8
10
12
14
16
18
20
0 0,01 0,02 0,03 0,04 0,05D
epth
[cm
]TOC [%]
White mat
Brown mat
Sand ref

Alan Wiech Geochemistry Master Thesis 45hp
27
Table 3. δ¹³C [permil] vs PDB of the DIC and POC through depth for the three different sediment types.

Alan Wiech Geochemistry Master Thesis 45hp
28
Figure 10 a;b;c. Carbon isotope (δ¹³C vs PDB [permil]) trends for DIC and POC through depth for the three
sediment types investigated, a) the white mat; b) brown mat; and c) sand sediment reference.
0
2
4
6
8
10
12
14
-40,00 -30,00 -20,00 -10,00 0,00 10,00 20,00
Dep
th c
m
δ¹³C [‰]
a) White mat
0
5
10
15
20
25
-40,00 -30,00 -20,00 -10,00 0,00 10,00 20,00
Dep
th c
m
δ¹³C [‰]
b) Brown mat
0
5
10
15
20
25
-40,00 -30,00 -20,00 -10,00 0,00 10,00 20,00
Dp
eth
cm
δ¹³C [‰]
c) Sand sediment
δ¹³C-POC
δ¹³C-DIC

Alan Wiech Geochemistry Master Thesis 45hp
29
5.3. Lipid analysis on collected samples
The least polar fractions (1 and 2) did not yield any results and are thus excluded
from further consideration. However, all sites had a significant number of polar
compounds which were identified in fractions 3a and 3b (from Material and Methods
4.9.), with the highest quantity found in the surface samples at all sites. Tables 8, 10 & 12
(appendix) show a detailed lists of surface lipid biomarkers found from fraction 3a,
while tables 9, 11 & 13 (appendix) show lipid biomarkers found in fraction 3b from
surface mats of the three investigated sediment types (appendix figures 30, 31 & 32 are
the chromatographs for the brown-, sand- and white- areas respectively).
Identification of the compounds was done by investigating significant m/z (mass to
ratio) ions and using different mass spectra libraries. The most significant lipids
identified were normal, iso- and anteiso- fatty acid lipids (denoted as i or ai,
respectively); monoenoic fatty acids; sterols; and finally the hopanoids. These all have
specific spectra particular to that group and only varying slightly depending on their
carbon numbers (tables seen in appendix). The appendix has a more detailed
description on the identification and abundances of the lipids identified.
5.4. Lipid distributions
The lipid biomarkers identified and found in all surface samples (appendix tables 8
to 13) include:
Straight chain fatty acids: hexadecanoate and octadecanoate.
Unsaturated fatty acids: 9-hexacecenoate (9-16:1).
squalene and glycerol
Esters: hexadecanoic acid 2,3-bis[(trimethylsilyl)oxy] propyl ester (C16
monoglyceride) and octadecanoic 2,3-bis[(trimethylsilyl)oxy] propyl ester (C18
monoglyceride).
Sterols: cholesterol, sterol, stigmasterol and beta sitosterol (appendix table 6 &
figures 25 to 28).
Hopanoids: 17βH, 21βH-homohopanoic fatty acid, 17αH, 21βH-bishomohopanoic
fatty acid, 17βH, 21βH-bishomohopanoic fatty acid and diploptene (appendix table
7 & figure 29).

Alan Wiech Geochemistry Master Thesis 45hp
30
Although the surface samples at all sites had significant lipid biomarkers, the sand
sediment samples had the highest concentrations of lipids both at the surface and down
core. The brown and white microbial mats both had lower amounts of lipid biomarkers
in the surface sediment as well as down core, though there were some that were also
found in the deeper samples as well. These are summarized in table 4 (page 38).
The sand sediment had the most lipid biomarkers found through depth (figure 11,
12 & 13). These include: 12-methyl-tetradecanoate (aiC12:0 15Me), octadecanoate (C₁₈),
15-methyl-hexadecanoate (iC15:0 17Me ), 9-hexadecenoate (9-16:1) (monoenoic),
tetradecanoate (C₁₄), glycerol, hexadecanoic acid 2,3-bis[(trimethylsilyl)oxy] propyl
ester, octadecanoic acid 2,3-bis[(trimethylsilyl)oxy] propyl ester, cholesterol, sterol,
stigmasterol and beta sitosterol. For figure 11 biomarkers that deviate from the rest are
the hexadecanoic acid 2,3-bis[(trimethylsilyl)oxy] propyl ester and octadecanoic acid
2,3-bis[(trimethylsilyl)oxy] propyl ester, which both increase with depth. Glycerol
increases as well through depth. 12-methyl-tetradecanoate, octadecanoate and
cholesterol, all decrease through depth. The other biomarkers mentioned above behave
differently in that they decrease rapidly and then increase slightly through depth. This is
especially particular due to the other sterols acting differently from the Cholesterol.
The brown mat samples had a lower diversity of biomarkers identified down core
(figures 11, 12 & 13). These include: glycerol, hexadecanoate (C₁₆), octadecanoate (C₁₈),
hexadecanoic acid 2,3-bis[(trimethylsilyl)oxy] propyl ester and octadecanoic acid 2,3-
bis[(trimethylsilyl)oxy] propyl ester. Here, hexadecanoate decreases progressively with
depth, unlike glycerol that seems to almost have an opposite increasing trend.
Octadecanoate increases from the surface point to the middle point, then decreases
rapidly at the deepest point. Hexadecanoic acid 2,3-bis[(trimethylsilyl)oxy] propyl ester
and octadecanoic acid 2,3-bis[(trimethylsilyl)oxy] propyl ester both increase with
depth. Biomarkers found in the two upper samples include: 9-hexadecenoate (9-16:1)
(monoenoic), tetracosanoate (normal C₂₄), cholesterol, sterol, stigmasterol and beta
sitosterol. These biomarkers all decrease down core and are not found at the lowest
depth.
The white mat samples had even less biomarkers found through depth (figures 11,
12 & 13). These include: glycerol, hexadecanoate (C₁₆), octadecanoate (C₁₈),
hexadecanoic acid 2,3-bis[(trimethylsilyl)oxy] propyl ester, octadecanoic acid 2,3-

Alan Wiech Geochemistry Master Thesis 45hp
31
bis[(trimethylsilyl)oxy] propyl ester and cholesterol. Excluding the cholesterol, all
biomarkers decrease with depth. Cholesterol on the other hand decreases and then
increases slightly again, following the same trend as the other sterols in the sand
sediment (though not the sand’s cholesterol specifically).
Figure 11. C16, C18 and propyl esters approximate concentration [ng g¯¹ dw] relative to n-alkane standard
through depth. Colors: Sand references site=blue; Brown microbial mat= orange; and White microbial
mat= grey. Depths: Surface= 0-2cm; Middle= 6-8cm; and Deepest= 10-11cm for Sand; 16-18cm for Brown;
and 12-14cm for White.
0 2000 4000 6000
Surface
Middle
Deepest
Approximate concentration [ng g¯¹ dw]
Hexadecanote C₁₆
Sand
Brown
White
0 500 1000
Surface
Middle
Deepest
Approximate concentration [ng g¯¹ dw]
Octadecanoate C₁₈
0 500 1000 1500
Surface
Middle
Deepest
Approximate concentration [ng g¯¹ dw]
C16 Monoglyceride
0 500 1000
Surface
Middle
Deepest
Approximate concentration [ng g¯¹ dw]
C18 Monoglyceride

Alan Wiech Geochemistry Master Thesis 45hp
32
Figure 12. Sterols approximate concentration [ng g¯¹ dw] relative to n-alkane standard through depth.
Colors: Sand references site=blue; Brown microbial mat= orange; and White microbial mat= grey. Depths:
Surface= 0-2cm; Middle= 6-8cm; and Deepest= 10-11cm for Sand; 16-18cm for Brown; and 12-14cm for
White.
0 100 200 300
Surface
Middle
Deepest
Approximate concentration [ng g¯¹ dw]
Cholesterol C27 with Δ5
Sand
Brown
White
0 100 200
Surface
Middle
Deepest
Approximate concentration [ng g¯¹ dw]
Sterol C28 with Δ5,22
0 100 200 300 400
Surface
Middle
Deepest
Approximate concentration [ng g¯¹ dw]
Stigmasterol C29 with Δ5,22
0 200 400 600 800
Surface
Middle
Deepest
Approximate concentration [ng g¯¹ dw]
beta Sitosterol C29 with Δ5

Alan Wiech Geochemistry Master Thesis 45hp
33
Figure 13. Glycerol, C14, 9-hexadecanoate (9-16:1), aiC12:015Me and iC15:017Me approximate concentration
[ng g¯¹ dw] relative to n-alkane standard through depth. Colors: Sand references site=blue; Brown
microbial mat= orange; and White microbial mat= grey. Depths: Surface= 0-2cm; Middle= 6-8cm; and
Deepest= 10-11cm for Sand; 16-18cm for Brown; and 12-14cm for White.
5.5. Lipid analysis of bacterial and archaeal pure cultures
A detailed list of the lipid biomarkers found in the cultures in presented in
appendix table 14 (appendix figure 33 & 34). The most worth noting ones in the bacteria
0 200 400 600
Surface
Middle
Deepest
Approximate concentration [ng g¯¹ dw]
Glycerol
0 500 1000
Surface
Middle
Deepest
Approximate concentration [ng g¯¹ dw]
Tetradecanoate
0 1000 2000 3000 4000
Surface
Middle
Deepest
Approximate concentration [ng g¯¹ dw]
9-hexadecanoate (9-16:1)
0 50 100 150 200
Surface
Middle
Deepest
Approximate concentration [ng g¯¹ dw]
12-Methyltetradecanoate (anteiso C₁₅)
0 100 200 300 400
Surface
Middle
Deepest
Approximate concentration [ng g¯¹ dw]
15-Methylhexadecanoate (iso C₁₇)

Alan Wiech Geochemistry Master Thesis 45hp
34
were the hexadecanoate; octadecanoate; 9-hexadecanoate (only in the Geobacter
sulfurreducens); hexadecanoic acid 2,3-bis[(trimethylsilyl)oxy] propyl ester and
octadecanoic acid 2,3-bis[(trimethylsilyl)oxy] propyl ester, as these were all seen in the
samples as well. The contaminants are cyclononasiloxane occurring at each repetitive
point in the chromatograph. Even though the archaeal culture had lipid biomarkers
identifiable by the GCMS, the hydrocarbons (e.g. hexadecanoate) present are because
this culture was grown using yeast (appendix table 14 & figure 33).
5.6. Archaeol and GDGTs obtained with HPLC-MS
There were no identified abundances of GDGTs identified in the brown microbial
mat samples nor the sand reference samples. The most abundant concentration of
archaeols and GDGTs were found in the archaeal culture and the white microbial mat
samples (figure 14). NOTE* the concentration of all archaeols and GDGTs from these
results were calculated relative to an archaeol like standard (AStd) concentration
(standard’s name= 1,2,0-Dihexadecyl-rac-glycerol).
In the archaeal culture the most abundant structures, with the highest
concentration first: archaeol (glycerol diphytanyl diether, henceforth Ar) (m/z: 653,
1593.13 ng g¯¹ dw); GDGT-0 (m/z: 1302, 1477.54 ng g¯¹dw); GDGT-1 (m/z: 1300, 4.41
ng g¯¹ dw); GDGT-2 (m/z: 1298, 0.29 ng g¯¹ dw); and GDGT-3 (m/z: 1296, 0.05 ng g¯¹
dw). Structures seen in figures 15 & 16.
In the white mat surface sample the highest concentration was the Ar with 3.94 ng
g¯¹ dw, followed by GDGT-0 with 1.42 ng g¯¹ dw, and finally crenarchaeol with 1.11 ng
g¯¹ dw. The total amount at the surface equaled 6.71 ng g¯¹ dw. However, the middle
sample (6-8 cm) had GDGT-0, GDGT-1, GDGT-2, GDGT-3, crenarchaeol and Ar with
concentration of 1.35, 1.21, 2.34, 1.36, 1.13 and 1.62 ng g¯¹ dw respectively. The total
amount at 6-8 cm equaled to 8.52 ng g¯¹ dw.
In the deepest sample (12-14 cm) the GDGT-0, GDGT-2, GDGT-3 and crenarchaeol
were present, with concentrations of 0.04, 0.29, 0.10 and 0.18 ng g¯¹ dw respectively.
The total amount at 12-14 cm (deepest sample) equaled 0.61 ng g¯¹ dw.

Alan Wiech Geochemistry Master Thesis 45hp
35
Figure 14. GDGT abundances by depth down the white mat core.
Figure 15. Molecular structure of isoprenoid glycerol dialkyl glycerol tetraethers (GDGTs) (picture from
Liu 2011). 1st, 2nd, 3rd, 4th and 5th identified using HPLC-MS.
Figure 16. Structure of archaeol identified using HPLC-MS (picture from Liu 2011).
0 1 2 3 4 5
1
7
13
ng g¯¹ dw relative to AStd
Dep
th [
cm]
GDGT abundances
GDGT-0 GDGT-1
GDGT-2 GDGT-3
Crenarchaeol Archaeol

Alan Wiech Geochemistry Master Thesis 45hp
36
5.7. Isotopic signature of lipids (IRMS data) and their isotopic fractionation
To acquire reliable isotopic results the IRMS have to have higher detection limit
and overload amplitude. Hence the lipids with low concentrations (e.g. hopanoids many
among others) could not be measured. Fortunately, two lipids were measured in all
surface sites: 9-hexadecanoate (9-16:1) and hexadecanoate. A summary of these values
are in table 5.
Note all δ¹³C values are relative to the Vienna Pee Dee Belemnite standard.
The white microbial mat had isotopic signatures (δ¹³C) of -15.65‰ for the 9-
hexadecanoate, and -25.51‰ for the hexadecanoate, with differences between the DIC
and lipids isotopic values (Δ¹³C-DIC-lipid) of 16.55‰ and 26.84‰ respectively.
The lipids from the brown microbial mat had a higher intensity of lipids which the
IRMS could measure. Here the 9-hexadecanoate’s isotopic signature (δ¹³C) was between
-29.52‰; hexadecanoate, -29.58‰; and octadecanoate, -31.63‰. The differences
between the DIC and lipids isotopic values (Δ¹³C-DIC-lipid) were 35.30‰; 35.37‰; and
37.55‰, for 9-hexadecanoate, hexadecanoate and octadecanoate, respectively.
In the sand sediment, because lipid peak heights were even higher than the brown
microbial mat, more lipids were detectable. The lipids measured here were 12-methyl-
tetradecanoate (anteiso); 15-methyl-hexadecanoate (iso); 9-hexadecanoate;
hexadecanoate; and octadecanoate, with isotopic signatures of -19.73‰; -22.58‰; -
19.38‰; -19.89‰; and -25.68‰ respectively for each lipid biomarker. The differences
between the DIC and lipids isotopic values (Δ¹³C-DIC-lipid) in the surface sand sediment
were 25.51‰; 28.50‰; 25.15‰; 25.68‰; and 31.78‰, for 12-methyl-
tetradecanoate, 15-methyl-hexadecanoate, 9-hexadecanoate, hexadecanoate and
octadecanoate respectively (see table 5).
5.8. rTCA, RuBisCO (I) and RuBisCO (II) signatures
The inorganic carbon pathways quantified, according to the abundance of specific
genes at the different sites, varied significantly (figure 17). In the surface samples, all
sites the RuBisCO (II) was the most dominant carbon fixing enzyme, with the highest
abundance recorded in the brown, followed by the white and finally the sand reference.
The rTCA cycle in the surface did not change much between the different sites, however,
it did have the lowest values in the brown mat and sand sediment, while the lowest

Alan Wiech Geochemistry Master Thesis 45hp
37
values in the white mat was that of the RuBisCO (I) pathway. The carbon pathway for
RuBisCO (I) in the brown mat and sand sediment surface samples had a much higher
abundance compared to its quantification in the white mat’s sample.
Observing the whole core, the brown microbial mats show an increasing
abundance trend of all the cycles going towards the surface. For the white microbial mat,
the RuBisCO (I) seems to decrease towards the surface while the rTCA cycle has an
increasing trend. The RuBisCO (II) has also an increasing trend, though not many points
were obtained. The sand sediment reference seems to be fairly stable and does not have
an increasing/decreasing trend. However, the RuBisCO (II) cycle is highest in all depths.
Figure 17. How the different carbon pathway activities change through depth in the different sites, where
the orange line is for the white microbial mat site; the brown line for the brown microbial mat site; and
the blue line for the sand sediment reference site (from Dr. N. Callac, unpublished data).

Alan Wiech Geochemistry Master Thesis 45hp
38
Tables 4. Summary of the concentrations [ng g¯¹ dw] of the lipid biomarkers as a function of depth for each investigated sediment type.
nd= below detection limit; ‘-‘= not present.

Alan Wiech Geochemistry Master Thesis 45hp
39
Table 5. Carbon isotope signature (‰ δ¹³C vs VPDB) of lipids together with their isotopic fractionation.
nd= below detection limit; ‘-‘= not present.

Master Thesis 45hp Alan Wiech Geochemistry
40
6. Discussion
6.1. DIC and POC
The isotopic signatures of the DIC in the two microbial mats had an enriching trend
with depth, which was not seen in the sand reference site which had none changing
values through depth. Furthermore, the isotopic signatures of POC did not deviate
noticeable with depth (average of -19‰ in the mats and 18‰ in the sand reference).
Usually a correlation between the δ13C-DIC and–POC, influenced by marine algae
(Henley et al., 2012; Rau et al., 1989; 1991), can be seen. This through the uptake of
lighter CO2 enriching the inorganic carbon (DIC). This correlation cannot be seen here,
as these two values do not inversely change together with depth. What can be noted
from the DIC and POC’s isotopic values, not changing inversely with depth in any site, is
that the biological activities are not having a big impact on the isotopic values.
The biggest differences observed in the microbial mats, compared to the sand
reference, are the temperature increase and the pH decrease with depth. The DIC
(H2CO3, HCO3¯ and CO3¯) abundances are very dependent on pH, while the isotopic
differences are strongly dependent on temperature (Eby 2004; Hayes 1993; 2001).
Therefore, a correlation between the temperature and the enrichment of δ13C-DIC with
depth can be estimated. Through the increase in temperature, with depth, a kinetic
isotopic fractionation between the aquatic-DIC and the gaseous-CO2 is pushing more
depleted δ13C into CO2 (gas) and leaving more enriched δ13C-DIC behind, seen from our
results. This analogy was also recorded in the NE Pacific deep-sea hydrothermal vent of
Axial Volcano (Levesque et al., 2005), observing enrichments in δ13C-DIC with increasing
fluid vent temperatures. Therefore the isotopic DIC values are presumed to be affected
by the temperature increases through depth, in the microbial mats.
6.2. Lipid abundances affected by hydrothermal transition zones.
The lipid analysis varied in abundances but also in the diversity of different lipid
types, between the different sites. In each site the lipid abundances seemed to decrease
with depth. The lipid analysis performed in this study has contributed to the notion,
suggested by Sievert et al. (1999), that the different sampled sites were separated by
transitional zones caused by differences in hydrothermal conditions (e.g. temperature
and physico-chemical conditions). The further away from the white mats (most active
part of the hydrothermal area), a clear increase in lipid diversity and abundance can be

Master Thesis 45hp Alan Wiech Geochemistry
41
observed, which was also observed by Sievert et al. (1999) and Giovanneli et al. (2013),
both studying the microbial diversity in the Palaeochori Bay’s shallow hydrothermal
area. Furthermore, higher sedimentation rates have been recorded outside the
hydrothermally active areas of the Palaeochori bay, using 210Pb-dating methods (Ugür et
al., 2003), compared to the most hydrothermally active area, suggesting a similar setting
here. This correlates well with the identified lipid abundances, as higher abundances are
seen further away from the vent field. The recorded high lipid content through depth for
the sand sediment is most likely related to normal marine environmental conditions (i.e.
neutral pH, ~20°C, no hydrothermal activity, etc.). This environment promotes a larger
diversity of organisms (seen from the diversity of lipid biomarkers). There is also a
minor effect from the ongoing convection caused by the hydrothermal outgassing in the
vent field (O’Hara et al., 1995; Dando et al., 1995a; Wenzhöfer et al., 2000) together with
higher accumulation rates (Ugür et al., 2003), contributing to a higher abundance of
organic matter in the site outside the hydrothermal vent field (i.e. sand sediment site).
This higher abundance of lipids in the sand reference also correlates well with the TOC,
as the TOC was relatively higher at the sand reference site compared to the other sites.
However there was an exception at 7 cm, where the highest TOC was from the brown
microbial mat site, followed by the white mat and the sand site having the lowest. This
increase in the mats and decrease in the reference cannot be explained from the
obtained results, but it is very interesting as this effected all sites, thus further research
is needed to understand this increase.
The two straight chain fatty acids recovered in all samples (hexadecanoate and
octadecanoate) are usually ubiquitous, and are unfortunately not used as biomarkers for
specific organisms (Volkman 1998), since they can be produced by all organisms.
The identification of the different branched chain fatty acids (iso and anteiso) were
most likely originating from prokaryotes (e.g. chemoautotrophic anaerobic bacteria).
These lipids were only seen in the sand sediment and the brown mat, with higher
concentrations through depth in the sand sediment, compared to the brown, which only
had concentrations in the surface. Price et al. (2013a), Wenzhöfer et al. (2000) and
Sievert et al. (1999) have all studied the seep fluids of sediments in the hydrothermal
vent areas of Milos, Greece, and showed that in both microbial mat areas (white and
brown) the temperature increased sharply with depth. The white mats temperature

Master Thesis 45hp Alan Wiech Geochemistry
42
increased on average from 40-60°C at the sediment surface to about 70°C at 2.5 cm
sediment depth (Sievert et al., 1999 recorded temperatures up to 103°C at 10 cm
sediment depth), with a decrease in pH from 7 to 3.8. The brown mats temperature
stayed around 20°C in the sediment surface to about 1.5 cm with a decrease in pH of 7 to
4.5, where after, the temperature steadily increased though not as high as in the white
mat site. The temperature in the sand reference site stays steadily in the range of 20°C to
25°C (Price et al. 2013a, Wenzhöfer et al. 2000 and Sievert et al. 1999). Temperature
increasing with depth, in the brown and white mat (Wenzhöfer et al. 2000; Sievert et al.
1999), could be a reason for the absence of the iso and anteiso fatty acids in the deeper
parts of the brown mat and the complete absence in the white mat. Furthermore, the
abundance increase of prokaryotes towards the edges and outer regions of the main
vent field, and decrease with depth, coincides with Giovanneli et al. (2013)’s study
showing the same with the bacteria diversity in the Palaeochori Bay.
The monoenoic fatty acid 9-hexadecanoate (9-16:1), is seen in all sites, but is also
considered ubiquitous (Volkman 1998), as it can be produced by all organisms.
However, the decrease with depth among the different areas could be due to the
temperature increase with depth (Wenzhöfer et al 2000) in the microbial mats.
6.3. The presence of Sterols.
The identified sterols from this study were cholesterol, sterol Δ5.22, stigmasterol and
sitosterol occurring in all sampled sites, with the white mat having the lowest
abundances of the sterols. The phytosterols (sterol Δ5.22, stigmasterol and sitosterol) in
the white microbial mat were only seen in the surface sediment. Going down core these
sterols were all absent, which could be because the sediment conditions were
immediately more anoxic (Wenzhöfer et al., 2000). This lack of oxygen was thus
inhibiting the synthesis of the sterols (Galea & Brown 2009). Although this anoxic trend
was also seen in the brown mat, there were still sterol abundances present at 7cm, even
though the sediment was anoxic. Out of all the sterols, the beta-sitosterol was the most
abundant in all sites (relative to the other sterols in the same site). Sterol lipids are
associated with algal membranes and the sterols observed in these different sites can be
attributable to microalgae (as these utilize C29 sterols in their biosynthesis) but also to
diatoms (Volkman 1998).

Master Thesis 45hp Alan Wiech Geochemistry
43
6.4. The presence of Hopanoids.
The identified hopanes in this study were diploptene, 17βH.21βH-bishomohopanoic
acid, 17αH.21βH-bishomohopanoic acid and 17βH.21βH-homohopanoic acid. Though
these only appear in the surface samples, the sand reference and brown habitat had all
of these hopanes, while the white habitat only had diploptene and 17βH.21βH-
bishomohopanoic acid. The bishomohopanoids and homohopanoids are derived from
complex hopanoids structures (Härtner et al., 2005). The 17βH.21βH structures of the
hopanoids are the least thermodynamically stable structures (Barakat & Rullkötter
1995), therefore, with this in mind, it was not surprising that the overall relative
predominance was that of the 17βH.21βH hopanoid components in all surface sites, as
this would indicate that the surface sediments are not mature. Although, hopanoids are,
to a large extent, biomarkers for bacterial organisms (relative abundances found in i.e.
cyanobacteria, methanotrophic bacteria and members of the α-proteobacteria), the
knowledge regarding their taxonomic classification is not clear (Peters et al., 2005).
However, these could be attributable to the sulfur-oxidizing proteobacterial organisms
which had been identified in the Palaeochori Bay area (Sievert 1999). The identified
diploptene hopanoid, one of the most common C30 hopanoid compound in bacterial
biosynthesis (Kannenberg et al., 1999), can be attributed to many organisms. Though
here, alone, it cannot be set to any specific organisms.
6.5. The identified GDGTs.
The identified abundances of GDGT-0 and crenarchaeol (GDGT-5), in the surface,
could be biomarkers for the non-thermophilic Crenarchaeota (Smittenberg et al., 2005b;
Schouten et al., 2013) classified as Thaumarchaeota. However, the low abundance of
GDGT-3 and absence of GDGT-1; -2 and absence of the regio-isomer of crenarchaeol,
together with the high temperature environment, suggests that these GDGTs are
biomarkers for some other archaeal.
As mentioned, it has been suggested that the crenarchaeol may also be a biomarker for
the biosynthesis of a thermophilic ammonia oxidizing crenarchaeon “Candidatus
Nitrosocaldus yellowstonii” (Pearson et al., 2008; Lincoln et al 2013) which grows
optimally in alkaline pH conditions with ammonia and oxygen present. Consequently
this could be the reason for why the concentration of the crenarchaeol is higher in the
oxic-anoxic interface between the seawater and the vent fluids (Yücel et al., 2013;
Wenzhöfer et al., 2000), where Fitzsimons et al., (1997) recorded high abundances of

Master Thesis 45hp Alan Wiech Geochemistry
44
ammonia and oxygen in the white surface area. One of the reasons for the crenarchaeols
immediate decrease in the white microbial mat could be the more acidic pH conditions,
as studied by Wenzhöfer et al., (2000), in deeper parts of the sediment as this would
inhibit the growth for the archaea.
The high abundance of GDGT-0 and crenarchaeol, and the relatively smaller abundances
of the cyclic GDGTs (GDGT-1; -2; -3), found in the white mat site show a characteristic
marine archaeal profile (as seen in Schouten et al 2000; Xiao-Lei Liu 2011), which has
also been seen in other hydrothermal areas, e.g. the spreading ridge of Eastern Lau in
the South Pacific Ocean (Hu et al., 2012) and the Lost city hydrothermal field near the
mid-Atlantic ridge (Lincoln et al., 2013). Also as no branched GDGTs were identified
(produced by bacteria (Xiao-Lei Liu 2011)), this suggests that the main biosynthesizes of
the GDGTs here are archaeal organisms. The hydrothermal surface environment in this
study suggests that the crenarchaeol, and the absence of the GDGTs mentioned above, is
most likely a biomarker for the thermophilic ammonia oxidizing crenarchaeon
“Candidatus Nitrosocaldus yellowstonii”. However, it should be noted that the
understanding of the biological sources of GDGTs is still in its early stages, as there has
not been extensive research surrounding this (Xia-Lei Liu; Hu et al., 2012; Lincoln et al
2013).
The identified abundances of Ar (GDD with m/z 653, see figure 16) is the most
commonly observed archaeal diether lipid (Xia-Lei Liu 2011) and can be attributable to
methanotrophic archaea (Xia-Lei Liu 2011 and references therein). If similar ring moiety
distribution would have been seen in the GDDs as well as the GDGTs, it could have been
suggested that they have the same biological sources (Xia-Lei Liu 2011; Liu et al 2012),
though this is not the case here. When relating the abundances of Ar to the different
GDGTs identified, the Ar abundances are higher, in the surface sediment of the white
microbial mat, with only one Ar (GDD-0) present. Liu 2011 recorded high abundances of
specific H-shaped GDGTs (molecular weight + hydrogen mass) together with H-shaped
GDDs in hydrothermal vent sediments. Another reason for the Ar presence in this study
could be due to a diagenesis process by the GDGTs, as it has been reported by Takano et
al., (2010) that benthic archaea can recycle GDGTs into GDDs. By this contrast GDDs can
be indicators for archaeal lipid membranes or a diagenesis process by which the
archaeal follow.

Master Thesis 45hp Alan Wiech Geochemistry
45
Moreover, the brown mat and sand reference samples did not show any
abundances for GDGTs. Even though Fitzsimons et al., (1997) recorded 10 times lower
ammonia levels in the brown mat, compared to the white mat, this is most likely not the
reason for the absence of the biomarker. Even though the environment is different in the
two other sites, there should still have been some signs of marine archaeal presence.
Another possibility for the absence of the GDGTs in the brown and sand samples could
be a methodological error (e.g. a low concentration of GDGTs in the samples, detection
limits from the instrument or filtration issues in the method) causing the samples to not
show identifiable signs for the GDGTs.
Based on the discussion above, the only definitive conclusion is that the presence
of archaeal lipid membranes are present in the white microbial mat, and speculation on
their biological source would suggest that they are biosynthesized by the thermophilic
ammonia oxidizing crenarchaeon “Candidatus Nitrosocaldus yellowstonii”. Further
evidence for this is that the Crenarchaeota was measured in abundances, in this area, by
Price et al (2013a). Also the recorded high abundance of GDGTs and GDD, in the surface
sediment of the most active hydrothermal field area in this study, suggests that these
biomarker lipids are important archaeal lipids that can be targeted in future
hydrothermal studies.
Acquiring additional results from the other sites, a comparison between the
different environments could be better understood, though this would imply further
research on other sites.
6.6. Culture lipid analysis
The lipid analysis on the cultures was made to correlate specific lipid to those that
were identified in the sediment samples. However, being that the lipids identified in the
cultures were mostly ubiquitous, this correlation was not possible. Thus this is not
discussed furtherly as there are no results that are discussable.
6.7. Isotopic lipid signatures indicating a mixed source from methanotrophs
When comparing the results from the brown microbial mat with the sand
reference (no hydrothermal activity) the δ13C values are 10‰ more depleted, indicating
that these systems has to have some other/mixed carbon source.
The organisms in the microbial mats can theoretically get their carbon source for

Master Thesis 45hp Alan Wiech Geochemistry
46
biosynthesis from three sources, bicarbonate; methane; and dissolved CO2. Carbon
fixation of bicarbonate (Hayes 1993; 2001) in this system is one possibility (seen in
deep-sea hydrothermal vent systems (Minic & Thongbam 2011). However, through this
biosynthesis the lipids isotopic signature would have smaller isotopic fractionation from
their carbon source (bicarbonate), and thus be more enriched in 13C compared to the
dissolved CO2. For this reason the assimilation through this process is not proposed
here, as this would mean that the δ13C results, from the lipids, would have less depleted
(heavier) signals compared to the results gathered here.
Another possible carbon source could be from the biosynthesis of methane, by
methanotrophs (Hanson & Hanson 1996), from the vent outgassing (<9%) (Dando et al.,
1995). Several studies have been made identifying the different bacterial and archaeol
organisms (Price et al., 2013a; Giovanneli et al., 2013), in the hydrothermal vent system
of Milos, though there has not been any identification of methanotrophs. Methanotrophs
are from the gamma- (ribulose monophosphate pathway) and alpha- (serine pathway)
proteobacteria family (Hanson & Hanson 1996), and these family groups have been
identified from this area (Price et al., 2013; Giovanneli et al., 2013), though not
methanotrophs specifically. With optimum growth conditions, for methanotrophic
bacteria, being within a temperature range of 25 to 35°C, pH values around 7 to 7.6,
methane availability and ammonia concentrations ranging between 12 and 61 mM
(Hanson & Hanson 1996), there is a possibility for them to be present in the microbial
mats. Aerobic methanotrophs utilizing oxygen (which would be on top of the sediment
due to anoxic condition in the sediment (Wenzhöfer et al., 2000)) and methane (coming
from hydrothermal areas), which would yield δ13C lipid values ranging from -40 to -
75‰ (these lipid values were found in mud volcanoes at the Mediterranean Ridge
(Pancost et al., 2000)). Thus the available carbon source (HCO3¯) would be subsequently
depleted. However, this would have been show in the results, with much more depleted
(lighter) δ13C signals from the lipids. Though, there is a possibility to suggest for a mixed
carbon source isotopic signal (with one of them being from methanotrophs) in this
environment, as the identified Ar GDD was high in abundance in the surface of the white
microbial mat which could be attributable to methanotrophs. Though this would need
further research to be able to propose these conditions.
The last possible carbon source is the dissolved CO2, which is the most plausible one in
this environment because of the constant CO2 vent gassing from the hydrothermally

Master Thesis 45hp Alan Wiech Geochemistry
47
active areas (white and brown mats) (Dando et al., 1999; 1995a). This CO2 would permit
for the easiest carbon fixation by the organisms (Hayes 1993; 2001).This is the
argument for the values in the white and brown mats from this study. In these
conditions the organisms would fractionate more readily, due to the large reservoir of
the CO2, discriminating the 13C in their assimilation (Hayes 2001), thus producing the
depleted δ13C signals seen from the results. While the sand reference has a 10‰ more
enriched signal, this is most likely due to the low reservoir of CO2 (compared with the
mats in the vent fields) and overall higher abundance of lipids and microbes (Price et al.,
2013a; Giovanneli et al., 2013), causing the discrimination of carbon to not be as
efficient.
A more broad study of this kind is needed, where the targeted lipids are not
ubiquitous, as in this study, and can be linked to more specific organisms.
6.8. RuBisCO (II) dominated throughout the sites
It has been proven that the rTCA cycle is the most dominate carbon fixation
pathway for organisms in deep-sea hydrothermal vent systems (Campbell & Cary 2004),
with only weak to no signal for both RuBisCO I and II. These deep-sea systems are
mostly inhabited by chemolithoautotrophs while the photoautotrophic activity is
limited. On the contrary, shallow submarine hydrothermal systems, such as in Milos, are
in the photic zone and are influenced by photoautotrophic and chemoautotrophic
organisms (Price et al., 2013a; Giovanneli et al., 2013), though these are highly affected
by the dynamic hydrodynamics (tides, storms, microearthquakes and currents) that are
present (Wenzhöfer et al., 2000). Here the microbial mats have nutrients and constant
CO2 vent outgassing (Dando et al., 1999; 1995a), making these areas practically non-
limiting CO2 reservoirs. The results, from the genes sequences of these areas, show that
the RuBisCO form II is dominating in the Milos sediment, regardless of sample site, with
rTCA having the lowest activity in all sites (except for the white mat). The highest levels
of RuBisCO (II) and (I) were seen in the brown microbial mat, most likely due to the
nutrient availability, non-limiting CO2 environment (O’Leary & Roeske 1985; Staal et al.,
2007), higher abundance microbial organisms (Giovanneli et al., 2013) seen from the
lipid analysis as well (compared to the white microbial mat), and the less extreme
environment (also compared to the white mat) (see figure 19). The white microbial mat
also had higher RuBisCO (II) compared with the rTCA, though here the RuBisCO (I) had

Master Thesis 45hp Alan Wiech Geochemistry
48
decreased rapidly making it the third highest carbon fixation pathway (out of the three
measured). The sand reference site had similar RuBisCO (II) activities as the white
microbial mat, most likely due to the “marine” like environment, promoting a higher
diversity of microorganisms, also seen from the lipid analysis. While the rTCA was at its
lowest point in this sediment site (see figure 19). The discussion only entails to the
surface values and not the deeper activities of the different genes.
This is the first study showing that the RuBisCO (II) is the most active carbon
fixation pathway for organisms, in all regions (including the non-affected sand reference
site) of the shallow submarine hydrothermal vent system of Milos Island.
Furthermore, not all pathways for carbon fixation have been measured in this area (e.g.
carboxylase, acetyl-CoA), and this would provide a more in-depth understand of this
environment and the organisms inhabiting it.
Figure 19. Detailed rendered summary figure of the different sediment surface sites recovered for
analysis, with each sites results summarized. The color gradient of blue going in to red-brownish indicates
the transition of entering into more hydrothermally active conditions, with physico-chemical conditions
increasing (i.e. increasing temperature; seep fluid intrusions; more anoxic sediments; higher arsenic
levels). The sand reference is the only area in the figure that has no hydrothermal activity (marine
conditions), as it is situated further away from the other sites. Accumulation rates acquired from Ugür et
al (2003). Carbon pathway abundances are in logarithmic scales.

Master Thesis 45hp Alan Wiech Geochemistry
49
7. Conclusions
From the arsenic rich hydrothermally active region of Milos, a comprehensive lipid
biomarker interpretation was made. Interpreting these different lipid abundances, a
clear correlation could be made together with the physico-chemical conditions of the
environment. This indicated that the organism’s abundance and diversity increase in the
periphery and the outer regions of the hydrothermal vent field. The same is seen
through depth in the different regions, with the microbial mats most likely affected by
the sharp temperature rise. Furthermore these conclusions coincide with results from
Giovanneli et al. (2013), which suggested the same conclusions. Similarly, the enriching
isotope values of DIC with depth, in the microbial mats, are also most likely due to
temperature increase which is affecting the isotopic fractionation of DIC. This permits
more depleted CO2 release, leaving more enriched DIC values in the deeper and higher
temperature sediments.
The carbon isotope values from the two microbial mat lipids indicated that the
most likely carbon source for organism’s biosynthesis is dissolved CO2. This is concluded
from the more depleted lipid signatures in the microbial mats, compared with the
unaffected site, and the large reservoir of CO2, causing higher discrimination of 13C
compared to 12C. These conditions do not appear to change through depth indicating
small fluctuations in recent hydrodynamic processes.
The most important discovery from this study, is the demonstration that the
RuBisCO (form II) is the most important carbon fixation pathway for chemoautotrophic
and photoautotrophic organisms living in the arsenic rich shallow submarine
hydrothermal system in Spathi Bay of Milos, Greece. Even though rTCA is favored by
free-living microorganisms in deep-sea hydrothermal vent systems (e.g. Campbell &
Cary 2004; Elsaied & Naganumna 2001), the key gene sequences targeted here (cbbL,
cbbM and aclB) are showing a dominance for RuBisCO (especially form II) in these
hydrothermally affected microbial mats. These are the first documented results
indicating that the RuBisCO (II) is the most actively used enzyme, for biosynthesis, in a
shallow submarine hydrothermal vent field area. However, the two RuBisCO forms
diminish rapidly as the physico-chemical conditions increase and the environment
become more extreme, while the rTCA is not affected as severely.

Master Thesis 45hp Alan Wiech Geochemistry
50
For future studies involving carbon fixation pathways in submarine hydrothermal
vent systems, the hydrothermal vent field around the island of Milos is an ideal research
location with high RuBisCO (II) activities. If there is a connection between RuBisCO (II)
and arsenic in the environment these future studies could give a better understanding of
how organisms survived in the early Earth environments.
8. Acknowledgements
I would like to thank my main-supervisor Ernest Chi Fru, co-supervisor Jayne Rattray
and co-advisor Rienk Smittenberg for all their help and guidance throughout this thesis.
I also want to acknowledge Nolwenn Callac, Heike Siegmund and Kweku Afrifa Yamoah
for their laboratory assistants and support. During these 5 year at Stockholms University
I have received a lot of help for the administrators, technical staff and professors from
the Department of Geological Sciences, and would like to thank them as well. Lastly I
would like to thank my mother, family members and friends, and a really big special
thanks to Camilla Olsson who had the patience to help and encourage me throughout the
thesis. I’m done and out (mic drop)!

Master Thesis 45hp Alan Wiech Geochemistry
51
9. References
Aközcan, S. & Uǧur Görgün, A. 2012, 'Trace metal and radionuclide pollution in marine
sediments of the Aegean Sea (Izmir Bay and Didim)', Environmental Earth
Sciences, p. 1-5
Alfieris, D., Voudouris, P. & Spry, P. 2013, 'Shallow submarine epithermal Pb–Zn–Cu–Au–
Ag–Te mineralization on western Milos Island, Aegean Volcanic Arc, Greece:
Mineralogical, geological and geochemical constraints', Ore Geology Reviews, 53,
pp. 159-180
Amend JP., McCollom TM., Hentscher M. & Bach W. 2011. ’Catabolic and anabolic energy
for chemolithoautotrophs in deep-sea hydrothermal systems hosted in different
rock types’. Geochim Cosmochim Acta, 75, pp. 5736–5748
Baker-Austin, C. & Dopson, M. 2007, 'Review: Life in acid: pH homeostasis in
acidophiles', Trends In Microbiology, 15, pp. 165-171.
Barakat AO. & Rullkötter J. (1995) Extractable and bound fatty acids in core sediments
from the Nördlinger Ries, southern Germany. Fuel 74: 416–425
Begy, R., Cosma, C., & Timar, A. 2009, 'Recent changes in Red Lake (Romania)
sedimentation rate determined from depth profiles of 210Pb and 137Cs
radioisotopes', Journal Of Environmental Radioactivity, 100, 8, pp. 644-648.
Bekker, A., Slack, J.F., Planavsky, N., Krapež, B., Hofmann, A., Konhauser, K.O., Rouxel, O.J.,
2010. Iron formation: The sedimentary product of a complex interplay among
mantle, tectonic, oceanic, and biospheric processes. Econ. Geol. 105, 467-508.
Bennett, S, Statham, P, Green, D, Le Bris, N, McDermott, J, Prado, F, Rouxel, O, Von Damm,
K, & German, C 2011, 'Dissolved and particulate organic carbon in hydrothermal
plumes from the East Pacific Rise, 9°50′N', Deep-Sea Research Part I, 58, pp. 922-
931
Berg, I., Kockelkorn, D., Ramos-Vera, W., Say, R., Zarzycki, J., Hügler, M., Alber, B. & Fuchs,
G. 2010, 'Autotrophic carbon fixation in archaea', Nature Reviews Microbiology, 8, 6,
pp. 447-460

Master Thesis 45hp Alan Wiech Geochemistry
52
Breuer, C. & Pichler, T. 2013, 'Arsenic in marine hydrothermal fluids', Chemical Geology,
348, Arsenic in marine hydrothermal systems: Source, fate and environmental
implications, pp. 2-14
Cahnmann, H. 1957, 'Partially deactivated silica gel columns in chromatography:
Chromatographic behavior of benzo[a]pyrene', Analytical Chemistry, 29, 9, p.
1307-1311.
Cambray, R., Eakins, J., Harkness, J., & Pennington, W. 1976, 'Radionuclide dating of the
recent sediments of Blelham Tarn', Freshwater Biology, 6, 4, p. 317.
Campbell, B. & Gary, S. 2004, 'Abundance of reverse tricarboxylic acid cycle genes in
free-living microorganisms at deep-sea hydrothermal vents', Applied And
Environmental Microbiology, 70, 10, p. 6282-6289.
Campbell, B., Cary, S. & Stein, J. 2003. 'Evidence of chemolithoautotrophy in the bacterial
community associated with Alvinella pompejana, a hydrothermal vent polychaete',
Applied And Environmental Microbiology, 69, 9, p. 5070-5078
Castaneda, I., & Schouten, S., 2011, 'A review of molecular organic proxies for examining
modern and ancient lacustrine environments’, vol 30, pp. 2851, Quaternary Science
Reviews, 125, pp. 174-176.
Coolen MJL. & Gibson JAE. 2009. ‘Ancient DNA in lake sediment records’ PAGES News,
17, pp. 104–106
Coolen, M. J. L., Muyzer, G. Rijpstra, W. I. C., Schouten, S., Volkman, J. K. and Sinninghe
Damste J. S. 2004 ‘Combined DNA and lipid analyses of sediments reveal changes in
Holocene haptophyte and diatom populations in an Antarctic lake’. Earth Planet
Sci. Lett., 223, 225–239
Cronan, D., Varnavas, S., & Perissoratis, C., 1995, 'Hydrothermal Sedimentation in the
Caldera of Santorini, Hellenic Volcanic Arc', Terra Nova, 7, 2, pp. 289-293.
Dando, P., Hughes, J. & Thiermann, F. 1995b, ‘Preliminary observations on biological
communities at shallow hydrothermal vents in the Aegean Sea’, Geological Society,
London, Special Publications, vol. 87, issue 1, pp. 303-317

Master Thesis 45hp Alan Wiech Geochemistry
53
Dando, P., Hughes, J., Leahy, Y., Niven, S., Taylor, L., & Smith, C., 1995a, 'Gas venting rates
from submarine hydrothermal areas around the island of Milos, Hellenic Volcanic
Arc', Continental Shelf Research, 15, 8, p. 913-929.
Dando, P., Stüben, D. & Varnavas, S. 1999, 'Hydrothermalism in the Mediterranean Sea',
Progress In Oceanography, 44, pp. 333-367
DeLong, E.F. 1998, 'Everything in moderation: archaea as 'non-extremophiles'', Current
Opinion In Genetics & Development, vol. 8, no. 6, pp. 649-654.
E. Chi Fru., M. Ivarsson., S. P. Kilias., P. J. Frings., C. Hemmingsson., C. Broman., S. &
Bengtson., E. Chatzitheodoridis. 2015. Biogenicity of an Early Quaternary iron
formation, Milos Island, Greece. Geobiology 13, 225–244.
Eby, G. Nelson. (2004). Principles of environmental geochemistry. Pacific Grove, Calif.:
Thomson-Brooks/Cole
Elsaied, H. & Naganuma, T. 2001, 'Phylogenetic diversity of ribulose-1,5-bisphosphate
carboxylase/oxygenase large-subunit genes from deep-sea microorganisms',
Applied And Environmental Microbiology, 67, 4, pp. 1751-1765
Ernest Chi Fru, Magnus Ivarsson, Stephanos P. Kilias, Stefan Bengtson, Veneta
Belivanova, Federica Marone, Danielle Fortin, Curt Broman, Marco Stampanoni.
2013. Fossilized iron bacteria reveal a pathway to the biological origin of banded
iron formation. Nature Communications 4, 2050 doi:10.1038/ncomms3050.
Fitzsimons, M., Pratt, S., Dando, P., Hughes, J., Thiermann, F., & Akoumianaki, I., 1997,
'Submarine hydrothermal brine seeps off Milos, Greece: Observations and
geochemistry', Marine Chemistry, 57, 3-4, p. 325-340.
Gaines, Susan M., Eglinton, Geoffrey & Rullkötter, Jürgen 2009. Echoes of life: what fossil
molecules reveal about earth history. Oxford: Oxford University Press
Galea, A. & Brown, A. 2009, 'Hypothesis Paper: Special relationship between sterols and
oxygen: Were sterols an adaptation to aerobic life?', Free Radical Biology And
Medicine, 47, pp. 880-889
Gilhooly, W., Fike, D., Druschel, G., Kafantaris, F., Price, R. & Amend, J. 2014. 'Sulfur and
oxygen isotope insights into sulfur cycling in shallow-sea hydrothermal vents,
Milos, Greece', Geochemical Transactions, 15, doi: 10.1186/s12932-014-0012-y

Master Thesis 45hp Alan Wiech Geochemistry
54
Godelitsas, A., Price, R., Pichler, T., Amend, .J, Gamaletsos, P. & Göttlicher, J. 2015,
'Amorphous As-sulfide precipitates from the shallow-water hydrothermal vents off
Milos Island (Greece)', Marine Chemistry, 177, Part 5, pp. 687-696
Hanson, R. & Hanson, T. 1996,’Methanotrophic Bacteria’, Microbiological reviews, 60, 2,
pp. 439-471
Härtner, T., Kannenberg, E., & Straub, K. 2005, 'Occurrence of hopanoid lipids in
anaerobic Geobacter species', FEMS Microbiology Letters, 243, 1, p. 59-64
Harwood, J. & Russell, N. 1984. Lipids in plants and microbes. Department of
Biochemistry, University College of Wales, Cardiff, UK, George Allen & Unwin
(Publishers) Ltd
Hayes, J. 1993, 'Factors controlling 13C contents of sedimentary organic compounds:
Principles and evidence', Marine Geology, 113, 1-2, p. 111-125
Hayes, J. 2001,’Fractionation of Carbon and Hydrogen Isotopes in Biosynthetic
Processes’, Reviews in Mineralogy and Geochemistry, 43, p. 225-277
Hein JR., Stamatakis MG. & Dowling JS. (2000) Trace metal-rich Quaternary
hydrothermal manganese oxide and barite deposit, Milos Island, Greece. Applied
Earth Science: Transactions of the Institutions of Mining and Metallurgy: Section B
109, 67–76.
Henley, S., Annett, A., Ganeshram, R., Carson, D., Weston, K., Crosta, X., Tait, A., Dougans,
J., Fallick, A. & Clarke, A. 2012, 'Factors influencing the stable carbon isotopic
composition of suspended and sinking organic matter in the coastal Antarctic sea
ice environment', Biogeosciences, 9, 3, p. 1137-1157
Hewitt, W., 2000, ‘Determining the Ages of the Recent Sediments using Measurements of
Trace Radioactivity’, Terra et Aqua, Number 78
Hu, J., Meyers, P., Chen, G., Peng, P. & Yang, Q. 2012, 'Archaeal and bacterial glycerol
dialkyl glycerol tetraethers in sediments from the Eastern Lau Spreading Center,
South Pacific Ocean', Organic Geochemistry, 43, pp. 162-167

Master Thesis 45hp Alan Wiech Geochemistry
55
Jungblut, A., Allen, M., Burns, B. & Neilan, B. 2009, 'Lipid biomarker analysis of
cyanobacteria-dominated microbial mats in meltwater ponds on the McMurdo Ice
Shelf, Antarctica', Organic Geochemistry, 40, pp. 258-269
Kannenberg, E., & Poralla, K. 1999, 'Hopanoid biosynthesis and function in bacteria',
Naturwissenschaften, 86, 4, pp. 168-176
Karner, M., DeLong, E. F. and Karl, D. M. 2001 Archaeal dominance in the mesopelagic
zone of the Pacific Ocean. Nature 409, 507–510.
Kelley, D, Karson, J, Blackman, D, Fruh-Green, G, Butterfield, D, Lilley, M, Olson, E,
Schrenk, M, Roe, K, Lebon, G, & Rivizzigno, P 2001, 'An off-axis hydrothermal vent
field near the Mid-Atlantic Ridge at 30 degrees N', Nature, 412, 6843, p. 145-149
Kilias, S., Nomikou, P., Papanikolaou, D., Polymenakou, P., Godelitsas, A., Argyraki, A.,
Carey, S., Gamaletsos, P., Mertzimekis, T., Stathopoulou, E., Goettlicher, J.,
Steininger, R., Betzelou, K., Livanos, I., Christakis, C., Bell, K., & Scoullos, M., 2013,
'New insights into hydrothermal vent processes in the unique shallow-submarine
arc-volcano, Kolumbo (Santorini), Greece', Scientific Reports, 3. DOI:
10.1038/srep02421
Kim, J., van der Meer, J., Schouten, S., Helmke, P., Willmott, V., Sangiorgi, F., Koç, N.,
Hopmans, E. & Damsté, J. 2010, 'New indices and calibrations derived from the
distribution of crenarchaeal isoprenoid tetraether lipids: Implications for past sea
surface temperature reconstructions', Geochimica Et Cosmochimica Acta, 74, pp.
4639-4654
Kuenen, G. 2009. Oxidation of Inorganic Compounds by Chemolithotrophs. In Lengeler,
J.; Drews, G.; Schlegel, H. Biology of the Prokaryotes. John Wiley & Sons. p. 242
Lanekoff, I., Karlsson, R., 2010. Analysis of intact ladderane phospholipids, originating
from viable anammox bacteria, using RP-LC-ESI-MS. Analytical and Bioanalytical
Chemistry 397, 3543-3551.
Lerman, A. & Baccini, P. (red.) 1978. Lakes: chemistry, geology, physics. New York:
Springer-Vlg
Levesque, C., Limén, H. & Juniper, S. 2005, 'Origin, composition and nutritional quality of
particulate matter at deep-sea hydrothermal vents on Axial Volcano, NE Pacific',
Marine Ecology Progress Series, 289, p. 43-52

Master Thesis 45hp Alan Wiech Geochemistry
56
Lincoln, S., Bradley, A., Newman, S. & Summons, R. 2013, 'Archaeal and bacterial glycerol
dialkyl glycerol tetraether lipids in chimneys of the Lost City Hydrothermal Field',
Organic Geochemistry, 60, pp. 45-53
Liu, X., Lipp, J., Schröder, J., Summons, R. & Hinrichs, K. 2012, 'Isoprenoid glycerol
dialkanol diethers: A series of novel archaeal lipids in marine sediments', Organic
Geochemistry, 43, pp. 50-55
Mackenzie, A.S., Brassell, S.C., Eglinton, G., & Maxwell J.R., 1982, 'Chemical Fossils: The
Geological Fate of Steroids', Science, vol. 217, no. 4559, pp. 491-504.
Minic, Z., & Thongbam, P. 2011, 'The Biological Deep Sea Hydrothermal Vent as a Model
to Study Carbon Dioxide Capturing Enzymes', Marine Drugs, 9, 5, pp. 719-738
Nakagawa, S., & Takai, K., 2008, 'Deep-sea vent chemoautotrophs: diversity,
biochemistry and ecological significance', Fems Microbiology Ecology, 65, 1, pp. 1-
14
O'Hara, S., Dando, P., Schuster, U., Bennis, A., Boyle, J., Chui, F., Hatherell, T., Niven, S. &
Taylor, L. 1995, 'Gas seep induced interstitial water circulation: observations and
environmental implications', Continental Shelf Research, 15, 8, p. 931-948
O'Leary, M. & Roeske, C. 1985, 'Carbon isotope effect on carboxylation of ribulose
bisphosphate catalyzed by ribulosebisphosphate carboxylase from Rhodospirillum
rubrum', Biochemistry, 24, 7, p. 1603-1607
Othman, I., Al-Masri, M., & Al-Rayyes, A. 2000, 'Sedimentation rates and pollution history
of the eastern Mediterranean Sea: Syrian coast', Science Of The Total Environment,
248, pp. 27-35
Oulas, A., Polymenakou, P., Mandalakis, M., Christakis, C., Kotoulas, G., Magoulas, A.,
Seshadri, R., Tripp, H., Paez-Espino, A., Pati, A., Ivanova, N., Kyrpides, N., Chain, P.,
Nomikou, P., Kilias, S. & Carey, S. 2016, 'Metagenomic investigation of the
geologically unique Hellenic Volcanic Arc reveals a distinctive ecosystem with
unexpected physiology', Environmental Microbiology, 18, 4, p. 1122-1136
Pancost, R., Sinninghe Damsté, J., de Lint, S., van der Maarel, M. & Gottschal, J.
2000.'Biomarker evidence for widespread anaerobic methane oxidation in
Mediterranean sediments by a consortium of methanogenic archaea and bacteria.

Master Thesis 45hp Alan Wiech Geochemistry
57
The Medinaut Shipboard Scientific Party', Applied And Environmental Microbiology,
66, 3, pp. 1126-1132
Pearson, A., Pi, Y., Li, S., Zhao, W., Li, Y., Romanek, C., Zhang, C., Li, W., Inskeep, W. &
Perevalova, A. 2008, 'Factors controlling the distribution of archaeal tetraethers in
terrestrial hot springs', Applied And Environmental Microbiology, 74, 11, p. 3523-
3532
Peters, K. E., Walters, C. C. & Moldowan, J. M. (red.) 2005. The Biomarker Guide / Volume
1. Biomarkers and Isotopes in the Environment and Human History., Cambridge
University Press, Cambridge
Price RE., Lesniewski R., Nitzsche KS., Meyerdierks A., Saltikov C., Pichler T. & Amend JP.
2013a. Archaeal and bacterial diversity in an arsenic-rich shallow-sea
hydrothermal system undergoing phase separation. Frontiers in microbiology, 4.
doi: 10.3389/fmicb.2013.00158
Price RE., Savov I., Planer-Friedrich B., Bühring SI., Amend J. & Pichler T. 2013b.
Processes influencing extreme As enrichment in shallow-sea hydrothermal fluids
of Milos Island, Greece. Chemical Geology, 348, 15-26.
Rattray, J., Iñiguez, E., Yamoah, K., Muschitiello, F., Sawicka, J., Smittenberg, R. ‘A high-
throughput reverse phase UHPLC-MS method for the analysis of GDGTs’. In prep.
Rau, G. H., Froelich, P. N., Takahashi, T., and Des Marais, D. J. 1991: Does sedimentary
organic δ13C record variations in Quaternary ocean [CO2(aq)]? Paleoceanography,
6, 335–347, 1991.
Rau, G. H., Takahashi, T., and Des Marais, D. J. 1989: Latitudinal variations in plankton
δ13C: implications for CO2 and productivity in past oceans, Nature, 341, 516–518
Schouten, S., Hopmans, E., & Sinninghe, Damsté, J. 2013, 'Review: The organic
geochemistry of glycerol dialkyl glycerol tetraether lipids: A review', Organic
Geochemistry, 54, pp. 19-61
Schouten, S., Hopmans, E., Schefuß, E. & Sinninghe Damsté, J. 2002, 'Distributional
variations in marine crenarchaeotal membrane lipids: a new tool for
reconstructing ancient sea water temperatures?', Earth And Planetary Science
Letters, 204, pp. 265-274
Master Thesis 45hp Alan Wiech Geochemistry
58
Schouten, S., Hopmans, E.C., Pancost, R.D., Sinninghe Damsté, J.S., 2000. Widespread
occurrence of structurally diverse tetraether membrane lipids: evidence for the
ubiquitous presence of low-temperature relatives of hyperthermophiles.
Proceedings of the National Academy of Sciences USA 97, 14421–14426
Schouten, S., Van Der Meer, M., Hopmans, E., Rijpstra, W., Damsté, J., Reysenbach, A. &
Ward, D. 2007, 'Archaeal and bacterial glycerol dialkyl glycerol tetraether lipids in
hot springs of Yellowstone National Park', Applied And Environmental
Microbiology, 73, 19, p. 6181-6191
Sievert, S., Kuever, J., Brinkhoff, T., Muyzer, G. & Ziebis, W. 1999, 'Spatial heterogeneity of
bacterial populations along an environmental gradient at a shallow submarine
hydrothermal vent near Milos island (Greece)', Applied And Environmental
Microbiology, 65, 9, p. 3834-3842
Sjöberg S. 2014, ‘Characterization of an REE-enriched black substance in fractured
bedrock in the Ytterby Mine’, Stockholm University, Master thesis
Smittenberg, R. H., Baas, M., Schouten, S. and Sinninghe Damsté, J. S. 2005 ‘The demise of
the alga Botryococcus braunii from a Norwegian fjord was due to early
eutrophication’. The Holocene, 15, 133-140
Smittenberg, R., Baas, M., Green, M., Hopmans, E., Schouten, S. & Sinninghe Damsté, J.
2005, 'Pre- and post-industrial environmental changes as revealed by the
biogeochemical sedimentary record of Drammensfjord, Norway', Marine Geology,
214, pp. 177-200
Staal, M., Thar, R., Kuhl, M., van Loosdrecht, M., Wolf, G., de Brouwer, J. & Rijstenbil, J.
2007. 'Different carbon isotope fractionation patterns during the development of
phototrophic freshwater and marine biofilms', Biogeosciences, 4, 4, pp. 613-626
Stan-Lotter, H., & Fendrihan, S., 2012. Adaption of Microbial Life to Environmental
Extremes: Novel Research Results and Application. Vienna: Springer Vienna
Starr, M.P., (red.) 1981. The prokaryotes: a handbook on habitats, isolation, and
identification of bacteria. Berlin: Springer-Vlg.
Master Thesis 45hp Alan Wiech Geochemistry
59
Takano, Y., Chikaraishi, Y., Ogawa, O.N., Nomaki, H., Morono, Y., Inagaki, F., Kitazato, H.,
Hinrichs, K.-U., Ohkouchi, N., 2010. Sedimentary membrane lipids recycled by
deep-sea benthic archaea. Nature Geoscience 3, 858–861
Timmis, K. N. 2010. Handbook of Hydrocarbon and Lipid Microbiology. Berlin,
Heidelberg: Springer Berlin Heidelberg
Uǧur, (Tanbay) A., & Yener, G. 2001, 'Accumulation rates and sediment deposition in the
Gökova Bay in Aegean Sea Turkish Coast', Applied Radiation And Isotopes, 55, pp.
581-588
Ugür, A., Miquel, J., Fowler, S., & Appleby, P. 2003, 'Radiometric dating of sediment cores
from a hydrothermal vent zone off Milos Island in the Aegean Sea', Science Of The
Total Environment, 307, pp. 203-214
Volkman, J., Barrett, S., Blackburn, S., Mansour, M., Sikes, E. & Gelin, F. 1998, 'Microalgal
biomarkers: A review of recent research developments', Organic Geochemistry, 29,
5-7, pp. 1163-1179
Wenzhöfer, F., Holby, O., Glud, R., Nielsen, H., & Gundersen, J., 2000, 'In situ microsensor
studies of a shallow water hydrothermal vent at Milos, Greece', Marine Chemistry,
69, pp. 43-54.
Woese, Carl R., Kandler, O, Wheelis, M. 1990. ‘Towards a natural system of organisms:
proposal for the domains Archaea, Bacteria, and Eucarya’. Proc Natl Acad Sci USA
87 (12): 4576–4579
Yamoah, K., Chabangborn, A., Chawchai, S., Väliranta, M., Wohlfarth, B. & Smittenberg, R.
2016, 'Large variability in n-alkane δ13C values in Lake Pa Kho (Thailand) driven
by wetland wetness and aquatic productivity', Organic Geochemistry, 97, pp. 53-60
Yücel, M., Sievert, S., Vetriani, C., Foustoukos, D., Giovannelli, D. & Le Bris, N. 2013, 'Eco-
geochemical dynamics of a shallow-water hydrothermal vent system at Milos
Island, Aegean Sea (Eastern Mediterranean)', Chemical Geology, 356, pp. 11-20
Zhu, C., Lipp, J.S., Wormer, L., Becker, K.W., Schroder, J., Hinrichs, K.U., 2013.
’Comprehensive glycerol ether lipid fingerprints through a novel reversed phase
liquid chromatography-mass spectrometry protocol’. Organic Geochemistry 65,
53-62.

Master Thesis 45hp Alan Wiech Geochemistry
60
Zimmerman, A. R., and Canuel, E. A. 2000 ‘A geochemical record of eutrophication and
anoxia in Chesapeake Bay sediments: anthropogenic influence on organic
matter composition’. Mar Chem. 69, 117-137
Lipid references
AOCS lipid library- http://lipidlibrary.aocs.org/index.cfm
GCMS library- From the installed program on Shimadzu GCMS-QP2010 Ultra.
Mass spectra library- A large diverse group of spectra’s acquired over time at Stockholm
University
Sjöberg S. 2014, ‘Characterization of an REE-enriched black substance in fractured
bedrock in the Ytterby Mine’, Stockholm University, Master thesis
Electronic resources
HTML 1: http://lipidlibrary.aocs.org/History/content.cfm?ItemNumber=40363

Master Thesis 45hp Alan Wiech Geochemistry
61
10. Appendix
Detailed description of how to identify lipids together with abundances from this
study. Saturated straight-chain fatty acids (also known as: fatty acid methyl esters =
FAmEs) have higher m/z ratios of M+-31 peak compared to M+-23 (see appendix figure
22), where M+-x is the molecular weight of that compound minus x. Apart from normal
FAmEs, saturated branched-chain fatty acid methyl esters (iso- and anteiso) were also
detected. When distinguishing them from normal FAmE, of the same carbon number,
these exhibited slight spectral differences (see difference between figure 22 & 23). Iso
FAmEs show relatively enhanced M+-43 and almost equal heights in M+-31 and M+-29,
while anteiso FAmEs show a higher M+-29 compared to M+-31, and have a raised M+-57.
The unsaturated monoenoic fatty acids (figure 24) were identified using different mass
spectra libraries (e.g. GCMS library and lipid-database online). The sterols were
identified using a mass spectra library, and the diagnostic ions for identification can be
seen in table 6 (also see figures 25 to 28). Due to the low TOC % the hopanoids
(triterpenoids) were only identified after the SIM GCMS analysis, targeting specific ions
(i.e. 189 and 191). The diagnostic ions for the identification of the hopanoids are
presented in table 7 (also figure 29).
Figures 20 & 21 show the total volumes of the peaks identified from the two GCMS
methods. The surface samples are described in detail since the highest number and
highest amounts of compounds were identified here. In all surface samples from the
normal GCMS method, the highest volume of lipids were the straight chain fatty acids
accounting for more the half of the identified peak (57%, 60% and 53% for sand, brown
mat and white mat, respectively). The second highest lipid abundance were the
unsaturated fatty acids for both the sand sediment- and brown microbial mat samples
corresponding to 35% and 34%, respectively. The white mat sample had a much lower
volume of unsaturated fatty acids, making up only 4%. The branched fatty acids were
only present in the sand sediment- and brown mat samples, constituting 6% and 3%,
respectively. Finally the “other” category accounts for unknown compounds that do not
fit in with the other categories. For the sand sediment- and the brown mat samples this
volume was low, making up 2% and 3%, respectively, while the white mat sample had
almost half of the total volume, accounting for 43% “other” lipids. However, it is worth
noting that overall significantly more and greater peaks were found in the sand
sediment and brown mat (i.e. higher concentrations compared with the white sample),

Master Thesis 45hp Alan Wiech Geochemistry
62
especially in fraction 3a. Although more lipids were identified using the SIM method, it
should be noted again that most of these lipid biomarkers are significantly lower in
volume than the lipid biomarkers identified from the normal GCMS method.
For the sand sediment sample the highest volume of lipids were the triterpenoids
accounting for 34%, followed by the straight chain fatty acids, 27% and two propyl
esters (hexadecanoic 2,3-bis[(trimethylsilyl)oxy] propyl ester and octadecanoic 2,3-
bis[(trimethylsilyl)oxy] propyl ester), accounting for 18%. Here the “other” category
made up 11% and the branched fatty acids, 10%.
In the brown mat the highest volume of the lipids were also the triterpenoids
accounting for 31% of the total volume, followed by the straight chain fatty acids, 26%.
The “other” category, two propyl esters, the branched fatty acids and the unsaturated
fatty acids constituted 21%, 12%, 8% and 2%, respectively.
Lastly the white mat had a lower diversity, where the two propyl esters accounted
for 49%, the triterpenoids, 27% and the “other” category, 24%.
Figure 20. Pie chart distribution of total lipid biomarker volumes for the sand sediment-, brown mat-, and
white mat surface samples. Above figure labeled with the “N.” illustrate the lipid biomarkers identified
using the “normal” total ion GCMS method.
Figure 21. Pie chart distribution of total lipid biomarker volumes for the sand sediment-, brown mat-, and
white mat surface samples. The figure is labeled with the “SIM.” illustrate the lipid biomarkers identified

Master Thesis 45hp Alan Wiech Geochemistry
63
using the “SIM” ion GCMS method.
*Note that not all peaks have been identified from the chromatograph, due to low volumes, and are thus
not accounted for in the total volume of the samples, however some unidentified peaks have been
accounted for due to their high volumes and are represented in the “other” category.
Figure 22. Mass spectra for Hexadecanoate (from AOCS lipid library)
Figure 23. Mass spectra for 14-methyl pentadecanoate (iso) (from AOCS lipid library)

Master Thesis 45hp Alan Wiech Geochemistry
64
Figure 24. Mass spectra for 9-hexadecanoate (monoenoic FAmE) (from AOCS lipid library)
Table 6. List of sterols identified, underlining of diagnostic fragments refers to the base peak (highest
peak).
Figure 25. Spectrum for Cholesterol C27 with Δ5.

Master Thesis 45hp Alan Wiech Geochemistry
65
Figure 26. Spectrum for Sterol C28 with Δ5,22.
Figure 27. Spectrum for Stigmasterol C29 with Δ5,22.
Figure 28. Spectrum for beta Sitosterol C29 with Δ5.
Table 7. List of hopanes identified, underlining of diagnostic fragments refers to the base peak (highest
peak).

Master Thesis 45hp Alan Wiech Geochemistry
66
Figure 29. Spectrum for Diploptene, significant diagnostic fragments include: 191.

Master Thesis 45hp Alan Wiech Geochemistry
67
Table 8. Detailed list of the peaks from Brown mat shown in figure 30 fraction 3a.
(S.= straight; n.= normal total ion GCMS method; SIM= SIM GCMS method)

Master Thesis 45hp Alan Wiech Geochemistry
68
Table 9. Detailed list of the peaks from Brown mat shown in figure 30 fraction 3b.
(S.= straight; n.= normal total ion GCMS method; SIM= SIM GCMS method)

Master Thesis 45hp Alan Wiech Geochemistry
69
Figure 30. GCMS chromatogram of the total lipid extracts from brown mat’s surface. The peaks are shown
on tables 8 & 9.

Master Thesis 45hp Alan Wiech Geochemistry
70
Table 10. Detailed list of the peaks from Sand sediment shown in figure 31 fraction 3a.
(S.= straight; n.= normal total ion GCMS method; SIM= SIM GCMS method)

Master Thesis 45hp Alan Wiech Geochemistry
71
Table 11. Detailed list of the peaks from Sand sediment shown in figure 31 fraction 3b.
(S.= straight; n.= normal total ion GCMS method; SIM= SIM GCMS method)

Master Thesis 45hp Alan Wiech Geochemistry
72
Figure 31. GCMS chromatogram of the total lipid extracts from sand sediment’s surface). The peaks are
shown on tables 10 & 11.
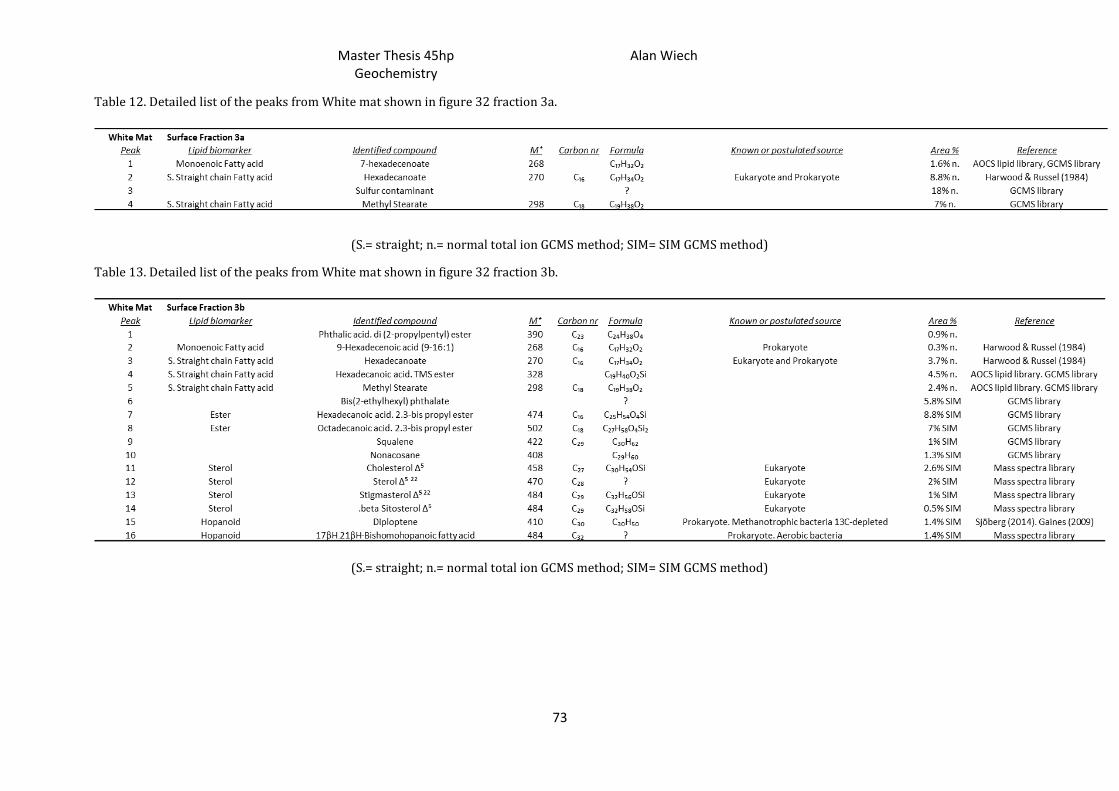
Master Thesis 45hp Alan Wiech Geochemistry
73
Table 12. Detailed list of the peaks from White mat shown in figure 32 fraction 3a.
(S.= straight; n.= normal total ion GCMS method; SIM= SIM GCMS method)
Table 13. Detailed list of the peaks from White mat shown in figure 32 fraction 3b.
(S.= straight; n.= normal total ion GCMS method; SIM= SIM GCMS method)

Master Thesis 45hp Alan Wiech Geochemistry
74
Figure 32. GCMS chromatogram of the total lipid extracts from white mat’s surface. The peaks are shown on tables 12 & 13.

Master Thesis 45hp Alan Wiech Geochemistry
75
Table 14. Detailed lipid biomarker index acquired from the bacterial and archaeal cultures. Peaks are shown in figures 33 & 34.
(S.= straight; n.= normal total ion GCMS method; SIM= SIM GCMS method)

Master Thesis 45hp Alan Wiech Geochemistry
76
Figure 33. GCMS chromatogram of the pure bacteria and archaea cultures. Detailed list of peak in table 14.

Master Thesis 45hp Alan Wiech Geochemistry
77
Figure 34. GCMS chromatogram of the pure bacteria and archaea cultures. Detailed list of peak in table 14.