masterclass: cost benefit analysis for implementing the
TRANSCRIPT

Masterclass: cost benefit analysis for implementing the 2030 Agenda in MexicoDr. Jason Eis | Executive Director at Vivid Economics & Dr. Alejandra Elizondo | Researcher at CIDE
This session will detail a study of the costs to implement the Sustainable Development
Goals in Mexico. The presenters will share information about the study, methodology for
costing 7 SDG targets and key findings from the study.

Presentation prepared for GIZ’s Second Annual Green and Inclusive Financing Event
September 2021

1. Project overview and scope
2. SDG-specific approach
3. Key findings
Masterclass: cost benefit analysis for implementing the 2030 Agenda in Mexico

Masterclass: cost benefit analysis for implementing the 2030 Agenda in Mexico
Dr. Jason Eis
Vivid Economics
Jason is Executive Director at Vivid Economics. He is an expert in public
finance, development and environmental economics, with particular
expertise in the energy, industry, forest and agricultural sectors. He has
worked extensively on sustainable development strategies, including
the development of SDG and green growth assessment methodologies
applied in India, Brazil, Ethiopia, Mexico, Colombia and Peru. He also
has experience in cross cutting issues of climate innovation and
climate finance. Jason has been Project Director for a large number of
complex projects, including high profile initiatives that advised
governments across Asia, Latin America and Africa. In particular, Jason
has extensive experience in developing green growth projects in
conjunction with government stakeholders.
Dr. Alejandra Elizondo
CIDE
Alejandra is a researcher at CIDE with experience in the analysis of
environmental, energy and climate public policies. Her interests
include designing and applying economic tools to assess the impacts
of energy and climate policies on production, government indicators
and wellbeing. She is part of the Interdisciplinary Program for
Regulation and Economic Competition at CIDE, bringing together
views of academia, government, and the private sector in energy
related issues. In addition, she constantly acts as advisor to the
government and other organizations on the definition of the energy
and climate agenda. Alejandra holds a PhD in Public Policy from CIDE,
a MSc in Economic Policy from Columbia University and a BA in
Economics from ITAM.


The Government of Mexico, in collaboration with Deutsche Gesellschaft für Internationale Zusammenarbeit (GIZ) GmBH and Vivid Economics, developed a methodology to calculate the cost of delivering the targets of the UN’sAgenda 2030 in Mexico.
Análisis del costo de implementación de los ODS en México
“La Agenda 2030 para el Desarrollo Sostenible es el acuerdo global más ambicioso de la historia por el bienestar de todas las personas. Su aprobación en 2015 por 193 Estados miembro de la Organización de las Naciones Unidas y los 17 Objetivos de Desarrollo Sostenible que la conforman, representan una propuesta transformadora hacia la construcción de un modelo de desarrollo incluyente, justo y equilibrado, que trascienda nuestro tiempo ysiente las bases para un porvenir más próspero para la presente y las futuras generaciones.”- Estrategia nacional para la implementacion de la Agenda 2030 en Mexico

Mexico has engaged significantly in the delivery of the 2030 Agenda:• A National Council for the 2030 Agenda
provides leadership across government• The 2021 Voluntary National Report
documented success to date and remaining gaps
The SDGs are universal – they have been adopted by 193 countries and belong to all countries and their people.
The SDG Agenda is not about only developing or developed countries, the poor or the rich; it extends worldwide and enshrines the concept of ‘leaving no one behind’.
Recognition of universal principles, standards and
values
Interconnectedness of national and global
development challenges
Sustainable development issues exist in all
countries
Universal commitment to leaving no one behind
Masterclass: cost benefit analysis for implementing the 2030 Agenda in Mexico

Análisis del costo de implementación de los ODS en México
Target Selection Criteria Selected Targets
• Applicability of costing methodology to other targets (utility): SDG targets should require costing methodology that can be adopted and applied to a wide range of targets
• Co-benefit potential of target: Investment in delivery of specific SDG targets is expected to create stimulus across the economy.
• Alignment with national SDG target priorities: The menu of options for the 2030 Agenda is large and many nations have selected specific targets as priorities.
• Data Availability: reliable quantification of SDG targets is contingent upon existing data.
• Balance across themes of the 2030 Agenda: The UN has identified three ‘pillars’ of sustainable development – goals focus on ‘people’, ‘planet’ and ‘prosperity’
• ODS 1.2 – Reducir a la mitad la proporciónde personas que viven en la pobreza
• ODS 6.2 – Lograr el acceso a servicios de saneamiento e higiene adecuados
• ODS 8.10 – Lograr el acceso universal alos servicios bancarios, financieros y deSeguros
• ODS 9.c – Proporcionar accesouniversal y asequible a Internet
• ODS 12.3 – Reducir el desperdicio dealimentos
• ODS 15.5 – Proteger hábitats naturalesy la biodiversidad
• ODS 16.5 – Reducir la corrupción y elsoborno

Masterclass: cost benefit analysis for implementing the 2030 Agenda in Mexico
Halve national poverty by 2030
Access to safely managed sanitation for all
Protect water ecosystems by 2020
Significantly increase access to ICT
Access to banking/financial services for all
Protect culture and heritage sites
Halve per capita food waste/loss
Access to banking/financial services for all
Halt the loss of biodiversity
Substantially reduce corruption and bribery

6.2
Access to sanitation
Costed/scaled based on existing
programs and distance from
target
8.10
Access to finance
Costed/scaled based on existing
programs and distance from
target
9.c
Access to ICT
Costed/scaled based on existing programs,
international data and
distance from target
12.3
Halve food waste
Costed/scaled costs
based on portfolio of ag/waste
programs and policies
15.5
Halt biodiversity
lossCosted/
scaled based on existing
conservation programs and relevant case
studies
16.5
Reduce corruption
Costed/scaled based on existing portfolio of programs,
partner activities
Poverty (income approach) impacts (SDG 1.2)
Target-specific spending consolidated into profile of spending in sectors from 2020 - 2030
ViEW CGE model estimates resulting sector growth and changes in structure of economy over this period, including labor profile across sectors
1
2
Masterclass: cost benefit analysis for implementing the 2030 Agenda in Mexico

Análisis del costo de implementación de los ODS en México
Option 3 (scale historical unit costs): scale costs of past interventions within the country of interest to meet SDG goals
Option 2 (transfer international costs): apply cost estimates from interventions delivered internationally and adjust for target country context
Option 1 (existing estimates): apply existing cost estimates from national policy documents and strategies
Engagement with planning leads will help to assess which option is most appropriate for each sector, given data availability and current strategies
Option 1
Option 2
Option 3
Apply existing estimates
Transfer international costs
Scale historical costs
Masterclass: cost benefit analysis for implementing the 2030 Agenda in Mexico
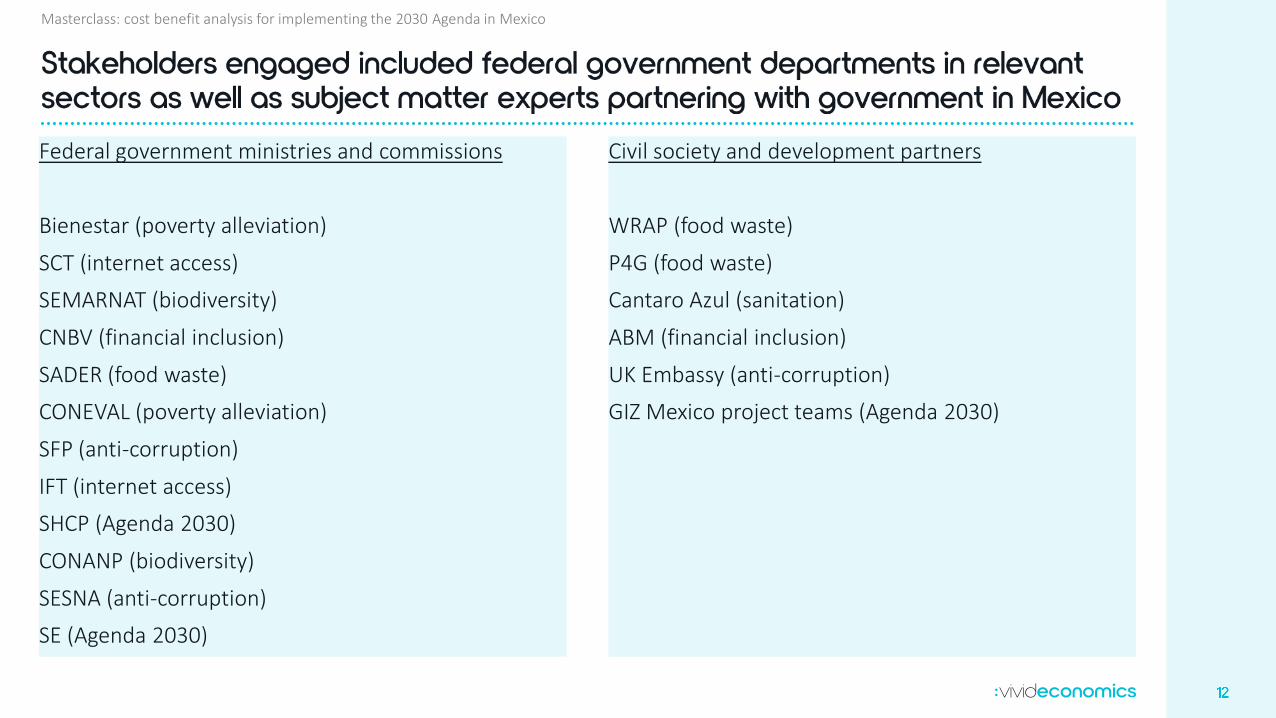
Federal government ministries and commissions
Bienestar (poverty alleviation)
SCT (internet access)
SEMARNAT (biodiversity)
CNBV (financial inclusion)
SADER (food waste)
CONEVAL (poverty alleviation)
SFP (anti-corruption)
IFT (internet access)
SHCP (Agenda 2030)
CONANP (biodiversity)
SESNA (anti-corruption)
SE (Agenda 2030)
Civil society and development partners
WRAP (food waste)
P4G (food waste)
Cantaro Azul (sanitation)
ABM (financial inclusion)
UK Embassy (anti-corruption)
GIZ Mexico project teams (Agenda 2030)
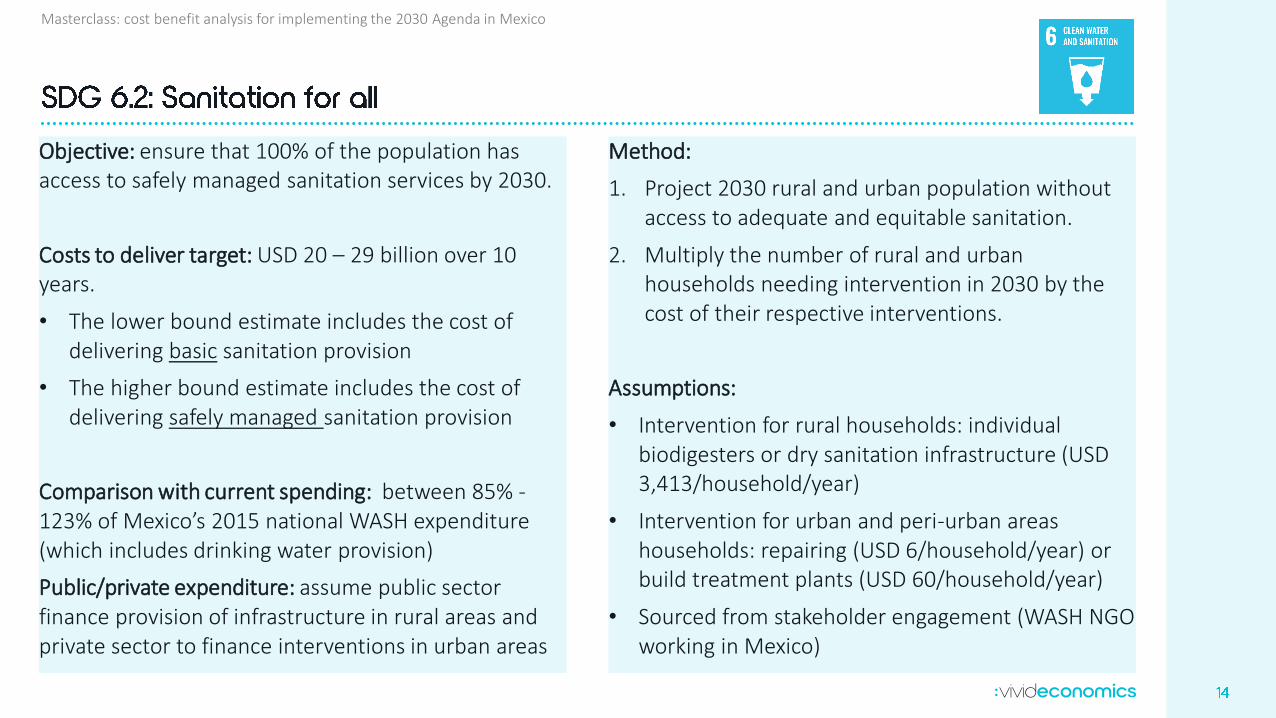
Objective: ensure that 100% of the population has access to safely managed sanitation services by 2030.
Costs to deliver target: USD 20 – 29 billion over 10 years.
• The lower bound estimate includes the cost of delivering basic sanitation provision
• The higher bound estimate includes the cost of delivering safely managed sanitation provision
Comparison with current spending: between 85% -123% of Mexico’s 2015 national WASH expenditure (which includes drinking water provision)
Public/private expenditure: assume public sector finance provision of infrastructure in rural areas and private sector to finance interventions in urban areas
Method:
1. Project 2030 rural and urban population without access to adequate and equitable sanitation.
2. Multiply the number of rural and urban households needing intervention in 2030 by the cost of their respective interventions.
Assumptions:
• Intervention for rural households: individual biodigesters or dry sanitation infrastructure (USD 3,413/household/year)
• Intervention for urban and peri-urban areas households: repairing (USD 6/household/year) or build treatment plants (USD 60/household/year)
• Sourced from stakeholder engagement (WASH NGO working in Mexico)
Masterclass: cost benefit analysis for implementing the 2030 Agenda in Mexico

Objective: ensure 100% of adults have a bank account by 2030.
Costs to deliver target: USD 2 – 8 billion over 10 years.
• The lower bound estimate scales up costs from the World Bank’s Mexico Financial Inclusion Program proportional to required impacts.
• The higher bound estimate uses existing costs of opening a bank account in Mexico, adding the additional assumption that maintaining an account open costs 50% of the opening fee per year.
Comparison with current spending: between 13% –52% of Mexico’s annual spending on ‘financial inclusion’ in 2019.
Method:
1. Project the 2030 population of adults that will need a bank account.
2. Multiply the number of adults needing to open a bank account by 2030 by the cost of opening and maintaining bank account.
Public/private expenditure: private sector participation ranges between 10%, which is the proportion contributed from the financial sector to the World Bank Financial Inclusion programme, and 50% (assumed share in the account-level intervention).
Masterclass: cost benefit analysis for implementing the 2030 Agenda in Mexico

Objective: provide internet to 96% of the population by 2030 (currently best in world internet penetration).
Costs to deliver target: USD 5 billion over 10 years, with 40% of the financing delivering broadband to the majority of the unconnected population.
Comparison with current spending: annual spending required 5 times CFE Internet Para Todos 2021 budget.
Public/private expenditure: assume private sector to provide finance for rural coverage between 2021 and 2024, while public sector finances remote area coverage from 2025.
Method:
1. Project 2030 adult population requiring broadband connectivity.
2. Estimate the cost of deploying mobile broadband to 92.2% penetration (all urban and rural) by 2024.
3. Estimate the costs to connect the remaining unconnected Mexican remote areas between 2024 and 2030.
Assumptions:
• Two phases to connect 96% of the population:
• 2021 – 2024: increase broadband coverage by more than 20 percentage points.
• 2025 – 2030: connect the remaining 4% of the population
Masterclass: cost benefit analysis for implementing the 2030 Agenda in Mexico

Objective: halve food loss and waste by 2030.
Costs to deliver target: more than USD 8 billion over 10 years.
Comparison with current spending: estimated annual spending represent 3.6% of the food loss and waste annual costs to the Mexican economy.
Public/private expenditure: private sector expected to finance the totality of investment required to halve food loss and waste at the farm gate to retail level
Method:
1. Project 2030 food loss and waste without intervention.
2. Estimate the costs of reducing food loss and waste from the farm gate to retail (supply chain).
3. Estimate the costs of reducing food loss and waste from retail to household (awareness campaign).
Assumptions:
• Main food loss and waste farm gate to retail challenge is the lack of cold chain infrastructure to lengthen food’s shelf life (cost = 12% of loss).
• Similar campaigning costs in Mexico and the UK means that it is possible to apply benefit-to-cost ratio of the Love Food Hate Waste campaign successfully deployed in UK to Mexico.
Masterclass: cost benefit analysis for implementing the 2030 Agenda in Mexico

Objective: By 2030, 100% of Mexico’s protected areas will maintain their vegetation cover (prevent losses to less than 5% per year).
Costs to deliver target: USD 2.6 billion over 10 years.
Comparison with current spending: estimated annual costs represent 6 times CONANP’s 2021 budget.
Public/private expenditure: public sector to contribute to 100% of the investment needs between 2021 and 2030.
Method:
1. Estimate the surface area of protected areas in 2030 (in line with 30% target).
2. Multiply the surface of protected areas in 2030 by an optimum per-hectare cost to adequately maintain protected areas.
Assumptions:
• Given Mexico’s recent commitment to contribute to protect 30% of the planet, terrestrial protected areas in Mexico are expected to increase to 30% by 2030.
• Optimum per-hectare cost to maintain protected areas intact is 3X current budget (USD 6.22/ha, as estimated by Pronatura Noroeste compared to current CONANP budget of USD 1.98/ha).
Masterclass: cost benefit analysis for implementing the 2030 Agenda in Mexico

Objective: reduce corruption prevalence rate observed during personal administrative processes by 23% by 2030 (target shared from National Council for Agenda 2030).
Costs to deliver target: USD 1.8 billion over 10 years.
Comparison with current spending: estimated annual costs 14% higher that Mexico’s 2021 anti-corruption federal budget.
Public/private expenditure: federal government contributes to 100% of the investment needs between 2021 and 2030 (in line with MoU with UK Government on ACROL).
Method:
1. Estimate the level and cost of corruption to 2030.
2. Estimate cost of effective interventions (current programs + data steward program in federal ministries).
3. Project estimated spending to 2030.
Assumptions:
• Effective interventions include 2021 requested anti-corruption federal budget, International donor activity in Mexico including UK FCDO’s Global Anti-Corruption Program delivering transparent federal procurement portal and cost estimates of personnel to maintain and update Mexico’s future public procurement system.
• High-cost scenario: reduction costs (USD 21.5 billion) equals to 50% of the costs of corruption
Masterclass: cost benefit analysis for implementing the 2030 Agenda in Mexico

Objective: reduce (nationally defined) poverty by half by 2030.
Costs to deliver target: USD 10 billion annually in 2030.
Comparison with current spending: spending required represents 20% of current spending on cash transfer programmes.
Public/private expenditure: federal government contributes 100% of the investment needs in 2030(assume other spending programmes represent investment up to 2030)
Method:
1. Estimate 2030 GDP, population and GDP/capita.
2. Estimate the 2030 level of poverty, accounting for growth in GDP/capita and additional impact from spending on previous SDGs.
3. Multiply the cost of lifting one person out of poverty by the amount of 2030 poverty that needs to be reduced to meet target.
Assumptions:
• Assume current income poverty lines remain constant in real terms (adjusted only for inflation)
• Assume growth is distributed proportionately between rural/urban population
• Costs of main social policy programs divided by the number of beneficiaries make up the cost of lifting people out of poverty
Masterclass: cost benefit analysis for implementing the 2030 Agenda in Mexico


-
5
10
15
20
25
30M
in
Max
Min
Max
Min
Max
SDG 6.2 SDG 8.10 SDG9.c
SDG12.3
SDG15.5
SDG 16.5
US$
bill
ion
to
20
30
Target-level spending estimates range based on ambition of target (basic or safely managed sanitation) and robustness of assumptions (e.g. scaling example project or calculating bottom up costs)
These scenarios provide a range of estimates to plan for key uncertainties such as last-mile costs
Providing safe and adequate sanitation for all requires the largest
share of investment needs
1Masterclass: cost benefit analysis for implementing the 2030 Agenda in Mexico

The analysis assumes a linear distribution of costs between 2021 and 2030, equivalent to 1-3% of government budget in 2020
The annual financing requirements decrease slightly to reflect the decreasing total costs to connect the remaining 4% of the population to broadband after 2025
S illion per ear
o t res old scenario
ig t res old scenario
1Masterclass: cost benefit analysis for implementing the 2030 Agenda in Mexico

The share of public spending is estimated to be between 70-76% to 2030 (driven at the high end by investment in anti-corruption efforts)
The share of private sector spending is estimated to be between USD 11 -19 billion (24 – 30%)
to 2030
Private sector investment is assumed highest in food waste sector, with significant
private investments also expected in
sanitation, ICT and finance sectors
1
-
5
10
15
20
25
30
Min
Max
Min
Max
Min
Max
SDG 6.2 SDG 8.10 SDG9.c
SDG12.3
SDG15.5
SDG 16.5
US$
bill
ion
per
yea
r
Public investment
Private investment
Masterclass: cost benefit analysis for implementing the 2030 Agenda in Mexico

Expected GDP growth and stimulus impact from SDG spending could reduce the share of population living in poverty
by 11%
An additional reduction of 14%, or 18 million people in 2030, is required to halve the poverty rate (SDG 1.2)
Assuming a cost of MEX$ 11,500 to lift one person out of poverty through direct cash transfer, this residual poverty
reduction would cost around MEX$ 200 billion (USD 10 bn) in 2030 (a 20% increase on current cash transfers)
gro t i pact gro t S Gspending
Popula on living elo na
onal povert line
Poor on poor S G arget
2Masterclass: cost benefit analysis for implementing the 2030 Agenda in Mexico
Note – accounting for additional spending
from delivering other SDG targets could drive down residual poverty
by 2030 further

Source: Rozenberg and Fay (2019), World Bank, Vorisek and Yu (2020)
Masterclass: cost benefit analysis for implementing the 2030 Agenda in Mexico
While 7 targets are costed in this analysis, Agenda 2030 covers 169 targets
Not all targets are relevant for Mexico (e.g. international partnership or targeting Least Developed Countries), but significant areas not covered include:
• Reduce hunger and increase agricultural productivity (SDG 2)
• Improve health outcomes (SDG 3)
• Improve education outcomes (SDG 4)
• Achieve gender equity (SDG 5)
• Promote renewable energy (SDG 7)
• Protect marine life (SDG 14)
Note: annual estimated costs for 7 targets amount to <1% GDP

Vivid Economics Limited163 Eversholt StreetLondon NW1 1BUUnited Kingdom
T: +44 (0)844 8000 254
vivideconomics.com