masters dissertation posters 2014
DESCRIPTION
Posters summarizing dissertation research projects to date, presented by MA and MSc students at the Institute for Transport Studies (ITS), University of Leeds, May 2014. on.fb.me/1oSvcMT www.its.leeds.ac.uk/courses/masters/dissertationTRANSCRIPT

Development of a Transferable Car Travel Demand Model: A Case Study of Nairobi, Kenya and Dar-es-Salaam, Tanzania
Andrew Bwambale | Dr. Charisma Choudhury (Supervisor) | Dr. Nobuhiro Sanko (2nd Reader)
1. Motivation
2. Objectives
To investigate the hypothesis that
households make joint car ownership and
trip generation decisions;
To evaluate the local performance of
alternative modelling frameworks;
To investigate the effectiveness of directly
transferred models; and
To evaluate the impact of updating
procedures on model transferability.
3. Case Study Areas (1) 5. Modelling Framework
6. Methodology
Spatial Transferability of household car
ownership and Trip Generation models
using data from JICA household surveys -
Nairobi (2006) and Dar-es-Salaam (2008).
General Model Types: Univariate and
Bivariate Ordered Response Models
Four Scenarios:
M1 = A car trip generation model without
the car ownership variable
M2 = A car trip generation model with the
car ownership variable
M3 = A car ownership sub model for in-put
into the trip generation model
M4 = A joint car ownership and car trip
generation model
Focus will be on spatial transferability of household car ownership and Trip Generation models
using data from JICA household surveys - Nairobi (2006) and Dar-es-Salaam (2008). Four
alternative structures to be tested in pursuit of the most appropriate modelling framework.
5. Insights from Data
M1 M2 M4 M3
Comparison of
model performance
Incorporation of
aggregate variables
M1’ M2’ M4’ M3’
Comparison of
model performance
Transferability tests
and updating
Transferability tests
and updating
Evaluation
Final model
Comparison of model
performance
Comparison of model
performance
Transferability
tests and
updating
Final
Comparison
and model
selection
NAIROBI
Transferability
tests and
updating
M1D
Comparison of model
performance
Comparison of model
performance
DAR – ES - SALAAM
Incorporation of
aggregate variables
M1N/ M1D: A car trip generation
model without the car
ownership variable to test
whether the need for car
ownership data can be avoided
M2N/ M2D: A car trip generation
model with the car ownership
variable to test the
significance of car ownership
on trip generation
M3N/M3D A car ownership sub model pre-
estimating car ownership for input into the
car trip generation model to test
performance in circumstances of
unavailable/ unreliable car ownership data
M4N/ M4D: A Joint car
ownership and trip generation
model addressing suspected
endogeneity between them
4. Case Study Areas (2)
NAIROBI
DAR-ES-SALAAM
M2D M3D M4D
M1’D M2’D M3’D M3’D
M1N M2N M3N M4N
Incorporation of
aggregate variables
M1’N M2’N M3’N M3’N
1.1%3.9%
9.0%
24.7%
31.2%
42.6%40.0%
0.0%
10.0%
20.0%
30.0%
40.0%
50.0%
60.0%
31.8
74.2
148.5
318.1
530.2
742.3
848.3
Average Household Income (USD)
Car Holding Rate by HH Income
1.0% 1.0% 2.7% 5.2%
14.3%
24.0%
45.3%
65.3%
90.6%
0.0%
20.0%
40.0%
60.0%
80.0%
100.0%
34.0
102.0
170.1
238.1
340.1
476.2
612.2
1,0
20.4
1,3
60.5
Average Household Income (USD)
Car Holding Rate by HH Income
Budget constraints have resulted in
model estimation data shortage in
developing countries.
A compromise solution could be provided
by transferable models. Focus to be
placed on transferability of car ownership
and car trip generation models (Since
private cars are the main source of
congestion).
However, unreliable car ownership
information might limit transferability of
traditional trip generation models
containing a car ownership variable.
Previous studies have not tackled the
possibility of using cross-sectional data
to develop a joint car ownership / trip
generation model based on exogenous
variables to avoid this problem

Perceptions of transport network flood-risk vulnerability Are we prepared enough?
Aims
• Identify vulnerabilities of the transport network
within selected ‘flood-risk’ areas
• Establish perceptions of transport network
vulnerabilities in case study areas
• Ascertain opportunities for improvements to
existing strategies in the event of a flooding
emergency
Expected Findings
• Identification of specific training needs in
flood-risk areas, directly related to the
identification of vulnerabilities in case study
areas
• Improvement of emergency strategies for
vulnerable groups focusing on accessibility
in flood-risk areas
• Development of a framework for
vulnerable area identification and
accessibility improvements for policy
perceptions of vulnerability
Methodology
• Undertake a comprehensive analysis of existing literature and
preparation techniques for emergency response and vulnerability
identification
• Audit emergency response information - including training
programs and response strategies to identify perceptions of
vulnerability in case study areas
• Analyse accessibility issues in relation to network limitations for
vulnerable groups (e.g. disabled, homeless, isolated elderly
people and children) and methods to improve existing strategies
“more people will be at risk of coastal flooding
each year” UK CEN (2014)
Amy Friel MSc. Transport Planning FT Supervisor: Frances Hodgson
Source: Environment Agency (2014)
Background
Over recent years, the rainfall and disaster situations in the UK as a result of
flooding have been steadily increasing. As this risk increases, it is necessary
to ensure sufficient transport sector emergency preparation for vulnerable
areas and vulnerable groups.
In the UK:
• 5, 000, 000 people in direct risk of flooding
• 1 in 6 ‘flood-risk’ properties
• ~86% probability of identified areas flooding again in the next 70 years
• >300,000 homes without power (Winter 2014)
• Sea-levels rose to just 40cm below the Hull Tidal Surge Barrier limit
(December 2013)
0
5
10
15
20
25
0 0.5 1 1.5
Nu
mb
er o
f P
rop
ert
ies
Lost
(a
pp
rox)
Tho
usa
nd
s
Sea-Level Increase (metres AOD)
Sea-Levels in the Humber Estuary: Potential Property Loss
Key References Golpalakrishnan, C. 2013. Water and disasters: a review and analysis. International Jourlan of Water Resources Development. 29(2), pp. 250-271 Berdica, K. 2002. An introduction to road vulnerability: what has been done, is done and should be done. Transport Policy. 9. pp. 117-127 Environment Agency. 2010. River Hull Flood Risk Management Strategy Report. Halcrow Group Limited.

Understanding Choice of Departure Airport and its Rela7on to Surface Access: A Case Study of Manchester and Leeds Bradford Airports
• To discover the generally accepted distance at which
a passenger is not prepared to travel beyond to access a direct flight and how this varies with different journey and passenger types
• To assess the role of surface access in passengers willingness to travel to a regional airport of further distance from their home airport, to access a direct flight
• Upon the results of the two above objec=ves, would there be a case for the two airports to work collabora=vely.
Research Ques=ons: Background Builds upon the work of Johnson, Hess and MaGhews (2014). Their study assessed whether a passenger would be more inclined to take a direct flight from an alterna=ve airport rather than an in-‐direct flight from their home airport. Concluded that irrespec=ve of improved surface access, there was a strong aversion to in-‐direct flights and the passenger would s=ll choose the alterna=ve regional airport. They would s=ll choose the alterna=ve airport if the airfare were to be increased and the access =me longer than their home airport.
This study will aGempt to quan=fy the point at which passengers no longer find the promise of a direct flight enough to warrant increased access =me and cost. It will then seek to assess how improved surface access to the airports region wide, would affect passengers propensity to travel to an alterna=ve airport to access a direct flight. Would try to assess the case for strategic coopera=on of the two airports.
Scope of the Study
Why Manchester and Leeds? In 2010, 20.2% of Manchester Airports patronage originated from or des=na=ons were in the Yorkshire and Humber area, rising from 19.2% in 2009. Yorkshire and the Humber has not only Leeds Bradford Airport, but Doncaster and Humberside too. This would suggest that the people of Yorkshire and Humber are prepared to travel a significant distance to access the wider range of direct flights that Manchester Airport has to offer. First Trans-‐Pennine express provide services to Manchester Airport from across Yorkshire to the airport. Significant?
Key References Civil Avia=on Authority. 2010. Passenger Survey Report 2010. London, Civil Avia=on Authority. Civil Avia=on Authority. 2009. Passenger Survey Report 2009. London, Civil Avia=on Authority. Johnson, D. Hess, S. MaGhews, B. 2014. Understanding Air Travellers’ Trade-‐offs Between Connec=ng Flights and Surface Access.
Anna Goldie, MSc Transport Planning FT Supervisor: Bryan MaGhews
Methodology Will follow stated preference survey techniques and mul=nomial logit models to assess passengers paGern of trades offs Iden=fica=on of a range of important aGributes in the decision making process such as: Air Service type – Full or Low cost Flight Type – Direct or Indirect Access Time Access Mode/s Reliability of Access Modes Price of Access Modes Approach Airports and Access providers such as Trans-‐Pennine Express (MAN) and Arrow Cars (LBA) Secure access to passengers to survey – failing this explore online surveying techniques
What Next?

CONTROLLING REFLECTIVE CRACKING IN ASPHALT OVERLAYS A Pavement Deterioration Study
By: Ahmad Huneidi Supervisor: Mr. David Rockliff
1. Background • Asphalt is a mixture of cement, water and
aggregate. It can be used as a surface binder
course on the top layer of the pavement.
• Pavement layers from bottom to the top layer are
sub-grade, capping layer (optional), sub-base,
main base, binder course and surface course.
• Asphalt cracking is a form of pavement
deterioration which is mainly caused by water
entering the pavement infrastructure. Other
reasons can be due to weathering conditions,
traffic loadings and lack of maintenance.
2. Objectives • To control reflective cracking in asphalt and to
choose the best cost/effective treatments available.
• Treatments to be chosen depending on the
deterioration stage. Crack sealing, surface
dressing, patching, inlaying and crack injection are
suitable solutions.
• To identify the causes of the cracking, i.e. water,
thermal or traffic related.
• Estimating the best time to intervene to maintain
the pavement is based on engineering judgment.
3. Comparisons and Limitations • A huge part of the dissertation will focus on comparing asphalt cracking and pavement deterioration
between the UK and Kuwait. Specifically to compare deterioration patterns caused by weathering
conditions, as in Kuwait the temperature can go up to 50 oC during the day, and may drop 10 degrees and
more during nightfall, where in the UK many types of weather can be experienced in a single day. Also,
maintenance procedures in terms of asset management comparisons between Kuwait and the UK, where
in Kuwait funding and budget is highly available and in the UK highway maintenance budget was cut in the
past few years.
• The dissertation will also argue the limitations set on highway maintenance, such as budget, as it’s
recommended to intervene to fix the pavement, however sometimes it’s better not to intervene to save
money.
5. Research Outcomes • Preventing asphalt cracking and on-time
intervention.
• Introduce a cost/effective pavement maintenance
procedures
• Heavily deteriorated pavements may lead to car
damage and pedestrian/cycling accidents, e.g.
potholes.
• Identify the conditions of the highway infrastructure
in Kuwait and compare it to the UK.
4. Research Methodology • The research will start off defining the asphalt
mixture and its’ mechanism.
• Functions of a pavement, layers and most
common binding courses used.
• Detailed definition of the main question.
• Designing appropriate thickness with good quality
materials to increase pavements’ life-expectancy.
• Identify asphalt cracking reasons in Kuwait and in
the UK with comparisons.
• Identify pavement maintenance procedures in
Kuwait and in the UK with comparisons.
• Look into highway maintenance and infrastructure
budget available and in terms of asset
management.
6. References • J.M. Rigo, R. Degeimbre, L. Francken (2010) Reflective Cracking in
Pavements: State of the Art and Design Recommendations. Oxford,
UK.
• L. Francken, E. Beuving, A. Molenaar (2004) Reflective Cracking in
Pavements: Design and Performance of Overlay Systems. London,
UK.
• T. Harvey (1995) Structural Design of Asphalt Concrete Pavements
to Prevent Fatigue Cracking. California, USA.
• J. Baek (2010) Modelling Reflective Cracking Development in HMA
Overlays. Illinois, USA.
• Button & Lytton (2006) Guidelines – Synthetics in HMA Overlays.
• Online references: Tensar International, Maccaferri, Adept & Institute
of Asphalt Technology.
• References from Kuwait: Arab Planning Institute, Department of
Transport, and Ministry of Public Works.
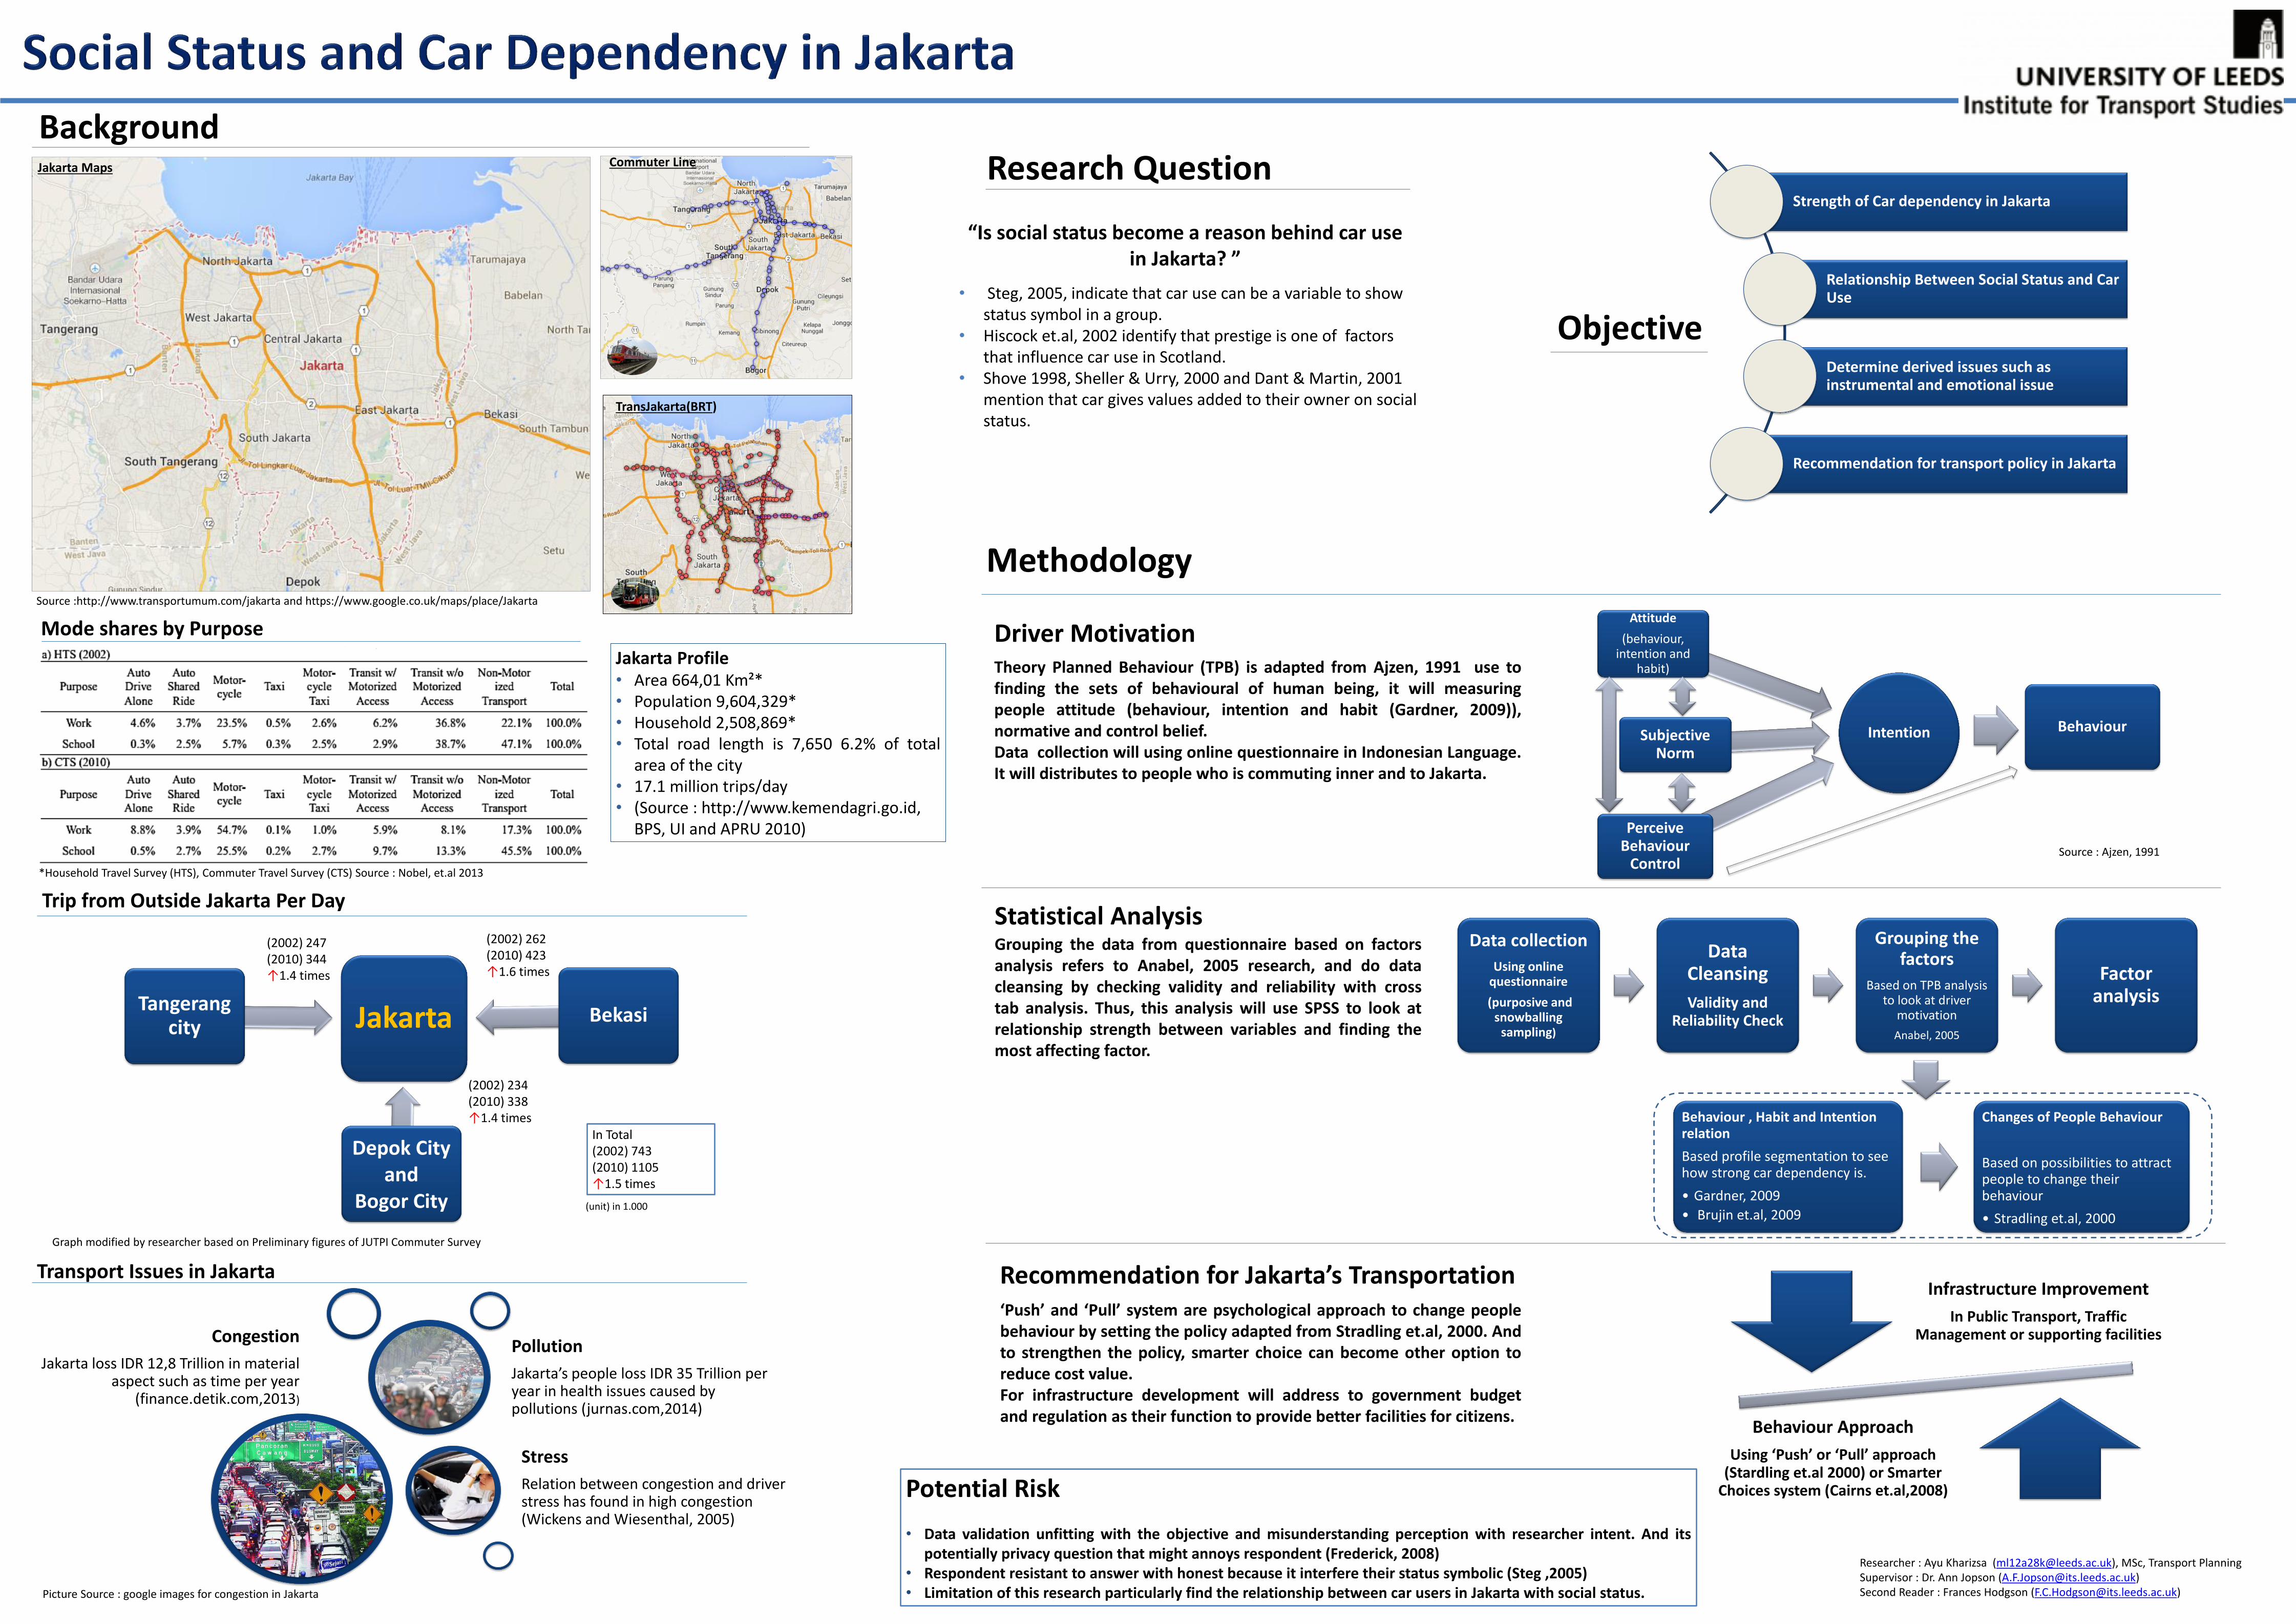
Source :http://www.transportumum.com/jakarta and https://www.google.co.uk/maps/place/Jakarta
Commuter Line
TransJakarta(BRT)
*Household Travel Survey (HTS), Commuter Travel Survey (CTS) Source : Nobel, et.al 2013
Jakarta Tangerang
city Bekasi
Depok City and
Bogor City
(2002) 262 (2010) 423 ↑1.6 times
(2002) 247 (2010) 344 ↑1.4 times
(2002) 234 (2010) 338 ↑1.4 times
(unit) in 1.000
Graph modified by researcher based on Preliminary figures of JUTPI Commuter Survey
In Total (2002) 743 (2010) 1105 ↑1.5 times
Congestion
Jakarta loss IDR 12,8 Trillion in material aspect such as time per year
(finance.detik.com,2013)
Stress
Relation between congestion and driver stress has found in high congestion (Wickens and Wiesenthal, 2005)
Pollution
Jakarta’s people loss IDR 35 Trillion per year in health issues caused by pollutions (jurnas.com,2014)
Transport Issues in Jakarta
Trip from Outside Jakarta Per Day
Strength of Car dependency in Jakarta
Relationship Between Social Status and Car Use
Determine derived issues such as instrumental and emotional issue
Recommendation for transport policy in Jakarta
Behaviour , Habit and Intention relation
Based profile segmentation to see how strong car dependency is.
• Gardner, 2009
• Brujin et.al, 2009
Changes of People Behaviour
Based on possibilities to attract people to change their behaviour
• Stradling et.al, 2000
Intention
Attitude
(behaviour, intention and
habit)
Perceive Behaviour
Control
Subjective Norm
Data collection
Using online questionnaire
(purposive and snowballing
sampling)
Data Cleansing
Validity and Reliability Check
Grouping the factors
Based on TPB analysis to look at driver
motivation
Anabel, 2005
Factor analysis
Infrastructure Improvement
In Public Transport, Traffic Management or supporting facilities
Behaviour Approach
Using ‘Push’ or ‘Pull’ approach (Stardling et.al 2000) or Smarter
Choices system (Cairns et.al,2008)
Driver Motivation
Statistical Analysis
Recommendation for Jakarta’s Transportation
Behaviour
Methodology
Objective
Background
Jakarta Profile • Area 664,01 Km²* • Population 9,604,329* • Household 2,508,869* • Total road length is 7,650 6.2% of total
area of the city • 17.1 million trips/day • (Source : http://www.kemendagri.go.id,
BPS, UI and APRU 2010)
“Is social status become a reason behind car use in Jakarta? ”
Research Question
• Steg, 2005, indicate that car use can be a variable to show status symbol in a group.
• Hiscock et.al, 2002 identify that prestige is one of factors that influence car use in Scotland.
• Shove 1998, Sheller & Urry, 2000 and Dant & Martin, 2001 mention that car gives values added to their owner on social status.
Theory Planned Behaviour (TPB) is adapted from Ajzen, 1991 use to finding the sets of behavioural of human being, it will measuring people attitude (behaviour, intention and habit (Gardner, 2009)), normative and control belief. Data collection will using online questionnaire in Indonesian Language. It will distributes to people who is commuting inner and to Jakarta.
Grouping the data from questionnaire based on factors analysis refers to Anabel, 2005 research, and do data cleansing by checking validity and reliability with cross tab analysis. Thus, this analysis will use SPSS to look at relationship strength between variables and finding the most affecting factor.
‘Push’ and ‘Pull’ system are psychological approach to change people behaviour by setting the policy adapted from Stradling et.al, 2000. And to strengthen the policy, smarter choice can become other option to reduce cost value. For infrastructure development will address to government budget and regulation as their function to provide better facilities for citizens.
Potential Risk • Data validation unfitting with the objective and misunderstanding perception with researcher intent. And its
potentially privacy question that might annoys respondent (Frederick, 2008) • Respondent resistant to answer with honest because it interfere their status symbolic (Steg ,2005) • Limitation of this research particularly find the relationship between car users in Jakarta with social status.
Jakarta Maps
Picture Source : google images for congestion in Jakarta
Researcher : Ayu Kharizsa ([email protected]), MSc, Transport Planning Supervisor : Dr. Ann Jopson ([email protected]) Second Reader : Frances Hodgson ([email protected])
Mode shares by Purpose
Source : Ajzen, 1991
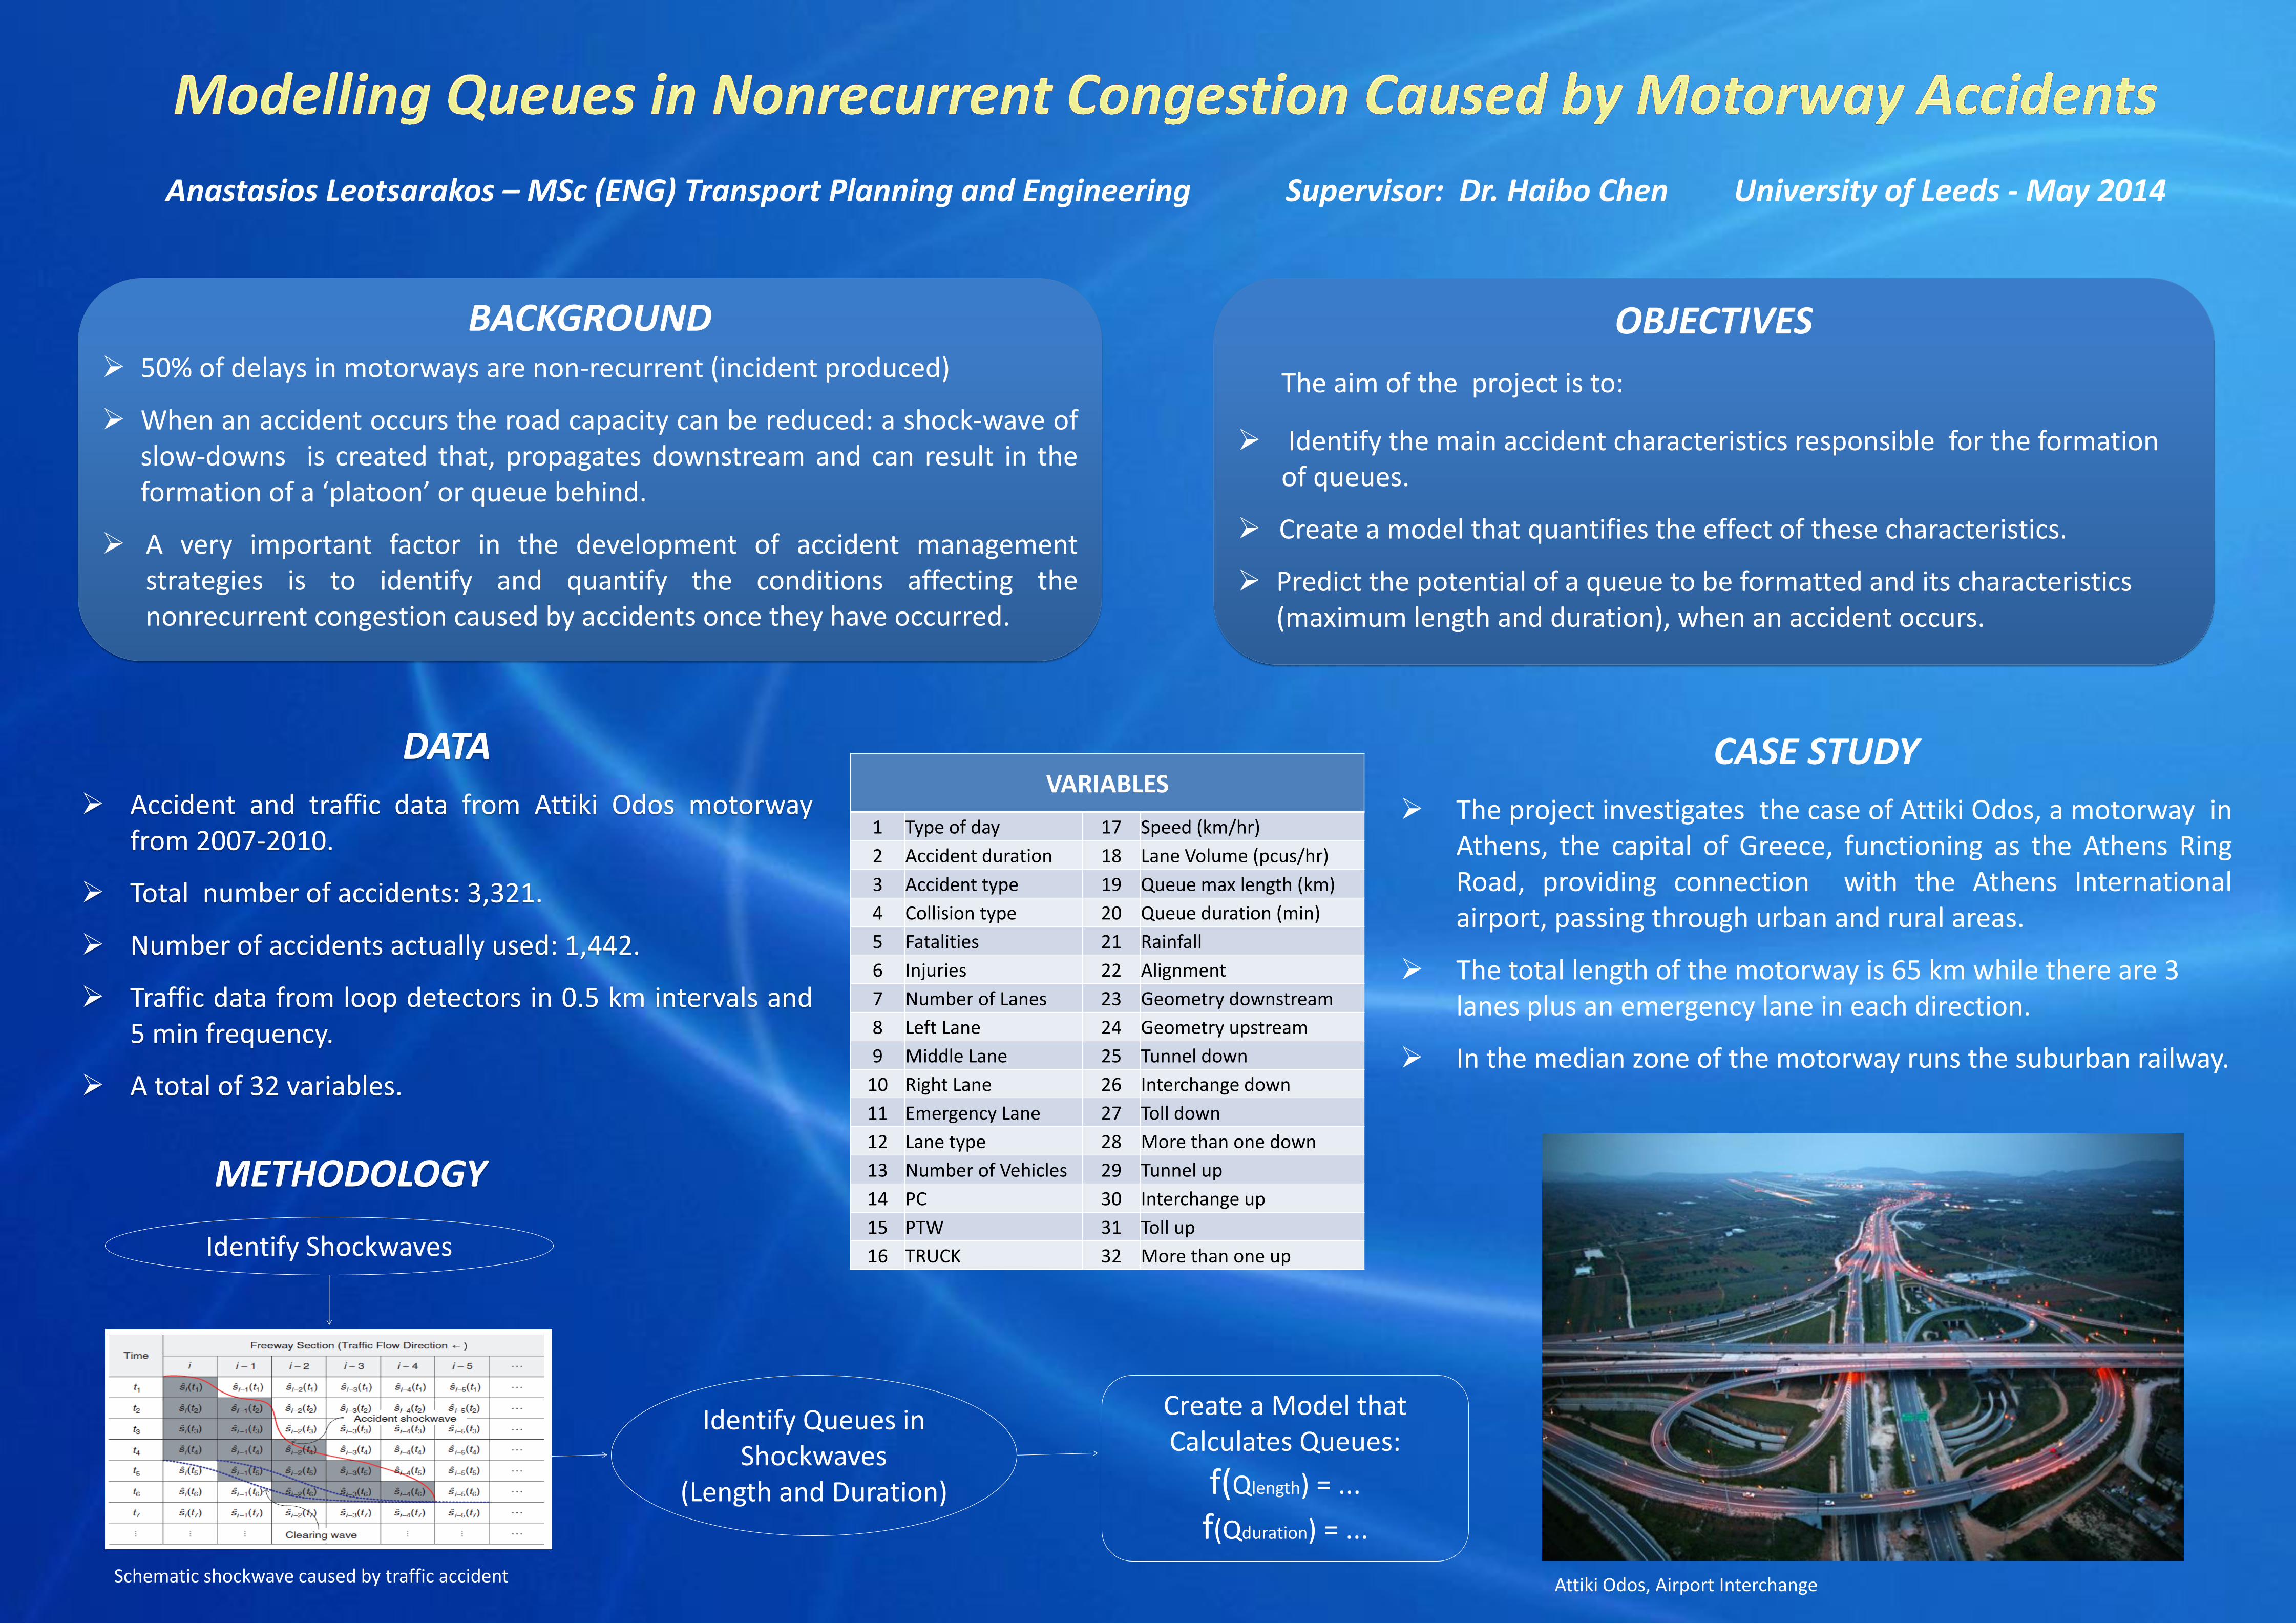
Anastasios Leotsarakos – MSc (ENG) Transport Planning and Engineering Supervisor: Dr. Haibo Chen University of Leeds - May 2014
OBJECTIVES
The aim of the project is to:
Identify the main accident characteristics responsible for the formation of queues.
Create a model that quantifies the effect of these characteristics.
Predict the potential of a queue to be formatted and its characteristics (maximum length and duration), when an accident occurs.
METHODOLOGY
CASE STUDY
The project investigates the case of Attiki Odos, a motorway in Athens, the capital of Greece, functioning as the Athens Ring Road, providing connection with the Athens International airport, passing through urban and rural areas.
The total length of the motorway is 65 km while there are 3 lanes plus an emergency lane in each direction.
In the median zone of the motorway runs the suburban railway.
DATA
Accident and traffic data from Attiki Odos motorway from 2007-2010.
Total number of accidents: 3,321.
Number of accidents actually used: 1,442.
Traffic data from loop detectors in 0.5 km intervals and 5 min frequency.
A total of 32 variables.
VARIABLES
1 Type of day 17 Speed (km/hr)
2 Accident duration 18 Lane Volume (pcus/hr)
3 Accident type 19 Queue max length (km)
4 Collision type 20 Queue duration (min)
5 Fatalities 21 Rainfall
6 Injuries 22 Alignment
7 Number of Lanes 23 Geometry downstream
8 Left Lane 24 Geometry upstream
9 Middle Lane 25 Tunnel down
10 Right Lane 26 Interchange down
11 Emergency Lane 27 Toll down
12 Lane type 28 More than one down
13 Number of Vehicles 29 Tunnel up
14 PC 30 Interchange up
15 PTW 31 Toll up
16 TRUCK 32 More than one up
BACKGROUND 50% of delays in motorways are non-recurrent (incident produced)
When an accident occurs the road capacity can be reduced: a shock-wave of slow-downs is created that, propagates downstream and can result in the formation of a ‘platoon’ or queue behind.
A very important factor in the development of accident management strategies is to identify and quantify the conditions affecting the nonrecurrent congestion caused by accidents once they have occurred.
Identify Shockwaves
Identify Queues in Shockwaves
(Length and Duration)
Create a Model that Calculates Queues:
f(Qlength) = ...
f(Qduration) = ...
Attiki Odos, Airport Interchange Schematic shockwave caused by traffic accident

• Hills and activity related issues recognised as key issue by
Gatersleben & Appleton:(2007) in their cycle to work study in a hilly area of Surrey.
• Figure 2 displays what they found to be key factors leading to a bad cycling experience.
24%
19% 13%
8%
36%
Figure 2: Factors relating to bad cycling experiences
Bad Weather/Darkness
Activity related issues: hills & feeling tired
Traffic issues
Mechanical
Other
Source: Gatersleben & Appleton (2007)
What are electric bikes? Electric bicycles (also known as Pedelecs and e-bikes) are bicycles which offer the rider electrical assistance when pedalling. This comes from a battery power source.
Expected findings: - Technologically e-bikes are now a viable form of transport. - Lack of awareness of the benefits from the public and policymakers which is limiting the uptake
of e-bikes amongst most groups. - The increased Cost of an e-bike is a key barrier to uptake, particularly for lower-income groups
and those new to cycling. Industry bodies recommend >£1000 for a quality model. - Concerns which prevent people using conventional bikes will still form a barrier. These include
road safety and weather (Rose 2013).
Background
Methodology & Data collection 1. Qualitative interviews with e-bike retailers, manufacturers and industry experts. The findings will
feed into and complement the questionnaire survey. 2. Questionnaire survey of existing e-bike users and those who do not currently cycle. This will
assess the impact of the technology on travel habits of existing owners and the attitudes of non-owners .
3. Analyse & Triangulate both qualitative and quantitative data to gain significance and depth of understanding.
Key references consulted: Gordon, E., Xing, Y., Wang, Y., Handy, S., & Sperling, D. (2012). Can Electric 2-wheelers Play a Substantial Role in Reducing C02 Emissions?. Institute of Transportation Studies, University of California, Davis. Rose, G. (2012). E-bikes and urban transportation: emerging issues and unresolved questions. Transportation, 39(1), 81-96. Dill, J., & Rose, G. (2012). E-bikes and transportation policy: Insights from early adopters. Transportation Research Record: Journal of the Transportation Research Board, (2314), 1-6 Gatersleben, B., & Appleton, K. M. (2007). Contemplating cycling to work: Attitudes and perceptions in different stages of change. Transportation Research Part A: Policy and Practice, 41(4), 302-312.
How much of a barrier are hills and intense physical activity?
Where is the potential for e-bikes? It has been acknowledged that e-bikes can encourage cycling amongst:
• The Elderly • Physically disadvantaged • Cyclists in hot, hilly or windy areas • Those wishing to avoid the need to
change clothes (see Rose 2012 & Gorden et. al. 2012).
Source: COLIBI 2013
Electric bike sales Sales have been strongest in China with Germany and the Netherlands jointly making up 65% of the European market in 2012.
Research questions arising
1. Can e-bikes encourage more cycling trips in hilly areas and amongst those less able in the UK? 2. What are the barriers to e-bike ownership, given the slow take-up in the UK?
Are electric bikes a solution to hills? A UK perspective.
A hub-mounted electric motor
A frame-mounted electric motor
Folding electric bicycle
Student: Alexander Lister Course: MSc. Transport Planning Dissertation Supervisor: Frances Hodgson
0
50,000
100,000
150,000
200,000
250,000
300,000
350,000
400,000
2010 2011 2012
E-b
ike
sal
es
Year
E-bike sales 2010-2012
Great Britain
Germany
Netherlands
45%
20%
5%
5%
4%
21%
Europe 2012 e-bike sales share
Germany
The Netherlands
France
Italy
Great Britain
Other(s)

Monica Corso - [email protected]
MSc (Eng) Transport Planning and Engineering
Supervisor: Daniel Johnson May 2012
Bing Li – MSc Transport Planning and Engineering Supervisor: Dr. James Tate
E-mail: ml12b2l@ leeds.ac.uk Institute for Transport Studies University of Leeds 05 - 2014
BACKGROUND
OBJECTIVES
CASE STUDY
➢ The main aim of this project is to better understand the impacts of traffic congestion on fuel consumption and vehicle emissions performance in the study area – Headingley.
➢ Two key objectives:
Actual Tracked Vehicles Data in Headlingley from RETEMM Project (Speed, Acceleration, Gradient)
One Vehicle with PEMS
Model Validation and Data Obtaining – Real and Predict Emissions & Fuel Consumption
VEHICLE EMISSIONS FUEL CONSUMPTION
➢ Road transport is the main source of air pollution in urban areas.
➢ Speed profiles will help to run emission model.
➢ Speed profiles are obtained using a GPS data logger and the data is historic collected.
➢ Road gradient is considered which will be used in PHEM through vehicle specific power (VSP) formula and to make model more accurate. ➢ Analysing the relationship between congestion and vehicle emissions, and how driving behaviours in traffic congestion affect emissions
➢ Fuel consumption is greatly influenced by road gradient because it is related to different engine load.
➢ Fuel consumption usually increases under congestion and the changing of driving behaviours makes contributions to the increasing part.
◎ Using actual tracked data to study how driving behaviours and vehicle movements adapt to congestion and the effect on tail-pipe emissions.
◎ Analysing how driving behaviours and vehicle movements influence fuel consumption under congestion.
➢ Health Effect: Public Health England(PHE) said 5.3 per cent of all deaths in over-25s were linked to air pollution, which is more than road accidents.
➢ Emission Trends: The emissions of petro vehicles (e.g. NOX) decreases from Euro0 to Euro5, however, it is almost unchanged for diesel vehicles and increases from Euro3.
*Real-world Traffic Emissions Monitoring and Modelling (RETEMM). EPSRC January 2008, Grant Reference: GR/S31136/01
Five vehicles with GPS data
Analysis and Comparison
Emission Model – PHEM Real Observations (CO2)
0 200 400 600 800 1000
0.0
00
0.0
01
0.0
02
0.0
03
0.0
04
0.0
05
0.0
06
Time (seconds)
NO
x (
g / s
)
0 200 400 600 800 1000
01
02
03
04
05
0
Time (seconds)
Ve
hic
le S
pe
ed
(
km
h1)
Speed Profile NOX Profile

•Review of relevant literature
• formulation of questions for interviews
Methodology
Step one
•Interview of policy makers and Non Governmental Organizations (NGOs)
• Interview analysis.
Methodology
Step two
•An appraisal of the factors that have influenced the focus on CO2 reduction in transport in the UK;
•Exposition on the consequences of such focus.
Expected Findings
Benedictus Dotu Nyan ID: 200819480 Sustainability (Transport) Supervisor Antonio Ferreira (Dr) Caroline Mullen (Dr) Second Reader TRAN5911M
Background- emergence of focus on CO2 reduction in the UK
• Stern Review (2006) urged transition to a low carbon economy.
• UK Climate Change Act (2008) :-
transport is a major source of CO2 and other Greenhouse gases (DfT, 2012).
• Carbon Plan (2011) :- move toward
achieving an 80% reduction in and CO2 other Greenhouse gases (DfT, 2012)
• (DECC, 2014) CO2 emissions from the
transport sector in the UK in 2013 accounted for ¼ of all domestic CO2
emissions
Objectives Identify factors that have
influenced the focus on CO2
reduction in the UK.
Examine the pros and cons of
focusing on CO2 reduction in the
UK.
Research Questions What are the factors that have influenced the focus on CO2 reduction in the UK?
What are the pros and cons of
focusing on CO2 reduction in the UK?
Problem • Humanity has already transgressed the
climate change planetary boundary . • It is based on two critical thresholds- CO2
and radiative forcing. • Exceedence of 350 PPM of CO2 and 1 watt of
radiative forcing will result to irreversible climate change.; However,
• The biodiversity boundary has been transgressed;
• Change in land use has become problematic
(Rockstrom et al., 2009). • Ambient air pollution (PM2.5, PM10 NO2, SO2,
etc.) was responsible for 3.5 million deaths in 2012 (WHO, 2012);
Google Image
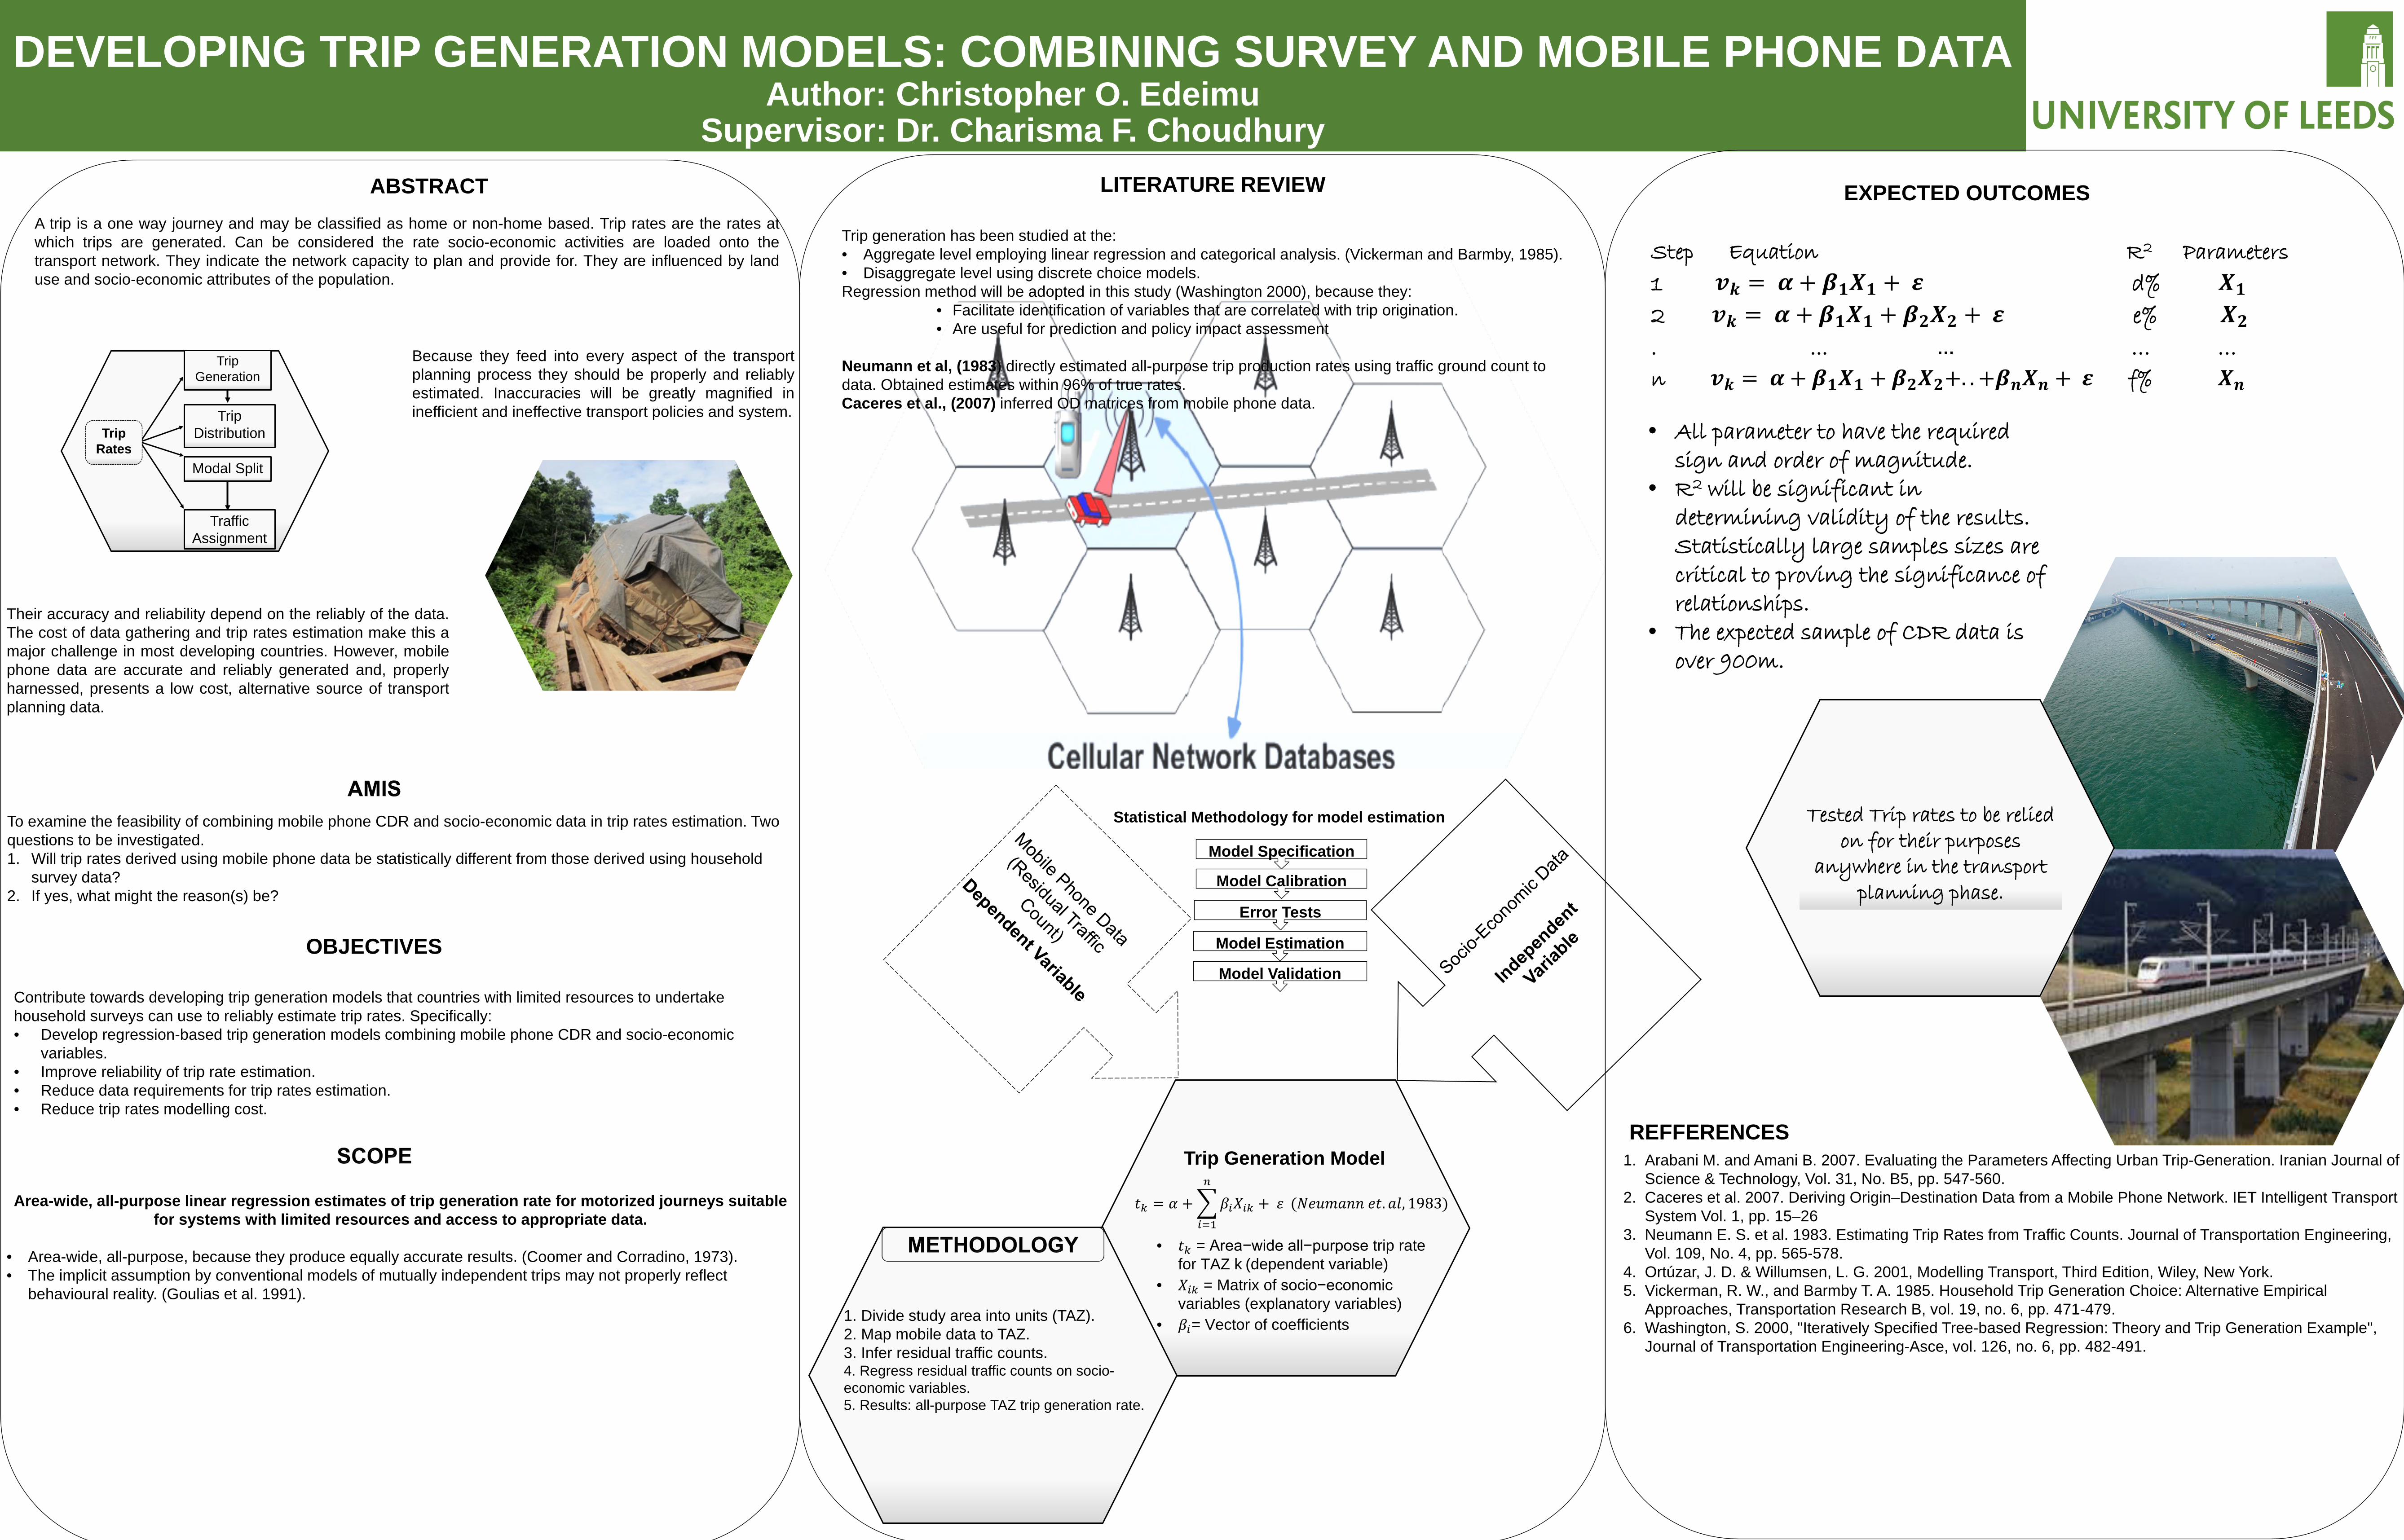
DEVELOPING TRIP GENERATION MODELS: COMBINING SURVEY AND MOBILE PHONE DATAAuthor: Christopher O. Edeimu
Supervisor: Dr. Charisma F. Choudhury
A trip is a one way journey and may be classified as home or non-home based. Trip rates are the rates at which trips are generated. Can be considered the rate socio-economic activities are loaded onto the transport network. They indicate the network capacity to plan and provide for. They are influenced by land use and socio-economic attributes of the population.
ABSTRACT
Their accuracy and reliability depend on the reliably of the data. The cost of data gathering and trip rates estimation make this a major challenge in most developing countries. However, mobile phone data are accurate and reliably generated and, properly harnessed, presents a low cost, alternative source of transport planning data.
Trip generation has been studied at the: • Aggregate level employing linear regression and categorical analysis. (Vickerman and Barmby, 1985). • Disaggregate level using discrete choice models. Regression method will be adopted in this study (Washington 2000), because they:
• Facilitate identification of variables that are correlated with trip origination. • Are useful for prediction and policy impact assessment
Neumann et al, (1983) directly estimated all-purpose trip production rates using traffic ground count to data. Obtained estimates within 96% of true rates. Caceres et al., (2007) inferred OD matrices from mobile phone data.
OBJECTIVES
Contribute towards developing trip generation models that countries with limited resources to undertake household surveys can use to reliably estimate trip rates. Specifically: • Develop regression-based trip generation models combining mobile phone CDR and socio-economic
variables. • Improve reliability of trip rate estimation. • Reduce data requirements for trip rates estimation. • Reduce trip rates modelling cost.
To examine the feasibility of combining mobile phone CDR and socio-economic data in trip rates estimation. Two questions to be investigated. 1. Will trip rates derived using mobile phone data be statistically different from those derived using household
survey data? 2. If yes, what might the reason(s) be?
EXPECTED OUTCOMES LITERATURE REVIEW
REFFERENCES 1. Arabani M. and Amani B. 2007. Evaluating the Parameters Affecting Urban Trip-Generation. Iranian Journal of
Science & Technology, Vol. 31, No. B5, pp. 547-560. 2. Caceres et al. 2007. Deriving Origin–Destination Data from a Mobile Phone Network. IET Intelligent Transport
System Vol. 1, pp. 15–26 3. Neumann E. S. et al. 1983. Estimating Trip Rates from Traffic Counts. Journal of Transportation Engineering,
Vol. 109, No. 4, pp. 565-578. 4. Ortúzar, J. D. & Willumsen, L. G. 2001, Modelling Transport, Third Edition, Wiley, New York. 5. Vickerman, R. W., and Barmby T. A. 1985. Household Trip Generation Choice: Alternative Empirical
Approaches, Transportation Research B, vol. 19, no. 6, pp. 471-479. 6. Washington, S. 2000, "Iteratively Specified Tree-based Regression: Theory and Trip Generation Example",
Journal of Transportation Engineering-Asce, vol. 126, no. 6, pp. 482-491.
Traffic Assignment
Modal Split
Trip Distribution
Trip Generation
Trip Rates
Because they feed into every aspect of the transport planning process they should be properly and reliably estimated. Inaccuracies will be greatly magnified in inefficient and ineffective transport policies and system.
Area-wide, all-purpose linear regression estimates of trip generation rate for motorized journeys suitable for systems with limited resources and access to appropriate data.
• Area-wide, all-purpose, because they produce equally accurate results. (Coomer and Corradino, 1973). • The implicit assumption by conventional models of mutually independent trips may not properly reflect
behavioural reality. (Goulias et al. 1991).
Statistical Methodology for model estimation
Trip Generation Model
𝑡𝑘 = 𝛼 + �𝛽𝑖𝑋𝑖𝑘 + 𝜀 𝑛
𝑖=1
(𝑁𝑁𝑁𝑁𝑁𝑁𝑁 𝑁𝑡. 𝑁𝑎, 1983)
1. Divide study area into units (TAZ). 2. Map mobile data to TAZ. 3. Infer residual traffic counts. 4. Regress residual traffic counts on socio-economic variables. 5. Results: all-purpose TAZ trip generation rate.
• 𝑡𝑘 = Area−wide all−purpose trip rate for TAZ k (dependent variable)
• 𝑋𝑖𝑘 = Matrix of socio−economic variables (explanatory variables)
• 𝛽𝑖= Vector of coefficients
Error Tests
Model Estimation
Model Validation
Model Calibration
Model Specification
Tested Trip rates to be relied
on for their purposes anywhere in the transport
planning phase.
Step Equation R2 Parameters
1 𝒗𝒌 = 𝜶 + 𝜷𝟏𝑿𝟏 + 𝜺 d% 𝑿𝟏
2 𝒗𝒌 = 𝜶 + 𝜷𝟏𝑿𝟏 + 𝜷𝟐𝑿𝟐 + 𝜺 e% 𝑿𝟐
. ... … … …
n 𝒗𝒌 = 𝜶 + 𝜷𝟏𝑿𝟏 + 𝜷𝟐𝑿𝟐+. . +𝜷𝒏𝑿𝒏 + 𝜺 f% 𝑿𝒏
• All parameter to have the required sign and order of magnitude.
• R2 will be significant in determining validity of the results. Statistically large samples sizes are critical to proving the significance of relationships.
• The expected sample of CDR data is over 900m.

• The Mohring Effect is the background for the reimbursement guidance of Concessionary Travel from the UK Department for Transport.
• In England, the Concessionary Travel has been introduced in 2006 for elderly people and disabled residents allowing free travel in off peak time. In 2009/2010 concessionary passengers on local bus represented the 30% of local bus trips.
•The principle for reimbursement to bus operators was “NBNWO” , “No better no worse off” than without the scheme: costs incurred by carrying extra passengers may be significantly different depending on behaviour of the operator facing the extra –demand. Operators may:
• Allow for higher load factor without any additional service
• Run larger vehicles
• Run additional service to the route, leading to the Mohring Effect.
The power relationship between frequency and demand is challenged by real world considerations, such as:
• Indivisibilities, desire to maintain “round numbers” for service level
• Load factor constraints, passenger constraints
• Predatory competition
Does the Mohring effect really exist? Student: Dario Nistri
Supervisor: Jeremy Toner - Second Supervisor: Antony Whiteing
Background
What is the Mohring effect?
Demand Q= 1 Opt. Number of bus =B*
• The Mohring effect is a form of economy of scale by user side in public transport services. For scheduled and urban public transport, an increase in frequency, produces economy of scale for users in term of time savings.
•Supposing a Welfare Maximising operator, Mohring (1972) states that whether it occurs an exogenous increase of travel demand, the bus service would increase with the square-root.
Mohring Square root
Opt. Number of bus =1.40B*
• Supplying the service with additional 40% bus units, travellers double
Meaning of the rule
Task 1
Task 2
Demand and cost estimation Max Load Factor
Crowding Threshold
Overload Departures
Does elasticity is =0.5? How much is different?
Square Root Method
Mohring Effect Size of Mohring Factor
Size of Mohring Factor Policy implications
Methodology
Objectives Expected results
References
However a second order demand of commercial travellers is generated beyond concessionary extra traffic.
•Investigation of operators behaviour when the increase of the demand occurs, attempting to identify the crowding threshold above that the operators upgrade the service increasing the frequency.
•Estimation of the effect of the agreement for full or partial reimbursement of Concessionary Travel on service level .
•Estimation of the size of Mohring Factor in the context of unregulated market populated by profit-maximising operators.
•At network level, calculation of costs and Load Factor change due to the introduction of Concessionary Fare, in case of full and partial reimbursement . Application of Abrantes and Last methodology to calculate Mohring Effect.
•Application of the Square Root at route level to calculate Mohring Factor, taking in account two routes one with the demand double of the other.
Hp 2
Hp 1
Abrantes & Last Method
Concess. pax
Generated Pax
Task 1
Task 2
•Abrantes and Last study established two crowding threshold that we consider such as milestones. So it is reasonable to expect that the threshold for the data taken in account would be between 85% and 100% of load factor.
•The condition “no better no worse off” , if not fully applied, may prevent the profit maximising operator to increase the service, allowing the load factor to increase.
•The size of Mohring Factor in the context of unregulated market populated by profit-maximising operators is expected to vary that estimated for the welfare maximising scenario.
•Nelltorph et al. (2010) proposed the value of 0.6 in welfare-maximising framework. Abrantes and Last (2011), studying the commercial decisions by operators in three English Metropolitan areas, calculated the values reported in the following table.
•Abrantes, P., & Last, A. (2011). Estimating additional capacity requirements due to free bus travel.
•Toner J.P.(2013). Mohring Effect: theory and Existing Evidence. Institute for Transport Studies.
B*= optimal n. of bus /hour
C= unit cost to produce bus/h
Q= passenger / hours
V= value of time
• If an hexogen change doubles the travel demand, it can be supplied with 40% additional bus units
Demand Q= 2

Introduction
Landlocked Developing Countries (LLDCs) face peculiar
transport problems, particularly in freight transport, because
of their dependency on other countries co–operation for
access to international trade routes.
Freight costs per km in most LLDCs are more than 50
percent (value of export), higher than in United States of
America and Europe. Transport costs can be as high as 75
percent of the value of exports (Faye et al., 2004).
A number of studies have been conducted on freight
transport problems encountered along the northern corridor;
however, very few have used system dynamics thinking to
analyse and present these problems.
Problems faced
Dependence on transit neighbour: neighbours’
infrastructure; administrative practices; peace and stability.
Long distance from the sea.
High freight transportation cost.
Aims and Objectives
Identify problems faced by transporters.
Identify factors hindering efficiency of cargo clearance along
the Northern Corridor.
Carry out system analysis of factors that hinder freight
transportation along the Northern Corridor and develop
causal loop diagrams that describe feedback mechanisms
between these factors.
SYSTEM ANALYSIS OF BARRIERS TOWARDS FREIGHT TRANSPORTATION IN LANDLOCKED DEVELOPING COUNTRIES: A CASE OF ROAD FREIGHT
TRANSPORTATION IN UGAANDA
Student: OKELLO Cypriano: (Msc.) Transport Planning
Supervisor: Dr. Astrid Guehnemann; Co-supervisor : Prof. Paul Timms
University of Leeds
Methodology
Causal Loop Diagrams (CLDs)
The CLDs are important tool for representing the feedback
structure of systems (Sterman, 2001). The CLDs are
excellent for:
Capturing hypothesis about causes of dynamics
Eliciting and capturing mental models of
individuals/teams
Communicating important feedbacks believed to be
responsible for problems
Data collection
Face to face interviews using semi–structured
questionnaires
Sampling techniques
Purposive sampling (Ministries, Departments and
Agencies)
Missing voices to be included (allows for flexibility)
Data analysis
Draws out patterns from concepts and insights
Data presentation
Causal Loop Diagrams will be used to describe feedback
mechanisms between freight transport problems identified.
Scope
Main focus on road transport along the
northern corridor, from Mombasa to
Kampala
Malaba Border Post (Malaba–Uganda and
Malaba–Kenya)
50% of Travel Time: waiting at BPs & other stops
References
FAYE, M. L., MCARTHUR, J. W., SACHS, J. D. &
SNOW, T. 2004. The challenges facing landlocked
developing countries. Journal of Human
Development, 5, 31-68.
STERMAN, J. D. 2001. System Dynamics Modelling:
TOOLS FOR LEARNING IN A COMPLEX WORLD.
California management review, 43.
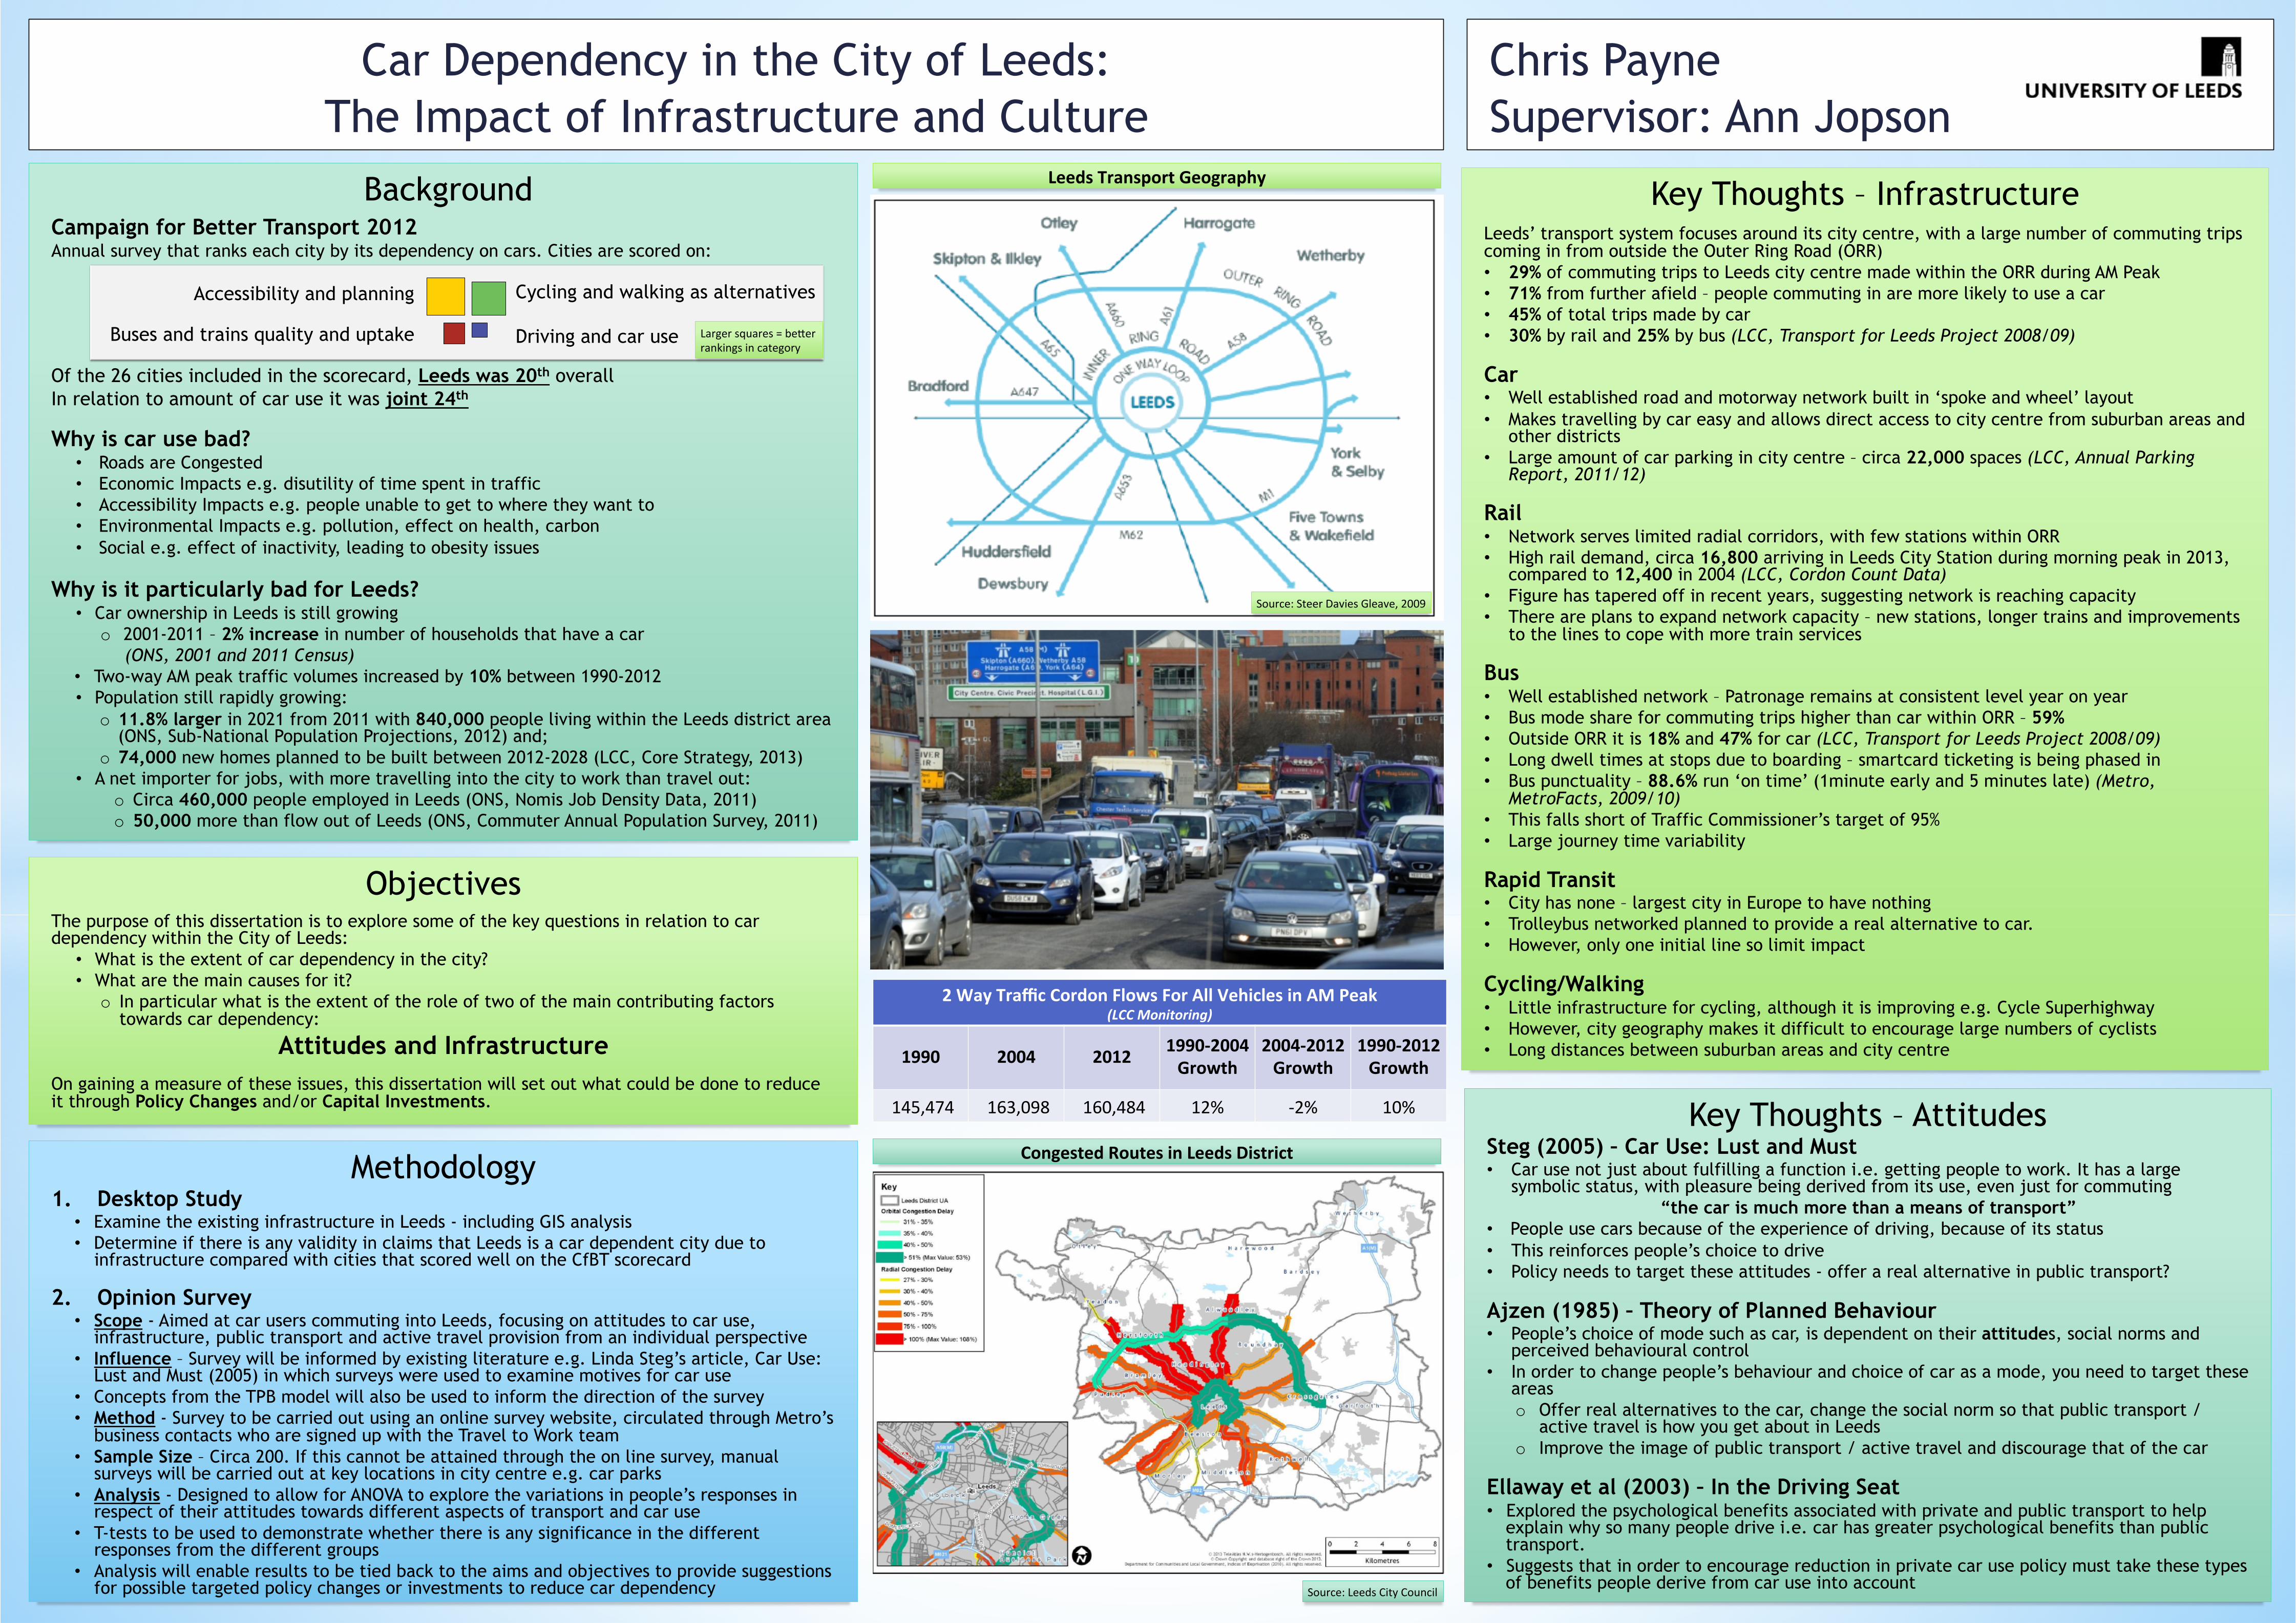
Car Dependency in the City of Leeds: The Impact of Infrastructure and Culture
Objectives
The purpose of this dissertation is to explore some of the key questions in relation to car dependency within the City of Leeds: • What is the extent of car dependency in the city? • What are the main causes for it?
o In particular what is the extent of the role of two of the main contributing factors towards car dependency:
Attitudes and Infrastructure
On gaining a measure of these issues, this dissertation will set out what could be done to reduce it through Policy Changes and/or Capital Investments.
Background
Campaign for Better Transport 2012 Annual survey that ranks each city by its dependency on cars. Cities are scored on: Of the 26 cities included in the scorecard, Leeds was 20th overall In relation to amount of car use it was joint 24th
Why is car use bad? • Roads are Congested • Economic Impacts e.g. disutility of time spent in traffic • Accessibility Impacts e.g. people unable to get to where they want to • Environmental Impacts e.g. pollution, effect on health, carbon • Social e.g. effect of inactivity, leading to obesity issues
Why is it particularly bad for Leeds? • Car ownership in Leeds is still growing
o 2001-2011 – 2% increase in number of households that have a car (ONS, 2001 and 2011 Census)
• Two-way AM peak traffic volumes increased by 10% between 1990-2012 • Population still rapidly growing:
o 11.8% larger in 2021 from 2011 with 840,000 people living within the Leeds district area (ONS, Sub-National Population Projections, 2012) and;
o 74,000 new homes planned to be built between 2012-2028 (LCC, Core Strategy, 2013)
• A net importer for jobs, with more travelling into the city to work than travel out: o Circa 460,000 people employed in Leeds (ONS, Nomis Job Density Data, 2011)
o 50,000 more than flow out of Leeds (ONS, Commuter Annual Population Survey, 2011)
Methodology 1. Desktop Study • Examine the existing infrastructure in Leeds - including GIS analysis • Determine if there is any validity in claims that Leeds is a car dependent city due to
infrastructure compared with cities that scored well on the CfBT scorecard
2. Opinion Survey • Scope - Aimed at car users commuting into Leeds, focusing on attitudes to car use,
infrastructure, public transport and active travel provision from an individual perspective • Influence – Survey will be informed by existing literature e.g. Linda Steg’s article, Car Use:
Lust and Must (2005) in which surveys were used to examine motives for car use • Concepts from the TPB model will also be used to inform the direction of the survey • Method - Survey to be carried out using an online survey website, circulated through Metro’s
business contacts who are signed up with the Travel to Work team • Sample Size – Circa 200. If this cannot be attained through the on line survey, manual
surveys will be carried out at key locations in city centre e.g. car parks • Analysis - Designed to allow for ANOVA to explore the variations in people’s responses in
respect of their attitudes towards different aspects of transport and car use • T-tests to be used to demonstrate whether there is any significance in the different
responses from the different groups • Analysis will enable results to be tied back to the aims and objectives to provide suggestions
for possible targeted policy changes or investments to reduce car dependency
Key Thoughts – Attitudes Steg (2005) – Car Use: Lust and Must • Car use not just about fulfilling a function i.e. getting people to work. It has a large
symbolic status, with pleasure being derived from its use, even just for commuting “the car is much more than a means of transport”
• People use cars because of the experience of driving, because of its status • This reinforces people’s choice to drive • Policy needs to target these attitudes - offer a real alternative in public transport?
Ajzen (1985) – Theory of Planned Behaviour • People’s choice of mode such as car, is dependent on their attitudes, social norms and
perceived behavioural control • In order to change people’s behaviour and choice of car as a mode, you need to target these
areas o Offer real alternatives to the car, change the social norm so that public transport /
active travel is how you get about in Leeds o Improve the image of public transport / active travel and discourage that of the car
Ellaway et al (2003) – In the Driving Seat • Explored the psychological benefits associated with private and public transport to help
explain why so many people drive i.e. car has greater psychological benefits than public transport.
• Suggests that in order to encourage reduction in private car use policy must take these types of benefits people derive from car use into account
Key Thoughts – Infrastructure
Leeds’ transport system focuses around its city centre, with a large number of commuting trips coming in from outside the Outer Ring Road (ORR) • 29% of commuting trips to Leeds city centre made within the ORR during AM Peak • 71% from further afield – people commuting in are more likely to use a car • 45% of total trips made by car • 30% by rail and 25% by bus (LCC, Transport for Leeds Project 2008/09)
Car • Well established road and motorway network built in ‘spoke and wheel’ layout • Makes travelling by car easy and allows direct access to city centre from suburban areas and
other districts • Large amount of car parking in city centre – circa 22,000 spaces (LCC, Annual Parking
Report, 2011/12)
Rail • Network serves limited radial corridors, with few stations within ORR • High rail demand, circa 16,800 arriving in Leeds City Station during morning peak in 2013,
compared to 12,400 in 2004 (LCC, Cordon Count Data) • Figure has tapered off in recent years, suggesting network is reaching capacity • There are plans to expand network capacity – new stations, longer trains and improvements
to the lines to cope with more train services
Bus • Well established network – Patronage remains at consistent level year on year • Bus mode share for commuting trips higher than car within ORR – 59% • Outside ORR it is 18% and 47% for car (LCC, Transport for Leeds Project 2008/09) • Long dwell times at stops due to boarding – smartcard ticketing is being phased in • Bus punctuality – 88.6% run ‘on time’ (1minute early and 5 minutes late) (Metro,
MetroFacts, 2009/10) • This falls short of Traffic Commissioner’s target of 95% • Large journey time variability
Rapid Transit • City has none – largest city in Europe to have nothing • Trolleybus networked planned to provide a real alternative to car. • However, only one initial line so limit impact
Cycling/Walking • Little infrastructure for cycling, although it is improving e.g. Cycle Superhighway • However, city geography makes it difficult to encourage large numbers of cyclists • Long distances between suburban areas and city centre
2 Way Traffic Cordon Flows For All Vehicles in AM Peak (LCC Monitoring)
1990 2004 2012 1990-‐2004 Growth
2004-‐2012 Growth
1990-‐2012 Growth
145,474 163,098 160,484 12% -‐2% 10%
Chris Payne Supervisor: Ann Jopson
Accessibility and planning
Buses and trains quality and uptake
Cycling and walking as alternatives
Driving and car use Larger squares = be9er rankings in category
Source: Steer Davies Gleave, 2009
Source: Leeds City Council
Leeds Transport Geography
Congested Routes in Leeds District

• Complex road network with 245,000 miles worth of road (DfT, 2012) • 35 million vehicles on British roads in 2013 and that is a 1.5% increase
from 2012 (DfT, 2014) • Roads don’t last forever, wear and tear, accidents means that there is a
need for increased investment to being maintained • The maintenance of local authority managed roads is being reduced:
- 2009/10 £3.3 million - 2010/11 £3.1 million - 2011/12 £3.0 million (DfT, 2013)
• By 2020/21 £6 billion will have being invested to help repair and sustain
local roads (Great Britain & HM Treasury, 2013) • Must use resources more efficiently, how is this decided? How should it
be decided • Providing a service for the public, so ask the public what they think
• The customer satisfaction surveys involve 46 local authorities • Cross comparison of two models, will be the same except with
the addition of customer satisfaction in one of them • What determines the cost?
Cost= f(Type of treatment, time constraints, Customer Satisfaction,
availability of resources, traffic management, utilities)
• Estimate the significance, size and signs of the variables based on the economic background
• Problems, which could be encountered: missing variables, errors in variables larger data set needed, the independence of the authorities
• To solve these problems appropriate tests will be taken
Disadvantages
• Only when habits are changed can there be a true value
• Instruments for measuring customer satisfaction not readily available
• Difficult to apply costs to a 5 point scale (Abou-Zeid 2008)
• Personality and taste will affect the results making it biased
• Not consistent when surveys are repeated because there will be a different range of income, age, gender, employment
𝐻0 : Customer satisfaction plays a valid role 𝐻𝐴 : Customer satisfaction plays no significance
Abou-Zeid, M. Moshe B, and Michel B. 2008. Happiness and travel behavior modification. Proc. of the European Transport Conference. Department for Transport. (2012). Road lengths in Great Britain: 2011. Department for Transport. (2013). Road Conditions in England: 2012 Department for Transport. (2014). Vehicle Licensing Statistics: 2013. Great Britain & HM Treasury. (2013). Investing in Britain’s future. Vol 8669. Stationary Office. Highways Agency. (2014). Listening to our customers. Olsson, L. Friman, M. Pareigis, J. Evardsson, B. (2012). Measuring service experience: Applying the satisfaction with travel scale in public transport. Journal of Retailing and Customers Satisfaftion. 19, pp. 413-418.
Charlotte Stead- 200386644 MA Transport Economics Phill Wheat
• 𝐻0 : Customer satisfaction plays a valid role - Fail to reject the null hypothesis, - Customer satisfaction should be used - How can it be improved? • 𝐻𝐴 : Customer satisfaction plays no significance - Can reject the null hypothesis - What are the alternatives
• The problems encountered in the model • How this model can be improved
Advantages
• Used to assess the non monetary costs such as time, smoothness of the journey, cleanliness (Olsson 2012)
• Surveys are used to assess how well services are meeting expectations
• This is needed to influence investment decisions
“Understanding the needs of our customers is an integral part of the Agency’s operations. To help us achieve our vision we need help.”
(Highways Agency, 2014)
All roads needs maintenance
Highway Maintenance Strategy
SOURCE: Public Transport Authority of Western Australia
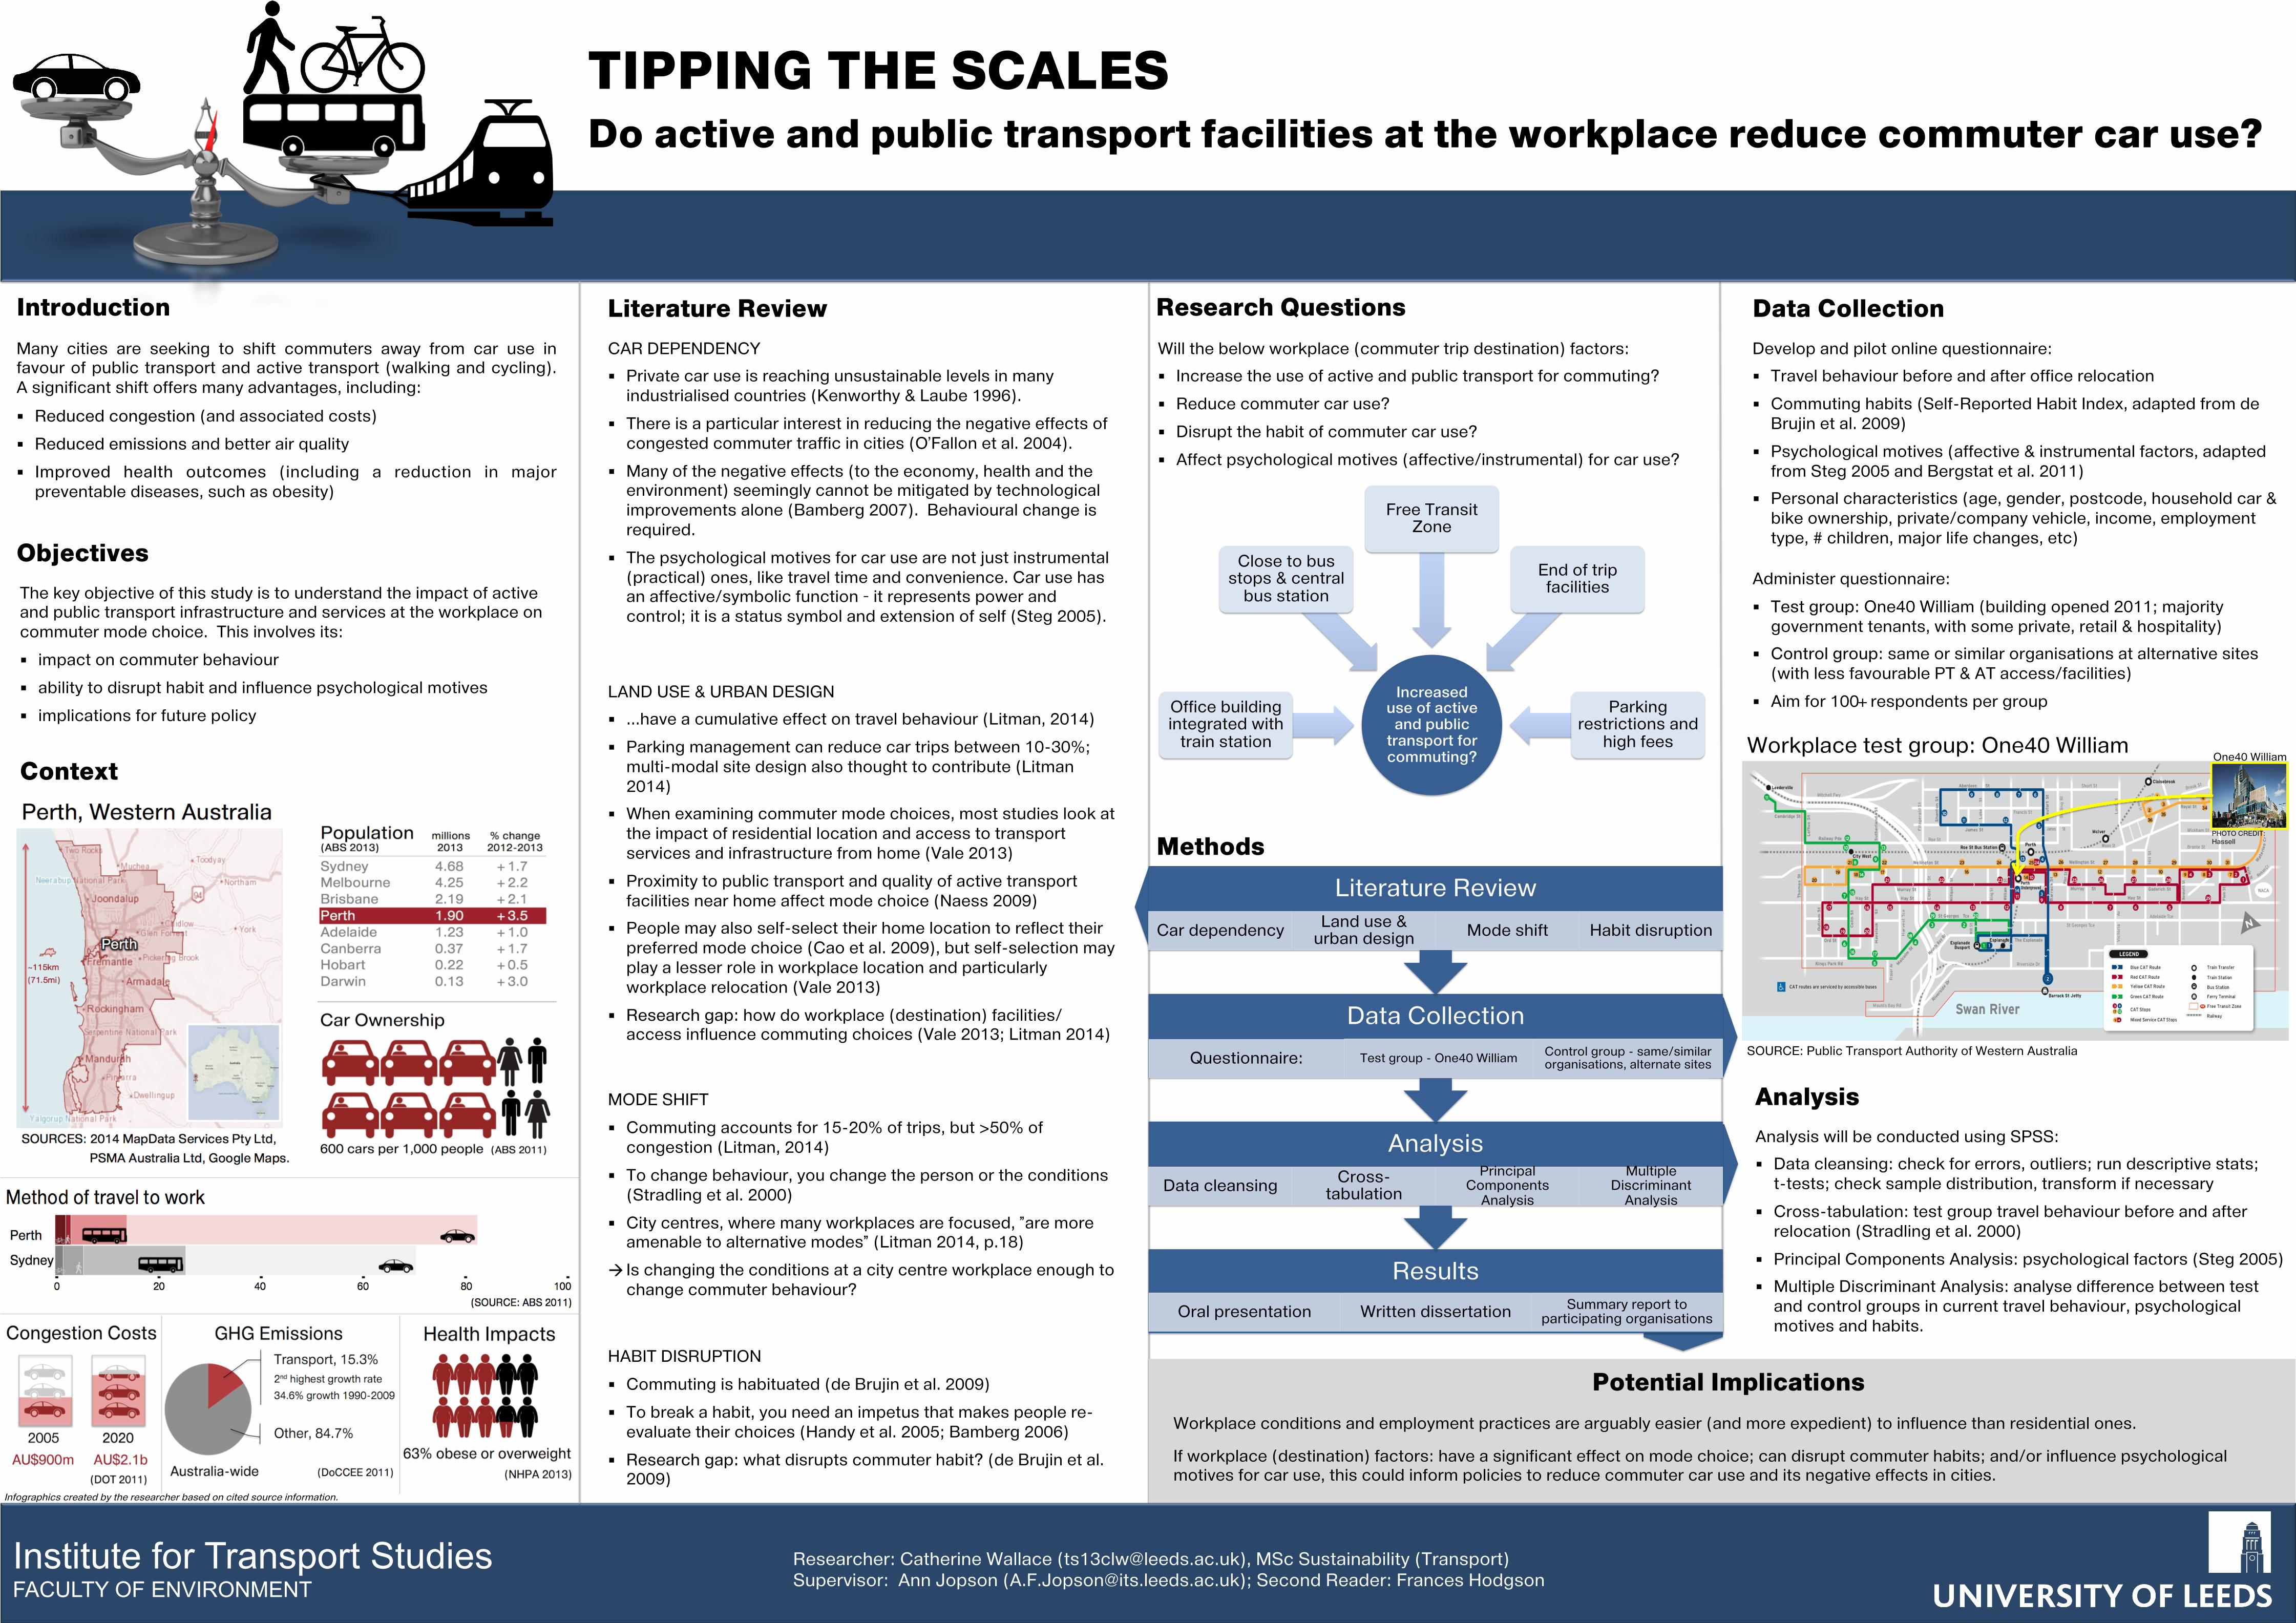
Workplace test group: One40 William
PHOTO CREDIT: Hassell
One40 William
Sub-headings (36 pt) Main body (24 pt) Captions (18 pt)
Author (50 pt) Title (80 pt)
Results Oral presentation Written dissertation Summary report to
participating organisations
Analysis Data cleansing Cross-
tabulation Principal
Components Analysis
Multiple Discriminant Analysis
Data Collection Questionnaire: Test group - One40 William Control group - same/similar
organisations, alternate sites
Literature Review Car dependency Land use &
urban design Mode shift Habit disruption
TIPPING THE SCALES
Do active and public transport facilities at the workplace reduce commuter car use?
Researcher: Catherine Wallace ([email protected]), MSc Sustainability (Transport) Supervisor: Ann Jopson ([email protected]); Second Reader: Frances Hodgson
Institute for Transport Studies FACULTY OF ENVIRONMENT
Increased use of active and public transport for commuting?
Office building integrated with train station
Close to bus stops & central bus station
Free Transit Zone
End of trip facilities
Parking restrictions and
high fees
Context
Objectives
Methods
Analysis
Research Questions Introduction CAR DEPENDENCY § Private car use is reaching unsustainable levels in many industrialised countries (Kenworthy & Laube 1996).
§ There is a particular interest in reducing the negative effects of congested commuter traffic in cities (O’Fallon et al. 2004).
§ Many of the negative effects (to the economy, health and the environment) seemingly cannot be mitigated by technological improvements alone (Bamberg 2007). Behavioural change is required.
§ The psychological motives for car use are not just instrumental (practical) ones, like travel time and convenience. Car use has an affective/symbolic function – it represents power and control; it is a status symbol and extension of self (Steg 2005).
LAND USE & URBAN DESIGN § ...have a cumulative effect on travel behaviour (Litman, 2014) § Parking management can reduce car trips between 10-30%; multi-modal site design also thought to contribute (Litman 2014)
§ When examining commuter mode choices, most studies look at the impact of residential location and access to transport services and infrastructure from home (Vale 2013)
§ Proximity to public transport and quality of active transport facilities near home affect mode choice (Naess 2009)
§ People may also self-select their home location to reflect their preferred mode choice (Cao et al. 2009), but self-selection may play a lesser role in workplace location and particularly workplace relocation (Vale 2013)
§ Research gap: how do workplace (destination) facilities/access influence commuting choices (Vale 2013; Litman 2014)
MODE SHIFT § Commuting accounts for 15-20% of trips, but >50% of congestion (Litman, 2014)
§ To change behaviour, you change the person or the conditions (Stradling et al. 2000)
§ City centres, where many workplaces are focused, ”are more amenable to alternative modes” (Litman 2014, p.18)
à Is changing the conditions at a city centre workplace enough to change commuter behaviour?
HABIT DISRUPTION § Commuting is habituated (de Brujin et al. 2009) § To break a habit, you need an impetus that makes people re-evaluate their choices (Handy et al. 2005; Bamberg 2006)
§ Research gap: what disrupts commuter habit? (de Brujin et al. 2009)
Develop and pilot online questionnaire: § Travel behaviour before and after office relocation § Commuting habits (Self-Reported Habit Index, adapted from de Brujin et al. 2009)
§ Psychological motives (affective & instrumental factors, adapted from Steg 2005 and Bergstat et al. 2011)
§ Personal characteristics (age, gender, postcode, household car & bike ownership, private/company vehicle, income, employment type, # children, major life changes, etc)
Administer questionnaire: § Test group: One40 William (building opened 2011; majority government tenants, with some private, retail & hospitality)
§ Control group: same or similar organisations at alternative sites (with less favourable PT & AT access/facilities)
§ Aim for 100+ respondents per group
Analysis will be conducted using SPSS: § Data cleansing: check for errors, outliers; run descriptive stats; t-tests; check sample distribution, transform if necessary
§ Cross-tabulation: test group travel behaviour before and after relocation (Stradling et al. 2000)
§ Principal Components Analysis: psychological factors (Steg 2005) § Multiple Discriminant Analysis: analyse difference between test and control groups in current travel behaviour, psychological motives and habits.
The key objective of this study is to understand the impact of active and public transport infrastructure and services at the workplace on commuter mode choice. This involves its: § impact on commuter behaviour § ability to disrupt habit and influence psychological motives § implications for future policy
Many cities are seeking to shift commuters away from car use in favour of public transport and active transport (walking and cycling). A significant shift offers many advantages, including:
§ Reduced congestion (and associated costs) § Reduced emissions and better air quality § Improved health outcomes (including a reduction in major preventable diseases, such as obesity)
The Australian city of Perth will be used as a case study.
Congestion costs: Expected to reach AU$2.1b by 2020, up from AU$900m in 2005 Transport emissions: 15.3% of total emissions, Australia-wide (2nd highest growth rate; 34.6% growth 1990-2009) Health impacts: 63% Perth metropolitan area, obese or overweight
Potential Implications Workplace conditions and employment practices are arguably easier (and more expedient) to influence than residential ones. If workplace (destination) factors: have a significant effect on mode choice; can disrupt commuter habits; and/or influence psychological motives for car use, this could inform policies to reduce commuter car use and its negative effects in cities.
Literature Review Data Collection Will the below workplace (commuter trip destination) factors: § Increase the use of active and public transport for commuting? § Reduce commuter car use? § Disrupt the habit of commuter car use? § Affect psychological motives (affective/instrumental) for car use?
Fast facts: § 4th largest Australian city § Pop. 1.83M (⎡22% 1990-2009) § 20% of all jobs in city centre § High car ownership (600 cars per 1,000 people)
§ Lagging larger Australian cities in AT & PT commuting
SOURCES: 2014 MapData Services Pty Ltd, PSMA Australia Ltd, Google Maps.
Perth, Western Australia
~115km (71.5mi)
Infographics created by the researcher based on cited source information.
ROAD TRANSPORT EMISSIONS AND ITS EFFECT ON PUBLIC HEALTH IN GHANA
A CASE STUDY OF THE ACCRA PILOT BRT ROUTE
Daniel Essel: Msc Transport Planning & Environment Supervisor: Dr. James Tate Co-supervisor: Jeffrey Turner
Background
A major problem facing the world today is road
transport emissions which have been increasing at
a much faster rate than anticipated. There is little
evidence to support the fact that the current
growth in vehicle ownership especially in
developing countries will decline.
Vehicle population in Ghana increased from
511,755 in 2000 to 1,591,143 in 2013 and
projected to grow by 10% per annum.
A roadside study reports high levels of PM10
exceeding the EPA- Ghana 24 hour mean of
70µgm-3 even though WHO limit value for PM10
is 50µgm-3.
79% of the samples collected at 3 roadside sites
along the BRT route exceeded the EPA-Ghana
24-hour PM10 air quality guideline of 70 µgm3.
Exposure to emissions at roadsides are 7 times
higher within 15 metres but decay as distance
increases.
Epidemiological studies have confirmed short
and long-term effect of vehicular emissions on
respiratory related illnesses.
Objectives
Model current levels of vehicular emissions along
the BRT route
Assess air quality concentrations along the BRT
route
Assess its health implication on residents, traders
and commuters along the BRT route
Expected Outcomes
Residents living within 150m from the BRT
route would have higher exposure to traffic
pollutants than those living further away
The health implications will vary as traffic
levels changes
Commuter and traders spending longer
hours along the BRT route will have
higher exposure to traffic emissions
References
Driver and Vehicle License Authority, 2013: Unpublished Report of Vehicles
Registered in Ghana
Ebenezer Fiahagbe, 2012. Air Quality Monitoring in Accra, Ghana
Kim, J.J. et al. 2004. Traffic-related air pollution near busy roads: the East Bay
Children's Respiratory Health Study. American journal of respiratory and critical
care medicine.
Wright, L. and Fulton, L. 2005. Climate change mitigation and transport in
developing nations. Transport Reviews
Proposed Methodology
Pilot BRT Route 24-Hour PM10 Concentration along the route
Date: 2nd May, 2014
Extract of a section of the BRT route
Proposed Methodology
Source: Adapted from Google Maps Source: EPA Ghana- Air Quality Monitoring Programme
Student : David Nunoo
Programme : MSc. Transport Planning and Engineering
Supervisor : Dr. Samantha Jamson
Leeds – Bradford Canal Towpath Improvements:
Will it encourage social and commuter cycling along the canal? Institute of Transport Studies
Date : May 2014
Author 1 | Author 2 | Author 3 (edit this list on View > Slide Master)
Research questions:
1. Is perceived risk a serious obstacle to cycling and walking along
the canal?
2. Is cycling and walking considerably affected by perceived risk
along the canal?
3. Who the predominant users of the towpath are and their trip
purpose(s)?
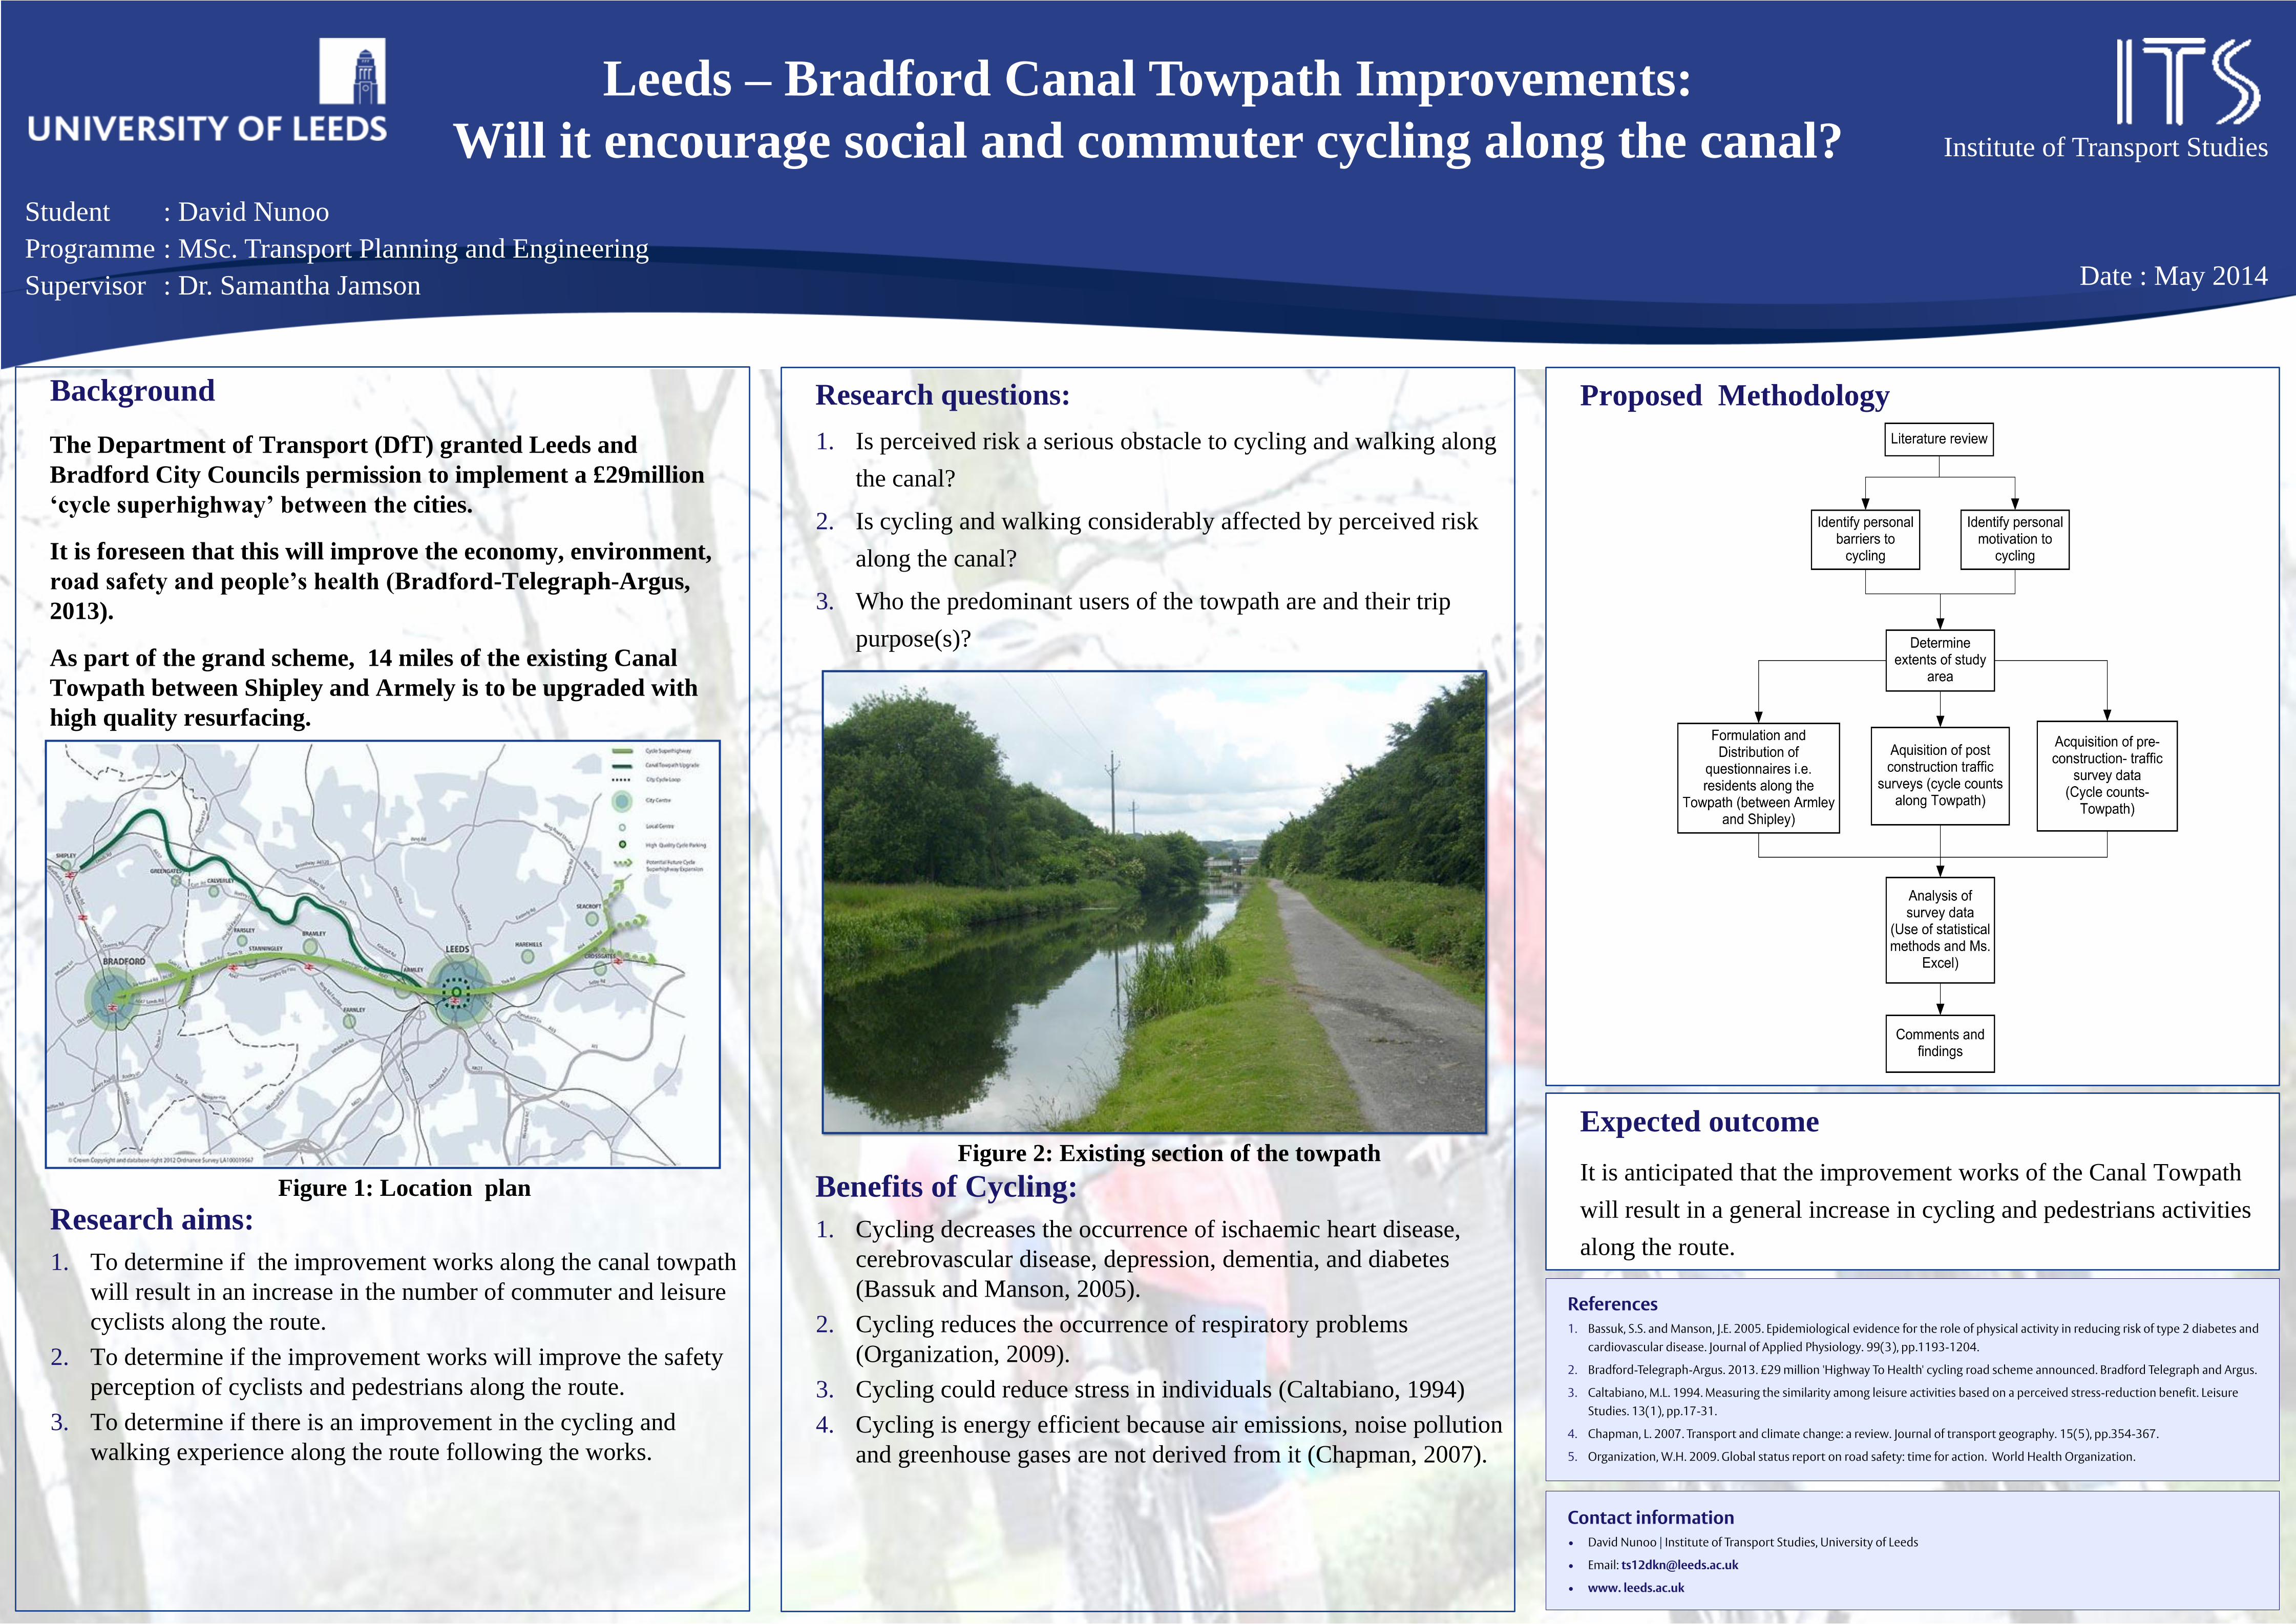
Background
The Department of Transport (DfT) granted Leeds and
Bradford City Councils permission to implement a £29million
‘cycle superhighway’ between the cities.
It is foreseen that this will improve the economy, environment,
road safety and people’s health (Bradford-Telegraph-Argus,
2013).
As part of the grand scheme, 14 miles of the existing Canal
Towpath between Shipley and Armely is to be upgraded with
high quality resurfacing.
Methodology
Only the unit name and authors should be
edited in the slide master.
Our templates use the concept of a ‘Slide
Master’ in PowerPoint to ensure that the
crucial elements in the page cannot be
changed, moved or distorted unintentionally.
Content contained in the slide master
includes:
• the University device
• the unit name (must be your official unit name)
• the colour of the banner at the top of the page
• the list of authors
• a ‘master text frame’ that defines the sizes and styles for each level of bullet in the document
You must be on the top master slide in order
to edit the unit name and authors (this is the
slide on the top of the left-hand column in
Slide Master view).
Figure 1: Location plan
References 1. Bassuk, S.S. and Manson, J.E. 2005. Epidemiological evidence for the role of physical activity in reducing risk of type 2 diabetes and
cardiovascular disease. Journal of Applied Physiology. 99(3), pp.1193-1204.
2. Bradford-Telegraph-Argus. 2013. £29 million 'Highway To Health' cycling road scheme announced. Bradford Telegraph and Argus.
3. Caltabiano, M.L. 1994. Measuring the similarity among leisure activities based on a perceived stress-reduction benefit. Leisure
Studies. 13(1), pp.17-31.
4. Chapman, L. 2007. Transport and climate change: a review. Journal of transport geography. 15(5), pp.354-367.
5. Organization, W.H. 2009. Global status report on road safety: time for action. World Health Organization.
Contact information • David Nunoo | Institute of Transport Studies, University of Leeds
• Email: [email protected]
• www. leeds.ac.uk
Proposed Methodology
Research aims:
1. To determine if the improvement works along the canal towpath
will result in an increase in the number of commuter and leisure
cyclists along the route.
2. To determine if the improvement works will improve the safety
perception of cyclists and pedestrians along the route.
3. To determine if there is an improvement in the cycling and
walking experience along the route following the works.
Figure 2: Existing section of the towpath
Expected outcome
It is anticipated that the improvement works of the Canal Towpath
will result in a general increase in cycling and pedestrians activities
along the route.
Benefits of Cycling:
1. Cycling decreases the occurrence of ischaemic heart disease,
cerebrovascular disease, depression, dementia, and diabetes
(Bassuk and Manson, 2005).
2. Cycling reduces the occurrence of respiratory problems
(Organization, 2009).
3. Cycling could reduce stress in individuals (Caltabiano, 1994)
4. Cycling is energy efficient because air emissions, noise pollution
and greenhouse gases are not derived from it (Chapman, 2007).
Author 1 | Author 2 | Author 3 (edit this list on View > Slide Master)

BACKGROUND
The private finance functions in developing and expanding Manchester Airport Supervisor: Nigel Smith
Dayuan Xu MSc (Eng) Transport Planning and Engineering Institute for Transport Studies University of Leeds Email: [email protected]
Analyse the functions of private finance in those successfully extended airports.
Analyse the risk of private investment and measures to reduce the risk.
Identify the most effective mechanisms for utilising private finance in future Manchester Airport development.
How to create a win-win model in PPP.
Manchester Airport ranks only second to Heathrow airport in
the UK.
There are now three passenger terminals and two runways.
The forecasts for Manchester suggest that the Airport could
be handling some 38 million passengers by 2015 and the
number could rise to around 50 million by 2030.
Planning to provide an additional terminal to expand
capacity and exploit economic benefits.
FURTHER WORK
OBJECTIVES
METHODOLOGY
Preliminary activities
Design issues
Limitations
Obtain database of Manchester Airport. Risk analysis of different PFI forms on
both ground and air sides. How to reduce risks in the PPP. What could Manchester Airport learn
from the completely extended airports. The pros and cons of private
investment on airport. Evaluate the private finance in airport
development.
Prepare
Generate dissertation
Data collection Analyse
Manchester Airport
Documents Archival records
Interviews
Protest -characterised asbeing non violent they involvea collection of people whocome together to protest acultural, social, political oreconomic issue (Oliver, et al.2012).
Riot - Riots are one exampleof anti-governmentdemonstrations which is aspontaneous outburst ofviolence from a large group ofpeople (Barkan. 2012)
Flashmob - Strangers meet ata predetermined publiclocation, perform an unusualbehaviour, and then disperse(Duran. 2006)
Mediated Crowd - A newsocial phenomenon relatingto collective action whichemerges as a result of thevirtual arena of ‘’Web 2.0’’and new mobile technologies
Web 2.0– Characterised asbeing a interactive socialmedia and user generatedcontent allowing users toexchange content
The mobile criminal: Protests, Riots & FlashmobsEmma O’Malley
Supervisor: Frances Hodgson
Aim
Understand how the communication aspect of social media can influence theorganisation of Protests, Riots and Flashmobs, specifically those which occur ontransport networks or are in response to changes on the network.
Objectives
• How is transport used as the stage and\or reason or action?• Do changes in communication technologies, particularly social media
significantly influence social organisation to initiate new forms of protests (e.g.,flashmobs, critical mass) on the transport system?
• Following acts on transport networks how do transport systems respond andrecover?
Background
The world is made up of networks whether environmental, social or economic; this projectlooks at the links between communication networks and transport networks, specifically at howcommunication networks as part of new social media is used to support action which disruptsor is a result of changes to transportation system.
Transport Networks• Transportation systems are often the focus of this action as it is intertwined with practically
every aspect of human life meaning that:• Large numbers are people are affected by changes or disruption to the system whether on a
local or global scale• Transportation networks are easily accessible• Action on the system will be very visible(Blickstein and Hanson. 2001).
Communication NetworksThe creation of the mediated crowd is an example of how public communication practices havechanged in the twenty-first century (Baker. 2012). Social Media allows everyone with access tohave a voice and removes physical and spatial barriers allowing communication with a vastamount of people who may share the same mindset (Baker. 2012; Moler. 2013). This allows fora new form of social organisation where people can create or connect with social movementsoutside existing channels far quicker and easier than ever before (Bartlett. 2013).
PreparednessIt is important to understand how this new form of communication influences the organisationthese forms of protest, especially those which occur spontaneously and have large negativeimpacts, as it can assist in preparedness and recovery from such events.
As we move deeper into the ‘internet age’ it is important to understand mobility not just in theform of movement but also related to the ‘new mobilties perspective’ includes the movementof information through the use of the internet and media outlets (Sheller and Urry. 2006).
New Mobilties Perspective
Method
Complete an in depth study on literature surrounding three main areas:• Mobility and communication• Networks (Transport, Communication) and how these networks influence
each other• Existing policy to enhance ‘preparedness’ in the face of new forms of
protestConduct questionnaires with people who have been involved with protestsand interviews with participants who took a leadership role in organisingprotests such as Critical Mass or the London Die- In.
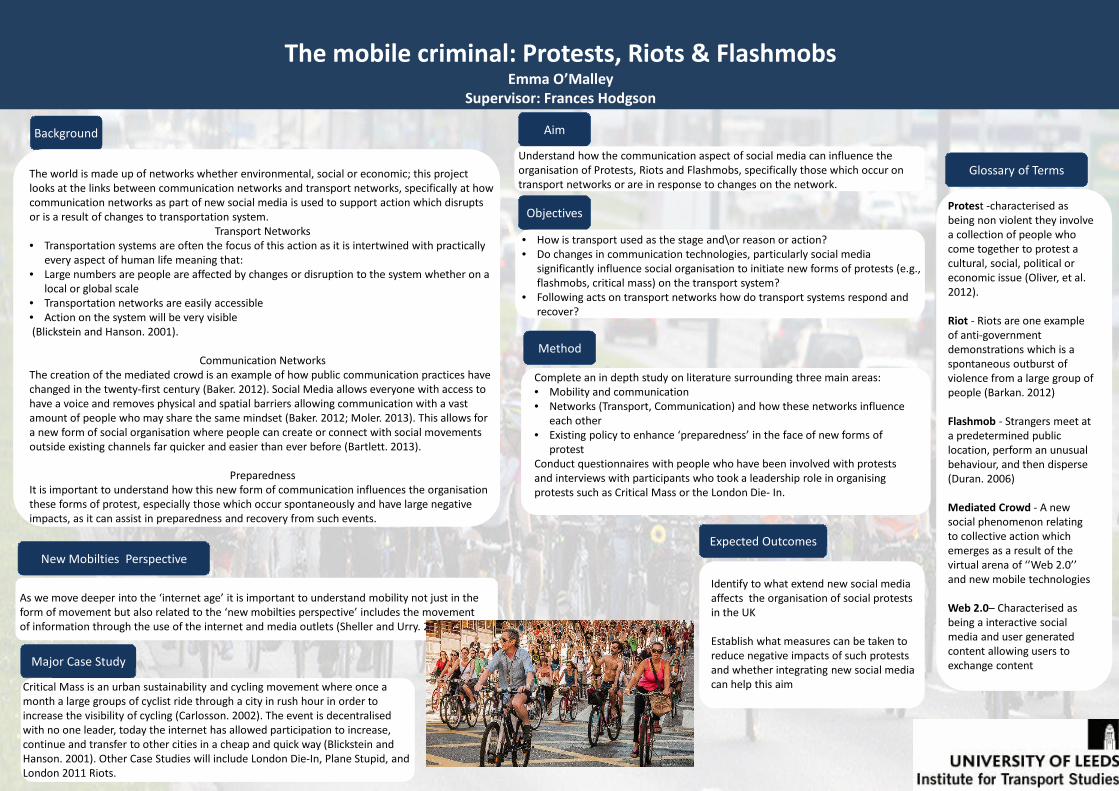
Major Case Study
Critical Mass is an urban sustainability and cycling movement where once amonth a large groups of cyclist ride through a city in rush hour in order toincrease the visibility of cycling (Carlosson. 2002). The event is decentralisedwith no one leader, today the internet has allowed participation to increase,continue and transfer to other cities in a cheap and quick way (Blickstein andHanson. 2001). Other Case Studies will include London Die-In, Plane Stupid, andLondon 2011 Riots.
Glossary of Terms
Expected Outcomes
Identify to what extend new social mediaaffects the organisation of social protestsin the UK
Establish what measures can be taken toreduce negative impacts of such protestsand whether integrating new social mediacan help this aim

TRANSPORT IN DEVELOPING COUNTRIES
(The benefit of implementing NMT Master Plan in Tema, Ghana)
Emmanuel N. Tetteh: MSc Transport Planning and Engineering Supervisor: Jeff Turner
1. BACKGROUND
Transport planning policies in many developing
countries have followed the western systems by using
of models such as Highway Development Management
(HDM-4) which focuses on or mainly dominated by
motorists transport. Hence the gap between motorist
and NMT especially in Africa.
Non motorists transport is the ideal mode of transport
travel within cities. This due to the fact that they require
less space, less energy as well as zero noise and air
pollution . NMT enhance safety and also has direct link
with health
It is widely established, from current studies that a
sustainable transport in terms of impact on areas such
as social economy, environment is the choice mode of
walking and cycling, the two major means of urban
NMT. In developing countries NMT is recommended as
most sustainable transport mode.
2. AIM
The aim of this dissertation would be to look at some of
the benefits that the City of Tema would gain from
implementing the master Plan.
3. OBJECTIVES
The main objective will focus on the following:
Identification of general NMT benefits
Congestion benefits
Challenges in terms of infrastructure
A critical review of why NMT in Accra did
not work
4. METHODOLOGY
Secondary data available in final submitted
report of ministry of road transport and
Highways of Ghana 2013 master plan for Tema
would be the main source of data to be used for
this research.
The existing data will be used to access the
relative benefits of promoting NMTs such as
health.
5. PROPOSED SCOPE
This research will be limited to the analysis of
congestion and economic benefits after the
implementation of NMT Master Plan in the City
of Tema in Ghana.
The research will also look at some challenges
that will need to be addressed during the
implementation in terms of infrastructure for
Non Motorists Transport (NMT).
Cyclist in Tema
Congested road in Tema
Google Map of Accra and Tema
Geographical Location of Study Area
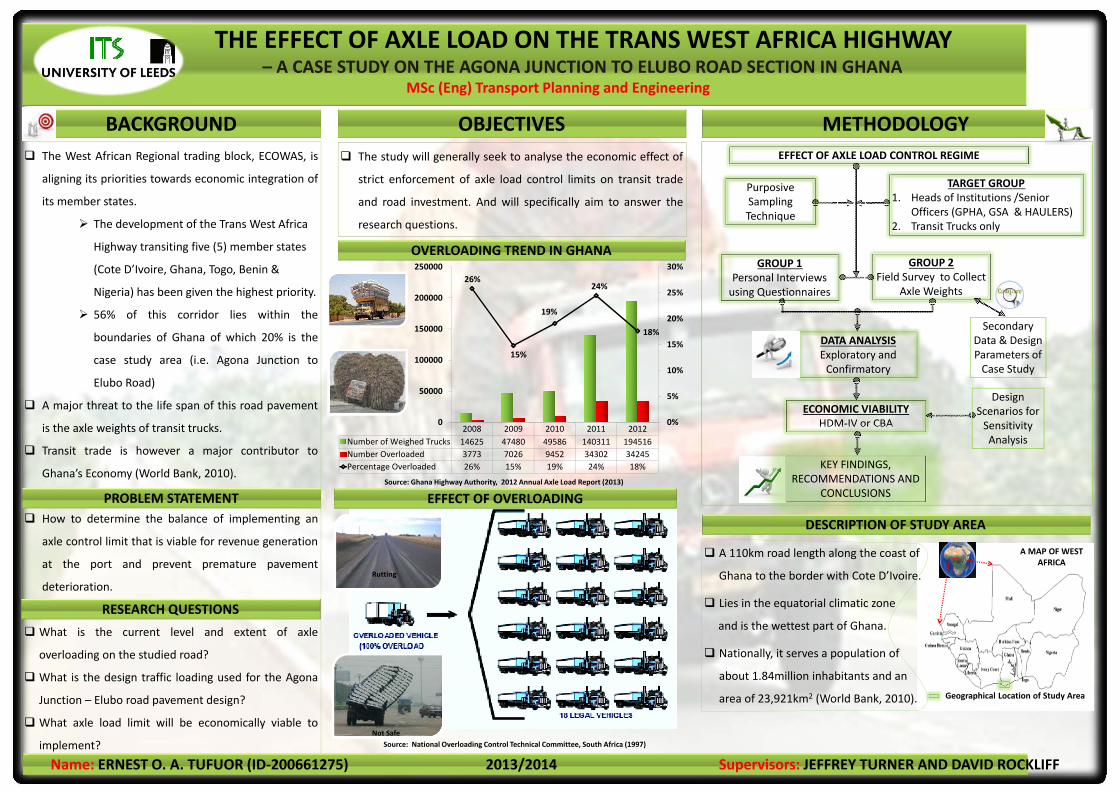
THE EFFECT OF AXLE LOAD ON THE TRANS WEST AFRICA HIGHWAY – A CASE STUDY ON THE AGONA JUNCTION TO ELUBO ROAD SECTION IN GHANA
MSc (Eng) Transport Planning and Engineering
OBJECTIVES The study will generally seek to analyse the economic effect of
strict enforcement of axle load control limits on transit trade
and road investment. And will specifically aim to answer the
research questions.
METHODOLOGYEFFECT OF AXLE LOAD CONTROL REGIME
Purposive Sampling Technique
TARGET GROUP1. Heads of Institutions /Senior
Officers (GPHA, GSA & HAULERS)2. Transit Trucks only
GROUP 1Personal Interviews using Questionnaires
GROUP 2Field Survey to Collect
Axle Weights
Secondary Data & Design Parameters of Case Study
Design Scenarios for Sensitivity Analysis
DATA ANALYSISExploratory and Confirmatory
ECONOMIC VIABILITYHDM‐IV or CBA
KEY FINDINGS, RECOMMENDATIONS AND
CONCLUSIONS
Source: National Overloading Control Technical Committee, South Africa (1997)
EFFECT OF OVERLOADING
OVERLOADING TREND IN GHANA
BACKGROUND The West African Regional trading block, ECOWAS, is
aligning its priorities towards economic integration of
its member states.
The development of the Trans West Africa
Highway transiting five (5) member states
(Cote D’Ivoire, Ghana, Togo, Benin &
Nigeria) has been given the highest priority.
56% of this corridor lies within the
boundaries of Ghana of which 20% is the
case study area (i.e. Agona Junction to
Elubo Road)
A major threat to the life span of this road pavement
is the axle weights of transit trucks.
Transit trade is however a major contributor to
Ghana’s Economy (World Bank, 2010).
How to determine the balance of implementing an
axle control limit that is viable for revenue generation
at the port and prevent premature pavement
deterioration.
What is the current level and extent of axle
overloading on the studied road?
What is the design traffic loading used for the Agona
Junction – Elubo road pavement design?
What axle load limit will be economically viable to
implement?
DESCRIPTION OF STUDY AREA
RESEARCH QUESTIONS
PROBLEM STATEMENT
A 110km road length along the coast of
Ghana to the border with Cote D’Ivoire.
Lies in the equatorial climatic zone
and is the wettest part of Ghana.
Nationally, it serves a population of
about 1.84million inhabitants and an
area of 23,921km2 (World Bank, 2010).
Name: ERNEST O. A. TUFUOR (ID‐200661275) 2013/2014 Supervisors: JEFFREY TURNER AND DAVID ROCKLIFF
Rutting
Not Safe
Source: Ghana Highway Authority, 2012 Annual Axle Load Report (2013)
2008 2009 2010 2011 2012Number of Weighed Trucks 14625 47480 49586 140311 194516Number Overloaded 3773 7026 9452 34302 34245Percentage Overloaded 26% 15% 19% 24% 18%
26%
15%
19%
24%
18%
0%
5%
10%
15%
20%
25%
30%
0
50000
100000
150000
200000
250000
A MAP OF WEST AFRICA

Mode Choice Analysis for
Shopping Trips in Great Britain Gandrie R. Apriandito (200737853)
Supervised by Jeremy Shires and Daniel Johnson
• To examine the relationship between
expenditure and transport accessibility
• To identify what factors influence people
in determining the choice of mode for
shopping trips
• To design relevant transport policy
recommendations in order to get more
people using bus instead of cars
Objectives
• Primary data was
collected by ITS for DfT
through an online
survey across Great
Britain
• Distance and time
travelled are
compiled from
Transport Direct to
calculate journey cost
Data Collection
Methodology
Primary Data Secondary Data
Expenditure and
Accessibility Mode Choice
Analysis
Regression
Analysis Logit Model
Transport Policy Recommendations
• The dominant journey purpose for bus
trip in Great Britain is shopping with 1.3
millions per annum, surpassing
commuting purpose with 1.1 million
passengers per annum (National Travel
Survey)
• Nearly 70% of shopping activities are
located in either city or town centres. Bus
service is essential in providing efficient
accessibility to the potential demand
• More than half of shopping trips are
undertaken by cars
Background Key Issues
Logit Model
Un,j = Vn,j + εn,j
Example for single
observation n with j
different modes
• U: Utility choice
function
• V: Deterministic
function of the
attributes
• ε: Unobserved part
(distributed
independently
and identically)
Expenditure Model
• It is the function
of individuals
characteristics
and generalised
cost
• Relates to
income,
employment,
shopping
location, modes,
specific purpose
• Generalised cost
is the function of
accessibility and
fares (for bus)
Structuring a well-defined decision
guidelines based on demand and supply
characteristics of the traveller and
alternatives available

The railway system in Great Britain is the oldest in the world.
The world's first locomotive-hauled public railway opened in
1825. Rail passenger demand has experienced significant
growth in the last decade. The study is aimed at undertaking
analysis to determine quantitative elasticity variations with key
factors that drive passenger rail demand in Great Britain for the
period 2002 to 20011. This information is vital in facilitating
decision making, planning, management, policy formulation and
investments in the transport sector.
A measure frequently used to summarize the responsiveness of
demand to changes in the factors determining the level of
demand is the elasticity. Given as :
Where ∆y is the change in the demand y, and ∆xi is the change
in the explanatory variable xi.
• The study offers valuable insights to the variations in the
responsiveness of key drivers to rail travel growth.
• There is plenty of empirical evidence on elasticity’s but not so
much evidence on examining variations. The main aim of this
study is to produce quantitative indications of elasticity’s
variation with key factors such as distance; route; ticket type;.
i. To find evidence on fare elasticity variations.
ii. To find evidence on service quality elasticity variations
iii. To determine general journey time elasticity variations
iv. To find evidence on elasticity variation with the strength of
competition
v. To investigate evidence on GDP elasticity variations across
routes , distance and overtime.
• The study will adapt the conventional modelling approach, the fixed
effect model (FEM) expressed as: • 𝒍𝒏𝑽𝒊𝒋𝒕 = 𝝁𝒊𝒋 + 𝜶𝒍𝒏𝑭𝒊𝒋𝒕 + 𝜷𝒍𝒏𝑮𝑱𝑻𝒊𝒋𝒕 + 𝜸𝒍𝒏𝑮𝒊𝒕 + 𝜹𝒍𝒏𝑷𝒊𝒕 + 𝜼𝒍𝒏𝑻𝒊𝒋𝒕 +
𝝀𝒍𝒏𝑪𝒊𝒋𝒕 + 𝝆𝑯𝒊𝒕 +𝜺𝒊𝒕
• The FEM allows the time invariant differences between flows which
cannot be included or the time-invariant difference between flows to be
expressed as a specific function of included variables as compared to
the ratio modal approach.
• The beauty of greater generality of FEM makes it preferable for
estimation of panel data.
• The basic model for the study is the fixed effect model (FEM)
as opposed to the previous studies that used the ratio model
(RM) and the PDFH.
• Quantitative secondary panel data from rail operating
companies will be used in this research, consisting of 184 flows
ranging from 20 to 300 miles between stations, in 13 periods
from 2002 to 2011.
• Econometric analysis will be done using Eviews soft ware.
Presentation of results in forms of figures, tables, charts
• Output will be in two forms:
o Within group variation: variation over time for each
flow
o Between group variation: variations flows
AN ANALYSIS OF ELASTICITY VARIATIONS IN RAIL
PASSENGER DEMAND IN GREAT BRITAIN
2002 -2011
• Resent developments in the field of elasticity’s have led to
renewed interest in extending the analysis to variations in
elasticity’s across different key factors.
• Fares and quality of service are fundamental to the operation of
public transport since they form major sources of income to
operators. Evidence on fare elasticity and quality of service
elasticity variations are crucial in decision making on pricing
policy, service level changes and evaluation of non equal-
proportional fare changes for cost effective schemes.
• The last decade has seen transformation of the railway
therefore, it is important for policy-making to be informed by
best available knowledge about the variations in elasticity's
• The GDP elasticity represents the positive impacts of economic
activity on business trips and income on leisure trips.
BACKGROUND
WHY IS IT AN IMPORTANT SUBJECT?
WHY ARE WE STUDYING IT?
WHAT DO WE HOPE TO ACHIEVE?
HOW ARE WE GOING TO DO IT?
WHY THIS MODEL?
WHAT EVIDENCE IS THERE?
Gerald Harry Ekinu- MA Transport Economics
(ID: 200734159)
Supervisor: Professor Mark Wardman
area; elapsed time and levels that this variables take
• A need to recognize and address the limitations of previous/ current
studies in the modelling approaches used.

The Role of Incomes in Discrete Choice Models: implications in
welfare measure in transport investment appraisal
1. Background, Motivation & Objectives
2. Theoretical Framework
3. Overall Methodology 4. Case studies: railways
5. Expected Results
6. References
•Small, K.A. and Rosen, H.S (1981) “Applied welfare economics with discrete choice models’. Econometrica, 49 (1) 105-130. •Batley, I. and Ibanez, N. “Applied welfare economics with discrete choice models: Implications of Theory for Empirical Specification”. Working Paper. •Jara-Diaz, S.R. (2007). Transport economic theory. Oxford: Elsevier. •MaFadden, D. (1973)“Conditional Logit Analysis of Qualitative Choice behavior”.
UNIVERSITY OF LEEDS Institute for Transport Studies (ITS)
• Since the theoretical work of Small and Rosen (1981), applications in discrete choice models to welfare analysis in transportation sector have taken relevance in the academic and policy-makers grounds.
• The mis-specifying of incomes in discrete choice models might potentially lead to inaccurate measures of welfare.
• The theory in discrete choice models has made an important progress over years, that its recent approaches may cope potentially the mis-specifying of incomes in discrete models.
• To examine the role of incomes in discrete choice models from: (1) the theoretical basis in welfare measure; and (2) practical application in investment transport appraisal.
Literature Review
Theoretical basis: to review the concepts stated in Batley and Ibanez (2010).
Practical basis: to examine how incomes have been specified in DCM in literature.
Cases study
(a) Crossrail and (b) Linea 2: to review the way of incomes have (or not) been specified in the calculation of welfare. to analyse the assumptions regarding incomes in measuring user benefits.
Report of findings
Implications of mis-specifying incomes in welfare analysis.
Outline a practical guidance of income effects in discrete choice models.
• Incomes in discrete choice models might have implications for practical purposes in measuring welfare.
• The implications in welfare measure of mis-specifying incomes in discrete choice models might be significant and lead to inaccurate calculations of benefits in transport investment appraisal under some circumstances.
• Assumptions regarding incomes might be potentially more compatible with techniques in advanced discrete models.
Marshallian Demand X=X(P,M)
Hicksian Demand X=X(P,U0)
P
X1 M/P1
P0
P1
Subst. Effect
Income Effect
a b a + b = CS a = CV
𝑀𝑀𝑀𝑀𝑀𝑀 𝑈𝑈 𝑋𝑋 s.t. ∑ 𝑃𝑃𝑖𝑖𝑋𝑋𝑖𝑖 ≤ 𝐼𝐼𝑖𝑖 ; 𝑋𝑋𝑖𝑖 ≥ 0
X2
X1
M/P0
A
B
M/P1
C
U1
U0
𝐶𝐶𝐶𝐶 = −� �𝑋𝑋𝑖𝑖𝑐𝑐(𝑃𝑃𝑖𝑖𝑈𝑈0)𝑑𝑑𝑃𝑃𝑖𝑖𝑖𝑖
𝑃𝑃𝑃
𝑃𝑃0
Neo-classical approach of welfare
Δ𝑀𝑀𝐶𝐶𝑀𝑀 = −� �𝑋𝑋𝑖𝑖(𝑃𝑃, 𝐼𝐼 )𝑑𝑑𝑃𝑃𝑖𝑖𝑖𝑖
𝑃𝑃𝑃
𝑃𝑃0
𝐶𝐶𝐶𝐶 = −∫ ∑ 𝑋𝑋𝑖𝑖𝑐𝑐 𝑃𝑃𝑖𝑖𝑈𝑈0 𝑑𝑑𝑃𝑃𝑖𝑖𝑖𝑖𝑃𝑃𝑃𝑃𝑃0 = 𝑒𝑒 𝑃𝑃0,𝑈𝑈0 − 𝑒𝑒(𝑃𝑃𝑃,𝑈𝑈0)
A theoretical approach of income effect in welfare measure
Discrete choice models in demand
Discreteness in demand can be modelled in at least three forms when goods may be (Small and Rose, 1981): (a) available in continuous quantities; but in only one mutually exclusive varieties, e.g. housing/rent; (b) available in discrete large units that one or two are chosen, e.g. transport modes; and (c) purchased because nonconcavities leads corner solutions, e.g.tv show aired simultaneously. To exemplify illustratively a probabilistic choice, a decision-maker faces the following task:
Decision-maker 𝑃𝑃𝑃𝑃𝑘𝑘 = 𝑃𝑃𝑃𝑃(𝑤𝑤𝑘𝑘 + 𝜀𝜀𝑘𝑘 > 𝑤𝑤𝑘𝑘 + 𝜀𝜀𝑘𝑘)∀𝑖𝑖 ≠ 𝑘𝑘
𝑃𝑃𝑃𝑃𝑡𝑡𝑡𝑡𝑡𝑡𝑖𝑖𝑡𝑡 = 𝑃𝑃𝑃𝑃(𝜀𝜀𝑏𝑏𝑏𝑏𝑏𝑏 − 𝜀𝜀𝑡𝑡𝑡𝑡𝑡𝑡𝑖𝑖𝑡𝑡< 𝑤𝑤𝑡𝑡𝑡𝑡𝑡𝑡𝑖𝑖𝑡𝑡 − 𝑤𝑤𝑏𝑏𝑏𝑏𝑏𝑏)
𝑃𝑃𝑃𝑃𝑏𝑏𝑏𝑏𝑏𝑏 = 𝑃𝑃𝑃𝑃(𝜀𝜀𝑡𝑡𝑡𝑡𝑡𝑡𝑖𝑖𝑡𝑡 − 𝜀𝜀𝑏𝑏𝑏𝑏𝑏𝑏< 𝑤𝑤𝑏𝑏𝑏𝑏𝑏𝑏 − 𝑤𝑤𝑡𝑡𝑡𝑡𝑡𝑡𝑖𝑖𝑡𝑡)
Institute for Transport Studies MA Transport Economics FACULTY OF ENVIRONMET Presented by: Gian Carlos Silva Ancco - [email protected] - May 2014
Advised by: Dr. Richard Batley
Crossrail (London): £10.2 billion investment; 21km twin-bore tunnel, NPV £6.5 billion using DfT VoT or £11.5 billion using TfL VoT; increased capacity of London transport network; time saving DfT £7.4 bn or TfL £10.2 bn; congestion relief DfT £5.9 bn or TfL £8.1 bn; 200,000 passengers morning peak; discount rate 3.5 and 3.0; conventional BCR DfT 1.87 or TfL 2.55. Metro Linea 2 (Lima): USD 6.5 billion
investment; PPP contract; 35km twin-bore tunnel; 4 to 6 year of construction; 35 stations; number of trains from 26 to 42; 662,346 estimated passengers daily; NPV USD 759 miles; discount rate 9%, BCR 1.15, VoT USD 2.51; max reduced journey time between two stations: 70 min.
The income effect (variation in the purchase power) may be present in a lump-sum or change in price. The formulation of welfare is given by:
Δ𝑀𝑀𝐶𝐶𝑀𝑀 = −∫ ∑ 𝑋𝑋𝑖𝑖(𝑃𝑃, 𝐼𝐼 )𝑑𝑑𝑃𝑃𝑖𝑖𝑖𝑖 = −𝑃𝑃𝑃𝑃𝑃0 ∫ ∑ −
𝑑𝑑𝑑𝑑𝑑𝑑𝑑𝑑𝑑𝑑𝑑𝑑𝑑𝑑𝑑𝑑𝑑𝑑
𝑑𝑑𝑃𝑃𝑖𝑖𝑖𝑖𝑃𝑃𝑃𝑃𝑃0
If marginal utility of income (denoted by λ) is constant, then ∆MCS equals CV:
Δ𝑀𝑀𝐶𝐶𝑀𝑀 = 𝑑𝑑𝑑𝑑𝑑𝑑𝑑𝑑
𝑣𝑣 𝑃𝑃𝑃,𝑦𝑦 − 𝑣𝑣 𝑃𝑃0,𝑦𝑦 = 𝑒𝑒 𝑃𝑃0,𝑈𝑈0 − 𝑒𝑒(𝑃𝑃𝑃,𝑈𝑈0)
The assumption of constant λ implies path-independency in Marshallian demand, i.e. alike welfare measure in Hickesian and Marshallian approach.
Where: 𝜆𝜆 = 𝑑𝑑𝑉𝑉𝑑𝑑𝑑𝑑⟹ 𝜕𝜕𝑥𝑥𝑖𝑖
𝜕𝜕𝑝𝑝𝑝𝑝= 𝜕𝜕𝑥𝑥𝑝𝑝
𝜕𝜕𝑝𝑝𝑖𝑖∀𝑖𝑖, 𝑗𝑗

f
f
Site Profile: Merseyside
Population: 1,381,200 (9th)
645 km2 (43rd)
5 Boroughs – Knowsley, Liverpool, Sefton, St Helens, Wirral
Valued at £21.9 Billion (2.1% of U.K economy) GVA (Gross Value Added)
0 1 2 3 4 50.5
Miles
Ward_Boundaries
No. of Households With Access To A Vehicles
18 - 94
95 - 171
172 - 247
248 - 323
324 - 400
401 - 476
477 - 552
553 - 628
629 - 705
706 - 781
No Data
¡
No. Of Households with No Access To A Vehicle
(Inset of Wirral and Liverpool Boundaries)
0 2.5 5 7.5 101.25
Miles
0 1 2 3 4 50.5
Miles
Ward_BoundariesNo. Of Households with Dependents
8 - 28
29 - 49
50 - 69
70 - 89
90 - 110
111 - 130
131 - 150
151 - 170
171 - 191
192 - 211
No Data
¡
No. Of Households with Dependents in Merseyside
(Inset of Wirral and Liverpool Boundaries)
0 2.5 5 7.5 101.25
Miles
The Maps:
The Maths:
PC = TC TC + TT
CIJ = a1.tIV + a2.tWK + a3.tWT + a4.tIN + a5.F + a6
The Method:
Ai = Σ [BJf(CIJ)]
Accessibility To Destination:
This will demonstrate how accessible a location is based on either Thiessen polygons (zone inside polygon is closer to that sample) or isochrones (coloured bars of equal value).
Modal Split/Destination Attractiveness:
Multi-nomial logit models calculating modal split. (Equation can be used for destinations). These can be portrayed 3D or by colour (large spike, more accessible)
Route Allocation/ Trip Chaining:
Network Analyses using the cost equation above will show the “cheapes t” rou te fo r an i n d i v i d u a l t o u s e . A l s o demonstrates trip-chaining (best way to carry out multiple tasks).
D e m o n s t r a t e a n d evaluate disaggregate t e c h n i q u e s o f accessibility analysis
Potential Issues
Establishing parameters. How to
measure a preference?
How disaggregate is too disaggregate?
Issues with deterrence functions.
How viable are the methods?
Literature Review: 1970
Geographical Space Accessible Space
2011
Hagerstrand developed a time-geographies concept.
3 M a i n C o n s t r a i n t s : “capability constraints”, “coupling constraints” and “authority constraints”.
Computing power h a s a l l o w e d f o r disaggregate activity model l ing to be c a r r i e d o u t .
S t i l l a “ p i o n e e r i n g ” m e t h o d . B u f f e r s a r e predominant technique
Not a spatially defined problem. – Large geographical space, small accessible space.
Need to consider area mobility, individual m o b i l i t y a n d a r e a a c c e s s i b i l i t y .
Economic status, car availability and physical or social preferences and limitations can affect how a person can or wants to travel.
A Local Travel Plan (LTP) set up by the Local Authority and Merseytravel seeks to “develop a fully integrated and sustainable transport network... And ensures good access for all in the community” (Merseytravel 2000)
The End Result: GIS outputs of varying types with two main aims:
1. Levels of accessibility for individuals demonstrating how their lifestyles
affect their travel choices and access.
2. Differences between the disaggregate methods used in the study and aggregate methods carried out as a comparative tool.
This will establish if the individual level studies are more accurate than aggregate measures, and if so, to what extent, with what outcomes?
What Next…?
Need to establish parameters to use within the functions.
Carry out the GIS techniques and modelling.
Analyse and evaluate the datasets – See what is possible.
Large number of citizens in certain areas are not car users and as such find it hard to carry out fundamental tasks, such as taking children to school or going shopping. Thus creating and social exclusion transport poverty.
f f
Some Important Questions:
Can GIS model the movements of individuals based on their preferences, motivations and restrictions, and how these relate to transport?
Does a micro-level analysis offer a viable alternative to the current methods of study?
One Size Doesn’t Fit All... Many relationships exist between different individuals preferences, capabilities and the levels of their t r a n s p o r t a c c e s s i b i l i t y .
Aggregate methods (groups, not individuals ) can miss important elements of a persons accessibility.
Study Aims:
Carry out an accessibility study of Merseyside at a disaggregate level.
Highlight inefficiencies in aggregate modelling
Show that individuals from the same areas have differing travel
patterns.

Methodology
Traffic signals are important in the safe use of
road space and efficient control of traffic in
congested urban transport networks.
Combining a traffic model and an optimisation
method, traffic signal control models devise
signal timings that meet certain objectives.
The current traffic signal control is based on the
average traffic condition, and does not account
for variability (or say ‘noise’) in traffic.
To develop a traffic signal timing model that
account for variability in traffic.
To consider Cross Entropy Method (CEM) with
micro-simulation in the model.
• To test the performance of the model in a realistic
network.
Background
3
Study 4 Scenarios Objectives 2
1
DRACULA micro-simulation modelling
Get detailed information (delay, driving behavior, etc.)
to appraise performance of each signal timing.
Cross Entropy Method (CEM)
Start of stage 1
Start of stage 2
1
2 3
4
5 6
Distribution function
Select the best 5% solutions and update
parameters of distribution through minimizing the
Kullback–Leibler distance, which is equivalent
to the program:
𝑀𝑎𝑥𝐷 𝜇, 𝜎 = Max ln𝑝 𝑥𝑖; 𝜇, 𝜎
𝑖
Where 𝑥𝑖 represents the best 5% solutions.
Stop the iteration until the new values of
parameters are equal (or close enough) to the
previous one.
Solutions
Appraise Solutions
Micro-simulation model
Rank and select Update
Best Solution
Convergence
?
Develop a Matlab code to implement the CEM
model, providing input solutions to and taking
results from DRACULA.
Test the integrated model on a number of
representative and realistic networks, and
compare the results with standard signal timings.
Test the performance on modelling different
options (e.g. different CEM updating methods,
number of simulation runs)
Compare and contrast the restricts, draw
conclusions and write report.
Jialiang Guo - [email protected]
MSc (Eng) Transport Planning and Engineering
Supervisor: Ronghui Liu May 2014
µ
σ
Roundabout
Signal timing generation
Generate a big sample of signal timings (say
1000) from a given distribution function 𝑝 𝑥; 𝜇, 𝜎

• Road pricing (tolling) dates back to the 17th century introduced
after the turnpike Act – 1663 in UK and to 18th century in the USA;
• Was predominantly used to raise funds for construction and
maintenance of highways;
• In recent times, tolling has been used for numerous reasons;
• Implemented in Singapore since 1975 as a traffic management
tool;
• In London, it has been used since 2003 to reduce congestion and
protect the environment;
• Norway, Sweden and Malaysia use road tolling to raise funds for
road transport budget support.
Road Pricing: A Case of Competing Private Road Toll Operators
The study intends to:
• Study techniques of identifying Nash Equilibrium for multiple toll
operators;
• Examine toll levels that ensure private operators maximise
revenue and meet the Nash Equilibrium conditions;
• Establish how revenue maximising tolls compare with social
welfare maximising tolls.
By Jonah Mumbya | Supervisor – Mr. Andrew Koh | Second Reader – Dr. Chandra Balijepalli
Introduction
Objectives
Motivation
Effects of Increasing Congestion Environmental Costs of Traffic Government Budget Constraints
• Global costs of congestion are high and
projected to increase with increasing
traffic delays;
• In UK, congestion costs (due to delay)
stood at £20bn in 2000 and projected to
increase to £30bn by 2020;
• NTM projects traffic to grow by 43% as a
result of a 66% GDP growth from 2010-
2040 in England alone;
• This would lead to congestion increasing
by 114% and lost seconds per mile would
increase by 36% hence cost as travel
speeds would reduce by 8%.
• Transport is the third largest
contributor to global warming
just behind energy (electricity
and heating) and industry;
• In UK, Road transport
contributed over 27% to
Green House Gasses with
cars having 58% of this in
2009;
• With increasing motorisation,
this is likely to be the same or
worse with time.
• Governments are continually
getting constrained to finance
road infrastructure using
traditional budget
appropriations;
• Hence road users ought to
meet part of the road
infrastructure investment
costs/budgets;
• Road pricing supports about
32% of Norway’s national road
system budget and 46% of
Spain's road budget.
Methodology
a) Link Selection;
Link selection shall be based on the difference
between link marginal cost and average cost and the
level of congestion of the do-nothing scenario.
b) Determine Tolls;
Iteratively, tolls will be set until a Nash Equilibrium is
achieved for the competing toll operators.
c) Traffic Assignment;
Using SATURN, traffic shall be assigned to the
network based on Wardrop’s first equilibrium
principle.
d) Calculation of Revenue and Benefits.
Based on assigned link flows from SATURN,
revenues and social benefits will be calculated.
Test Network – Edinburgh
1
2
3
4 5
Select Links
[SATURN]Set Tolls
Assign Traffic to
the Network
[SATURN]
Is Nash
Equilibrium
Achieved?
Calculate
Revenue and
Social
Benefits
No
Yes

INVESTMENT DECISIONS FOR RESILIENT TRANSPORT INFRASTRUCTURE:
A CASE STUDY OF THE DAWLISH RAILWAY LINE COLLAPSE
Kwame Nimako: MSc Transport Planning and Engineering (2013-2014) Supervisors: Prof. Greg Marsden and Prof. Nigel Wright
1. BACKGROUND
• A good transport system promotes the movement of people,
goods and services from one point to another under normal
conditions (Amdal and Swigart, 2010). A nation’s economic
vitality to a large extent depends on its transport network
(Amdal and Swigart, 2010).
• The occurrences of natural disasters such as flooding, make
transport networks such as railway lines vulnerable (Doll et
al., 2013), thereby impacting negatively on train services.
• For the disruption at Dawlish, the Train Operating Companies
will be paid £16 million by Network Rail for lost revenue over
the period (BBC, 2014).
• As the frequency and magnitude of such disruptive events
become more probable in future due to climate change, the
cost of providing engineering interventions required for
reliable transport services increases significantly.
• Since most transport infrastructure are long term assets (Doll
et al., 2013), there is the need for adequate investment
decisions on cost effective strategies to be employed to
enhance their resilience over their life span.
2. AIM
The aim of this dissertation is to develop a methodology to be
utilised in making cost-effective investment decisions to
improve the resilience of railway lines to disruptions.
3. OBJECTIVES
To achieve this aim, the following objectives have been set:
i. Understanding how demand for transport changes during
a major flooding event
ii. Estimating the impacts of the resultant disruption on
users of the infrastructure
iii. Collecting estimates of alternative flood risk mitigation
investments
iv. Developing a methodology to assess the cost-
effectiveness of such investments under different future
scenarios of flood risk
Great Western Rail line - London-Exeter-Dawlish-Plymouth-Penzance. (Source: First Great Western network map)
Location of Dawlish and the Railway line Disruption (Source: Google.com)
4. PROPOSED METHODOLOGY
5. EXPECTED OUTCOME
It is anticipated that this study will produce an Investment-
Frequency Matrix based on current and future scenarios of
disruptions to be utilised to improve the resilience of railway
lines.
6. REFERENCES
• Amdal, J.R. and Swigart, S.L. 2010. Resilient Transportation Systems
in a Post-Disaster Environment: A Case Study of Opportunities
Realized and Missed in the Greater New Orleans Region, 2010.
• Doll, C. et al. 2013. Adapting rail and road networks to weather
extremes: case studies for southern Germany and Austria. Natural
Hazards. pp.1-23.
• British Broadcasting Corporation. 2014. Storm-hit Dawlish rail line
compensation payout revealed. [Online]. [Accessed 28 April 2014].
Available from:http://www.bbc.co.uk/news/uk-england-devon-
27055780.

University business travel choices and University business travel choices and University business travel choices and working practices
Kanintuch Siripaibool Supervisor: Ann Jopson ([email protected])
working practicesKanintuch Siripaibool Supervisor: Ann Jopson ([email protected])
ObjectivesBackground
Objectives
• Find out the chosen / preferred travel mode choices of Nowadays there is an increasing in number of business
• Find out the chosen / preferred travel mode choices of
traveling;trips particularly for academic staff in the UK traveling to
European cities and beyond. Most of staff traveling by
traveling;
• Compare the choices e.g. air vs rail between UK and European cities and beyond. Most of staff traveling by
train or air depending on their preferences and time used.
• Compare the choices e.g. air vs rail between UK and
European cities;train or air depending on their preferences and time used. European cities;
• Discover the advantages / disadvantages of each The aim is to understand the academic travelers preferred choices and the reasons behind that, the activities they
• Discover the advantages / disadvantages of each
choice;choices and the reasons behind that, the activities they are doing while traveling and also how to reduce • Determine the activities they do while traveling and the are doing while traveling and also how to reduce environmental impact e.g. carbon emission (Carbon Management Plan, 2011).
influence to the chosen mode.Management Plan, 2011).
Business Travel
VS
Business Travel
• Average annual trips of educational staff (all modes) = VS
• Average annual trips of educational staff (all modes) =
50 trips (Wardman et al., 2013);
• 82% of business travelers said they spent some/most
of time working while travelling (Lyons et al, 2008).
MethodologyIn-vehicle VOT for Trip > 50km Methodology
• Mixed method questionnaire used in the study (mainly 35
In-vehicle VOT for Trip > 50km
• Mixed method questionnaire used in the study (mainly
qualitative) via online;25
30
• Tick-box questions for the first part of questionnaire e.g. 20
25
Background, preferred choices;15
20
£/hr
• Open-ended questions for opinions about choices,
advantages / disadvantages, etc. and some follow10
15
advantages / disadvantages, etc. and some follow
interviews for in-depth questions;0
5
interviews for in-depth questions;
• Find out the repeated similarities / themes in data
0
Car Bus Rail Air • Find out the repeated similarities / themes in data
collected.
Car Bus Rail Air
Norway’s 1997 data collected.Norway’s 1997 data
University business travel choices and University business travel choices and University business travel choices and working practices
Kanintuch Siripaibool Supervisor: Ann Jopson ([email protected])
working practicesKanintuch Siripaibool Supervisor: Ann Jopson ([email protected])
Scope
Find out the chosen / preferred travel mode choices of
Scope
• Focus on trips involved with meetings/conferences, Find out the chosen / preferred travel mode choices of
• Focus on trips involved with meetings/conferences,
away from usual working place;
Compare the choices e.g. air vs rail between UK and • Target only ITS staff, sample size: 25 – 30;
Compare the choices e.g. air vs rail between UK and • Travel choices between Leeds and key European cities
Discover the advantages / disadvantages of each e.g. Paris, Brussels, Amsterdam;
Rail network in EuropeDiscover the advantages / disadvantages of each
Rail network in Europe
Determine the activities they do while traveling and the
influence to the chosen mode.
VSVS
Source:Wikipedia (2011)
Initial Findings method questionnaire used in the study (mainly • Trips less than 500km air travel rarely used while trips
method questionnaire used in the study (mainly
more than 1000km air travel is predominate (Borken-
Kleefeld et al., 2013);box questions for the first part of questionnaire e.g.
Kleefeld et al., 2013);
• Business travelers have high in-vehicle VOT than Background, preferred choices;
• Business travelers have high in-vehicle VOT than
commuting and leisure travelers (Wardman, 2008);ended questions for opinions about choices,
advantages / disadvantages, etc. and some follow-up commuting and leisure travelers (Wardman, 2008);
• Business travelers have high willingness-to-pay advantages / disadvantages, etc. and some follow-up
depth questions; • Business travelers have high willingness-to-pay
(Carlsson, 1999);depth questions;
Find out the repeated similarities / themes in data (Carlsson, 1999);
• Business travelers are mostly time-restricted, don’t strive Find out the repeated similarities / themes in data
• Business travelers are mostly time-restricted, don’t strive
for low price (Jung and Yoo, 2013).for low price (Jung and Yoo, 2013).
Pedestrian Safety for the Visually Impaired and Elderly: Case Study: Leeds
Background
Aim
Scope
Pedestrians are often referred to as
vulnerable road users, borne out of the fact
that they comprise over 20% of those killed on
the roads(WHO, 2013).
The elderly and visually impaired pedestrians
are more vulnerable in this context as they
find it difficult to meander on the roadway as
other pedestrians do. They usually fear the
risk of being run over by vehicles coupled with
being endangered by other roadway hazards
like tripping to a fall on barriers like litter bins,
concrete and sign post. This results in low
level of confidence and hence suppressed
mobility.
This research aims at restoring confidence to the
visually impaired and elderly pedestrians on using
the roadway so they can get out more.
The survey method will be used where qualitative data will be
obtained from an in-depth face to face interview of 30 to 50
groups of visually impaired and elderly pedestrians using open
ended questions, which will reflect the recipients’ feelings
about their safety as pedestrians. Finally data will be analysed
using content analysis of descriptive and interpretative
measures where data will be sorted and classified into
similarities and differences, and finally summarised and
tabulated.
Methodology
The research is focused on the suppressed mobility of visually impaired and older
pedestrians within Leeds. it will seek to identify what makes them vulnerable, as well as
infrastructure and facilities available to encourage movement leading to their restored
confidence and enhanced safety.
Objectives
• To understand the extent to which the
visually impaired and the older people’s
mobility is suppressed, as compared with
the population as a whole.
• To establish whether there is a link between
suppressed mobility and the level of
confidence in using the pedestrian and built
environment; and if so, the nature of that
link.
• To explore possible ways of building
confidence amongst the visually impaired
and older people, leading to their enhanced
mobility.
By Jennifer Kuka Upuji
Student ID: 200749910
Supervisor: Mr Bryan Mathews
Implications
2 million people in the UK are living with sight
loss. These figures are expected to rise to over
2,250,000 in 2020 (Fight for Sight, 2014)
Zifotofsky et al,2009
http://Safetysigns-mn.com
Department for Transport,2013
Pedestrian Accidents- > 60yrs
Fhwa.dot.gov
www.bhatkallys.com
http://Clacksweb.org.uk
www.sensors/special_issues/vehicle-control
www.nei.nih.gov/eyedata/lowvision
http://srsc.org.sg
http://phillymotu.wordpress.com

Understanding travel behaviour to stadium and arena events : A Cardiff case study Laura Crank, MSc Transport Planning (FT)
Supervisor: Bryan Matthews
The importance of travelling to events
The car is the most popular mode of transport to stadium and arena events, and as the attendance of such events increases, it is noted, “…the demand for travel is heavily constrained both in time and space” (Robbins et al. 2007:303). High demand in a short space of time leads to congestion on the roads and overcrowding on public transport. Providing for such temporary ‘peak’ crowds would leave the additional infrastructure and services underused for the most part, which is economically unviable (ibid:304).
The story so far…
Obtained at least 150 responses between face-to-face and online surveys
Met with Cardiff Council’s Operations Manger of Major
Projects (Infrastructure) at one of the venues during an event. Managed to discuss issues at hand and how the council managed the city during large events
Methodology
Design survey taking into account aims and objectives. Test survey to ensure it is understandable and quick to complete
Sample a range of events to capture different socio-economic groups
Conduct face-to-face surveys at both Millennium
Stadium and Motorpoint Arena, and promote online survey to gain 200+ responses
Differentiate between results for each event,
establish differences in audiences, distances travelled, travel habits
Conclude what would need to be done to encourage modal shift to public transport
Aims and Objectives
To understand travel behaviour to events, developing on previous research at other stadiums and arenas
It is becoming a growing interest to understand the behaviour of spectators and to determine what changes would have to occur to the public transport system to increase attractiveness and modal share of public transport to events.
Research Questions What is the percentage of different modes of transport
used to access events in Cardiff?
What factors influence mode choice to events in Cardiff? Are there differences between mode choices to the two
venues? Are different event audiences more “sustainable” in
their travel choices, or willing to change their event travel habits?
What changes would have to be made to public transport
to increase its usage during events in Cardiff?
References Robbins, D. et al. 2007. Planning Transport with Special Events: A Conceptual
Framework and Future Agenda for Research. International Journal of Tourism Research. 9. Pp. 303-314.
Yeates, J. et al. 2009. Changing Travel Patterns of Arena Visitors: Transportation Demand Management for Urban Arenas and Stadia. [Online] Available at: http://www.ite.org/Membersonly/techconference/2009/CB09C3001.pdf [Accessed April 2014] Washington: Institute of Transport Engineers. Modal split before and after TDM measures
Location of venues and public transport stations in the vicinity of
the Cardiff region
A survey of stadium travel in New York found that after
transport demand measures (TDM) were implemented,
there was a decrease in car travel to events, whilst
public transport use increased.
BACKGROUND
Realistic driving behaviour models require detailed trajectory data for calibration; however, such data is very expensive to collect and process.
Spatial transferability of driving behaviour models leads to significant saving of costs and saves time for the new location.
RESEARCH QUESTIONS
What driving behaviour models could be developed for two contexts within the same geographical areas?
Which of the models would be recommended for transferability?
To use data from two sites to develop three different driving behaviour model structures.
To evaluate transferability of each of the three models using transferability scores.
To make recommendation on the best transferable driving behaviour model.
OBJECTIVES
STUDY LOCATION
SITE 2
Transferability of Gap-Acceptance Driving Behaviour Model Student: Ahabyona M. Evelyn. Supervisor: Dr. Charisma C. Choudhury. 2nd Reader: Dr. Ronghui Liu.
To test proximity effect on model transferability two are chosen from the same geographical area while the other data set is from a different geographical location.
Transferability of data sets will be analysed using the likelihood-ratio test methodology.
A micro-simulation tool (biogeme) will be used to predict the aggregate gap-acceptance behaviour of drivers.
METHODOLOGY POTENTIAL RISKS
Data being used may be out dated. Unrevealed factors such as bad weather conditions that
may have affected data collection. The data may not be detailed enough to capture all
aspects of gap-acceptance driving behaviour since it was collected for a different purpose.
A DRIVER CHANGING LANES
SITE 1
DATA COLLECTION
Understanding Free Bus Travel in West Yorkshire Using Smartcard Data
Context Methodology
• Temporal variation of trip frequency i.e. by time of day or day of the week.
• Influence of age on trip frequency.
• Spatial variation of trips frequency i.e. by location, with influence of income/level of deprivation.
Expected Findings
MSc Transport Planning Dissertation Mmoloki S. S. Baele e-mail: [email protected]
Scope and Objectives Scope
• The study covers concessionary bus travel for WY only.
• The focus is on after-scheme cross sectional travel data.
Objectives of Dissertation
• To determine the level of ENCTS pass use in West Yorkshire.
• To determine trip frequency patterns according to temporal, spatial and socio-demographic variations i.e. by day of the week, location, income group, age, gender and disability type.
• To evaluate value of smartcard data in determining travel patterns and the implications of the results on the policy for the ENCTS in West Yorkshire.
LITERATURE REVIEW
•Reviewing literature on concessionary bus travel, previous studies on smartcard data and complementary data sources.
•Determine the relevance of literature to the study.
DATA COLLECTION AND PREPARATION
•Deciding on relevant data types and variables.
•Extraction from WY Metro smartcard database – primary source.
•Downloading relevant complementary data (e.g. census and NTS data).
•Cleaning and organising data.
DATA ANALYSIS
•Defining trip data units of analysis and method of analysis from smartcard data.
•Determining trip frequency distribution and statistical analysis e.g. regression analysis.
•Comparison with other data sources (e.g. NTS).
INTERPRETATION OF RESULTS
• Identifying notable travel patterns.
•Evaluating the relevance of results to policy.
•Reflecting on the strengths and limitations of study and possible future areas of study.
West Yorkshire Concessionary Free Bus Travel
•West Yorkshire Passenger Transport Executive (WY Metro) issues smartcard type Concessionary Bus Travel passes as part of the English National Concessionary Travel Scheme (ENCTS).
Senior Pass
• Issued to permanent residents of West Yorkshire (WY); free off-peak bus travel for persons that have reached retirement age.
Blind and Disabled Passes
•Free travel on buses for blind persons at any time of day in West Yorkshire and off-peak throughout England and free, off-peak bus travel for disabled persons throughout England.
Companion Pass
•For persons accompanying eligible persons who are not able to travel alone.
67.3%
31.1%
1.6%
Proportion of Trips by Pass Type
Senior Disabled Companion
0
200
400
600
800
1000
1200
1400
Sun Mon Tue Wed Thu Fri Sat
No
. of
Trip
s
Average Weekly Trips - March 2014
Companion
Disabled
Senior
0 20 40 60 80 100 120
0.00
0.50
1.00
1.50
2.00
2.50
3.00
Passholders Age
Trip
s/p
ers
on
/we
ek
Mar’14 Average Trip Frequencies by Age
All pictures under WY Metro Copyright May 2014

2) Description of the Topic - Objectives
In the context of this survey, new stated preference data on mode choice are collected, with two components: one using current settings and one incorporating reducing car use & switching to public transport commuting instead. The work then investigates the performance of models estimated on the base scenario to predict the behaviour after the incentives have been brought in, and looks at the benefits that a treatment of attitudes brings in this context.
3) Scope of the Research
We investigate the response of the participants at 4 different scenarios -
policy interventions: •Increase in fuel price
•Increase in parking cost •Decrease in public transport cost (fare)
•Increase in the frequency of public transport
4) Methodology Statistical Model: Discrete Choice Modeling - Integrated
Choice & Latent Variable Model (ICVL)
We consider that the interviewees have 3 transportation options: drive & pay for parking, drive & search for free parking & use public transport. We give them eight current alternatives in which the attributes of the three options differ slightly. After that, we introduce 4 hypothetical policy interventions from their base scenario, where only one attribute changes every time. The individuals’ choices depend on the perceived utility of each option, which itself depends on the attributes of the specific alternative (access time, frequency, travel time, finding space, egress time, cost), the person’s socio-demographic characteristics (age, income, gender, education, area of residence, marital status), but also on the latent attitudes an of the individual (pro-intervention attitudes). Those attitudes explain his responses to the attitudinal questions (indicators I).
5) Data Collection: Survey - Stated Preference Data Collection – Devision of on-line Questionnaire
The questionnaire consists of four parts: • Existing Situation
•Stated Preference Part → Before/After Policy Intervention Choices
• Car/Public Transport Attributes & Attitudes • Socio - Demographic Characteristics
Sample: Staff of the University of Leeds, size of approximately 100 persons who commute by car.
On-line survey instead of face-to-face interviews
Indicators I → Responses to
attitudinal questions
Socio-demographic Characteristics of
interviewees
Utility of car & public transport
Attributes X of modes (car &
public transport)
Choice ↔ Probability of different scenarios
occurring
1) Introduction-Background
Nowadays, the challenge in transportation is to move to a more sustainable, environmentally friendly & economic way of commuting. To achieve this goal, incentives should be given to individuals in order to switch from car use to public transport. This dissertation aims to deepen in this issue, to investigate & quantify those incentives & examine all its parameters, as there are no retrospect surveys on this subject.
Marina T. Triampela, Stephane Hess

Institute for Transport Studies Faculty of Environment
1 INTRODUCTION
Transport Sector Contribute to GhG Emisssion According to the House of Commons Environmental Audit Committee,
“carbon emissions from transport since 1990 have moved spectacularly in the wrong direction – in marked contrast to other sectors”. Contribution of transport sector to total GhG emission increase to around 25%
Road transport carbon emissions proportion on the transport sector
emission is 75%-85%. Current CO2 emission of road transport are hovering at the same level as in 1990. Target of transport CO2 emission is 31% lower than 1990 base year by 2020 (CCC, 2013)
Road pricing could be alternative mitigation to reduce carbon emission further. But many of current schemes tend to focus on congestion as their primary objective rather than look at the joint problem of tolling for congestion and emission.
How to Calculate Carbon Emission? • DfT Methods (DfT, 2011) Where:
Ce= carbon emission, L=Fuel consumption, Ceβ= Carbon emission per litres burnt, V= Average speed and a,b,c,d= Parameters based on “New UK Road
Vehicle Emission Factors Database”
• Alternative Models (Shepherd, 2008) 1. Simple fixed rate Apply average speed of network into equation of complex emission model below, and get constant addition of CO2 per trips 2. Complex emission models
Where: g = CO2 emitted, V = average speed of link-based Then carbon emission can be monetized by multiply it with £70 per tonne of carbon emitted
Cordon Pricing
4 METHODOLOGY
Researcher: Naf’an Arifian ([email protected]) --MSc. Transport Planning
Supervisor: Simon Shepherd ([email protected])
Second Reader: Dave Milne (D.S.Milne@its/leeds.ac.uk)
How Effective are Cordon and Distance-Based Pricing at Reducing CO2 Emission?
2 OBJECTIVES 1. To investigate welfare benefits of road pricing schemes taking into
account CO2 emission and congestion 2. To investigate differentiation between simple fixed rate emission model
and complex emission model dependent-speed. 3. To investigate impacts of cordon pricing and distance based pricing
policies on reducing CO2 emission
Build Networks on SATURN
OD matrix, road networks data and demand elasticity
Develop Road Pricing Schemes
Charges all-links (first best pricing adjust to include CO2 emission cost), Cordon and
distance-based pricing by modified ‘generalized cost’ equation of SATURN
Run SATURN and Record Outputs
Link-based speed and flows
Calculate and Investigate
Emission cost of simple vs complex emission models, Congestion and emission cost of cordon vs distance-
based pricing
Comparison between Scenarios with First-best Pricing
In terms of congestion cost, emission cost and welfare benefit
What is Road Pricing? •Road pricing are direct charges for the use of roads, including road
tolls, distance or based time charges, congestion charges particularly to discourage use of certain class of vehicles, fuel sources or more polluting vehicles.
1. First-best pricing; charges on all links in order to achieve maximum social welfare
2. Second-best pricing; under constraints to find optimum toll in order to achieve maximum welfare
Ce= L*Ceβ
3 LITERATURE REVIEW
Calculate and Investigate
Welfare benefit of Cordon vs Distance-based pricing (by Plotting optimal toll take account (i) congestion,
(ii) congestion + CO2 emission simple fixed rate model and (iii) congestion + Co2 emission complex model)
Source: Shepherd (2008)
Source: DECC (2014)
Source: Shepherd et.al (2008)
1. Committee on Climate Change (CCC). 2013. Fourth carbon budget review –
technical report : Sectoral analysis of the cost-effective path to the 2050 target 2. Department for Transport (DfT). 2011. The greenhouse gasses sub-objective:
TAG 3.3.5 3. Department of Energy and Climate Change (DECC). 2014. Total greenhouse gass
emission from transport 4. Shepherd, S. 2008. The effect of complex models of externalities on estimated
optimal tolls 5. Shepherd, S., May. A., and Koh. A. 2008. How to design effective road pricing
cordons
References

www.kliaekspres.com
www.ktmkomuter.com.my
www.ktmb.com.my
www.prasarana.com.my
www.spad.gov.my
• Population ~29m • Capital: Kuala Lumpur • GDP per capita: ~10k USD • Age group [16-64] expanding Kuala Lumpur Metropolitan Area (KLMA)
www.wikimedia.com
• Rapid motorization rate – Car Ownership at ~320 cars / 1000 per. • Fuel subsidized – Oil producing country - Approved Price / Floating Price Mechanism : Pump price lower/equal than actual market value. • Train Services: Intercity and Urban (KLMA) available
Components Description
Key Question
Deduction of constant elasticity Method:
Urban: Trips Made
Intercity: Kilometer-Passenger
Urban: Trips Made
Intercity: Kilometer-Passenger
Online Survey - Considering type of trip, gender, income, location. Dispersion question: Given a situation is that the fuel price has gone very high and is no longer affordable. If you had to make a leisure trip (visiting family/friends, holiday etc) . If petrol prices are too high, how do you travel? A) Train B)Bus
Key Question: Deduction of the cross elasticity of rail demand with respect of pump car-fuel price.
Area and Mode Area of study will be in Malaysia (East and West). Related modes: Train and Cars.
Impact of Car Petrol Prices on Rail Demand: The Case of Malaysia Nik Mohd Rafiq Bin Wan Ibrahim MSc. (Eng.) Transport Planning and Engineering [email protected]
Supervisor: Prof. Mark Wardman Institute for Transport, University of Leeds
Quick Overview: Deduction of the cross-elasticity of rail passenger demand in Malaysia with respects to car petrol prices.
TrainCar
rainRidershipT
arRidershipC
iceCarFuelCariceCarFuelRailV
V,Pr,Pr, ||
1. Situation Appraisal 3. Scope 5. Methodology / Data Collection
4. Literature 2. Motivation
iceCarFuelRail Pr,
iceCarFuelCar Pr,
rainRidershipTV
arRidershipCV
TrainCar,
Urban Rail (Kuala Lumpur
Metropolitan Area) Nationwide
Intercity Rail (Nationwide)
• Interesting to see in a fuel-subsidized country, where the actual transport fuel cost is not paid by the user, would there be any significant mode shift.
• As oppose to EU or UK, whereby taxation of fuel is a national income stream, the effects of increase modal-shift to trains (public transport in general) in countries where fuel are “costly” to the nation, would be a point of interest.
• Trending projects to improve in urban rail especially in KLMA and intercity rail services (Double Track, HSR)
• Subsidy will be removed?
Acutt and Dodgson 1996, Cross elasticities of demand for travel, Transport Policy Vol 2, pp. 271-277
Train Type Year Cross Elasticity w.r.t car-fuel price
InterCity, NSE, Regional
1992/93 0.041 – 0.094
Underground 1992/93 0.017
Train Type Year Cross Elasticity w.r.t car-cost
Inter Urban - 0.59
Urban - 0.25
Paullney et al 2006, The demand for public transport: The effects of fares. Quality service and car ownership, Transport Policy, 13(4), pp. 295-306
40.0
50.0
60.0
70.0
80.0
90.0
100.0
110.0
120.0
130.0
19
80
19
82
19
84
19
86
19
88
19
90
19
92
19
94
19
96
19
98
20
00
20
02
20
04
20
06
20
08
20
10
20
12
Consumer Price Index(2000 = 100) (SourceDOSM)
0
2000
4000
6000
8000
10000
12000
14000
19
80
19
82
19
84
19
86
19
88
19
90
19
92
19
94
19
96
19
98
20
00
20
02
20
04
20
06
20
08
20
10
20
12
Retail Fuel Sold [millionliters] (RON97 + RON95)(Source KPDNKK)
0
20000000
40000000
60000000
80000000
100000000
120000000
140000000
160000000
180000000
200000000
19
80
19
82
19
84
19
86
19
88
19
90
19
92
19
94
19
96
19
98
20
00
20
01
20
03
20
05
20
07
20
09
20
11
Passenger Ridership UrbanRail (Source: EPU)
0
200000000
400000000
600000000
800000000
1E+09
1.2E+09
1.4E+09
1.6E+09
1.8E+09
19
80
19
82
19
84
19
86
19
88
19
90
19
92
19
94
19
96
19
98
20
00
20
02
20
04
20
06
20
08
20
10
20
12
Railways, passengerscarried (passenger-km)[Source: DOSM]
MALAYSIA
Objective: To investigate the relationship of car fuel price to rail demand. Increasing of car fuel price (either due to global market or government’s removal of the subsidy) should hypothetically increase train patronage.
1. Literature Review on global PED
2. On-line Survey: Stated Preference
3. Regression from existing data:
Cross elasticity is calculated using an equation that consists of several components. These components are partly review from literature to compare other international values followed by a re-calculation using method described below. A crucial part of this study is an online survey to deduce the diversion factor; non-payable option of cost car-fuel is hypothesized.
(Source: DOSM) 0
0.1
0.2
0.3
0.4
0.5
0.6
0.7
19
80
19
84
19
88
19
92
19
96
20
00
20
04
20
08
20
12
Pumpprice forgasoline(US$ perliter)(Source:WorldBank)
0
20000
40000
60000
80000
100000
120000
140000
160000
180000
0
500
1000
1500
2000
2500
19
80
19
82
19
84
19
86
19
88
19
90
19
92
19
94
19
96
19
98
20
00
20
02
20
04
20
06
20
08
20
10
20
12
Length of railway track (km)(Source: DOSM)Roads, total network (km)(Source: World Bank)
Trac
k (k
m)
Ro
ad N
etw
ork
(km
)
-
5,000,000
10,000,000
15,000,000
20,000,000
25,000,000
19
80
19
86
19
92
19
98
20
04
20
10
Cars
Motorcycle
Other Vehicles
Goods Vehicle
Bus
Taxi and PrivateHire
Mileage travelled Deduction from Retails Fuel Sold – considering fractioning to cars and yearly fuel consumption, calibrated with VehicleKilometerTravelled (recent Survey)
Pump Fuel Price Considering Consumer Price Index
Registered Vehicles over time

Background
How Good the SATURN Model Representing the Network Impact of Lendal Bridge Closing Trial?
Objective
Scope of Study • Study area confined by the
ring road (A64 and A1237) • Access crossing Ouse River
A. Rawcliffe Bridge B. Clifton Bridge C. Lendal Bridge D. Ouse Bridge E. Skeldergate Bridge F. A64
Data • Survey Manual Classified Counts Survey has been conducted every autumn (September, October, November) Record bridge crossings activity for 12 hours (07:00-19:00) Data available motorised vehicle, bicycles and pedestrian However exact survey location is unknown
• Automatic Traffic Count Data ATC location spread around the study area Record vehicle, cycle and car park
• Network model and Trip Matrix of York City • Journey time data from Trafficmaster • However, data only limited to traffic count and journey time without specific
detail to each vehicle (GPS or Number Plate)
• Lendal Bridge Closing Trial 27th August 2013 until 26th February 2014. 10:30 until 17:00 closure limited to cars, lorries and motorbike (www.york.gov.uk/)
• SATURN (Simulation and Assignment of Traffic to Urban Road Networks) Transportation network analysis program developed at Institute for
Transport Studies, University of Leeds Generalised Cost, 𝐶 = 𝛼𝑇 + 𝛽𝐷 (α = PPM and β = PPK) while T and D
denotes travel time and distance is the basic principle of route choice Combined assignment and simulation model
Methodology Data Description
Pujas Bakdirespati [email protected] (200792978) MSc. Transport Planning and Engineering
0100200300400500600
North 2012 North 2013
24 Hour Bridge Traffic Load Proportion
Lendal Bridge Traffic Flow
ATC Data Difference 2013 to 2012
Before the Closing
Difference
York Network
Supervisor: Dr. David Milne
21.91%
11.46%
7.29% 8.83%
13.74%
36.77% 22.08
%
12.00%
4.94%
7.87%
14.65%
38.44%
22.81%
12.51%
3.47% 8.15%
15.57%
37.49%
21.25%
11.42%
6.63%
7.56%
13.59%
39.54%
Rawcliffe Bridge
Clifton Bridge
Lendal Bridge
Ouse Bridge
Skeldergate Bridge
A64
2012
2013
Bridge Open
Bridge Closed
-16.00%
-11.00%
-6.00%
-1.00%
4.00%
9.00%
14.00%
19.00%
Direction 1 Direction 2
-16.00%
-11.00%
-6.00%
-1.00%
4.00%
9.00%
14.00%
19.00%
Direction 1 Direction 2
0100200300400500600
South 2012 South 2013
Lendal Bridge Select Link Assignment
11:00-17:00 Peak
• To compare route choice between the result of SATURN model and observation data, which in this case the comparison could be divided in two steps: Route choice before the closing of Lendal Bridge trial, where the SATURN model will be calibrated with journey time and flow
data in order to better reflect the condition Route choice after the closing of Lendal Bridge trial, where the SATURN model is slightly modified at Lendal bridge where it is
banned in two way with exemptions of bus, while during the closing condition could be interpreted as evolving condition throughout the time
• By using 𝛼
𝛽 indicates ratio of PPM and PPK without knowing the value of both which believed to be appropriate as variable to
conduct sensitivity testing to calibrate the model
Comparison of Traffic Flow and Travel Time
Between Forecast and Observation Data
The first step of research methodology will focused on the route choice at before closing condition with available SATURN model. Subsequently, will be compared with the real condition of route choice which acquire from link flows and travel time data to find a better value of ratio
𝛼
𝛽. There are possibilities of step repetition
as we would calculate the correct ratio for SATURN model.
Second step similar with the first step however, the SATURN model is completely new with slight modifications made at the network.
Consequently, the last step of research is to compare the route choice in both condition and made analysis on the main findings
There is possibility of data collection to support hypothesis in findings
Secondary Data
Step 1
York City
Network Before
the Trial
O-D Matrix of
York City
SATURN Software
Forecast of Traffic Flow Each Link
Step 2
York City
Network After
the Trial
O-D Matrix of
York City
SATURN Software
Forecast of Traffic Flow Each Link
Comparison of Traffic Flow and Travel Time
Between Forecast and Observation Data
Main Findings
Comparison of Route Choice Between
Forecast and Observation Data

DISSERTATION POSTER Topic Implementation of National Urban Transport Policy of India 2006:
Progress and Prospects in improving Public Transport, By: Paulose N Kuriakose 200745484Progress and Prospects in improving Public Transport, By: Paulose N Kuriakose 200745484

Ex-post versus Ex-ante Appraisal of High Speed Train Projects:
Case Study on Ex-post Analysis of Turkey HST Projects Seher Demirel Kutukcu, (MA) Transport Economics
Supervisor: Dr James Laird
Feasility studies of the projects
Passenger numbers, fares, time savings
Operation and maintanence costs
Before and after mode shares
Load factors, delays in service (Reliability)
Realized construction costs
Conventional Appraisal Topics: WebTag
Guidelines and Worldbank
(Elasticity of demand for Ankara-Konya: literature)
( Value of time for both projects: literature )
Wider Social Impacts: TAG unit A2-1 and
NCHRP spreadsheet tool
Impacts on GDP: Literature
Answering following questions:
Do HSR projects in Turkey provide social benefits?
Does it worth working on wider impacts considering their complexity?
Are there good applications in the world?
Is there any optimism bias in the case study Cost Benefit Analyses
(CBA) and what are the reasons for deviations?
Have case study project objectives been achieved? If not why not?
How can ex post cost benefit analyses (CBA) contribute to the
practice of ex ante cost-benefit analysis?
2. Background
1. Motivation Huge investments to HSR projects
Need for prioritization of projects
Problems in monetizing all benefits and costs
Increasing investments in railway sector in Turkey
No ex-post transport infrastructure appraisal in
Turkey yet
Utilization of EU funds require ex-post analysis
Appraisal systems: UK Transport (WebTag),
European Commission (DG Regio and DG
Mobility and Transport), EIB, Worldbank (for low
and mid-income countries)
No standard definition on HSR.
Available case studies in Turkey with accessible
data ( Ankara-Eskisehir and Ankara-Konya)
Ankara-Eskisehir
Allocations to Railways in Turkey (Million TL)
Mode Shares Before and After Ankara-Eskisehir HSR Project
4. Scope and Methodology
3. Objectives
Case Study HSR Lines and Connected Cities
Ankara-Eshisehir Realized Monthly Passenger Numbers
1 2 3 4 5 6 7 8 9 10 11 12 1 2 3 4 5 6 7 8 9 10 11 12
Ankara-Konya Realized Monthly Passenger Numbers
5. Data

Prepared by : Gethin Shaji
Supervisor : Jeremy Shires
Co-Supervisor : Prof. Mark Wardman
BACKGROUND
• Desirable change in patronage can be achieved
through bus design changes.
• Like soft factors, impact of bus design on
patronage is hard to measure and quantify.
• Route 72 bus runs along Leeds-Bradford corridor.
• Other bus services along this corridor are:
(1) X6
(2) X11
(3) X14/14
(4) 508
• The Leeds City Region (LCR) generates 140,000
road trips daily.
• The modal split along this corridor is as follows:
Car – 68% Bus – 19% Train – 3%
• In Oct. 2012, Hyperlink bus service was introduced
along this corridor.
• Key features of the Hyperlink buses are:
(1) Tram like design
(2) Modern leather seats with new seating
layout
(3) Free Wi-Fi facility
(4) On-board Real Time Information
(5) On-board host based ticketing
ROUTE MAP
OBJECTIVES
• Examine and analyse ticket sales data to observe
any quantifiable relation with bus design
• Estimate the impact of bus design on
(1) Existing bus services
(2) Generational effect
(3) Passenger behaviour
• Observe relation between bus design improvement
and change in demand
METHODOLOGY
DATA COLLECTION
• Time period : 2011-2014
• The following buses are considered as they share
part of the Leeds-Bradford corridor:
(1) H72
(2) X6
(3) X11
(4) X14/14
(5) 508
• The following data is to be collected:
(1) Changes in endogenous variables ,
e.g. fares, frequencies, journey times etc.
(2) Changes in exogenous variables,
e.g. the economy etc.
(3) Passenger behaviour data from surveys
ISSUES AND EXPECTED FINDINGS
1 • Historical analysis of bus routes from 2011 along
the Route 72 corridor
2 • Analysis of ticket sales data for the buses
competing along this corridor before and after the introduction of Hyperlink service
3 • Identify different demand impacts :
(1) General trends
(2) Abstraction from other bus services
(3) Generation, e.g. new and existing bus users
4 • Analyse existing survey data and conduct new
passenger survey to help understand these trends and passenger behaviour
5 • Attribute changes in demand to changes in bus
design
• Issues :
(1) How comprehensive is the ticket data ?
(2) How stable have the bus services/routes been
since 2011 ?
(3) How detailed are existing passenger surveys ?
• Expected findings :
(1) Small rise in patronage through generation
(2) Small to medium rise in patronage through
abstraction
BUS DESIGN AND IMPACT ON DEMAND

Background
Objectives
Methodology
• Identify current modelling/microsimulation approaches toshared space particularly interactions between motorvehicles and pedestrians
• Assess a shared space option for the Shipley junction andimprove the parameters in the current vehicle andpedestrian microsimulation model with the help of collecteddata to test, verify and validate the model
• Assess the emission levels of the Shipley junction using theemissions model, and compare this with the signalisedoption for the Shipley junction
• Develop general guidance that can be provided for modellingShared Space
By Samuel Oswald, [email protected]
Current ModelReferences
No Road Markings
Emissions modelling
The emissions model being used PHEM is a comprehensivepower instantaneous model with can simulate fuelconsumption and various emissions such as NOx, ParticulateMass (PM10), Carbon monoxide etc. for cars and light vehiclessecond-by-second.
The model requires 1Hz speed data, road gradient and thevehicle specification. In this case the speed data and vehiclespecifications will be taken form the AIMSUN model and roadgradient form Google Earth terrain data. The AIMSUN modelwill also be used to predict the proportion of emissionscontributed by each vehicle type (Tate, 2013).
Hans Monderman first pioneered the concept of shared space,whereby removing traffic lights, signs, crossings, road markingsand even curbs. Pedestrians, motorists and cyclists are requiredto negotiate their way through streets by reacting with oneanother (Projects for Public Spaces, 2002).
These types of schemes have been implemented worldwide,with schemes becoming increasingly popular in the UK.
In 2011 the Department for Transport issued a Local TransportNote to aid with the design of the these types of schemeshowever the guidance contains minimal advice onmicrosimulation/modelling. Yet clients are increasingly askingfor models to prove designs work.
There has also been relatively little research into whether thistype of scheme has different affects on emissions compared toother junctions types.
No Traffic SignsNo Raised Curbs
AN INVESTIGATION INTO THE CURRENT TECHNIQUES USED TO MICROSIMULATE SHAREDSPACES AND THE IMPACT OF SHARED SPACES ON EMISSION LEVELS
Resize currentmodel to the
corridor required
Validate theresized model bycomparing GEH
Calibration datafrom old model
Ensure GEHanalysis meetsDepartment for
Transportguidelines
Assess the vehicletrajectories anddynamics in the
model
Compare the twosets of data
Adjust the modelparameters to
mimic the real lifedata
Collectreallifetrajectoryanddynamicsdatausingvehicle
tracking
Clear model of allcurbs road
markings andcrossings
Evaluate howthese vehicle
movements canbe applied to thejunction layout
Study currentshared space toascertain vehiclemovements
Adjust the modelto representshared space
Calibrating the Base model
Vehicle Dynamics
Run AIMSUNwith 0.5 timestep withoutLEGION
Run PHEM model for shared space model
and signalised base model
Run AIMSUN with0.6 step with
LEGION Google EarthTerrain data
Interpolate dataso it is in 1Hzform for PHEM
Coding the Shared space option Figure 3: Time series plots of PHEM result for Euro 5 Bendy-Bus
Projects for Public space (2002) Hans Monderman, Availableonline: http://www.pps.org/reference/hans-monderman/
J. Tate (2013) Project Report: York Low Emission ZoneFeasibility Study – Vehicle Emission Modelling
Figure 2: Example of Shared space
Figure 1: Shipley AIMSUN with LEGION Base model

Price elasticity of demand in suburban railways in
India – A case study of four cities Syed Abdul Rahman, (MA) Transport Economics
Supervisor: Dr Narasimha Balijepalli
• Importance of Suburban railways in India in passenger
transportation.
• Significance of passenger demand forecasting in transport
planning, service provision and infrastructure development
• Key role of elasticity in forecasting demand
• Lack of economic rationale in policy decisions
Complete government ownership
High population growth
High growth in car-ownership
Fiscal pressure on Governments
Need to attract private investments
MRTS programs in the major cities
Dynamic pricing in Indian railways
4.Scope • Four biggest cities of India: Mumbai, Chennai,
Delhi and Kolkata
• Time series data of 25 years
5. Data • Panel data (4 cities, 25 years)
• Originating passengers, vehicle KM and fare per
passenger per KM from 1988 to 2012
• Data on population, income and fuel costs
6.Methodology Concept and different methods of elasticity
Decide on demand estimation models
Time series regression on each individual city
Linear regression on 4 cities using panel data
Comparison of individual estimates with
combined estimates and other studies
Evaluation of available forecasts of a city and
assessment of impacts on policies regarding
infrastructure development
7. Risks a) Omitted variables
b) Lack of studies on developing countries
c) Income Vs suburban rail journey
8.References Balcombe R. et al., (2004), The Demand for Public Transport: A
practical Guide, TRL Report, TRL593
3.Objectives/Output To estimate fare elasticity of suburban rail passengers
To compare the estimated elasticity with other studies.
To suggest possible uses of elasticity values (i.e. demand forecasting)
To critically assess perspective plan of one city
To highlight possible policy implications
To provide input to infrastructure planning
Demand model:
α = constant; β = fare elasticity; γ = elasticity of population, income and fuel costs; δ =
sensitivity of current demand with respect to demand in t-1
V = passenger km (dependent variable)
F = Fare
Z = Vector of population, income and fuel costs of the cities
i = city; and t = time
1. Motivation
2.Background
Mumbai Chennai

• The construction of roads could be traced
to 312 BC when Romans built roads to
connect major cities within their empire.
These roads were regularly maintained.
• Pavement rehabilitation and construction
are very expensive and do not create room
for trials.
• Pavement evaluation provides information
to ascertain the type of maintenance
activity to be carried out.
An Examination and Application of Flexible Road Pavement Evaluation Methods:
A review of the methods and application to roads in Sierra Leone
1. Background
2. Objectives • To identify relationships between the
evaluation methods of flexible pavement.
• To locate and determine the seriousness of
the pavement distresses on the selected
roads.
• To determine possible structural surveys
and/or laboratory tests to be carried out.
• To ascertain the ‘present serviceability
rating (PSR)’ and the ‘pavement condition
score (PCS)’ for the selected roads.
Transverse Crack Longitudinal Crack
Rutting Patches
Alligator Cracking
Pothole
7. Methodology
Pavement Distresses on roads
• The present serviceability index would give an indication
of the ride quality of the road.
• The present condition score would indicate the extent and severity of the distresses on the road.
4. Why determine ‘PSR’ and ‘PCS’ ?
5. Selected Roads
By Serrie Henry Willoughby MSc(Eng) Transport Planning and Engineering Mr. David Rockliff (Supervisor), Prof. Anthony Whiteing (2nd Reader )
• A comparison between the UK methods and that
specified in the oversees ‘Road Note 18’ for tropical
countries would be considered in this work.
• The PSR would be obtained from highways engineers,
commercial and private drivers.
3. Scope
The relationship between the different types of evaluation method shall be obtained by review of literature.
The positions of distresses shall be obtained by the use of a hand held GPS device and wheel meter.
The pavement serviceability index shall be assessed by
driving through the road and rating the ride quality on a scale
of 0 – 5: were ‘0’ would indicate very poor and ‘5’ would mean
very good.
The pavement condition rating would be obtained by noting
the extent and severity of distresses and calculating the
index using the equations in the FHWD manual as outlined
below:
PCR = 100 - [(100 - AC_INDEX) + (100 - LC_INDEX) + (100 - TC_INDEX) + (100 -PATCH_INDEX) + (100 - RUT_INDEX)] • Scale: POOR (<=60), FAIR (61 - 84), GOOD (85 - 94) , EXCELLENT (95 - 100
The selected roads are Old railway
line , Pademba road and Benjamin
lane in Freetown, Sierra Leone.
Original Pavement Design and Construction Records
Analysis Establish Probable
Causes of Pavement Distresses Observed Pavement
Distresses
Field Tests Surface Condition
Roughness Deflection
Frictional Resistance
Field Samples Laboratory
Evaluation Rehabilitation
Alternatives Based on Pavement Design
Principles
Background Maintenance Performance Geometrics
Environment Traffic
Economics
Thin/ Thick Overlay
Inlay
Recycling
Reconstruction
Pavement Evaluation
Performance Condition Safety
Structural Material
6. Evaluation for Rehabilitation
Location Referencing

The hypotheses
Open access operators exhibit the same cost
characteris1cs as franchised operators
Open access operators have lower input costs than franchised
operators
Open access operators have lower staff costs than franchised
operators
Scale and density effects dominates lower input costs
The background
Data
Open access Franchises
Scale effects?
Density effects
Other efficiency gains?
Lower input costs?
The objec?ve The paper will seek to answer two major ques1ons: • Does open access operators face a different cost
func?on from that of franchised operators? and
• Does other efficiency gains and/or lower input costs outweigh the scale and density effects?
The separa1on of rail infrastructure and train opera1ons, is making the passenger rail market less monopolis1c. Governments can open for either compe11on-‐for-‐the-‐market or compe11on-‐in-‐the-‐market. The former is through franchise or tender compe11ons for a train opera1on monopoly. In the laFer model, companies run services on their own risk and in compe11on with each other. Research on franchised passenger rail opera1ons done in the UK by Wheat and Smith (2014) has shown that there are strong economies of density (number of trains run per kilometre of track) and in some cases significant scale effects (route network size) in the industry. However, this research did not account for open access opera1ons. With a growing market for such opera1ons in Europe, it is important to establish whether open access opera1ons exhibit different characteris1cs from franchised operators. The answer may provide a guide to whether head on open access compe11on will bring benefits, or if we are beFer off following the UK prac1ce of only allowing non-‐abstrac1ve services.
United Kingdom – non-‐abstrac1ve
services since 2000
Sweden – head on compe11on since
2010, major increase expected in 2015
Czech Republic – head on compe11on
since 2011
Interna1onal open access opera1ons liberalised in 2010
Austria – head on compe11on since
2011
Italy – head on compe11on since 2012
Germany – head on compe11on since
2012\
Dates determined by start of first services as recorded by Railway GazeFe Interna1onal online. Flags sourced from na1onalflaggen.de
Current open access opera?ons
Econometric analysis of open access railway operators’ compe??veness
Data • Collect and structure data for use in model.
• Need to be to the same format as data used in earlier research to ensure comparability
Model • Using hedonis9c cost model for heterogeneous outputs developed by Wheat and Smith (2014)
• This will provide me with a cost func9on for open access operators
Tes?ng • Is the cost func9on for open access operators different from that of comparable franchised operators?
• If using the input/staff costs of franchises, would the costs of open access increase?
• Does the lower input costs make up for the change in scale and density effects?
The Methodology
Due to open access operators only being responsible for a minor frac1on of the traffic on the Bri1sh network, there is a risk that size and form of the sample will limit the transferability of the results. However, the results should indicate whether there are structural cost advantages to be exploited, as well as formalising the cost structure of small rail operators in the United Kingdom.
Risks
By Tørris Rasmussen Supervisor: Phil Wheat
Output metrics such as train hours, train kilometres and route kilometres, and input metrics such as vehicles per train, vehicle type and top speed will be sourced from 1metable data from the Department for Transport. The minimum require data has been secured. Cost input data will be sourced from respec1ve companies’ annual accounts posted with Companies House and publicly available.
Alexandersson, G., 2010. The Accidental Deregula9on -‐ Essays on Reforms in Swedish Bus and Rail Industries 1979-‐2009. Ph.D thesis: University of Stockholm. Wheat, P. & Smith, A., 2014 Forthcoming. Do the usual results of railway returns to scale and density hold in the case of heterogeneity in outputs: A hedonic cost func9on approach. Journal of Transport Economics and Policy MVA Consultancy, 2011. Modelling the Impacts of Increased On-‐Rail Compe99on Through Open Access Opera9on, London: MVA Consultancy.
Major sources consulted

Sustainable Aviation: Evolution of China’s Aviation Industry (Markets and Fleet) STUDENT: Wendy Dzifa Wemakor
SUPERVISORS: Professor Andrew L. Heyes & Dr Zia Wadud
Introduction
Currently, China’s domestic fleet is made up of two aircraft types , turboprops and regional jets. There are a total of 725 flight routes of which 655 flights are served by regional jets and 70 by turboprops (Ryerson and Ge,2014). As cities and personal wealth increases, so will the intensity of human interactions with the result that there will be and increase in demand for air travel. The aircraft will have to grow and evolve to meet the need.
Objectives China’s aviation industry is a significant contributor to its economy. In 2010, the industry contributed about 1% of total GDP and 296 million passengers and 11 million metric tons of freight travelled to, within and from China (IATA,2012).Tremendous growth in China’s aviation industry is expected by 2020 and will take the highest value of aircraft deliveries in the period as predicted by Boeing and Airbus, the world’s largest manufacturers of aircrafts.
To develop a representative model of the development of air travel in China in order to • assess the world fraction of China’s aviation
market and how it will change over the next two decades.
• determine the optimum aircraft fleet to meet China’s air travel demand in the most energy efficient way.
• compare air travel between China’s cities with the High Speed Rail from an energy perspective
The demand Dij between cities i and j is calculated using a simple one-equation gravity model of the form
𝐷𝑒𝑚𝑎𝑛𝑑 𝐷𝑖𝑗
= 𝐾 ∗ 𝑝𝑜𝑝𝑖𝑝𝑜𝑝𝑗𝛼∗ 𝐺𝐷𝑃𝑖𝐺𝐷𝑃𝑗
𝛽∗ 𝑐𝑜𝑠𝑡𝑖𝑗
𝛾
The forecast will help determine fleet type to meet demand from an energy perspective.
Methodology
Analysis of Air Travel Demand Model
Optimization of Fleet Type
Comparison of Results
Air Travel and HSR
Discussions and Conclusion
Gravity Demand Model
Optimization of Fleet to Meet China’s Demand
Expected Output
Regional Jet / HSR/ Turboprop?
It is hoped the study will allow conclude whether or not aviation is the optimum way to link China’s vast growing cities and how it can be integrated with other transport modes like the high speed rail to form a sustainable transport system
What w
ill it be?
2013/14
Figure 1: Aircraft demand in global aviation market (Airbus, 2012)
Reference • Airbus. 2012. Global Market Forecast 2012-2031. • International Air Transport Association. 2012. Special
report: Chinese aviation. A New Era in Aviation. • Ryerson, M. S. and Ge, X. 2014. The role of turboprops
in China’s growing aviation system. Journal of Transport Geography.

How Advanced Ticket Purchase Influences
Yield Management In Rail Market?
Yield management originated with the deregulation of the US
airline industry in the late 1970s.
Railroads have offered a limited number of tickets online at a
discounted price in advance.
•The PEP system offered base fares as well as early booking
discounts of 40%, 25%, or 10%.
BACKGROUND
To investigate yield management in rail market;
To investigate what impact risk has on the decision whether to
purchase a ticket in advance or not;
To help understand how to maximise the revenue of rail
companies and how this conflicts with the benefits for
passengers;
To calibrate the existing PRAISE model in modelling advanced
ticket purchase to be more realistic.
OBJECTIVES
METHODOLOGY
Analyse the Value of
Advanced Ticket Purchase Analyse the disadvantages
Reveal economic benefits
Collect the ticket prices online for
One and Two months in advance
Existing PRAISE Model:
Demand Model Structure 𝑷𝒕𝒊𝒄𝒌𝒆𝒕 = 𝑷′𝒓𝒂𝒊𝒍𝑷𝒕𝒊𝒄𝒌𝒆𝒕|𝒓𝒂𝒊𝒍
Multinomial Logit Model
𝑃𝑡𝑖𝑐𝑘𝑒𝑡|𝑟𝑎𝑖𝑙 =exp(𝑼𝒕𝒊𝒄𝒌𝒆𝒕)
exp(𝑈𝑡𝑖𝑐𝑘𝑒𝑡′)𝑡𝑖𝑐𝑘𝑒𝑡′∈𝑁
Incremental Logit model
𝑃′𝑟𝑎𝑖𝑙=𝑃𝑟𝑎𝑖𝑙exp(∆𝑈𝑟𝑎𝑖𝑙)
1−𝑃𝑟𝑎𝑖𝑙 +𝑃𝑟𝑎𝑖𝑙exp(∆𝑈𝑟𝑎𝑖𝑙)
Upper Level
Lower Level
Fare
Function
𝑵𝒆𝒘 𝑼𝒅𝒂𝒕𝒆
𝑮𝑪𝒅𝒂𝒕𝒆=𝑭𝒅𝒂𝒕𝒆 + 𝒗𝒐𝒕 ∗ 𝑮𝑱𝑻𝒅𝒂𝒕𝒆 + 𝑨𝑷
𝑨𝑷—Advanced Purchase Penalty
𝑭𝒅𝒂𝒕𝒆—Fare Function deduced by data
A Route on High Speed Rail Network in an European Country
Data Collection
Calibrate PRAISE model 𝑷𝒅𝒂𝒕𝒆 = 𝑷′𝒓𝒂𝒊𝒍𝑷𝒅𝒂𝒕𝒆|𝒓𝒂𝒊𝒍
CASE STUDY
• Devise Scenarios involving different levels of fare adjustment to analyse different
yield management systems;
• Calculate the Revenues and Demands for different Scenarios;
• Compare with the Base Scenario (current fares) to put forward Price Suggestions.
Xinghua Zhang -MSc (Eng) Transport Planning and Engineering Supervisor : Daniel Johnson
E-mail: ml12xz@ leeds.ac.uk Institute for Transport Studies University of Leeds 05 - 2014

Yodya Yola PratiwiSpeed Limits for UK Motorways:a case study of increase the speed limit
Yodya Yola PratiwiSpeed Limits for UK Motorways:a case study of increase the speed limit
Yodya Yola PratiwiSpeed Limits for UK Motorways:a case study of increase the speed limit
Yodya Yola PratiwiSpeed Limits for UK Motorways:a case study of increase the speed limit
Yodya Yola PratiwiSpeed Limits for UK Motorways:a case study of increase the speed limit
Yodya Yola PratiwiSpeed Limits for UK Motorways:a case study of increase the speed limit
Yodya Yola PratiwiSpeed Limits for UK Motorways:a case study of increase the speed limit
Yodya Yola PratiwiSpeed Limits for UK Motorways:a case study of increase the speed limit
Yodya Yola PratiwiSpeed Limits for UK Motorways:a case study of increase the speed limit
Yodya Yola PratiwiSpeed Limits for UK Motorways:a case study of increase the speed limit
Yodya Yola PratiwiSpeed Limits for UK Motorways:a case study of increase the speed limit

Electric Bikes: a solution to hills? Lessons from case of China
.
In the chart, the growth rate of E-bikes was predicted to
show a sharply increase in Western Europe while the
others remain stable from 2013 to 2020.
Easily found in the terrain map of UK, the most land of
UK is covered by rugged hills and low mountains,
especially from the middle to the north.
Goodman (2010) has pointed out that E-
bike is a kind of tool which take hills out of
riding. Nowadays, China have the most
amount of E-bikes users which increased
from several thousands to more than 10
million from 1998 to 2005. Although it can
be say that electric bike is one of the best
choices for low income people to travel in
the developing country, the impact of these
much electric bikes is huge and most of the
impacts are negative (Weinert and Ma et al.,
2007, pp. 62--68).
Find out the potential users of E-bikes in
UK, range from different age and gender.
In order to improve the market of E-bikes
in UK, the appropriate price and what will
the consumers consider when deciding to
buy a E-bike should be identified.
The usage of E-bikes.
UK
China
Zhixi Li – [email protected] Msc Transport Planning Supervisor: Frances Hodgson
ITS University of Leeds
Background 1 Objectives 2
Methodology 3
Study of UK
Questionnaire
Classification of Respondents 1 Gender
2 Age
Case Study of China to inform UK
Focus Group
Literature Review
1 Government publication 2 News Report
Potential outcomes 5
Scope 4
UK
Age Gender Standard
20-40 Male • 60 people will be surveyed for each age group, and 30 for each gender.
• Online surveys and practical surveys will be done on the same time for all the age group
Female
40-60 Male
Female
60-80 Male
Female
China (second tier city)
Drivers
Pedestrians and cyclists
China began to produce E-bikes since 1998 and have
the most amount of E-bikes users, increased from
several thousands to more than 10 million in 2005.
Lacking of appropriate improvement strategies and
regulations leads to a lot of traffic congestions and
accidents.
Introduction
E-bike is a kind of tool which take hills out of riding
(Goodman, 2010).
UK government defined Electric bikes as “electrically
assisted pedal cycles”(EAPCs) which should be 2-
wheeled bicycles, tandems or tricycles with a battery
pack and a motor to transfer power.
The definition of E-bikes in China has a greater range,
included E-bikes, E-scooters, Mobility Scooters.
Background of theses two countries
The research will seek to identify the
advantages and disadvantages resulted
from using E-bikes to the citizens of China,
while the reason why E-bikes are so
popular in China will be found.
By review the documents related to E-
bikes in china, find out the potential
problems to the whole transport system,
and make suggestion for an appropriate
improvement strategies and policies.
Most of the young people might use E-
bikes for leisure, therefore E-bikes may be
more popular for elder people, the survey
will help to find the reason of it
Price and safety reasons may be the most
important thing to concern
After the case study of China, Appropriate
policies and improvement strategies
should be determinate and published, in
order to make suggestions for UK
Infrastructure and related facilities would
be well designed and built up before E-
bikes plan being practiced
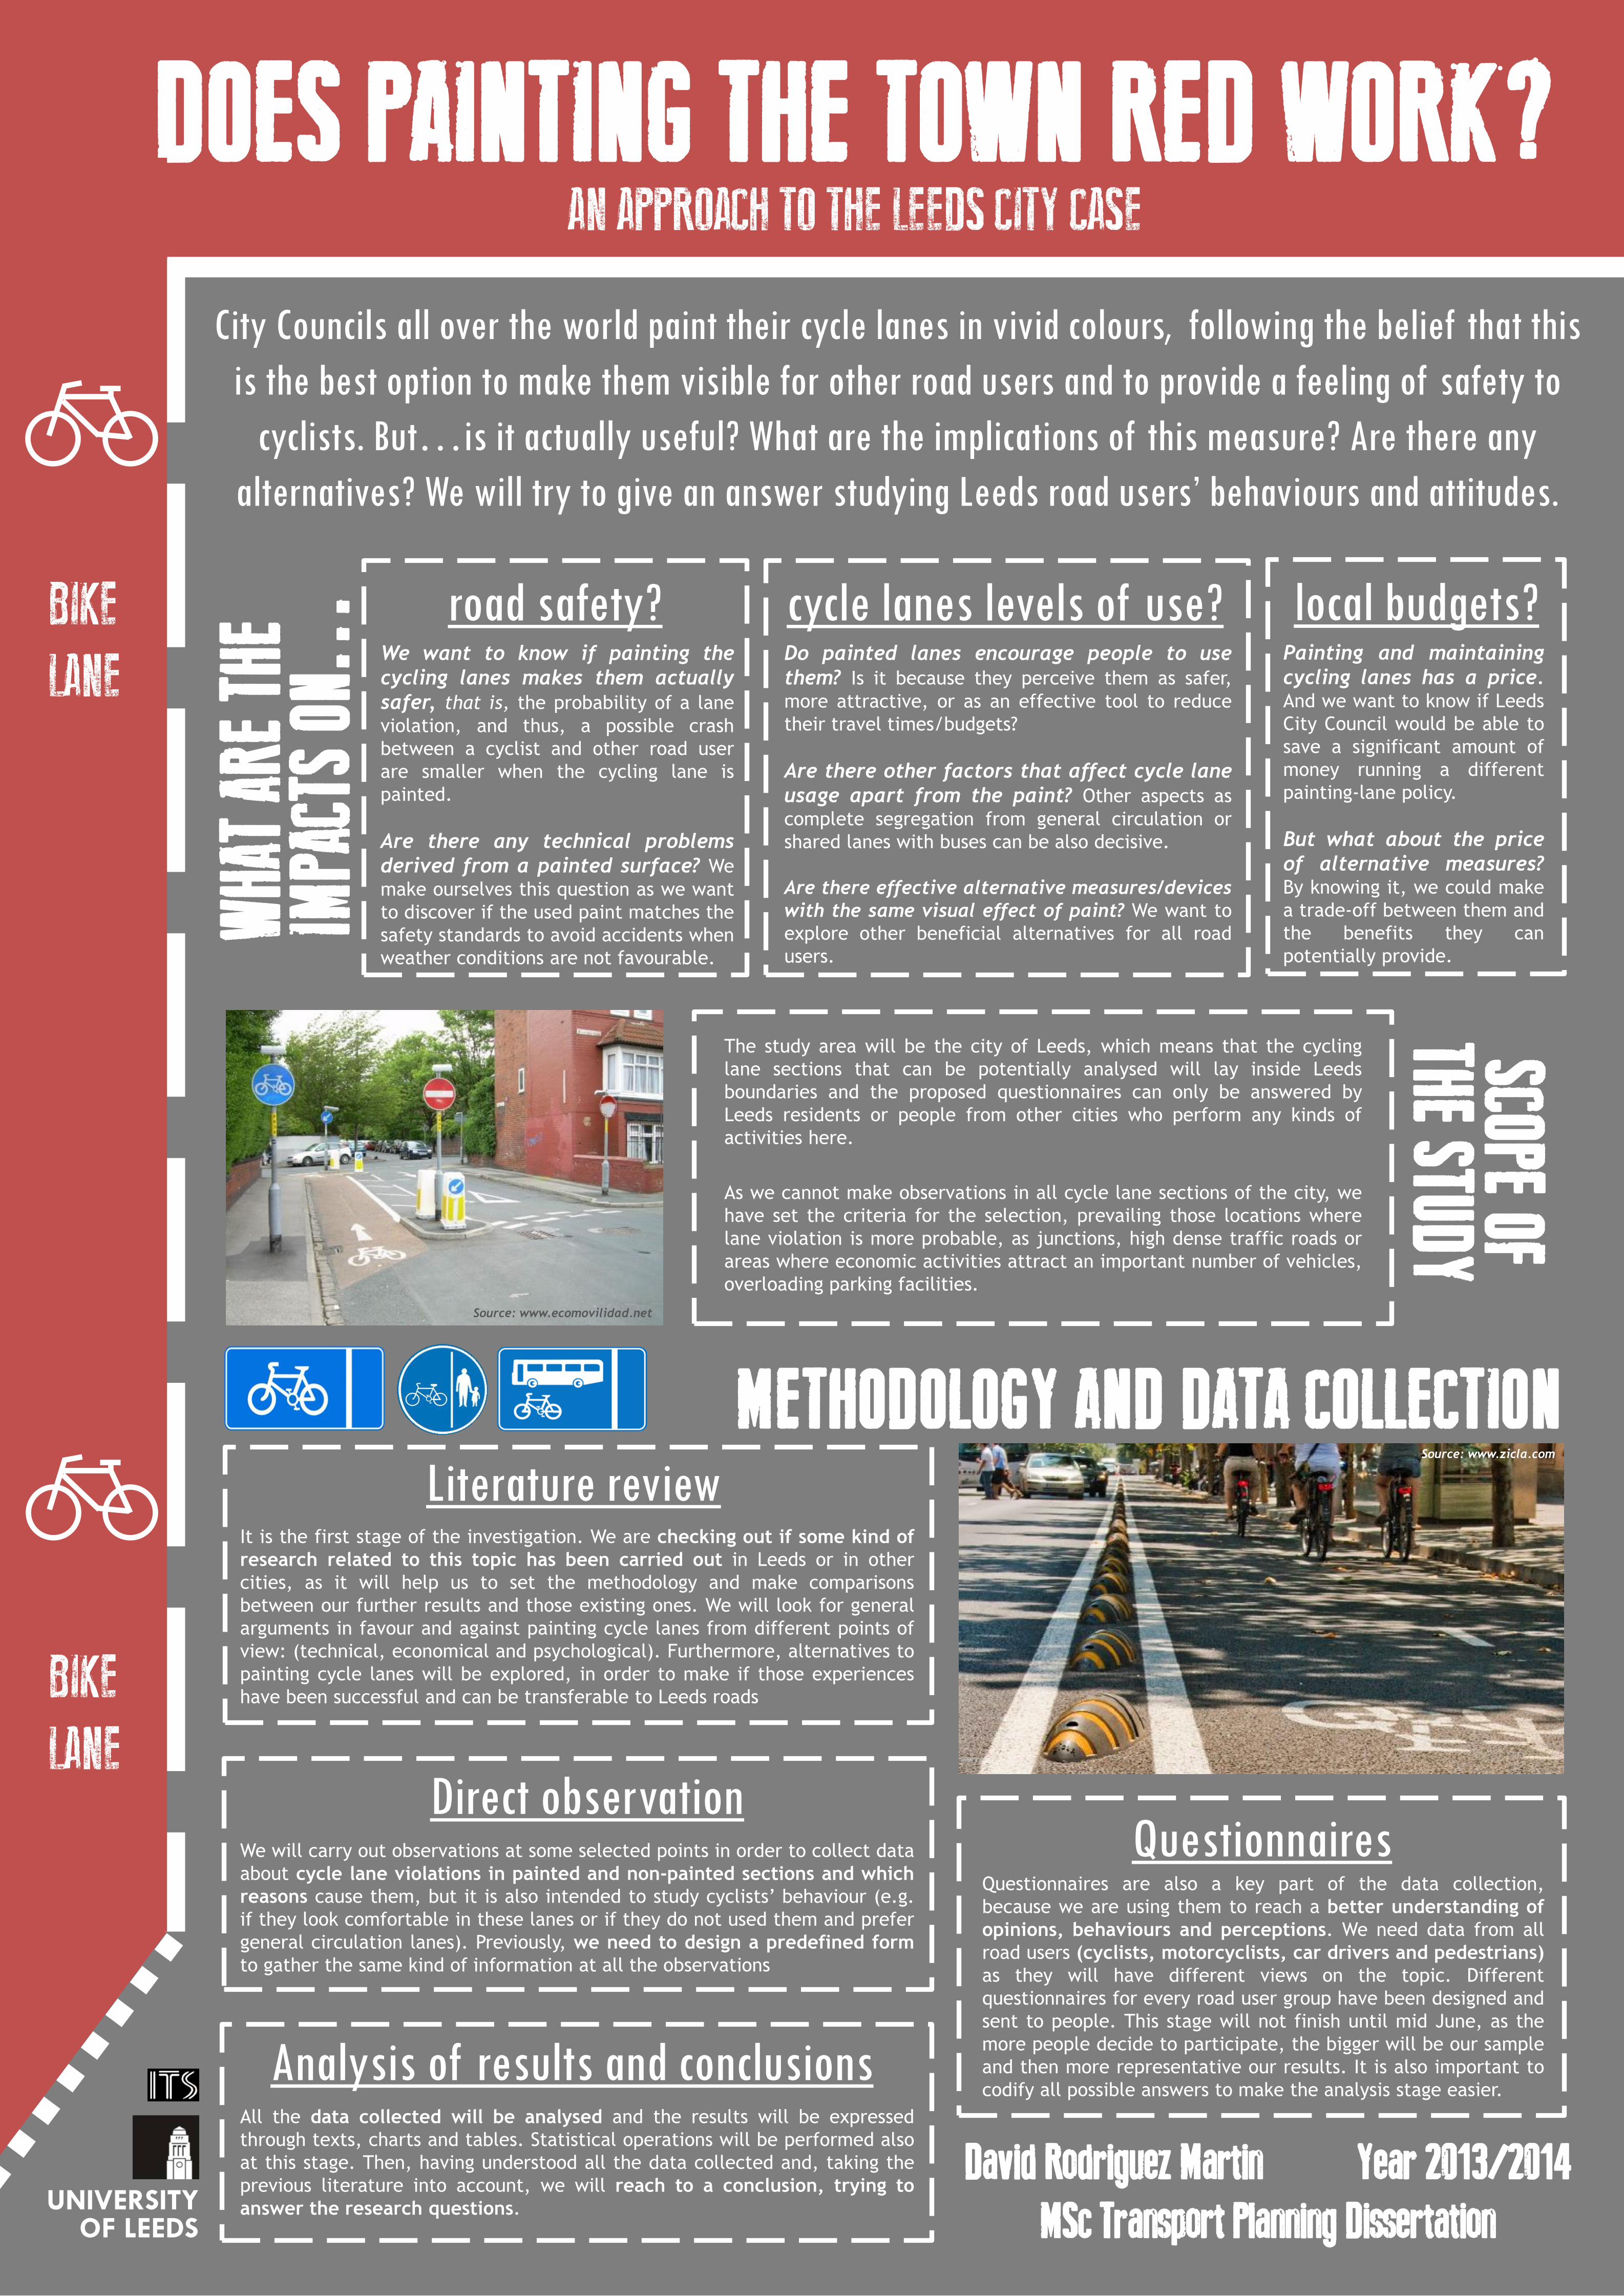
DOES PAINTING THE TOWN RED WORK?
The study area will be the city of Leeds, which means that the cycling
lane sections that can be potentially analysed will lay inside Leeds
boundaries and the proposed questionnaires can only be answered by
Leeds residents or people from other cities who perform any kinds of
activities here.
As we cannot make observations in all cycle lane sections of the city, we
have set the criteria for the selection, prevailing those locations where
lane violation is more probable, as junctions, high dense traffic roads or
areas where economic activities attract an important number of vehicles,
overloading parking facilities.
AN APPROACH TO THE LEEDS CITY CASE
City Councils all over the world paint their cycle lanes in vivid colours, following the belief that this
is the best option to make them visible for other road users and to provide a feeling of safety to
cyclists. But…is it actually useful? What are the implications of this measure? Are there any
alternatives? We will try to give an answer studying Leeds road users’ behaviours and attitudes.
road safety? cycle lanes levels of use? local budgets?
METHODOLOGY AND DATA COLLECTION
We will carry out observations at some selected points in order to collect data
about cycle lane violations in painted and non-painted sections and which
reasons cause them, but it is also intended to study cyclists’ behaviour (e.g.
if they look comfortable in these lanes or if they do not used them and prefer
general circulation lanes). Previously, we need to design a predefined form
to gather the same kind of information at all the observations
It is the first stage of the investigation. We are checking out if some kind of
research related to this topic has been carried out in Leeds or in other
cities, as it will help us to set the methodology and make comparisons
between our further results and those existing ones. We will look for general
arguments in favour and against painting cycle lanes from different points of
view: (technical, economical and psychological). Furthermore, alternatives to
painting cycle lanes will be explored, in order to make if those experiences
have been successful and can be transferable to Leeds roads
We want to know if painting the
cycling lanes makes them actually
safer, that is, the probability of a lane
violation, and thus, a possible crash
between a cyclist and other road user
are smaller when the cycling lane is
painted.
Are there any technical problems
derived from a painted surface? We
make ourselves this question as we want
to discover if the used paint matches the
safety standards to avoid accidents when
weather conditions are not favourable.
Do painted lanes encourage people to use
them? Is it because they perceive them as safer,
more attractive, or as an effective tool to reduce
their travel times/budgets?
Are there other factors that affect cycle lane
usage apart from the paint? Other aspects as
complete segregation from general circulation or
shared lanes with buses can be also decisive.
Are there effective alternative measures/devices
with the same visual effect of paint? We want to
explore other beneficial alternatives for all road
users.
Painting and maintaining
cycling lanes has a price. And we want to know if Leeds
City Council would be able to
save a significant amount of
money running a different
painting-lane policy.
But what about the price
of alternative measures? By knowing it, we could make
a trade-off between them and
the benefits they can
potentially provide.
David Rodriguez Martin Year 2013/2014
MSc Transport Planning Dissertation
WHA
T AR
E TH
E
BIKE
LANE
Questionnaires are also a key part of the data collection,
because we are using them to reach a better understanding of
opinions, behaviours and perceptions. We need data from all
road users (cyclists, motorcyclists, car drivers and pedestrians)
as they will have different views on the topic. Different
questionnaires for every road user group have been designed and
sent to people. This stage will not finish until mid June, as the
more people decide to participate, the bigger will be our sample
and then more representative our results. It is also important to
codify all possible answers to make the analysis stage easier.
SCOPE OF
IMPA
CTS
ON…
THE STUDY
Questionnaires Direct observation
Literature review
BIKE
LANE
All the data collected will be analysed and the results will be expressed
through texts, charts and tables. Statistical operations will be performed also
at this stage. Then, having understood all the data collected and, taking the
previous literature into account, we will reach to a conclusion, trying to
answer the research questions.
Analysis of results and conclusions
UNIVERSITY OF LEEDS
Source: www.ecomovilidad.net
Source: www.zicla.com

ECONOMY ENVIRONMENT
+ Reducing the cost of import fossil fuels + Gaining profit by export biofuels + Reuse abandoned agricultural land − Low energy density of biofuels, lead to more
distances, travel times and labour costs. − Feedstock processing costs
+ Less GHG emission + Carbon negative renewable energy − Extra trips/distances are needed for collecting
feedstock cause greater air pollution − The changes of Land use cause emissions − Decrease biodiversity − Decrease soil, water quality
SOCIETY ENERGY SECURITY
+ Increase employments + The fuel prices become more reasonable − Food security concerns − Poor quality of biofuels decrease the vehicles
performances − The hi-tech vehicles are not affordable for the
whole public, increase the inequality.
+ As an alternative energy source to enhance energy security
− The failure of implement biofuels can weaken energy security
− Hard to forecast if biofuels face the same situation like oil crisis in the future
“4 A
SPEC
TS” OF IM
PAC
TS A
IMS &
OB
JECTIV
ES M
ETHO
DO
LOG
Y
Rose I-Hsuan Lien ([email protected]), Supervised by Dr Anthony Whiteing
iofuel’s issue used to focus on its energy efficiency and the food crisis it might cause. However, how to optimise the supply chain still lack of discussion at present. To illustrate, negative impacts of biofuel supply chain not only need to be recognised but be solved through sustainable ways. The main missions of this supply chain management are to ensure the costs are competitive and the supplies are continuous (Gold and Seuring, 2011; Hess et al., 2007; Sims and Venturi, 2004). The demands of biofuel in Taiwan are increasing. Since the usages of biofuels in Taiwan are still developing, it is an advantage for Taiwan to implement the sustainable strategies into the supply chain.
Harvest & collect
·Feedstock type
·Harvest frequency
·Topography
·Post-harvest process place (bail and chip)
Storage
·Demands & supplies
·Storage facilities
·At farm or storage terminal
·Degradation & dry matter loss
Pre-treatment · Pre-treatment with storage
· Mode: drying, pelletisation
Energy conversion
· Place for refine and blend
Gas station
· The facilities to store biofuels
Consumer
· Vehicle performance
· Vehicle choices
Transp
ort: M
od
e ch
oice
, law &
infrastru
cture
, veh
icles cap
acity
Reference: ①Green Energy Industry Information Net, (2014). Introduction of biofuels Industry. Taiwangreenenergy.org.tw. Available at: http://www.taiwangreenenergy.org.tw/Domain/domain-4.aspx ②Hess, J.R., Wright, C.T., Kenney, K.L., 2007. Cellulosic biomass feedstocks and logistics for ethanol production. Biofuels, Bioproducts and Biorefining 1 (3), 181e190. ③Gold, S. and Seuring, S. 2011. Supply chain and logistics issues of bio-energy production. Journal of Cleaner Production, 19 (1), pp. 32--42. ④IEA. 2013. Tracking Clean Energy Progress 2013. [e-book] Paris: Internation Energy Agency. Available through: Internation Energy Agency http://www.iea.org/publications/TCEP_web.pdf. ⑤Sims, R.E.H., Venturi, P., 2004. All-year-round harvesting of short rotation coppice eucalyptus compared with the delivered costs of biomass from more conven- tional short season, harvesting systems. Biomass and Bioenergy 26 (1), 27e37.
B
1. Case studies: Studying biofuel promoting schemes in developed/emerging/developing countries to compare and organise the implementations under different circumstances. 2. Interviews: To apply potential options to Taiwan, the locals’ opinions and experiences are important. Thus the options will be provided to experts in different areas - academic, planner, government, sustainable workers in Taiwan, and interview them to know the attitudes and possibilities to implement these options.
PROBLEM → APPROACH → SOLUTION → ADAPTION → APPLICATION Understand biofuels implementation
Understand operation processes
Develop sustainable Instruments
Develop options for Taiwan
Summarise the feasibilities of options
①Policies& infrastructures
②Impacts in “4 aspects”
③Future goals & trends
①”Who” drive &“who” are involved
② Operation processes
③Differences between nations
①Instruments integration ②Factors of instrument
choices ③Underlying barriers and
conflicts ④Strengths &
weaknesses in “4 aspects”
①Develop options
②Stakeholders’ viewpoints
①The most and the least feasible options ②Influents of choices ③Conflicts of influents
between different stakeholders
④Improve options: negative↓, positive↑
(Gold and Seuring, 2011)
Case in Taiwan: Bioethanol: (Import only, no local factories (high investment risk)) •07/2009:Taipei&Kaohsiung Metro Area Ethanol Promotion Project, total 14 gas stations supply E3. •2012: 210 kilolitres used.
Biodiesel: (Imported palm oils and local cooking waste oils) 4 stages implement plan: 1.11/2006-06/2008: Green Bus Project, encouraged
buses use B1-B5 biodiesel 2.07/2007-06/2008: Green County Project (B1), in two
counties, the oil companies in these areas were
chosen to blend biodiesels and to sell in the gas station there. B100 biodiesel were refined by Taiwan factories , also energy crops were allocated to plant in fallow farmlands.
3.07/2008: Full implement B1 4.06/2010: Full implement B2 • 2012: 100,000 kilolitres used. • 2014: Poor quality of biodiesels influenced vehicles
performance, government plan to pause B2 projects in June.
• 2016: Full implement B5, estimated 250,000 kilolitres biodiesel required.
(Green Energy Industry Information Net, 2014)
OPERATION ISSUES
Global biofuel productions projections and target.
(Source: IEA, 2013)
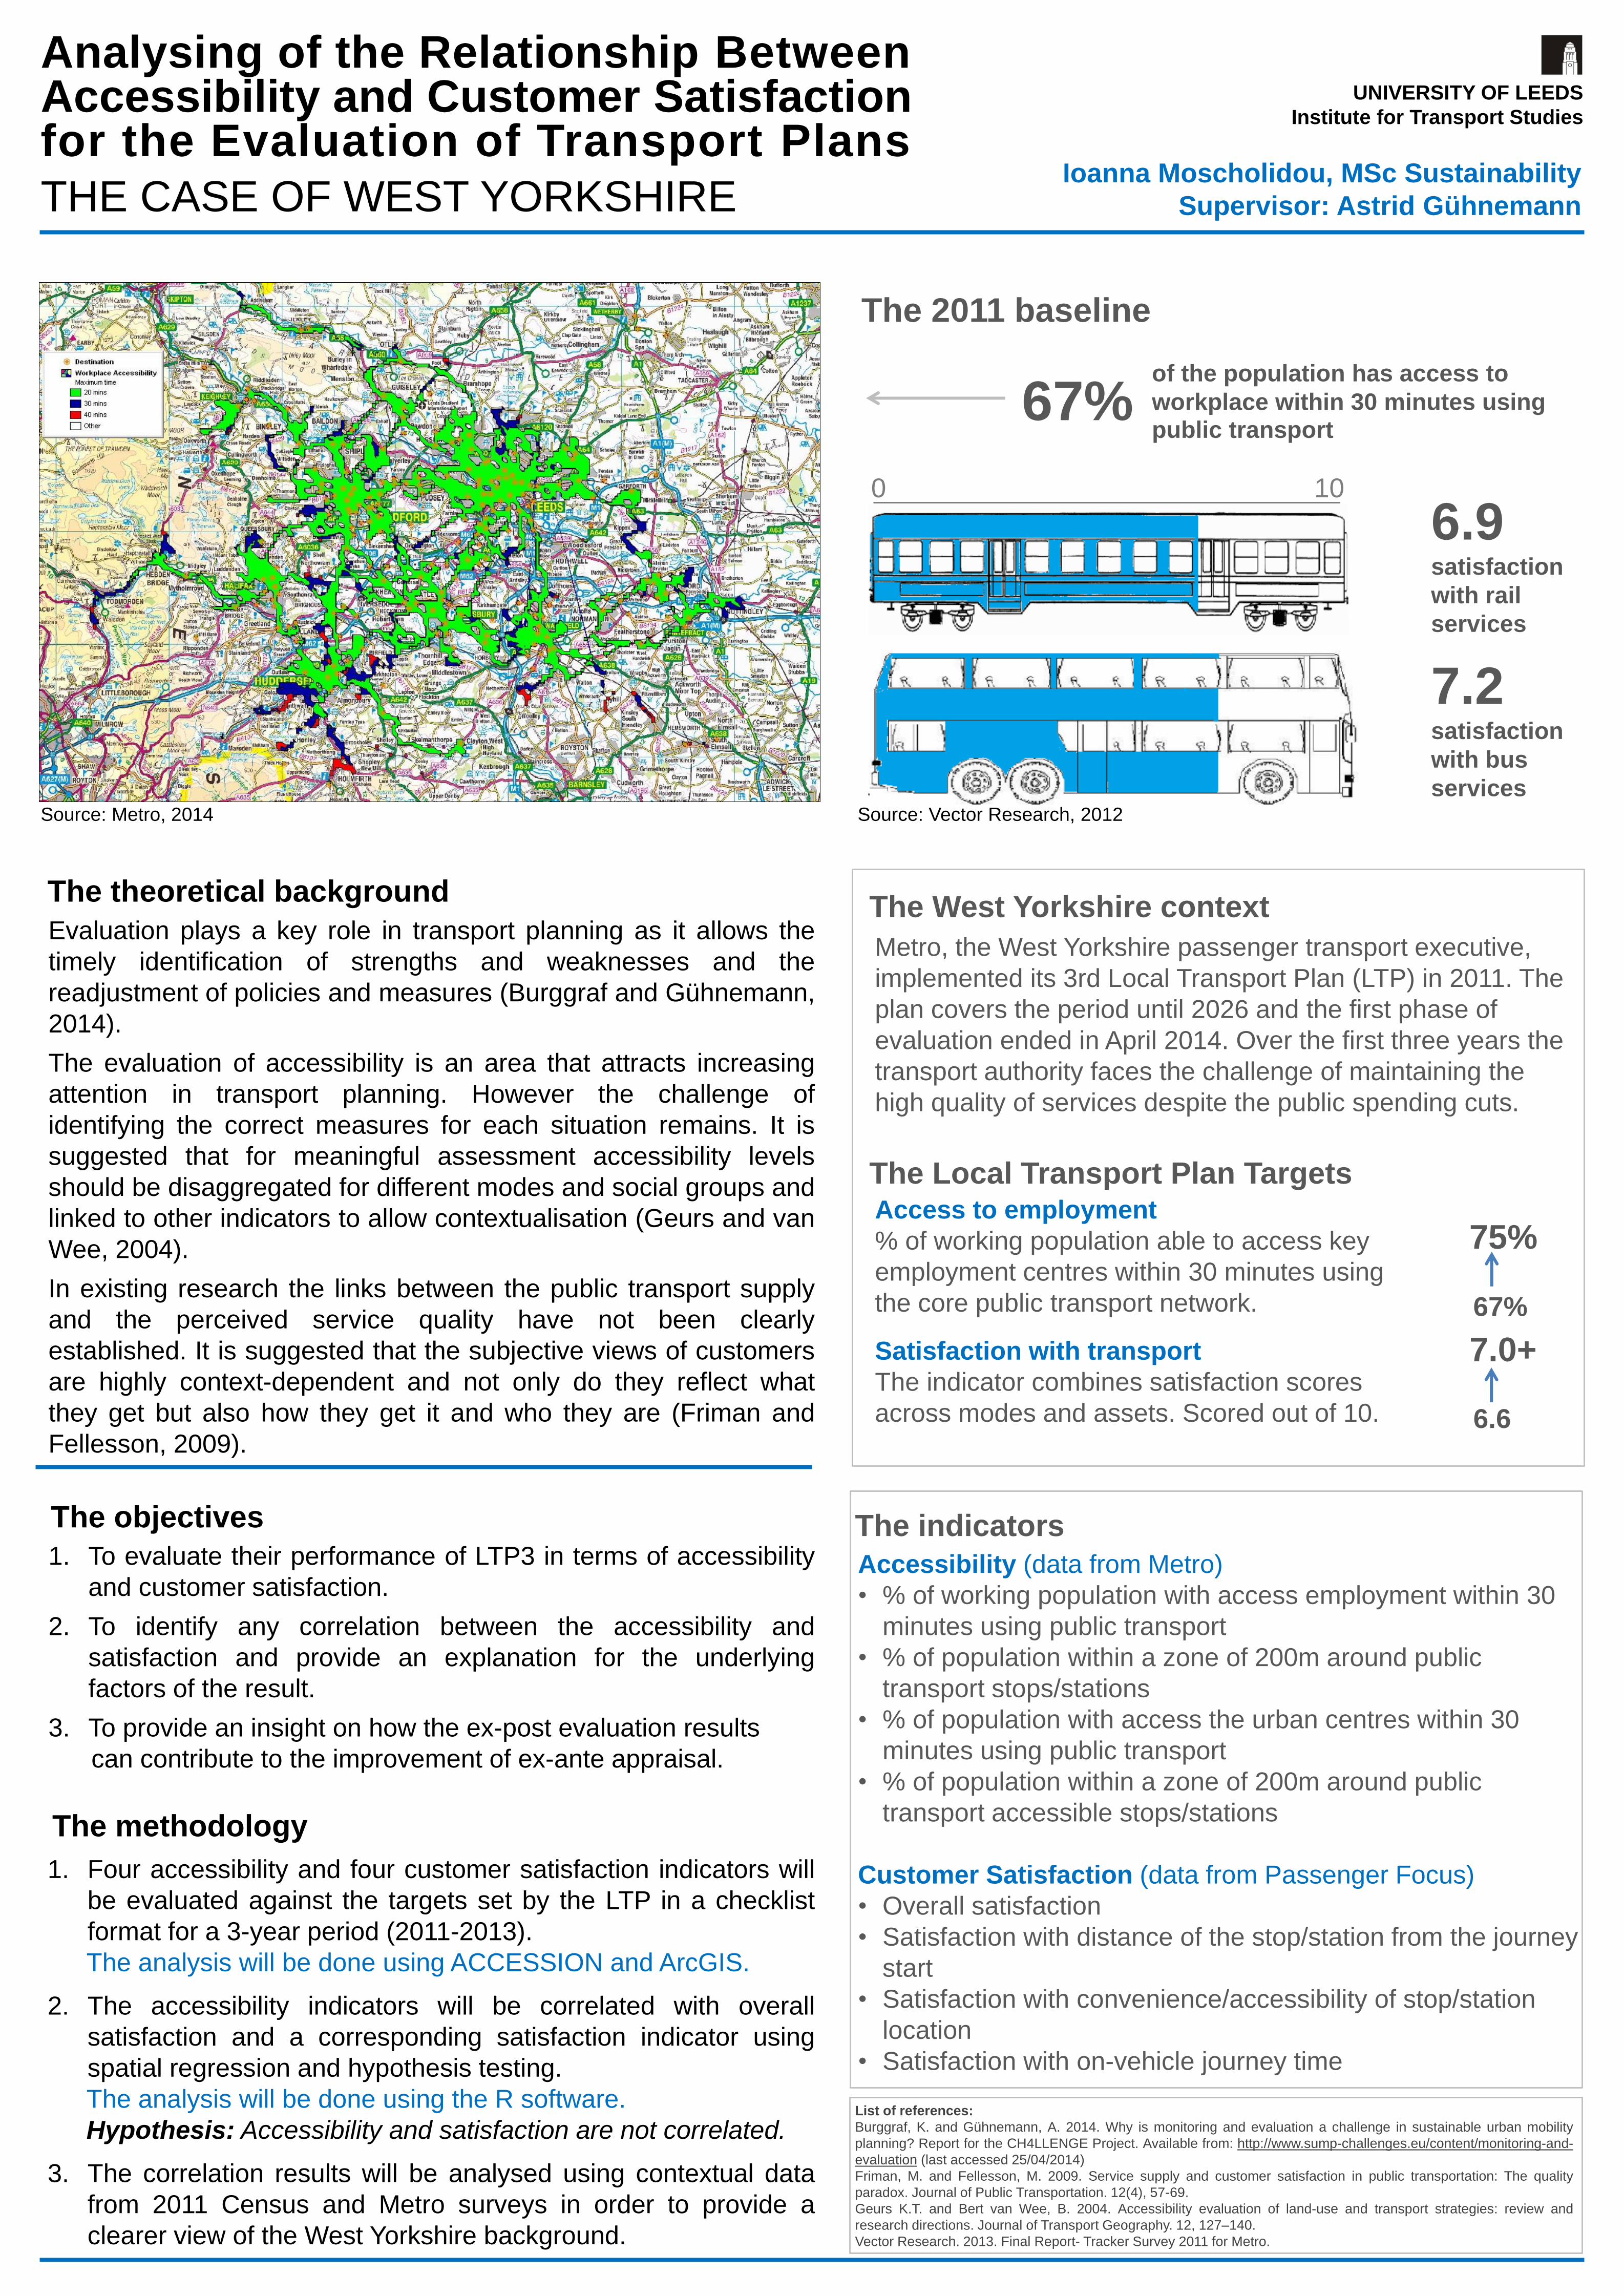
Analysing of the Relationship Between Accessibility and Customer Satisfaction for the Evaluation of Transport Plans
Ioanna Moscholidou, MSc Sustainability
Supervisor: Astrid Gühnemann THE CASE OF WEST YORKSHIRE
Evaluation plays a key role in transport planning as it allows the
timely identification of strengths and weaknesses and the
readjustment of policies and measures (Burggraf and Gühnemann,
2014).
The evaluation of accessibility is an area that attracts increasing
attention in transport planning. However the challenge of
identifying the correct measures for each situation remains. It is
suggested that for meaningful assessment accessibility levels
should be disaggregated for different modes and social groups and
linked to other indicators to allow contextualisation (Geurs and van
Wee, 2004).
In existing research the links between the public transport supply
and the perceived service quality have not been clearly
established. It is suggested that the subjective views of customers
are highly context-dependent and not only do they reflect what
they get but also how they get it and who they are (Friman and
Fellesson, 2009).
The theoretical background
The methodology
The objectives
Source: Metro, 2014 Source: Vector Research, 2012
6.9 satisfaction
with rail
services
7.2 satisfaction
with bus
services
67% of the population has access to
workplace within 30 minutes using public transport
The 2011 baseline
Access to employment
% of working population able to access key
employment centres within 30 minutes using
the core public transport network.
Satisfaction with transport
The indicator combines satisfaction scores
across modes and assets. Scored out of 10.
The Local Transport Plan Targets
75%
67%
7.0+
6.6
The West Yorkshire context
Metro, the West Yorkshire passenger transport executive,
implemented its 3rd Local Transport Plan (LTP) in 2011. The
plan covers the period until 2026 and the first phase of
evaluation ended in April 2014. Over the first three years the
transport authority faces the challenge of maintaining the
high quality of services despite the public spending cuts.
List of references:
Burggraf, K. and Gühnemann, A. 2014. Why is monitoring and evaluation a challenge in sustainable urban mobility
planning? Report for the CH4LLENGE Project. Available from: http://www.sump-challenges.eu/content/monitoring-and-
evaluation (last accessed 25/04/2014)
Friman, M. and Fellesson, M. 2009. Service supply and customer satisfaction in public transportation: The quality
paradox. Journal of Public Transportation. 12(4), 57-69.
Geurs K.T. and Bert van Wee, B. 2004. Accessibility evaluation of land-use and transport strategies: review and
research directions. Journal of Transport Geography. 12, 127–140.
Vector Research. 2013. Final Report- Tracker Survey 2011 for Metro.
1. To evaluate their performance of LTP3 in terms of accessibility
and customer satisfaction.
2. To identify any correlation between the accessibility and
satisfaction and provide an explanation for the underlying
factors of the result.
3. To provide an insight on how the ex-post evaluation results
can contribute to the improvement of ex-ante appraisal.
1. Four accessibility and four customer satisfaction indicators will
be evaluated against the targets set by the LTP in a checklist
format for a 3-year period (2011-2013).
The analysis will be done using ACCESSION and ArcGIS.
2. The accessibility indicators will be correlated with overall
satisfaction and a corresponding satisfaction indicator using
spatial regression and hypothesis testing.
The analysis will be done using the R software.
Hypothesis: Accessibility and satisfaction are not correlated.
3. The correlation results will be analysed using contextual data
from 2011 Census and Metro surveys in order to provide a
clearer view of the West Yorkshire background.
Accessibility (data from Metro)
• % of working population with access employment within 30
minutes using public transport
• % of population within a zone of 200m around public
transport stops/stations
• % of population with access the urban centres within 30
minutes using public transport
• % of population within a zone of 200m around public
transport accessible stops/stations
Customer Satisfaction (data from Passenger Focus)
• Overall satisfaction
• Satisfaction with distance of the stop/station from the journey
start
• Satisfaction with convenience/accessibility of stop/station
location
• Satisfaction with on-vehicle journey time
The indicators
0 10
UNIVERSITY OF LEEDS
Institute for Transport Studies

Playing with transport How to make your commute greener and have fun at the same time.
Objectives Methodology
This dissertation will try to
understand if there is a
difference in mode choice
when people are given
incentives to use modes of
transport that are friendlier
with the environment.
The incentives investigated
will be based on gamification
where an aim is set and
participants compete to win by
making decisions that impact
their behaviour.
Data analysis and expected findings
A 2 week field study will be carried out to assess the impact that providing incentives
has on commuting behaviour.
Participants will be
asked to install an app
on their phones and use
it for 2 weeks.
During the first week, the
app will record information
on participants’ trips,
including distance travelled,
mode choice, route choice
(coordinates) and duration.
During the second week, participants
will receive points based on their use of
different modes. Information on their
ranking amongst the group will be
disclosed. Points will be converted into
raffle tickets for a chance to win prizes.
Background
With urban pollution on the rise, policies that incentivise
modal switch towards modes of transport that are better for
the environment are needed.
Gamification, or the art of mixing games and real life, has
shown to be an effective way of modifying behaviour to
achieve a specific goal(1); whether it is user engagement,
learning, or even physical exercise.
Gamification can be used as a way to reward positive
behaviour rather than punish negative behaviour, and as
such may be well perceived by the public and prove more
effective than punitive policies such as congestion charging.
J. SEBASTIAN CASTELLANOS
Supervisor: Frances Hodgson
Bibliography and further reading
1. Muntean, C. I., 2011, Raising engagement in e-learning through gamification, 6th International
Conference on Virtual Learning.
2. McCallum, S., 2012, Gamification and serious games for personalized health, 9th International
Conference on Wearable Micro and Nano Technologies for Personalized Health.
3. Brazil, W. and Caulfield, B., 2013, Does green make a difference: The potential role of smartphone
technology in transport behaviour, Transportation Research Part C: Emerging Technologies, Vol.
37, pp. 93–101.
4. Dick, E., Knockaert, J., and Verhoef, E., 2010, Using incentives as traffic management tool:
empirical results of the “peak avoidance” experiment, Transportation Letters: The International
Journal of Transportation Research Vol. 2, pp 39-51.
5. Fan, Y., Chen, Q., Douma, F., Liao, C., 2012., Smartphone-Based Travel Experience Sampling and
Behaviour Intervention among Young Adults, Intelligent Transport Systems Institute, University of
Minnesota.
6. Schlossberg, M., Evers, C., Kato, K., and Brehm, C., 2012, Active Transportation, Citizen
Engagement and Livability: Coupling Citizens and Smartphones to Make the Change, URISA
Journal, Vol. 25, No. 2.
The app
Participants click on “start
trip” whenever they want to
record a trip.
While travelling, participants
take a picture to confirm the
mode they’re using and hence
become eligible for points
When the trip is finished,
participants click on stop and
choose the mode they used.
The information is sent to a
server where it is collected
Sample trips
Output files
With the data collected during the first
week of the study, a baseline scenario
will be set up and the modal split of
the sample will be determined.
During the second week, changes in
modal split will be observed and a
hypothesis test will be carried out with
H0 being there is no change in modal
split when incentives are in place, and
H1 being there is a significant change
in modal split, specifically towards
higher rewarded modes.
Field study
The field study will be carried out in
Bogotá (Colombia), with students
between the ages of 17 and 24. The
sample size will be between 30 and
40 participants.
Data analysis
Mode Points
Car 0
Public bus 2
BRT 4
Bicycle 6
Walking 6

Noisy optimisation: Stochastic optimisation of traffic signal networks using a trust region method
Jack Robinson, MSc (Eng) Transport Planning and Engineering candidate, Institute for Transport Studies, University of Leeds
For a network of traffic signals
with a given common cycle time,
which set of green times and
offsets minimises the total travel
time of vehicles through the
network?
Problem formulation I
• The problem is too difficult to
solve analytically for general
networks
• The objective function may
contain multiple local minima,
making hill-climbing methods
unreliable
• Stochastic effects from
simulation further distort the
objective function
Set parameters, and initial timings and trust region
settings
Simulate network in DRACULA for various timings within the trust
region
Fit model function to simulation results
Find solution to minimise model function
Update trust region centre and size
Output solution
Loop
until so
lution c
onve
rges
• A framework for derivative-
free optimisation, useful for
complicated surfaces
• An easy-to-optimise model
function is fitted to the
objective function in a ‘trust
region’ around the current best
solution
• For this project, quadratic
model functions are used, and
the trust regions are balls
Schematic
contour plot of
trust region
model function
True function:
Model function:
Trust region:
Compare resilience and speed of
the algorithm under different
parameters, networks and
starting conditions
• The algorithm is being tested
for a simple two-node network
• Testing will continue on larger
networks, and the algorithm
will be refined
• Is the algorithm adversely
affected by the randomness of
simulation? Use of the simpler,
deterministic cell transmission
model could be compared
Photo by Edwin Mak
10 20 30 40 50 600
0.2
0.4
0.6
0.8
1
Total veh-hours in network
Em
piric
al cum
ula
tive p
robability d
istr
ibution
Empirical cumulative distribution plot of a test run of the
trust region algorithm on the two-node network
after 0 iterations
after 1 iteration
after 2 iterations
after 3 iterations
after 4 iterations
after 6 iterations
known solution
Issues 2
Algorithm structure 3
Trust region methods 4
Analysis 5
Progress and plans 6
Block signalling The concept of block signalling is simple. The railway line is split into blocks of varying lengths, controlled by a signal at the entrance to each block. Once a train is within a particular block, no other train can enter the block until it is clear. This was introduced as a safety precaution in the late 1880’s and is still used in places on the network today.
Moving block signalling Much like block signalling, moving block signalling uses the ideas of blocks as well. The difference is that the blocks re fixed to each individual train. The block is the length of the train, plus the distance that the train would need to stop in case of emergency. This allows trains to run a lot closer together in a safe manner.
Premise A hot topic today surrounding railways is the issue of capacity. With demand for rail services increasing the railways are becoming busier. In terms of the environment there is also call for freight to be transported via railways instead of roads and so this puts further strain on the railway network. HS2 is a solution to this increase in demand but since its completion is 20 years away, there needs to be a solution now. Moving block signalling is one of those solutions and this project will look at what sort of capacity gain the railway could experience by changing its approach to signalling.
Modelling Using the specifications from real locomotives that are operating on the East Coast Mainline, the length of each block can be calculated. At stage one, the new capacity can be calculated under the assumption that all trains run at the same speed. At stage two, the varying speeds of trains, freight vs passenger, can be taken into account using duel lines to facilitate an optimal solution for capacity.
Outcomes and Analysis After the modelling stage is complete there will be an optimal solution in terms of the maximum capacity of railways. This will be reviewed in terms of the modal shift of freight and the environmental benefit as well as the passenger rail demand benefit. The trade offs will also be reviewed to see if there are any negative effects of moving block signalling.

A multi-national analysis of the value of travel time: the study case of UK and DK
UNIVERSITY OF LEEDS Institute for Transport Studies
Background and motivation
The value of travel time is the key parameter in transport economics1. Its definition plays a major role in:
• Investment appraisals • Travel demand forecasting
The ample variety of results across models and studies is a matter of concern.
In the UK, estimated values of the VTT differ up to 69% within the same data set2. • What is the nature of the multiplicity of results? • Are complex models diminishing our ability to
obtain «robust» empirical evidence on the willingness to pay?
• What is the role of the data set?
Is model selection to blame for the differences?
Evidence in Australia and NZ suggest that "as models become more complex, there is greater variability in the mean estimates of VTTS between data sets"3.
Source: Hensher, et. al (2012)
Leonardo Ortiz Olivares Prof. Stephane Hess (Supervisor)
Objectives
• To explore if significant differences exist on the estimation of the mean VTT across different choice models within the same data set for the UK and DK cases.
• To provide some insight on the implications of model structure selection (contrasting models).
A first look at the evidence
Source: UK data from Tjiong (2013) and Mackie (2003); DK data from Fosgerau (2006)
4.22
7.13
1.03 1.49
MNL MMNL
UK (p/min) DK (DDK/min)
Methodology
Multinomial Logit Model (MNL), Mixed MNL (MMNL) and Latent Class Model with identical set of attributes and functional form will be developed to calculate comparable VTT across models.
To determine the influence of the data or functional form in the VTT estimated values, a multivariate regression will also be estimated:
where i indicates the estimated model and all independent variables are specified as dummy (1,0).
Data
British, Danish and Dutch national VOT studies have been built on similar time-cost experiments. Access to similar data sets in design allows to contrast results within model form across comparable data sets. • Orthogonal survey designs • Two unlabelled alternatives • Non-business trips included • Similar socio-economic variables
References
1FOSGERAU, M. 2006. Investigating the distribution of the value of travel time savings. Transportation Research Part B: Methodological, 40, 688-707. 2TJIONG, L. K. J. 2013. Re-estimating UK value of time using advanced models. MSc Transport Planning, University of Leeds. 3HENSHER, D. A., ROSE, J. M. & LI, Z. 2012. Does the choice model method and/or the data matter? Transportation, 39, 351-385. MACKIE, P., WARDMAN, M., FOWKES, A., WHELAN, G., NELLTHORP, J. & BATES, J. 2003. Values of travel time savings UK.
𝑉𝑉𝑉𝑉𝑉𝑉𝑖𝑖 = 𝐶𝐶 + 𝑀𝑀𝑀𝑀𝑀𝑀𝑖𝑖 + 𝑀𝑀𝑀𝑀𝑀𝑀𝑀𝑀𝑖𝑖 + 𝑀𝑀𝐶𝐶𝑖𝑖 + 𝐷𝐷𝐷𝐷𝐷𝐷𝐷𝐷𝐷𝐷𝐷𝐷𝐷𝐷𝑈𝑈𝑈𝑈 + 𝐷𝐷𝐷𝐷𝐷𝐷𝐷𝐷𝐷𝐷𝐷𝐷𝐷𝐷𝐷𝐷𝑈𝑈

Investigating and Calibrating the dynamics of vehicles in
Traffic Micro-simulations ModelsMohammed Yazan Madi - Supervisor: Dr. James Tate
University of [email protected]
Ob
jecti
ve
s
Transportation sector is a significant contributor to air quality
problems in the United Kingdome .
Traffic micro-simulation models are used to generate second-by-
second speed trajectory information for use by instantaneous
emission models to evaluate the environmental impact of real-time
Backg
rou
nd
Develop a calibration process of micro simulation models to ensure
vehicular behavior from simulation is closer to the behavior observed in the
field, which improve second by second vehicle activity and emissions
estimates.
Validate micro-simulation vehicles' dynamics with field second by second
trajectories data to explain any trends or unique observations in emissions
The following data will be collected :
Data Collection
Ob
jecti
ve
s
Researc
h M
eth
od
olo
gy
emission models to evaluate the environmental impact of real-time
transport policies.
Vehicle dynamics are explained by the driving velocity and
acceleration / deceleration of vehicles.
It is significant that the vehicle dynamics replicate on-road
behavior, so the emission model’s simulations of engine power
demands and resultant fuel consumption/ emissions are reliable.
For environmental models to be reliable, vehicle dynamics in
traffic micro-simulation models need to replicate on-road behavior.
Backg
rou
nd
Case study Location Micro-simulation Model
trajectories data to explain any trends or unique observations in emissions
estimates from the simulation and the real-world.
The motivation of this dissertation is to apply these advanced models to
create a state-of-art traffic micro-simulation models that are real-world
integrated and can evaluate the environmental impacts of different traffic
management strategies.
Research Hypothesis: Parameters of internal behavioral models within
microscopic simulation packages need calibration and validation to better
replicate vehicle activity on roads.
Researc
h M
eth
od
olo
gy
sim
ula
tio
n M
od
el
Headingley, Leeds, UK.
Micro-simulation model calibration and validation process framework :
Calibration and Validation Process Approach
Vehicle Movements in AIMSUN
RaceLogic VBOX II GPS engine and data logger
is used to obtain dynamic characteristics data
of vehicle (speed, acceleration) and
geographical position.
AIMSUN microscopic traffic simulator will be
used to model the Headingley corridor traffic
in Leeds to measure second-by-second speed
trajectory information.
AIMSUN Specifications
List your information on these lines.
Mic
ro-s
imu
lati
on
Mo
del
Traffic-emission Modeling Framework
Micro-simulation model calibration and validation process framework :
AIMSUN
Micro-
simulation
Model
AIMSUN Micro-simulation Model Calibration
using key input data , and simulation model parameters (observed aggregated traffic flow
and average travel speed)
AIMSUN
Micro-simulation
Model Validation
using activity data
AIMSUN
Calibrated
Model Run
Demand/ Flows
(DMRB procedure,
GEH stat)
Journey times
(DMRB
criteria)
Vehicle
Trajectories
Vehicle speed
and
acceleration
Vehicle Movements in AIMSUN
Researc
h M
od
el
The traffic model captures the second-by-second speed and acceleration of
individual vehicles travelling in a road network based on:
Vehicles individual driving style.
Vehicle mechanics.
Vehicles interaction with other traffic and with traffic control in the network.
During simulation each vehicle is moved
along their chosen route from origin to
destination. Their speeds and positions
are updated according to car-following,
lane-changing and gap acceptance rules,
and traffic regulations at intersections..
Example
Data
An
aly
sis
Researc
h A
pp
licati
on
• AIMSUN real–world
integrated micro-simulation model.
TRAFFIC MICROSIMULATION
• Instantaneous
emission model PHEM 11.
VEHICLE EMISSION MODEL
• Road section, time-of-
day, vehicle sub-category or an individual vehicle
trajectory.
RESULTS
Vehicle
Trajectory
Data
Disaggregate
Emission Data
VEHICLE TYPE
(Car, LGV, HGV)
VEHICLE SUB-
CATEGORY
(Euro, Fuel type)
Frequency distribution of Observed and Modelled passenger car speed and
acceleration distributions (hexagonal binning). Source (Tate, 2013)ANPR
SURVEY
Tate, J. 2013. York Low Emission Zone Feasibility Study- Vehicle Emission Modelling. Institute for Transport Studies, University of Leeds.
Source (Tate, 2013)

The Importance of Eco-DrivingIn the last decades, engine technology and vehicle performance has improved, while mostdrivers have not adapted their driving style.1 Eco-driving represents a driving culture whichsuits modern engines and makes best use of advanced vehicle technologies, such asmaintaining a steady speed at low rpm, shifting gear early and rolling in neutral. The benefitsof adopting such behaviour include;
Lower greenhouse gas emissionsIt is widely accepted that greenhouse gas emissions contribute to climate change. Eco-drivingcan be embraced as a simple and effective environmentally friendly initiative that can lowervehicle emissions by 20g per kilometre.2
Save cost on fuel By adopting eco-driving practices, fuel efficiency can be improved by 15% or more lowering the demand for fuel.3
Source (Fiat, 2010, p. 25)
Eco-driving: who does it and why ?Identifying the motivational factors
References
1 Eco Drive (2014). What is eco-driving. [Online]. [Accessed 7th April 2014]. Available at: http://www.ecodrive.org/en/what_is_ecodriving-/2 Fiat. (2010). Eco-driving Uncovered. [Online]. Accessed 7th April 2014]. Available at: http://www.fiat.co.uk/uploadedFiles/Fiatcouk/Stand_Alone_Sites/EcoDrive2010/ECO-DRIVING_UNCOVERED_full_report_2010_UK.pdf3 Baltutis, J. (2010). Benefits of Eco-Driving. [Online]. (Accessed 7th April 2014]. Available at: http://www.unep.org/transport/PDFs/Ecodriving/Ecodriving_pwpt.pdf4 Mensing, F et al. (2014). Eco-driving: An economic or ecologic driving style? Transportation Research Part C, 38, 110 – 121.5 Powell, D. (2008). Extreme Driver – with a difference. New Scientist. 200, pp. 42 -43 6 DfT. (2011). Eco-driving: Factors that determine post test take up. [Online]. [Accessed 7th April 2014]. Available at: https://www.gov.uk/government/uploads/system/uploads/attachment_data/file/142536/Eco_safe_driving.pdf7 Delhomme, P et al. (2013). Self-reported frequency and perceived difficulty of adopting eco-friendly driving behaviour according to gender, age and environmental concern. Transportation Research Part D, 20. pp. 55 – 58.
Savings per car life cycle
Fuel Consumption
CO 2
EmissionsSavings
Average Driver
-6% -1,088kg £480
Top 10% -16% -2,895kg £1,260
Literature Review
Motivational factors - Economic 4
- Environmental concern 4
- Embracing the challenge 5
- Road safety 6
Barriers to adoption- Perceived difficulty 7
- Lack of awareness 6
- Technological innovation is more interesting 2
- Lack of tuition in driving schools 6
Group most likely to eco-drive- Middle aged females with a high environmental concern 7
Group least likely to eco-drive- Young males and females 7
Michael Wilson
Supervisor: Dr Daryl HibberdInstitute for
Transport Studies
MethodologyStep 1 – Develop an online scenario based questionnaire divided into 4 sections
Section 1 – Personal Characteristics:Identify the key variables such as age, gender,income and environmental concern.
Section 2 – Strategic Decision ScenariosExamine the motivation for the selection of vehicle type,checking tyre pressure and fuel choice.
Section 3 – Tactical Decision ScenariosExamine the motivation for route choice regarding congestion , road terrain and whetherindividuals consider removing excess vehicle weight.
Section 4 – Operational Decision Scenarios Examine the motivation for driver speed, driving style, air conditioning use and idling.
Example QuestionYou are given the choice of two routes to the same destination. Route 1 will take 1 hour and emit 5% more CO2.Route 2 will take 10 minutes longer, emitting 5% less CO2.Which do you choose?
Step 2 – Obtain 100+ respondents to achieve a representative sample of the population. Respondents will be private vehicle users with a valid driving license.
Step 3 – Analyse results by performing a regression analysis between variables in SPSS to answer research questions.
Possible Further Research
Examine how eco-driving campaigns can target driver groups through motivational factors and removal of barriers
Attempt to quantify the environmental impact if eco-driving was implemented as a soft policy measurement
Undertake a cost-benefit analysis to calculate the NPV to the driver of eco-driving
Aims and ObjectivesThe aim of this project is to explore the relationship between individual characteristics, eco-driving behaviours and motivational factors. The following objectives have been set toanswer the overarching question of who eco-drives and why?
Identify motivations behind eco-driving
Identify which drivers are most likely to undertake eco-driving behaviour
Identify whether individuals are conscious of eco-driving
Identify the potential barriers to eco-driving
HypothesesThe following hypotheses will be tested in order to provide a structure and focus to answer the project objectives.
The strongest motivation to eco-drive is fuel conservation
Lower income groups are more likely to eco-drive because of economic influence
Individuals who travel a greater distance are more likely to eco-drive because of the experience they have gained
The greatest barrier is awareness of eco-driving practices

How does stated preference design affect the valuation of ‘soft’ factors?
Introduction Although there is a wide literature about the valuation of time, congestion and other significant issues such as price elasticities, there is a lack of confidence in the valuation of soft factors.
Soft factors are seen as attributes of secondary importance in demand choice but still effect demand. Soft factors for train passengers can be split into two main groups;
• On-board: Seat comfort, noise, information, security etc.
• Off-board: shelters, seating, CCTV, passenger lounge, heating, lighting etc.
It is important to value these attributes correctly to make sure that there is not an over or under valuation, resulting in train operating companies adapting their rolling stock or railway stations based on implausible fare augmentations.
Objectives The objective of this dissertation is to analyse how different stated preference designs affect the choices that respondents make. There is wide spread tolerance of implementing stated preference surveys that are designed in such a way that it is easy for respondents to judge the aims of the surveys. This opens the survey design up to respondents’ strategic bias.
• Does the design of a stated preference survey affect the valuations of the soft factors;
• Identical valuations- zero strategic bias
• Different valuations- strategic bias may be present where respondents can ‘play’ the survey
Literature Review
• Values of attributes can be 3 times higher when the purpose of the study is transparent, and thus there can be strategic bias (Wardman and Whelan 2001) • Direct valuations provided for soft variables are often unconvincing (Bates 1994). • Soft factor values across 18 different UK studies appear to be too large and have a lot of variation (Wardman and Whelan 2001). • By adding up to 10 soft factors, passengers state they are willing to pay double the original fare. This is very unrealistic in real life (Bates 1994). • It is necessary to implement an upper valuation cap for a bundle of soft factor improvements to stop it becoming unattainably high (Steer Davis Gleave 1990). • Direct valuations of soft factors vary with the number of factors included in the survey (Bates 1994).
Methodology and Data Collection
• Eight different designs will be made using Biogeme;
• Three transparent survey designs and five mixed designs.
• Data will be collected in face to face interviews on First Transpennine Express services.
• It is hoped that there will be 1000 respondents over a five day surveying period.
• Surveys will be initially done on paper, with the choices being analysed using a range of computer packages.
Key Questions To Be Answered
• Does a transparent survey design give higher soft factor valuations?
• Does the ordering of positive and negative attributes in the choice question affect the soft factor valuations?
• Are there different soft factor valuations when using fare and time as numeraires as opposed to only using one numeraire per survey design?
Attributes Alternative One Alternative Two
Seats Current condition Reupholstered
Air Conditioning Current availability Individual air conditioning
Noise As now Quieter service
Ease of access onto train As now (steps) Train door level with platform
Time 30 minutes 45 minutes
Choice
Attributes Alternative One Alternative Two
Seats Current condition Reupholstered
Air Conditioning Individual air conditioning Current availability
Noise As now Quieter service
Ease of access onto train Train door level with
platform
As now (steps)
Time 45minutes 30minutes
Choice
Other Design Combinations 1. Time: Grouped positive and negative attributes 2. Fare: Transparent 3. Fare: Grouped positive and negative attributes 4. Fare: Each row opposite to the previous 5. Time and cost: Transparent 6. Time and cost: Each row opposite to previous
References • BATES J, 1994, Reflections on Stated Preference: Theory and practice, Chapter 6 of Travel behaviour research: updating the state of play, pp.89-103 • STEER, DAVIES, GLEAVE, 1990, The effects of quality improvements to public transport, Wellington regional council • WARDMAN, M., WHELAN G., 2001, Valuation of improves railway rolling stock: A review of the literature and new evidence, Transport Reviews, Vol 21, No.4, pp415-447

COMPARISON BETWEEN CAR OWNERSHIP
CHARACTERISTICS IN UK & JAPAN
The difference in socio-economic profile between UK & Japan
potentially has an effect on car ownership characteristics
between the two countries at household level. It is interesting to
look at some attributes which is significant to car ownership level
in the two countries.
The study is conducted to develop a model based on basic
regression analysis and discrete choice principles, which is an
advanced regression technique, to explain the relationship
between socio-economic attributes and car ownership as
dependent variable.
UK Socio-economic data for UK is taken
from UK National Census data as
distributed by UK Data Archive. Full
census in the UK is conducted every 10
years by Census Division of Office for
National Statistics.
JAPAN Information on Japanese socio-
economic profile is provided through
Japanese General Social Survey which
was conducted in 2005. This survey
was designed and conducted by Osaka
University & Tokyo University.
ABOUT THE DATASETS
Some other published statistics are also used in this dissertation, including
National Travel Survey, World Bank Statistics and Organisation for Economic
Cooperation and Development (OECD).
KEY STATISTICS SUMMARY
CHOICE MODELLING BASIC REGRESSION The analysis is still being carried out for both datasets. Given in the table below is the most recent estimation for JGSS data
425 cars/ 1000 people
441 cars/ 1000 people
Based on World Bank Statistics, there are 425
cars/1000 people in UK in 2001, and 441
cars/1000people in Japan in 2005..
$$$$$$ $$$$$
US $ 27,926 Annual income per head
US $ 25,616 Annual income per head
According to Organisation for Economic Co-operation and Development
(OECD) published statistics in 2011, annual income per head in UK is
3% higher than in Japan.
78.4% employed
61.2% employed
It is revealed that 78.4% of respondents in UK were in employment,
while 2.2% did not have a job. Students were 0.5%. Whilst in Japan,
61.2% of the respondents were employed, and 37.1% were
unemployed .
UK NATIONAL CENSUS DATA 2001 Sample Size 2,964,871 Respondents’ age ranging between 0 – 85+ Car ownership is given for 0, 1, and 2+ cars Main commuting mode is given Employment status is given with 8 class NSEC system Income information will be imputed from other source (National Travel Survey, 2001)
Communal
19.4%
+
41.3%
37.4%
1.8%
Don’t have cars
CAR OWNERSHIP
AGE
41% of the respondent owns
a car and 37% owns more
than 2 cars. Whilst 19% do
not own cars, and the
remainder use cars in
communal, this includes car
sharing.
MAIN COMMUTING
MODE The main commuting mode in
UK was dominated by car with
the proportion of 61%, while
walking takes 12% in 2001
CAR OWNERSHIP
The minimum cars owned is determined by the total number of car types chosen by respondents, while
the maximum car owned takes the number of adult into account. In Japan, the car license is issued to
individuals aged over 18 .
Only respondents 20 years old and older who participated in the survey
AGE
COMMUTING MODE In this survey, the respondents are
allowed to choose more than one
mode. Car is dominating as chosen by
543 respondents, 95% of which
choose car only.
Dissertation by:
Rendy Prakoso MSc(Eng) Transport Planning & Engineering
Postgraduate Student
Supervisor:
Professor Stephane Hess University of Leeds, UK
Professor Nobuhiro Sanko Kobe University, Japan
COMMUTING
TIME (MIN)
JAPAN GENERAL SOCIAL SURVEY
2005
Sample Size 1,872
Respondents’ age ranging between 20-89,
Car ownership is determined by type of car and age of respondent (licence issued for age 18 and over)
Household members age and sex information are included
Income is given in 19 categories, with 714 missing (38% of the data)
ACKNOWLEDGEMENT
Dependent variable =
car ownership
Independent variable =
age, sex, income, employment,
commuting mode, commuting
costs (time/distance)
Utility function
U n,j = V n,j + εn,j
j = different levels of car
ownership
Vn,j = f (β, x n,j)
Logit model,
choice
probabilities
The Japanese General Social Surveys (JGSS) are designed and carried out at the Institute of Regional Studies at Osaka University of
Commerce in collaboration with the Institute of Social Science at the University of Tokyo under the direction of Ichiro TANIOKA, Michio
NITTA, Noriko IWAI and Tokio YASUDA. The project is financially assisted by Gakujutsu Frontier Grant from the Japanese Ministry of
Education, Culture, Sports, Science and Technology for 1999-2008 academic years, and the datasets are compiled and distributed by SSJ
Data Archive, Information Center for Social Science Research on Japan, Institute of Social Science, the University of Tokyo.
β
β
β
β
β
β
β
β
β
β
β
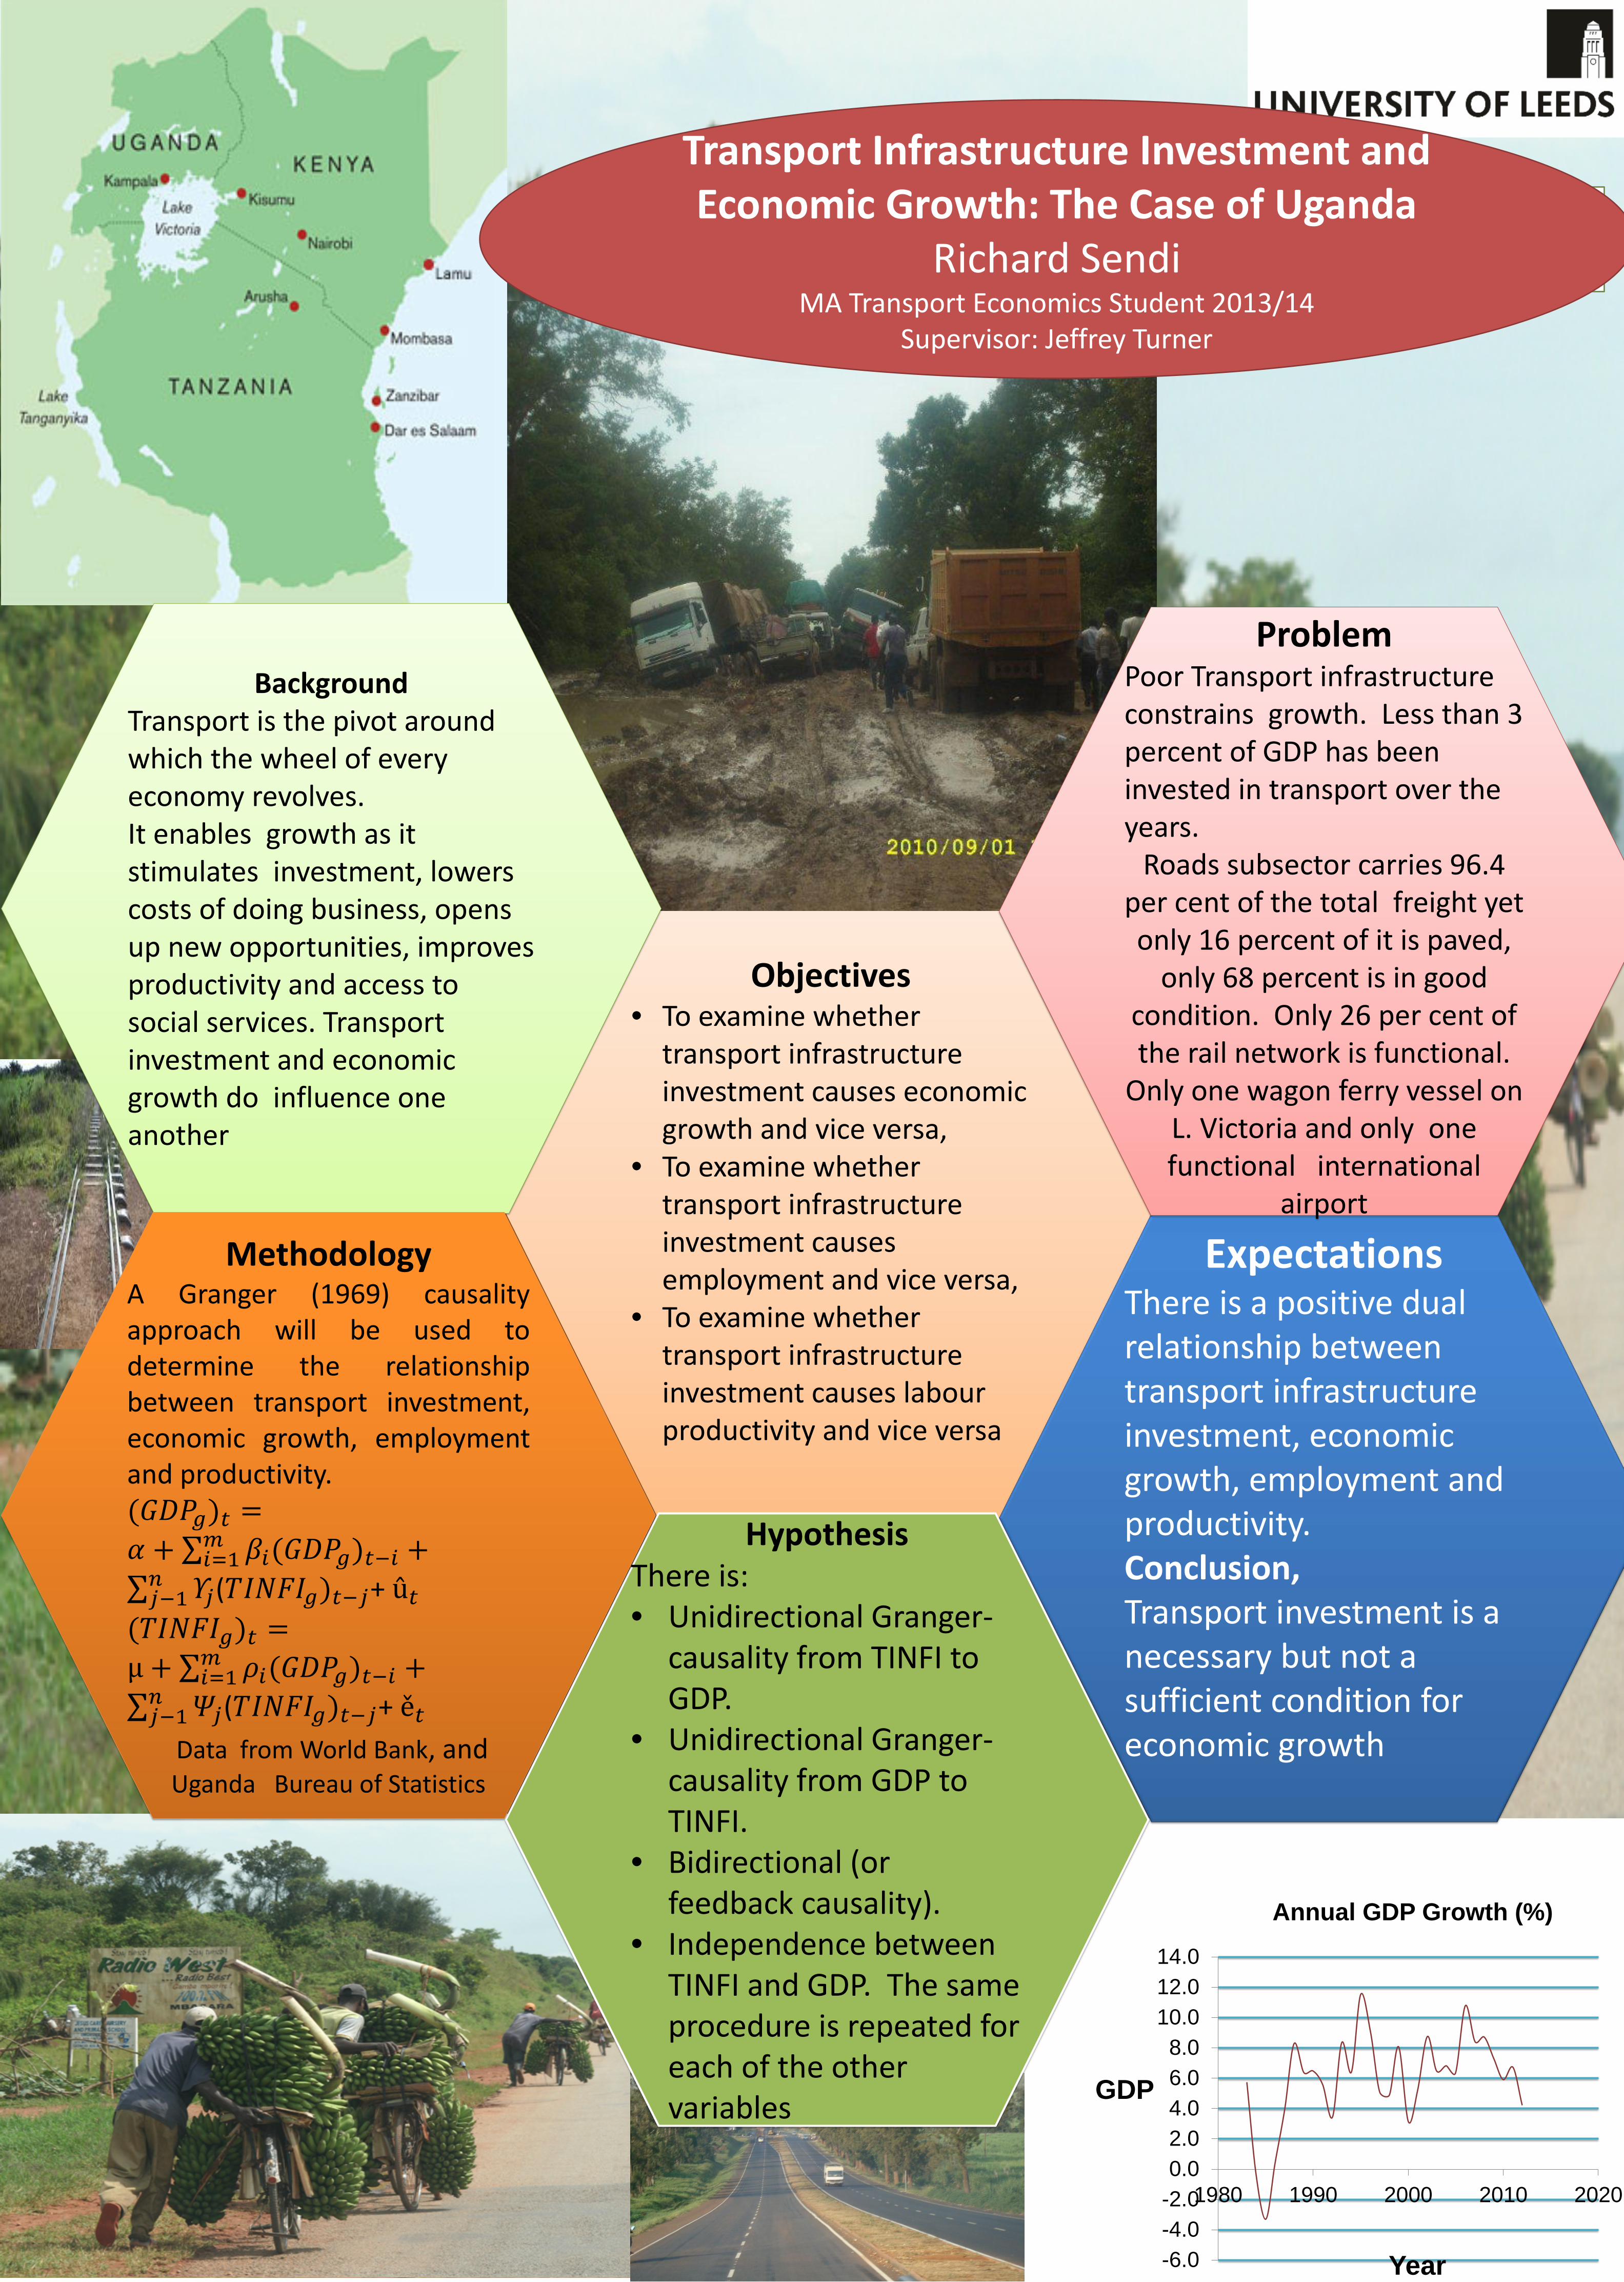
Objectives • To examine whether
transport infrastructure investment causes economic growth and vice versa,
• To examine whether transport infrastructure investment causes employment and vice versa,
• To examine whether transport infrastructure investment causes labour productivity and vice versa
-6.0-4.0-2.00.02.04.06.08.0
10.012.014.0
1980 1990 2000 2010 2020
GDP
Year
Annual GDP Growth (%)
Expectations There is a positive dual relationship between transport infrastructure investment, economic growth, employment and productivity. Conclusion, Transport investment is a necessary but not a sufficient condition for economic growth
Hypothesis There is: • Unidirectional Granger-
causality from TINFI to GDP.
• Unidirectional Granger-causality from GDP to TINFI.
• Bidirectional (or feedback causality).
• Independence between TINFI and GDP. The same procedure is repeated for each of the other variables
Problem
Poor Transport infrastructure constrains growth. Less than 3 percent of GDP has been invested in transport over the years.
Roads subsector carries 96.4 per cent of the total freight yet only 16 percent of it is paved,
only 68 percent is in good condition. Only 26 per cent of the rail network is functional.
Only one wagon ferry vessel on L. Victoria and only one functional international
airport
Transport Infrastructure Investment and Economic Growth: The Case of Uganda
Richard Sendi MA Transport Economics Student 2013/14
Supervisor: Jeffrey Turner
Background Transport is the pivot around which the wheel of every economy revolves. It enables growth as it stimulates investment, lowers costs of doing business, opens up new opportunities, improves productivity and access to social services. Transport investment and economic growth do influence one another
Methodology A Granger (1969) causality approach will be used to determine the relationship between transport investment, economic growth, employment and productivity. (𝐺𝐺𝐺𝑔)𝑡 =𝛼 + ∑ 𝛽𝑖(𝐺𝐺𝐺𝑔𝑚
𝑖=1 )𝑡−𝑖 +∑ 𝛶𝑗𝑛𝑗−1 (𝑇𝐼𝐼𝐼𝐼𝑔)𝑡−𝑗+ û𝑡
(𝑇𝐼𝐼𝐼𝐼𝑔)𝑡 =µ + ∑ 𝜌𝑖(𝐺𝐺𝐺𝑔𝑚
𝑖=1 )𝑡−𝑖 +∑ 𝛹𝑗𝑛𝑗−1 (𝑇𝐼𝐼𝐼𝐼𝑔)𝑡−𝑗+ ě𝑡
Data from World Bank, and Uganda Bureau of Statistics
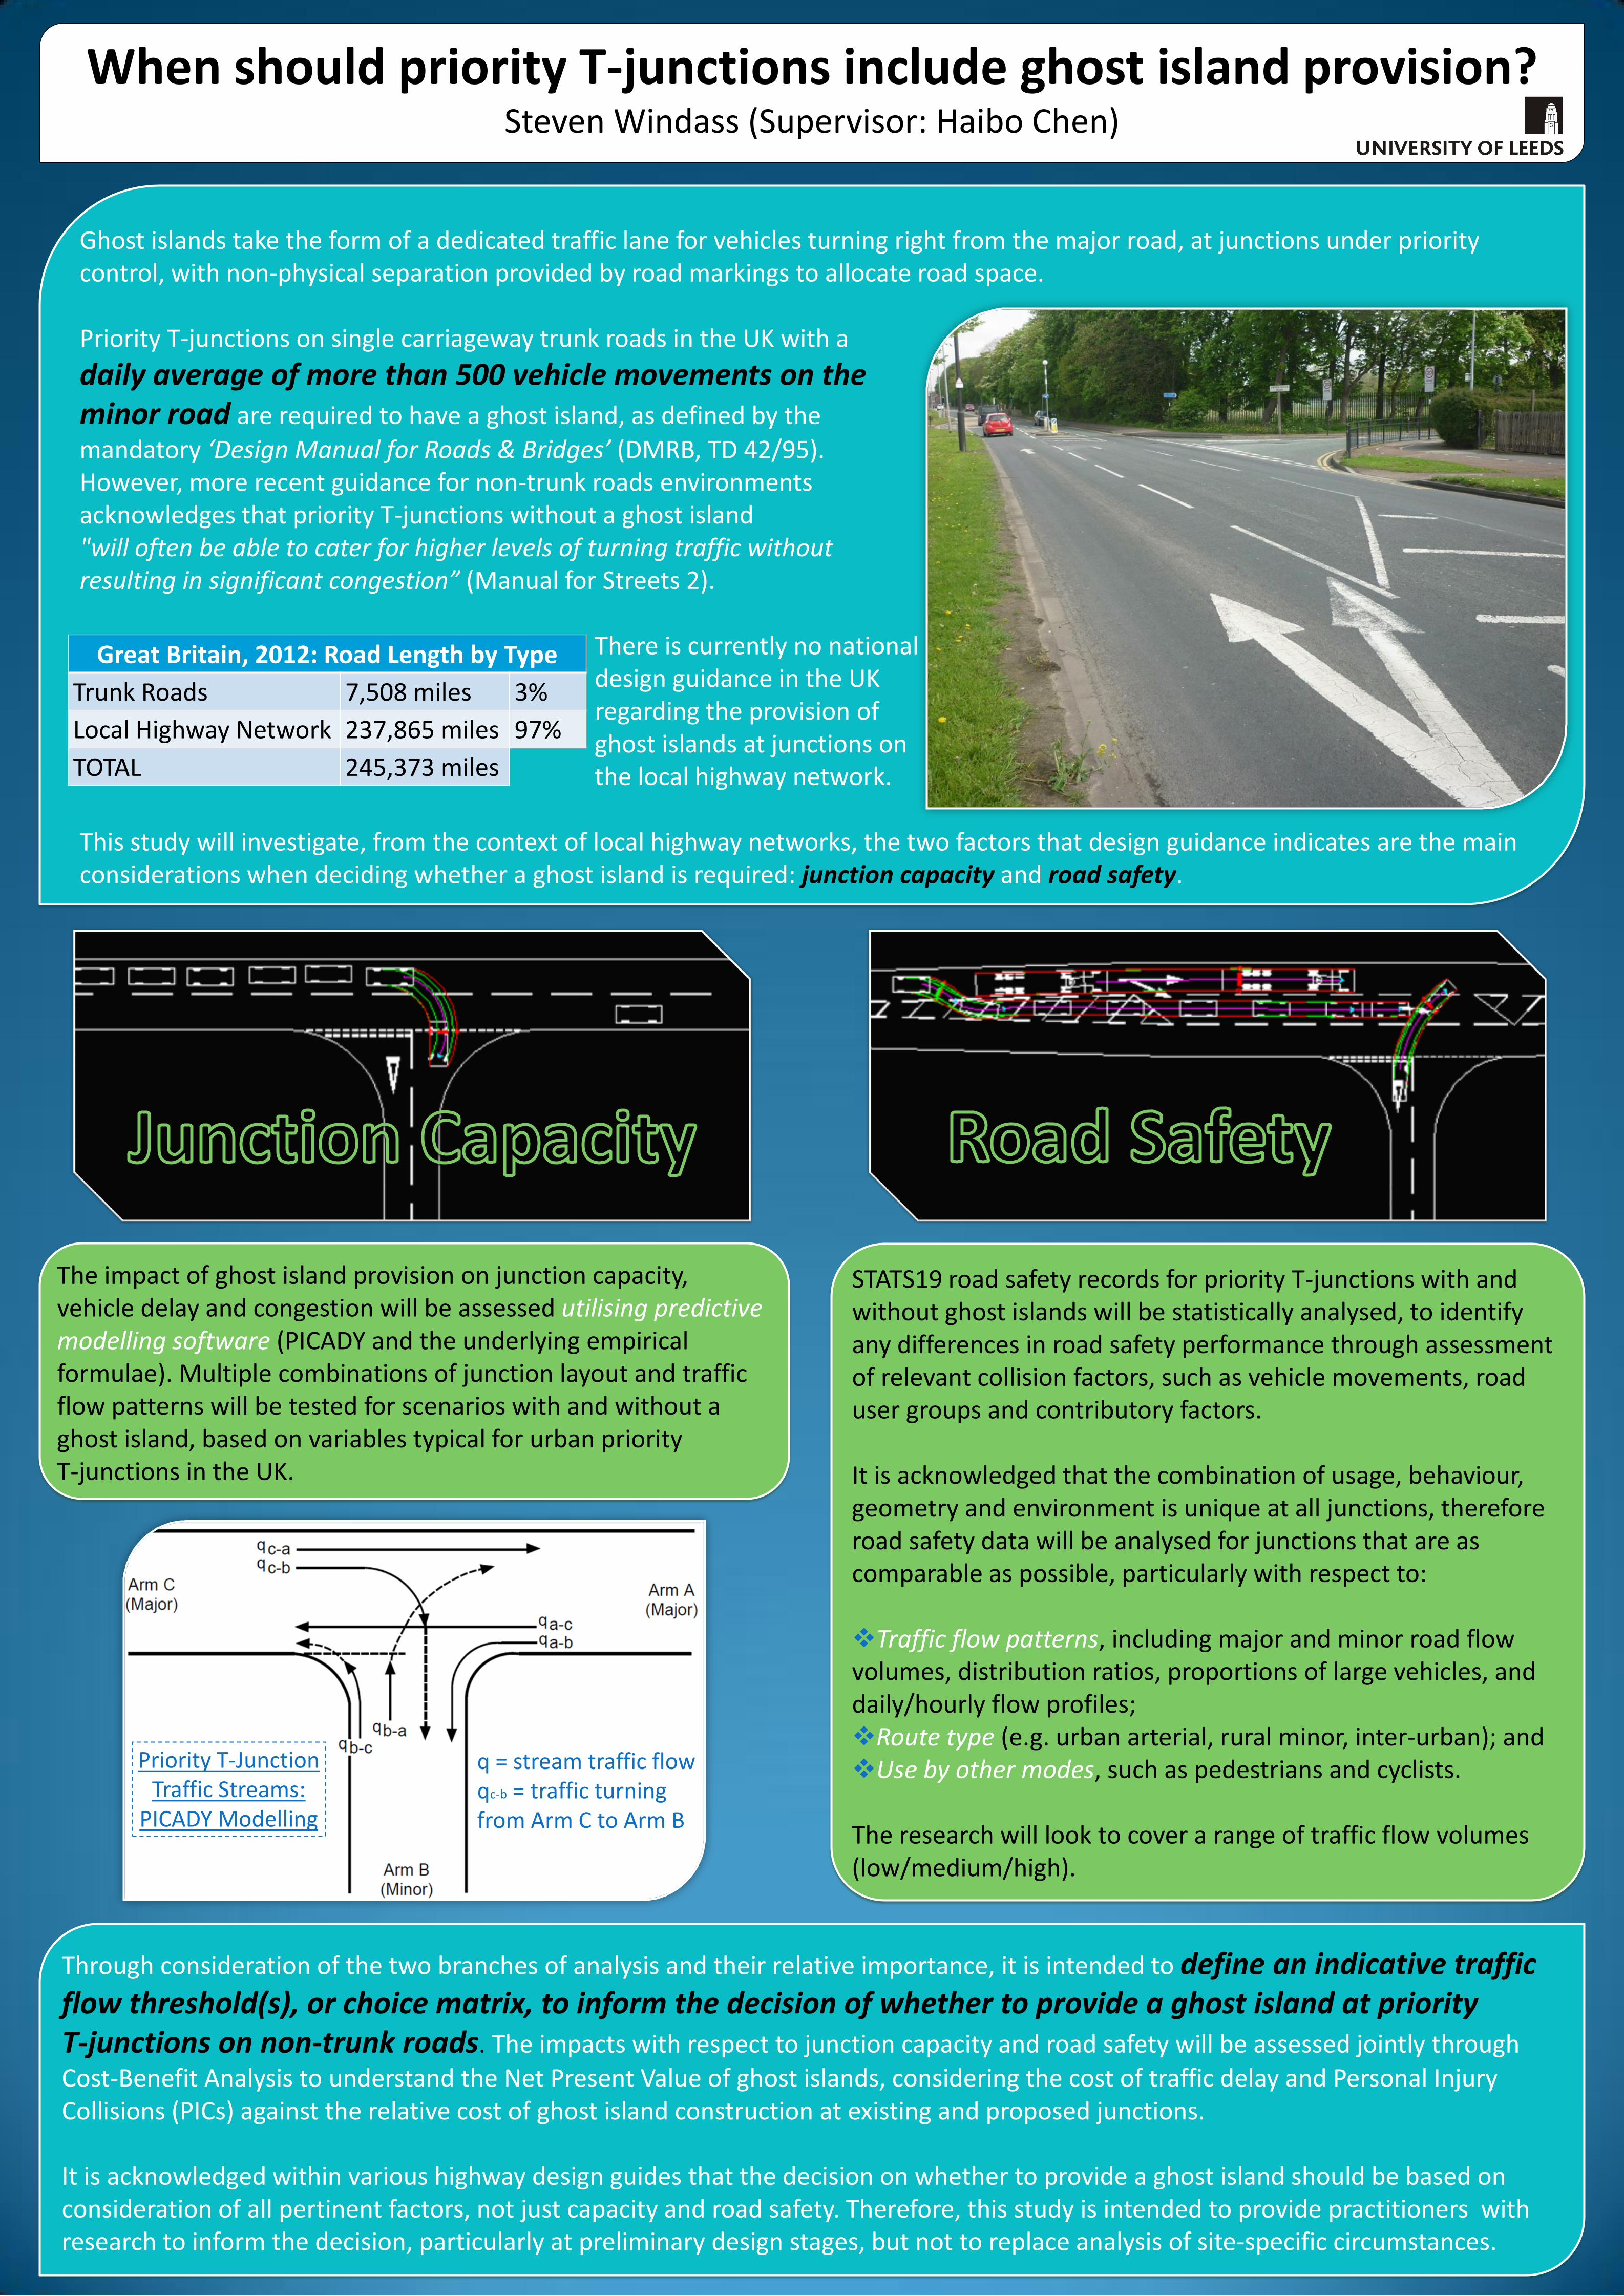
Ghost islands take the form of a dedicated traffic lane for vehicles turning right from the major road, at junctions under priority control, with non-physical separation provided by road markings to allocate road space. Priority T-junctions on single carriageway trunk roads in the UK with a
daily average of more than 500 vehicle movements on the minor road are required to have a ghost island, as defined by the
mandatory ‘Design Manual for Roads & Bridges’ (DMRB, TD 42/95). However, more recent guidance for non-trunk roads environments acknowledges that priority T-junctions without a ghost island "will often be able to cater for higher levels of turning traffic without resulting in significant congestion” (Manual for Streets 2).
There is currently no national design guidance in the UK regarding the provision of ghost islands at junctions on the local highway network.
This study will investigate, from the context of local highway networks, the two factors that design guidance indicates are the main considerations when deciding whether a ghost island is required: junction capacity and road safety.
STATS19 road safety records for priority T-junctions with and without ghost islands will be statistically analysed, to identify any differences in road safety performance through assessment of relevant collision factors, such as vehicle movements, road user groups and contributory factors. It is acknowledged that the combination of usage, behaviour, geometry and environment is unique at all junctions, therefore road safety data will be analysed for junctions that are as comparable as possible, particularly with respect to: Traffic flow patterns, including major and minor road flow volumes, distribution ratios, proportions of large vehicles, and daily/hourly flow profiles; Route type (e.g. urban arterial, rural minor, inter-urban); and Use by other modes, such as pedestrians and cyclists. The research will look to cover a range of traffic flow volumes (low/medium/high).
When should priority T-junctions include ghost island provision? Steven Windass (Supervisor: Haibo Chen)
The impact of ghost island provision on junction capacity, vehicle delay and congestion will be assessed utilising predictive modelling software (PICADY and the underlying empirical formulae). Multiple combinations of junction layout and traffic flow patterns will be tested for scenarios with and without a ghost island, based on variables typical for urban priority T-junctions in the UK.
Through consideration of the two branches of analysis and their relative importance, it is intended to define an indicative traffic flow threshold(s), or choice matrix, to inform the decision of whether to provide a ghost island at priority T-junctions on non-trunk roads. The impacts with respect to junction capacity and road safety will be assessed jointly through Cost-Benefit Analysis to understand the Net Present Value of ghost islands, considering the cost of traffic delay and Personal Injury Collisions (PICs) against the relative cost of ghost island construction at existing and proposed junctions. It is acknowledged within various highway design guides that the decision on whether to provide a ghost island should be based on consideration of all pertinent factors, not just capacity and road safety. Therefore, this study is intended to provide practitioners with research to inform the decision, particularly at preliminary design stages, but not to replace analysis of site-specific circumstances.
Priority T-Junction Traffic Streams:
PICADY Modelling
q = stream traffic flow qc-b = traffic turning from Arm C to Arm B
Great Britain, 2012: Road Length by Type
Trunk Roads 7,508 miles 3%
Local Highway Network 237,865 miles 97%
TOTAL 245,373 miles

6.07.08.09.0
10.011.0
19
92
19
93
19
94
19
95
19
96
19
97
19
98
19
99
20
00
20
01
20
02
20
03
20
04
20
05
20
06
20
07
20
08
20
09
20
10
20
11
20
12
Occ
up
an
cy(b
us
pass
en
ger
km
s p
er
bu
s se
rvic
e k
m)
Year
Average bus occupancy in Greater Manchester
Growth in bus occupancy in Greater ManchesterDissertation for Master of Transport Planning 2014
Student: Vi Ong 200813163 Supervisor: Dr. Jeremy Toner
Research QuestionsèSocial, economic, environmental or policy
determinants of occupancy rate changesservices in Greater Manchester
èPossible future patterns of change in bus passenger occupancy or loading rates in Greater Manchester
on local bus
Research ContextèDeregulation of local bus services in October 1986
èEnsuing ‘bus wars’ result in bus service provision (mileage/kilometreage) peaking at 40% above pre-deregulation level. Yet passenger use (patronage) over the same period declines by 30%.
èSince 1992, bus usage (in passenger kms) has fallen by 17%, yet bus occupancy (passenger kms per service km) has increased by 19%.
Project ContextThis topic was proposed by Transport for Greater Manchester (TfGM). TfGM is responsible for the delivery of transport infrastructure and services in Greater Manchester, and the implementation of transport policy set by the Greater Manchester Combined Authority.
This dissertation is intended to provide greater assurance for TfGM in the assumptions applied during planning for:èstop and terminal capacity at locations with high bus
volumes; andèthroughput capacity on corridors or roads with high bus
volumes in Greater Manchester.
DataManchester-specific historic and current data, relating to patronage and service provision, will be supplied by Transport for Greater Manchester (TfGM). Exclusive TfGM data sets to be utilised include the:èContinuous Passenger Survey (CPS); andèManual Bus Survey.
Other data sources to be utilised in comparisons with other case studies include reports from other transport authorities or departments, academic journals or papers, and trade/industry journals.
RisksThe project is heavily reliant on the use of secondary data. Issues may arise as a result of:èInconsistency in methodology for collection or
aggregation of data between different datasets or sources;èCommercial-in-confidence data that cannot be published
in the dissertation; orèUnavailability of data or insignificant sample sizes for
particular metrics.These risks can be mitigated by applying sensitivity testing with externally-sourced data where Manchester-specific data is not available.
Other risks pertain to time and resource availability.
Vi Ong, 2014. Piccadilly Gardens Bus and Metrolink stations, Manchester
MethodologyèReview of local bus public transport services
èLiterature review of similar studies to inform the development of potential hypotheses and variables to be tested and compared
èStatistics review from publicly-accessible sources such as Office for National Statistics, Department for Transport, TfGM and academic literature
èWorking to utilise exclusive TfGM in-house data resources
èDis-aggregate and aggregate statistics from different sources to provide common basis for comparison (e.g. location, time, etc.)
èComparisons to identify trends, including statistical analysis
200250300350400450500550600
405060708090
100110120
1975-1
976
1977-1
978
1979-1
980
1981-1
982
1983-1
984
1985-1
986
1987-1
988
1989-1
990
1991-1
992
1993-1
994
1995-1
996
1997-1
998
1999-2
000
2001-2
002
2003-2
004
2005-2
006
2007-2
008
2009-2
010
2011-2
012 P
atr
on
ag
e
(mill
ion
pass
en
ger
trip
s p
er
year)
Serv
ice p
rovi
sio
n
(mill
ion
bu
s m
iles
op
era
ted
per
year)
Financial Year
Service provision and patronage and in Greater Manchester
Service provision Patronage (unadjusted) Patronage (adjusted)
Data reproduced with permission from TfGM 2014, Email to Vi Ong, 23 April.
‘Adjusted’ patronage data is due to change in methodology adopted by TfGM.

There are 2 main objectives of this study• Understand how to encourage old people in
Taiwan to use electric bikes instead ofnormal scooter
• Analyze how to encourage old people whoonly walk or use public transportation to useelectric bikes, to increase their accessibility
Objectives
Analysis of existing dataTo know Taiwanese’s attitude toward electric bikes, i.e. How do they think of the advantages and disadvantages of electric bikes in general
Empirical work• Sample: old people in Taiwan’s suburban
• Questionnaire:
Older people’s travel behaviour
The main questions would include: Subject’sage and gender, how often do they travel,what vehicles do they use…
The factors that affect older people’swillingness
What factors affect the willingness of them tochange their habit more
Data analysis• Cross-analyse the data.
Summary and conclusionWith the data analyzed, we can conclude whatare the more practical ways to encourage olderpeople to use electric bikes
MethodologyAnalysis of existing data
To know Taiwanese’s attitude toward electric bikes, i.e. How do they think of the advantages and disadvantages of electric bikes in general
Empirical work• Sample: old people in Taiwan’s suburban
• Questionnaire:
Older people’s travel behaviour
The main questions would include: Subject’sage and gender, how often do they travel,what vehicles do they use…
The factors that affect older people’swillingness
What factors affect the willingness of them tochange their habit more
Data analysis• Cross-analyse the data.
Summary and conclusionWith the data analyzed, we can conclude whatare the more practical ways to encourage olderpeople to use electric bikes
Methodology
Taiwan at a glance Capital: Taipei
Population: 2.3million (2014)
Rural population: 5.2% (2012)
Total land area: 36,193 km²
GDP total: $517.019 billion (2013)
GDP per capita: $22,002 (2013)
In Taiwan,• The number of scooters tripled the number
of cars
• Lots of older people uses scooters
• This indicates that there is a big potential forscooter users to change to use electric bikes
In recent years, the number of electric scootersin Taiwan has increase dramatically, but thenumber of electric bikes has decrease
Background
Private passenger Cars
Motorcycle and scooters
Total registered number
5,909,115 15,139,628
Total people over 60 with license
1,739,658 2,063,130
How to encourage older people to use electric bikes in Taiwan?Yu-Hsuan Liu , Supervisor: Frances Hodgson
There are two expected outcome of the study:
• Identify the factors that would encourageolder people to use electric bikes
• Provide reference for future policy changes
Outcome
0
5000
10000
15000
20000
25000
30000
2006 2007 2008 2009 2010 2011
Electric bikes Electric scooters
Source: Data used from Taiwan Industrial Development Bureau - Electric scooter industry department Website (2014)
The advantages of electric bikes
• Help older people exercise
• Can use electric power when facing hills
• No emission
• Less costly
Electric bikes advantages