masters of the corporate portfolio - uni-paderborn.de...4 | masters of the corporate portfolio after...
TRANSCRIPT

The 2016 M&A Report
Masters of the Corporate Portfolio

The Boston Consulting Group (BCG) is a global management consulting firm and the world’s leading advisor on business strategy. We partner with clients from the private, public, and not-for-profit sectors in all regions to identify their highest-value opportunities, address their most critical challenges, and transform their enterprises. Our customized approach combines deep in sight into the dynamics of companies and markets with close collaboration at all levels of the client organization. This ensures that our clients achieve sustainable compet itive advantage, build more capable organizations, and secure lasting results. Founded in 1963, BCG is a private company with 85 offices in 48 countries. For more information, please visit bcg.com.

August 2016 | The Boston Consulting Group
MASTERS OF THE CORPORATE PORTFOLIO
JENS KENGELBACH
GEORG KEIENBURG
TIMO SCHMID
SÖNKE SIEVERS
OLIVER MEHRING
The 2016 M&A Report

2 | Masters of the Corporate Portfolio
CONTENTS
3 EXECUTIVE SUMMARY
6 FROM RECORD HEIGHTS TO AN UNCERTAIN OUTLOOKFiring on All Cylinders: M&A Activity in 2015Shifting Investor Perceptions Toward M&AHigh Valuations and Strong MomentumIs a Bubble Forming?
15 ARE DEAL-MAKING SKILLS VALUE-CREATING SKILLS?One-Timers Are Fast Out of the GateBut Early Performance Does Not Hold UpPlaying for the Long Term
21 MAKING M&A WORK: THE CHARACTERISTICS THAT SET PORTFOLIO MASTERS APART
Four Characteristics of Portfolio MastersMoving Up Can Pay Off
26 APPENDIX: SELECTED TRANSACTIONS, 2016, 2015, AND 2014
30 FOR FURTHER READING
31 NOTE TO THE READER

The Boston Consulting Group | 3
EXECUTIVE SUMMARY
Following a strong 2014, the year 2015 will go into the books as a record for global M&A deal making. But in the long run, it may also be
remembered as the year in which a sea change in investors’ appetite for deals became apparent. Capital markets have long greeted acquisition announcements with skepticism—and with good reason. Research, includ-ing our own, has consistently shown that most deals destroy value. But, as we explore in the following pages, markets in recent years have behaved differently than in the past and started bidding up shares of acquiring companies—by an average of 0.5% in the seven-day window around the announcement. In the current market environment, at least, investors are showing more trust in, and higher expectations for, dealmakers.
There’s a sound reason for this shift. Our research on, conversations with, and work for global companies and investors has found that in an extend-ed period of low growth and inexpensive financing, markets see deal mak-ing (both acquisitions and divestitures, assuming they are well planned and executed) as one of the few available avenues to grow value. Our 2015 M&A report confirmed that companies that do their homework and prac-tice disciplined postmerger integration can indeed acquire their way to growth in both earnings and shareholder returns. (See “Should Companies Buy Growth?,” BCG article, October 2015, and “From Acquiring Growth to Growing Value,” BCG article, October 2015.) Our 2014 report reached a similar conclusion about divestitures.
This year, we examine whether companies can, in effect, transact their way to value creation. The answer is that indeed they can, but it takes practice and a commitment to M&A as a strategic lever of the same sort as innova-tion or geographic or market expansion. In this year’s report, we explore the success of “portfolio masters”—companies that consistently reshape their corporate portfolios, using both acquisitions and divestitures as an essential component of their strategy. (For purposes of this report, we de-fine portfolio masters as companies that execute at least five major trans-actions, buying or selling, over a five-year period.) For these companies, M&A is a viable—and proven—value creation strategy.

4 | Masters of the Corporate Portfolio
After back-to-back years of high double-digit growth, the market is now sending mixed signals.
• Total M&A activity in 2015 returned to levels last seen in the boom years of 1999 and 2007. Global deal value increased by almost 40% on top of already solid growth in 2014 of more than 20%.
• Growth was strong across almost all sectors, with a number of industries showing high double- or even triple-digit percentage increases. The value of M&A deals also increased strongly in all major regions.
• There is a shift underway in investors’ views of M&A. Despite rising deal premiums and record valuation multiples in 2015, initial market reaction has been positive not only for sellers but also for acquirers, presumably the consequence of macroeconomic circumstances and market exuberance.
• Transaction valuation levels are higher than ever before. Across all sectors, the median target company in our sample was valued at a record-high 14 times EBITDA, exceeding even the heights in the “new economy” of the 1990s or the pre-Lehman bankruptcy era. The combination of high valuation levels and the magnitude of M&A as a percentage of GDP sent signals of a potential bubble by the end of 2015, and market participants entered 2016 on a more cautious note. Both the volume and the value of deals subsided significantly: deal value was down 27% in the first half of 2016 compared with the first half of 2015.
• At the same time, the second quarter of 2016 saw a small uptick of 14% from the first quarter announced deal value, and the funda-mental deal drivers of low GDP growth, cheap money, and avail-able cash are still in place. Private equity’s dry powder continues to grow (after five straight years), and investors favor strategic M&A to realize growth in an otherwise stagnating environment.
• Irrespective of aggregate deal levels for the rest of 2016 and beyond, the core question is whether firms are generating superior returns for shareholders from the transactions that they pursue and, particularly, at what level of risk—the latter a factor often neglected in boardrooms when it comes to M&A decision making.
Deal-making skills are value-creating skills.
• Can companies use deal-making skills on both sides of the transac-tion as a strategic tool for value creation—and if so, what sets these companies apart from other corporate buyers and sellers?
• Three types of dealmakers—portfolio masters, strategic shifters (making two to four deals within a five-year time frame), and one-timers (pursuing only one transaction in five years)—illustrate how different kinds of companies achieve markedly different results through M&A.

The Boston Consulting Group | 5
• Capital markets tend to reward one-timers on deal announcement, likely appreciating the once-in-a-lifetime deal opportunity. Over the medium and long term, however, more active dealmakers clearly outperform in terms of generating value for shareholders.
• In the long run in particular, portfolio masters outperform one-timers with an average annual total shareholder return of 10.5% versus 5.3%. Moreover, they achieve the higher return at substantially lower volatility—that is, they expose their sharehold-ers to less risk because of better integration management when buying, and better preparation when selling, a business.
Our analysis pinpoints four characteristics that distinguish port-folio masters from other companies.
• Active dealmakers are bold. They pay higher premiums and multiples in order to win a target because they have more experience in assessing potential synergies and integration costs. They also can afford to pay more because they have better M&A processes.
• They target growth even at the cost of acquiring companies with lower margins. Portfolio masters ultimately aim for growth from M&A. They acquire high-growth companies in order to enhance overall portfolio growth—even if the target business has lower margins—while divesting lower-growth firms.
• They execute M&A irrespective of the actual capital market environment. Portfolio masters do not shy away from transac-tions when facing high market volatility.
• They move fast. With an average closing time of 72 days when buying and 82 days when selling, portfolio masters execute transactions 30 days faster than one-timers—meaning that the latter lose one month between contract and closing, during which they have limited control over their assets.
Companies that train themselves to become proficient at M&A also learn how to create superior shareholder value.
• One-timers that executed deals more frequently over succeeding five-year periods outperformed their former one-timer peers by roughly 5 percentage points in terms of shareholder return.
• Their former peers, on the other hand, generated minimal to no appreciable shareholder return.

6 | Masters of the Corporate Portfolio
FROM RECORD HEIGHTS TO AN UNCERTAIN OUTLOOK
It’s hard for any market to maintain double-digit growth rates for long, even
when the fundamentals are acting mostly in its favor. Following a strong 2014 and a heated 2015, when M&A activity approached record territory, the announced volume and value of deals subsided sharply in the first half of this year, with global deal values contracting 27% compared with the first half of 2015. That said, the second quarter of 2016 saw a 14% increase in activity over the first three months of this year. Looking out from its new heights, the market appears unsure where it is headed.
General market uncertainty and increased volatility may be good reasons for companies to take a cautious approach to transactions (even though certain types of dealmakers actually thrive in this type of environment, as we will show later in detail). Corporate caution and market unpredictability are fueled by a number of factors, including the following:
• An unclear economic and political future for the European Union, resulting in part from the UK’s vote to exit the bloc.
• Significantly higher volatility in equity markets, complicating execution of IPOs as part of an M&A “dual track” strategy and making share-based deals in general less predictable.
• A tightening of regulations to thwart so-called inversion deals (transactions that enable companies to reduce tax burdens by establishing new domiciles overseas).
The number of deals—and big deals—that have been aborted or withdrawn is substan-tial: the failed Pfizer-Allergan transaction, the terminated Halliburton–Baker Hughes merger discussions, and the canceled divest-ment of Philips’s lighting equipment business unit to Chinese investor GO Scale Capital are only a few examples.
Looking out from its new heights, the market appears unsure where it is headed.
Still, first-half 2016 M&A levels are on a par with ten-year averages, and there is plenty of disagreement among practitioners as to whether the recent slowdown represents the beginning of a significant drop-off in activity or just a temporary pause in a market with plenty of momentum left.
As always, geopolitical events are a wildcard. In our view, most (if not all) of the funda-mental drivers of M&A activity in 2014 and
The Boston Consulting Group | 7
2015 are still in place—low GDP growth, cheap money, available cash, and the need for growth among companies and for returns among private equity (PE) players. Deal mak-ing remains broadly active across industries and geographies. In some regions, such as China, outbound deal activity levels rose above historical levels in the first part of 2016.
Regardless of whether we are facing a breath-er or a more serious break in the action, there are compelling reasons for more companies to look more seriously into M&A—on both sides of the transaction—as a powerful tool for value creation, as we explore in depth in this report.
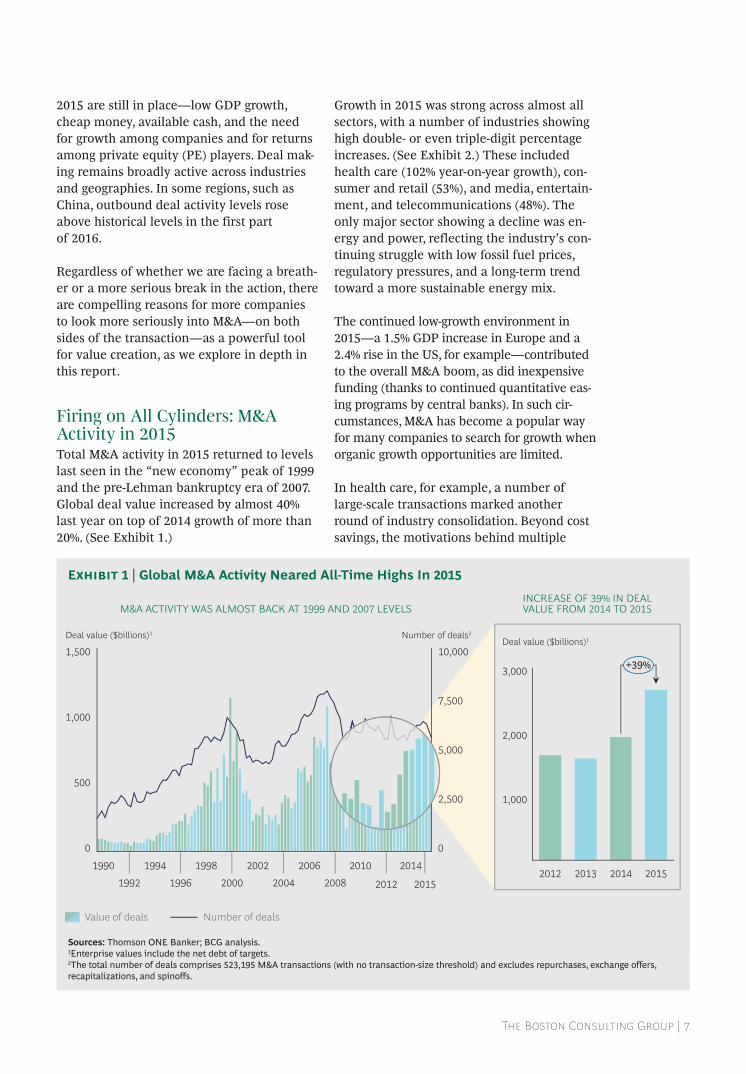
Firing on All Cylinders: M&A Activity in 2015Total M&A activity in 2015 returned to levels last seen in the “new economy” peak of 1999 and the pre-Lehman bankruptcy era of 2007. Global deal value increased by almost 40% last year on top of 2014 growth of more than 20%. (See Exhibit 1.)
Growth in 2015 was strong across almost all sectors, with a number of industries showing high double- or even triple-digit percentage increases. (See Exhibit 2.) These included health care (102% year-on-year growth), con-sumer and retail (53%), and media, entertain-ment, and telecommunications (48%). The only major sector showing a decline was en-ergy and power, reflecting the industry’s con-tinuing struggle with low fossil fuel prices, regulatory pressures, and a long-term trend toward a more sustainable energy mix.
The continued low-growth environment in 2015—a 1.5% GDP increase in Europe and a 2.4% rise in the US, for example—contributed to the overall M&A boom, as did inexpensive funding (thanks to continued quantitative eas-ing programs by central banks). In such cir-cumstances, M&A has become a popular way for many companies to search for growth when organic growth opportunities are limited.
In health care, for example, a number of large-scale transactions marked another round of industry consolidation. Beyond cost savings, the motivations behind multiple
M&A ACTIVITY WAS ALMOST BACK AT 1999 AND 2007 LEVELS
19921994
19961998
20002002
200420061990
0
500
1,000
1,500
0
2,500
5,000
7,500
10,000Number of deals2Deal value ($billions)1
1,000
3,000
2,000
+39%
20142012 20152013
Deal value ($billions)1
INCREASE OF 39% IN DEALVALUE FROM 2014 TO 2015
2014
201520082010
2012
Value of deals Number of deals
Sources: Thomson ONE Banker; BCG analysis.1Enterprise values include the net debt of targets.2The total number of deals comprises 523,195 M&A transactions (with no transaction-size threshold) and excludes repurchases, exchange offers, recapitalizations, and spinoffs.
Exhibit 1 | Global M&A Activity Neared All-Time Highs In 2015

8 | Masters of the Corporate Portfolio
megadeals included building out product portfolios (Teva-Allergan) and strategic re-alignment (the Sanofi-Boehringer Ingelheim asset swap). Tax efficiencies were also a deal driver for part of the year until the US gov-ernment moved to stop inversion transac-tions involving US companies.
Large-scale consolidation (such as Anheuser- Busch InBev’s acquisition of SABMiller and the Heinz-Kraft merger) was behind M&A growth in consumer goods and retailing. Companies in this sector also pursued small-er transactions in order to acquire new capa-bilities—especially in the areas of digital innovation and e-commerce.
Two principal drivers were behind activity in the high-tech sector: technology companies expanding their offerings toward integrated systems (Dell’s acquisition of data storage company EMC is one example of this) and nontech players acquiring technology compa-
nies in order to augment their product offer-ings and their internal capabilities. In fact, nontech acquirers appear to have at least three motives in snapping up digital assets. One is the acquisition of new technology platforms in order to expand their core busi-ness—one example being clothing maker Un-der Armour looking to boost sales by gaining access to a digital fitness network, MyFitness-Pal. A second is to gain control of a strategic technology. German automakers Audi, Daim-ler, and BMW paid $3.1 billion for Nokia’s maps business (“Here”)—a key technology for self-driving cars. The third is the desire to improve operations by using technology to enhance productivity—the rationale behind tire manufacturer Saehwa Imc’s acquisition of Cube Tech, a 3D printing company.
The value of M&A deals increased significant-ly in all major regions. Deal value in North America jumped 47% to $1.4 trillion in 2015, fueled by a 53% growth in domestic M&A and
199
295
251
216
214
2015
2,657
292
514
295
435
385
Media, entertainment, and telecommunicationsIndustrials and materials
Consumer and retailHigh technologyHealth care
Energy and powerFinancial services and real estate
303
432
2014
1,921
318
428
DOUBLEDIGIT+ GROWTH ACROSS SECTORS
–8%
+20%
+48%
+47%
+53%
+41%
+102%
Deal value ($billions)1
MACROTRENDS DRIVING M&A ACTIVITY
Cheap funding• Current US corporate Aaa bond yield of 3.55%
versus 4.99% in 20112 • European Central Bank’s refinancing rate: 0.00%3
Low-growth environment• 2015 GDP growth in Europe and the US of 1.5%
and 2.4%, respectively
Sources: Thomson ONE Banker; industry reports; Federal Reserve; BCG analysis. Note: Because of rounding, not all numbers add up to the totals shown.1Enterprise values include the net debt of targets.2This data compares the US Aaa corporate bond yield in June 2016 versus June 2011.3This information is as of March 10, 2016.
Exhibit 2 | Most Sectors Showed Big M&A Increases

The Boston Consulting Group | 9
a big rise in cross-border transactions, many originating from Asia (a 32% increase over 2014). China was especially active: for exam-ple, Qingdao Haier acquired GE’s appliances business, and Tencent Holdings bought video game maker Riot Games.
M&A activity in Asia-Pacific grew by 60% to $539 billion. Transactions in Europe, which totaled $568 billion, showed the smallest in-crease, only 18%. European-based acquirers lost their appetite, in particular, for targets in their neighborhood. The total year-over-year value of intra-Europe deals contracted by 5% to $315 billion, while European-originated acquisitions in North America increased by roughly one-third. The shift toward North America could be seen as a flight to a “safe haven.” Political instability in parts of Europe and unresolved questions regarding econom-ic and political integration in the European Union may continue to push European buy-ers to look for targets in more stable environ-ments with better growth prospects.
Shifting Investor Perceptions Toward M&AThere seems to be a shift in investors’ views of M&A. We would argue, however, that it is temporary and based on current macroeco-nomic conditions rather than a longer-term sea change.
The typical paradigm for years was that while sellers earned an attractive takeover premium on the deal, the average acquirer’s stock fell on concerns of poor strategic fit, deal complexity, or doubts about synergy realization. In the past three years, however, despite high and ris-ing pre-announcement valuation levels and generous acquisition multiples, the cumulative abnormal returns of both targets and acquirers have been positive. (CAR assesses a deal’s im-pact by measuring the total abnormal change in market value over a seven-day window cen-tered on the transaction announcement date.1) Unsurprisingly, average sell-side returns of 18% in 2015 were significantly above their long-term average, reflecting the attractive valua-tion levels at that time. (See Exhibit 3.)
As highlighted in our recent investor survey, investors are looking for new value-creation strategies in a world of low GDP growth and limited opportunities. (See “In a Tough Mar-ket, Investors Seek New Ways to Create Val-ue,” BCG article, May 2016.) Strategic acquisi-tions are more often than not seen as the most effective value-creating use of capital, even despite lofty acquisition multiples.
High Valuations and Strong MomentumValuation levels were at all-time highs in 2015, with the median deal fetching an enter-
–3
–2
0
2
1
–4
–1
1994
Average CAR (%)1
20152010
Ø 0.9
200219981990 2006
0.5%
ACQUIRERS’ PERFORMANCEPUBLICTOPUBLIC DEALS
TARGETS’ PERFORMANCEPUBLICTOPUBLIC DEALS
8
10
12
14
16
18
20
22
2002 20101994 20061998
Average CAR (%)1
1990
18.0%
Ø 15.7
2015
Sources: Thomson Reuters Datastream; Thomson Reuters Worldscope; BCG analysis.1CAR = cumulative abnormal return calculated over a seven-day window centered around the announcement date (+3/−3).
Exhibit 3 | Lately, Investors Have Changed Their Response to Acquisitions
10 | Masters of the Corporate Portfolio
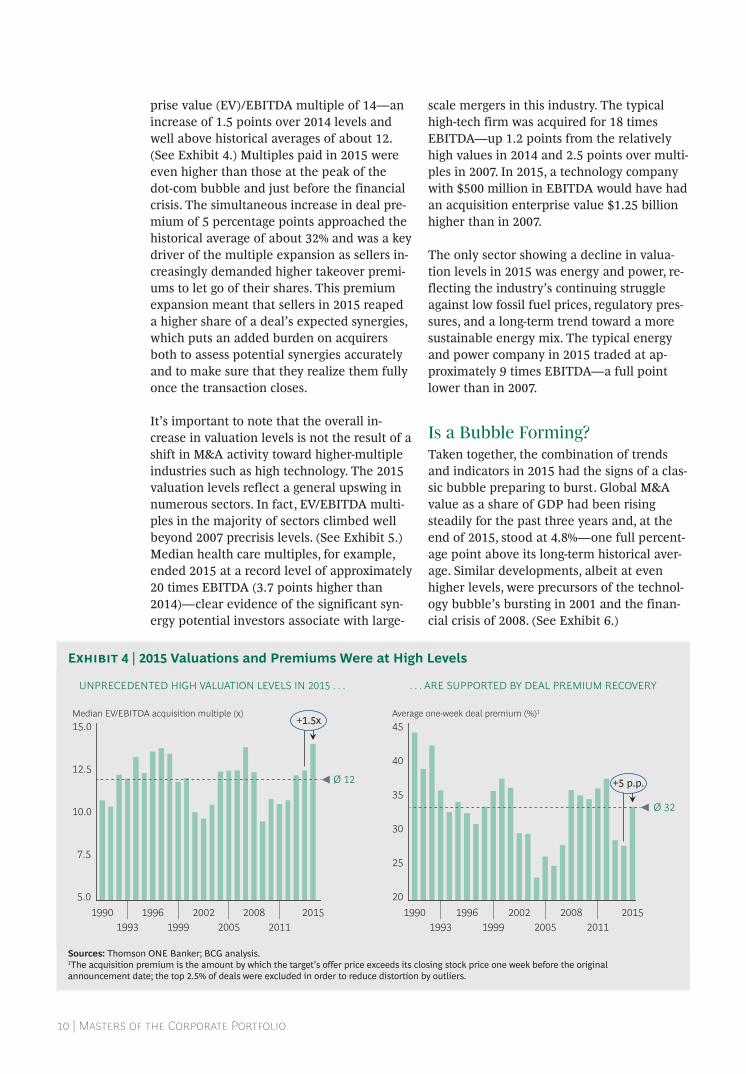
prise value (EV)/EBITDA multiple of 14—an increase of 1.5 points over 2014 levels and well above historical averages of about 12. (See Exhibit 4.) Multiples paid in 2015 were even higher than those at the peak of the dot-com bubble and just before the financial crisis. The simultaneous increase in deal pre-mium of 5 percentage points approached the historical average of about 32% and was a key driver of the multiple expansion as sellers in-creasingly demanded higher takeover premi-ums to let go of their shares. This premium expansion meant that sellers in 2015 reaped a higher share of a deal’s expected synergies, which puts an added burden on acquirers both to assess potential synergies accurately and to make sure that they realize them fully once the transaction closes.
It’s important to note that the overall in-crease in valuation levels is not the result of a shift in M&A activity toward higher-multiple industries such as high technology. The 2015 valuation levels reflect a general upswing in numerous sectors. In fact, EV/EBITDA multi-ples in the majority of sectors climbed well beyond 2007 precrisis levels. (See Exhibit 5.) Median health care multiples, for example, ended 2015 at a record level of approximately 20 times EBITDA (3.7 points higher than 2014)—clear evidence of the significant syn-ergy potential investors associate with large-
scale mergers in this industry. The typical high-tech firm was acquired for 18 times EBITDA—up 1.2 points from the relatively high values in 2014 and 2.5 points over multi-ples in 2007. In 2015, a technology company with $500 million in EBITDA would have had an acquisition enterprise value $1.25 billion higher than in 2007.
The only sector showing a decline in valua-tion levels in 2015 was energy and power, re-flecting the industry’s continuing struggle against low fossil fuel prices, regulatory pres-sures, and a long-term trend toward a more sustainable energy mix. The typical energy and power company in 2015 traded at ap-proximately 9 times EBITDA—a full point lower than in 2007.
Is a Bubble Forming?Taken together, the combination of trends and indicators in 2015 had the signs of a clas-sic bubble preparing to burst. Global M&A value as a share of GDP had been rising steadily for the past three years and, at the end of 2015, stood at 4.8%—one full percent-age point above its long-term historical aver-age. Similar developments, albeit at even higher levels, were precursors of the technol-ogy bubble’s bursting in 2001 and the finan-cial crisis of 2008. (See Exhibit 6.)
UNPRECEDENTED HIGH VALUATION LEVELS IN 2015 . . . . . . ARE SUPPORTED BY DEAL PREMIUM RECOVERY
20
25
30
35
40
45
19961993
1990
Average one-week deal premium (%)1
Ø 32
20152011
20082005
20021999
5.0
7.5
10.0
12.5
15.0Median EV/EBITDA acquisition multiple (x)
Ø 12
20152005 2011
200820021999
19961993
1990
+1.5x
+5 p.p.
Sources: Thomson ONE Banker; BCG analysis.1The acquisition premium is the amount by which the target’s offer price exceeds its closing stock price one week before the original announcement date; the top 2.5% of deals were excluded in order to reduce distortion by outliers.
Exhibit 4 | 2015 Valuations and Premiums Were at High Levels

The Boston Consulting Group | 11
18
9
1112
12
20
5
4
3
2
1
0
–1
–2
–3
–4
–5543210–1–2
Absolute multiple change, 2014–20151
Absolute multiple change, 2007–20151
Bubble size reflects EV/EBITDA multiple
ABSOLUTE CHANGE IN EV/EBITDA MULTIPLE: 20142015 VERSUS 20072015
Health care
Hightechnology
Industrials andmaterials
Energy andpower
Consumerand retailTMT2
10
4.8
Ø 3.8
5.8
8.7
1992 1995 2000 2005 201020151999 2007
Recession years in the US
NORTH AMERICA
9.1
Average1992–2015
7.0
2015
4.0
Average1992–2015
+0.5
2015
4.5
GLOBAL M&A VALUE AS A SHARE OF GDP %
0
EUROPE
+2.1
Sources: Thomson ONE Banker; BCG analysis.1Multiple relates to median EV/EBITDA.2TMT includes media, entertainment, and telecommunications.
Sources: International Monetary Fund; Thomson ONE Banker; BCG analysis.Note: Deal values are based on announced deal value.
Exhibit 5 | Most Sectors’ 2015 Valuations Were Well Above Precrisis Levels
Exhibit 6 | Are We Heading Toward a Bubble?

12 | Masters of the Corporate Portfolio
And, in fact, M&A value contracted in the first half of 2016 by more than 25% compared with the first half of 2015. That said, deal activity is at a par with ten-year historical averages, and the jury is still out on whether there are similarities to previous M&A market collapses. (See Exhibit 7.) The second quarter of 2016 saw a 14% uptick in activity from the first.
Going forward, we see two underlying factors supporting continued M&A activity. First, while PE buyers were highly active in 2015, their war chests also continued to grow, and they still face the need to put their money into play. (See Exhibit 8.)
Second, investors are pushing corporate lead-ers to pursue strategic deals. (See Exhibit 9.) More investors than ever see strategic M&A as an attractive way to deploy capital in the current low-growth, cheap-funding environ-ment (48% in our 2016 investor survey versus a 41% average among our 2009 through 2015 investor surveys). At the same time, in a clear sign of the times, fewer investors than ever prefer increasing investment in organic growth.
Irrespective of whether overall M&A market activity remains at current levels, slows through 2016, or bounces back in the second half, so long as debt funding is relatively cheap and economic growth is low, M&A deals will flow. And while some investors appear to be taking a balanced and cautious approach in these circumstances, others are likely to see this time as an opportunity to make bids for carefully selected and well-tracked assets. One such example is the pro-posal by SoftBank of Japan to acquire British chipmaker ARM in the aftermath of the UK’s “Brexit” vote and the related weakness in the British pound.
Other companies will continue with their strategic agenda despite the market back-drop—see Bayer’s bid for Monsanto or Micro-soft’s proposal to acquire LinkedIn, for exam-ple. The first six months of 2016 have also highlighted (again) that China is a force to be reckoned with. ChemChina’s $43 billion bid for agrochemical company Syngenta, HNA Group’s proposed $6.3 billion acquisition of IT distributor Ingram Micro, and Midea’s $4.5 billion tilt at industrial robot-maker Kuka are just three examples among many
Announced deal value ($billions)1
27% DECREASE IN DEAL VALUEFIRSTHALF 2015 VERSUS
FIRSTHALF 2016 . . .. . . BUT ACTIVITY IS STILL ON A PAR WITH THE
TENYEAR HISTORICAL AVERAGE
1,000
500
1,500
2,000
First-half2016
First-half2015
0
5,000
10,000
15,000
1,500
2,000
1,000
500
020162015201420132012201120102009
First-half-year deal value ($billions)1 Number of deals2
200820072006
Average first-half-year deal value, 2006–2016Number of deals
–27%
Sources: Thomson ONE Banker; BCG analysis.1Enterprise values include the net debt of targets.2The total number of deals excludes repurchases, exchange offers, recapitalizations, and spinoffs; there is no transaction-size threshold.
Exhibit 7 | Deal Activity Is Still on a Par with the Ten-Year Average

The Boston Consulting Group | 13
DEVELOPMENT OF PE ACTIVITY1 PE DRY POWDER ON A STEADY RISE2
Value of dealsNumber of deals
0
200
400
600
800
1,000
0
1,000
2,000
3,000
4,000
5,000
Number of dealsDeal value ($billions)
20022000
1998
+28%
20152012
20102008
20062004
479460431
399353
388422
481482438
379
258
176185
March2016
201420122010200820062004
Fund size ($billions)
KEY TRENDS THAT DRIVECORPORATE ACQUISITIONS
Shareholder demand forstrategic M&A
Silver bullet to counterslow economic growth
Continuously cheapfunding
Safeguard againstbecoming a target in aconsolidation play
35
INVESTORS BULLISH ON M&A
6541 37
20 22 15
58 4826 17 16
Retiredebt
Stockrepurchase
program
Increase dividends
Pursuestrategic
M&A
Step uporganic
investment
Survey question:“Given your expectations, what do you think the optimal deployment ofcapital and free cash flow should be for healthy companies that generate strong freecash flow beyond dividend and debt payment commitments?” Rank your top three options.
Build cashon balance
sheet
20162009–2015 average
Growth focus Payout focus Balance sheet focus
–3% +1%–9%–7% +7% +13%
Respondents who choseoption first or second (%)
Percentage point change fromthe 2009–2015 average
Sources: Thomson ONE Banker; Preqin; BCG analysis.Note: In the right-hand graphic, each bar represents data on December 31 of the year noted, with the exception of 2016, for which data is available only through March 31, 2016.1This analysis is based on completed deals, including buyouts and deals involving private equity sponsors, with at least 75% of shares acquired or divested.2Amounts include buyout funds only.
Sources: Industry reports; “In a Tough Market, Investors Seek New Ways to Create Value,” BCG article, May 2016; 2016 BCG Investor Survey; BCG analysis. Note: Responses to the option “pay special dividend” (9%) were excluded because this option was not offered in previous surveys.
Exhibit 8 | Private Equity War Chests Keep Growing
Exhibit 9 | Shareholder Demand for M&A Is Stronger Than Ever

14 | Masters of the Corporate Portfolio
that illustrate the magnitude of China’s out-bound M&A appetite.
No matter where the market goes, the core question is whether firms are generating su-perior returns for shareholders from the transactions that they pursue and at what level of risk—a factor often neglected in boardrooms when it comes to M&A decision making.
Note1. BCG performs standard event-study analysis on each deal in our database to calculate the cumulative abnormal return (CAR) over the seven-day window centered around the date a deal was announced. Short-term returns are not distorted by other events— a material advantage over some other M&A metrics.

The Boston Consulting Group | 15
Last year’s M&A report looked into whether frequent acquirers grow faster
and create more value for their shareholders. The 2014 report examined the importance of divestitures to creating value. Corporate leaders today are wise to consider options on both sides of the M&A board. And more often than not, buy-side and sell-side decisions are closely intertwined, as in when companies need to free up cash to buy a promising prospect or antitrust authorities require the sale of certain assets as part and parcel of a major acquisition.
Corporate leaders today are wise to consider options on both sides of the M&A board.
This year, we used our proprietary database of more than 54,000 M&A transactions since 1990 to assess whether companies can employ their deal-making skills on both sides of the transaction as a strategic tool for value cre-ation, and if so, what sets these companies apart from other corporate buyers and sellers.
In our work with our clients, we see three typical types of corporate dealmakers. We call them “portfolio masters,” “strategic shift-ers,” and “one-timers.”
Portfolio masters are serial dealmakers such as GE, Accor, and Cisco; they use M&A as an instrument to routinely rebalance their port-folio of businesses, and many do so with frequency. In quantitative terms, we define portfolio masters as companies that execute at least five major transactions (buying or selling) over a five-year period.1 For example, within the past five years (from 2011 through 2015), GE bought 19 major businesses and sold more than 50 major assets, such as its $32 billion sale of NBC Universal to Comcast. (GE’s total deal count for the period exceeds 300 when smaller deals and minority stakes are included.) Cisco acquired 17 companies while divesting its television set-top box busi-ness in 2015 to Technicolor.
Portfolio masters are a rare but prolific breed. Taking the full 25 years of transac-tions in our database into account, we can identify 1,339 companies in this category, representing only 6% of the companies in our sample. Yet these companies accounted for almost 14,000 deals, or about 25% of global M&A over the past 25 years, and an even higher share of total transaction volume (37%). They are responsible for many of the largest deals ever done and have an average transaction size of $933 million.
Strategic shifters are companies that frequent-ly rebalance their portfolios through M&A; they are involved in two to four transactions
ARE DEAL-MAKING SKILLS VALUE-CREATING SKILLS?

16 | Masters of the Corporate Portfolio
over a five-year period. They make up approx-imately one quarter of companies in our sam-ple (6,354) and include such names as Mattel, Texas Instruments, and K+S. This category was responsible for the largest share of trans-actions—about 22,000 deals worth close to $13 trillion, or 40% of the total. These compa-nies tend to have significant M&A experience but do not use deal making consistently as a primary tool for shaping their portfolios.
The largest group of companies by number (roughly two-thirds of the sample) are one-timers—more than 11 times as many companies as there are in the portfolio master category. Some 15,000 companies have made only one acquisition or divestiture each over a five-year time window. Yet, with a combined count of 18,891 deals since 1991, they repre-sent 35% of total M&A deals globally.
One immediate conclusion: for the typical CEO, M&A is a once-in-a-lifetime activity; most companies prefer to pursue organic growth. As we shall see, this bias may work to their shareholders’ detriment.
One-Timers Are Fast Out of the GateInvestors like one-time dealmakers—at least in the short term. According to our sample, capital markets tend to buy into the story of a once-in-a-lifetime opportunity for acquirers. They are also appreciative when a company sheds a noncore asset that it more than likely held onto for too long. As a result, the initial capital market reaction is distinctly more pos-itive for one-time dealmakers than for their more active counterparts.
One-timers receive the largest capital market appreciation of all three categories of corpo-rate dealmakers, as expressed by short-term CAR—an average increase of 5.5%. This find-ing is consistent with our prior research on buy-side transactions (see “From Acquiring Growth to Growing Value,” BCG article, Octo-ber 2015) and holds true across different mar-ket phases.2 One-timers also have the highest share of deals that create a positive short-term market reaction: 64% of their deals were received positively by capital markets. By contrast, the average immediate excess return
for portfolio masters is only 0.5%. It seems that capital markets already factor in that fre-quent deal-making firms will engage in ongo-ing portfolio adjustments, so news of an up-coming acquisition or divestiture is actually no real news at all. (See Exhibit 10.)
Portfolio masters expose investors to the lowest level of risk.
The element of surprise becomes more visi-ble when looking at the range between each category’s average positive and negative CAR on deal announcement. Favorably received deals by one-timers earn an average CAR of 12.1%, while deals raising doubts result in an average CAR of –6.5% on deal announce-ment. The spreads for strategic shifters (7.4% to –5.1%) and especially for portfolio masters (4.8% to –4.1%) are much narrower. Because portfolio masters and, to some extent, strate-gic shifters are better known quantities in an M&A context, investors expect them to en-gage in transactions and the assessments of their deals coalesce more quickly.
But Early Performance Does Not Hold UpOne year after the deal announcement date, portfolio masters clearly outperform, as meas- ured by relative total shareholder return (RTSR)—that is, a company’s total sharehold-er return (TSR) compared with its sector in-dex. Portfolio masters generate an average RTSR of 4.1%—more than 1 percentage point higher than one-timers. Even more significant, portfolio masters generate their deal returns at significantly lower share price volatility (36% standard deviation of RTSR as compared with 50% for one-timers), expos-ing investors to the lowest level of risk. (See Exhibit 11.)
How do they do it? The biggest difference be-tween portfolio masters and less experienced M&A dealmakers is their insight into the asso-ciated deal risk. Given their experience and frequent use of M&A as a strategic tool, port-

The Boston Consulting Group | 17
ONETIMERS HAVE THE HIGHEST SHORTTERMCAR AND POSITIVE MARKET REACTION
THE “SURPRISE EFFECT” DRIVES PRONOUNCEDCAR RANGE FOR ONETIMERS
5.5%
2.0%***
0.5%***
% of positive market reaction
Average CAR
Portfoliomasters
Strategicshiers
One-timers
Portfoliomasters
Strategicshiers
One-timers
Average CAR, negative deals
Average CAR, positive deals
7.4%4.8%
12.1%
–6.5%–5.1%–4.1%
Ø CAR1 Ø CAR1
52% 57% 64%
3.03.9**
4.1**
PORTFOLIO MASTERS OUTPERFORMON ONEYEAR RTSR . . .
One-year RTSR (%)1
49.841.9***
36.4***
. . . WITH MUCH LOWER VOLATILITY . . .
Volatility (%)2
11.29.3
5.9
. . . RESULTING IN SIGNIFICANT RISKADJUSTED OUTPERFORMANCE
Risk-adjusted performance measure3
Portfoliomasters
Strategicshiers
One-timers
Portfoliomasters
Strategicshiers
One-timers
Portfoliomasters
Strategicshiers
One-timers
Sources: Thomson ONE Banker; BCG analysis.Note: Deals include all types of transactions (public to public, public to private, and public to subsidiary). Between 1991 and 2015, a total of 12,847 deals were observed for portfolio masters, 19,164 deals for strategic shifters, and 15,216 deals for one-timers.1CAR = cumulative abnormal return calculated over a seven-day window centered around the announcement date (+3/−3). There is a statistically significant difference in CAR for portfolio masters versus strategic shifters and for strategic shifters versus one-timers (using a two-sample t-test): *significant at p<0.1; ** significant at p<0.05; *** significant at p<0.01.
Sources: Thomson ONE Banker; BCG analysis. Note: This analysis, which spans the years from 1991 through 2015, is based on a total of 39,812 buy-side and sell-side observations.1RTSR = relative total shareholder return one year after the announcement date; RTSR was winsorized at 1% and 99%.2Volatility was measured as a standard deviation of RTSR. 3The risk-adjusted performance measure combines returns and volatility and is defined as RTSR over the standard deviation of RTSR, in the same vein as the commonly used Sharpe ratio. There is a statistically significant RTSR difference for portfolio masters and strategic shifters versus one-timers (using a two-sample t-test) as well as a statistically significant difference in the standard deviation of RTSR for portfolio masters versus strategic shifters and strategic shifters versus one-timers (using a two-sample variance ratio test): * significant at p<0.1; ** significant at p<0.05; *** significant at p<0.01.
Exhibit 10 | One-Timers Achieve the Highest Announcement Returns
Exhibit 11 | Portfolio Masters Outperform in the Medium Term

18 | Masters of the Corporate Portfolio
folio masters are much better at predicting deal outcomes than less experienced compa-nies. On the buy side, they estimate synergies and postmerger integration (PMI) costs more accurately, and they deliver on their projec-tions. When shedding an asset, they under-stand the complexities involved, and they as-sess the impact on the rest of the organization. They—and their investors—know what to ex-pect 12 months after a deal is announced.
Combining returns and volatility into a risk-adjusted performance measure (calculat-ed as RTSR over the standard deviation of RTSR) demonstrates the significantly better performance of portfolio masters over strate-gic shifters and one-timers. Investors in port-folio masters enjoy the highest returns per “unit of risk”—11.2 for portfolio masters ver-sus 9.3 and 5.9 for strategic shifters and one-timers, respectively.
It is for these reasons, perhaps, that investors’ comfort with portfolio masters’ strategies and execution extends to decisions that take these companies beyond their core markets. Portfo-lio masters appear to be largely immune from conglomerate discounts. (See the side-
bar, “Revisiting Conglomerate Discounts for Portfolio Masters.”)
Playing for the Long TermWhile portfolio masters earn higher one-year returns than their less experienced counter-parts, this gap widens to an even greater margin in the long run. During the five years from 2011 through 2015, for example, port- folio masters’ average annual TSR of 10.5% is significantly higher than that of strategic shifters (7.9%) and one-timers (5.3%). (See Exhibit 12.) In other words, a shareholder that invested $10,000 in the average portfolio master in 2011 was $3,526 better off in 2016 than a shareholder that invested the same amount of capital in the average one-timer.
In addition, portfolio masters experience low-er long-term share price volatility than their less acquisitive peers, exposing shareholders to less risk even though they engage in multi-ple portfolio shifts that could be assumed to impair daily operations. The average TSR vol-atility of portfolio masters is 3.4 points lower than that of strategic shifters and 8.4 points lower than that of one-timers.
5.3
–2.6
7.9***
–2.6
One-timersStrategic shiersPortfolio masters One-timersStrategic shiersPortfolio masters
10.5**
19.3***
15.9***
+5.0
+3.4
24.3
SIGNIFICANT TSR OUTPERFORMANCE IN THE LONG RUN . . .
. . . COMBINED WITH SUBSTANTIALLYLOWER RISK
Average annual five-year TSR (%)1 Volatility of average annual five-year TSR (%)1
Sources: Thomson ONE Banker; BCG analysis. Note: This analysis, which spans the years from 2011 through 2015, is based on a total of 4,647 company observations. 1There is a statistically significant TSR difference for portfolio masters versus strategic shifters and strategic shifters versus one-timers (using a two-sample t-test) as well as a statistically significant difference in the standard deviation of TSR for portfolio masters versus strategic shifters and strategic shifters versus one-timers (using a two-sample variance ratio test): * significant at p<0.1; ** significant at p<0.05; *** significant at p<0.01.
Exhibit 12 | Portfolio Masters Outperform Most in the Long Run

The Boston Consulting Group | 19
It’s a well-known truism that investors dislike diversification.
As we, among others, have shown, capital markets clearly favor focused companies over their more broad-based counter-parts—and for a wide range of reasons. (See Invest Wisely, Divest Strategically: Tapping the Power of Diversity to Raise Valuations, BCG Focus, April 2014.) So one has come to expect higher shareholder returns from firms that focus expressly on certain technologies or industries while diversified companies are saddled with a “conglomerate discount.”
For portfolio masters, however, this para-digm does not apply. We find only a margin-al difference between portfolio masters that pursue a diversifying strategy and those that narrow their activities, either one year after the deal announcement or over an entire five-year time period. (See the exhibit below.) We define a company following a
diversifying strategy as one that has, over a five-year period, done more than three M&A deals—either acquisitions outside of its home industry or divestments of operations within its core industry, as measured by the two-digit Standard Industrial Classification (SIC) code.
How can this be? Investors are supposed to favor more focused companies because of their superior capital allocation and potential to unlock synergies from related businesses.
In fact, portfolio masters do exactly what investors want companies to do. They systematically review their portfolios—asking with respect to each business or asset, are we currently investing our shareholders’ money in the most value-generating way possible? If the answer is no (which it often is), and there is a better opportunity beyond the current corporate borders, they use M&A as a strategic tool to
REVISITING CONGLOMERATE DISCOUNTS FOR PORTFOLIO MASTERS
MEDIUMTERM RETURNS ON DIVERSIFIED ANDREFOCUSED PORTFOLIOS ARE ALMOST ON A PAR . . .
. . . AND THERE IS NO REAL DIFFERENCEIN LONGTERM VALUE CREATION
4.0 4.3
Refocusing1Diversifying
One-year RTSR (%)
Medium term
10.8 10.4
RefocusingDiversifying2
Average annual five-year TSR (%)
Long term
+0.3 p.p. –0.4 p.p.
Sources: Thomson ONE Banker; BCG analysis.Note: A deal is classified as “diversifying” if the two-digit SIC code of the target company is not the same as one of the two-digit SIC codes of the acquirer.1This analysis of RTSR spans one-year periods from 1991 through 2015.2Portfolio masters are classified as “diversifying” when they have done more than three diversification deals within the five-year period from 2011 through 2015.
Portfolio Masters Enjoy Similar Returns for Different Strategies

20 | Masters of the Corporate Portfolio
It may seem counterintuitive, but the data is clear: the more frequent M&A activities of portfolio masters produce superior share- holder returns at lower risk in the medium and long term than those of less frequent acquirers. This begs the questions, explored in the next chapter, of how portfolio masters work their magic and whether companies that develop from one-timers into portfolio masters also see an increase in their returns. Or put another way, can deal-making neo-phytes learn to become M&A masters?
Notes1. We have included only deals valued at more than $25 million with the acquisition or divestiture of at least 75% of the shares.2. One-timers achieved higher CAR than portfolio masters across each five-year window from 1991 through 2015.
seize it—and thereby improve their capital allocation. Since their decisions are well grounded in an objective strategic review, it is easy for them to argue that their actions favor their investors. Whether these companies decide to divest a former core asset, invest in a new technology or sector, or add an additional but synergetic pillar to
their existing operations, investors have come to understand—and trust—that their decisions are made with value creation in mind and that management is good at identifying, acting on, and realizing the potential of all kinds of M&A opportunities.
REVISITING CONGLOMERATE DISCOUNTS FOR PORTFOLIO MASTERS(continued)

The Boston Consulting Group | 21
The evidence is conclusive—portfolio masters outperform other dealmakers
over the medium and long term. But what do they do differently—or better—when it comes to M&A?
Based on interviews we conducted two years ago with senior managers, investors, and sell-side analysts about successful serial acquir-ers, we concluded that the single factor that most often distinguishes these companies is their willingness to invest large amounts of leadership time, money, and organizational focus in support of their M&A strategy—in advance of any particular deal. (See “Unlock-ing Acquisitive Growth: Lessons from Success-ful Serial Acquirers,” BCG Perspectives, Octo-ber 2014.) Our 2016 analysis of thousands of transactions over the 25 years from 1991 through 2015 identifies four additional char-acteristics that distinguish portfolio masters from other companies in both their buying and selling activities.
Four Characteristics of Portfolio MastersThe four key characteristics of portfolio mas-ters, which other companies can emulate, are:
• Be bold. Portfolio masters are willing to pay higher multiples for the right deals because they know what it will take to make the transaction work and have more
experience in assessing potential syner-gies and integration costs.
• Buy growth over margin. Portfolio masters buy high-growth firms and sell divisions that do not deliver on their growth targets. Further, they are willing to dilute their margins temporarily with the confidence that they can improve com-bined margins over time.
Portfolio masters are bold, agnostic about the market, buy growth, and move fast.
• Don’t worry about the market. Portfolio masters are agnostic about the market environment and actually do more deals during volatile times, taking advantage of lower competition.
• Move fast. Portfolio masters are quicker to close transactions than strategic shifters and one-timers, reflecting their experienced and well-honed transaction processes.
Be bold. Portfolio masters are not shy about paying up when they have an attractive transaction in their sights. They are willing to pay top multiples and high premiums in
MAKING M&A WORKTHE CHARACTERISTICS THAT SET PORTFOLIO MASTERS APART

22 | Masters of the Corporate Portfolio
order to land their targets, which evidences confidence in their target analysis and selection process as well as in their ability to make the deal work. (See Exhibit 13.)
In our sample, portfolio masters pay, on aver-age, a multiple of almost 12 times EBITDA, compared with multiples of 10.3 and 10.1 times EBITDA paid by strategic shifters and one-timers, respectively. This shows that for the right quality asset, portfolio masters do not shy away from paying high valuations. The fact that portfolio masters also pay high-er deal premiums—an average of 2 to 3 per-centage points higher—further underscores that they are more confident they will achieve higher synergies and therefore will-ing to strike when the deal is right.
Portfolio masters also do more of their deals purely in cash, another indication of confi-dence: approximately 60% of acquisitions by portfolio masters were paid for with cash only, compared with 46% by one-timers. Knowing that they can harvest deal synergies, portfolio masters are less willing to share the
future upside with the target company’s shareholders, and they know that cash deals generally require a smaller premium than those involving stock because cash removes any uncertainty as to the value to the target’s shareholders.
Buy growth over margin. Portfolio masters systematically swap their portfolio assets for higher growth—that is, they buy higher- growth companies and sell lower-growth operations—in stark contrast to one-timers and strategic shifters, which do the reverse. Revenue growth is a key driver of TSR, and portfolio masters use M&A to boost growth and weed out lower-growth assets. (See Exhibit 14 and “The 2015 Consumer Value Creators Series: The Return of Growth,” BCG article, December 2015.) To achieve growth, portfolio masters are even willing to add lower-margin firms to the portfolio (reflected in the largest margin differential of close to 3 percentage points between portfolio masters’ existing portfolios and those of their targets), since they are confident that they can improve the target’s EBITDA through effective PMI.
ON AVERAGE, PORTFOLIO MASTERS PAYHIGHER EBITDA MULTIPLES . . . . . . AS WELL AS HIGHER PREMIUMS
Median EV/EBITDA multiple1 Median deal premium2
34.4 33.2
36.7***
10.3 10.1
One-timers
Portfoliomasters
11.9***
Strategicshiers
One-timers
Portfoliomasters
Strategicshiers
Sources: Thomson ONE Banker; BCG analysis.Note: The analysis of multiples, which spans the years from 1991 through 2015, is based on a total of 4,682 observations. The analysis of deal premiums, which spans the same years, is based on a total of 6,811 observations. There is a statistically significant multiple difference for portfolio masters versus one-timers (using a rank-sum test) as well as a statistically significant premium difference for portfolio masters versus one-timers (using a rank-sum test): * significant at p<0.1; ** significant at p<0.05; *** significant at p<0.01.1This analysis excludes observations with EV/EBITDA multiples higher than 50 as well as companies in the financial services industry.2Deal premiums are calculated based on trading values four weeks before announcement.
Exhibit 13 | Portfolio Masters Are Willing to Pay More for Their Targets

The Boston Consulting Group | 23
Don’t worry about the market. When it comes to deal making, portfolio masters are general-ly the most agnostic about the broader economic picture (as measured by GDP) and market uncertainty (as measured by stock market volatility). They buy and sell in all types of environments. (See Exhibit 15.) Our sample indicates that portfolio masters actually prefer higher-volatility markets, which offer them the opportunity to deploy their full M&A capabilities in an environment of uncertainty when competitors hesitate or are less sure.
While portfolio masters are most active during periods of low growth and high vola-tility, they generate positive excess returns (as measured by one-year post-transaction an-nouncement RTSR) across all market cycles, regardless of growth-volatility combinations.
Portfolio masters’ success in all environments suggests that they have a high level of agility in adapting their capabilities and processes to changing circumstances and operate with a long-term view. They regard M&A as an always-available weapon in their strategic arsenal; transaction sourcing, executing, and
integrating are all part of daily business life. They are motivated far more by strategic rationale than circumstantial incentives (such as cheap funding).
Move fast. With an average closing time of 72 days for acquisitions and 82 days for divestitures, portfolio masters execute trans-actions 30 days faster than one-timers, which lose one full month between contract and closing—a time when they have limited control over their assets. This gives active dealmakers a head start on PMI or ensures earlier carve-out execution, which, as we have discussed before, is where much of the value in M&A is realized.
Moving Up Can Pay OffPortfolio masters reap higher returns. But can companies increase their returns for share-holders by moving up the M&A ladder, from one-timer to strategic shifter or portfolio mas-ter? The evidence suggests that they can. (See Exhibit 16.)
For example, the 37% of one-timers that moved up to strategic shifters generated
3.9
6.8
9.7
5.5
9.38.6
Portfoliomasters
One-timers
Strategicshiers
Portfoliomasters
One-timers
Strategicshiers
Sell sideBuy side
PORTFOLIO MASTERS BUY HIGHERGROWTHCOMPANIES AND SELL LOWERGROWTH OPERATIONS
WHILE THEIR PEERS DO THE OPPOSITE
PORTFOLIO MASTERS ACQUIRE TARGETS WITHTHE LARGEST MARGIN DIFFERENTIAL, WHICH
REFLECTS CONFIDENCE IN PMI
Acquirer’sEBITDA
margin (%)2
Target’sEBITDA
margin (%)2
Margindifferential
(p.p.)3
18.7 15.8
16.2 14.5
15.1 12.6
2.9
2.5
1.7
Median target sales growth inthe announcement year (%)1
Sources: Thomson ONE Banker; Thomson Reuters Datastream; BCG analysis.Note: This analysis, which spans deals done from 1991 through 2015, is based on a total number of 26,908 observations on margins.1This analysis includes transactions done by companies in the financial services industry.2This analysis excludes transactions done by companies in the financial services industry. Margins are calculated using data one year prior to the announcement date.3p.p. = percentage points.
Exhibit 14 | Portfolio Masters Buy High Growth Rather Than Margin

24 | Masters of the Corporate Portfolio
52 51 50
48 49 50
One-timers
Strategicshiers
Portfoliomasters
One-timers
Strategicshiers
Portfoliomasters
Market growth1
5952 49
4148 51
Low
Market volatility2
High
High
Low
POSITIVEENVIRONMENT
NEGATIVEENVIRONMENT
% of all transactions
PORTFOLIO MASTERS BUY AND SELLIN HIGH AND LOWGROWTH ENVIRONMENTS
PORTFOLIO MASTERS DO MORE DEALSIN HIGHVOLATILITY MARKETS
ONETIMER
PORTFOLIO MASTER
STRATEGIC SHIFTER
6%
+5.8%
37%
+4.5%
16%
+4.8%
xx% xx%Percentage of companies that moved up1 RTSR of companies that moved up2
Sources: Thomson ONE Banker; Thomson Reuters Datastream; BCG analysis.Note: This analysis spans 25 years, from 1991 through 2015, and is based on a total of 54,574 observations.1The market cycle is measured by world GDP growth.2Volatility is measured by the Chicago Board Options Exchange Volatility Index (VIX) at the respective year end; years are separated into two groups by the respective median of the relevant metric.
Sources: Thomson ONE Banker; BCG analysis.Note: Performance is based on a total number of 28,463 observations from1991 through 2015.1Indicates the percentage of companies that moved up from one category to another (from one-timer to strategic shifter to portfolio master) spanning the period from 1991 through 2015 as observed in five-year cycles.2Performance is based on one-year RTSR.
Exhibit 15 | Portfolio Masters Do Deals Regardless of Market Conditions
Exhibit 16 | Moving Up the M&A Ladder Improves Shareholder Value

The Boston Consulting Group | 25
average one-year RTSR of 4.5%. The 16% of strategic shifters that moved up to portfolio master status generated average one-year RTSR of 4.8%. By comparison, companies that stayed in place or moved down the M&A lad-der generally saw minimal or even negative RTSR as a consequence.
Take the example of pharmaceutical compa-ny Actavis that became Allergan through a $71 billion acquisition in 2015. (See Exhibit 17.) Since 2001, the company increased its deal activity over the course of three succes-sive five-year periods—starting with 1 trans-action (2001 through 2005), followed by 3 transactions (2006 through 2010), and then 15
buy- and sell-side transactions (2011 through 2015). Over the same time horizon, it im-proved average annual TSR from –9% to 43%.
CEOs should take note. Not only does con-sistent deal making create value, not
making deals does a disservice to investors. This does not mean that every company, or management team, is cut out to become a deal-making machine. But those manage-ments that do not hone their M&A skills and deploy them on a continuing basis are effec-tively leaving a powerful value-creating tool unused in the toolbox.
Market cap($billions)1
SIX EXAMPLES OF COMPANIES THAT GRADUATED FROMONETIMER TO PORTFOLIO MASTER AND IMPROVED TSR ACTAVIS INCREASED ITS TRANSACTION VOLUME
Industry Country
Pharma
Hightechnology
Industrials
Industrials
Professionalservices
Real estatemanagement
Ireland
UnitedStates
UnitedStates
UnitedStates
UnitedStates
Germany
$0.2billion
$3.4billion
$101.8billion
Average annualTSR (%)
–9
–19
5
–10
–17
–20
10
15
11
11
–6
–4
43
32
11
13
41
16
1231
3
Acquisitions Divestitures
2011–2015
15
2006–20102001–2005
Number of transactions
123.2
18.7
4.4
7.3
2.4
1.6
Cumulative deal value announced
2001–2005
2006–2010
2011–2015
Equinix
Cabot Oil & Gas
B/E Aerospace
On Assignment
TAG Immobilien
Allergan2 One-timer
M&A development at Actavis
Strategicshier
Portfoliomaster
2001
2011
2006
Sources: Thomson ONE; S&P Capital IQ; BCG analysis. Note: This analysis looks only at deals of more than $25 million with acquisitions or divestitures of at least 75% of shares. 1The market cap is as of December 31, 2015.2The data on Allergan relates to its predecessor firm Actavis, which acquired Allergan in 2015.
Exhibit 17 | Companies Can Improve Returns by Doing More Deals

26 | Masters of the Corporate Portfolio
APPENDIXSELECTED TRANSACTIONS, 2016, 2015, AND 2014
Strategic advisor tothe seller
Strategic advisorto the buyer
Strategic advisorto the buyer
Strategic advisorto the buyer
Strategic advisorto the buyer
Value not disclosed
Strategic advisor tothe seller
$310 million
Strategic advisor tothe seller
$6.8 billion $80 million
Strategic advisorto the buyer
$280 million
$142 million
Strategic advisorto the buyer
$2.3 billion
Strategic advisorto the buyer
Pharma CMObusiness of
Strategic advisorto the buyer
Strategic advisorto the buyer
Strategic advisorto the buyer
$131 million €270 million $599 million
$19.1 billion
$218 million
Strategic advisor tothe seller
Strategic advisorto the buyer
(ACTA*)
2016 20162016
2015 2015 2015
2015
2016 2015
2015
2015 2015 2015
2015
2015
Sale of VoithIndustrial Services
Value not disclosed Value not disclosed
Value not disclosed
Corporate Transactions

The Boston Consulting Group | 27
Strategic advisorto the buyer
Strategic advisorto the buyer
Consumer health
$547 millionEstablishment of
joint venture
2015 2015 2015
$8.1 billion
Strategic advisorto the buyer
2015
Strategic advisorto the buyer
Strategic advisorto the buyer
$388 million $18 million
Strategic advisorto the buyer$344 million
Strategic advisorto the buyer
2016 2016 2016
Strategic advisorto the seller$154 million
20152016
$360 million
2014
Strategic advisor tothe seller
$805 million
PharmaceuticalDevices andPrescription
Retail Packaging
2014
$411 million
Strategic advisor tothe buyer
2014
Strategic advisor tothe seller
€783 million
2014
Strategic advisor tothe buyer
always inspiring more...
€1.3 billion
2014
Strategic advisor tothe buyer
2014
Strategic advisor tothe buyer
€308 million
2014 2014
Strategic advisor tothe buyer
2014
Strategic advisor tothe buyer
2014
Strategic advisor tothe seller
Kitchen Business
€1.3 billion
2014
Strategic advisor tothe seller
2014
€1 billion
Strategic advisor tothe seller
Value not disclosed
Value not disclosed
Value not disclosed Value not disclosed Value not disclosed
Private Equity Transactions

28 | Masters of the Corporate Portfolio
Strategic advisorto the seller
$3.7 billion
Strategic advisorto the seller
Strategic advisorto the seller
Strategic advisorto the seller
Strategic advisorto the seller$714 million $258 million
Strategic advisorto the buyer
Strategic advisorto the buyer
Strategic advisorto the buyer
2015 2015 20152015
2015 2015 20152015
$24 million
Strategic advisorto the seller
$98 million
Strategic advisorto the buyer
2015
2015
Strategic advisorto the buyer
$1.9 billion
Strategic advisorto the buyer$950 million
Strategic advisorto the buyer
Strategic advisorto the buyer
Strategic advisorto the buyer
Strategic advisorto the buyer$800 million
Strategic advisorto the buyer
Strategic advisorto the buyer
Strategic advisorto the buyer
Strategic advisorto the buyer
Strategic advisorto the buyer
$543 million
Strategic advisorto the buyer$28 million
Strategic advisorto the buyer
2015 2015
2015 2015 2015 2015
2015 2015 2015 2015 2015
2015
2015
Strategic advisor tothe buyer
2015 2015
Commercial duediligence provider
2015
Value not disclosed Value not disclosed Value not disclosed
Value not disclosed Value not disclosed
Value not disclosed Value not disclosed Value not disclosed Value not disclosed
Value not disclosed Value not disclosed Value not disclosed
Value not disclosed Value not disclosed Value not disclosed
Private Equity Transactions(continued)

The Boston Consulting Group | 29
2014
$40 million
Strategic advisor tothe investor
2014
Strategic advisor tothe seller
Lenders & Employees
$700 million
ers & Emplo
2014 2014 2014
Strategic advisor tothe seller
Strategic advisor tothe seller
Strategic advisor tothe seller
$1.6 billion
2014
Strategic advisor tothe buyer
2014
Strategic advisor tothe buyer
Value not disclosed Value not disclosed Value not disclosedValue not disclosed
2014
$8.7 billion
Strategic advisor tothe buyer
2014 2014
$124 million $55 million
Strategic advisor tothe buyer
Strategic advisor tothe investor
2014
Strategic advisor tothe buyer
(Minority stake)(Minority stake)
Value not disclosed
2014
Strategic advisor tothe buyer€1.4 billion
2014 2014 2014
Strategic advisor tothe buyer
Strategic advisor tothe buyer
Strategic advisor tothe buyer
€376 million
(Minority stake)
2014
Value not disclosed Value not disclosed
2014
Strategic advisor tothe buyer
Value not disclosed
2014
Strategic advisor tothe buyer
Value not disclosed
2014
$264 million
Strategic advisor tothe buyer
2014
Strategic advisor tothe buyer
2014
Strategic advisor tothe buyer
Value not disclosed Value not disclosed
2014
Strategic advisor tothe seller
Strategic advisor tothe seller
€940 million €3.75 billion
2014 2014
Strategic advisor tothe seller
RANK GROUP LIMITED
2014
Strategic advisor tothe seller
Strategic advisor tothe seller
€800 million
2014
Value not disclosed Value not disclosed

30 | Masters of the Corporate Portfolio
The Boston Consulting Group publishes many reports and articles on corporate development and finance, M&A, and PMI that may be of interest to senior executives. The following are some recent examples.
Postmerger Integration RejuvenationBCG Perspectives, June 2016
In a Tough Market, Investors Seek New Ways to Create ValueAn article by The Boston Consulting Group, May 2016
How to Successfully Manage Joint Ventures in ChinaA Focus by The Boston Consulting Group, March 2016
To Centralize or Not to Centralize?An article by The Boston Consulting Group, December 2015
From Buying Growth to Building Value: Increasing Returns with M&AThe 2015 M&A Report, October 2015
Why Deals FailAn article by The Boston Consulting Group, October 2015
Value Creation for the Rest of UsThe 2015 Value Creators Report, July 2015
M&A in China: Getting Deals Done, Making Them Work A Focus by The Boston Consulting Group, January 2015
Unlocking Acquisitive Growth: Lessons from Successful Serial AcquirersBCG Perspectives, October 2014
When the Growing Gets Tough, the Tough Get GrowingBCG Perspectives, October 2014
Don’t Miss the Exit: Creating Shareholder Value Through Divestitures The 2014 M&A Report, September 2014
Taking a Portfolio Approach to Growth InvestmentsBCG Perspectives, July 2014
Growth for the Rest of UsBCG Perspectives, January 2014
Divide and Conquer: How Successful M&A Deals Split the SynergiesA Focus by The Boston Consulting Group and Technische Universität München, March 2013
FOR FURTHER READING

The Boston Consulting Group | 31
NOTE TO THE READER
About the AuthorsJens Kengelbach is a partner and managing director in the Munich office of The Boston Consulting Group, the firm’s global head of M&A, and leader of the BCG Transaction Center. He is also a member of the firm’s Corporate Development and Industrial Goods practices. Georg Keienburg is a principal in BCG’s Cologne office and a core member of the Corporate Development and Industrial Goods practices. He is also a member of the BCG Transaction Center. Timo Schmid is an M&A expert principal in the firm’s Munich office. He is a core member of the Corporate Development practice and the BCG Transaction Center. Sönke Sievers holds the chair of international accounting at Paderborn University. Oliver Mehring is a research assistant at Paderborn University.
Paderborn UniversityThis report would not have been possible without the partnership of Paderborn University, the University for the Information Society, which has a strong foundation in computer science and its applications. Paderborn’s chair of international accounting, Sönke Sievers, focuses on research relating to information processing in financial markets and valuation. In addition to academic research, he intensively collaborates with business partners to advance knowledge in the fields of corporate finance, accounting, and mergers and acquisitions. For more information, please visit www.upb.de/accounting.
AcknowledgmentsThe authors are grateful to Kurt Schulze, Axel Werries, Anton Kashyrkin, Eugene Khoo, and Sharon Ng for their insights and their support on the research and content development of this report. They would also like to thank Boryana Hintermair for coordinating the publication of this report, David Duffy for his assistance in writing the report, and Katherine Andrews, Gary Callahan, Kim Friedman, Abby Garland, Pamela Gilfond, and Sara Strassenreiter for their contributions to its editing, design, and production.
For Further ContactThis report is a product of BCG’s Corporate Development practice, which works with its clients to deliver solutions to the challenges addressed in this report. If you would like to discuss the insights drawn from this report or learn more about the firm’s capabilities in M&A, please contact one of the authors.
Jens KengelbachPartner and Managing DirectorBCG Munich+49 89 231 [email protected]
Georg KeienburgPrincipalBCG Cologne+49 221 55 00 [email protected]
Timo SchmidPrincipalBCG Munich+49 89 231 [email protected]

© The Boston Consulting Group, Inc. 2016. All rights reserved.
For information or permission to reprint, please contact BCG at:E-mail: [email protected]: +1 617 850 3901, attention BCG/PermissionsMail: BCG/Permissions The Boston Consulting Group, Inc. One Beacon Street Boston, MA 02108 USA
To find the latest BCG content and register to receive e-alerts on this topic or others, please visit bcgperspectives.com.
Follow bcg.perspectives on Facebook and Twitter.
8/16

Abu DhabiAmsterdamAthensAtlantaAucklandBangkokBarcelonaBeijingBerlinBogotáBostonBrusselsBudapestBuenos AiresCalgaryCanberraCasablancaChennai
ChicagoCologneCopenhagenDallasDenverDetroitDubaiDüsseldorfFrankfurtGenevaHamburgHelsinkiHo Chi Minh CityHong KongHoustonIstanbulJakartaJohannesburg
KievKuala LumpurLagosLimaLisbonLondonLos AngelesLuandaMadridMelbourneMexico CityMiamiMilanMinneapolisMonterreyMontréalMoscowMumbai
MunichNagoyaNew DelhiNew JerseyNew YorkOsloParisPerthPhiladelphiaPragueRio de JaneiroRiyadhRomeSan FranciscoSantiagoSão PauloSeattleSeoul
ShanghaiSingaporeStockholmStuttgartSydneyTaipeiTel AvivTokyoTorontoViennaWarsawWashingtonZurich
bcg.com | bcgperspectives.com
Masters of th
e Corporate Portfolio Th
e 2016 M&
A R
eport