material and methods -...
TRANSCRIPT
MATERIAL MATERIAL MATERIAL MATERIAL
AND METHODSAND METHODSAND METHODSAND METHODS
111
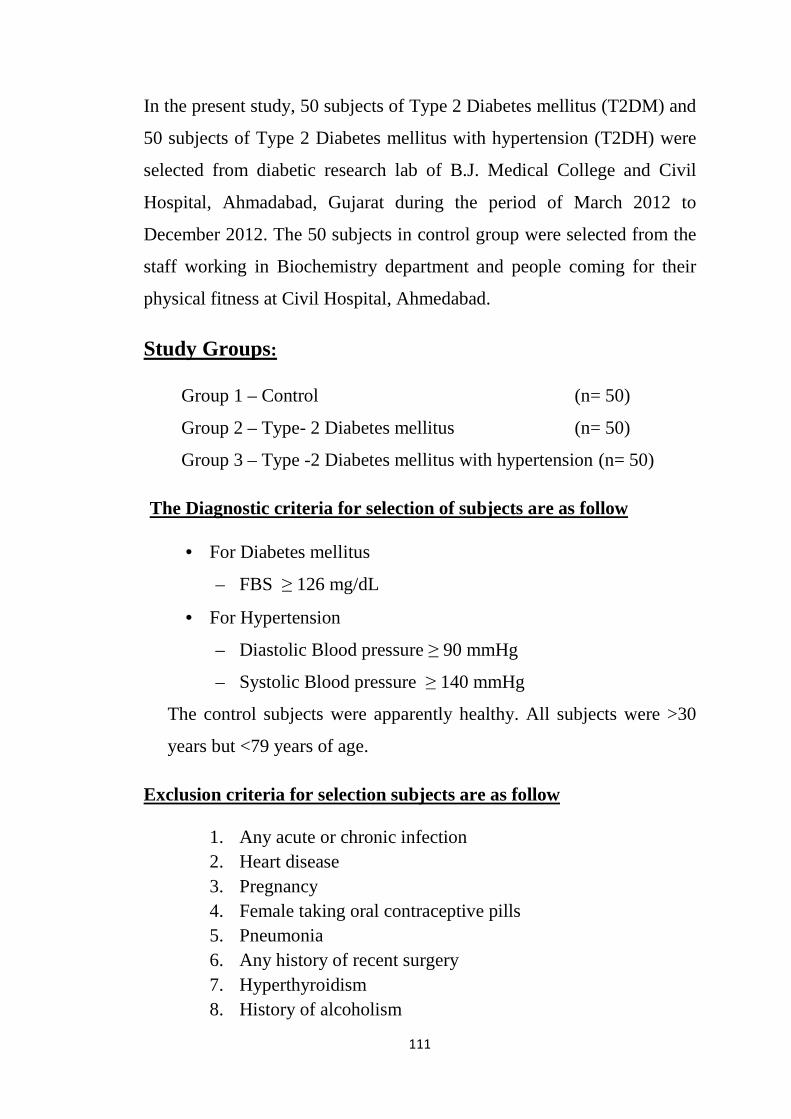
In the present study, 50 subjects of Type 2 Diabetes mellitus (T2DM) and
50 subjects of Type 2 Diabetes mellitus with hypertension (T2DH) were
selected from diabetic research lab of B.J. Medical College and Civil
Hospital, Ahmadabad, Gujarat during the period of March 2012 to
December 2012. The 50 subjects in control group were selected from the
staff working in Biochemistry department and people coming for their
physical fitness at Civil Hospital, Ahmedabad.
Study Groups:
Group 1 – Control (n= 50)
Group 2 – Type- 2 Diabetes mellitus (n= 50)
Group 3 – Type -2 Diabetes mellitus with hypertension (n= 50)
The Diagnostic criteria for selection of subjects are as follow
• For Diabetes mellitus
– FBS ≥ 126 mg/dL
• For Hypertension
– Diastolic Blood pressure ≥ 90 mmHg
– Systolic Blood pressure ≥ 140 mmHg
The control subjects were apparently healthy. All subjects were >30
years but <79 years of age.
Exclusion criteria for selection subjects are as follow
1. Any acute or chronic infection 2. Heart disease 3. Pregnancy 4. Female taking oral contraceptive pills 5. Pneumonia 6. Any history of recent surgery 7. Hyperthyroidism 8. History of alcoholism

112
9. Trauma: Surgical, Burns, Fractures 10. Malignancy: Lymphoma, Carcinoma, Sarcoma, Leukemia 11. Present or past smokers 12. Hepatic disease 13. Lipid lowering drugs 14. Antioxidant vitamin supplements 15. <30 and >79 years of age 16. Failed to give a written consent were excluded 17. Patients of type 2 DM, being managed with insulin 18. Any evidence of non-diabetic renal disease, severe renal
disease (serum creatinine >2.0 mg/dl).
EQUIPMENT:
• Fully Automated Biochemistry Analyzer: XL-640 (ERBA)
• ELISA Reader and Washer (TULIP)
• NycoCard Reader
SAMPLE TYPE:
• Serum (free of hemolysis)
• Plasma (free of hemolysis)
• Urine
SAMPLE COLLECTION:
A). BLOOD
All subjects were instructed, not to perform any strenuous exercise for at
least 24 hours prior to collection of samples.Venous blood was collected
after an overnight fasting of about 12-14 hours, from all subjects between
09:00AM to 10:00AM by venipuncture. Part of the blood sample was
placed into coagulating tubes and allowed to clot and serum was
separated by centrifugation at 3000 rpm for 10 minutes. The serum was
stored at -20°C until required. Portions (0.5 ml) of the blood collected
were placed in fluoride tubes for fasting plasma glucose estimation.

113
B). URINE
The most sensitive standard of microalbuminuria measurement is the
collection of 24h urine. The disadvantage of 24h urines are collection
errors. Careful attention has to be paid on patient instructions because
collection of 24h urine is not an easy task. The collection of 24h urine
samples is cumbersome and time consuming. For this reason in present
study morning spot urine were collected into sterile containers from all
subjects for the analysis.
Laboratory Investigations
Samples analysis was done on fully auto analyzer XL-640 (ERBA),
ELISA reader and washer and NycoCard reader at Hi-Tech Biochemistry
Laboratory, Civil Hospital, B. J. Medical College, Ahmedabad.
Commercially available ready to use reagent kits were used for
estimation of various parameters. Following Laboratory Investigations
were done in study group and control group.
• GLUCOSE (Plasma) • TOTAL BILIRUBIN • GGT • ALT • AST • ALP • CREATININE • UREA • URIC ACID • TOTAL PROTEIN • ALBUMIN • MICROALBUMIN (Urine) • C- REACTIVE PROTEIN

114
• HbA1c • INSULIN • TOTAL CHOLESTEROL • TRIGLYCERIDE • HDL-C • MAGNESIUM • COPPER • ZINC • SODIUM • POTASSIUM Care Taken
� Serum specimens should be free of fibrin, red blood cells and other
particulate matter.
� Human serum specimens to be tested should be protected from
light.
� For serum specimens ensured that complete clot formation has
taken place prior to centrifugation. (If the specimen is centrifuged
before a complete clot forms, the presence of fibrin may cause
erroneous results)
� If testing was delayed for more than 6 hours, serum specimens
were stored at -20°C and analyzed next day.
� Multiple freeze-thaw cycles must be avoided.
� Sample is mixed thoroughly after thawing, by low speed vortexing
or by gently inverting.
115
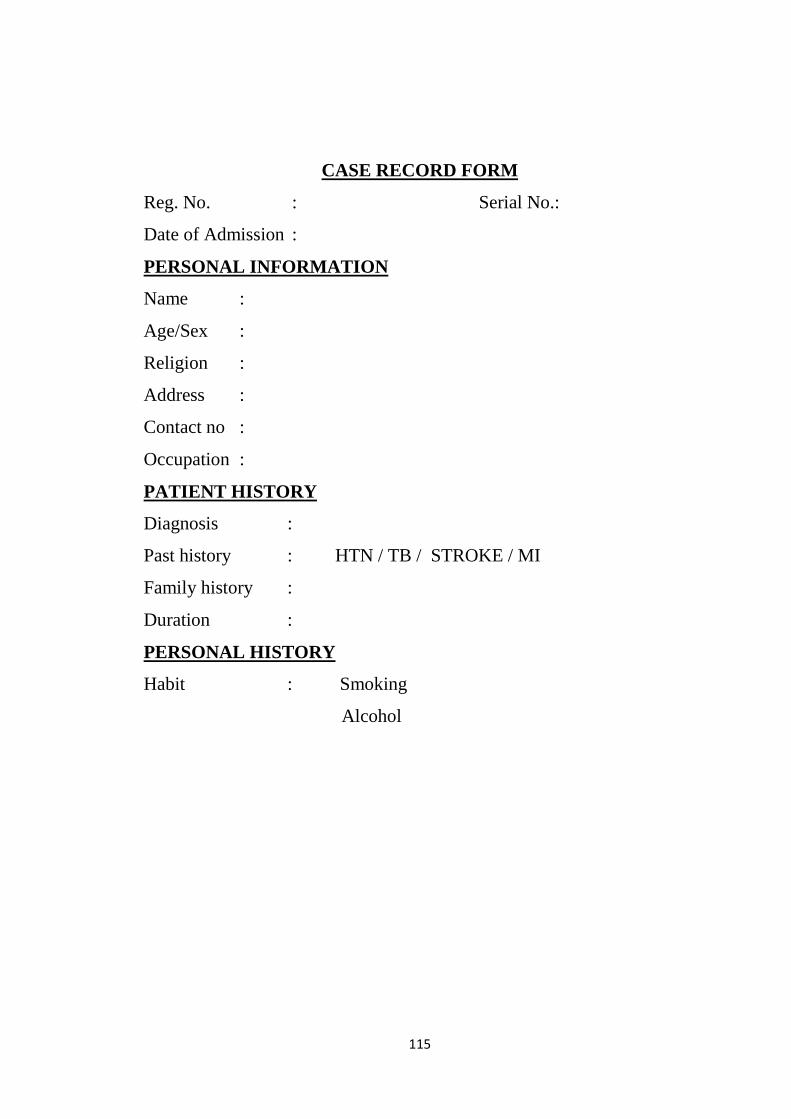
CASE RECORD FORM
Reg. No. : Serial No.:
Date of Admission :
PERSONAL INFORMATION
Name :
Age/Sex :
Religion :
Address :
Contact no :
Occupation :
PATIENT HISTORY
Diagnosis :
Past history : HTN / TB / STROKE / MI
Family history :
Duration :
PERSONAL HISTORY
Habit : Smoking
Alcohol

116
� ESTIMATION OF GLUCOSE METHOD: GOD/POD
PRINCIPLE
Glucose is oxidised to gluconic acid and hydrogen peroxide in the
presence of glucose oxidase. Hydrogen peroxide further reacts with
phenol and 4-aminoantipyrine by the catalytic action of peroxidase to
form a red coloured quinoneimine dye complex. Intensity of the colour
formed is directly proportional to the amount of glucose present in the
sample.
Glucose Oxidase Glucose + O2 + H2O Gluconate + H2O2 H2O2+ 4 Aminoantipyrine Red Quinoneimine dye +
H2O + Phenol
REAGENT
Glucose reagent
REAGENT PREPARATION
Reagents are ready to use. Protect from bright light.
SAMPLE TYPE
Plasma free from haemolysis.
SAMPLE STABILITY
Plasma is stable for 7 days at 2 to 80C.
Peroxidase
117
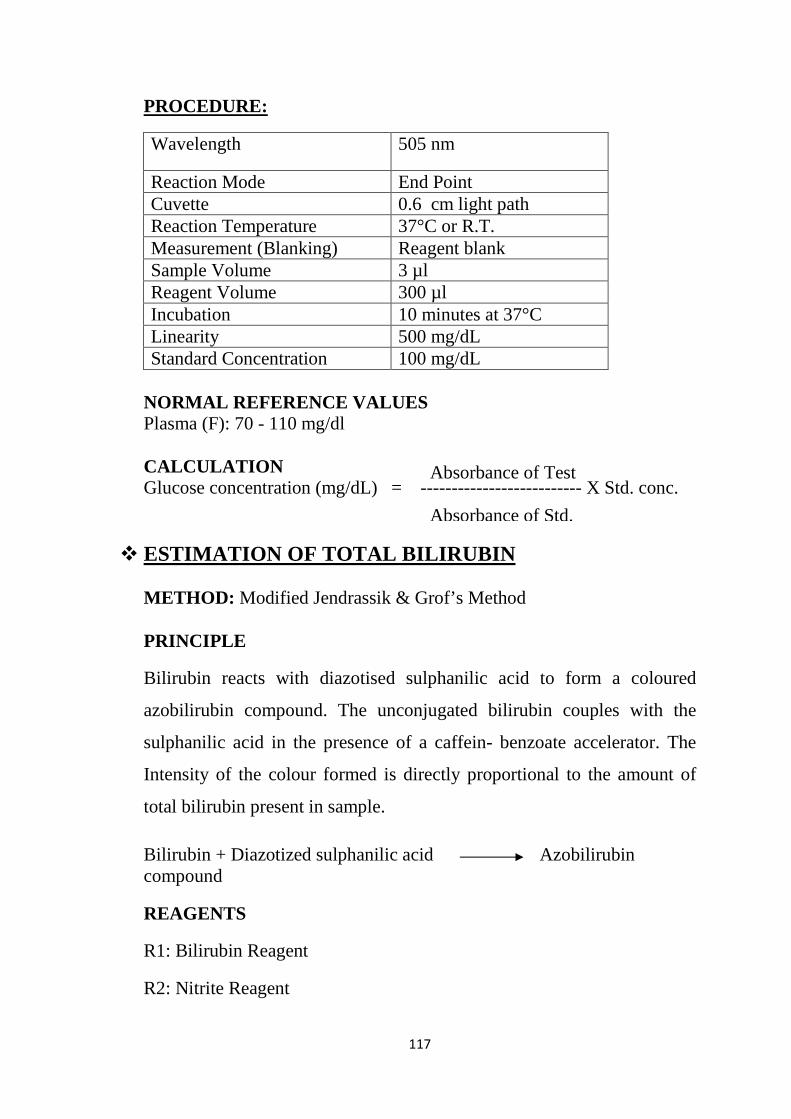
PROCEDURE:
Wavelength 505 nm
Reaction Mode End Point Cuvette 0.6 cm light path Reaction Temperature 37°C or R.T. Measurement (Blanking) Reagent blank Sample Volume 3 µl Reagent Volume 300 µl Incubation 10 minutes at 37°C Linearity 500 mg/dL Standard Concentration 100 mg/dL
NORMAL REFERENCE VALUES Plasma (F): 70 - 110 mg/dl CALCULATION Glucose concentration (mg/dL) = -------------------------- X Std. conc.
� ESTIMATION OF TOTAL BILIRUBIN
METHOD: Modified Jendrassik & Grof’s Method PRINCIPLE
Bilirubin reacts with diazotised sulphanilic acid to form a coloured
azobilirubin compound. The unconjugated bilirubin couples with the
sulphanilic acid in the presence of a caffein- benzoate accelerator. The
Intensity of the colour formed is directly proportional to the amount of
total bilirubin present in sample.
Bilirubin + Diazotized sulphanilic acid Azobilirubin compound
REAGENTS
R1: Bilirubin Reagent
R2: Nitrite Reagent
Absorbance of Test Absorbance of Std.

118
REAGENT PREPARATION
Reagents are ready to use. Protect from bright light.
SAMPLE TYPE
Serum free from haemolysis.
SAMPLE STABILITY
Serum is stable for 1 day at 20 to 250C & 7 days at 4 to 80C.
(Darkness required when stored for > 8 hours).
PROCEDURE
Wavelength 546 nm Cuvette 0.6 cm light path Reaction temperature 37ºC Reaction mode End Point Blank Sample Sample Volume 20 µl Reagent 1Volume R1- 200 µl
Reagent 2Volume R2- 10 µl Incubation time 10 minutes Factor 13 Unit mg/dL Linearity High(mg/dL) 20
If result obtained was greater than linearity limit, sample was diluted 1:2
with normal saline and result was multiplied by 2.
INTERFERENCE
• Lipemic and Hemolysed sera interfere strongly with the measurement of
bilirubin.
• Serum for bilirubin estimation must be kept away from the bright light.
CALCULATION
Total bilirubin (mg/dL) = (Sample OD – Blank OD) × 13
119
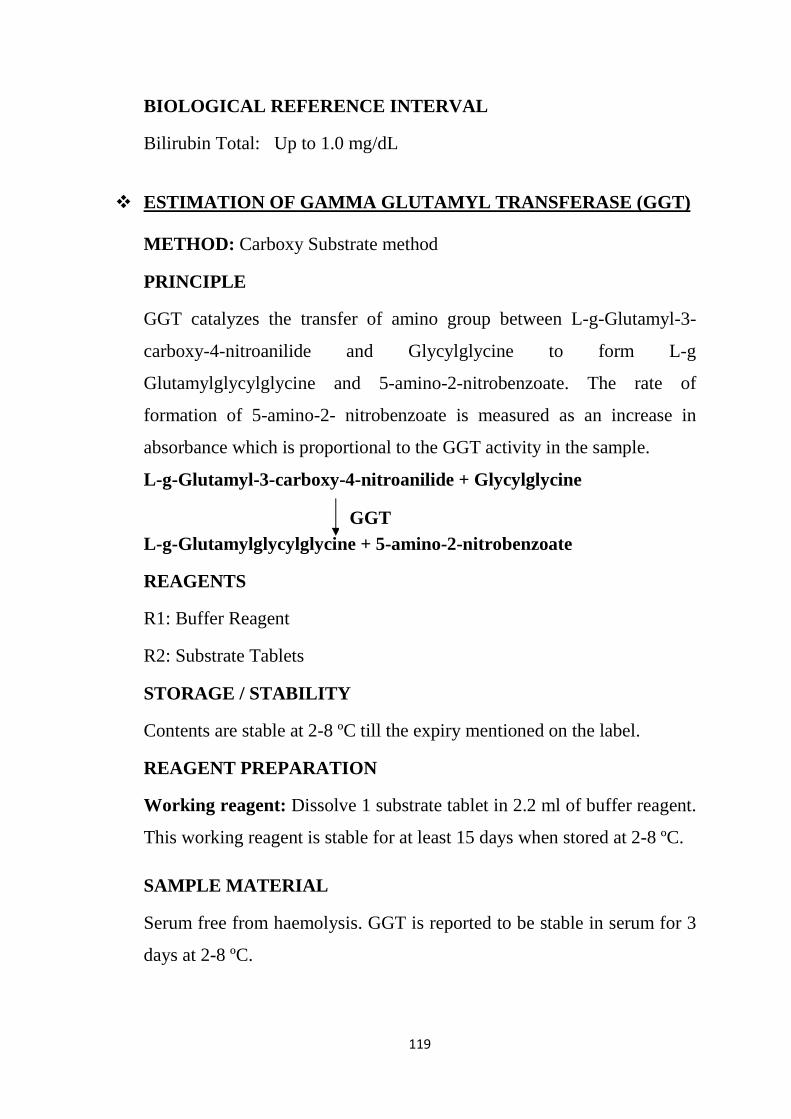
BIOLOGICAL REFERENCE INTERVAL
Bilirubin Total: Up to 1.0 mg/dL
� ESTIMATION OF GAMMA GLUTAMYL TRANSFERASE (GGT)
METHOD: Carboxy Substrate method
PRINCIPLE
GGT catalyzes the transfer of amino group between L-g-Glutamyl-3-
carboxy-4-nitroanilide and Glycylglycine to form L-g
Glutamylglycylglycine and 5-amino-2-nitrobenzoate. The rate of
formation of 5-amino-2- nitrobenzoate is measured as an increase in
absorbance which is proportional to the GGT activity in the sample.
L-g-Glutamyl-3-carboxy-4-nitroanilide + Glycylglycine L-g-Glutamylglycylglycine + 5-amino-2-nitrobenzoate
REAGENTS
R1: Buffer Reagent
R2: Substrate Tablets
STORAGE / STABILITY
Contents are stable at 2-8 ºC till the expiry mentioned on the label.
REAGENT PREPARATION
Working reagent: Dissolve 1 substrate tablet in 2.2 ml of buffer reagent.
This working reagent is stable for at least 15 days when stored at 2-8 ºC.
SAMPLE MATERIAL
Serum free from haemolysis. GGT is reported to be stable in serum for 3
days at 2-8 ºC.
GGT
120
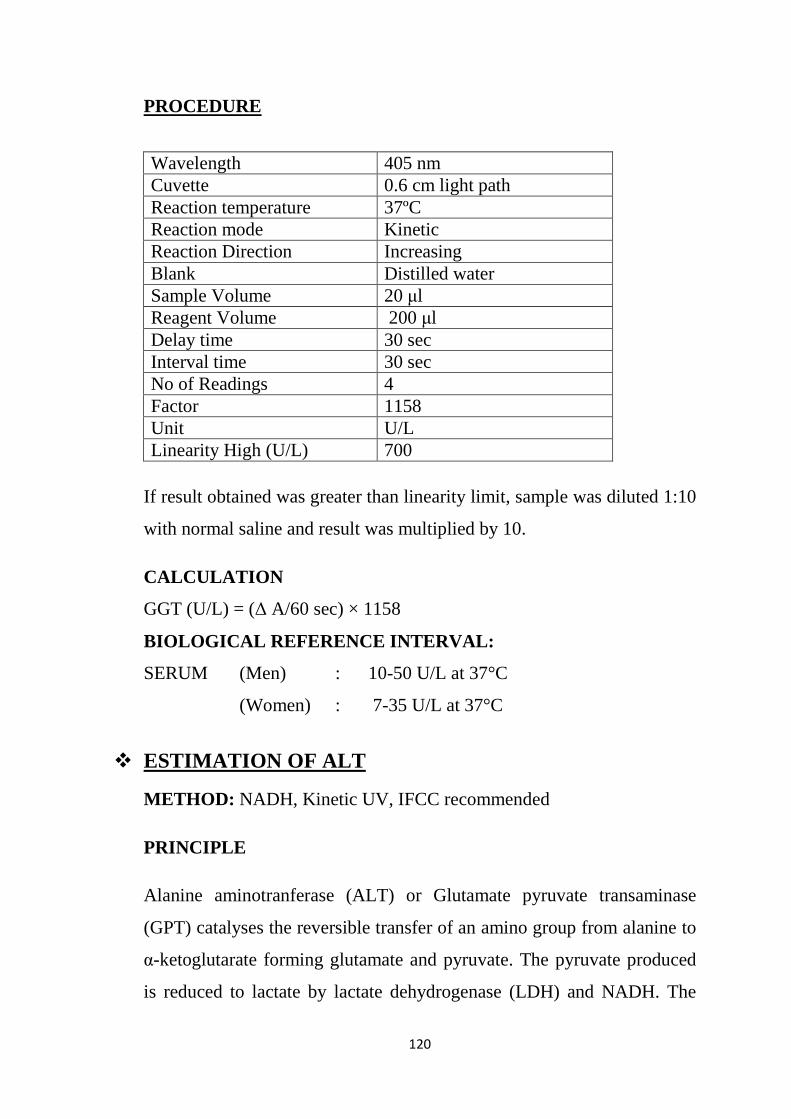
PROCEDURE
If result obtained was greater than linearity limit, sample was diluted 1:10
with normal saline and result was multiplied by 10.
CALCULATION
GGT (U/L) = (∆ A/60 sec) × 1158
BIOLOGICAL REFERENCE INTERVAL:
SERUM (Men) : 10-50 U/L at 37°C
(Women) : 7-35 U/L at 37°C
� ESTIMATION OF ALT
METHOD: NADH, Kinetic UV, IFCC recommended
PRINCIPLE
Alanine aminotranferase (ALT) or Glutamate pyruvate transaminase
(GPT) catalyses the reversible transfer of an amino group from alanine to
α-ketoglutarate forming glutamate and pyruvate. The pyruvate produced
is reduced to lactate by lactate dehydrogenase (LDH) and NADH. The
Wavelength 405 nm Cuvette 0.6 cm light path Reaction temperature 37ºC Reaction mode Kinetic Reaction Direction Increasing Blank Distilled water Sample Volume 20 µl Reagent Volume 200 µl Delay time 30 sec Interval time 30 sec No of Readings 4 Factor 1158 Unit U/L Linearity High (U/L) 700
121
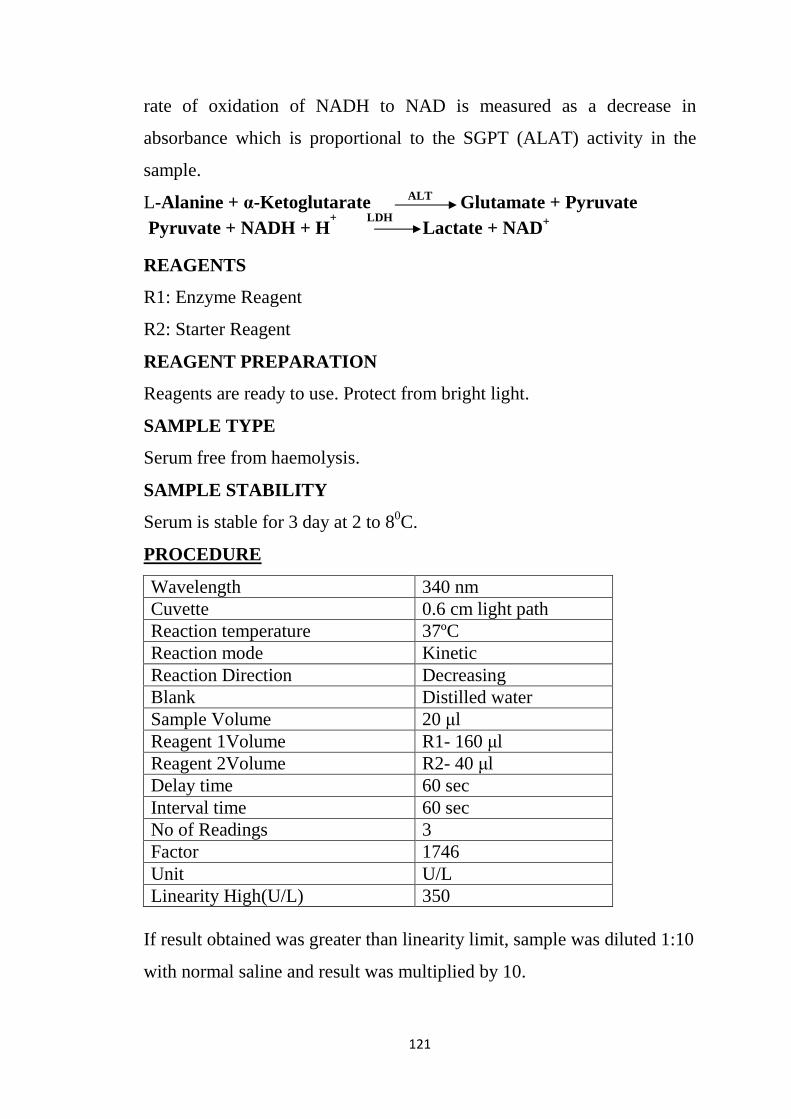
rate of oxidation of NADH to NAD is measured as a decrease in
absorbance which is proportional to the SGPT (ALAT) activity in the
sample.
L-Alanine + α-Ketoglutarate ALT Glutamate + Pyruvate Pyruvate + NADH + H
+ LDH Lactate + NAD+
REAGENTS
R1: Enzyme Reagent
R2: Starter Reagent
REAGENT PREPARATION
Reagents are ready to use. Protect from bright light.
SAMPLE TYPE
Serum free from haemolysis.
SAMPLE STABILITY
Serum is stable for 3 day at 2 to 80C.
PROCEDURE
Wavelength 340 nm Cuvette 0.6 cm light path Reaction temperature 37ºC Reaction mode Kinetic Reaction Direction Decreasing Blank Distilled water Sample Volume 20 µl Reagent 1Volume R1- 160 µl Reagent 2Volume R2- 40 µl Delay time 60 sec Interval time 60 sec No of Readings 3 Factor 1746 Unit U/L Linearity High(U/L) 350
If result obtained was greater than linearity limit, sample was diluted 1:10
with normal saline and result was multiplied by 10.

122
CALCULATION
ALT (U/L) = ∆OD/min × 1746
BIOLOGICAL REFERENCE INTERVAL
Men: 0-45 U/L
Women: 0-34 U/L
� ESTIMATION OF AST
METHOD: NADH, Kinetic UV, IFCC recommended
PRINCIPLE
Aspartate aminotransferase (AST) formerly called glutamate oxaloacetate
(GOT) catalyses the reversible transfer of an amino group from aspartate
to α-ketoglutarate forming glutamate and oxalacetate. The oxalacetate
produced is reduced to malate by malate dehydrogenase (MDH) and
NADH. The rate of oxidation of NADH to NAD is measured as a
decrease in absorbance which is proportional to the SGPT (ALAT)
activity in the sample.
L-Aspartate + α-Ketoglutarate AST Glutamate + Oxaloacetate Oxaloacetate + NADH + H
+ MDH Malate + NAD+
REAGENTS
R1: Enzyme Reagent
R2: Starter Reagent
REAGENT PREPARATION
Reagents are ready to use. Protect from bright light.
SAMPLE TYPE
Serum free from haemolysis.
SAMPLE STABILITY
Serum is stable for 3 day at 2 to 80C.
123
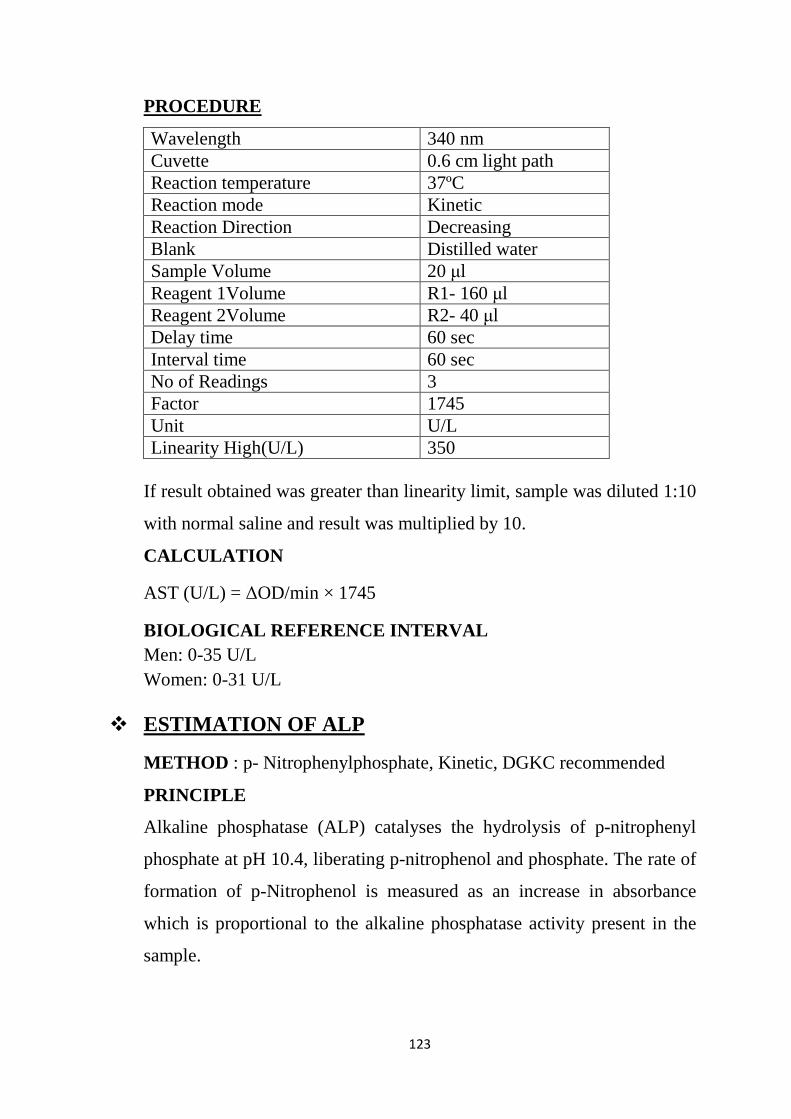
PROCEDURE
Wavelength 340 nm Cuvette 0.6 cm light path Reaction temperature 37ºC Reaction mode Kinetic Reaction Direction Decreasing Blank Distilled water Sample Volume 20 µl Reagent 1Volume R1- 160 µl Reagent 2Volume R2- 40 µl Delay time 60 sec Interval time 60 sec No of Readings 3 Factor 1745 Unit U/L Linearity High(U/L) 350
If result obtained was greater than linearity limit, sample was diluted 1:10
with normal saline and result was multiplied by 10.
CALCULATION
AST (U/L) = ∆OD/min × 1745
BIOLOGICAL REFERENCE INTERVAL Men: 0-35 U/L Women: 0-31 U/L
� ESTIMATION OF ALP
METHOD : p- Nitrophenylphosphate, Kinetic, DGKC recommended
PRINCIPLE
Alkaline phosphatase (ALP) catalyses the hydrolysis of p-nitrophenyl
phosphate at pH 10.4, liberating p-nitrophenol and phosphate. The rate of
formation of p-Nitrophenol is measured as an increase in absorbance
which is proportional to the alkaline phosphatase activity present in the
sample.
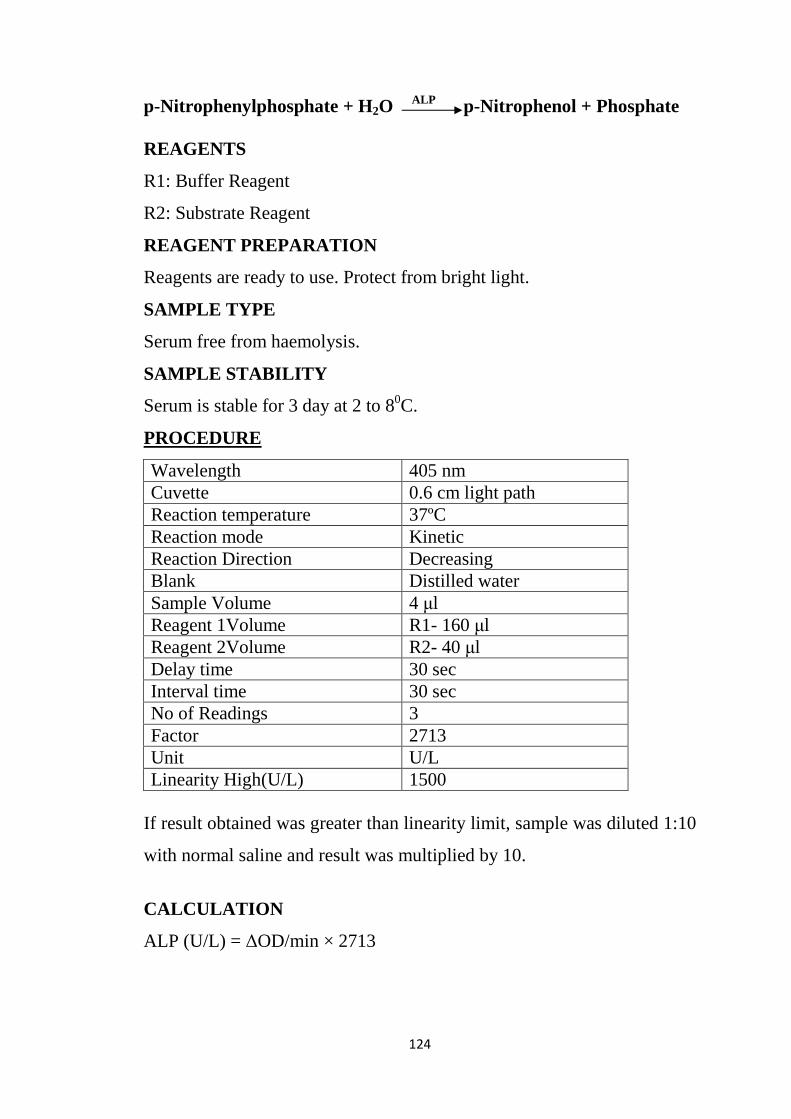
124
p-Nitrophenylphosphate + H2O ALP p-Nitrophenol + Phosphate REAGENTS
R1: Buffer Reagent
R2: Substrate Reagent
REAGENT PREPARATION
Reagents are ready to use. Protect from bright light.
SAMPLE TYPE
Serum free from haemolysis.
SAMPLE STABILITY
Serum is stable for 3 day at 2 to 80C.
PROCEDURE
Wavelength 405 nm Cuvette 0.6 cm light path Reaction temperature 37ºC Reaction mode Kinetic Reaction Direction Decreasing Blank Distilled water Sample Volume 4 µl Reagent 1Volume R1- 160 µl Reagent 2Volume R2- 40 µl Delay time 30 sec Interval time 30 sec No of Readings 3 Factor 2713 Unit U/L Linearity High(U/L) 1500
If result obtained was greater than linearity limit, sample was diluted 1:10
with normal saline and result was multiplied by 10.
CALCULATION
ALP (U/L) = ∆OD/min × 2713

125
BIOLOGICAL REFERENCE INTERVAL
Children (1-14 yrs): 250-700 U/L
Adults: 100-250 U/L
� ESTIMATION OF CREATININE METHOD: Mod. Jaffe’s kinetic method
PRINCIPLE
Picric acid in an alkaline medium reacts with creatinine to form an orange
coloured complex with the alkaline picrate. Intensity of the colour formed
is directly proportional to the amount of creatinine present in the sample.
Creatinine + Alkaline Picrate Orange Coloured Complex
REAGENTS
Picric acid reagent
Buffer reagent
REAGENT PREPARATION
Reagents are ready to use. Protect from bright light.
SAMPLE TYPE
Serum free from haemolysis.
SAMPLE STABILITY
Serum is stable for 7 days at 2 to 80C
PROCEDURE
Wavelength 520 nm Reaction Mode Fixed time kinetic Cuvette 0.6 cm light path Reaction Temperature 37°C or R.T. Measurement (Blanking) Distilled water Sample Volume 20 µl Reagent 1Volume 100 µl Reagent 1Volume 100 µl Incubation 3 minutes at 37°C Linearity 20 mg/dL Standard Concentration 2 mg/dL
126
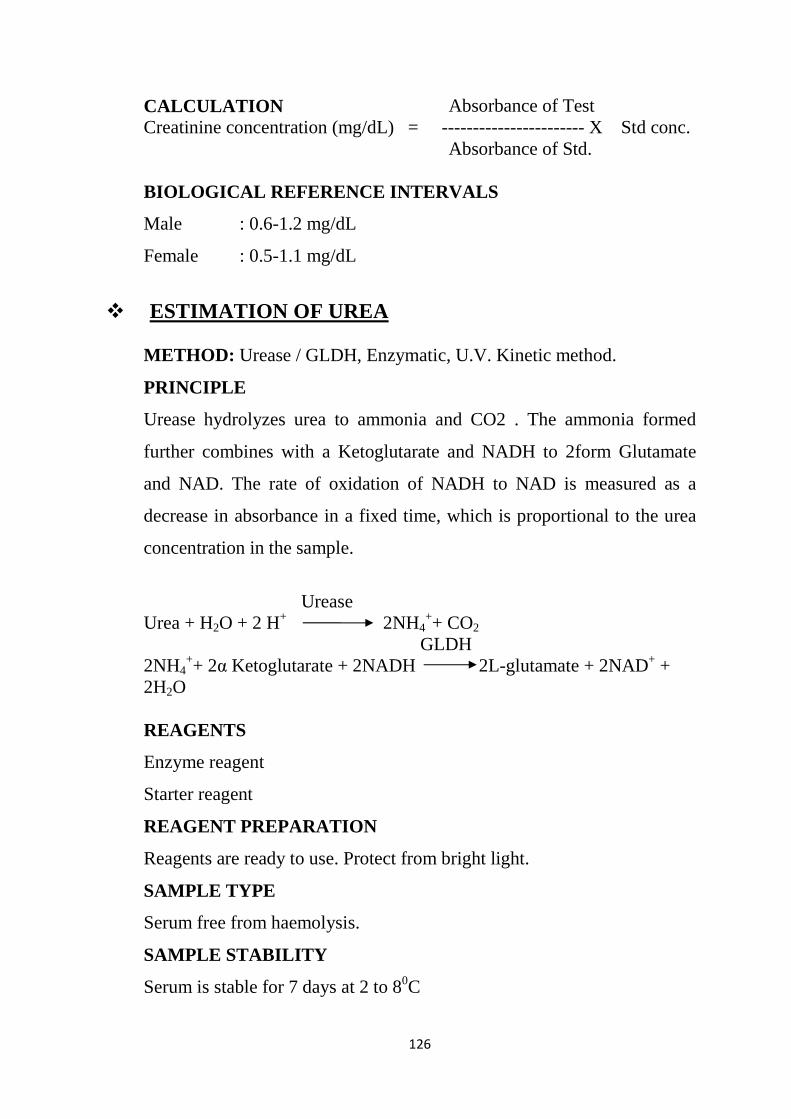
CALCULATION Creatinine concentration (mg/dL) = ----------------------- X Std conc. BIOLOGICAL REFERENCE INTERVALS
Male : 0.6-1.2 mg/dL
Female : 0.5-1.1 mg/dL
� ESTIMATION OF UREA
METHOD: Urease / GLDH, Enzymatic, U.V. Kinetic method.
PRINCIPLE
Urease hydrolyzes urea to ammonia and CO2 . The ammonia formed
further combines with a Ketoglutarate and NADH to 2form Glutamate
and NAD. The rate of oxidation of NADH to NAD is measured as a
decrease in absorbance in a fixed time, which is proportional to the urea
concentration in the sample.
Urease
Urea + H2O + 2 H+ 2NH4++ CO2
GLDH 2NH4
++ 2α Ketoglutarate + 2NADH 2L-glutamate + 2NAD+ + 2H2O REAGENTS
Enzyme reagent
Starter reagent
REAGENT PREPARATION
Reagents are ready to use. Protect from bright light.
SAMPLE TYPE
Serum free from haemolysis.
SAMPLE STABILITY
Serum is stable for 7 days at 2 to 80C
Absorbance of Test Absorbance of Std.

127
PROCEDURE
Wavelength 340 nm Reaction Mode Fixed time kinetic Cuvette 0.6 cm light path Reaction Temperature 37°C or R.T. Measurement (Blanking) Distilled water Sample Volume 3 µl Reagent 1Volume 300 µl Incubation 3 minutes at 37°C Linearity 250 mg/dL Standard Concentration 40 mg/dL
BIOLOGICAL REFERENCE INTERVALS Serum / Plasma : 14 - 40 mg/dl CALCULATION Urea concentration (mg/dL) = -------------------------- X Std. conc.
� ESTIMATION OF URIC ACID
METHOD: Uricase/ PAP method.
PRINCIPLE
Uricase converts uric acid to allantoin and hydrogen peroxide. The
hydrogen peroxide formed further reacts with aphenolic compound and 4
aminoantipyrine by the catalytic action of peroxidase to form a red
coloured quinoneimine dyecomplex. Intensity of the colour formed is
directly proportional to the amount of uric acid present in the sample.
Uricase Uric Acid + H2O Allantoin + H2O2 H2O2+ 4 Aminoantipyrine Red Quinoneimine dye +
H2O + Phenolic Compound
REAGENTS
Buffer reagent
Absorbance of Test Absorbance of Std.
Peroxidase

128
Enzyme reagent
REAGENT PREPARATION
Reagents are ready to use. Protect from bright light.
SAMPLE TYPE
Serum free from haemolysis.
SAMPLE STABILITY
Serum is stable for 7 days at 2 to 80C
PROCEDURE
Wavelength 520 nm Reaction Mode End point Cuvette 0.6 cm light path Reaction Temperature 37°C or R.T. Measurement (Blanking) Distilled water Sample Volume 4 µl Reagent 1Volume 160 µl Reagent 2Volume 40 µl Incubation 5 minutes at 37°C Linearity 20 mg/dL Standard Concentration 8 mg/dL CALCULATION Uric acid concentration (mg/dL) = X X Std. conc. BIOLOGICAL REFERENCE INTERVALS Serum / Plasma : Male: 3.4-7.0 mg/dl Female: 2.5-6 mg/dl
� ESTIMATION OF TOTAL PROTEIN
METHOD: Biuret, Colorimetric
PRINCIPLE
Proteins give an intensive violet-blue complex with copper salts in an
alkaline medium. Iodide is included as an antioxidant. The intensity of
Absorbance of Test Absorbance of Test
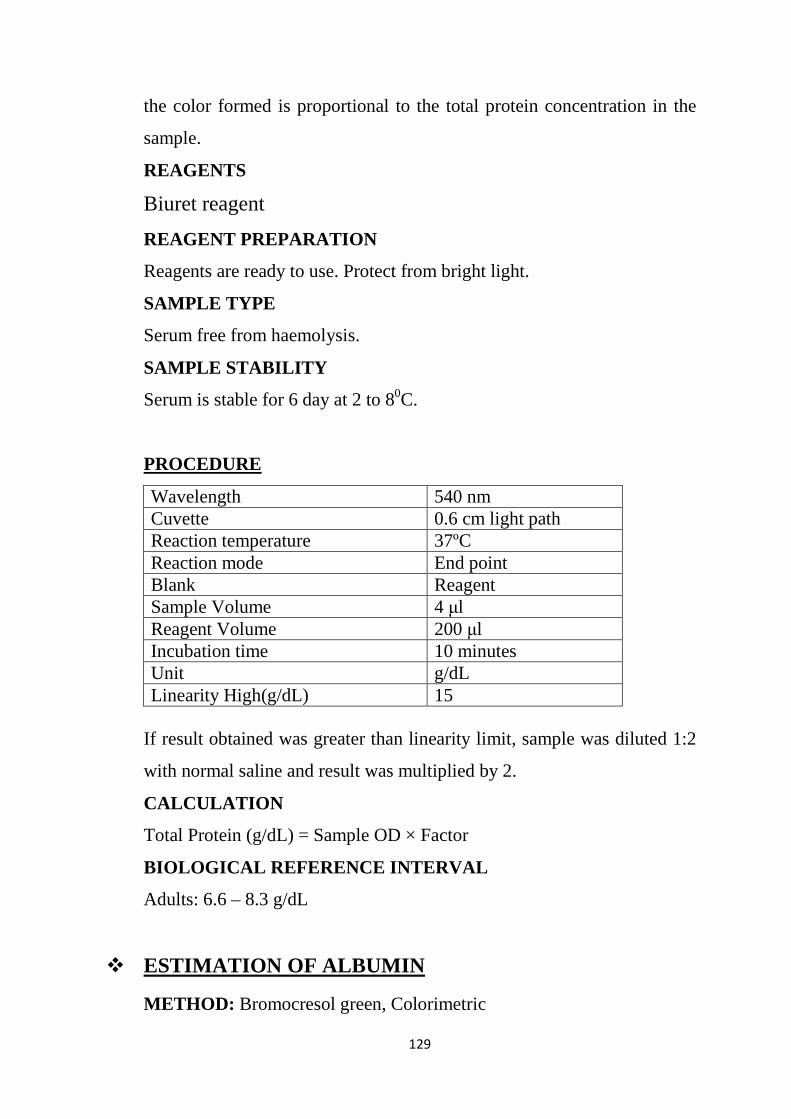
129
the color formed is proportional to the total protein concentration in the
sample.
REAGENTS
Biuret reagent
REAGENT PREPARATION
Reagents are ready to use. Protect from bright light.
SAMPLE TYPE
Serum free from haemolysis.
SAMPLE STABILITY
Serum is stable for 6 day at 2 to 80C.
PROCEDURE
Wavelength 540 nm Cuvette 0.6 cm light path Reaction temperature 37ºC Reaction mode End point Blank Reagent Sample Volume 4 µl Reagent Volume 200 µl Incubation time 10 minutes Unit g/dL Linearity High(g/dL) 15
If result obtained was greater than linearity limit, sample was diluted 1:2
with normal saline and result was multiplied by 2.
CALCULATION
Total Protein (g/dL) = Sample OD × Factor
BIOLOGICAL REFERENCE INTERVAL
Adults: 6.6 – 8.3 g/dL
� ESTIMATION OF ALBUMIN
METHOD: Bromocresol green, Colorimetric

130
PRINCIPLE
Albumin in the presence of bromocresol green at a slightly acid pH
produces a colour change of the indicator from yellow-green to green-
blue. The intensity of the color formed is proportional to the albumin
concentration in the sample.
REAGENT
Bromocresol green, pH 4.2
REAGENT PREPARATION
Reagents are ready to use. Protect from bright light.
SAMPLE TYPE
Serum free from haemolysis.
SAMPLE STABILITY
Serum is stable for 6 day at 2 to 80C.
PROCEDURE
Wavelength 630 nm Cuvette 0.6 cm light path Reaction temperature 37ºC Reaction mode End point Blank Reagent Sample Volume 2 µl Reagent Volume 220 µl Incubation time 10 minutes Unit g/dL Linearity High(g/dL) 7
If result obtained was greater than linearity limit, sample was diluted 1:2
with normal saline and result was multiplied by 2.
CALCULATION
Albumin (g/dL) = Sample OD × Factor
BIOLOGICAL REFERENCE INTERVAL
3.5 to 5.0 g/ dL

131
� ESTIMATION OF MICROALBUMINURIA
METHOD: TURBIDIMETRIC IMMUNOASSAY PRINCIPLE
In this method determination of microalbumin is based on the principle of
agglutination reaction. The test specimen is mixed with the activation
buffer (R1) and anti-human antibody solution (R2) and allowed to react.
Presence of albumin in the test specimen forms an insoluble complex
producing a turbidity, which is measured at wavelength 340 nm. The
resulting turbidity corresponds to the concentration of albumin in the test
specimen.
REAGENT
1. Activation Buffer (R1): Ready to use.
2. Anti-human albumin Reagent (R2): Ready to use solution of anti-
human albumin antibody.
3. Calibrator: Ready to use albumin solution and is equivalent to the
stated amount of albumin on mg/L basis.
REAGENT STORAGE AND STABILITY
1. Store the reagents at 2-8°C. DO NOT FREEZE. 2. The mixed stability of working reagent (R1+R2) is 7 days when
stored at 2-8°C.
PROCEDURE
Wavelength 340 nm Cuvette 0.6 cm light path Reaction mode 2-point Blank Distilled water Sample Volume 25 µl Reagent 1 Volume 250 µl Reagent 2 Volume 50 µl Incubation time 7 minutes Unit mg/L Detection limit (mg/L) 20
132
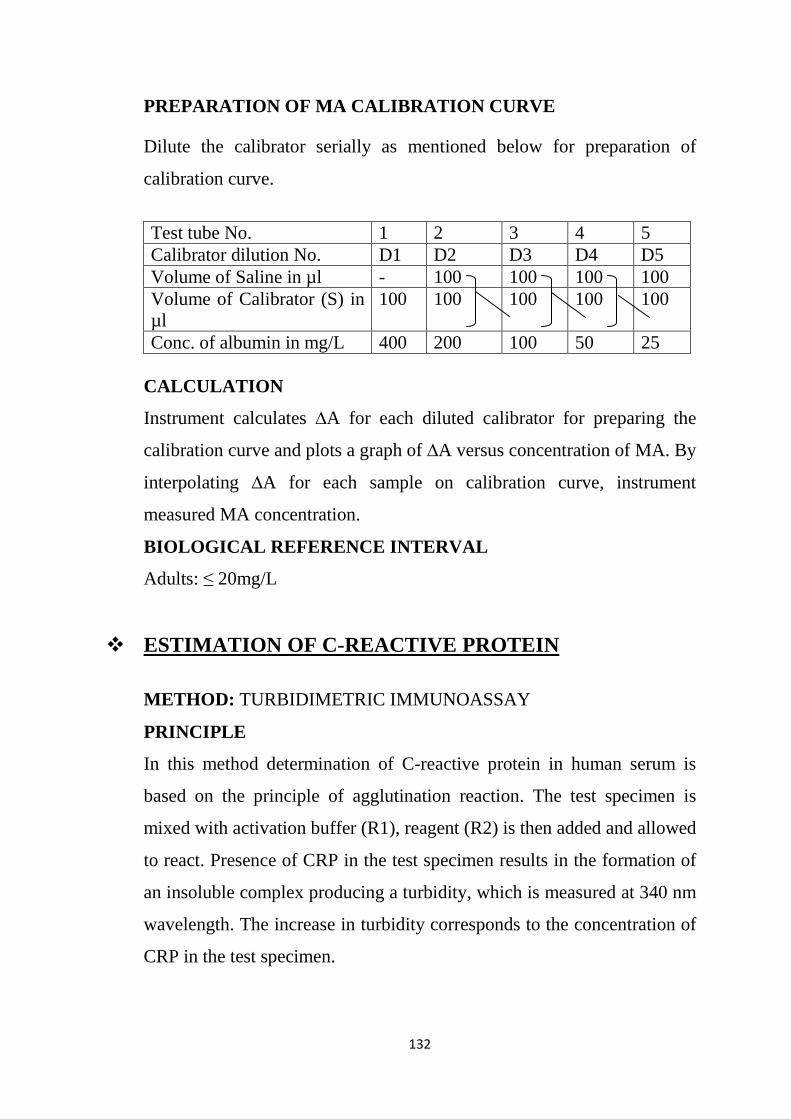
PREPARATION OF MA CALIBRATION CURVE
Dilute the calibrator serially as mentioned below for preparation of
calibration curve.
Test tube No. 1 2 3 4 5 Calibrator dilution No. D1 D2 D3 D4 D5 Volume of Saline in µl - 100 100 100 100 Volume of Calibrator (S) in µl
100 100 100 100 100
Conc. of albumin in mg/L 400 200 100 50 25 CALCULATION
Instrument calculates ∆A for each diluted calibrator for preparing the
calibration curve and plots a graph of ∆A versus concentration of MA. By
interpolating ∆A for each sample on calibration curve, instrument
measured MA concentration.
BIOLOGICAL REFERENCE INTERVAL
Adults: ≤ 20mg/L
� ESTIMATION OF C-REACTIVE PROTEIN
METHOD: TURBIDIMETRIC IMMUNOASSAY
PRINCIPLE
In this method determination of C-reactive protein in human serum is
based on the principle of agglutination reaction. The test specimen is
mixed with activation buffer (R1), reagent (R2) is then added and allowed
to react. Presence of CRP in the test specimen results in the formation of
an insoluble complex producing a turbidity, which is measured at 340 nm
wavelength. The increase in turbidity corresponds to the concentration of
CRP in the test specimen.
133
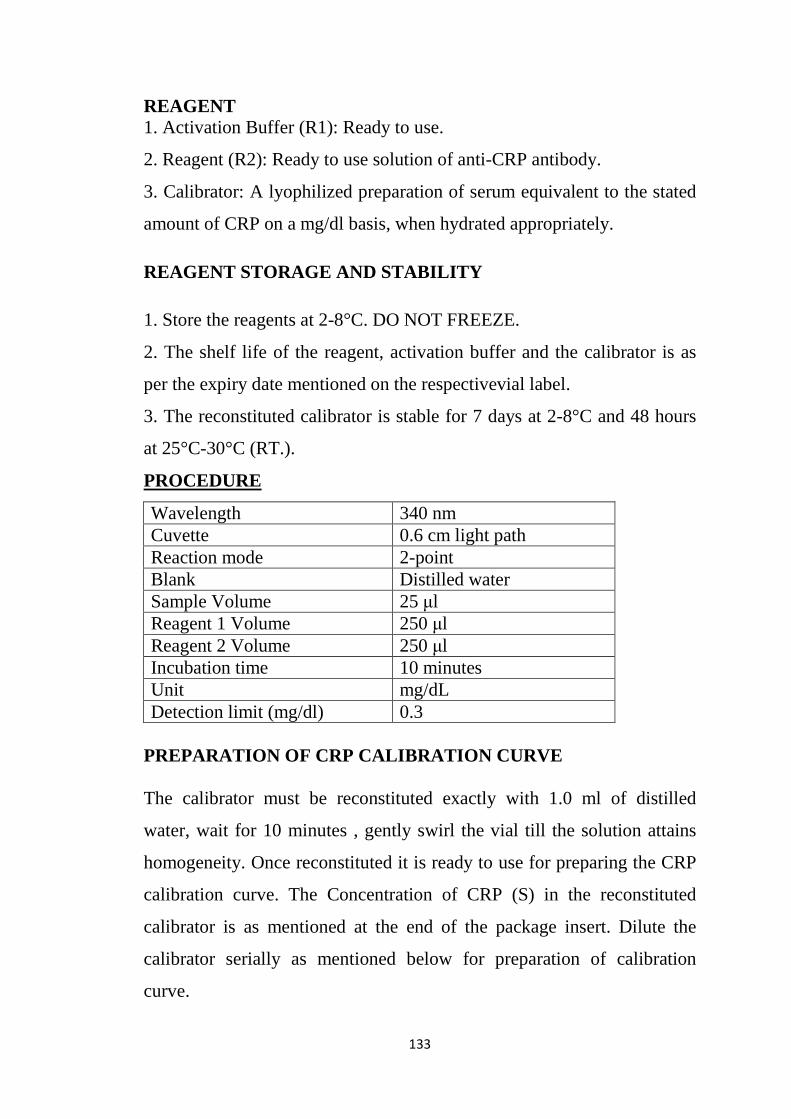
REAGENT 1. Activation Buffer (R1): Ready to use.
2. Reagent (R2): Ready to use solution of anti-CRP antibody.
3. Calibrator: A lyophilized preparation of serum equivalent to the stated
amount of CRP on a mg/dl basis, when hydrated appropriately.
REAGENT STORAGE AND STABILITY
1. Store the reagents at 2-8°C. DO NOT FREEZE.
2. The shelf life of the reagent, activation buffer and the calibrator is as
per the expiry date mentioned on the respectivevial label.
3. The reconstituted calibrator is stable for 7 days at 2-8°C and 48 hours
at 25°C-30°C (RT.).
PROCEDURE
Wavelength 340 nm Cuvette 0.6 cm light path Reaction mode 2-point Blank Distilled water Sample Volume 25 µl Reagent 1 Volume 250 µl Reagent 2 Volume 250 µl Incubation time 10 minutes Unit mg/dL Detection limit (mg/dl) 0.3
PREPARATION OF CRP CALIBRATION CURVE The calibrator must be reconstituted exactly with 1.0 ml of distilled
water, wait for 10 minutes , gently swirl the vial till the solution attains
homogeneity. Once reconstituted it is ready to use for preparing the CRP
calibration curve. The Concentration of CRP (S) in the reconstituted
calibrator is as mentioned at the end of the package insert. Dilute the
calibrator serially as mentioned below for preparation of calibration
curve.

134
Test tube No. 1 2 3 4 5 Calibrator dilution No. D1 D2 D3 D4 D5 Volume of Saline in µl - 100 375 880 940 Volume of Calibrator (S) in µl 100 100 125 120 60 Conc. Of CRP in mg/dl 10 5 2.5 1.2 0.6
CALCULATION
Instrument calculates ∆A for each diluted calibrator for preparing the
calibration curve and plots a graph of ∆A versus concentration of CRP.
Interpolate ∆A for each sample on calibration curve and obtain CRP
concentration.
BIOLOGICAL REFERENCE INTERVAL
Adults: < 0.6 mg/dL
� ESTIMATION OF HbA1c
METHOD: NycoCard method
PRINCIPLE
NycoCard HbA1c is a boronate affinity assay. When blood is added to
the reagent, the erythrocytes immediately lyse. All hemoglobin
precipitates. The boronic acid conjugate binds to the cis-diol
configuration of glycated hemoglobin. An aliquot of the reaction mixture
is added to the test device, and all the precipitated hemoglobin,
conjugate-bound and unbound, remains on top of the filter. Any excess of
coloured conjugate is removed with the washing solution. The precipitate
is evaluated by measuring the blue and red colour intensity with the
NycoCard reader, the ratio between them being proportional to the
percentage of HbA1c in the sample.
135
REAGENTS
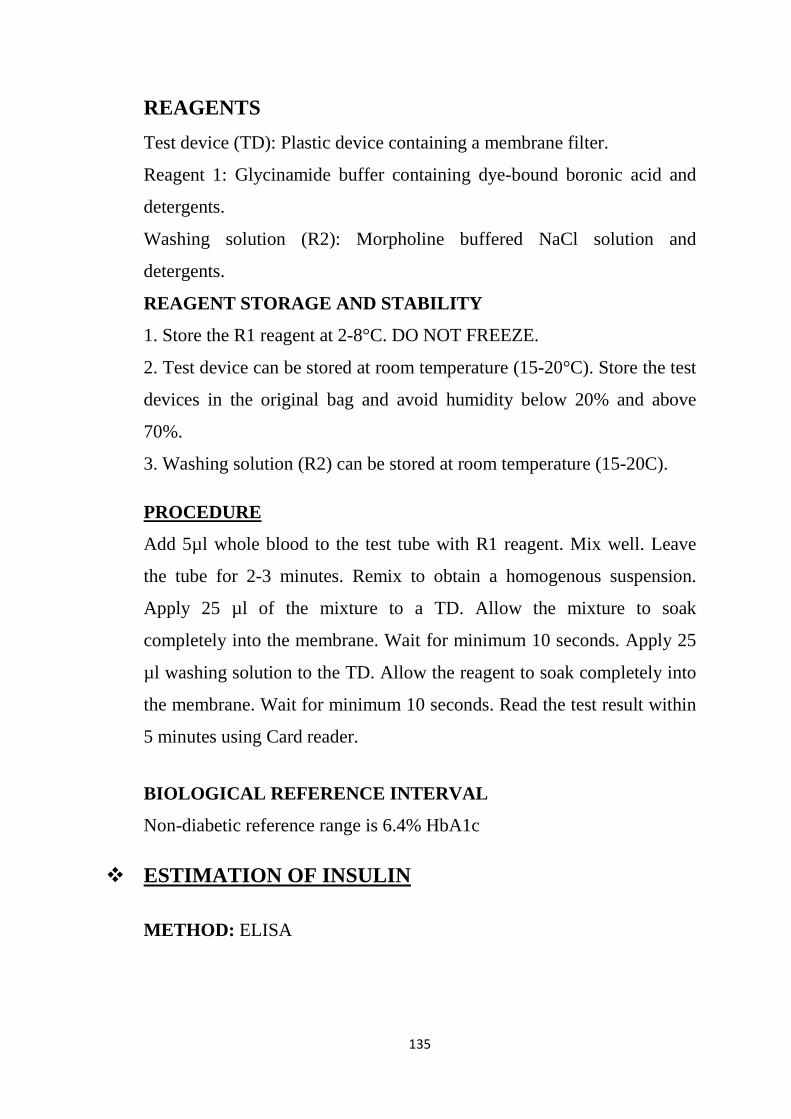
Test device (TD): Plastic device containing a membrane filter.
Reagent 1: Glycinamide buffer containing dye-bound boronic acid and
detergents.
Washing solution (R2): Morpholine buffered NaCl solution and
detergents.
REAGENT STORAGE AND STABILITY
1. Store the R1 reagent at 2-8°C. DO NOT FREEZE.
2. Test device can be stored at room temperature (15-20°C). Store the test
devices in the original bag and avoid humidity below 20% and above
70%.
3. Washing solution (R2) can be stored at room temperature (15-20C).
PROCEDURE
Add 5µl whole blood to the test tube with R1 reagent. Mix well. Leave
the tube for 2-3 minutes. Remix to obtain a homogenous suspension.
Apply 25 µl of the mixture to a TD. Allow the mixture to soak
completely into the membrane. Wait for minimum 10 seconds. Apply 25
µl washing solution to the TD. Allow the reagent to soak completely into
the membrane. Wait for minimum 10 seconds. Read the test result within
5 minutes using Card reader.
BIOLOGICAL REFERENCE INTERVAL
Non-diabetic reference range is 6.4% HbA1c
� ESTIMATION OF INSULIN
METHOD: ELISA

136
PRINCIPLE
Insulin ELISA kit is based on the sandwich principle. The microtiter
wells are coated with a monoclonal antibody directed towards a unique
antigenic site on the insulin molecule. An aliquot of patient samle
containing endogenous insulin is incubated in the coated well with
enzyme conjugate, which is an anti-insulin antibody conjugated with
biotin. After incubation the unbound conjugate is washed off. During
second incubation step streptavidin peroxidase enzyme complex binds to
the biotin-anti-insulin antibody. The amount of bound HRP complex is
proportional to the concentration of insulin in the sample. Having added
the substrate solution, the intensity of colour developed is proportional to
the concentration of insulin in the patient sample.
REAGENTS
1. Microtiterwells: Wells coated with anti-insulin antibody (monoclonal).
2. Zero standard: Ready to use 0µIU/mL
3. Standard (1-5): Ready to use, Concentrations:
6.25,12.5,25,50,100µIU/mL
4. Enzyme conjugate: Ready to use, Mouse monoclonal anti-insulin
conjugated to biotin
5. Enzyme complex: Ready to use, Streptavidin-HRP complex
6. Substrate solution: Ready to use, Tetramethylbenzidine (TMB)
7. Stop solution: Ready to use, 0.5M H2SO4
8. Wash solution: 40X concentration
Dilute 30 ml of concentrated wash solution with 1170 ml deionized water
to a final volume of 1200mL.
REAGENT STORAGE AND STABILITY
1. Store the reagent at 2-8°C. DO NOT FREEZE.

137
2. Opened kits retain activity for 8 weeks.
PROCEDURE
Dispense 25 µl of each standard, control and samples with new
disposable tips into appropriate wells. Dispense 25 µl enzyme conjugate
into each well. Thoroughly mix for 10 seconds. Incubate for 30 minutes
at room temperature. Briskly shake out the contents of the wells. Rinse
the wells 3 times with diluted wash solution (400µl per well). Strike the
wells sharply on absorbent paper to remove residual droplets. Add 50 µl
of enzyme complex to each well. Incubate for 30 minutes at room
temperature. Briskly shake out the contents of the wells. Rinse the wells 3
times with diluted wash solution (400µl per well). Strike the wells
sharply on absorbent paper to remove residual droplets. Add 50 µl of
substrate solution to each well. Incubate for 15 minutes at room
temperature. Stop the enzymatic reaction by adding 50 µl of stop solution
to each well. Determine the absorbance (OD) of each well at 450nm with
a microtiter plate reade within 10 minutes.
CALCULATION
Instrument calculates average absorbance values for each set of standards,
controls and patient samples. A standard curve is constructed
automatically by the instrument. The concentration of the samples can be
read directly from this standard curve.
BIOLOGICAL REFERENCE INTERVAL
Adults : 2 -25µIU/mL
� ESTIMATION OF CHOLESTEROL
METHOD: CHOD / PAP

138
PRINCIPLE
Cholesterol esters are hydrolyzed by cholesterol esterase to produce
cholesterol. This cholesterol is then oxidized by Cholesterol oxidase to
produce hydrogen peroxide which in turn reacts with 4 aminoantipyrine
and phenolic compound in presence of peroxidase to yield a red coloured
complex. Intensity of the colour formed is directly proportional to the
amount of cholesterol present in the sample.
REAGENTS
R1: Enzyme Reagent 1
R2: Enzyme Reagent 2
REAGENT PREPARATION
Reagents are ready to use. Protect from bright light.
SAMPLE TYPE
Serum free from haemolysis.
SAMPLE STABILITY
Serum is stable for 7 days at 2 to 80C.
PROCEDURE
Wavelength 520 nm Reaction Mode End Point Cuvette 0.6 cm light path Reaction Temperature 37°C or R.T. Measurement (Blanking) Against Reagent Blank Sample Volume 2 µl Reagent Volume 200 µl Incubation 5 minutes at 37°C Linearity 750 mg/dL Standard Concentration 200 mg/dL
CALCULATION
Cholesterol concentration (mg/dL) = ----------------------- X Std con.
Absorbance of Test Absorbance of Std.
139
BIOLOGICAL REFERENCE INTERVAL
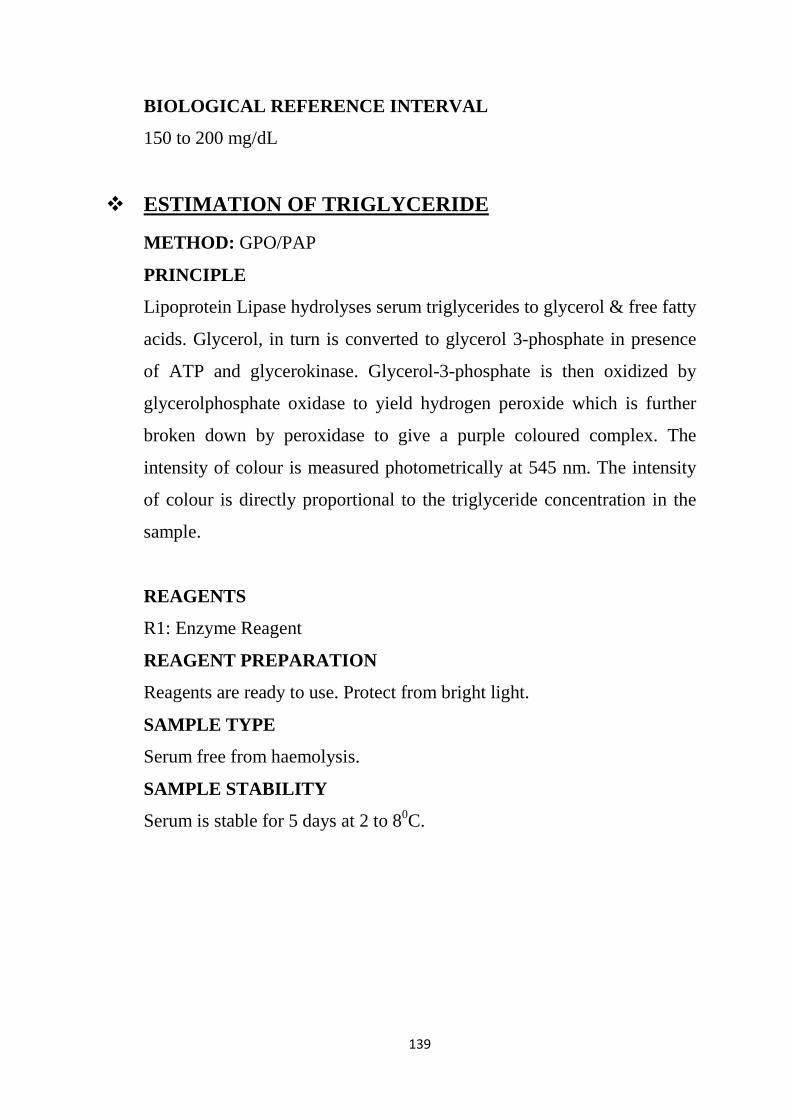
150 to 200 mg/dL
� ESTIMATION OF TRIGLYCERIDE
METHOD: GPO/PAP
PRINCIPLE
Lipoprotein Lipase hydrolyses serum triglycerides to glycerol & free fatty
acids. Glycerol, in turn is converted to glycerol 3-phosphate in presence
of ATP and glycerokinase. Glycerol-3-phosphate is then oxidized by
glycerolphosphate oxidase to yield hydrogen peroxide which is further
broken down by peroxidase to give a purple coloured complex. The
intensity of colour is measured photometrically at 545 nm. The intensity
of colour is directly proportional to the triglyceride concentration in the
sample.
REAGENTS
R1: Enzyme Reagent
REAGENT PREPARATION
Reagents are ready to use. Protect from bright light.
SAMPLE TYPE
Serum free from haemolysis.
SAMPLE STABILITY
Serum is stable for 5 days at 2 to 80C.
140
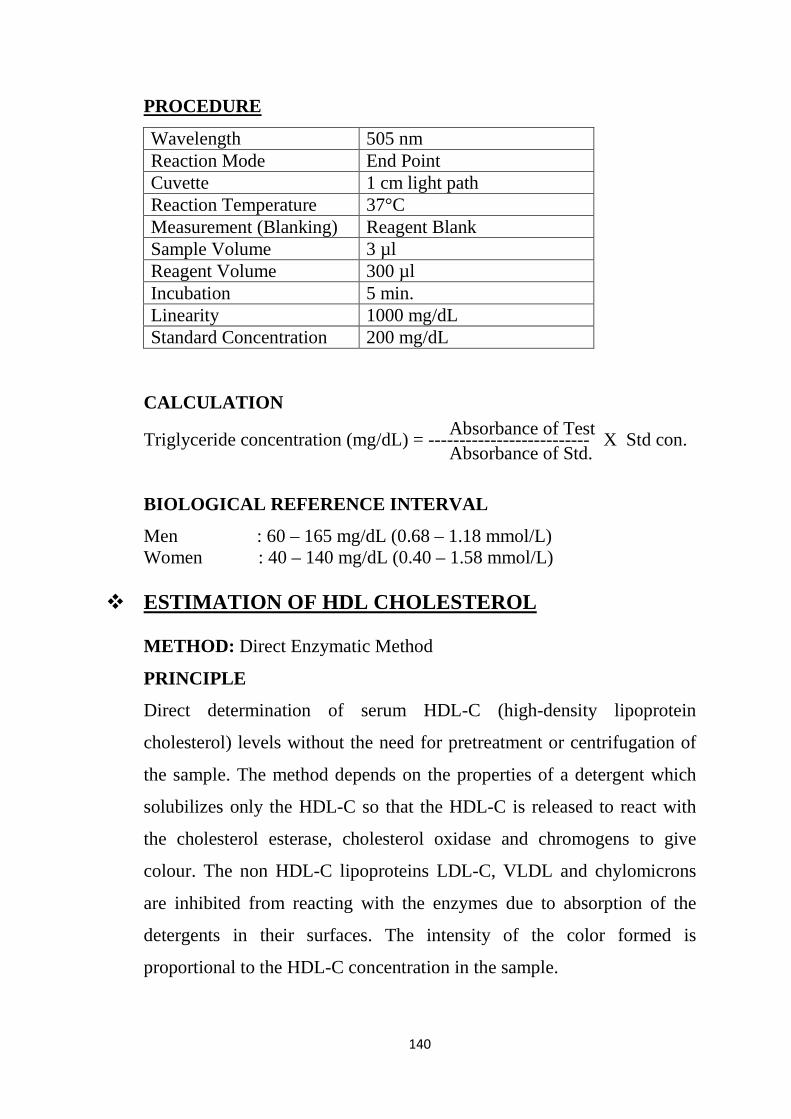
PROCEDURE
Wavelength 505 nm Reaction Mode End Point Cuvette 1 cm light path Reaction Temperature 37°C Measurement (Blanking) Reagent Blank Sample Volume 3 µl Reagent Volume 300 µl Incubation 5 min. Linearity 1000 mg/dL Standard Concentration 200 mg/dL
CALCULATION
Triglyceride concentration (mg/dL) = -------------------------- X Std con. BIOLOGICAL REFERENCE INTERVAL
Men : 60 – 165 mg/dL (0.68 – 1.18 mmol/L) Women : 40 – 140 mg/dL (0.40 – 1.58 mmol/L)
� ESTIMATION OF HDL CHOLESTEROL
METHOD: Direct Enzymatic Method
PRINCIPLE
Direct determination of serum HDL-C (high-density lipoprotein
cholesterol) levels without the need for pretreatment or centrifugation of
the sample. The method depends on the properties of a detergent which
solubilizes only the HDL-C so that the HDL-C is released to react with
the cholesterol esterase, cholesterol oxidase and chromogens to give
colour. The non HDL-C lipoproteins LDL-C, VLDL and chylomicrons
are inhibited from reacting with the enzymes due to absorption of the
detergents in their surfaces. The intensity of the color formed is
proportional to the HDL-C concentration in the sample.
Absorbance of Test Absorbance of Std.

141
REAGENTS
R1: Enzyme Reagent 1
R2: Enzyme Reagent 2
REAGENT PREPARATION
Reagents are ready to use. Protect from bright light.
SAMPLE TYPE
Serum free from haemolysis.
SAMPLE STABILITY
Serum is stable for 7 days at 2 to 80C.
PROCEDURE
Mode of reaction End point Slope of reaction Increasing Wavelength 630 nm Temperature 37ºC Linearity Up to 150 mg/dL Blank Reagent Incubation time 5 min Sample Volume 3µl Reagent 1volume 225µL Reagent 2volume 75µl Cuvette 0.6 cm light path Linearity 150mg/dl Standard Concentration 46 mg/dL
CALCULATION
For Calibrator ∆ AC = A2C – A1C
For Test ∆ AT = A2T – A1T
HDL-C in mg/dL = X Concentration of Standard
BIOLOGICAL REFERENCE INTERVAL
Male Female Low risk > 50 mg/dL > 60 mg/dL Normal Risk 35 - 50 mg/dL 45-60 mg/dL High Risk < 35 mg/dL < 45 mg/dL
∆ AC ∆ AT

142
� ESTIMATION OF VLDL-CHOLESTEROL VLDL is calculated by following Friedwald formula VLDL = TG/5 BIOLOGICAL REFERENCE INTERVAL Upto 35 mg/dL
� ESTIMATION OF LDL-CHOLESTEROL LDL is calculated by following Friedwald equation: LDL-Cholesterol = Total Cholesterol – (VLDL+ HDL-Cholesterol) BIOLOGICAL REFERENCE INTERVAL Upto 100 mg/dL TC/HDL and LDL/HDL Ratio were thereby calculated.
� ESTIMATION OF MAGNESIUM
METHOD: Calmagite Method
PRINCIPLE
Magnesium combines with Calmagite in an alkaline medium to form a
red coloured complex. Interference of calcium and proteins is eliminated
by the addition of specific chelating agents and detergents. Intensity of
the colour formed is directly proportional to the amount of magnesium
present in the sample.
Alkaline Magnesium + Calmagite Red coloured complex
Medium
REAGENTS
R1: Buffer Reagent
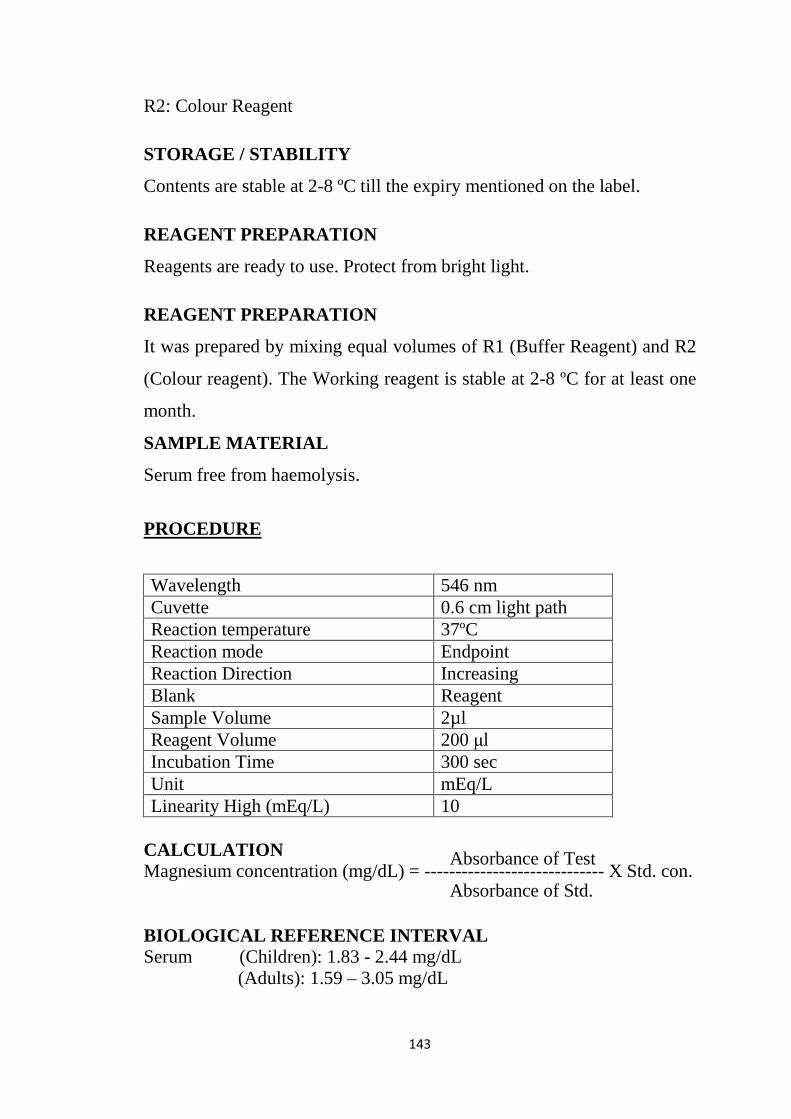
143
R2: Colour Reagent
STORAGE / STABILITY
Contents are stable at 2-8 ºC till the expiry mentioned on the label.
REAGENT PREPARATION
Reagents are ready to use. Protect from bright light.
REAGENT PREPARATION
It was prepared by mixing equal volumes of R1 (Buffer Reagent) and R2
(Colour reagent). The Working reagent is stable at 2-8 ºC for at least one
month.
SAMPLE MATERIAL
Serum free from haemolysis.
PROCEDURE
CALCULATION Magnesium concentration (mg/dL) = ----------------------------- X Std. con.
BIOLOGICAL REFERENCE INTERVAL Serum (Children): 1.83 - 2.44 mg/dL
(Adults): 1.59 – 3.05 mg/dL
Wavelength 546 nm Cuvette 0.6 cm light path Reaction temperature 37ºC Reaction mode Endpoint Reaction Direction Increasing Blank Reagent Sample Volume 2µl Reagent Volume 200 µl Incubation Time 300 sec Unit mEq/L Linearity High (mEq/L) 10
Absorbance of Test
Absorbance of Std.
144
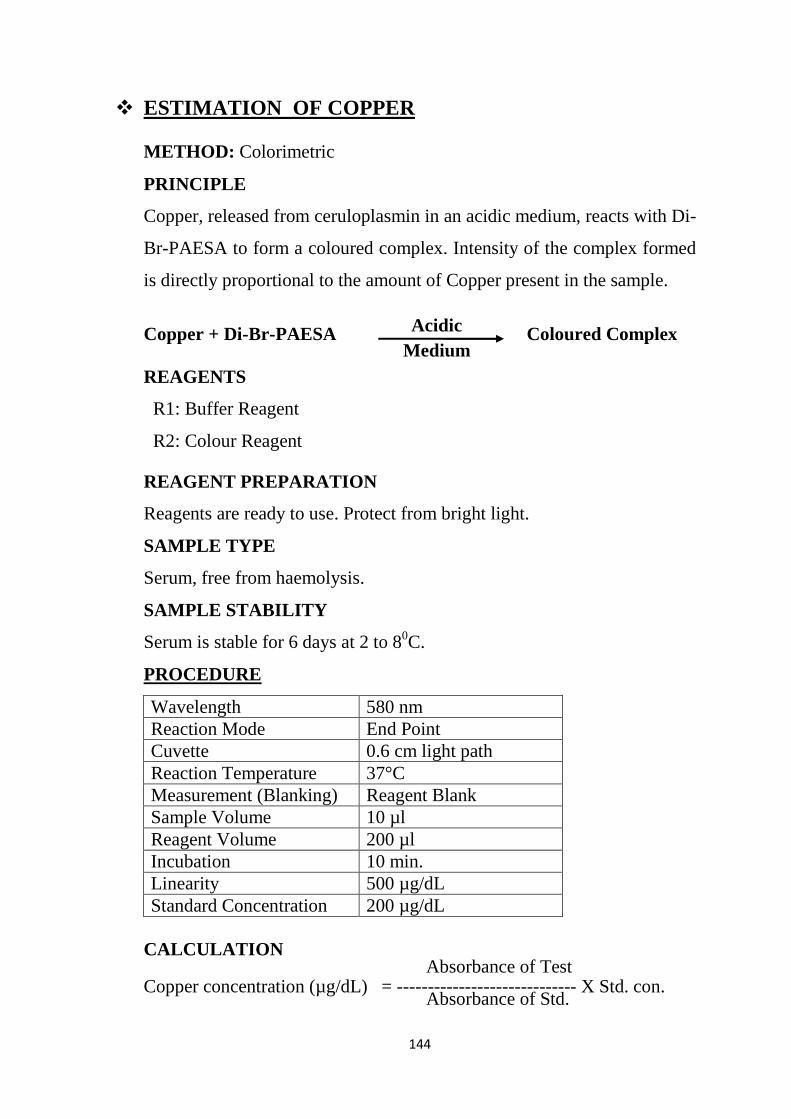
� ESTIMATION OF COPPER
METHOD: Colorimetric
PRINCIPLE
Copper, released from ceruloplasmin in an acidic medium, reacts with Di-
Br-PAESA to form a coloured complex. Intensity of the complex formed
is directly proportional to the amount of Copper present in the sample.
Copper + Di-Br-PAESA Coloured Complex REAGENTS
R1: Buffer Reagent
R2: Colour Reagent
REAGENT PREPARATION
Reagents are ready to use. Protect from bright light.
SAMPLE TYPE
Serum, free from haemolysis.
SAMPLE STABILITY
Serum is stable for 6 days at 2 to 80C.
PROCEDURE
Wavelength 580 nm Reaction Mode End Point Cuvette 0.6 cm light path Reaction Temperature 37°C Measurement (Blanking) Reagent Blank Sample Volume 10 µl Reagent Volume 200 µl Incubation 10 min. Linearity 500 µg/dL Standard Concentration 200 µg/dL
CALCULATION
Copper concentration (µg/dL) = ----------------------------- X Std. con.
Acidic Medium
Absorbance of Test
Absorbance of Std.
145
BIOLOGICAL REFERENCE INTERVAL Male : 80 – 140 µg/dL Female : 80 – 155 µg/dL
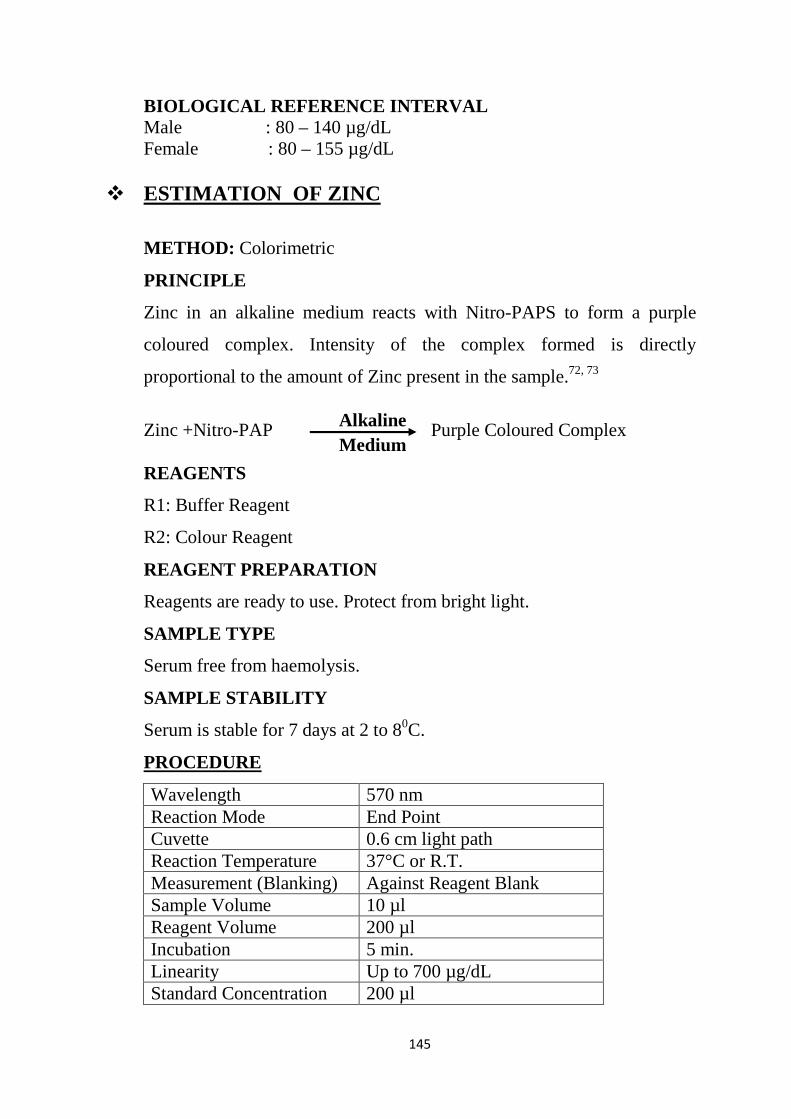
� ESTIMATION OF ZINC
METHOD: Colorimetric
PRINCIPLE
Zinc in an alkaline medium reacts with Nitro-PAPS to form a purple
coloured complex. Intensity of the complex formed is directly
proportional to the amount of Zinc present in the sample.72, 73
Zinc +Nitro-PAP Purple Coloured Complex REAGENTS
R1: Buffer Reagent
R2: Colour Reagent
REAGENT PREPARATION
Reagents are ready to use. Protect from bright light.
SAMPLE TYPE
Serum free from haemolysis.
SAMPLE STABILITY
Serum is stable for 7 days at 2 to 80C.
PROCEDURE
Wavelength 570 nm Reaction Mode End Point Cuvette 0.6 cm light path Reaction Temperature 37°C or R.T. Measurement (Blanking) Against Reagent Blank Sample Volume 10 µl Reagent Volume 200 µl Incubation 5 min. Linearity Up to 700 µg/dL Standard Concentration 200 µl
Alkaline Medium
146
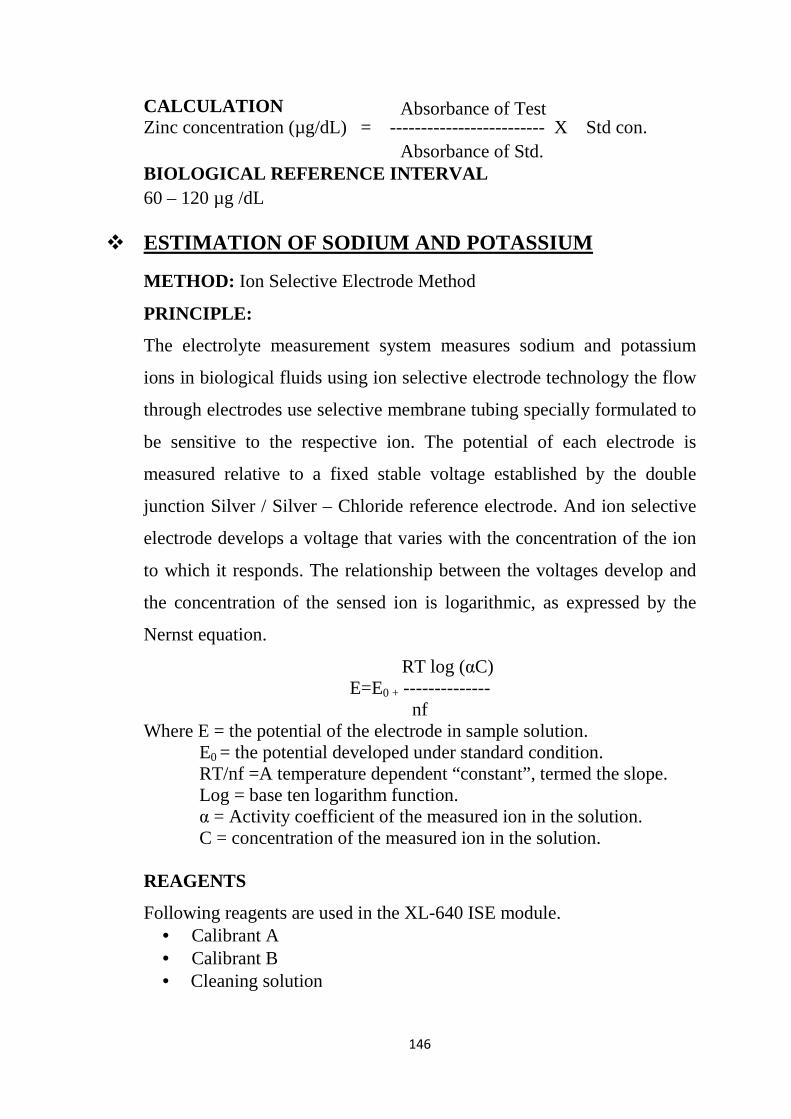
CALCULATION Zinc concentration (µg/dL) = ------------------------- X Std con. BIOLOGICAL REFERENCE INTERVAL 60 – 120 µg /dL
� ESTIMATION OF SODIUM AND POTASSIUM
METHOD: Ion Selective Electrode Method
PRINCIPLE:
The electrolyte measurement system measures sodium and potassium
ions in biological fluids using ion selective electrode technology the flow
through electrodes use selective membrane tubing specially formulated to
be sensitive to the respective ion. The potential of each electrode is
measured relative to a fixed stable voltage established by the double
junction Silver / Silver – Chloride reference electrode. And ion selective
electrode develops a voltage that varies with the concentration of the ion
to which it responds. The relationship between the voltages develop and
the concentration of the sensed ion is logarithmic, as expressed by the
Nernst equation.
RT log (αC) E=E0 + --------------
nf Where E = the potential of the electrode in sample solution. E0 = the potential developed under standard condition. RT/nf =A temperature dependent “constant”, termed the slope. Log = base ten logarithm function. α = Activity coefficient of the measured ion in the solution. C = concentration of the measured ion in the solution. REAGENTS
Following reagents are used in the XL-640 ISE module. • Calibrant A • Calibrant B • Cleaning solution
Absorbance of Test
Absorbance of Std.
147
PROCEDURE
• When the electrode calibration slopes are in the acceptable range the electrolyte measurement system is ready for the sample analysis.
• For serum sample 70 µl of sample is required for the electrolyte measurement.
BIOLOGICAL REFERENCE INTERVAL:
• SODIUM: Adult : 136 to 145 mEq/L
• POTASSIUM: Adult: 3.5 to 5.1 mEq/L
� HOMA-IR (Homeostasis Model of Assessment - Insulin Resistance) HOMA-IR originally described by Mathews DR et al. (1985) HOMA-IR was calculated using the following formula:
HOMA-IR = Fasting Glucose (mg/dl) × Fasting Insulin (µU/ml) /405
� eGFR (Estimated Glomerular Filteration Rate) eGFR was calculated using the following formula: Cockcroft and Gault (CG) method:
eGFR (male) = (140-age) x wt. / sCr x 72 eGFR (female) = eGFR (male) x 0.85 age = age (years) wt. = weight (Kg) sCr = serum creatinine concentration (mg%) This result was then adjusted for body surface area (BSA). The Mosteller
formula is used because it is much simpler and easily calculated with a
hand-held calculator.

148
The Mosteller formula: BSA (m²) = ([Height (cm) x Weight (kg)]/ 3600)½
Formula used for eGFR calculation in present study was:
eGFR = eGFR from CG Method x 1.73/BSA
BIOLOGICAL REFERENCE INTERVAL:
> 90 ml/min/1.73m2
� BLOOD PRESSURE
After 30 minutes of resting, blood pressure was measured by standard
mercury sphygmomanometers twice at a gap of 1–2 minutes. The average
of the two readings was used to classify high blood pressure or
hypertension.
� ANTHROPOMETRIC MEASUREMENTS
Weight, height, Waist circumference (WC), Hip circumference (HC)
were measured as per WHO guidelines (WHO-2008)
� WEIGHT
Weight of subjects wearing light clothing without shoes was
measured using a calibrated weighing machine. Weight was recorded to
the nearest 0.1 Kg.
� HEIGHT
The subjects were asked to stand erect without shoes against a wall
and their topmost point of vertex was identified with the help of a plastic

149
ruler. Thus height was measured at this point. Height was recorded to the
nearest cm.
� BODY MASS INDEX (BMI)
BMI was calculated using following formula (Garrow JS and
Webster J-1985).
BMI (Kg. /m2) = 2meters)in(Height
Kg.inWeight
Categorization of subjects on the basis of BMI is given in Table G
(WHO-1997).
� WAIST CIRCUMFERENCE
The waist circumference was measured at the midpoint between the lower
margin of the last palpable rib and the top of the iliac crest, using a
stretch‐resistant tape. The measurement is made at the end of a normal
expiration.
� HIP CIRCUMFERENCE
Hip circumference was measured at the widest portion of the buttocks,
with the tape parallel to the floor. The waist to hip ratio (W/H) was
thereby calculated.
� STATISTICAL ANALYSIS Numerical variables are reported in terms of mean and standard
deviation. Data were evaluated by analysis of variance (ANOVA) with
bonferroni’s post hoc test, adjusted for multiple comparisons. P-values of
<0.05 were considered statistically significant. Correlations were
determined by Pearson’s test. Analysis was carried out using Graphpad
Instat version 3 statistical software.