material change of use development permit for extractive ... · jt1582 – 310 gregors creek road...
TRANSCRIPT

December, 2015 Noise Impact Assessment
JT1582 – 310 Gregors Creek Road – NIA for Quarry 1
• Telephone 0417 727 981
• Facsimile 07 5530 7521 • ABN 68 467 757 073
Application Details
Application Type Material Change of Use – Development permit
Defined Use Extractive Industry - Quarry
Street Address 310 Gregors Creek Road, Gregors Creek
Client Edith Pastoral Company
Date December 2015
In support of an application for
Material Change of Use – Development Permit for Extractive Industry (Quarry)
Noise Impact Assessment

December, 2015 Noise Impact Assessment
JT1582 – 310 Gregors Creek Road – NIA for Quarry 2
©This document is and will remain the property of JT Environmental Pty Ltd. The document may only be used for the purposes for which it was commissioned by and for Downer Australia and in accordance with the Terms of Engagement for the commissioning, monitoring and modelling associated with this project. Unauthorised use of this document in any form whatsoever is prohibited by any other parties than those associated with the Agreement dated 5th June 2012.
© 2015 – JT Environmental Pty Ltd ABN 64081048723
P.O Box 1057, Mudgeeraba Qld 4213
P: 0417 727 981 F: 07 5530 7521
Limitations
This report was prepared for the sole use of Edith Pastoral Company in accordance with generally accepted consulting practice. No other warranty, expressed or implied, is made as to the professional advice included in this report. This report has not been prepared for use by parties other than the client, the owner and their respective consulting advisors. It may not contain sufficient information for the purposes of other parties or for other uses. It is recommended that any works planned by others and relating specifically to the content of this report be reviewed by JT Environmental Pty Ltd to verify that the intent of our recommendations is properly reflected in the final design. To the best of our knowledge, information contained in this report is accurate at the date of issue.
Document Status
Rev No. Author Reviewer Approved for Issue
Name Signature Date
A BRS TCD TCD 30.11.15
B BRS TCD TCD 21.12.15
C BRS TCD TCD 18.01.16

December, 2015 Noise Impact Assessment
JT1582 – 310 Gregors Creek Road – NIA for Quarry 3
TABLE OF CONTENTS
1.0 EXECUTIVE SUMMARY .................................................................................................................. 5
1.1 SITE DETAILS...................................................................................................................................... 5 1.2 APPLICATION DETAILS ........................................................................................................................ 5
2.0 INTRODUCTION ................................................................................................................................ 6
2.1 NOISE MITIGATION AND MANAGEMENT ...................................................................................................... 7
3.0 SITE DESCRIPTION .......................................................................................................................... 8
3.1 SURROUNDING LAND USES ................................................................................................................. 8 3.2 EXISTING ENVIRONMENT .................................................................................................................. 10 3.3 EXISTING ENVIRONMENT AERIALS, SEPERATION DISTANCES ............................................................... 10 3.4 PROPOSED DEVELOPMENT ENVIRONMENT ......................................................................................... 12 3.6 QUANTIFYING THE NOISE IMPACT ....................................................................................................... 15 3.7 PEN3D2000 MODELLING SOFTWARE AND SUITABILITY ....................................................................... 15
4.0 EQUIPMENT AND PROCEDURES................................................................................................. 17
4.1 INSTRUMENTATION .......................................................................................................................... 17 4.2 MEASUREMENT PROCEDURE ............................................................................................................. 18
5.0 MEASURED NOISE LEVELS .......................................................................................................... 18
5.1 MEASURED EXISTING ACOUSTIC ENVIRONEMNT................................................................................. 18 5.2 HOURS OF OPERATION ....................................................................................................................... 20 5.3 METEOROLOGICAL CONDITIONS ........................................................................................................ 20
6.0 NOISE CRITERIA AND LIMITS ..................................................................................................... 20
6.1 EPP NOISE CRITERIA – EP (NOISE) POLICY 2008 ................................................................................ 20
7.0 ASSESSMENT OF NOISE IMPACT ................................................................................................ 22
7.1 POTENTIAL NOISE EMISSIONS FROM THE QUARRY ............................................................................. 23 7.1.1 Blasting ........................................................................................................................................... 23 7.1.2 Truck and front end loaders / Vehicle manoeuvring on-site .............................................................. 24 7.1.3 Crushing, screening – hard Rock ..................................................................................................... 25 7.1.4 Adopted noise levels ........................................................................................................................ 25
7.2 PEN3D2000 MODELLING FOR QUARRY ONLY .................................................................................... 27 7.3 PEN3D2000 MODELLING CUMULATIVE ASSESSMENT OF QUARRY WITH OTHER USES ON THIS SITE THAT
ARE NOT PART OF THIS APPLCIATION. ............................................................................................................ 28 7.4 PEN3D2000 MODELLING FOR TRUCKS ENTERING AND EXITING AT GREGORS CREEK RD ........................ 30
8.0 CONCLUSIONS ................................................................................................................................ 32
9.0 RECOMMENDATIONS ................................................................................................................... 33
10.0 REFERENCES ................................................................................................................................... 34
11.0 APPENDIX......................................................................................................................................... 35
11.1 APPENDIX A – SITE PLANS ............................................................................................................... 35 11.2 APPENDIX B – NOISE SAMPLING ....................................................................................................... 44 11.3 APPENDIX C – EXISTING SITE PHOTOS ................................................................................................ 45

December, 2015 Noise Impact Assessment
JT1582 – 310 Gregors Creek Road – NIA for Quarry 4
LIST OF FIGURES
Figure 1: Surrounding locality - source: Lockyer Design. 9
Figure 2: Land zoning under the Somerset Regional Council. 10 Figure 3: Aerial view of separation distances from proposed use to receptors - source:
Lockyer Designs. 11 Figure 4: Proposed development site of Extractive Industry - source: Lockyer Designs. 13 Figure 5: Existing dam for polishing stage and water treatment irrigation. 14
Figure 6: ML1 unattended ambient monitoring location 18
Figure 7: Noise monitoring graph. 19
LIST OF TABLES
Table 1: Measured Ambient Noise Levels ML1. 19
Table 2: Relevant EP (noise) P 2008 from ambient data 21 Table 3: receptor separation distances 22
Table 4: receptor separation distances 24 Table 5: Relevant noise levels from activities/equipment on-site 25
Table 6: PEN3D2000 modelling results (including blasting) 27
Table 7: PEN3D2000 modelling results (including blasting) 28 Table 8: PEN3D modelling results (excluding blasting) 29
Table 9: Relevant EP (noise) P 2008 criteria from ambient data 30 Table 10: Modelling results of trucks entering/exiting the site. 31
Terminology, Acronyms and Definitions
Ambient Noise Level: The composite of noise from all sources near and far. The normal
or existing level of environmental noise at a given location A-weighted sound level: A frequency weighting filter used to measure of sound pressure
level designed to reflect the acuity of the human ear, which does not respond equally to all frequencies.
dB(A): Unit of sound level: The weighted sound pressure level by the use of the A metering
characteristic and weighting specified in ANSI Specifications for Sound Level Meter.
deciBel (dB): A measure of sound. It is equal to 10 times the logarithm (base
10) of the ratio of a given sound pressure to a reference sound pressure. The reference sound pressure used is 20 micropascals, which is the lowest audible sound.
L10: The sound pressure level that is exceeded for 10% of the time for
which the given sound is measured, and takes account for all annoying peaks of noise.
L90: The A-weighted sound pressure level that is exceeded for 90% of
the time over which a given sound is measured. Leq: Equivalent sound pressure level: the steady sound level that over
a specified period of time would produce the same energy equivalence as the fluctuating sound level actually occurring.

December, 2015 Noise Impact Assessment
JT1582 – 310 Gregors Creek Road – NIA for Quarry 5
1.0 EXECUTIVE SUMMARY
1.1 SITE DETAILS
Address of Site : 310 Gregors Creek Road
Name of Owner/s : Edith Pastoral Company
1.2 APPLICATION DETAILS
Type of Application : MCU - Development Permit for Extractive Industry & Associated Uses (Quarry)
Applicant : Edith Pastoral Company
Contact Person: Tyson Dodd / Bradley Stewart
Our Reference : JT1582
This proposal serves to locate an extractive industry Quarry over land at 310 Gregors Creek Road.

December, 2015 Noise Impact Assessment
JT1582 – 310 Gregors Creek Road – NIA for Quarry 6
2.0 INTRODUCTION
The following noise impact assessment is for a Material Change of Use – Development Permit for Extractive Industry. The Development Permit for Extractive Industry seeks approval to commence an extractive industry use on the site for the extraction of hard rock material, with a threshold of 5,000 tonne to 100,000 tonne per year.
The subject site is located over land at 310 Gregors Creek Road, Gregors Creek.
JT Environmental under took on-site unattended noise sampling to determine the ambient acoustic environment for modelling and assessment purposes. The attached subject site plan has been considered appropriate for this report, however it is acknowledged that in the case of site layout amendments, this assessment report will be amended as appropriate and any modelling completed updated to reflect the proposal. On this basis, JT Environmental conducted modelling as per this layout. It is considered that a worse-case operational scenario be adopted for modelling purposes to provide a more appropriate avenue for this Noise Impact Assessment to consider the emissions on the Sensitive Receptors identified.
This report has been prepared to further support the location of the activity from an environmental noise perspective, together with ambient noise monitoring conducted at location ML1 (as detailed on the locality plans) and investigate the potential noiseimpacts associated with the proposed location of the extractive industry on the Gregors Creek Road site. Long Term sampling (7 days) at the ML1 location was chosen for a number of reasons:
1. This is a location on the site that is close to sensitive receptors on the oppositeside of the Brisbane River (albeit outside a 1000-m radius of the use). It islocated some 1074-m from the processing plant area for the quarry asdetailed on the site plan (LD- 1030 –SK05) prepared by Lockyer Designs.
2. This receptor demonstrates the clearest line of sight to the proposed use areawith negligible noise sources between the subject site and receptor;
3. Least intervening structures;4. Considered to be best practice in Accordance with AS1055.
The topographical characteristics of the site, location and the orientation of the site facilitate sufficient attenuation from existing sensitive receptors within the locality.
The objectives of this Noise Impact Assessment are to:
1. Establish noise level design goals (criteria) for the noise emissions associated with thenew proposed extractive industry on-site;
2. Assess the existing levels of noise emission in relation to the noise criteria for thenearest residences to the proposal;
3. Determine future levels of noise emission from the site for the operation of theproposed extractive industry, also included is a cumulative assessment for theoperation of both the extractive industry and a proposed concrete batching plant(not part of this application for a worst case scenario from operation of both uses;

December, 2015 Noise Impact Assessment
JT1582 – 310 Gregors Creek Road – NIA for Quarry 7
4. Assess noise levels from proposed operations in relation to the noise criteria for thenearest residences to the proposed site; and
5. Recommend noise mitigation measures to allow the relevant noise criteria to beachieved where required or where no compliance is expected to occur.
The purpose of the Noise Impact Assessment is to ensure that the proposed development does not impact negatively on the existing amenity for the locality. The Assessment will determine the level of noise impacts that currently occur within this locality and predict the future noise horizon associated with the site to determine if mitigation is required as part of this development application (expected to be minimal).
Furthermore, the report modelling has assessed additional details provided by the applicantregarding plant and equipment to be used, tools, quantities of vehicles and scale (graders,trucks, dozers).
The noise assessment has been prepared with reference to the following;
(i.) Australian Standard AS 1055:1997; (ii.) Description and Measurement of Environmental Noise Parts 1, 2 and 3, (iii.) AS2107; and (iv.) Environmental Protection (Noise) Policy 2008.
2.1 NOISE MITIGATION AND MANAGEMENT
Several mitigation methods have been identified within this report in order to minimise noise at the sensitive receptors. Mitigation in the form of engineering controls, planning controls, and basic on-site responsibilities will ensure that noise emitted from the site will be of an acceptable level in accordance with the Environmental Protection (Noise) Policy 20008.
Controls:
All blasting activities will be conducted in a controlled environment byprofessionally qualified personnel, and restricted to midday blasts ONLY;
All crushing and screening facilities are to be enclosed where possible or placedwhere direct line of site is not available to surrounding dwellings, or asubstantial separation between the proposed use and surrounding dwellings isachieved;
Posted speed limits of 20km/hour surrounding the processing and stockpile areas,
and 40km/hr for all other areas and haul roads;
Reversing of vehicles with beeper alarms is to be reduced through site design that
provides for circulation of vehicles in a forward direction wherever possible; and
The site is to operate over a 12-hour period only.

December, 2015 Noise Impact Assessment
JT1582 – 310 Gregors Creek Road – NIA for Quarry 8
3.0 SITE DESCRIPTION
3.1 SURROUNDING LAND USES
Local Government
Authority: Somerset Regional Council
Address of Site : 310 Gregors Creek Road, Gregors Creek
Name of Owner/s : Edith Pastoral Company
The subject site is located in the locality of Gregors creek, which falls with the local Government area of Esk. The site is well connected by the Brisbane Valley Highway which runs past the western boundary of the site from north to south, ultimately providing ease of access to local towns and larger cities. The area surrounding the site is used for primarily agricultural purposes, with a small number of residential sensitive receptors in the locality.
Two existing quarries are located to the north of the site, off Sinnamons Lane and to the north of Gregors Creek Road, an existing sand extraction operation is located on the Brisbane River to the north-west of the site adjacent to Gregors Creek Road, and an approved quarry is located to the north-west of the site on Gregors Creek Road. The Brisbane Valley Highway is located to the west of the site, and dense bushland within a State reserve adjoins the eastern boundary of the site as detailed in figure 1.
Based on these existing uses in the area, the reduced scale of the proposed use on the site, and the separation distances and attenuation opportunities that exist, the proposed site is considered to be suitable for the proposed use.

December, 2015 Noise Impact Assessment
JT1582 – 310 Gregors Creek Road – NIA for Quarry 9
Figure 1: Surrounding locality - source: Lockyer Design.

December, 2015 Noise Impact Assessment
JT1582 – 310 Gregors Creek Road – NIA for Quarry 10
3.2 EXISTING ENVIRONMENT
The site is currently used for agricultural purposes as shown in the site photos in appendix C, with a large area of vacant land and dense bushland to the east of the site. A number of dams exist on site and as proposed by the applicant, these will be utilised as part of the new use for the plant operations.
The site is located within the Somerset Regional Council, under the former Esk local government area, and is contained in the Rural zone.
Figure 2: Land zoning under the Somerset Regional Council.
Furthermore, the closest sensitive receptor to where monitoring has been conducted hasthe best line of sight to the subject site where the quarry plant is proposed to be located (figure 1). As detailed by the aerial survey and confirmed from a site inspection, the locality is significantly void of sensitive receptors within the 1km radius of the site, ultimately providing adequate separation distances to attenuate noise emissions at these receptors.
3.3 EXISTING ENVIRONMENT AERIALS, SEPERATION DISTANCES
Figure 3 provides an aerial view of the site and surrounding locality, incorporating the location of the identified sensitive receptor locations which have been included in the noise assessment from the proposed use, to determine the future predicted impacts at these locations. Receptor R4 is the existing house on the subject site, while all other receptors are located on the opposite side of the Brisbane River.

December, 2015 Noise Impact Assessment
JT1582 – 310 Gregors Creek Road – NIA for Quarry 11
Figure 3: Aerial view of separation distances from proposed use to receptors - source: Lockyer Designs.
R1
R2
R3
R4
R5

December, 2015 Noise Impact Assessment
JT1582 – 310 Gregors Creek Road – NIA for Quarry 12
3.4 PROPOSED DEVELOPMENT ENVIRONMENT
The following section outlines the proposed development environment to be located onsite 310 Gregors Creek Road with respect to the proposed quarry.
The proposed site plan is shown in figure 4 and Appendix A.
This noise impact assessment considers all activities to be carried out for operations with respect to vehicle manoeuvring on-site and along the haul road, blasting, crushing and screening, and plant and equipment to be located for operations. As mentioned these impacts will be assessed separately for each use and then cumulatively for a combined total assessment report of the application.
Edith Pastoral Company has a sound knowledge of the hard rock extraction industry, from the operation of quarries in the locality including the Rockwell quarry (18km west of Esk). This use was utilised for the purposes of specific noise point sampling as well.
The quarrying process will involve the following broad steps:
Clearing of topsoil and stripping (dozers, excavators, loaders and dump trucks) Excavation of rock materials using excavators, and loaded into dump trucks. Drilling and blasting – it is likely that no more than one blast per week will
be required to meet with production requirements, however blasting is onlyexpected to occur infrequently. In the case of more frequent blasts, themodelling results will demonstrate that production can occur without anynegative impacts on the locality;
Material from the blast will be loaded by excavators and front end loaders intodump trucks and transported to the screening plant.
The sound power level of acoustically significant plant and equipment has been provided below in Section 7.1, and obtained from the Rockwell Quarry and previous similar assessments.
Truck and Dogs coming to and from Gregors Creek Road to the Plant site - both fully Loaded and unloaded;
Dump trucks working in the pit with a 30 to 40 tonne capacity; 30 to 40 tonne excavators used to load dump trucks at the pit, with front end loaders
loading raw or processed material at the pit; A Grader to maintain Haul Roads; Water Truck for dust suppression; Processing Plant including Crushers (Jaw, Cone etc.); Conveyors and vibrating screens for processing of material; Water Pumps; All plant will be driven by electric motors.
Plant and Equipment used for the Quarry Operations

December, 2015 Noise Impact Assessment
JT1582 – 310 Gregors Creek Road – NIA for Quarry 13
Figure 4: Proposed development site of Extractive Industry - source: Lockyer Designs.

December, 2015
JT1582 – 310 Gregors Creek Road – NIA for Quarry 14
Extractive Industries must be located in an area where they will not pose a hazard to the environment or the amenity of the local community.
The design incorporates specific features to minimise noise and dust emissions including;
All buffer zones between the proposed uses on-site and the sensitive uses inthe locality are located no less than a separation distance 1.1km (figure 3above);
Haulage routes are to be designed and planned so as to not createunnecessary nuisance to surrounding residences;
The existing dams are to be utilised as water treatment, polishing and
irrigation purposes
The siting of the proposed development utilises the surrounding topography asa means of reducing line of sight to existing residential dwellings as shown infigure 4 below where the landform screens a large proportion of the use area;and
The proposed hard rock extraction area has been reduced significantly from theprevious proposal submitted for the site.
Figure 5: Existing dam to be adapted for polishing stage and water treatment irrigation.

December, 2015
JT1582 – 310 Gregors Creek Road – NIA for Quarry 15
3.6 QUANTIFYING THE NOISE IMPACT
The investigation’s purpose was to estimate the potential noise impact of the proposal on the existing ambient noise climate in the surrounding areas and on any potential sensitive receptors. This was achieved by measuring the existing ambient noise levels at the site and comparing with the predicted noise levels from future operations.
3.7 PEN3D2000 MODELLING SOFTWARE AND SUITABILITY
A digital terrain noise model of the site and surroundings has been developed using PEN3D. The PEN3D General Prediction Model (GPM) is based on the method documented by Bies & Hansen (1988 pages 117, 127). The implementation is a more complex variation of the approach to sound propagation described in Concawe. Concawe is one of the most commonly used methodologies to predict outdoor noise propagation from industrial sites. PEN also draws on aspects from ISO 9613-2. The PEN3D software was originally developed in 1993 and has been in constant development and review since. The basic equation adopted by the GPM is:
Lp = Lw - 20 log10(r) - 10log10(4π) + AE
Where Lp is the sound pressure level at an observer Lw is the sound power level of the source, in octave bands from 63 Hz to 8kHz 20 log10(r) + 10log10(4π) is the distance attenuation (spherical) AE is the excess attenuation factors.
The excess attenuation factors AE comprise:
AE = Aa + Ag + Am + Ab + Af
Where: Aa = Excess attenuation due to air absorption from Sunderland et. al. Ag = Excess attenuation due to ground reflection Am = Excess attenuation due to meteorological effects Ab = Excess attenuation due to barriers Af = Excess attenuation due to forests.
PEN is a sophisticated environmental noise model incorporating a 3D terrain model that permits accurate representation of the ground, ground cover, tree zones, mounds, barriers and weather conditions. PEN calculates a curved noise path based on surface friction, vertical temperature gradients and wind speed. All the noise calculations are based on this curved path. A finite differences approximation method is used to calculate the curved path. The curvature of the path determines the meteorology corrections. The meteorology corrections are frequency and distance dependent and are limited to +12 dB (downwind at

December, 2015
JT1582 – 310 Gregors Creek Road – NIA for Quarry 16
night) and –7 dB (upwind and during the day) similar to the Concawe Category 1 and Category 6 meteorological corrections.
The excess attenuation due to ground reflection is obtained by combining the direct wave and the reflected wave incoherently, that is the energy from the ground wave is added to the direct wave. The ground reflection attenuation (or ground effects) will be between 0 and -3dB (a negative value is an increase in noise levels) for all cases. This contrasts with the coherent reflection approach. The coherent approach is considered to be an “exact” method. For those situations where the source and receiver are located close to the same very hard reflecting plane and the path difference between the direct path and the reflected path is small, then the addition of the reflected wave and the direct wave will result in 6 dB increases rather than a 3 dB increase. However, at large distances the sound pressure level reduces at 12 dB per doubling with the coherent model (not 6 dB as per the incoherent model). This approach, while “exact”, is dubious as DTM models are neither of sufficient accuracy nor can noise models truly account for the effects of atmospheric turbulence.
Other methods such as the Nordic method or ISO 9613-2 divide the region between the source and receiver into three zones, and those zones closest to the source and to the receiver can potentially have higher absorption values. Consequently, if a noise source was measured say at a distance of 30 m and the sound power level is calculated by the commonly adopted formula PWL = SPL + 10log10(2 π r2) then the calculations using the PEN3D methodology would remain conservatively high for all distances.
The ground reflection (or ground effects) is a complex calculation using the flow resistivity for the surface likely to provide the ground reflection and the likely angle of incidence of the reflected wave to the ground. In those instances where the ground is highly absorptive the excess correction will approach zero. For those surfaces which are highly reflective the correction will be - 3dB, i.e. will lead to an increase in noise levels of 3dB(A) (simulates hemispherical propagation).
While there are numerous methods to calculate ground effect (some of which providing significant attenuation (reduction of noise levels)), the PEN implementation is one of the more conservative estimates of ground effect in the far field. In the opinion of Bies & Hansen 1988, “as the distance from the source or frequency increases, the incoherent model will become more appropriate”.
The theoretical approach to meteorology implies that PEN is likely to provide more significant corrections than other models. Thus, at night or during downwind predictions, the PEN calculations are likely to result in conservatively high results. The likely barrier attenuations are calculated for four possible curved paths, namely:
source, to the top of barrier then to the receiver;
source, reflection from ground (source side), top of barrier, receiver;

December, 2015
JT1582 – 310 Gregors Creek Road – NIA for Quarry 17
source, top of barrier, reflection from ground (receiver side), receiver, and;
source, reflection from ground (source side), top of barrier, reflection from ground(receiver side), receiver.
These are combined to obtain effective barrier attenuation. In the situation where the source and receiver are well above the ground and the barrier just intercepts line-of-sight then the barrier effect will be 5 dB(A). However, if the source and receiver are close to the ground and the noise barrier just intercepts line of sight (a pebble) the barrier effect will tend to zero.
Once the most likely curved path has been calculated, the method determines if it intercepts any tree zones within the digital terrain model. If the curved noise path travels in the lower 75% of the tree zone then the full excess attenuation is applied for the distance travelled in the tree zone. If the curved noise path travels in the upper 25% of the tree zone then:
Potentially tree zones can provide extremely high attenuations if the coverage of tree zones are large. However, in practice, the curved path adopted in the PEN methodology usually results in the noise rays passing above the tree zones (at night or during downwind conditions) and only intercepting tree zones if they exist on the tops of hills or whenever the noise ray approaches the ground. Tree zones can potentially provide higher than expected attenuations during calm neutral conditions.
4.0 EQUIPMENT AND PROCEDURES
4.1 INSTRUMENTATION
The following instruments were used to measure environmental noise impact levels.
Norsonic 131 (Type 1) Noise Logger; and
Rion NC 73 Calibrator.
The operation of the sound level measuring equipment was field calibrated to the reference signal and checked at the end of each measurement session to ensure it was within 0.5dB of the reference signal. All instrumentation used in this assessment hold a current calibration certificate from a certified NATA calibration laboratory. Calibration Certificate for the 131 Type 1 is provided in the Appendix to this report. The Microphone of the SLM was at 1.5m above natural ground level and fitted with a Norsonic wind screen.

December, 2015
JT1582 – 310 Gregors Creek Road – NIA for Quarry 18
4.2 MEASUREMENT PROCEDURE
Ambient noise was measured at the site from 18th to the 24th November 2015 (ambient) at ML1 indicated in Figure 6. The resultant noise levels are provided in Table 1 and graphical representation in the Appendix of this report. The weather conditions during the survey were noted as fine with a temperature of approximately 16-28oC and a negligible wind speed. The location was chosen as it best represents the acoustic environment for the existing locality. The noise logger was required to be elevated in a tree (1.5m) to avoid wildlife interfering with the equipment during monitoring.
Figure 6: ML1 unattended ambient monitoring location
5.0 MEASURED NOISE LEVELS
5.1 MEASURED EXISTING ACOUSTIC ENVIRONEMNT
Existing free-field noise exposure levels were determined and the typical noise levels measured at ML1 in order to characterise the existing acoustic environment at the surrounding sensitive receptors.
Summaries of these results are shown in Table 1.
The objective of the background noise survey was to measure ambient noise levels at a location representative of the nearest potentially affected residences during the day, evening and night-time periods to enable the determination of the noise criteria for the proposed quarry and associated plant and equipment.
These ambient background samples have been collected in accordance with the requirements of EP (Noise) Policy 2008, the Ecoaccess Guideline: Planning for Noise Control

December, 2015
JT1582 – 310 Gregors Creek Road – NIA for Quarry 19
and the principles of AS1055.3-1997 for the external monitoring at the nearest noise affected premise to the south of the site.
Table 1: Measured Ambient Noise Levels ML1.
Parameter Period Recorded Noise
Levels
LMAX Daytime (7am-6pm) 64.2
Evening (6pm-10pm) 62.1
Night-time (10pm-7am) 51.9
L10 Daytime (7am-6pm) 47.6
Evening (6pm-10pm) 48.4
18 Hour 47.6
Night-time (10pm-7am) 43.6
L90 Daytime (7am-6pm) 35.0
Evening (6pm-10pm) 40.7
Night-time (10pm-7am) 38.9
Leq Daytime (7am-6pm) 45.8
Evening (6pm-10pm) 46.8
Night-time (10pm-7am) 42.6
Figure 7: Noise monitoring graph.

December, 2015
JT1582 – 310 Gregors Creek Road – NIA for Quarry 20
5.2 HOURS OF OPERATION
The proposed quarry will be operational over 12hrs of the day, however, for modelling purposes and to provide a conservative modelling approach, modelling has been completed for the day-time, evening and night-time periods and assessed against the relevant criteria. This further demonstrates that even with 24-hr operations, the proposed development is compliant with the EP (Noise) Policy 2008.
5.3 METEOROLOGICAL CONDITIONS
During wind and temperature conditions, project noise levels at the receptors may increase or decrease compared to noise levels during calm conditions. The change occurs due to refraction as a result of varying speed of sound with increasing elevation. Noise levels increase when the wind is blowing from source to receiver. Conversely, the noise level can decrease when the wind is blowing from receiver to the source.
6.0 NOISE CRITERIA AND LIMITS
6.1 EPP NOISE CRITERIA – EP (NOISE) POLICY 2008
In accordance with the agreed assessment methodology, the relevant noise criteria for assessment of impacts at sensitive receptors have been determined based upon the Environmental Protection (Noise) Policy 2008 ‘controlling background creep’
As detailed in the EP (Noise), the objectives of a Noise impact Assessment is to determine and more so ensure that the Indicative Noise factors are achieved for the particular land use categories (in this case residential) from a proposed noise emitting operation on existing or future noise affected premises.
Controlling background creep:
(1) This section states the management intent for an activity involving noise.(2) Note—
See section 51 of the Environmental Protection Regulation 2008.
(2) To the extent that it is reasonable to do so, noise from an activity must not be—
(b) for noise that varies over time measured by LAeq,adj,T - more than 5dB(A) greaterthan the existing acoustic environment measured by LA90,T.
*EP(noise)P 2008

December, 2015
JT1582 – 310 Gregors Creek Road – NIA for Quarry 21
Table 2: Relevant EP (noise) P 2008 from ambient data
Period
Adopted Sensitive Receiver Noise limit LAeq,adj,T
dB(A)
Derived from ambient data at ML1 location
7am to 6pm 50.8dB(A)
6pm to 10pm 51.8dB(A)
10pm to 7am 47.6dB(A)
As discussed in section 5.3, while operation hours have not been confirmed and as such to provide a potentially worst case scenario for the proposed site to demonstrate compliance, night-time criteria has been applied to the development and derived from the Ecoaccess Guidelines: Planning for Noise Control provides the relevant criteria for night-time assessment:
As a rule in planning for short-term or transient noise events, for good sleep over eight hours, the indoor sound pressure level measured as a maximum instantaneous value should not exceed approximately 45dBA maxLpA more than 10-15 times per night. The corresponding external noise level, assuming partially closed windows, is 52dBA maxLpA, measured in the free field.
Therefore the night-time criteria to be adopted is LAmax 52dB(A) external to residential dwellings.
Appropriate noise assessment should consider the following:
Emissions of any contaminants including air pollutants, noise, and vibration do notcause environmental harm or nuisance.
The design of the proposal minimises noise impacts on surrounding uses.
Noise emission and vibrations from the site must not cause an environmentalnuisance to sensitive receptors.
The building design and layout locates potential noise sources away from sensitivesurrounding uses.
Major openings in buildings and all areas where work maybe conducted outside thebuildings are located away from the nearest sensitive receiving environment. Noiseemission and vibrations from the site must not cause an environmental nuisance.
Where the site has a common boundary with a noise affected premise:
No openings occur in walls facing a common boundary or sensitive land uses;
Effective acoustic screening is provided; and
Noise emitting services are located as far away as possible.

December, 2015
JT1582 – 310 Gregors Creek Road – NIA for Quarry 22
7.0 ASSESSMENT OF NOISE IMPACT
As detailed in the attached aerial photograph drawings the closest noise affected premise to the proposed quarry is located on the subject site to the north of the processing area at approximately 1130-metres. The next closest receptor is located at 1280-metres; this noise affected premise consists of one single detached dwelling which will not have a direct line of sight due to intervening ridges and vegetation. The next closest receptor is just a further 233-meters north of the first dwelling with a separation distance of approximately 1360-meters. A third dwelling is located a further 400-meters north with a separation distance of 1628-metres to the site. It is expected that due to reduced line of sight with intervening structures and separation distances, noise impacts on these receptors will be in-audible. This will be justified by the modelling.
The calculated reductions have been based on no reduction corrections applied for ground absorption and reduction of line of sight to a noise affected premise. Furthermore, JT Environmental has completed the acoustic modelling based on example noise levels from previous studies, operators, and applicants details. This general operational capacity has been utilised to determine the impacts on the closest noise affected premise of which demonstrates compliance with the EP (Noise) Policy 2008.
The design elements of the Site layout facilitate efficient truck movements on-site to reduce possible impacts on the sensitive receiving environments. All truck and vehicle movements on-site are expected to be in the forward gear as facilitated by the general design and layout of operational plants. The location of the Viper and Crusher at the southern edge of the site demonstrate significant compliance.
The overall approach of this noise impact assessment is to minimise noise nuisance from operations to sensitive receivers in the locality. And therefore all on-site activities and equipment proposed has been assessed below.
Table 3: receptor separation distances
Receptor 1 1280km
Receptor 2 1360km
Receptor 3 1628km
Receptor 4 1130km
Receptor 5 2223km

December, 2015
JT1582 – 310 Gregors Creek Road – NIA for Quarry 23
7.1 POTENTIAL NOISE EMISSIONS FROM THE QUARRY
This section briefly describes the activities on-site.
Acoustically significant plant and equipment to be used on-site for and the associated sound power levels are provided below and derived from previous assessments of similar quarries in South East Queensland completed by this consultancy and from on-site monitoring at the applicants’ Rockwell Quarry. The noise levels of the below activities on-site have been incorporated into the overall model scenario to predict the worst case noise levels that will be experienced at the receptor locations. An accumulative assessment of both the quarry and the concrete batching plant (not part of this application) has also been included to demonstrate compliance while both projects are in use.
The following activities and noise levels have been derived from quarries of a similar scale and represent the type of activities and equipment to be used for operations:
7.1.1 BLASTING
As the Rockwell Quarry does not conduct blasting activities onsite, noise levels for typical blasting of hard rock materials was reviewed and adopted for the purpose of this assessment. The scale and intensity of the blasting for the assessments reviewed was greater than the proposal at Gregors creek, however this will allow for a worst case scenario to be adopted demonstrating that compliance with the relevant criteria can be readily achieved. The range of noise levels from blasting from reviewing the below documents was 90dB(A) to 148dB(A), for the distance attenuation calculations and the PEN3D2000 modelling, the upper level of 148dB(A) was adopted for the input parameters.
The following environmental assessments and documents were referenced for this report:
Environmental Impact Statement, Prepared by Readymix Holdings Pty Ltd –Proposed Lynwood Quarry, Marulan (May 2005).
Noise and Blast management Plan – Prepared by Boral Resource, ProposedPeppertree Quarry (2nd August 2012);
Occupational Health and Safety Regulation, Guidelines Part 21 – Blasting operations;
It is to note that the noise limit for sensitive uses from blasting operations is 115dB(A) as detailed in table 4 below.
Explosives are used in quarrying to dislodge rock to enable the extraction of the required resource. This is done by drilling holes in an engineered pattern via angle, depth and spacing. The holes are filled with explosive charges and carried out by experienced and professionally trained staff personal.

December, 2015
JT1582 – 310 Gregors Creek Road – NIA for Quarry 24
Blasting Criteria:
The level of air-borne vibration (known as overpressure) and ground vibration has been predicted using the worst case noise levels that would be experienced at each receiver for the life of the development. The blasting designed for the proposal is to achieve the relevant criteria from the EP Act regulations and limits, Australian Standards – AS2187.2-2006 and the Queensland Ecoaccess Noise and vibration from blasting Guideline 2006.
The levels to be achieved are presented in table 4 below.
Table 4: receptor separation distances
Air- blast
overpressure level
Allowable Exceedance
115 5% of the total number of blasts over a
period of 12 months
120 0%
Blasting Control: All blasts are to be designed to reduce line of sight the sensitive uses in the area, and conducted by qualified and trained personal at all times.
Monitoring of Meteorological Conditions: Routine monitoring of meteorological conditions is to be conducted and evaluated prior to blasting, and as close to time of blasting as possible. The predicted weather conditions and possible effect on the generation of airborne dust and sound travel is to be considered and times altered where appropriate. The following conditions should be evaluated:
Prevailing wind direction and speed;
Time of day;
Seasonal weather patterns; and
Cloud cover.
All blasts are to occur during the nominated operation hours as stipulated in section 5.2 of this assessment report.
7.1.2 TRUCK AND FRONT END LOADERS / VEHICLE MANOEUVRING ON-SITE
Trucks and loaders will be used to load rock material from the quarry pit and to transport it from the quarry to the processing area (and proposed adjacent concrete batching facility). Sound levels for these vehicles have been derived from on-site monitoring at the applicants’ Rockwell Quarry where machinery and loaders were in use at time of attended monitoring.

December, 2015
JT1582 – 310 Gregors Creek Road – NIA for Quarry 25
7.1.3 CRUSHING, SCREENING – HARD ROCK
The sound power levels adopted for the crushing and screening assessment were obtained from a previous report completed by this consultancy. These levels were then compared to the existing quarry levels at the Rockwell Quarry from on-site attended monitoring. The Rockwell quarry is owned and operated by the proponent. This existing crushing and screening plant at that quarry is of a similar scale to that being proposed at 310 Gregors Creek Road, however, as indicated, this quarry extracts primarily sandstone materials, which is a softer material than the proposed hard rock. To further validate the adopted crushing/screening levels, the following assessment for a hard rock extraction quarry was reviewed;
Environmental Noise, Ground and air blast overpressure impact assessment,Gundagai Quarry – prepared by Vipac Engineers & Scientists Ltd (May 2010).
Both the PEN3D2000 model and the basic attenuation calculations have been conducted for all operations on-site to demonstrate that the proposed development can exist with minimal noise nuisance. The following equations have been completed with the use of separation distances as detailed in section 7.1 above. It is important to note that these calculations provide a basic loss of noise over distance ONLY and do not cater for the intervening topography between source and receiver.
Note: only the closest receptor has been modelled with separation attenuation as a demonstration of compliance.
7.1.4 ADOPTED NOISE LEVELS
Table 5: Relevant noise levels from activities/equipment on-site
SOURCE LMAX
Processing/crushing unit 113dB(A)
Hard rock extraction area
(machinery) 112dB(A)
Hard rock extraction area
(Blasting) 90-148dB(A)
Vehicle manoeuvring 105dB(A)
Noise is generally one of the main concerns to be addressed in planning documentation for a new proposed quarry.
The main type of noise sources to be generated from the quarry operations have been provided by the applicant and confirmed by this consultancy upon review from site

December, 2015
JT1582 – 310 Gregors Creek Road – NIA for Quarry 26
inspections of surrounding quarries in the area, including the Rockwell Quarries site. The noise sources have been modelled with attenuation over distance calculations and the PEN3D2000 later in the report.
It is important to note that following calculations do not account for any intervening topography between the site and the sensitive uses, only loss of noise over a particular distance to demonstrate the loss of noise from the existing separation distance.
On-site attended monitoring on the 18th of November 2015 at Rockwell Quarries identified that while the processing and crushing plant is in full operation the LMAX noise level was 94.4dB(A) over a 15 minute monitoring period. The only other additional noise source identified on the site was vehicles movements.
(Note: The below Noise data was obtained from on-site attended monitoring at the Rockwell Quarry)
Processing / crushing unit Receptor 4: Source noise level (Lp1): 113dB (A) at 15-metres Distance separation to Receptor 1 facade = 1130-metres (r2) Resultant noise levels at receptor 1 facade (Lp2): 57.36-dB (A) at receptor 1 Attenuation from ridge line and soft ground cover: (-5dB) = 52.36-dB(A) at receptor 4 From Lp2 = Lpi – 20 log (r2/r1)
Hard Rock Extraction Area (machinery) Receptor 4: Source noise level (Lp1): 112dB (A) at 3-metres Distance separation to Receptor 1 facade = 1130-metres (r2) Resultant noise levels at receptor 1 facade (Lp2): 60.48-dB (A) at receptor 1 Attenuation from ridge line and soft ground cover: (-5dB) = 55.48-dB(A) at receptor 4 From Lp2 = Lpi – 20 log (r2/r1)
Hard Rock Extraction Area (blasting) Receptor 4: Source noise level (Lp1): 148dB (A) at 3-metres Distance separation to Receptor 1 facade = 1130-metres (r2) Resultant noise levels at receptor 1 facade (Lp2): 96.48-dB (A) at receptor 1 Attenuation from ridge line and soft ground cover: (-5dB) = 91.48-dB(A) at receptor 4 From Lp2 = Lpi – 20 log (r2/r1)
Vehicle haulage Receptor 4: Source noise level (Lp1): 105dB (A) at 3-metres Distance separation to Receptor 1 facade = 1130-metres (r2) Resultant noise levels at receptor 1 facade (Lp2): 53.48-dB (A) at receptor 1

December, 2015
JT1582 – 310 Gregors Creek Road – NIA for Quarry 27
Attenuation from ridge line and soft ground cover: (-5dB) = 48.48-dB(A) at receptor 4 From Lp2 = Lpi – 20 log (r2/r1)
7.2 PEN3D2000 MODELLING FOR QUARRY ONLY
The following PEN3D modelling results include an accumulative assessment with the quarry operation and concrete batch ing plant in operation to provide the worst case development scenario with both applications. The quarry has also been modelled individually to demonstrate compliance for this proposal with regards to noise levels in accordance with the Environmental Protection (Noise) Policy 2008.
POINT CALCULATIONS Inclusive of blasting
Pen3D2000 V 1.10.0 Project Code:JB....
Project Description:Noise assessment of ... File:C:\PEN\Tests\Gregors Creek - CBP\CBP & Quarry cumulativel.PEN
File Description:Data file covering area
File Description:Data file covering area File Description:Data file covering area
Tuesday 01 Dec, 2015 at 14:35:28
Environmental Calculations
All point and line sources included. Line source segmentation angle: 10 degrees. Calculations for specified meteorology.
Noise level results are the logarithmic addition of all the noise sources Noise level results incorporate the incoherent ground reflection algorithm
Meteorology :
Wind speed 0.0 (m/s) Wind direction 0 Mast height 10.0 (m) Temperature 20.0 (C) Temperature Gradient 0.0 (C/100m) Humidity 50.0 (%)
Surface Roughness of terrain 0.023000000 (m) Zero plane offset 0.080000000 (m)
Table 6: PEN3D2000 modelling results (including blasting)
RECEPTOR X POSN Y POSN HEIGHT GROUND NOISE
LEVEL
(M) (M) (M) (M) (DB(A))
R1 438542.3 7011597.7 1.5 90.0 41.8
R2 438935.9 7011305.0 1.5 89.6 48.0

December, 2015
JT1582 – 310 Gregors Creek Road – NIA for Quarry 28
R3 439107.1 7011116.2 1.5 95.0 48.0
R4 439670.3 7012515.9 1.5 110.0 62.8
R5 438238.8 7012610.0 1.5 88.1 54.8
7.3 PEN3D2000 MODELLING CUMULATIVE ASSESSMENT OF QUARRY WITH OTHER USES ON THIS SITE THAT ARE NOT PART OF THIS APPLCIATION.
POINT CALCULATIONS Including blasting operations
Pen3D2000 V 1.10.0 Project Code:JB....
Project Description:Noise assessment of ... File:C:\PEN\Tests\Gregors Creek - CBP\CBP & Quarry cumulativel.PEN
File Description:Data file covering area
File Description:Data file covering area File Description:Data file covering area
Tuesday 01 Dec, 2015 at 14:21:05
Environmental Calculations All point and line sources included. Line source segmentation angle: 10 degrees. Calculations for specified meteorology.
Noise level results are the logarithmic addition of all the noise sources Noise level results incorporate the incoherent ground reflection algorithm
Meteorology :
Wind speed 0.0 (m/s) Wind direction 0 Mast height 10.0 (m) Temperature 20.0 (C) Temperature Gradient 0.0 (C/100m) Humidity 50.0 (%)
Surface Roughness of terrain 0.023000000 (m) Zero plane offset 0.080000000 (m)
Table 7: PEN3D2000 modelling results (including blasting)
RECEPTOR X POSN Y POSN HEIGHT GROUND NOISE LEVEL
(M) (M) (M) (M) (DB(A))
R1 438542.3 7011597.7 1.5 90.0 41.8
R2 438935.9 7011305.0 1.5 89.6 48.0
R3 439107.1 7011116.2 1.5 95.0 48.0
R4 439670.3 7012515.9 1.5 110.0 62.8
R5 438238.8 7012610.0 1.5 88.1 54.8

December, 2015
JT1582 – 310 Gregors Creek Road – NIA for Quarry 29
POINT CALCULATIONS Excluding blasting operations
Pen3D2000 V 1.10.0 Project Code:JB....
Project Description:Noise assessment of ... File:C:\PEN\Tests\Gregors Creek - CBP\CBP & Quarry cumulativel.PEN
File Description:Data file covering area File Description:Data file covering area File Description:Data file covering area
Tuesday 01 Dec, 2015 at 14:27:57
Environmental Calculations
All point and line sources included. Line source segmentation angle: 10 degrees. Calculations for specified meteorology. Noise level results are the logarithmic addition of all the noise sources
Noise level results incorporate the incoherent ground reflection algorithm Meteorology :
Wind speed 0.0 (m/s) Wind direction 0 Mast height 10.0 (m)
Temperature 20.0 (C) Temperature Gradient 0.0 (C/100m) Humidity 50.0 (%) Surface Roughness of terrain 0.023000000 (m) Zero plane offset 0.080000000 (m)
Table 8: PEN3D modelling results (excluding blasting)
RECEPTOR X POSN Y POSN HEIGHT GROUND NOISE LEVEL
(M) (M) (M) (M) (M) (DB(A))
R1 438542.3 7011597.7 1.5 90.0 41.7
R2 438935.9 7011305.0 1.5 89.6 37.6
R3 439107.1 7011116.2 1.5 95.0 36.4
R4 439670.3 7012515.9 1.5 110.0 57.3
R5 438238.8 7012610.0 1.5 88.1 47.4
The above PEN3D modelling demonstrates the proposed extractive industry (quarry) can be reasonably conducted on-site while having no perceived audibility at the identified sensitive receivers identified above. Furthermore, the accumulative assessment of both the Quarry and the concrete batching plant also demonstrate compliance with all relevant criteria derived from the EP (Noise) Policy 2008.
December, 2015
JT1582 – 310 Gregors Creek Road – NIA for Quarry 30
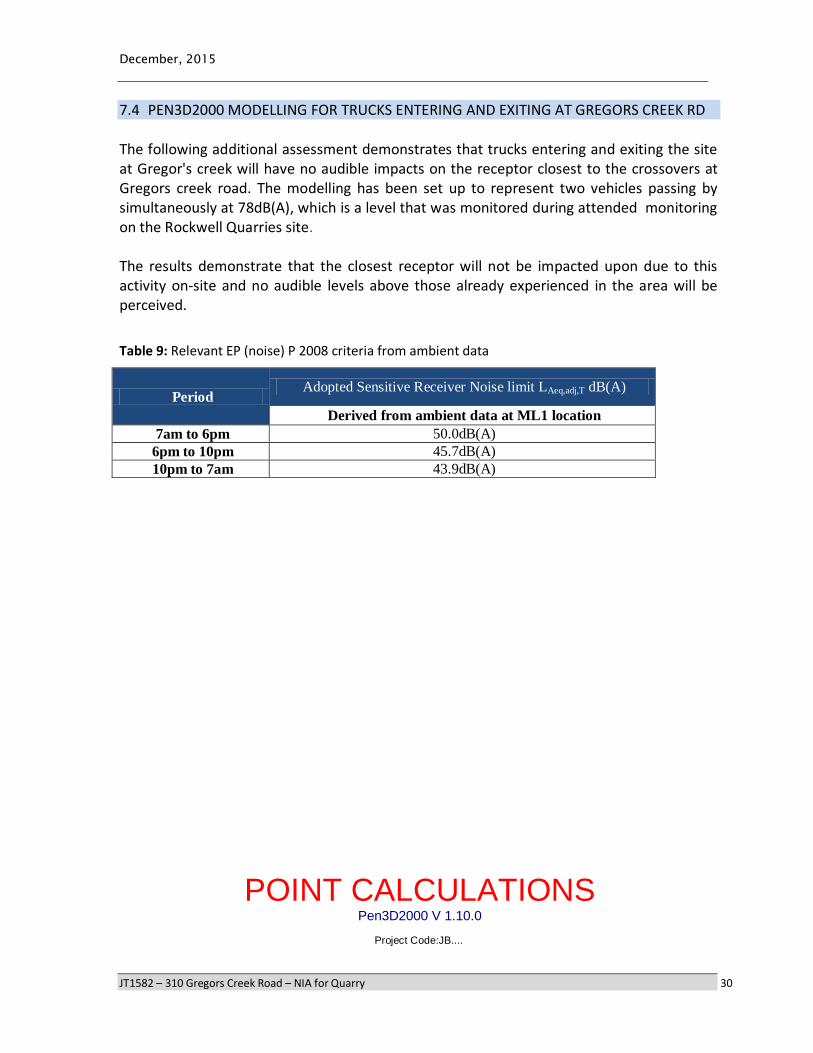
7.4 PEN3D2000 MODELLING FOR TRUCKS ENTERING AND EXITING AT GREGORS CREEK RD
The following additional assessment demonstrates that trucks entering and exiting the site at Gregor's creek will have no audible impacts on the receptor closest to the crossovers at Gregors creek road. The modelling has been set up to represent two vehicles passing by simultaneously at 78dB(A), which is a level that was monitored during attended monitoring on the Rockwell Quarries site.
The results demonstrate that the closest receptor will not be impacted upon due to this activity on-site and no audible levels above those already experienced in the area will be perceived.
Table 9: Relevant EP (noise) P 2008 criteria from ambient data
Period Adopted Sensitive Receiver Noise limit LAeq,adj,T dB(A)
Derived from ambient data at ML1 location
7am to 6pm 50.0dB(A)
6pm to 10pm 45.7dB(A)
10pm to 7am 43.9dB(A)
POINT CALCULATIONS Pen3D2000 V 1.10.0
Project Code:JB....

December, 2015
JT1582 – 310 Gregors Creek Road – NIA for Quarry 31
Project Description:Noise assessment of ...
File:C:\PEN\Tests\Gregors Creek - CBP\concrete batching model.PEN File Description:Data file covering area File Description:Data file covering area
Thursday 17 Dec, 2015 at 17:15:33
Environmental Calculations All point and line sources included. Line source segmentation angle: 10 degrees. Calculations for specified meteorology.
Noise level results are the logarithmic addition of all the noise sources
Noise level results incorporate the incoherent ground reflection algorithm Meteorology :
Wind speed 0.0 (m/s) Wind direction 0 Mast height 10.0 (m)
Temperature 20.0 (C) Temperature Gradient 0.0 (C/100m) Humidity 50.0 (%) Surface Roughness of terrain 0.027000000 (m) Zero plane offset 0.300000000 (m)
Truck pass by monitored by this consultancy to be 78dB(A) – representative of two trucks
Table 10: Modelling results of trucks entering/exiting the site.
RECEPTOR X POSN Y POSN HEIGHT GROUND NOISE
LEVEL
(M) (M) (M) (M) (M) (DB(A))
TRUCKS
ENTERING/EXITING 439578.8 7012777.9 95.0 95.0 41

December, 2015
JT1582 – 310 Gregors Creek Road – NIA for Quarry 32
8.0 CONCLUSIONS
For the proposed establishment of the extractive industry for a quarry, an assessment of the locality and surrounding uses has been conducted. As detailed in the modelling results for the operation, the significant separation distance for nearest sensitive receptors (which are located outside of a 1km radius) demonstrate that the resultant noise impact level from all activities at the quarry will be below the background noise levels measured at the closest noise affected premise at ML1 for both day and night-time background levels. The maximum possible impact level at the noise affected premise R4 is 45.9 dB(A).
Furthermore modelling scenarios have demonstrated that no audible change occurs at the receivers with the extractive industry located on-site. As detailed in the Environmental Protection Policy (Noise) 2007:
Part 4—General noise control provisions 17—Application of Part Except as otherwise specified, this Part does not apply to noise to which the provisions of Part 6, or guidelines under Part 7, apply.
18—Compliance with noise goals satisfies general environmental duty
(1) The general environmental duty under section 25 of the Act is satisfied in relation tonoise from a noise source, insofar as the noise affects particular noise-affected premises, ifthe noise complies with the noise goals.(2) The noise complies with the noise goals if measurements taken in relation to the noisesource and the noise-affected premises show that—
(a) the source noise level (continuous) does not exceed the background noise level plus 5dB(A); or COMPLIES(b) the source noise level (continuous) does not exceed the indicative noise level for the noisesource. COMPLEIS
This assessment report and modelling (PEN3D2000 and the distance attenuation results) concludes that the proposal can be established on-site in accordance with the above requirements of the noise criteria from the EP (Noise) Policy 2008. Furthermore, the assessment for vehicle haulage on-site demonstrates that the maximum predicted noise level for two vehicles in passing by simultaneously is 41.0dB(A) at the closest receptor to the entry/exit location for site access.
Ambient/background noise logging occurred at ML1 as detailed in the report.

December, 2015
JT1582 – 310 Gregors Creek Road – NIA for Quarry 33
9.0 RECOMMENDATIONS
As demonstrated above the location of the extractive industry in the layout provided by the applicant can be conducted on this site with minimal annoyance to the nearest noise affected premise within the locality. The locality to the north already has significantly noise operations by way of existing quarries (figure 1).
However based on the experience of this consultancy the following recommendations for the operation of this facility are made.
Performance monitoring during operation of the plant is to be conducted oncecommissioning has occurred to ensure compliance with the indicated amenitylevels detailed in this report;
Proposed 20km/hour speed limit surrounding the processing and stockpile areas,and 40km/hour for all other areas and haul roads;
All blasting operations as detailed by the applicant are to be during midday timeperiods only; and
Trucks reversing triggering the reverse beeper are to be minimized where possible– it is noted that the design accommodates forward motion of vehiclemanoeuvring through the site wherever possible.
It is concluded, based on site inspections and noise level predictions from an environmental noise perspective that this plant can be established with negligible noise impacts on sensitive receptors within the surrounding area based on the above-mentioned recommendation.

December, 2015
JT1582 – 310 Gregors Creek Road – NIA for Quarry 34
10.0 REFERENCES
Australian Standard (AS 2107:2000). Acoustics—Recommended design sound levels and reverberation times for building interiors.
Australian Standard 1055 (1997). Acoustics—Description and measurement of environmental noise Part 1: General procedures.
Australian Standard AS3671 (1989). Acoustics—Road traffic noise intrusion—Building siting and construction.
Environmental Impact Statement, Prepared by Readymix Holdings Pty Ltd – Proposed Lynwood Quarry, Marulan (May 2005).
Environmental Protection Act 1994
Environmental Protection Regulation 2008
Noise and Blast management Plan – Prepared by Boral Resource, Proposed Peppertree Quarry (2nd August 2012);
Occupational Health and Safety Regulation, Guidelines Part 21 – Blasting operations;
The Protection of the Environment Operations Act 1997 (POEO Act) and the Protection of the Environment Operations (Noise Control) Regulation 2008 (Noise Control Regulation).

December, 2015
JT1582 – 310 Gregors Creek Road – NIA for Quarry 35
11.0 APPENDIX
11.1 APPENDIX A – SITE PLANS

December, 2015
JT1582 – 310 Gregors Creek Road – NIA for Quarry 36

December, 2015
JT1582 – 310 Gregors Creek Road – NIA for Quarry 37

December, 2015
JT1582 – 310 Gregors Creek Road – NIA for Quarry 38

December, 2015
JT1582 – 310 Gregors Creek Road – NIA for Quarry 39

December, 2015
JT1582 – 310 Gregors Creek Road – NIA for Quarry 40

December, 2015
JT1582 – 310 Gregors Creek Road – NIA for Quarry 41

December, 2015
JT1582 – 310 Gregors Creek Road – NIA for Quarry 42


December, 2015
JT1582 – 310 Gregors Creek Road – NIA for Quarry 44
11.2 APPENDIX B – NOISE SAMPLING

December, 2015
JT1582 – 310 Gregors Creek Road – NIA for Quarry 45
11.3 APPENDIX C – EXISTING SITE PHOTOS

December, 2015
JT1582 – 310 Gregors Creek Road – NIA for Quarry 46
Site photos of proposed plant site.

December, 2015
JT1582 – 310 Gregors Creek Road – NIA for Quarry 47
Site photos of existing Rockwell Quarries in Harlin – similar to that being proposed on-site at Gregors Creek Road.

December, 2015
JT1582 – 310 Gregors Creek Road – NIA for Quarry 48
Location of noise logger on-site the 310 Gregors Drive

December, 2015
JT1582 – 310 Gregors Creek Road – NIA for Quarry 49
THIS PAGE HAS BEEN LEFT INTENTIONALLY.