material characterisation for analyses of titanium sheet ... · 1 material characterisation for...
TRANSCRIPT

LICENTIATE T H E S I S
Luleå University of TechnologyDepartment of Applied Physics and Mechanical Engineering
Division of Solid Mechanics
2005:63|: 02-757|: -c -- 05⁄63 --
2005:63
Material Characterisation for Analysesof Titanium Sheet Metal Forming
Eva-Lis Odenberger


1
Material Characterisation for Analyses of Titanium Sheet Metal Forming
Eva-Lis Odenberger
Division of Solid Mechanics Department of Applied Physics and Mechanical Engineering
Luleå University of Technology SE-971 87 Luleå, Sweden
Licentiate thesis

2

3
PREFACE
This work has been carried out at the Division of Solid Mechanics, Department of Applied Physics and Mechanical Engineering at Luleå University of Technology in Sweden. The research founding by VINNOVA (Swedish Agency for Innovation Systems), grant P22122-1A is gratefully acknowledged.
Firstly, I would like to thank my supervisor, Professor Mats Oldenburg and my former assistant supervisor Dr. Bengt Wikman for their great support and guidance during this work. Thank you my colleagues and friends of Research trainee 2002 and at the division of Solid Mechanics, making the University an interesting and pleasant place to be at.
My co-writer in the appended articles, Dr. Robert Pederson, former at the Division of Engineering Materials, deserves very special thanks.
Research assistant Mr. Jan Granström for his help during the performance of the sheet metal forming tests presented in Paper B and the collaboration with Professor Pentti Karjalainen and Dr. Mahesh Somani at University of Oulu in Finland performing the Gleeble tests presented in Paper A and B, are gratefully acknowledged.
I am also thankful to Henrik Runnemalm and co-workers at Volvo Aero Corporation in Trollhättan for their contribution to my work and for the fruitful discussions we have had.
Finally, I would like to express my deepest and dearest gratitude to my beloved family, my husband Torbjörn and my wonderful daughter Alva, for always being there. I couldn’t make this happen without you.
Eva-Lis Odenberger Luleå, November 2005

4

5
ABSTRACT
New demands and opportunities for simulation driven product development, that today's finite element (FE) technology allow for, exists in modern industry. Full applicability, in which decisions based on numerical evaluations and predictions, require accurate material parameters and of course accurate modelling of remaining features. To describe the deformation of a certain material a variety of material models
are available (e.g. constitutive equations, models for anisotropy, creep, phase transformation and microstructure evolution) which all contain model parameters that have to be determined. Often, different material models require specific types of experimental methods to determine its material model parameters. For example, the parameters in a constitutive equation may require a different type of experiment e.g. compression tests at certain strain rates compared to a creep model which may require another type of test method under strain rates valid for creep. The objective of this thesis is first to establish an experimental foundation and
comprehension on the thermo-mechanical behaviour of the titanium alloys Ti-6Al-4V but foremost Ti-6242, and to procure a good understanding of the possibilities and difficulties of used testing methods. Furthermore, experimental data are used both to obtain constitutive material model parameters trough force and displacement from elevated temperature compression tests by use of inverse modelling, and in finite element analyses for validation and prediction by analyses of sheet metal forming. Elevated temperature compression tests on cylindrical specimens are used for both Ti-6Al-4V and Ti-6242, revealing many interesting characteristics of these alloys. The experimental data are then used to estimate material parameters of different constitutive equations and used in initial predictions of sheet metal forming of Ti-6242. Cold and hot sheet metal forming tests of Ti-6242 is performed in order to evaluate suitable sheet metal forming processes for the alloy. Process parameters are studied and the tests functions as validation tests for the correlation of numerical models.

6

7
THESIS
The thesis comprises an introduction and the following two appended papers:
A. Westman E-L, Pederson R, Wikman B, Oldenburg M, Numerical and Microstructural Evaluation of Elevated Temperature Compression Tests on Ti-6Al-4V, Ti-2003 Science and Technology, 10th World Conference on Titanium, Hamburg, Germany, 13-18 July 2003, Volume III, pages 1461-1468.
B. Odenberger E-L, Pederson R, Oldenburg M, Thermo-mechanical material response and hot sheet metal forming of Ti-6242. To be submitted.

8

9
CONTENTS
1. INTRODUCTION ...............................................................................................................11
2. THE TITANIUM ALLOYS TI-6AL-4V AND TI-6242 ...................................................13
3. SHEET METAL FORMING OF TITANIUM .................................................................16
3.1 COLD FORMING ...............................................................................................................183.2 HOT FORMING..................................................................................................................193.3 SUPERPLASTIC FORMING .................................................................................................20
4. MATERIAL CHARACTERISATION..............................................................................21
4.1 EXPERIMENTAL OBSERVATIONS ......................................................................................224.2 MATERIAL MODELS FOR TITANIUM 6242 ........................................................................24
4.2.1 Elasticity..................................................................................................................254.2.2 Constitutive Relations .............................................................................................274.2.3 Plastic Yield Criteria...............................................................................................324.2.4 Models for Creep, Phase Transformation and Microstructure ...............................354.2.5 Damage Mechanics .................................................................................................35
4.3 PARAMETER ESTIMATION ................................................................................................364.3.1 Mechanical Testing .................................................................................................364.3.2 Inverse Modelling....................................................................................................36
5. MODELLING OF SHEET METAL FORMING OF TI-6242 ........................................41
6. SUMMARY OF APPENDED PAPERS ............................................................................44
6.1 PAPER A...........................................................................................................................446.2 PAPER B...........................................................................................................................45
7. CONCLUSIONS AND FUTURE WORK .........................................................................54
REFERENCES ........................................................................................................................56
APPENDIX...............................................................................................................................60
A. MATERIAL TESTING OF TI-6AL-4V...................................................................................60
APPENDED PAPERS
A Numerical and Microstructural Evaluation of Elevated Temperature Compression Tests on Ti-6Al-4V
B Thermo-mechanical Material Response and Hot Sheet Metal Forming of Ti-6242

10

11
1. INTRODUCTION In modern industry new demands and new opportunities for simulation driven product development exists. Today's finite element (FE) technology and computer capacity makes precise analyses possible – with detailed results that are at material point level. Resultant material state can be determined and predicted. However, in order to achieve this, material models and accurate material parameters are required. Traditional methods to determine necessary property data is time demanding and expensive, it exists only for few materials and they are often not in an appropriate form. An alternative course of action is to obtain material parameters trough experimental reference data by the use of inverse modelling [1]. Traditional methods to determine property data for e.g. the constitutive behaviour in which the material is characterized by several tension and/or compression tests at different strain rates and temperatures are often not sufficiently accurate. A homogenous stress distribution is assumed by logarithmic strain and mean stress. In the estimation of model parameters of constitutive equations by inverse modelling reference data by means of force and displacement from elevated temperature compression tests has shown to generate more accurate material data for the modelling of sheet metal forming. Additionally the methodology usually requires a reduced number of experiments [2, 3, 4]. The profit of inverse modelling is that boundary effects, e.g. friction leading to inhomogeneous stress conditions developed in the specimen upon loading, can be taken into account. This since FE analyses of the actual experiment is included in which boundary effects are modelled. Furthermore, additional homogenous states in the tests are not necessary. For example, if models for phase transformation and microstructure evolution are included in the FE model the mechanical properties of individual phases can be determined and predicted together with final material state and mechanical properties. A task that is difficult, if not impossible, with direct experiments. Inverse modelling implies a systematic way of dealing with simpler experiments. With increasing knowledge of e.g. mechanical properties and material models for a specific material or alloy the most fundamental experiments can be excluded when similar alloys are studied. This will increase the efficiency and reduce the costs associated to the process of determine necessary property data. The scope of the present research project is to explore the possibility to use
inexpensive and specially designed material experiments in combination with inverse modelling and optimisation methods in the industrial product development process. The aim is to develop a methodology resulting in inexpensive, high quality material descriptions for manufacturing and functional simulations in the concept phase of the product development

12
process. The existence of the proposed methods has the potential to significantly increase the possibility to implement modern modelling and simulation methods in industrial product development processes.
Co-operative work with Volvo Aero Corporation exists within the research project, for which focus lie on titanium alloys typically used in the aerospace industry i.e. Ti-6Al-4V and Ti-6242. Alternative manufacturing methods for the production of aero engine components i.e. by sheet metal forming in combination with cutting and/or welding techniques instead of forged or cast components are of interest. Conventional sheet metal forming of the titanium alloy Ti-6242 therefore functions as an application in the research project. Applications are necessary in the process to identify and determine the appropriate degree of complexity of suitable experiments, material models and validation tests for the numerical prediction of sheet metal forming.
The objective of this thesis is first to establish an experimental foundation and comprehension on the thermo-mechanical behaviour of the titanium alloys Ti-6Al-4V but foremost Ti-6242, and to procure a good understanding of the possibilities and difficulties of used testing methods. Further, experimental data from the elevated compression tests are used both to obtain material model parameters of constitutive equations trough force and displacement by use of inverse modelling and in finite element analyses for the prediction of sheet metal forming. All to be used in the process of giving rise to the above mentioned methodology in which one can find both a course of action, when new materials or applications are considered, and a bank of knowledge which promote the efficiency in identifying high quality material descriptions – one must not start over but can use previously generated knowledge on the area.
The main part of the work performed is reported in two papers but to start with an overview of the subjects is presented together with additional work. The summary is not meant to be complete in any sense but it will hopefully introduce readers to the subjects and extent of this thesis and research project.

13
2. THE TITANIUM ALLOYS TI-6Al-4V AND TI-6242 Titanium alloys are extensively used in aerospace applications such as turbine engines, airframe applications and space applications, mainly because of their superior strength to weigh ratio.
Ti-6Al-4V is the most widely used titanium alloy representing more than 50% of the world’s titanium usage, where the aerospace industry accounts for approximately 80% of the current use. Other applications of this alloy are medical prostheses and some amounts are also used in the automotive, marine and chemical industry. Wrought, cast and powder metallurgy are the most usual forms of Ti-6Al-4V where wrought products account for approximately 95% of the market. Examples of wrought products are ingots, billets, sheets, wires and forgings. Ti-6Al-4V is a two phase ( + ) alloy implying a variety of possible microstructures and property combinations depending on different factors such as thermo-mechanical processing, chemical composition, interstitials (mainly oxygen) and impurities. In order to ‘control’ or detect this variety of mechanical properties it is very important to define the chemical composition and microstructure together with the actual history1. The phase has a crystal HCP structure and the phase a BCC structure. Two phase ( + )alloys often contain one or more stabilizing element together with one or more stabilizing element, which increase or decrease the + transition temperature by stabilizing either the or the phase. Ti-6Al-4V contains 6 wt% aluminium stabilizing the phase and 4 wt% vanadium which stabilizes the phase. The microstructure at equilibrium and in room temperature mainly consists of the phase with some retained phase in which three rough categories can be classified; lamellar, equiaxed and a mixture of both. Thelamellar structure can be controlled by heat treatment, where, foremost, the cooling rate from above the transus temperature determines the size of the lamellas. Higher cooling rate imply finer lamellas. The equiaxedmicrostructures can be obtained by extensive mechanical working in the ( + )phase region ( 75 % reduction) in which the lamellar breaks up into equiaxed . The bimodal type of microstructure are best obtained by annealing (1 hour, 995 C) followed by cooling and aging at 600 C, the result is a structure consisting of isolated primary -grains in a transformed -matrix. Fig. 1 is a schematic illustration of the resultant microstructures when quenched from different temperatures. The figure attempts only to illustrate the
1 The meaning of “history” in this case is basically the treatment of the alloy from ore to complete work piece, depending on where the detail are in the manufacturing chain.

14
principle transformations upon cooling; in reality mixtures of hexagonal martensitic ’, orthorhombic martensitic ’’ and metastable/stable can occur. Typical physical properties can be found in table 1. The variety in Young’s
modulus is dependant on the heat treatment, alloy concentration, interstitials/substitutional, impurity levels and, if it is a textured sheet, of the angle between the rolling direction and specimen axis i.e. anisotropy of the sheet. Poisson’s ratio ( ) at room temperature range between 0.26-0.36 depending on phase content. The melting temperature of Ti-6Al-4V is lower than for commercially pure titanium and its nominal value is in the range from 1635 to 1675. The temperature dependent thermal conductivity, 7 W/m*K, is lower than that of pure titanium and even lower than for other high-alloy steels (22 W/m*K for pure titanium and 12 – 30 W/m*K for high-alloy steels). Unequivocal data of the plastic properties of Ti-6Al-4V is difficult to find since the properties, as stated earlier, depend on a variety of factors. However, typical values of the tensile yield strength (for annealed Ti-6Al-4V) are 830-924 MPa [5, 6, 7].
Fig. 1. A schematic illustration of microstructures occurring in Ti-6Al-4V after quenching from different temperatures [7].
Titanium Ti-6Al-2Sn-4Zr-2Mo-0.08Si or Ti-6242 was developed in the late 1960’s. It is a titanium alloy with high temperature stability for long-term applications (up to 425°C) and is one of the most creep-resistant, often used when the temperature range do not permit usage of Ti-6Al-4V. Ti-6242 is extensively used in turbine-engine applications, mostly for gas turbine components such as compressor blades, disks and impellers but also in sheet metal form for various “hot” airframe skin applications and in engine

15
afterburner structures. The alloy is a near-alpha, alpha-beta alloy and the structures are typically equiaxed in a transformed matrix or a fully transformed micro structure. The phase has a crystal HCP structure and the phase a BCC structure, as in Ti-6Al-4V. The fraction of equiaxed grains in the structure of sheet products are often of about 80-90 %, which is somewhat more than in forgings. The size of the grains in sheet products also tend to be smaller compared to those in forged products. The 6 wt% aluminium potentially stabilizing the phase while the 2 wt% molybdenum is a potential
phase stabilizer. The tin and zirconium additions are neutral, i.e. they do not stabilize any of the phases but they are solid-solution strengthening elements. The alloy is a weakly beta-stabilized alpha beta alloy, due to the moderate quantity of molybdenum. The silicon addition used in Ti-6242 improves the creep properties. Typical physical properties can be found in table 1, in which it is found that the density of Ti-6242 is slightly higher than that of Ti-6Al-4V. Young’s modulus (duplex annealed sheet) is 113 GPa and Poisson’s ratio 0.325, at room temperature. The properties except for the Beta transus-, melting temperature and the density are naturally temperature dependant. Typical values of the tensile yield strength (for duplex annealed sheet) range between 889-937 MPa.
Table 1 Summary of typical physical properties [2, 7]
Property Ti-6AL-4V Ti-6242
Beta transus 995 C 990 CMelting point ~1655 20 C ~1705 CDensity (a) 4.428 g/cm3 4.540 g/cm3
Young’s modulus (a) 115 15 GPa 113 GPa Poisson’s ratio (a) 0.26-0.36 0.325 Thermal conductivity (a) 7 W/m*K 7 W/m*K Specific heat capacity (a) 580 J/kg*K 460 J/kg*K Thermal coefficient of linear 9.0*10-6/ C 7.7*10-6/ C expansion (b)
(a) Typical values at room temperature. (b) Mean coefficient from 0 to 100 C
Both alloys have excellent corrosion resistance compared to other metallic alloys, at low temperatures a very thin oxide film protects the surface. However, at higher temperatures oxygen begins to dissolve from the oxide into the under lying metal, so called alpha case has formed, causing embrittlement. In other words, the film grows inwards by diffusion of oxygen and the corrosion velocity is strongly dependant on the temperature [5, 6].

16
3. SHEET METAL FORMING OF TITANIUM Titanium alloys are generally considered more difficult to form and often have less predictable forming characteristics than other metallic alloys such as steel and aluminium. The springback occurring when thin sheets are formed in room temperature are especially difficult to predict, in particular when the bend angles of the component are fixed by the forming tool. This can partly be explained by the combination of the high yield stress, y, and low elastic modulus, E, of titanium alloys which yields a high degree of spring back when formed by cold or even hot forming. The hexagonal crystal structure of the -phase also has anisotropic characteristics implying consequences to the elastic properties. For that many titanium components are formed at elevated temperatures or at room temperature followed by a so called “hot sizing” operation. An operation in which the part is allowed to be creep formed to the desired shape. Furthermore, components can also be typically over formed to attain the final dimensions. This is a common procedure in conventional sheet metal forming when springback is present. Other unfavourable effects on the formability of titanium alloys are; notch sensitivity (which can cause cracking during forming, especially when cold formed), galling tendencies, limited ability to shrink, embrittleness due to formation of alpha case when formed at elevated temperatures and tendencies to inequality due to anisotropy of thin sheets.
All titanium alloys exhibit strain rate sensitivity for which it is advantageous to use forming equipment with the possibility to control the deformation/load velocity. Generally, it is better to form titanium alloys at lower strain rates in room temperature. However, at elevated temperatures some alloys are better formed at higher strain rates while others still have better formability at lower strain rates. Further, titanium alloys are under all forming operations sensitive to the Bauschinger effect. In contrast to isotropic hardening, which implies that even after plastic strains has developed and after reverse loading has occurred the tensile yield stress equals the compressive yield stress ( y0 = - y0) the Bauschinger effect imply that the point where plastic effects occur at point B occurs earlier than for isotropic hardening, c.f. Fig. 2 (a) and (b). The effect is most pronounced in room temperature and must be considered when forming operations imply plastic loading in one direction followed by plastic loading in the reverse direction. This can be the case in, for example, multi-stage forming.
The preparation of sheet plates prior to forming is important in which the sheet specimens shall be inspected with respect to uniformity. All scratches on the sheet shall not exceed the once caused by an abrasive paper of fineness 180 and critical areas should be free from scratches. Sheet edges shall be smooth

17
and existing scratches shall be oriented parallel to the edge to prevent that stress concentrations causes fracture. Existing oxide or alpha case shall be removed to avoid difficulties concerning notch sensitivity when formed. Grease, oil, fingerprints, dirt and so forth shall be removed before heating since the salt in some defilement can cause so called hot salt cracking.
An effort to standardize the formability of titanium sheet has been made where a dimensionless index called the minimum bend radius TR is defined as the ratio between the die radius R and the sheet thickness H, c.f. Equation 1.
TR = R/H (1)
Small values of the minimum bend radius correspond to improved formability. The minimum bend radius, TR, vary between alloys from 1.5-2 for commercially pure titanium to 4.5 for Ti-6Al-4V.
(a) (b) Figure 2. a) Isotropic hardening and, b) the Bauschinger effect.
However, if forming is performed under favourable circumstances titanium alloys can be successfully formed into complex parts [5, 6, 7, 9, 10].
Currently, very limited research is published in the field of cold- and hot-sheet metal forming of Ti-6242. However, research efforts have been made in sheet metal forming of e.g. Ti-6Al-4V revealing many interesting sheet metal forming characteristics of this particular alloy including forming limit diagrams (FLD) [11-16]. For example, the work performed by Thomas et al. [11] deals with material behaviour models to establish the proper conditions for fabricating titanium alloys by conventional sheet forming processes, Ti-6Al-4V is studied in specific. Forming limit curves are calculated which is compared
y0+K
y0+K
y0y
y0y

18
with experimental FLD:s available in the literature. The results indicate that the most critical formability index is the strain rate sensitivity of the material. The forming limits increase with temperature for a given punch speed and with decreasing punch speed for a given temperature. The punch speed is particular important at the studied temperatures 538 and 677°C, predominantly due to the changes in the strain rate sensitivity of the alloy.
Furthermore, the influence of plastic anisotropy and R-value on the stretch forming and fracture behaviour of strongly textured Ti-6Al-4V is studied by Chan and Koss [12]. Here an experimentally determined forming limit diagram and fracture curve is presented. It was found that difficult through-thickness slip and a high R-value enhances the limit and fracture strains in the negative minor strain region, especially at uniaxial tension. However, a high R-value only has limited effect on the behaviour at near plain strain stretching and data suggests that an increasing value of R decreases the limit strain when the minor strain is positive. El-Domiaty [13] in his study of material models and the determination of material parameters in the formability of Ti-6Al-4V concluded that strain rate effect on the forming limit curve is more pronounced at higher temperatures, that it can be neglected at room temperature and that the level of the FLD depends on the strain, strain rate and temperature. In the study performed by Shipton and Roberts [14] the effect on earing behaviour with temperature and temperature gradients of deep drawn commercial purity titanium cups are presented. The study show that the earing characteristics change with temperature and that the use of temperature gradients enables high limiting drawing ratios to be achieved. In the paper by Alberti et al. [15] an application of a rubber forming process for the manufacturing of a titanium tweeter by deep drawing is analyzed. FE-analyses are performed to analyze the possibility to modify the tool geometry and determine the best set of technical parameter, in order to determine the best solution for the production of the required component. Experiments confirmed, to some extent, the numerical predictions. Yet another study on the area of stretch-drawing of titanium sheets is presented in the work by Satoh et al. [16]. It was, in this work, found that the shape quality of stretch-drawn cups is better compared to cups formed by conventional deep-drawing and that the shape feature depends on the planar anisotropy of the tested sheets (two kinds of pure titanium and one alloy are studied).
3.1 Cold Forming Titanium and titanium alloys can to some extent be formed in room temperature or at lower elevated temperatures. They are usually stretch-formed in room temperature even though the forming tool may be heated (~150ºC). Simple bend forming of straight sections can be performed in room

19
temperature if the forming tool have sufficient bend radius. The minimum bend radius however decreases with temperature implying, as previously mentioned, better formability at higher temperatures, c.f. Fig. 3 for an example of Ti-6Al-4V. The springback tend to follow the levels of the yield stress limit/ultimate stress limit in tension, where a high yield stress implies a high degree of springback. Even though the degree of springback in room temperature can be as high as 20-30% it is, as pointed out previously, not the magnitude that constitute the biggest difficulty but the variation. Due to this it may be required to perform a subsequent hot sizing operation for a certain amount of components. An alternative is to reduce the springback by hot forming in the temperature range 215-315°C. When cold forming of titanium alloys are applied, multistage forming with intermediate annealing may be required. Usually, commercial titanium and the more ductile titanium alloys (e.g. Ti-
15V-3Sn-3Cr-3Al and Ti-3Al-8V-6Cr-4Zr-4Mo) can be cold formed into simple geometries with standard techniques.
3.2 Hot Forming As already intimated, the formability of titanium alloys can be increased by forming at elevated temperatures, c.f. Fig. 3, in which the springback and the scatter in yield stress can be reduced. Simultaneously maximal deformation with the possibility of using one-step forming procedure is possible. However, the technique requires heat resistant forming tools and often slow forming velocities with subsequent holding times (approximately 5 minutes) implying long exposure times at high temperatures and additional costs. Severe and extensive forming must be performed in heated or pre-heated
forming tools, the highest ductility require forming temperatures above 315 - 425°C where the best improvement occurs above 540°C. For this reason most hot forming is performed above this temperature. As a comparison, most titanium alloys formed at 650°C behaves with similar formability as annealed stainless steel at room temperature. At even higher temperatures some titanium alloys exhibit superplastic characteristics, see section 3.3. However, forming at higher temperatures also imply a higher degree of contamination and forming at temperatures above 540°C should be performed in a protective atmosphere or coated sheets should be used. To avoid deterioration of the mechanical properties hot forming should generally not be performed at temperatures higher than ~815°C. When oxygen enrichment of titanium occur the material becomes more brittle and scaling may occur, removal of contaminated surface layer of the components should always be carefully considered for all heating above 540°C. Some forming temperatures are sufficient for ageing to occur and
- titanium alloys should not be formed over the -transus temperature due to the risk of extensive grain growth.
20
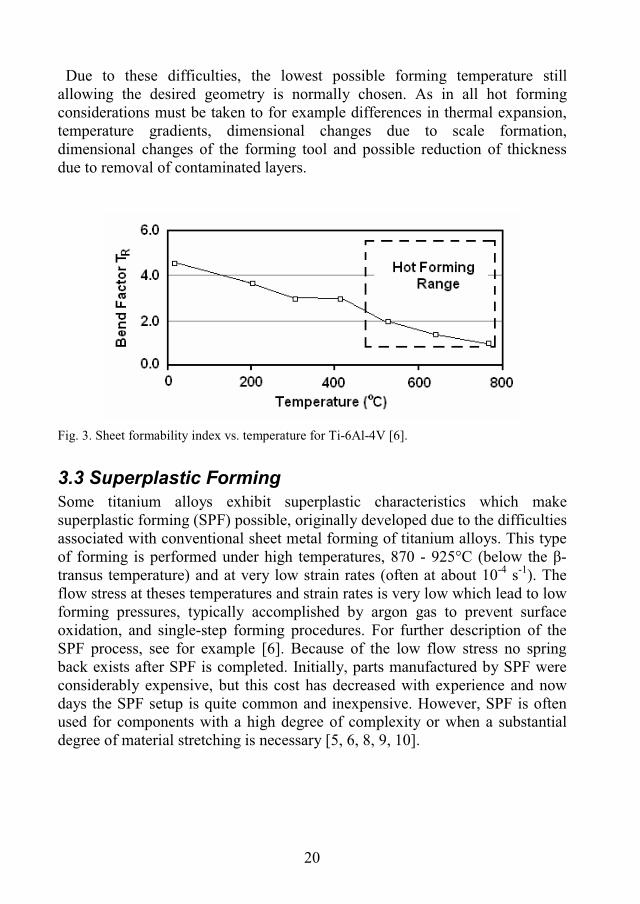
Due to these difficulties, the lowest possible forming temperature still allowing the desired geometry is normally chosen. As in all hot forming considerations must be taken to for example differences in thermal expansion, temperature gradients, dimensional changes due to scale formation, dimensional changes of the forming tool and possible reduction of thickness due to removal of contaminated layers.
Fig. 3. Sheet formability index vs. temperature for Ti-6Al-4V [6].
3.3 Superplastic Forming Some titanium alloys exhibit superplastic characteristics which make superplastic forming (SPF) possible, originally developed due to the difficulties associated with conventional sheet metal forming of titanium alloys. This type of forming is performed under high temperatures, 870 - 925°C (below the -transus temperature) and at very low strain rates (often at about 10-4 s-1). The flow stress at theses temperatures and strain rates is very low which lead to low forming pressures, typically accomplished by argon gas to prevent surface oxidation, and single-step forming procedures. For further description of the SPF process, see for example [6]. Because of the low flow stress no spring back exists after SPF is completed. Initially, parts manufactured by SPF were considerably expensive, but this cost has decreased with experience and now days the SPF setup is quite common and inexpensive. However, SPF is often used for components with a high degree of complexity or when a substantial degree of material stretching is necessary [5, 6, 8, 9, 10].

21
4. MATERIAL CHARACTERISATION Depending on some process of interest to study experimentally and numerically, a variety of testing methods and material models are available, see for example [3, 17, 18]. When considering sheet metal forming, which in essence is a highly nonlinear process, specific needs and demands on both experimental methods and material models used in nonlinear FE analyses exists. The proposed course of action to obtain accurate material model parameters, in this work, is to use material experiments in combination with inverse modelling and optimisation methods. By means of inverse modelling, each set of parameters in a specific type of material model to be determined often requires its own specific test method. For example, the parameters in a constitutive equation may require a different type of experiment e.g. compression tests at certain strain rates compared to a creep model which may require another type of test method under strain rates valid for creep. The profit of inverse modelling is that boundary effects, e.g. friction leading to inhomogeneous stress conditions developed in the specimen upon loading, can be taken into account. Furthermore, additional homogenous states in the tests are not necessary. For example, if models for phase transformation and microstructure evolution are included in the FE model the mechanical properties of individual phases can be determined and predicted together with final material state and mechanical properties. A task that is difficult, if not impossible, with direct experiments. Inverse modelling implies a systematic way of dealing with simpler experiments. Examples of models that are interesting for the modelling of sheet metal forming are constitutive equations, models for anisotropy, creep, phase transformation and microstructure evolution. For instance, when the constitutive relation of a material can be described by a model in which the model parameters are valid for a temperature interval and where boundary effects is accounted for, more accurate analyses can be performed compared to the direct usage of experimental true stress-strain relations. This since, no assumptions of homogenous stress conditions are used and the interpolation between true stress-strain relations for certain temperatures are not needed. The constitutive equation with model parameters can describe the actual constitutive behaviour by just modifying the actual temperature. The interpolation between true stress-strain relations at specific temperatures implies inaccuracy. Sheet metal forming of titanium alloys implies a variety of material
characteristics to be accounted for (e.g. anisotropic elastic properties, material hardening and flow softening, strain rate sensitivity, temperature sensitivity, plastic anisotropy and creep behaviour when holding time in heated forming tools is applied). The same apply when numerical predictions are to be

22
accomplished. However, an aspiration for simplicity should, as far as possible, permeate the accountancy for and choice of models. In other words, one should account only for the material characteristics necessary for the accurate prediction of the intended process and if possible use simple models. To start simple and subsequently account for areas found necessary, continuously validating the increase of model complexity.
4.1 Experimental Observations Experimental studies of the two titanium alloys have been performed. Elevated temperature compression tests are accomplished for both alloys presented in paper A and B, and sheet metal forming tests are conducted on Ti-6242 presented in paper B. The main purpose of the elevated compression tests is to obtain material model parameters trough force and displacement by inverse modelling. Furthermore, the compression tests functions as a source of information of how the specific alloys behaves in many senses. For example the thermo-mechanical behaviour has been studied along with microstructural changes due to the processing. The main purpose of the sheet metal forming tests is to use the results for validation of numerical models, in which material model parameters obtained from the elevated compression tests by inverse modelling are used. Another important aim is to investigate suitable forming conditions for Ti-6242 and simultaneously detect spring back characteristics and microstructural changes together with evolved damage. C.f. Fig. 4 for a schematic illustration of the used forming tools. References are made to the summary of the appended papers and to the complete papers, A and B, themselves.
Fig. 4. Schematic illustration of the forming tools.

23
When compression tests are to be used for the identification of material model parameters one must ensure that the reproducibility of used data are established. In order to ensure that the tests are performed under the exact same conditions, repeated tests are performed directly after each other. Three tests are performed in this work, but if possible the reproducibility can with advantage be statistically established. If considerably scatter in test data exists, which was observed when repeated tests were not performed in the same set of tests, this can result in inaccurate parameters and thereby inaccurate numerical predictions.
Currently, extensive experimental results on the compressive deformation behaviour for a broad range of strain rates and temperatures of Ti-6Al-4V are available [19-24], revealing many interesting characteristics of the alloy. For example, S. L. Semiatin and co-workers [19] on their overview studies on the hot workability of titanium and titanium aluminide alloys, report that the principal type of non uniform metal flow during bulk hot working are shear bands and gross metal flow defects. They state that the prediction and prevention of their occurrence increasingly rely on process modelling techniques e.g. FE-analysis due to the important role of perform and die geometry. Three common sources of bulges are die chilling, friction and bulging occurring even in the absence of friction (analog of necking during tension testing) which is a considerable function of material properties. The so called flow localization parameter, , can be utilized for the interpretation of flow localization where the onset of instability and flow localization is =0. However, in practice values of =5 or grater are required for noticeable flow localization to be generated. The main sources for the high rates of flow softening occurring in / titanium alloys are prescribed 1) for forging at low temperatures and high strain rates, deformation heating-induced softening or 2) microstructure-based softening due to breakdown of lamellar microstructures. In the work by Ding et al. [20] flow softening, in the temperature range 850 - 1050ºC, in Ti-6Al-4V are prescribed adiabatic heating, to phase transformation or at the higher temperature dynamic recrystallization. In the articles by Wagoner Johnson [21], Satish et al. [22] and Lee et al. [23] some interesting facts about the fracture mechanics of compressed specimens are presented.
In work published by Semiatin and Lahoti [25, 26, 27] some interesting characteristics of Ti-6242 in the field of isothermal and nonisothermal hot forging (816 to 1010ºC) are presented. Flow stress behaviour, occurrence of shear bands, chill zones and shear cracks are observed and discussed. For example, it was established that the flow behaviour to a big extent is determined by the starting microstructure and in hot isothermal compression it was stated that, for the alloy with an equiaxed structure, the deformation is stable with a decreasing flow stress with straining due to adiabatic heating.

24
With a transformed structure, unstable flow was observed and the observed flow softening is in this case caused by microstructural modification together with a small adiabatic temperature increase. The flow stress is sensitive to temperature for which it was shown that this dependence is related to the strain rate sensitivity. Shear bands occur during forging of the alloy for which it where concluded that this considerably depend on the temperature sensitivity of the flow stress. Furthermore, criteria for the occurrence of shear bands were established. Additionally work published by Semiatin and Thomas, Jr et al. [27, 28] studied the flow behaviour at hot forging temperatures and the deformation-induced microstructures of Ti-6242.
4.2 Material Models for Titanium 6242 To be able to solve for stresses, strains and displacements in a continuous body, information on material properties must be taken into account, i.e. the material properties influences the deformations in a body for prescribed external forces.
Table 2 Specification of material models.
Material model Current circumstances
Isotropic elasticity Initially assumed to be valid for Ti-6242
Anisotropic elasticity Include if necessary for the prediction of spring back
Constitutive equations Description of material hardening/softening
Empirical Model simplicity, insignificant variations in strain rate
Physically based Larger range of validity, insignificant variations in strain rate
Viscoplastic Describe more complex behaviour, substantial variations in strain rate and temperature
Isotropic yield criteria Disregard the anisotropic properties of the sheet
Anisotropic yield criteria Include the anisotropic properties of the sheet
Creep model Include when creep is assumed to be of significance, e.g. hold time in forming tools
Models for phase transformations Include phase transformations
Models for microstructure/texture Include microstructure evolution, texture development
Damage mechanics Include the effects of voids and micro cracks in the constitutive equation

25
In order to choose suitable material models for Ti-6242 it is helpful to set up a specification of the phenomena the models are expected to describe. The specification presented in this work is based on experimental studies as well as on literature studies and focused on typical phenomena occurring under chosen circumstances, i.e. at certain temperatures, strain rates and with a specific material structure. Relevant observations are presented and discussed below. The rather elementary specification can be viewed in table 2.
4.2.1 Elasticity Most metals are polycrystalline consisting of a very large number of irregularly oriented crystals. This implies that the overall elastic response of the metal is linearly isotropic, even if the individual crystal has anisotropic elastic properties. For isotropic elasticity the material behaves according to Hooke’s law, stated by Equation 2 in one dimension, where Young’s modulus, E, is dependant on the specific material and the temperature. Furthermore, the elastic modulus is independent of the rate of loading (for non extreme values of the loading rate) and thereby the stress-strain curve. A material that behaves according to this is, in the elastic regime, fully described by the two stiffness parameters E and (Poisson’s ratio). Hooke’s generalised law for isotropic materials in tensor form (Cartesian) may be written according to Equations 3-6 where and are the so called Lamé parameters, ij is the stress tensor and ijis the Cauchy infinitesimal strain tensor.
= E (2)
ijijkkij 2 (3)
12;
211EE (4)
12EG (5)
which yields
26
ijkkijij G21
2 (6)
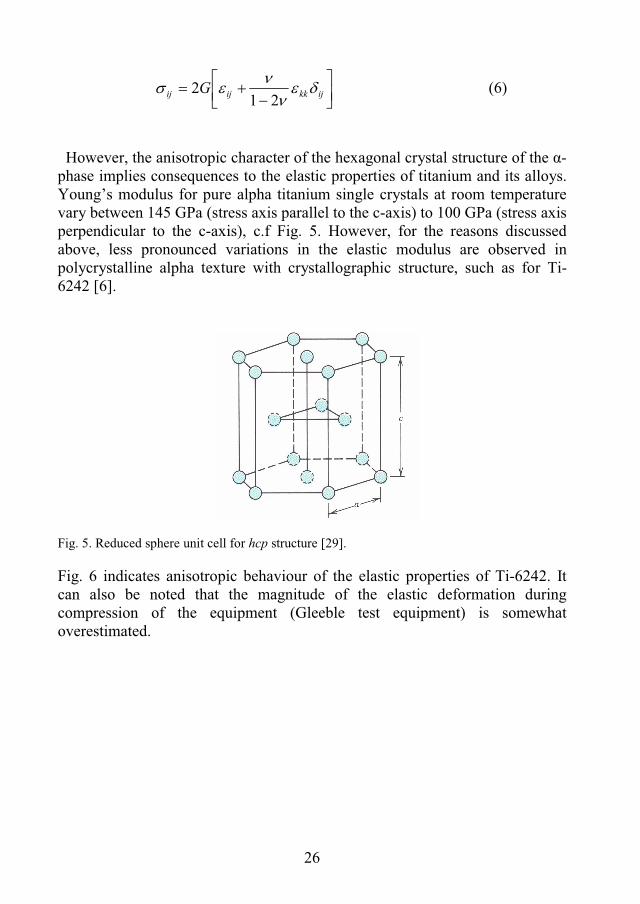
However, the anisotropic character of the hexagonal crystal structure of the -phase implies consequences to the elastic properties of titanium and its alloys. Young’s modulus for pure alpha titanium single crystals at room temperature vary between 145 GPa (stress axis parallel to the c-axis) to 100 GPa (stress axis perpendicular to the c-axis), c.f Fig. 5. However, for the reasons discussed above, less pronounced variations in the elastic modulus are observed in polycrystalline alpha texture with crystallographic structure, such as for Ti-6242 [6].
Fig. 5. Reduced sphere unit cell for hcp structure [29].
Fig. 6 indicates anisotropic behaviour of the elastic properties of Ti-6242. It can also be noted that the magnitude of the elastic deformation during compression of the equipment (Gleeble test equipment) is somewhat overestimated.

27
0 0.1 0.2 0.3 0.4 0.5 0.6 0.70
100
200
300
400
500
True strain
Tru
e st
ress
, (M
Pa)
TransverseLongitudinalThickness dir.45° mode
800°C
Fig. 6. True stress-strain relations for Ti-6242 at strain rate 0.05 s-1 and indicated temperature and extraction direction of tested specimens, presented in paper B.
Anisotropic elastic properties are, from a modelling perspective, important since it will affect the predictions of spring back behaviour. However, at the present isotropic elasticity is assumed. Still, if needed further on the anisotropic elastic properties of Ti-6242 must be further investigated.
4.2.2 Constitutive Relations When a metal is deformed plastically by cold working (temperatures below recrystallization) the strength and hardness usually increases. This is referred to as work hardening or strain hardening. The reason for this hardening lies in the crystalline structure, as the stresses increase the crystals slip against each other. Due to the complexity of the crystal structure an increasing amount of slip tend to “create” obstacles which prevent further slippage. This since the various dislocation lines crisscross each other. The isothermal Gleeble experiments presented in paper B indicate that initial
material hardening immediately followed by specimen cracking occurs in the temperature range 400 to 600°C. For the higher temperatures 700 to 900°C material hardening and peak stresses are followed by flow softening at certain strains, c.f. Fig. 7.

28
0 0.1 0.2 0.3 0.4 0.5 0.60.60
500
1000
1500
True strain
Tru
e st
ress
(M
Pa)
0.05 (1/s)
400°C500°C
600°C
700°C
800°C900°C
Fig. 7. Isothermal true stress-strain curves for Ti-6242 at strain rate 0.05 s-1 and indicated temperatures, presented in paper B.
This flow softening is a well known phenomenon observed in Ti-6242 and similar behaviour has been observed in the - titanium alloy Ti-6Al-4V [5, 20, 25, 28]. In the study by Wagoner et al. [21] on compression tests at lower temperatures in Ti-6Al-4V, it was concluded that voids occur and that the amount increase with deformation for the sample performed at a strain rate of 0.1 s-1. These voids tend to link up to micro cracks which grows into macroscopic cracks, growing from the corners into the centre of the specimen. This was also described in paper A. However, it is also stated that significant crack growth occurs only just before failure occurs. A strain rate increase in the rage of 0.1 to 10 s-1 does not affect the damage or fracture behaviour. The authors in [20] state that two different mechanisms in Ti-64 can cause flow softening (a) adiabatic heating during hot pressing or (b) alpha to beta phase transformation during hot pressing. It is, from paper A and B, known and observed that local shear bands appear in the specimens during compression. In these shear bands it is possible that voids and micro cracks are formed in the later part of the compression. This was indicated in metallographic studies for isothermal compression tests at the lower temperature interval 400-600°C, presented in paper B. The alloy is strain rate sensitive, as indicated in Fig. 8. This implies that
constitutive equations for the material hardening/softening must account for this, if a significant variation in strain rate during the forming process is present.

29
0 0.1 0.2 0.3 0.4 0.5 0.6 0.70
100
200
300
400
500
600
700
True strain
Tru
e st
ress
, (M
Pa)
800°C
0.5 (1/s)1 (1/s)
0.05 (1/s)
Fig. 8. Isothermal true stress-strain curves for Ti-6242 at indicated strain rates and temperature, presented in paper B.
From a continuum mechanics perspective, the constitutive equations shall satisfy the second principle of thermo-dynamics and in the case of large deformations also the objectivity principle (frame indifference). A rather common “classification” of constitutive equations read: empirical models,physically based models and viscoplastic models (rate-dependant).
Empirical or engineering models can be described by means of fitting model equations and parameters with experimental data without considering the physical processes and phenomena causing the material behaviour. Examples of empirical models are polynomial relations and the Johnson-Cook model [30] c.f. Equations 7 to 9 and 10 to 12, respectively.
Tny CBTA
1
(7)
33
2210)( TaTaTaaTA (8)
TnnTn 10 (9)
where B, C, a0, a1, a2, a3, n0, n1 are material model parameters. The Johnson-Cook model for the von Mises flow stress is described as

30
mn TCBA 1ln1 (10)
where is the equivalent plastic strain, * is the dimensionless plastic strain rate according to equation 7 and T* is the homologous temperature according to Equation 8.
0
* , where 0 = 1.0 s-1 (11)
ROOMMELT
ROOM
TTTT
T (12)
The material model parameters are A, B, n, C, m.Physically based models are models in which knowledge about the underlying
physical process e.g. dislocation processes, is incorporated and used for the formulation of the actual model. An example of a physically based model including the effects of strain rate is the model proposed by Nemat-Nasser [31]. The model comprises 8 material model parameters discussed below and the athermal and thermally activated flow stress can be expressed according to
Equations 13 to 16. is the uniaxial flow stress, is the effective strain rate, is the effective plastic strain, T the absolute temperature and Tm is the melting temperature. The model was originally derived for fcc and bcc metals. However, it has been proved to be able to describe the flow behaviour of Ti-6Al-4V under high strain rates [31, 32]. Furthermore, it can describe peak stresses and flow softening for which the model is interesting for studies of Ti-6242. The model is valid when dynamic strain aging is absent, however slight dynamic strain aging has been observed in the alloy Ti-6Al-4V at the temperature range 227-527°C under low strain rates (0.01s-1).

31
TfTfGkTT
pq
na ,,ln1,,
11
00
00 (13)
naa0 (14)
2
0 11),(mT
TaTf (15)
for T Tc, where Tc is the critical temperature above which the dislocations can cross their short-range barriers by their thermal activation only. The temperature and the adiabatic temperature increase, T, is calculated from
TTT 0
0 'd
CT
v (16)
2000/exp56.0 TCv
Where ’ is the mass density (4.54 g/cc for Ti-6242 and 4.39 g/cc for Ti-6Al-4V [31]), Cv is the heat capacity at constant volume and is the fraction of the plastic work converted to heat used to cause a temperature increase in the sample. Cv for Ti-6Al-4V change from 580 Jg-1K-1 at room temperature to 930 Jg-1K-1 at 870°C [33]. The specific heat capacity of Ti-6242 changes from 419 Jg-1K-1 at room temperature to 762 at 538°C. For duplex annealed sheet the coefficient changes from approximately 555 Jg-1K-1 at room temperature to 800 Jg-1K-1 at 532 °C and it is increasing nonlinear [5]. This implies that if the adiabatic temperature increase shall be accounted for in the model when

32
considering Ti-6242, the expression for Cv must be modified. Further, in the work by Nemat-Nasser et al. [31] it was showed hat ~ 1 for Ti-6Al-4V at high strain rates. The 8 material model parameters are presented in table 3.
Table 3 Material model parameters.
Model parameters Description p Constant that defines the shape of the energy barrier
q Constant that defines the shape of the energy barrier
k/G0 G0 is the total energy barrier that a dislocation must overcome by its thermal activation in the absence of an applied stress, k is the Boltzmann’s constant
0 Reference strain rate
a0 A constant depending on the initial (or reference) dislocation density
0 Empirically determined effective stress
0a Component in the athermal part of the flow stress, a
n Component in the athermal part of the flow stress, a
In this model the concept of the motion of dislocations and the barriers that they must overcome in their motion are considered. A general expression is obtained including free model parameters which can be directly evaluated against experimental data. In contrast to rate-independent plasticity in which the domain of validity is
restricted to moderate temperature usage and non-damaging loads, the rate-dependant viscoplasticity theory can describe more complex behaviours e.g. for higher temperatures and varying strain rates.
4.2.3 Plastic Yield Criteria The yield criterion defines a yield surface in the stress space which separates the elastic domain, inside the yield surface, from the inelastic domain, outside the yield surface. As presented in table 2, it can initially for simplicity be of relevance to use an isotropic yield condition according to von Mises yield theory, which can be written according to Equations 17-19.
,0),(___
ypf (17)

33
where_
is the effective stress given by
2
_3J (18)
and J2 is the second deviatoric stress invariant. The corresponding hardening law is defined as
)(_p
yy (19)
In hardening plasticity, the von Mises criterion is well known to be able to describe the yielding of metals and steels in which the size of the yield surface change upon plastic loading. An increase of the yield surface corresponds to a hardening of the material c.f. Fig 9. Here plastic loading can be accomplished by either prescribing an increasing stress or an increasing strain.
Fig. 9. Yield surface for isotropic hardening of the von Mises criterion.
However, when a material exhibit hardening plasticity followed by softening plasticity the elasto-plastic loading can only be accomplished by strain control.
1
2 3

34
This is due to the fact that for a given stress two possible strains exists, c.f. Fig. 10.
Fig. 10. Hardening plasticity followed by softening plasticity.
When the anisotropic plastic properties of the sheet are to be accounted for, one must use anisotropic criteria which can account for these effects. As an example Hill’s yield criterion for orthotropic materials [10], illustrated in Fig. 11, can be mentioned. Rolled steel and aluminium exhibit orthotropic properties [34, 35, 36].
Fig. 11. Yield curve in the deviatoric plane for Hill’s criterion.
1
2 3

35
4.2.4 Models for Creep, Phase Transformation and Microstructure When creep is of significance in a sheet metal forming operation, e.g. during holding time in heated forming tools, creep models must be considered. In the present work no extensive effort has so far been focused on this area. However, a model of interest is the generalized creep law by Northon-Odqvist, c.f. Equation 20.
e
ijn
c
ec
ij
ce
s231
(20)
Furthermore, to be able to predict the final material state the includance of models for phase transformation and microstructure evolution are important. Common models used for diffusional controlled transformations in steels are the equations given by Avrami, presented in reference [37]. It is of future interest to study the self consistent approach concerning texture evolution proposed by Molinari [38].
4.2.5 Damage Mechanics When a material is loaded mechanically, damage may develop which evolve with increasing load. Generally, the damage in the material initiates before final failure occurs. The mechanical properties such as stiffness and strength of course depend on the degree of damage. A material in which damage has evolved will e.g. exhibit a lower stiffness compared to a material without. If damage develop in a material, it is therefore important to include this in the constitutive law. Damage, i.e. voids and micro cracks have been observed in compression testing of specimens in Ti-6Al-4V [21]. It is realistic to assume that this type of damage also can occur in Ti-6242. Indications of this was detected and presented in paper B. When components manufactured by sheet metal forming in which critical deformation of the material is approached, damage is an important feature to detect and to be able to predict. This is apparent since damage existing in aero engine components can imply catastrophic consequences if failure occurs. Existing micro cracks can, under unfavourable circumstances, grow and finally cause failure [34, 35, 36].

36
4.3 Parameter Estimation As previously mentioned, material model parameters must be determined for the chosen material model. In this section the method of identifying material model parameters trough inverse modelling is described. Often different material models e.g. models for material harden/softening, anisotropy or creep require its own suitable testing method to provide the system with experimental reference data. Focus in this work lie on the determination of material model parameters of constitutive equations for the material hardening. In work by others [2, 3, 39] the accurate modelling of processes such as forming, inverse modelling has been shown to generate more accurate material data compared to the usage of traditional experimental data as model input. It can also reduce the number of required experiments [3].
4.3.1 Mechanical Testing To produce experimental reference data, so called Gleeble tests i.e. elevated temperature compression tests are conducted. Typical dimensions of the cylindrical specimens are 5 mm diameter and 7 mm height. References are made to paper B for specific information regarding the tests. The outcomes, relevant for the inverse modelling, of the tests are compression force and diametric increase from both isothermal compression tests and compression tests during continuous cooling c.f. Fig. 12(a) and (b) respectively.
0 0.5 1 1.5 2 2.5x 10
−3
0
5
10
15
20
25
30
Diametric increase, (m)
Com
pres
sion
forc
e, (
kN) 0.05 (1/s)400°C
500°C
600°C
700°C
800°C900°C
0 0.2 0.4 0.6 0.8 1 1.2 1.4 1.60
5
10
15
20
25
30
Diametric increase, (m)
Com
pres
sion
forc
e, (
kN) 0.05 (1/s)
750 − 600°C
800 − 650°C
850 − 700°C
(a) (b) Fig. 12. Compression force vs. diametric increase at indicated strain rate and temperatures or temperature intervals.
4.3.2 Inverse Modelling The strategy of inverse modelling described in [1, 40], can schematically be illustrated by Fig. 13. Experimental reference data are compared with data generated by a numerical model i.e. FE analyses of the actual test by means of an objective function.

37
Fig. 13. Schematic illustration of inverse modelling.
The numerical output from the model is altered by using the material model parameters as input, i.e. the design parameters. The objective function (xj), or equivalently the error, is an expression that determines the discrepancy between the computed and measured response. In this work in a least-square sense, normalized according to Equation 21.
n
iei
jf
iei
ei
jf
ie
ij D
xDDF
xFFx
1
22)()(
21)( (21)
where n is the number of sampled values, Fei and Ff
i are the compression force from experiment and FE analyses, respectively. De
i and Dfi are the radial
displacement from experiment and FE analyses, respectively. The objective function value is minimized by using an optimization algorithm. The optimization procedures used in this work are performed using INVSYS [40], an in-house programming system tailor-made for analysis of inverse problems. The core of the system is an optimization algorithm, the unconstrained subspace-searching simplex method (SUBPLEX) [41]. The method is a zero-order method which uses direct search to find the minimum of the objective function value. The SUBPLEX method is a generalization of the well known Nelder-Mead simplex method which has the capability to minimize very noisy objective functions.

38
Inhomogeneous stress conditions can be taken into account. This is of great benefit, in contrast to traditional methods where a homogenous stress distribution is assumed, c.f. Fig. 14.
Fig. 14. Schematic illustration of the inhomogeneous stress condition developed during deformation, mirrored FE model. Blue colour indicates low stress and yellow colour indicates high stress.
If material parameters valid for a certain temperature interval are obtained it would imply that more accurate modelling of the mechanical behaviour is possible compared to when traditional isothermal true stress-strain curves are used and interpolated in between. Model parameters valid for a temperature interval can be estimated through compression tests performed under continuous cooling in which several compression tests are used. The tests have different starting and final temperatures which imply that a certain overlap occurs and thereby provide with more information. Different strains occur at equal temperatures, c.f. Fig 15.

39
Fig. 15. Three compression tests under continuous cooling with overlap.
The model developed by Nemat-Nasser et al. [31] was used to estimate initial parameters for Ti-6242 at 400ºC to evaluate the possibility of the model to describe the mechanical properties of the alloy. Since we seek to estimate initial values to be used as an initial guess in future parameter estimations, the numerical evaluation i.e. the FE model of the compression test is excluded in the inverse modelling system. That is, material model parameters are optimized directly against the true stress-strain curve obtained from the isothermal compression test at 400ºC. Parameters presented in [31] for Ti-6Al-4V are here used as initial guess and only three parameters are used as design variables, 0
a , 0 and n.The result from the optimization can be found in Fig. 16, indicating good
capability of the model to describe the true stress-strain relation for Ti-6242 at 400º. This makes the model interesting for further evaluation.

40
0 0.02 0.04 0.06 0.08 0.1 0.120
200
400
600
800
1000
1200
Optimized
Initial Guess
Experimental
Fig. 16. True stress-strain relations for the initial guess, optimized parameters and the experimental curve for Ti-6242 at 400°C.
41
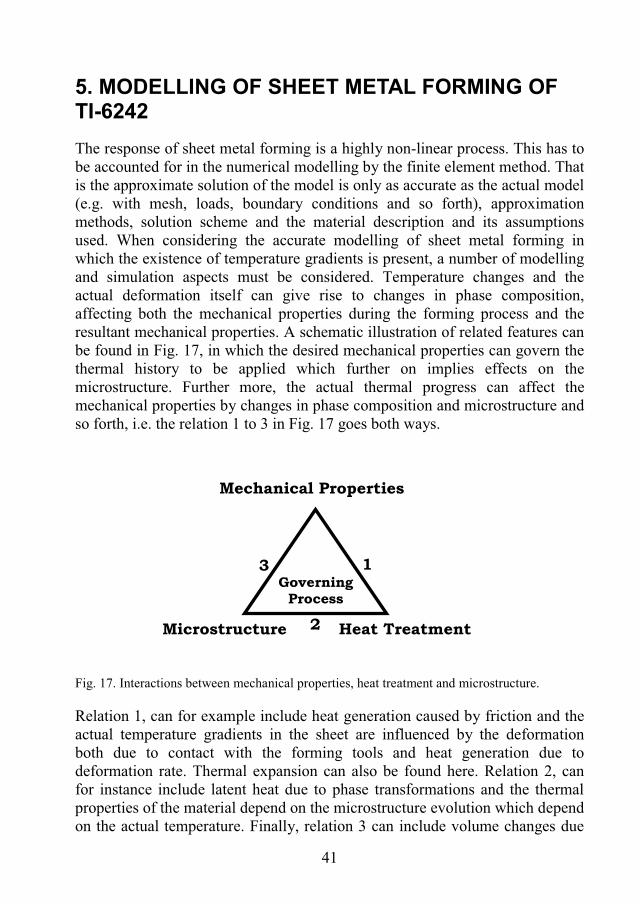
5. MODELLING OF SHEET METAL FORMING OF TI-6242The response of sheet metal forming is a highly non-linear process. This has to be accounted for in the numerical modelling by the finite element method. That is the approximate solution of the model is only as accurate as the actual model (e.g. with mesh, loads, boundary conditions and so forth), approximation methods, solution scheme and the material description and its assumptions used. When considering the accurate modelling of sheet metal forming in which the existence of temperature gradients is present, a number of modelling and simulation aspects must be considered. Temperature changes and the actual deformation itself can give rise to changes in phase composition, affecting both the mechanical properties during the forming process and the resultant mechanical properties. A schematic illustration of related features can be found in Fig. 17, in which the desired mechanical properties can govern the thermal history to be applied which further on implies effects on the microstructure. Further more, the actual thermal progress can affect the mechanical properties by changes in phase composition and microstructure and so forth, i.e. the relation 1 to 3 in Fig. 17 goes both ways.
Fig. 17. Interactions between mechanical properties, heat treatment and microstructure.
Relation 1, can for example include heat generation caused by friction and the actual temperature gradients in the sheet are influenced by the deformation both due to contact with the forming tools and heat generation due to deformation rate. Thermal expansion can also be found here. Relation 2, can for instance include latent heat due to phase transformations and the thermal properties of the material depend on the microstructure evolution which depend on the actual temperature. Finally, relation 3 can include volume changes due
Mechanical Properties
Governing Process
1
2
3
Heat Treatment Microstructure

42
to phase transformations and the microstructure evolution can depend on stresses and strains i.e. deformation dependant, the mechanical properties depend on the microstructure. Further connections exist. In this work the implicit finite element code MSC Marc 2003 [42] is used to
model and simulate sheet metal forming. In the actual example, symmetry conditions are applied in the model in order to limit the calculation time i.e. half the sheet plate is modelled according to Fig. 18 in which an analysis of the isothermal sheet metal forming test at 400°C is presented.
(a) (b)
Fig. 18. FE analysis of sheet metal forming of Ti-6242 at two different states in the forming sequence.
Further improvements of the model are however required. Difficulties occur in the modelling of the contact between the sheet and the forming tool and a rather coarse mesh is used. However, the initial result presented in Fig. 19 indicates that, with model improvements, the present forming process can be predicted. In this isothermal analysis four-node bilinear thin shell elements are used. The full Newton-Raphson iterative procedure is applied. The updated Lagrangian procedure is employed, which is widely used in large strain plasticity problems. The material of the forming tool is considered rigid. The contact between the sheet and the forming tools is modelled by a stick-slip friction model with initial contact and a friction coefficient of 0.05. In order to improve the detection of contact between the bodies a distance tolerance bias has been set, penetration check also occurs at every iteration. When temperature gradients must be considered, i.e. when forming tool and
sheet specimen possess different temperatures, coupled thermo-mechanical analyses must be performed.

43
Fig. 19. Measured and calculated forming force for isothermal forming at 400ºC in Ti-6242.
0 2 4 60
20
40
60
80
Time (sec)
For
ce (
kN)
Exp 14−no.3
FEA1

44
6. SUMMARY OF APPENDED PAPERS
6.1 Paper A In this paper, an investigation of the use of inverse modelling for estimation of material model parameters is presented. The considered experiment is a compression test of forged Ti-6Al-4V. The thermo-mechanical material response at investigated conditions was studied and changes in the microstructure as a consequence of heat treatment and deformation were also investigated. With reference to paper A, it was found that the alloy exhibit initial material
hardening followed by specimen cracking at the lower temperatures, from room temperature to 300ºC. The cracks leading to fracture were seen to originate at the corners of the samples and to grow in a diagonal mode to the loading direction. For temperatures at 700˚C and 900˚C the tests indicated material hardening followed by flow softening while at 500˚C the initial hardening was followed by ideal plastic behaviour. Ti-6Al-4V was found to be strain rate sensitive and the strain rates tested range from 0.05 s-1 to 5 s-1, no clear difference could be seen between the strain rates of 0.05 s-1 and 0.5 s-1,but at the higher strain rate flow softening occur. This softening was caused by formation of adiabatic shear bands in which the temperature increases. The temperature increase was measured to approximately 70 C during the deformation process. The alpha platelets in the Widmanstätten structure were increasingly broken up going from the less deformed anvil contact region into the more deformed centre of the specimen, c.f. Fig 20.
Fig. 20. Microstructure of sample isothermally compressed at 700 C, presented in paper A.The loading direction is horizontal in the figure.
45
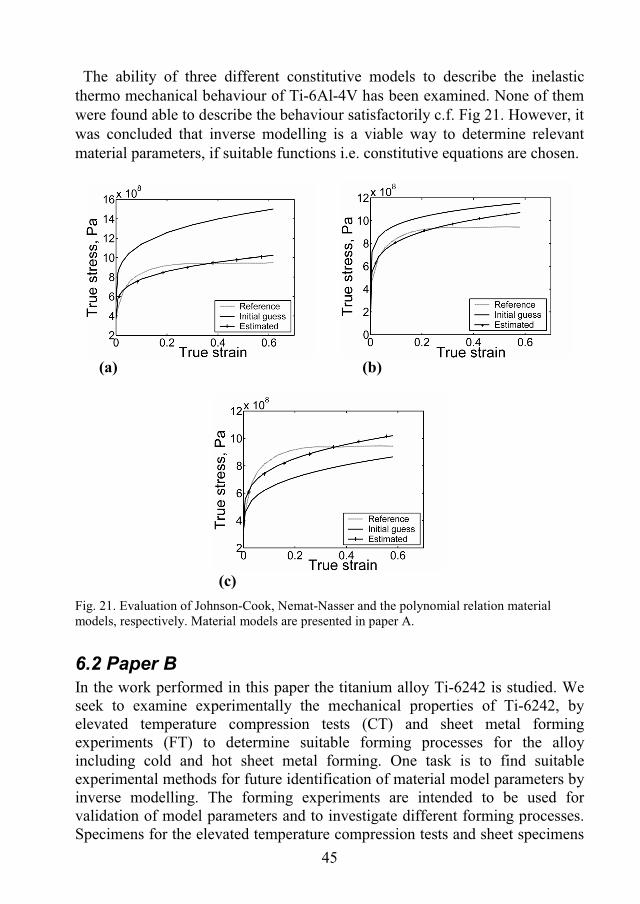
The ability of three different constitutive models to describe the inelastic thermo mechanical behaviour of Ti-6Al-4V has been examined. None of them were found able to describe the behaviour satisfactorily c.f. Fig 21. However, it was concluded that inverse modelling is a viable way to determine relevant material parameters, if suitable functions i.e. constitutive equations are chosen.
(a) (b)
(c)Fig. 21. Evaluation of Johnson-Cook, Nemat-Nasser and the polynomial relation material models, respectively. Material models are presented in paper A.
6.2 Paper B In the work performed in this paper the titanium alloy Ti-6242 is studied. We seek to examine experimentally the mechanical properties of Ti-6242, by elevated temperature compression tests (CT) and sheet metal forming experiments (FT) to determine suitable forming processes for the alloy including cold and hot sheet metal forming. One task is to find suitable experimental methods for future identification of material model parameters by inverse modelling. The forming experiments are intended to be used for validation of model parameters and to investigate different forming processes. Specimens for the elevated temperature compression tests and sheet specimens

46
for the forming tests are extracted from two different duplex annealed sheet metal plates of Ti-6242. In the compression tests, initial material hardening is observed followed by
specimen cracking at the lower temperatures, 400 to 600°C. Tests at 700 to 900˚C indicate material hardening followed by a peak stress and subsequent flow softening, c.f. Fig. 22(a). The three curves in Fig. 22(b) displays the strain rate sensitivity at 800°C, of the alloy at strain rates 0.05 to 1 s-1. The material is also found to possess anisotropic elastic as well as anisotropic plastic properties.
0 0.1 0.2 0.3 0.4 0.5 0.60.60
500
1000
1500
True strain
Tru
e st
ress
(M
Pa)
0.05 (1/s)
400°C500°C
600°C
700°C
800°C900°C
0 0.1 0.2 0.3 0.4 0.5 0.6 0.70
100
200
300
400
500
600
700
True strain
Tru
e st
ress
, (M
Pa)
800°C
0.5 (1/s)1 (1/s)
0.05 (1/s)
(a) (b) Fig. 22. Typical true stress-strain relations at indicated strain rates and temperatures.
A number of sheet metal forming tests are performed in which the temperature of both the sheet specimens and the forming tools are varied. Process parameters are studied, references are made to paper B. The forming tool is constructed with respect to the theoretical minimum bend radius in room temperature. Forming in room temperature can not be completed successfully, fracture occurs during the forming sequence, c.f. 23(a) and 24 for an example.

47
0 0.01 0.02 0.03 0.04 0.050
10
20
30
40
50
60
70
Displacement (m)
For
min
g fo
rce
(kN
)Longitudinal
Transverse
5 (mm/s)
Fracture
Fracture
0 0.01 0.02 0.03 0.04 0.050
10
20
30
40
50
60
70
80
Displacement (m)
For
min
g fo
rce
(kN
)
400°C/5/400°C
400°C/5−L/400°C
400°C/10/400°C
700°C/5/400°C
(a) (b) Fig. 23. Compression force vs. stroke displacement indicated forming velocities and extraction directions of sheet specimens (a) forming in room temperature and (b) at indicated initial temperatures (initial sheet specimen, temperature/forming velocity/tool temperature).
(a) (b)
Fig. 24. Fracture characteristics during forming sequence for the test with forming velocity 5 mm/s, (L). (a) loading and (b) first fracture
Forming with preheated sheet specimens with room tempered forming tools and forming with preheated sheet specimens with heated forming tools are however successful, c.f. Fig 23 (b) for examples. The spring back characteristics under the current circumstances are detected,
it was found that the spring back behaviour is altering when sheets are formed with a starting temperature of ~400ºC compared to when sheets are formed with a starting temperature of ~700ºC c.f. Fig 25. The minimum springback is obtained by hot isothermal forming at 400°C applying a subsequent holding time of 15 minutes in heated forming tools (400°C).

48
(a) (b) Fig. 25. Schematic illustration of final shapes of formed sheet plates, a) tests with starting temperature approximately 400ºC and b) tests with starting temperature approximately 700ºC.
As-received microstructures of the two sheet metals are presented in Fig. 26(a) and (b). Regions of more highly deformed grains are noticeable in the material. It was found that the microstructures of the two sheet metals differ with respect to grain size, the sheet metal used in the sheet metal forming tests posses a finer structure c.f. Fig 26(a) and (b).
(a) (b) Fig. 26. As-received microstructure of (a) sheet metal for CT, rolling direction are vertical in this figure and (b) sheet metal for FT, rolling direction are horizontal in this figure.
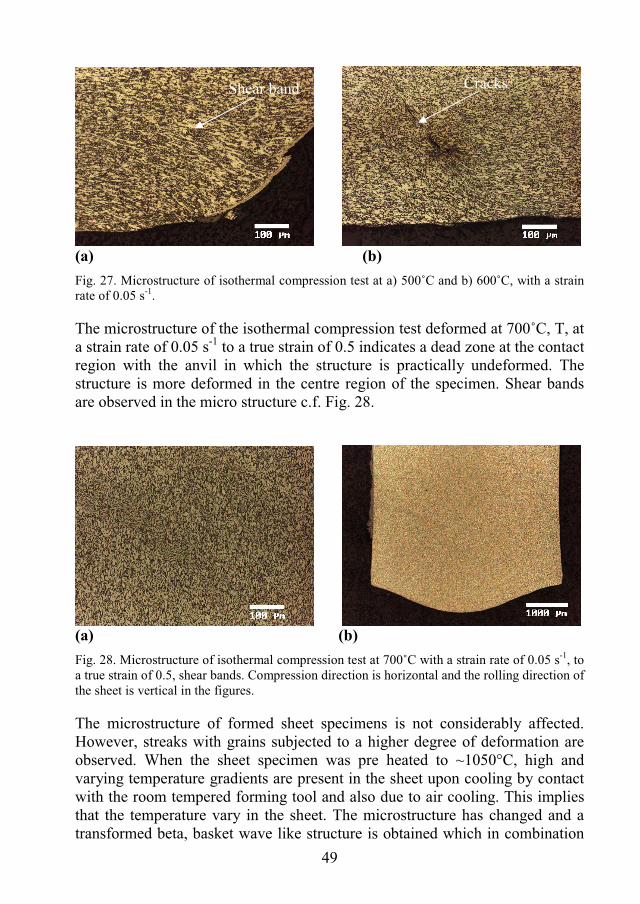
During compression tests performed in the temperature range 400 to 600°C, specimen failure occurred, in which the fracture pieces of broken samples were sheared in a diagonal mode to the loading direction. In Fig. 27 shear bands of isothermal compression at 500 and 600˚C are presented. It is obvious that cracks have formed within the sheared band in the test conducted at 600˚C, c.f. Fig. 27(b).
49
(a) (b)Fig. 27. Microstructure of isothermal compression test at a) 500˚C and b) 600˚C, with a strain rate of 0.05 s-1.
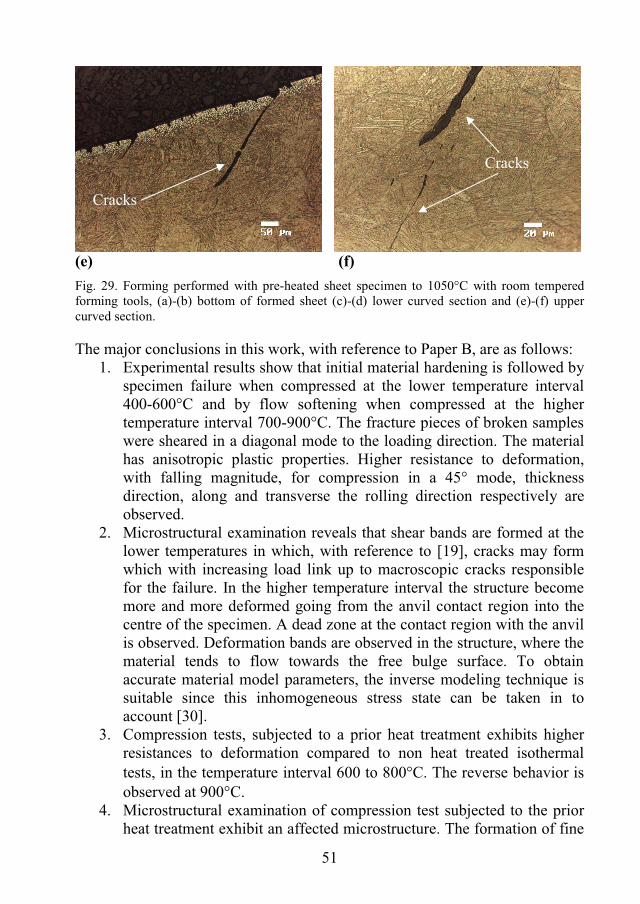
The microstructure of the isothermal compression test deformed at 700˚C, T, at a strain rate of 0.05 s-1 to a true strain of 0.5 indicates a dead zone at the contact region with the anvil in which the structure is practically undeformed. The structure is more deformed in the centre region of the specimen. Shear bands are observed in the micro structure c.f. Fig. 28.
(a) (b) Fig. 28. Microstructure of isothermal compression test at 700˚C with a strain rate of 0.05 s-1, to a true strain of 0.5, shear bands. Compression direction is horizontal and the rolling direction of the sheet is vertical in the figures.
The microstructure of formed sheet specimens is not considerably affected. However, streaks with grains subjected to a higher degree of deformation are observed. When the sheet specimen was pre heated to ~1050°C, high and varying temperature gradients are present in the sheet upon cooling by contact with the room tempered forming tool and also due to air cooling. This implies that the temperature vary in the sheet. The microstructure has changed and a transformed beta, basket wave like structure is obtained which in combination
Shear band Cracks

50
with the formed alpha case imply less ductility of the alloy. It is obvious that alpha case has formed in which micro cracks form upon loading, especially in bending, which grow with increasing load c.f. Fig. 29. The temperature at the fractured section of the sheet may also have been lower in comparison, implying even less ductility of the material. This in combination cause failure to occur during the forming despite the fact that the overall temperature during forming is equal or even higher compared to forming sheet specimens pre heated to ~700°C, where the forming was successful. The largest number and greatest micro cracks could be found at the outer edge in the upper curved section close to where fracture occurred.
(a) (b)
(c) (d)
Micro cracks
51
(e) (f) Fig. 29. Forming performed with pre-heated sheet specimen to 1050°C with room tempered forming tools, (a)-(b) bottom of formed sheet (c)-(d) lower curved section and (e)-(f) upper curved section.
The major conclusions in this work, with reference to Paper B, are as follows: 1. Experimental results show that initial material hardening is followed by
specimen failure when compressed at the lower temperature interval 400-600°C and by flow softening when compressed at the higher temperature interval 700-900°C. The fracture pieces of broken samples were sheared in a diagonal mode to the loading direction. The material has anisotropic plastic properties. Higher resistance to deformation, with falling magnitude, for compression in a 45° mode, thickness direction, along and transverse the rolling direction respectively are observed.
2. Microstructural examination reveals that shear bands are formed at the lower temperatures in which, with reference to [19], cracks may form which with increasing load link up to macroscopic cracks responsible for the failure. In the higher temperature interval the structure become more and more deformed going from the anvil contact region into the centre of the specimen. A dead zone at the contact region with the anvil is observed. Deformation bands are observed in the structure, where the material tends to flow towards the free bulge surface. To obtain accurate material model parameters, the inverse modeling technique is suitable since this inhomogeneous stress state can be taken in to account [30].
3. Compression tests, subjected to a prior heat treatment exhibits higher resistances to deformation compared to non heat treated isothermal tests, in the temperature interval 600 to 800 C. The reverse behavior is observed at 900 C.
4. Microstructural examination of compression test subjected to the prior heat treatment exhibit an affected microstructure. The formation of fine
Cracks
Cracks

52
alpha platelets observed have a smaller size than in the starting material which is believed responsible for the overall hardening at temperatures below 900°C. The softer behavior at 900°C is probably due to the higher content (vol%) -phase due to equilibrium between the and phase compared to tests performed without heat treatment.
5. Sheet metal forming of Ti-6242 in room temperature could not successfully be performed with the present tool. At elevated temperatures forming is successful. However, when sheet plates are subjected to temperatures as high as 1050°C (above the -transus temperature) and with the obtained high cooling rates, a transformed beta basket wave structure is yielded. This structure implies a lower ductility of the material. This in combination with the brittle alpha case cause failure to occur during forming. Similar anisotropic behavior, in longitudinal and transverse directions, as in the compression tests were observed i.e. tests with sheet specimens extracted along the rolling direction exhibit higher resistance to deformation. Hardening behavior was also observed when formed at the higher deformation rate. Strain rate sensitivity is however insignificant under isothermal forming at 400ºC.
6. The microstructure of formed sheet plates is not considerably affected. However, streaks with grains subjected to a higher degree of deformation are observed. The embrittleness of the alloy when sheet specimens are pre-heated to 1050°C cause failure during the forming despite the fact that the over all temperature during forming is equal or even higher compared to forming sheet specimens pre heated to ~700°C.
7. Due to a change in spring-back characteristics at elevated temperatures, forming with the higher start temperature (~700°C) yields over all a higher degree of spring-back compared to forming conducted at the lower start temperature (~400°C), at measured sections. The degree of spring-back can be reduced by application of holding times at the end of the forming sequence. The best final shape was obtained by hot isothermal forming at 400°C applying a subsequent holding time of 15 minutes.
8. The material thinning of formed sheet plates are minute. However, the extreme value of material thinning was observed in the test with pre-heated sheet specimens to about 700ºC and formed with room tempered tools.
9. The use of boron nitride as a lubricant in the forming process was shown to be important to prevent sheet specimens form sticking or sliding causing out of line placement. The friction coefficient increases

53
and the sensitivity to evenness and smoothness of the tool surfaces become even more important when forming without lubricants.
10. It can be concluded that, under the current conditions, Ti-6242 is suitable to form by hot sheet metal forming. Forming isothermally at 400°C is to prefer since it yields a smaller degree of spring back, especially when holding times are applied. If proper material models are chosen and accurate material model parameters are obtained, FE analyses can be used for the prediction of hot sheet metal forming of Ti-6242. Process parameters and tool geometry can then be studied by means of FE analyses. The final material state can be determined by the includance of models for phase transformation and micro structure evolution. It is however of great importance to assure that experimental data are reproducible in order to obtain accurate model parameters.

54
7. CONCLUSIONS AND FUTURE WORK The objective of this thesis was to establish an experimental foundation and
comprehension on the thermo-mechanical behaviour of the titanium alloys Ti-6Al-4V but foremost Ti-6242, and to procure a good understanding of the possibilities and difficulties of used testing methods. Furthermore, experimental data are used to obtain constitutive material model parameters through force and displacement from elevated temperature compression tests by inverse modelling. Experimental data are also used in finite element (FE) analyses for the prediction of sheet metal forming in Ti-6242. Cold and hot sheet metal forming tests of Ti-6242 is performed in order to evaluate suitable sheet metal forming processes for the alloy. Generated data and results also serve as validation tests for the correlation of numerical models. All to be used in the process of giving rise to a methodology resulting in inexpensive, high quality material descriptions for manufacturing and functional simulations in the concept phase of the product development process. The methodology will state a course of action when new materials or applications are considered and functions as a bank of knowledge which promotes the efficiency in identifying high quality material descriptions. Previously generated knowledge and experience can effectively be used and put into practice. Furthermore, the process of interest should govern the choice of suitable experimental methods and material models. The desired accuracy of numerical predictions of the process should govern the required degree of model complexity. That is, to start simple and increase the test and model complexity as needed. Material experiments and methods suitable for estimation of material
parameters have been identified. Furthermore, suitable range of parameters for the sheet metal forming process of Ti-6242 is indicated. For example, certain combinations of forming temperature and forming velocity yields unwanted effects, e.g. microstructure causing low ductility and formation of micro-cracks which even cause fracture. On the other hand, desired resultant microstructure and properties are possible to obtain by choosing suitable temperature (of the sheet specimens and forming tools), holding time and forming velocity. The studied finite element models will be continuously improved i.e. to
comprise further material models when needed. Of interest are models for anisotropy, if required elastic anisotropy, phase transformation, microstructure evolution and creep. It is of interest to predict the resultant material state (i.e. residual stress state, mechanical properties, resultant phase composition and microstructure) and geometry. The future work will be directed to parameter estimation by inverse modelling of Ti-6242 to be used in numerical predictions of sheet metal forming. The actual state predicted by FE analyses of sheet metal forming can be used as input for analyses of subsequent operations e.g.

55
welding analyses or heat treatment analyses. This would allow for simulation of a whole manufacturing chain, from titanium sheet blanks to complete component, and the resultant material state and mechanical properties can thereby be predicted.

56
REFERENCES
[1] A. Tarantola, Inverse Problem Theory – Methods for Data Fitting and Model Parameter Estimation, Elsevier, 1987.
[2] M. C. F. Eriksson, Doctoral Thesis 2002:19, Luleå University of Technology, Sweden, May 2002.
[3] P. Åkerstöm, Licentiate Thesis 2004:28, Luleå University of Technology, Sweden, May 2004.
[4] P. Åkerstöm, B. Wikman, M. Oldenburg, Material parameter estimation for a boron steel from simultaneous cooling and compression experiments, Accepted for publication in: Modelling Simulation Mater. Sci. Eng.
[5] Materials Properties Handbook: Titanium alloys, ASM International, 1994, 483-636.
[6] Titanium, G. Lütjering, J. C. Williams, Springer-Verlag Berlin Heidelberg, 2003.
[7] R. Pederson, Licentiate Thesis 2002:30, Luleå University of Technology, Sweden, May 2002.
[8] Metals Handbook, Desk edition, 2. Edition, Materials Park, Ohio, ASM International, 1998.
[9] W. F. Hosford, R. M. Caddell, Metal Forming – Mechanics and Metallurgy, Second edition, PTR Prentice-Hall, Inc., 1993.
[10] N.S. Ottosen, M. Risinmaa, The Mechanics of Constitutive Modelling, vol. 1, Classical topics, Division of Solid Mechanics, Lund University, 1999.
[11] J. F. Thomas, Jr., S. I. Oh, H. L. Gegel, Sheet forming of titanium alloys, Metallurgical Society of AIME, Conference proceedings, C1982, pp 81-100, 1982
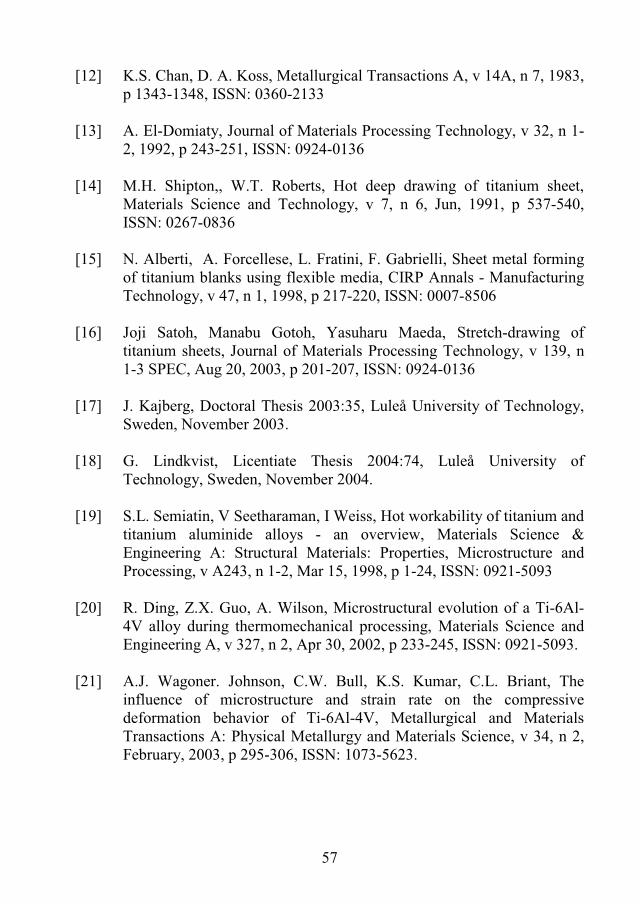
57
[12] K.S. Chan, D. A. Koss, Metallurgical Transactions A, v 14A, n 7, 1983, p 1343-1348, ISSN: 0360-2133
[13] A. El-Domiaty, Journal of Materials Processing Technology, v 32, n 1-2, 1992, p 243-251, ISSN: 0924-0136
[14] M.H. Shipton,, W.T. Roberts, Hot deep drawing of titanium sheet, Materials Science and Technology, v 7, n 6, Jun, 1991, p 537-540, ISSN: 0267-0836
[15] N. Alberti, A. Forcellese, L. Fratini, F. Gabrielli, Sheet metal forming of titanium blanks using flexible media, CIRP Annals - Manufacturing Technology, v 47, n 1, 1998, p 217-220, ISSN: 0007-8506
[16] Joji Satoh, Manabu Gotoh, Yasuharu Maeda, Stretch-drawing of titanium sheets, Journal of Materials Processing Technology, v 139, n 1-3 SPEC, Aug 20, 2003, p 201-207, ISSN: 0924-0136
[17] J. Kajberg, Doctoral Thesis 2003:35, Luleå University of Technology, Sweden, November 2003.
[18] G. Lindkvist, Licentiate Thesis 2004:74, Luleå University of Technology, Sweden, November 2004.
[19] S.L. Semiatin, V Seetharaman, I Weiss, Hot workability of titanium and titanium aluminide alloys - an overview, Materials Science & Engineering A: Structural Materials: Properties, Microstructure and Processing, v A243, n 1-2, Mar 15, 1998, p 1-24, ISSN: 0921-5093
[20] R. Ding, Z.X. Guo, A. Wilson, Microstructural evolution of a Ti-6Al-4V alloy during thermomechanical processing, Materials Science and Engineering A, v 327, n 2, Apr 30, 2002, p 233-245, ISSN: 0921-5093.
[21] A.J. Wagoner. Johnson, C.W. Bull, K.S. Kumar, C.L. Briant, The influence of microstructure and strain rate on the compressive deformation behavior of Ti-6Al-4V, Metallurgical and Materials Transactions A: Physical Metallurgy and Materials Science, v 34, n 2, February, 2003, p 295-306, ISSN: 1073-5623.

58
[22] V. Kailas, Satish, Y.V.R.K Prasad, S.K Biswas, Flow instabilities and fracture in Ti-6Al-4V deformed in compression at 298 K to 673 K, Metallurgical and Materials Transactions A: Physical Metallurgy and Materials Science, v 25A, n 10, Oct, 1994, p 2173-2179, ISSN: 1073-5623
[23] Woei-Shyan Lee, Ming-Tong Lin, Effects of strain rate and temperature on the compressive deformation behaviour of Ti-6Al-4V alloy, Journal of Materials Processing Technology, v 71, n 2, Nov 15, 1997, p 235-246, ISSN: 0924-0136
[24] V Seetharaman, L Boothe, C.M Lombard, Compressive deformation behavior of a Ti-6Al-4V alloy at high temperatures and strain rates, Proc Symp Microstruct Prop Relat Titanium Aluminides Alloys Presented 90 TMS Fall Meet, 1991, p 605-622, ISBN: 0-87339-130-6
[25] S. L. Semiatin, G. D. Lahoti, Deformation and Unstable Flow in Hot Forging of Ti-6Al-2Sn-4Zr-2Mo-0.1Si, Metallurgical Transactions A, v 12A, n 10, Oct, 1981, p 1705-1717.
[26] S. L. Semiatin, G. D. Lahoti, The occurrence of shear bands in isothermal, hot forging, Metallurgical Transactions, v 13A, n 2, Feb, 1982, p 275-288, ISSN: 0360-2133
[27] S. L. Semiatin, G. D. Lahoti, Occurrence of shear bands in nonisothermal, hot forging of Ti-6Al-2Sn-4Zr-2Mo-0. 1Si, Metallurgical Transactions A, v 14A, n 1, Jan, 1983, p 105-115, ISSN: 0360-2133
[28] P. Dadras, J. F. Jr. Thomas, Characterization and Modeling for Forging Deformation of Ti-6Al-2Sn-4Zr-2Mo-0.1Si, Metallurgical Transactions A, v 12A, n 11, Nov, 1981, p 1867-1876, ISSN: 0360-2133.
[29] W. D. Callister, Jr., Materials Science and Engineering, Fourth Edition, John Whiley & Sons, Inc, 1997, p 34-43, ISBN: 0-471-13459-7
[30] G. R. Johnson, W. H. Cook in the 7th International Symposium on Ballistics, The Hague, The Netherlands, 1983.
59
[31] S. Nemat-Nasser, W.-G. Guo, V.F. Nesterenko, S.S. Indrakanti, Y.-B. Gu, Dynamic response of conventional and hot isostatically pressed Ti-6Al-4V alloys: Experiments and modeling, Mechanics of Materials, v 33, n 8, August, 2001, p 425-439, ISSN: 0167-6636.
[32] S. Nemat-Nasser, Placticity – A Treatise on Finite Deformation of Heterogenous Inelastic Materials, Cambridge University, 2004, ISBN: 0 521 83979 3.
[33] ASM Metal Handbook, vol 3, pp. 351-418, 1980
[34] N.S. Ottosen, M. Risinmaa, The Mechanics of Constitutive Modelling, vol. 2, Numerical and Thermodynamical Topics, Division of Solid Mechanics, Lund University, 1999.
[35] P. Gudmundson, Material Mechanics, KTH Solid Mechanics, Stockholm, 2004.
[36] H. Lundh, Grundläggande hållfasthetslära, Institutionen för hållfasthetslära, KTH, 2000, ISBN: 91-972860-2-8.
[37] Tamas Reti, Zoltan Fried, Imre Felde, Computer simulation of steel quenching process using a multi-phase transformation model, Computational Materials Science, vol 22, pp 261-278, 2001
[38] A. Molinari, G. R. Canova, S. Ahzi, A self consistent approach of the large deformation polycrystal viscoplasticity, Acta metall, vol 35, no. 12, pp 2983-2994, 1987.
[39] G. Lindkvist, Master Thesis 2001:307, Luleå University of Technology, Sweden, November 2001.
[40] T. H. Rowan, Doctoral Thesis, University of Texas at Austin, Texas, USA, chapter 5, May, 1990.
[41] B. Wikman and G. Bergman, Technical Report 2000:27, Luleå University of Technology, December 2000.
[42] MSC. Marc, Product Documentation, vol. A-E, 2002.

60
APPENDIX
A. Material Testing of Ti-6Al-4V The test material used for the elevated temperature compression tests, so called Gleeble tests, is a Ti-6Al-4V forging received from Volvo Aero Corporation in Trollhättan. The chemical composition for the material is presented in table 4.
Table 4. Chemical composition of Ti-6Al-4V alloy (wt%)
Material Al V Fe Si C Cu O N H B Y Ti Ti-6Al-4V 6.20 4.10 0.19 0.04 0.01 0.01 0.18 0.005 0.0024 <0.001 <0.001 Bal.
Fig. 30 and 31 shows the as-received microstructure of the material. The microstructure consists of equiaxed primary grains (white) surrounded by Widmanstätten structure. The volume fraction of primary in the as-received material is determined to ~34 %.
Fig. 30. As-received microstructure, (110X).

61
Fig. 31. As-received microstructure, (450X).
Experimental Specification The specimens are small and cylindrical as shown in Fig. 32, the dimensions are determined with respect to the desired cooling rate.
Fig. 32. Dimensions of cylindrical test specimens.
All specimens, except the isothermal test at 900°C - test 1), have dimensions according to Fig. 32. The specimen for test 1) has a diameter of 6 mm and a height of 8 mm. The tests are performed in vacuum, pressure < 0.1 torrs (13.33 Pa). Three sets of tests and one thermal dilatation test are defined, described
below.
Isothermal Tests Six isothermal tests are performed, all with a heating rate of approximately 10 C/sec up to 950 C followed by a holding, at this temperature, for 20 minuets. The main purpose of the heat treatment is to accomplish both a relief of residual stresses, caused by the machining process to produce the test specimens, and to reach equilibrium between the - and -phase. Due to

62
limitations on the Gleeble 1500 machine regarding the resistance to high temperatures and also to avoid further time-dependence of the phases, a rather rapid cooling rate has been chosen. The following procedures, for tests 1- 6, are described below:
Test 1) The temperature is reduced from 950 C to 900 C with a cooling rate of 25 C/sec followed by an isothermal hold of approximately 10 seconds (in order to make a few adjustments of the control system for reliable results) and thereafter performance of an isothermal compression of true strain true =
0.693 (engineering strain eng = 0.5) with a strain rate of = 0.05 s-1. This gives the total compression time
t = 86.1305.0693.0true seconds.
Finally the specimen is cooled down to 25 C. See Fig. 33.
Test 2) Temperature reduction from 950 C to 700 C with the same cooling rate as above followed by an isothermal hold of approximately 10 seconds (in order to make a few adjustments of the control system for reliable results). After that an isothermal compression of true strain true = 0.693 (engineering strain eng = 0.5) with strain rate as test 1) above. This gives, as before, the total compression time, t = 13.86 seconds. Finally the specimen is cooled down to 25 C. See Fig. 33.
Test 3) Same as above but with a temperature reduction from 950 C to 500 C. See Fig. 33.
Test 4) Same as above but with a temperature reduction from 950 C to 300 C. See Fig. 33.
Test 5) Same as above but with a temperature reduction from 950 C to 100 C. See Fig. 33.
Test 6) Same as above but with a temperature reduction from 950 C to 25 C. See Fig. 33.

63
Fig. 33. Temperature history diagram for isothermal compression tests.
Compression during Continuous Cooling In this set of tests, three tests are defined, the compression during continuous
cooling is performed with a strain rate of = 0.05 s-1 and to a final true strain of true = 0.693. Three tests were chosen in order to achieve acceptable overlaps, see Fig. 34 and 35. These tests are conducted in order to obtain additional information from the tests.
Cooling range: 950 C 25 CCooling rate: 25 C/sec
Strain rate, : 0.05 s-1
Total cooling time, ttot: 925 / 25 = 37 sec Compression time/specimen, ti: 0.69 / 0.05 = 13.8 sec Temperature drop/specimen: 13.8 * 25 = 345 C

64
Start/Stop Temperatures for Compression during Continuous Cooling Tests
0
200
400
600
800
1000
1 2 3
Specimen number
Tem
pera
ture
(deg
.C)
Start temperatureStop temperature
Fig. 34. Start and stop temperatures during compression during continuous cooling test.
Fig. 35. Compression during continuous cooling test.
Strain Rate Dependence In order to detect the strain rate sensitivity of the alloy, two more
experiments are defined. The strain rates examined are
1 = 0.05 s-1 (already performed in 1.Isothermal Tests)
2 = 0.5 s-1
3 = 5 s-1
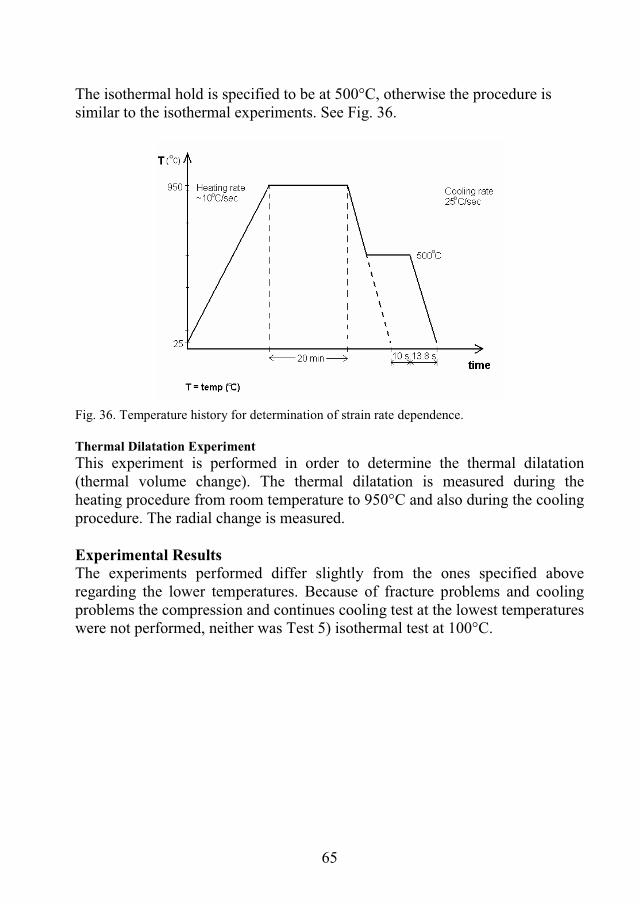
65
The isothermal hold is specified to be at 500°C, otherwise the procedure is similar to the isothermal experiments. See Fig. 36.
Fig. 36. Temperature history for determination of strain rate dependence.
Thermal Dilatation Experiment This experiment is performed in order to determine the thermal dilatation (thermal volume change). The thermal dilatation is measured during the heating procedure from room temperature to 950°C and also during the cooling procedure. The radial change is measured.
Experimental Results The experiments performed differ slightly from the ones specified above regarding the lower temperatures. Because of fracture problems and cooling problems the compression and continues cooling test at the lowest temperatures were not performed, neither was Test 5) isothermal test at 100°C.

66
Isothermal Tests
Fig. 37. True stress – true strain curves at different temperatures with a strain rate of 0.05 s-1.
Fig. 38. True stress – true strain curves at different temperatures with a strain rate of 0.05 s-1.
500 C
700 C
900 C
300 C25 C
Specimen fracture
20 min
5 min
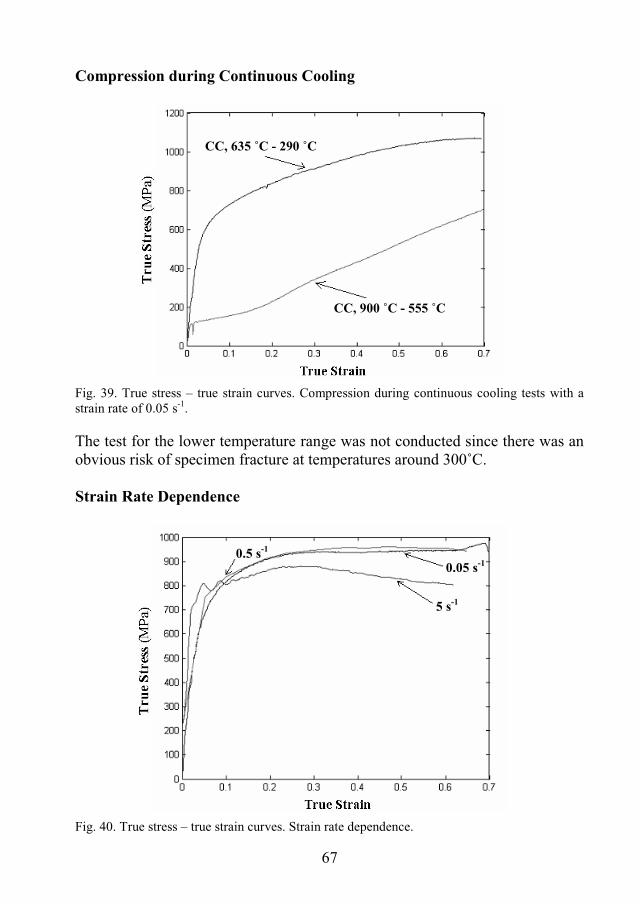
67
Compression during Continuous Cooling
Fig. 39. True stress – true strain curves. Compression during continuous cooling tests with a strain rate of 0.05 s-1.
The test for the lower temperature range was not conducted since there was an obvious risk of specimen fracture at temperatures around 300˚C.
Strain Rate Dependence
Fig. 40. True stress – true strain curves. Strain rate dependence.
CC, 635 ˚C - 290 ˚C
CC, 900 ˚C - 555 ˚C
0.05 s-1
5 s-1
0.5 s-1

68
Thermal Dilatation Experiment The thermal dilatation test is performed after heat treatment and during cooling of the specimen.
Fig. 41. Thermal dilatation, diametric change in %.
Received Microstructures The received microstructure of the isothermal experiment at 500˚C and at a strain rate of 0.05 s-1 has been examined using optical microscopy c.f. Fig. 42 to 44.
Fig. 42. Received microstructure at top of the specimen where contact with the anvil has occurred, (440X).
Temperature (˚C)

69
Fig. 43. Received microstructure at the curvature, cross section of specimen, (440X).
Fig. 44. Received microstructure at centre, cross section of specimen, (440X).
The volume fraction of primary -phase is estimated to ~38 %. When the microstructures are studied and compared to the as-received microstructure it is clear that the primary alpha and Widmanstätten structure are deformed due to compression, especially at mid height of the specimen, see Fig. 44. Fig. 42 indicates no visible change in the primary alpha or the Widmanstätten structure. Fig. 43 shows that the microstructure at the free surface of the specimen has formed an oxide layer, so-called -case, that is brittle. Micro hardness tests has been performed which clearly states that oxygen has dissolved from the oxide into the under lying metal. The hardness has increased from ~400 HV some distance from the -case to approximately 650 – 700 HV at the -case. The upper and lower edge of the specimen does not show this pronounced affect. Micro hardness tests show an increase of approximately 100 HV, from ~440 HV some distance from the edge to ~560 HV at the edge.


Paper A


1
Numerical and Microstructural Evaluation of Elevated Temperature Compression Tests on Ti-6Al-4V
E.-L. Westman, R. Pederson, B. Wikman, M. Oldenburg Luleå University of Technology, Luleå, Sweden
Abstract
An investigation of the use of inverse modeling for estimation of material model parameters, of a compression test of forged Ti-6Al-4V, is presented. The compression tests performed on cylindrical specimens indicated that initial material hardening was followed by specimen cracking at lower temperatures while at 700˚C and 900˚C material hardening was followed by flow softening. The alloy was also found to be strain rate sensitive. The ability of three different constitutive models to describe the inelastic thermo mechanical behavior of Ti-6Al-4V has been examined and none of them were found able to describe it satisfactorily. However, it was shown that inverse modeling is a viable way to determine relevant material parameters, if suitable functions are chosen. Changes in the microstructure as a consequence of heat treatment and deformation were also investigated. In general, it was found in cross sections parallel to the loading direction, that the deformation was non-uniform and concentrated in bands going diagonally from one corner to the other. The alpha platelets in the Widmanstätten structure were increasingly broken up going from the less deformed anvil contact region into the more deformed center of the specimen.
1. Introduction Ti-6Al-4V is a commonly used alloy in aerospace applications such as
turbine engines and airframes. In industrial applications it is often of great importance to know the thermo-mechanical properties of the material and to be able to predict and detect changes in these properties. Another need for accurate material property data stems from the industrial requirement to perform numerical analyses at different stages in the product development process. This could be simulation of a manufacturing process such as welding or forming, or it could be the function analysis of a component. In order to perform high quality FE-analyses, accurate model input is crucial.

2
Consequently, the development of appropriate constitutive models for Ti-6Al-4V for various applications is a central issue. It is also essential to emphasize the use of proper routines for efficient application of numerical modeling of industrial processes.
Traditional methods to determine necessary property data in which the material is characterized by several tension and/or compression tests at different temperatures and strain rates is time demanding and expensive and the results are often not in an appropriate form. An alternative route is to obtain material parameters trough force and displacement by inverse modeling [1]. Inhomogeneous stress conditions can be taken into account, which is of great benefit, in contrast to traditional methods where a homogenous stress distribution is assumed. The idea is to create different deformation mechanisms in one test. For the accurate modeling of processes such as forming inverse modeling has [2,3] been shown to generate more accurate material data compared to traditional experiments, and usually requires a reduced number of experiments [2].
2 Experimental procedure The starting material was in the form of cylindrical test specimens of Ti-6Al-4V cut out from a forged jet engine compressor disc. Specimen dimensions were 4.0 x 5.5 mm or 6.0 x 8.0 mm (Test 1), the dimensions depending on the desired cooling rate. The microstructure was bimodal consisting of about 34 vol% equiaxed primary alpha ( p) particles and 66 vol% of a Widmanstätten type structure. The chemical composition of the alloy was (in wt%): 6.20 Al, 4.10 V, 0.19 Fe, 0.04 Si, 0.01 Cu, 0.01 C, 0.18 O, 0.005 N, 0.0024 H, <0.001 B, <0.001 Y, and Ti balance.
A Gleeble 1500 thermo mechanical simulator with lengthwise strain control was used to perform axial compression tests. The test specimens were placed between two tungsten carbide anvils, coated with a film of graphite and tantalum to minimize friction and prevent sticking between the anvils and the specimen. Resistance heating of the specimen permitted high temperatures and rapid heating/cooling rates. The temperature was measured using a Pt/PtRh-thermocouple welded onto the surface and at mid height of the specimens. The tests were performed in an evacuated chamber (0.1 torr). During the testing sequence, the axial and radial displacements together with axial compression force and temperature were measured continuously.
Two sets of tests were performed as described in section 2.1 and 2.2. Prior to deformation, all specimens were heated up (10 C/s) to an equilibrium temperature of 950 C and kept there for 20 minutes before cooling down to the

3
desired test temperature. The main purpose of this heat treatment was both to relieve residual stresses [4], caused by the machining used to produce the specimens, and to reach an equilibrium fraction of alpha and beta phases and thereby avoid time-dependent phase transformation [5]. A rather rapid cooling rate of 25 C/s was chosen.
2.1 Isothermal compression tests at different temperatures
Six isothermal tests were performed, all heat-treated as previously described. A schematic temperature history diagram for the isothermal tests is shown in Fig. 1. After the equilibration stage the specimens were cooled to the desired testing temperature, e.g. 900 C (Test 1 in Fig. 1), which was held for 10 seconds (in order to make a few adjustments of the control system). The specimens were then compressed to a final lengthwise true strain of 0.693 at a strain rate of 0.05 s-1. Finally, the specimens were cooled down to room temperature (RT, 25 C). The same procedure was applied to Test 2-6, but at test temperatures of 700 C, 500 C, 300 C, 100 C and RT, respectively. In order to detect strain rate sensitivity, further tests were performed at higher strain rates (0.5 s-1 and 5 s-1) and at a testing temperature of 500 C (Tests 7 and 8, respectively).
2.2 Compression and continuous cooling tests
To receive more information from one single test, compression and continuous cooling tests (C-C) were performed, with the same strain rate and lengthwise strain as in Test 1-6. Two tests were chosen with certain overlaps, Tests 9 and 10. Testing in the lower temperature regime was not conducted due to problems with controlling the desired cooling rate and to fracture of specimens. A schematic temperature history diagram with start and stop temperatures for the C-C tests is shown in Fig. 2 (Test 9: 900-555 C, Test 10: 635-290 C).
Figure 1. Temperature history for isothermal tests. Figure 2. Temperature history for C-C tests.

4
3 Experimental results Experimental results for the isothermal tests are shown in Fig. 3. Initial material hardening was observed followed by specimen cracking at the lower temperatures (Tests 4, 5 and 6). Tests at 700˚C and 900˚C indicated material hardening followed by flow softening while at 500˚C the initial hardening was followed by ideal plastic behavior.
The strain rate dependence of the alloy is shown in Fig. 4; repeated tests were performed to confirm reproducibility of the experiment. It can be seen that for small strains the stress level increased with increasing strain rate, though only marginally from 0.05 to 0.5 s-1. For the highest strain rate, flow softening took place after a fluctuating material hardening behavior.
The C-C test results are shown in Fig. 5, which shall be applied in the inverse modeling in future work. The results presented in Fig. 3 to 5 include the elastic strain of the experimental equipment.
Figure 3. True stress-strain curves for Figure 4. Influence of strain rate on stress- isothermal tests, Tests 1-6. strain behaviour at 500°C, Tests 3, 7 and 8.
Figure 5. True stress-strain curves for C-C Figure 6. Temperature rise during tests,Tests 9 and 10.. deformation,Test 8.
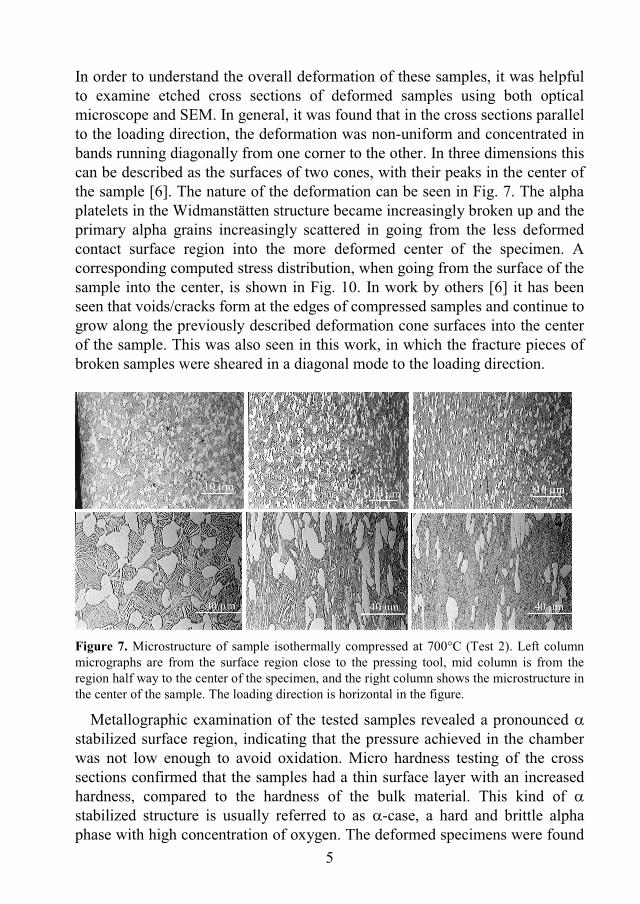
5
In order to understand the overall deformation of these samples, it was helpful to examine etched cross sections of deformed samples using both optical microscope and SEM. In general, it was found that in the cross sections parallel to the loading direction, the deformation was non-uniform and concentrated in bands running diagonally from one corner to the other. In three dimensions this can be described as the surfaces of two cones, with their peaks in the center of the sample [6]. The nature of the deformation can be seen in Fig. 7. The alpha platelets in the Widmanstätten structure became increasingly broken up and the primary alpha grains increasingly scattered in going from the less deformed contact surface region into the more deformed center of the specimen. A corresponding computed stress distribution, when going from the surface of the sample into the center, is shown in Fig. 10. In work by others [6] it has been seen that voids/cracks form at the edges of compressed samples and continue to grow along the previously described deformation cone surfaces into the center of the sample. This was also seen in this work, in which the fracture pieces of broken samples were sheared in a diagonal mode to the loading direction.
Figure 7. Microstructure of sample isothermally compressed at 700 C (Test 2). Left column micrographs are from the surface region close to the pressing tool, mid column is from the region half way to the center of the specimen, and the right column shows the microstructure in the center of the sample. The loading direction is horizontal in the figure.
Metallographic examination of the tested samples revealed a pronounced stabilized surface region, indicating that the pressure achieved in the chamber was not low enough to avoid oxidation. Micro hardness testing of the cross sections confirmed that the samples had a thin surface layer with an increased hardness, compared to the hardness of the bulk material. This kind of stabilized structure is usually referred to as -case, a hard and brittle alpha phase with high concentration of oxygen. The deformed specimens were found

6
to be non-uniformly recessed at the compression surfaces. A significant temperature rise during the deformation, in Test 8, was also detected (see Fig. 6).
4 Numerical procedure The numerical evaluation was designed to include the inhomogeneous stress development in the specimen during the deformation. Moreover, the Gleeble tests were performed in such a way that they involved simultaneously both thermal effects and deformation mechanisms. By inverse modeling of the actual experiment, material model parameters could be determined by minimizing the difference between the FE-analyses (FEA) and experimental reference data. The general idea of inverse modeling is shown in Fig. 8.
Figure 8. Schematic illustration of inverse modeling.
4.1 The direct problem
The direct problem consists of solving the FE-problem subjected to variations of material model parameters. In this work the non-linear implicit FE-code MSC.Marc has been used to set up an axi-symmetric model of the Gleeble experiments. The FE-model consists of 150 lower order quadrilateral elements and 176 nodes. Displacement boundary conditions are applied to the rigid anvils corresponding to the desired strain rate and deformation. A homogenous specimen temperature was applied in accordance with the experiment during deformation. The contact between the anvil and the specimen was modeled as a contact interface with a stick-slip friction model. The interface was assumed to be flat with a constant friction coefficient of 0.1. The mesh is shown in Fig. 9.
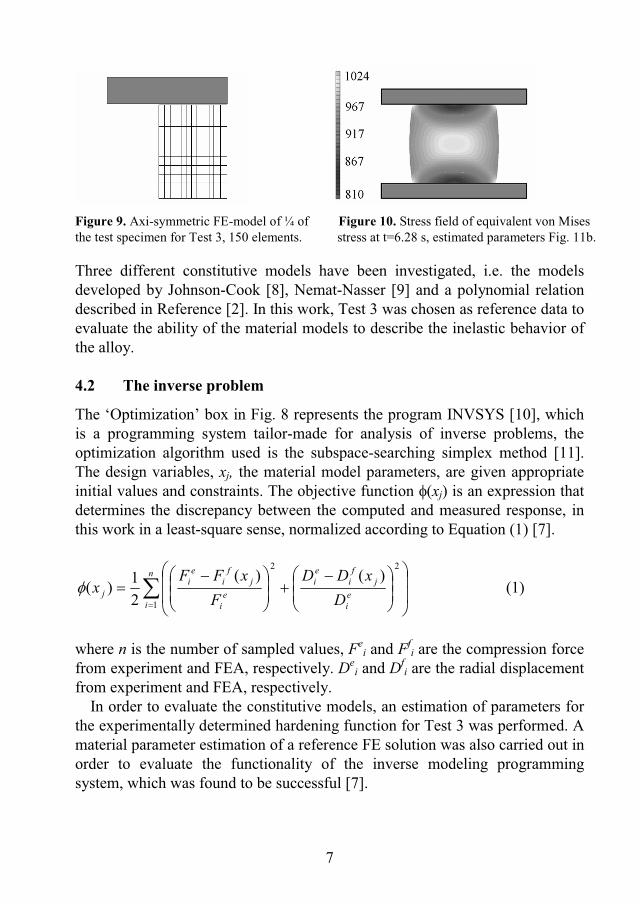
7
Figure 9. Axi-symmetric FE-model of ¼ of Figure 10. Stress field of equivalent von Mises the test specimen for Test 3, 150 elements. stress at t=6.28 s, estimated parameters Fig. 11b.
Three different constitutive models have been investigated, i.e. the models developed by Johnson-Cook [8], Nemat-Nasser [9] and a polynomial relation described in Reference [2]. In this work, Test 3 was chosen as reference data to evaluate the ability of the material models to describe the inelastic behavior of the alloy.
4.2 The inverse problem
The ‘Optimization’ box in Fig. 8 represents the program INVSYS [10], which is a programming system tailor-made for analysis of inverse problems, the optimization algorithm used is the subspace-searching simplex method [11]. The design variables, xj, the material model parameters, are given appropriate initial values and constraints. The objective function (xj) is an expression that determines the discrepancy between the computed and measured response, in this work in a least-square sense, normalized according to Equation (1) [7].
n
iei
jf
iei
ei
jf
ie
ij D
xDDF
xFFx
1
22)()(
21)( (1)
where n is the number of sampled values, Fei and Ff
i are the compression force from experiment and FEA, respectively. De
i and Dfi are the radial displacement
from experiment and FEA, respectively. In order to evaluate the constitutive models, an estimation of parameters for
the experimentally determined hardening function for Test 3 was performed. A material parameter estimation of a reference FE solution was also carried out in order to evaluate the functionality of the inverse modeling programming system, which was found to be successful [7].

8
5 Numerical results Results of the evaluation of the constitutive models with estimated parameters are presented in Fig. 11. The optimization was performed several times using different initial values of the parameters. It is important to examine the behavior of the objective function in the feasible region in order to find the acceptable minima.
Figure 11. Evaluation of Johnson-Cook, Nemat-Nasser and the polynomial relation material models, respectively.
The evaluation shows that none of the three constitutive models describes the inelastic behavior of this specific alloy satisfactorily. The three constitutive models, with estimated parameters, generate functions fairly similar to each other; there are only small differences in the behavior. A mirrored plot showing the von Mises stress of the deformed specimen, with the estimated parameters of the Nemat-Nasser material model presented in Fig. 11b, is shown in Fig. 10.

9
6 Discussion and Conclusions The samples compressed between RT and 300 C cracked during testing and the cracks leading to fracture were seen to originate at the corners of the samples and to grow in a diagonal mode to the loading direction. This is in well agreement with the simulated stress field occurring in compressed samples during testing (see Fig. 10). It is reasonable to expect that the resistance to crack initiation is reduced because of the observed -case found in the surface regions of the tested samples.
The strain rate sensitivity was examined by applying three different strain rates during isothermal deformation at 500 C, and the resulting stress-strain curves are shown in Fig. 4. No clear difference could be seen between the strain rates of 0.05 s-1 and 0.5 s-1, but at a strain rate of 5 s-1 flow softening seem to occur. This could be explained by heat generation during plastic deformation. Indication of this was found in the recorded temperature during the test (Fig. 6), where the temperature increased by approximately 70 Cduring the deformation process. If this temperature increase is high enough to cause flow softening is not yet certain, but it is possible that on a local scale (some distance from the thermocouple) the temperature increase could well be significantly higher than that recorded by the thermocouple, due to the variation in the degree of plastic deformation through the sample. The isothermal compression test conducted at 700 C with a strain rate of 0.05 s-1
(see Fig. 3) indicated a typical softening behaviour. Thus it is reasonably to suppose that the test performed at 500 C, due to the higher strain rate of 5 s-1,could have reached the softening regime observed at 700 C because of local heating in the specimen during deformation. However, it should be pointed out that no similar evidential results of local heating during the compression of Ti-6Al-4V have been found reported elsewhere. Thus, the possibility of an equipment error in the measured temperature rise cannot be ruled out. The slope of the 5 s-1 curve seems initially somewhat irregular and also steeper than for the curves at lower strain rates. This serrated form of the curve closely resembles serrated yielding, a phenomenon mainly known to occur in titanium alloys during plastic deformation at low (cryogenic) temperatures. However, similar compression experiments performed with other materials, with the same Gleeble 1500 equipment as was used in this work, produced similar types of serrated curves when high strain rates were applied. Thus, the serrated form of the curve observed here most likely stems from the equipment.
The three constitutive models that were studied in this work were not able to describe the material hardening behavior satisfactorily. A remaining challenge

10
of future work is therefore to find alternative descriptions for the material behavior. However the estimation performed to check the functionality of the inverse modeling programming system described in Reference [7] shows that inverse modeling is a viable way to determine material model parameters. It shall be mentioned that different sets of parameters can describe the same material behavior. Thus it is important that the error between the reference data and the response generated by the FE-analysis is small. The existence of a minimum for the objective function should be analyzed, since several minima often exist. Another crucial issue to investigate is the stability of the achieved solution. For instance, a flat minimum is considered non-unique, and for this reason the solution may change substantially by even small changes in the data. Thus, it is important to exclude misleading local minima by investigation of different initial guesses. In future work results from the C-C tests are to be used as reference data in order to achieve more accurate data with a reduced number of experiments.
Regarding the FE-model, the friction coefficient between the specimen and the anvils has not yet been investigated but is an important factor. It determines the shape of the billet when deformed and influences the estimated parameters, thus it should be investigated in future work. One possibility is to include the friction coefficient as a design parameter or perform parameter estimations with different friction coefficients. The foil and the recessed area at the compression surfaces of the specimen will cause difficulties in friction modeling. In order to take internal heat generation into account and to determine its effects it may also be justified to perform coupled thermo-mechanical analyses.
7 Acknowledgements The research founding by VINNOVA, grant P22122-1A, and the collaboration with Prof. Pentti Karjalainen and Ph.D. Mahesh Somani at University of Oulu, Finland, are gratefully acknowledged.
8 References 1. A. Tarantola, Inverse Problem Theory – Methods for Data Fitting and
Model Parameter Estimation, Elsevier, 1987. 2. M. C. F. Eriksson, Doctoral Thesis 2002:19, Luleå University of
Technology, Sweden, May 2002. 3. G. Lindkvist, Master Thesis 2001:307, Luleå University of Technology,
Sweden, November 2001.

11
4. Materials Properties Handbook: Titanium alloys, ASM International, 1994, p. 599.
5. R. Pederson, Licentiate Thesis 2002:30, Luleå University of Technology, Sweden, May 2002.
6. A. J. Wagoner Johnson, C. W. Bull, K. S. Kumar, C. L. Briant, Met. Mat. Trans. 34A, 2003, 295-306.
7. E.-L., Westman, Master Thesis 2003:108, Luleå University of Technology, Sweden, February 2003.
8. G. R. Johnson, W. H. Cook in the 7th International Symposium on Ballistics, The Hague, The Netherlands, 1983.
9. S. Nemat-Nasser in the IUTAM Symposium on Micro- and Macrostructural Aspects of Thermoplasticity, Kluwer Academic Publishers,1999, 101-113.
10. B. Wikman and G. Bergman, Technical Report 2000:27, Luleå University of Technology, December 2000.
11. T. H. Rowan, Doctoral Thesis, University of Texas at Austin, Texas, USA, chapter 5, May, 1990.


Paper B


1
Thermo-mechanical material response and hot sheet metal forming of Ti-6242
Eva-Lis Odenbergera*, Robert Pedersonb, Mats Oldenburga
a Department of Solid Mechanics, Luleå University of Technology, SE-971 87 Luleå, Sweden b Volvo Aero Corporation, Materials Technology, 9651RP , SE-46181 Trollhättan , Sweden
_______________________________________________________________
Abstract This paper presents the results from a study of the thermo-mechanical response of Ti-6242 in elevated temperature compression tests (CT) together with cold and hot sheet metal forming tests (FT). The suitability of different cold and hot processes for Ti-6242 sheet metal forming (isothermal and non-isothermal) is evaluated. Experimental data from the CT will be used for estimation of material model parameters (i.e. of constitutive equations). Furthermore, results from the FT will be used for validation of finite element models in which estimated material parameters are used for the prediction of sheet metal forming of Ti-6242. Specimens for the tests are extracted from two duplex annealed sheet metal plates, one thicker sheet is used for the CT and a thinner sheet for the FT. Experiments are performed in a set of tests with a broad range of temperatures, 400-900°C in CT and 20-700°C in FT. Tests are performed at strain rates and forming velocities, 0.05 – 1 s-1 and 5 – 10 mm/s, respectively. Depending on the temperature, compressive true strains of 10 to 50% are achieved. The microstructures of as-received material, deformed specimens and sheet specimens are investigated using optical microscopy. The results generated from the CT shows that initial material hardening is followed by specimen failure when compressed at the lower temperature interval 400-600°C and by flow softening when compressed at the higher temperature interval 700-900°C. The material possesses anisotropic properties. The flow stress is temperature dependent and to some extent strain rate sensitive. Deformation bands are observed where cracks may form and cause failure at the lower temperature interval. Results generated from the FT shows that forming of Ti-6242 in room temperature can not be successfully accomplished with the present tool geometry. At elevated temperatures forming is successful. However, the sheet specimens shall not be subjected to temperatures as high as 1050°C which cause embrittleness and thereby failure during forming. A change in spring-back characteristics occur at elevated temperatures, forming with the higher start temperature (~700°C) yields over all a higher degree of spring-back compared to forming conducted at the lower start temperature (~400°C). The degree of spring-back can however be reduced by application of holding times in the forming tools. The use of boron nitride as a lubricant in the forming process was found to be important. The microstructure of formed sheet plates is not considerably affected. However, streaks with grains subjected to a higher degree of deformation are observed. It can be concluded that, under the current conditions, Ti-6242 is suitable to form by hot sheet metal forming. Forming isothermally at 400°C is to prefer since it yields a smaller degree of spring back, especially when holding times are applied. Keywords: Ti-6242; Compression test; Hot sheet metal forming; Flow stress; Microstructure; Validation test, Finite element modeling
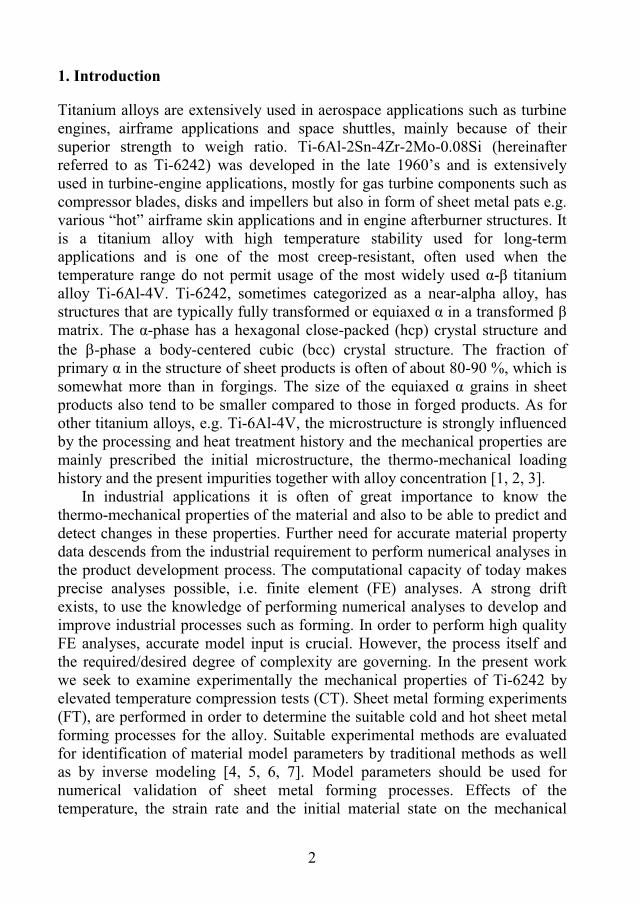
2
1. Introduction
Titanium alloys are extensively used in aerospace applications such as turbine engines, airframe applications and space shuttles, mainly because of their superior strength to weigh ratio. Ti-6Al-2Sn-4Zr-2Mo-0.08Si (hereinafter referred to as Ti-6242) was developed in the late 1960’s and is extensively used in turbine-engine applications, mostly for gas turbine components such as compressor blades, disks and impellers but also in form of sheet metal pats e.g. various “hot” airframe skin applications and in engine afterburner structures. It is a titanium alloy with high temperature stability used for long-term applications and is one of the most creep-resistant, often used when the temperature range do not permit usage of the most widely used - titanium alloy Ti-6Al-4V. Ti-6242, sometimes categorized as a near-alpha alloy, has structures that are typically fully transformed or equiaxed in a transformed matrix. The -phase has a hexagonal close-packed (hcp) crystal structure and the -phase a body-centered cubic (bcc) crystal structure. The fraction of primary in the structure of sheet products is often of about 80-90 %, which is somewhat more than in forgings. The size of the equiaxed grains in sheet products also tend to be smaller compared to those in forged products. As for other titanium alloys, e.g. Ti-6Al-4V, the microstructure is strongly influenced by the processing and heat treatment history and the mechanical properties are mainly prescribed the initial microstructure, the thermo-mechanical loading history and the present impurities together with alloy concentration [1, 2, 3].
In industrial applications it is often of great importance to know the thermo-mechanical properties of the material and also to be able to predict and detect changes in these properties. Further need for accurate material property data descends from the industrial requirement to perform numerical analyses in the product development process. The computational capacity of today makes precise analyses possible, i.e. finite element (FE) analyses. A strong drift exists, to use the knowledge of performing numerical analyses to develop and improve industrial processes such as forming. In order to perform high quality FE analyses, accurate model input is crucial. However, the process itself and the required/desired degree of complexity are governing. In the present work we seek to examine experimentally the mechanical properties of Ti-6242 by elevated temperature compression tests (CT). Sheet metal forming experiments (FT), are performed in order to determine the suitable cold and hot sheet metal forming processes for the alloy. Suitable experimental methods are evaluated for identification of material model parameters by traditional methods as well as by inverse modeling [4, 5, 6, 7]. Model parameters should be used for numerical validation of sheet metal forming processes. Effects of the temperature, the strain rate and the initial material state on the mechanical

3
properties are studied, spring-back characteristics are detected and metallographic studies are performed.
It is well known that titanium alloys are considered more difficult to form and generally have less predictable forming characteristics than other metallic alloys such as steel and aluminum. This can partly be explained by their high yield stress, y, and low elastic modulus, E, which in combination yields a high degree of spring-back when formed by cold- or hot-forming. The hexagonal crystal structure of the -phase also has anisotropic characteristics which imply consequences to the elastic properties. However, if conventional sheet metal forming is performed under favourable circumstances titanium alloys can be successfully formed into complex parts and if followed by a so called hot sizing operation, in which the part is allowed to be creep formed to the desired shape, the difficulties with spring back can be overcome. At the present, components manufactured by super plastic forming (SPF) are available, an area in which great research efforts have been made. However, even if SPF to day is a quite common manufacturing process it is often used for components with a high degree of complexity or when a substantial degree of material stretching is necessary [1, 2, 8-11].
Currently, very limited research is published in the field of direct cold- and hot-forming of Ti-6242. However, research efforts have been made in sheet metal forming of e.g. Ti-6Al-4V, reveling many interesting sheet metal forming characteristics of this particular alloy including forming limit diagrams (FLD) [12-17]. For example, the work performed by Thomas et al. [12] deals with material behavior models to establish the proper conditions for fabricating titanium alloys by conventional sheet forming processes, Ti-6Al-4V is studied in specific. Forming limit curves has been calculated which is compared with experimental FLD:s available in the literature, in which the results indicate that the most critical formability index is the strain rate sensitivity of the material. The forming limits increase with temperature for a given punch speed and with decreasing punch speed for a given temperature. The punch speed is particular important at the investigated temperatures 538 and 677°C predominantly due to the changes in the strain rate sensitivity of the alloy. An effort to standardize the description of titanium sheet formability has also been made where a dimensionless index called the minimum bend radius TR is defined as the ratio between the die radius R and the sheet thickness H, c.f. TR = R/H. Furthermore, extensive experimental results on the compressive deformation behavior (mostly in the hot forging area) for a broad range of strain rates and temperatures of Ti-6Al-4V are available [3, 18-23], revealing many different characteristics of the alloy. Fracture mechanics, metal flow, flow localizations and flow softening are studied. In work published by Semiatin et al [24-27] the properties of Ti-6242 in the field of isothermal and nonisothermal hot forging (816 to 1010ºC) are studied. Flow stress behavior, occurrence of shear bands,

4
chill zones, deformation-induced microstructures and shear cracks are observed and discussed. For example, it was established that the flow behavior to a large extent is determined by the starting microstructure. In hot isothermal compression it was stated that, for the alloy with an equiaxed structure, the deformation is stable with a decreasing flow stress with straining due to adiabatic heating. With a transformed structure, unstable flow was observed and the observed flow softening is in this case caused by microstructural modification together with a small adiabatic temperature increase. The flow stress is sensitive to temperature for which it was shown that this dependence is related to the strain rate sensitivity. Shear bands occur during forging of the alloy, it was concluded that this considerably depend on the temperature sensitivity of the flow stress. Criteria for the occurrence of shear bands were established.
2. Experimental procedure
2.1. Material Specimens for the elevated temperature compression tests (CT) and sheet specimens for the forming tests (FT) are extracted from two different duplex annealed sheet metal plates of Ti-6242. The compression tests require cylindrical specimens with 5 mm diameter and 7 mm height to attain the desired cooling rate. The specimens are machined from a documented alpha case free sheet with thickness 5.86 mm purchased from IML Industrial Metals International LTD, Heat: G-7047. Sheet specimens are machined from a sheet with the mean sheet thickness 1.95 mm purchased from RMI Titanium Company, duplexed annealed at 899°C for 30 minutes then air cooled and subsequently at 788°C for 15 minutes then air cooled. The chemical compositions of the two sheet metals are given in table 1.
Table 1. Chemical composition of Ti-6242 alloy (wt%)
Material Al Mo Zr Sn Si Fe C O N H Y Others Ti CT 6.27 1.98 4.09 2.07 0.07 0.02 0.02 0.11 0.01 0.0065 0.005. <0.3 Bal. FT 5.88 1.95 3.93 2.01 0.084 0.04 0.01 0.09 0.004 24 PPM <50 PPM Bal.
2.2. Compression tests The axial compression tests are performed using a Gleeble 1500 thermo-mechanical testing equipment with lengthwise strain control. The test specimens (extracted transverse (T), along (L), in thickness direction or in a 45° mode to the rolling direction) are placed between two tungsten carbide

5
anvils which are coated with a film of graphite and tantalum to prevent sticking and minimize the friction. Resistance heating of the specimens are used to attain the desired temperatures which also permit rapid heating/cooling rates. Prior to deformation, specimens are heated up (10 C/s) to the desired test temperature after which a holding time of ~15 seconds is applied (in order to make a few adjustments of the control system). After compression the specimens are cooled to room temperature (25°C/s). Some isothermal tests, prior heat treated at 950 C for 20 minutes before cooling to the desired test temperature, are also performed. Finally compression tests during continuous cooling are performed (25°C/s). The temperature is measured using a Pt/PtRh-thermocouple which is welded onto the surface and at mid height of the cylindrical specimens. The Gleeble 1500 equipment permit tests to be performed in an evacuated chamber (0.1 torr) or in a protective gas atmosphere, in this work argon gas is used to minimize -case formation. During the testing sequence the axial compression force, the axial displacement, the diametric increase at mid height of the specimen and the temperature are measured and logged.
2.3. Forming tests The sheet metal forming tests are performed using two sets of forming tools, one set with a cold punch and die (tool steel Uddeholm RIGOR, hardness 58-60 HRC) and another set with a heated punch and die (400°C-maximum temperature for long time exposure, tool steel Uddeholm HOTVAR, hardness 57 HRC, purchased from Fr Ramstrom and heat-treated by Bodycote Metal Technology) c.f. Fig. 1(a)-(b) and (c)-(d) respectively. The forming tools are constructed with respect to the theoretical minimum bend radius in room temperature and mounted in a DARTEC 250 kN Universal Straining Frame testing machine. The DARTEC 250 kN Universal Straining Frame testing machine is in this work stroke displacement controlled with the capability of switching the stroke controlled displacement to load controlled displacement at the very end of the forming sequence, calibrated to within ±0.2% of the measured value. The dimensions of the sheet specimens are 147x29x1.95 (mm) for tests performed in the cold forming tool and 137x29x1.95 (mm) in tests performed in the forming tool with heating capability. Sheet specimens are grinded with abrasive paper of fineness 240 or 320 to remove oxide layers, cleaned with ethanol and sprayed with Combat® Boron Nitride Aerosol CC-18 as lubrication, applied in two thin layers.

6
(a)
(b)

7
(c)
(d) Fig. 1. Mechanical drawing of (a)-(b) cold forming tool, (c)-(d) forming tool with heating capability, common dimensions with (a) and (b) are not specified (mm). Tool thickness is 29 mm.
The sheet specimens, extracted transverse (T) or along (L) the rolling direction, are placed and centered in the forming tool after which the forming sequence is carried out. The lower die has a constant velocity (5 or 10 mm/s). A holding time (5 sec. if nothing else mentioned) is applied before unloading. Pre-heating of sheet specimens, in the temperature range 400-1050°C, is performed using

8
an NABER 2804 Mod. L51/SR heating oven after which the pre-heated sheet plate is transferred directly into the forming tool. The temperature of the sheet specimen is continuously measured and logged by three PENTRONIC thermocouples, type K, welded at the longer edge of the rectangular sheet specimen c.f. Fig. 2 (where x1=8, x2=32 and L=147 mm for tests performed in the cold forming tool and x1=3, x2=27 and L=137 mm in tests performed in the forming tool with heating capability). The temperature of the forming tool is measured by another six PENTRONIC thermocouples, type K, mounted in the center and as close as possible to the contact surfaces of the forming tool, three in the upper punch (a-c) and three in the lower die (d-f) indicated by the small wholes in the mechanical drawing c.f. Fig. 1. The heating and the temperature maintenance of the forming tool with heating capability is accomplished by the use of three cartridge heaters purchased from FARNELL. The required power is controlled via a computer controlled automatic control system (using a PID-regulator). One cartridge heater (3/8", 250 W, external length 2") is placed in the center section of the upper punch and two (3/8", 315 W, external length 2.5") in the center section of the lower die according to the mechanical drawing c.f. Fig. 1(c) and (d), respectively. The heating of the sheet specimens and the forming tests are performed in laboratory atmosphere. Besides the temperature, the axial stroke displacement and the axial compression force are continuously measured and logged with the sampling frequency 100 Hz. Further, the spring-back behaviour c.f. Fig. 3 (where a=15.0 b=13.05 and c=10.0 mm) and the material thinning (at the sections by thermocouple no. 2 and 3 together with the area just below thermocouple no. 2) of formed sheets have been determined by measurements.
Fig. 2. Location of the three thermocouples welded at the longer edge of the rectangular sheet specimens.

9
Fig. 3. Illustration of spring-back measurements.
2.4. Metallographic studies The as-received microstructures of the two sheet metals, the microstructures of specimens from the elevated temperature compression tests and formed sheet plates from the forming tests are examined, using optical microscopy. For the as-received microstructures, rectangular samples are extracted in the rolling direction of the sheets. Typical samples of the cylindrical specimens are sectioned along the compression axis and samples from the forming tests are sectioned at section I where studies are conducted at a to e, c.f. Fig. 4. The specimens are polished and etched with Kroll’s reagent (2% HF, 3% HNO3 and 95% H20).
Fig. 4. Section of formed sheet plates for metallographic studies.
Desired geometry
Obtained geometry

10
3. Results
3.1. Material response observations, compression tests In Fig. 5(a)-(d), true stress-strain relations are presented at indicated strain rates and temperatures. Fig 5(a) displays the isothermal true stress-strain curves for the strain rate 0.05 s-1 at various temperatures. Initial material hardening is observed followed by specimen cracking at the lower temperatures 400 to 600°C. Tests at 700 to 900˚C indicate material hardening followed by flow softening, peak stresses at certain strains are observed. Flow softening is a well known phenomenon for Ti-6242 and similar behaviour has been observed for the - titanium alloy Ti-6Al-4V. At lower temperatures or at high strain rates formation of micro-cracks and voids evolve during deformation, see for example [1, 18, 19, 24, 27]. The three curves in Fig. 5(b) displays the strain rate sensitivity at 800°C at strain rates 0.05 to 1 s-1. As seen from Fig. 5(a) and (b), pronounced hardening due to higher strain rates is observed. However, no considerable temperature increase is measured during deformation at any strain rate (7°C, at the most for the highest strain rate 1 s-1). The material has anisotropic properties c.f. Fig. 5(c), where compression tests on specimens extracted at indicated directions to the rolling direction of the sheet have been performed. Fig. 5(d) displays the stress-strain curves for compression tests performed under continuous cooling (25°C/s) at indicated strain rate and temperature intervals (start and stop temperatures).
0 0.1 0.2 0.3 0.4 0.5 0.60.60
500
1000
1500
True strain
Tru
e st
ress
(M
Pa)
0.05 (1/s)
400°C500°C
600°C
700°C
800°C900°C
0 0.1 0.2 0.3 0.4 0.5 0.6 0.70
100
200
300
400
500
600
700
True strain
Tru
e st
ress
, (M
Pa)
800°C
0.5 (1/s)1 (1/s)
0.05 (1/s)
(a) (b)

11
0 0.1 0.2 0.3 0.4 0.5 0.6 0.70
100
200
300
400
500
True strain
Tru
e st
ress
, (M
Pa)
TransverseLongitudinalThickness dir.45° mode
800°C
0 0.1 0.2 0.3 0.40
200
400
600
800
1000
1200
True strain
Tru
e st
ress
, (M
Pa)
0.05 (1/s)
750 − 600°C
800 − 650°C
850 − 700°C
(c) (d) Fig. 5. (a)-(d) Typical true stress-true strain relations at indicated strain rates and temperatures, (c) at strain rate 0.05 s-1.
In Fig. 6(a) and (b), corresponding compression forces vs. diametric increase to Fig. 5(a) and (d) are presented. The data presented in Fig. 6 is additional information that can be included in material model parameter estimations by means of inverse modeling.
0 0.5 1 1.5 2 2.5x 10
−3
0
5
10
15
20
25
30
Diametric increase, (m)
Com
pres
sion
forc
e, (
kN) 0.05 (1/s)400°C
500°C
600°C
700°C
800°C900°C
0 0.2 0.4 0.6 0.8 1 1.2 1.4 1.60
5
10
15
20
25
30
Diametric increase, (m)
Com
pres
sion
forc
e, (
kN) 0.05 (1/s)
750 − 600°C
800 − 650°C
850 − 700°C
(a) (b) Fig. 6. (a)-(b) Compression force vs. diametric increase at indicated strain rate and temperatures or temperature intervals.
Compression tests with prior heat treatment (HT) for 20 minuets at equilibrium temperature 950 C are presented in Fig. 7(a), in which selected compression tests presented in Fig. 5(a) are used as reference for comparison. The material, tested from 600 to 800 C, exhibit higher resistance to deformation after heat treated. The same response is expected at 700 C. If the cooling rate of 25 C/sec is sufficiently fast, the formation of fine alpha platelets will occur and if these platelets have a smaller size than in the starting material a hardening effect should be observed c.f. Fig. 18(a) and 21(a). It is also possible that alpha case formation can have a hardening effect. The reverse behavior is observed at

12
900 C. This is most likely due to the fact that equilibrium between the softer -phase and the harder -phase has been reached due to the heat treatment [29]. Since the to transformation is not only temperature dependent but also time dependent it is reasonable to assume that this heat-treated specimen contains a high content (vol%) -phase at 900 C compared to tests performed at lower temperatures. The behavior is therefore softer. At 800 to 600 C this phenomena disappear due to the to transformation, where the content is low. Compressed specimens extracted transverse or along the rolling direction of the sheet have somewhat oval cross-sections due to anisotropy [23]. This was not observed for specimens extracted in thickness direction or with extraction direction in a 45° degree mode to the rolling direction, these specimens are circular. Examples of the reproducibility of the isothermal compression tests without prior heat treatment are presented in Fig. 7(b), indicating acceptable reproducibility even if some scatter is present.
0 0.1 0.2 0.3 0.4 0.5 0.6 0.70
200
400
600
800
1000
1200
True strain
Tru
e st
ress
, (M
Pa)
600°C − HT
600°C
700°C
800°C − HT800°C900°C900°C − HT
0.05 (s/1)
0 0.1 0.2 0.3 0.4 0.5 0.6 0.70
500
1000
1500
True strain
Tru
e st
ress
, (M
Pa)
500°C no.1500°C no.2500°C no.3700°C no.1700°C no.2700°C no.3
0.05 (1/s)
500°C
700°C
(a) (b) Fig. 7. a) True stress-true strain relations at indicated strain rate, temperatures and heat treatment b) reproducibility.
3.2. Material response observations, forming tests Cold forming tests, performed with the present room tempered (RT) forming tool and sheet plates, cannot successfully be performed. The sheet plates break during the forming process, c.f. Fig. 8 and Fig. 9(a)-(c) to Fig. 11(a)-(c) at indicated forming velocities (v) and extraction directions of the sheet specimens. In Fig. 8(a) two forming tests are compared performed under identical conditions except from extraction direction of sheet specimens, along (L) or transverse (T) the rolling direction. In the test with the extraction direction along the rolling direction an abrupt fracture occurs above the lower radius of the die, before the critical radius has been reached, c.f. Fig 9(b). The fracture is due to a combined stretching/bending case of load. Fracture is unsymmetrical, probably due to a small out-of-line placement of the sheet plate

13
in the tool, but local defects in the material can also influence the fracture characteristics. A second fracture occurs in centre of the opposite lower radius of the die at the very end of the forming sequence, c.f. Fig 9(c). In the other test, where the extraction direction is transverse the rolling direction, the firstfracture occurs comparatively later in the forming process implying that specimens extracted along rolling direction exhibit a higher resistance to plastic deformation. This was previously confirmed by the compression tests c.f. Fig. 5(c) and is indicated in Fig. 8(a), where a slightly higher forming force is required to deform the sheet plate some time before the first fracture occurs. In Fig. 8(b), forming force vs. stroke displacement for a test performed with the higher forming velocity 10 mm/s, (T), is presented. When compared to the test presented in Fig. 8(a), (T), fracture occurs comparatively earlier in the forming sequence indicating strain rate sensitivity c.f. Fig. 11(a)-(c). Strain rate sensitivity for Ti-6242 was also confirmed by the elevated temperature compression tests, c.f. Fig. 5(b). Spring-back and material thinning was not possible to measure due to fracture.
0 0.01 0.02 0.03 0.04 0.050
10
20
30
40
50
60
70
Displacement (m)
For
min
g fo
rce
(kN
)
Longitudinal
Transverse
5 (mm/s)
Fracture
Fracture
0 0.01 0.02 0.03 0.04 0.050
10
20
30
40
50
60
70
Displacement (m)
For
min
g fo
rce
(kN
)
Transverse 10 (mm/s)
Fracture
(a) (b) Fig. 8. Compression force vs. stroke displacement at indicated forming velocities and extraction directions of sheet specimens.
a) (b) (c) Fig. 9. Fracture characteristics during forming sequence for test with forming velocity 5 mm/s, (L). (a) loading, (b) first fracture and (c) second fracture

14
a) (b) (c) Fig. 10. Fracture characteristics during forming sequence for test with forming velocity 5 mm/s, (T). (a) loading, (b) first and second fracture and (c) unloading
a) (b) (c) Fig. 11. Fracture characteristics during forming sequence for test with forming velocity 10 mm/s, (T). (a) loading, (b) first fracture and (c) second fracture
Elevated temperature forming tests, performed with room tempered (RT) forming tools and pre-heated sheet specimens, can successfully be performed c.f. Fig. 12 and 15. Forming tests with preheated sheet specimens to the heating temperature of approximately 450, 750 and 1050ºC are presented in Fig. 12 (heating time approximately 200 s). Air cooling and contact with the room tempered forming tool imply somewhat lower starting temperatures when formed and substantial lower final temperatures after the 5 seconds holding time due to the room tempered forming tool. Exact temperatures of the sheet (thermocouple no. 1-3, c.f. Fig. 2) and the tool (thermocouple a-f, c.f. Fig. 1) are given in table 2 and Fig. 14(a)-(e). Elevated temperature forming tests performed with the higher forming velocity (v) 10 mm/s yields somewhat higher forming forces compared to tests performed with the lower forming velocity 5 mm/s. This is in accordance with the strain rate sensitivity of the alloy. However, the starting temperatures of test 400ºC/10 (test at 400ºC with forming velocity 10 mm/s) is somewhat lower than for the test 400ºC/5. The reverse is valid for the tests 700ºC/5 and 700ºC/10. The forming tests preheated to about 1050ºC yields similar magnitude of forming force, occasionally even higher, despite the higher forming temperature c.f. Fig. 12(a), 14(a), (c) and (e). Further on, fracture occurs at the end of the forming sequence c.f. Fig. 16(a)-(c) indicating material embrittlement, caused by the alteration of microstructure (transformed beta, basket weave structure) and formation of alpha case.

15
0 0.01 0.02 0.03 0.04 0.050
5
10
15
20
25
30
35
40
Displacement (m)
For
min
g fo
rce
(kN
)
400°C/5
700°C/5
1000°C/5
5 (mm/s)
Fracture
0 0.01 0.02 0.03 0.04 0.050
5
10
15
20
25
30
35
40
Displacement (m)
For
min
g fo
rce
(kN
)
400°C/10
700°C/10
10 (mm/s)
(a) (b) Fig. 12. Compression force vs. stroke displacement at indicated initial temperatures/forming velocities.
Elevated temperature forming tests, with heated (400ºC) forming tools and pre-heated sheet specimens, can successfully be performed. Forming tests are presented in Fig. 13 and appertaining temperature history in table 2 and Fig. 14(f). Isothermal forming of sheet with extraction direction along the rolling direction again indicate noticeable higher resistance to deformation when compared to sheet with extraction direction transverse the rolling direction. Strain rate sensitivity is insignificant at isothermal forming at 400ºC. Forming preheated sheet plates, to about 700ºC, yields a slightly decrease in forming force compared to isothermal forming at 400ºC. The reproducibility of the forming tests is confirmed by repeated tests c.f. Fig. 13(b).
0 0.01 0.02 0.03 0.04 0.050
5
10
15
20
25
30
35
40
Displacement (m)
For
min
g fo
rce
(kN
)
400°C/5/400°C400°C/5−L/400°C400°C/10/400°C700°C/5/400°C
0 0.01 0.02 0.03 0.04 0.050
5
10
15
20
25
30
35
40
Displacement (m)
For
min
g fo
rce
(kN
)
400°C/5/400°C − no. 1400°C/5/400°C − no. 2400°C/5/400°C − no. 3
5 (mm/s)
(a) (b) Fig. 13. Compression force vs. stroke displacement at indicated forming velocities, initial temperatures and extraction directions of sheet specimens, (b) reproducibility.

16
The use of boron nitride as a lubricant in the forming process was shown to be of importance. When forming in room temperature without lubricants, the friction coefficient increases considerably causing fracture to occur earlier and more abrupt compared to forming with lubricants. When sheet specimens are pre-heated to approximately 700°C and room tempered forming tool is used, the forming is successful. However the evenness and smoothness of the tool surfaces become even more important since existent roughness causes the sheet plate to be more adhesive on one side compared to the other. This cause the sheet plate to slide or stick during the forming process, resulting in a considerable out-of-line placement during forming. No significant material sticking was, however, observed.
Table 2. Current temperatures (°C) for elevated temperature forming tests (temperature sheet/v/temperature forming tool) Heating temperature Starting temperature Final temperature (Including 5 s hold time) Thermocouple no. Test 1 2 3 1 2 3 1 2 3
400/5 447 441 436 312 314 340 70 85 69
400/10 388 401 409 335 332 338 141 154 148
700/5 697 692 665 553 560 - 128 128 -
700/10 767 758 705 604 605 587 125 172 110
700/10-ht2 736 729 709 453 497 560 40 41 41
400/5/400 456 458 447 415 425 382 387 408 399
400/5-L/400 466 469 443 422 432 412 378 401 399
400/10/400 465 457 454 412 420 389 379 401 394
700/5/400 720 714 688 594 608 604 396 421 451
0 0.01 0.02 0.03 0.04 0.050
50
100
150
200
250
300
350
Displacement (m)
Tem
pera
ture
( °C
)
Th. couple no. 1Th. couple no. 2Th. couple no. 3Th. couple aTh. couple bTh. couple cTh. couple dTh. couple eTh. couple f
400°C/5
0 0.01 0.02 0.03 0.04 0.050
50
100
150
200
250
300
350
Displacement (m)
Tem
pera
ture
( °C
) Th. couple no. 1Th. couple no. 2Th. couple no. 3Th. couple aTh. couple bTh. couple cTh. couple dTh. couple eTh. couple f
400°C/10
(a) (b)
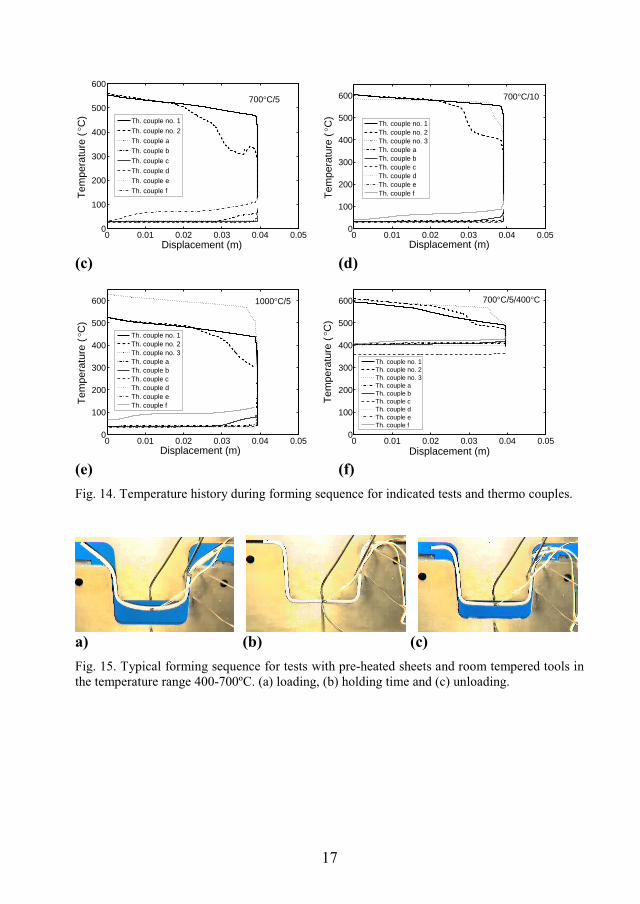
17
0 0.01 0.02 0.03 0.04 0.050
100
200
300
400
500
600
Displacement (m)
Tem
pera
ture
( °C
) Th. couple no. 1
Th. couple no. 2Th. couple aTh. couple b
Th. couple cTh. couple dTh. couple e
Th. couple f
700°C/5
0 0.01 0.02 0.03 0.04 0.050
100
200
300
400
500
600
Displacement (m)
Tem
pera
ture
( °C
)
Th. couple no. 1Th. couple no. 2Th. couple no. 3Th. couple aTh. couple bTh. couple cTh. couple dTh. couple eTh. couple f
700°C/10
(c) (d)
0 0.01 0.02 0.03 0.04 0.050
100
200
300
400
500
600
Displacement (m)
Tem
pera
ture
( °C
)
Th. couple no. 1Th. couple no. 2Th. couple no. 3Th. couple aTh. couple bTh. couple cTh. couple dTh. couple eTh. couple f
1000°C/5
0 0.01 0.02 0.03 0.04 0.050
100
200
300
400
500
600
Displacement (m)
Tem
pera
ture
( °C
)
Th. couple no. 1Th. couple no. 2Th. couple no. 3Th. couple aTh. couple bTh. couple cTh. couple dTh. couple eTh. couple f
700°C/5/400°C
(e) (f) Fig. 14. Temperature history during forming sequence for indicated tests and thermo couples.
a) (b) (c) Fig. 15. Typical forming sequence for tests with pre-heated sheets and room tempered tools in the temperature range 400-700ºC. (a) loading, (b) holding time and (c) unloading.

18
a) (b) (c)Fig. 16. Fracture characteristics during forming sequence for test with pre-heated sheet specimens to 1050ºC and room tempered tools with forming velocity 5 mm/s, (T). (a) loading, (b) first fracture and (c) second fracture.
Some material thinning occurs due to material stretching in the forming sequence c.f. table 3 (mean value from five measurements). The highest degree of material thinning is observed in the area just below thermo couple no. 2, i.e. somewhere between thermo couple no. 2 and 3, for tests with pre-heated specimens to about 700ºC formed with room tempered tools. The higher values than the sheet thickness at thermo couple no. 2 is due to a slight bend of the sheet plate which causes difficulties to obtain accurate measurements with the micrometer precision instrument.
The spring-back characteristics of Ti-6242 can be divided in to two typical behaviours, illustrated in Fig. 17. Forming with the higher start temperature yields over all a higher degree of spring-back compared to forming conducted at the lower temperature at measured sections c.f. table. 3 (mean value from six measurements). The changes of spring-back characteristics can be traced to the combined temperature and deformation history. However, the degree of spring-back can be reduced by the application of a holding time in the forming tool at the end of the forming sequence. The best final shape is obtained by hot isothermal forming at 400°C applying a subsequent holding time of 15 minutes c.f. table 3.
(a) (b) Figure 17. Schematic illustration of final shapes of formed sheet plates, a) tests with starting temperature of approximately 400ºC and b) tests with starting temperature of approximately 700ºC.

19
Table 3. Sheet thickness and spring-back measurements (mm) for forming tests (temperature (°C)/v(mm/s)/tool temperature (°C)). Holding time in forming tool is marked by ht followed by no. of minutes. Sheet thickness Spring-back distance Thermocouple no. Test 2 below 2 3 y x1 x2
400/5 1.954 1.932 1.946 0.61 -0.30 -0.44
400/10 1.964 1.930 1.942 0.47 -0.06 0.18
700/5 1.959 1.912 1.934 0.60 -0.09 -1.40
700/10 1.972 1.924 1.940 0.68 -0.84 -1.24
700/10-ht2 1.980 1.948 1.950 0.71 -0.49 -0.79
400/5/400 1.960 1.938 1.950 0.37 0.24 0.42
400/5-L/400 1.980 1.948 1.950 0.28 0.04 0.18
400/5-ht5/400 1.970 1.938 1.938 0.20 0.15 0.25
400/5-ht15/400 1.974 1.938 1.946 0.25 -0.04 0.00
400/10/400 1.974 1.946 1.956 0.34 0.27 0.45
700/5/400 1.974 1.938 1.958 0.47 -0.66 -1.19
700/5-ht5/400 1.986 1.950 1.954 0.48 -0.64 -1.08
Inhomogeneous temperature distribution exists in preheated sheets when formed by room tempered or heated forming tools, except in the isothermal test at 400°C where the temperature differences are approximately zero. The temperature field varies throughout the sheet and the magnitude therefore depends on location, forming velocity, forming temperature and time. For example in test 700°C/5/400°C, the magnitude of the temperature changes vary from only 5°C/s to 82°C/s (for short time intervals). Temperature changes can be even greater in tests with preheated sheets and room tempered forming tools (cooling rates locally up to 200°C/s). This implies that formed sheet plates have different thermo-mechanical loading histories compared to the compression tests. However, this will be accounted for and examined in future work.
3.3. Microstructural observationsAs-received microstructures of the two sheet metals are presented in Fig. 18(a) to (d). The microstructure consist of equiaxed in a transformed matrix, typically referred to as the + microstructure, see for example [26]. Regions of grains which are highly deformed are noticeable in the material c.f. Fig. 18(a) and (c). The microstructures of the two sheet metals differ with respect to grain size, the sheet metal used in forming tests possess a finer structure c.f. Fig 18(b) and (d).

20
(a) (b)
(c) (d) Fig. 18. As-received microstructure of (a-b) sheet metal for CT, rolling direction are vertical in these figures and (c-d) sheet metal for FT, rolling direction are horizontal in these figures.
During compression, performed in the temperature range 400 to 600°C specimen failure occurs, in which the fracture pieces of broken samples are sheared in a diagonal mode to the loading direction. In the study by Wagoner et al. [19] on compression tests at lower temperatures in Ti-6Al-4V, it was concluded that voids occur in the shear bands which form during the compression. The amount of voids increase with deformation. The voids form in the corners of sectioned specimens and grow into the centre of the specimen. These cracks are responsible for the fracture and it was additionally stated that significant crack growth occurs only just before failure occurs. In Fig. 19 shear bands of isothermal compression at 500 and 600˚C are presented. It is obvious that cracks have formed within a shear band in the test conducted at 600˚C, c.f. Fig. 19(b).

21
(a) (b) Fig. 19. Microstructure of isothermal compression test at a) 500˚C and b) 600˚C, with a strain rate of 0.05 s-1.
Fig. 20(a)-(e) presents the microstructure of the compression test isothermally deformed at 700˚C, T, at a strain rate of 0.05 s-1 and to a true strain of 0.5. The structure becomes more and more deformed going from the anvil contact region into the center of the specimen. Fig 20(a) indicates a dead zone at the contact region with the anvil in which the structure is practically undeformed and (b) the more deformed centre region of the specimen. Shear bands are observed in the structure, c.f. Fig 20(c) to (e). The material, when compressed at the higher temperatures 700 to 900°C, seems to flow towards the free bulge surface which is observed trough the wave-like deformation bands c.f. Fig. 20(e). No indications of alpha case are observed, in non heat treated specimens.
(a) (b)
Shear band Cracks

22
(c) (d)
(e) Fig. 20. Microstructure of isothermal compression test at 700˚C with a strain rate of 0.05 s-1, to a true strain of 0.5. (a)-(b) Close to the contact region and at centre of cross sectioned specimen, respectively. (c)-(e) Shear bands. Compression direction is horizontal and the rolling direction of the sheet is vertical in the figures.
As can be seen in Fig. 21(a) the microstructure of the heat treated isothermal compression test is considerably affected (test at 800˚C). The alpha grains or platelets in the structure have increasingly been broken up and the primary alpha grains increasingly scattered when going from the less deformed contact surface region into the more deformed centre of the specimen. This breakdown of the microstructure can, according to Semiatin et al. [3], cause flow softening. Indication of alpha-case formation at the free surface of heat treated specimens c.f. Fig. 21(a), indicate that the procedure in which argon gas is supplied to the testing chamber is not sufficient. Some leakage occurs in which the specimens are subjected to the laboratory atmosphere. Sheared grains/deformation bands are observed in the structure. In and close to contact regions the micro structure is practically unchanged. The formation of fine alpha platelets observed in pre heat treated compression tests, have a smaller size than in the starting material which probably causes the overall hardening

23
behavior, compared to non heat treated tests, previously discussed c.f. Fig. 7(a) and 21(a).
(a) (b) Fig. 21. (a) Microstructure of isothermal compression test, prior heat-treated, at 800˚C at a 0.05s-1 strain rate, to a true strain of 0.7 at the free edge of cross sectioned specimen, (b) microstructure close to the contact region.
The microstructure of formed sheet plates is in general not considerably affected. However, streaks with grains subjected to a higher degree of deformation are observed c.f. Fig 22 (a) and (b). When the sheet specimen was pre heated to ~1050°C, high and varying temperature changes occur in the sheet upon cooling by contact with the room tempered forming tool and also due to air cooling. This implies that the sheet is subjected large temperature variations during the forming process. The microstructure has changed and a transformed beta, basket weave like structure is obtained which in combination with the formed alpha case imply less ductility of the alloy. It is obvious that alpha case has formed in which micro cracks form upon loading, especially in bending, which grow with increasing load c.f. Fig. 23. The temperature at the fractured section of the sheet may also have been lower compared to other critical sections, implying even less ductility of the material. This, in combination, cause failure to occur during the forming despite the fact that the overall temperature during forming is equal or even higher compared to forming sheet specimens pre heated to ~700°C, where the forming was successful. The most frequent and largest micro cracks could be found at the outer edge in section b, close to where fracture occurred and at the outer edge at section d. Indications of micro cracks were also found in section c, but no micro cracks are visible at section e, c.f. Fig 4.

24
(a) (b) Fig. 22. Forming performed under isothermal conditions at 400°C. Typical bands of more deformed grains at (a) section b and (b) section c, c.f. Fig 4.
(a) (b)
(c) (d)
Micro cracks

25
(e) (f) Fig. 23. Forming performed with pre-heated sheet specimen to 1050°C with room tempered forming tools, (a)-(b) section a, (c)-(d) section b and (e)-(f) section d, c.f. Fig 4.
4. Discussion and Conclusions
In the present work, the thermo-mechanical response of Ti-6242 is studied in a set of tests with a broad range of temperatures and at different strain rates. By elevated temperature compression tests and sheet metal forming experiments cold and hot sheet metal forming processes for the alloy are evaluated. Experimental data will be used to obtain material model parameters i.e. of constitutive equations. Furthermore, results from the hot sheet metal forming tests will be used for validation of numerical (FE) models in which estimated material model parameters are used for the prediction of sheet metal forming of Ti-6242. Major conclusions from the present work are as follows: 1. Experimental results show that initial material hardening is followed by
specimen failure when compressed at the lower temperature interval 400-600°C and by flow softening when compressed at the higher temperature interval 700-900°C. The fracture pieces of broken samples were sheared in a diagonal mode to the loading direction. The material has anisotropic plastic properties. Higher resistance to deformation, with falling magnitude, for compression in a 45° mode, thickness direction, along and transverse the rolling direction respectively are observed.
2. Microstructural examination reveals that shear bands are formed at the lower temperatures in which, with reference to [19], cracks may form which with increasing load link up to macroscopic cracks responsible for the failure. In the higher temperature interval the structure become more and more deformed going from the anvil contact region into the centre of the specimen. A dead zone at the contact region with the anvil is observed. Deformation bands are observed in the structure, where the material tends to flow towards the free bulge surface. To obtain accurate material model
Cracks
Cracks
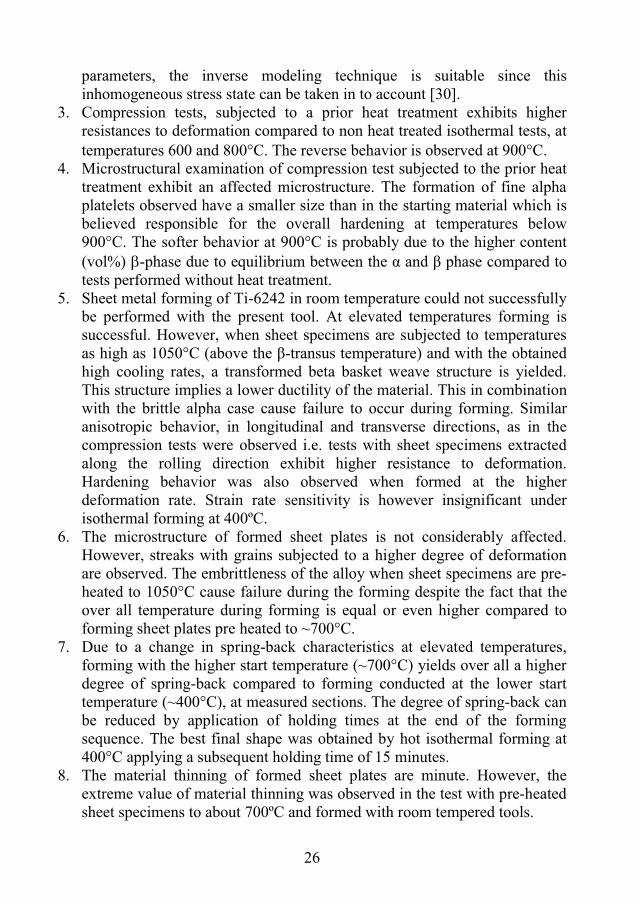
26
parameters, the inverse modeling technique is suitable since this inhomogeneous stress state can be taken in to account [30].
3. Compression tests, subjected to a prior heat treatment exhibits higher resistances to deformation compared to non heat treated isothermal tests, at temperatures 600 and 800 C. The reverse behavior is observed at 900 C.
4. Microstructural examination of compression test subjected to the prior heat treatment exhibit an affected microstructure. The formation of fine alpha platelets observed have a smaller size than in the starting material which is believed responsible for the overall hardening at temperatures below 900°C. The softer behavior at 900°C is probably due to the higher content (vol%) -phase due to equilibrium between the and phase compared to tests performed without heat treatment.
5. Sheet metal forming of Ti-6242 in room temperature could not successfully be performed with the present tool. At elevated temperatures forming is successful. However, when sheet specimens are subjected to temperatures as high as 1050°C (above the -transus temperature) and with the obtained high cooling rates, a transformed beta basket weave structure is yielded. This structure implies a lower ductility of the material. This in combination with the brittle alpha case cause failure to occur during forming. Similar anisotropic behavior, in longitudinal and transverse directions, as in the compression tests were observed i.e. tests with sheet specimens extracted along the rolling direction exhibit higher resistance to deformation. Hardening behavior was also observed when formed at the higher deformation rate. Strain rate sensitivity is however insignificant under isothermal forming at 400ºC.
6. The microstructure of formed sheet plates is not considerably affected. However, streaks with grains subjected to a higher degree of deformation are observed. The embrittleness of the alloy when sheet specimens are pre-heated to 1050°C cause failure during the forming despite the fact that the over all temperature during forming is equal or even higher compared to forming sheet plates pre heated to ~700°C.
7. Due to a change in spring-back characteristics at elevated temperatures, forming with the higher start temperature (~700°C) yields over all a higher degree of spring-back compared to forming conducted at the lower start temperature (~400°C), at measured sections. The degree of spring-back can be reduced by application of holding times at the end of the forming sequence. The best final shape was obtained by hot isothermal forming at 400°C applying a subsequent holding time of 15 minutes.
8. The material thinning of formed sheet plates are minute. However, the extreme value of material thinning was observed in the test with pre-heated sheet specimens to about 700ºC and formed with room tempered tools.
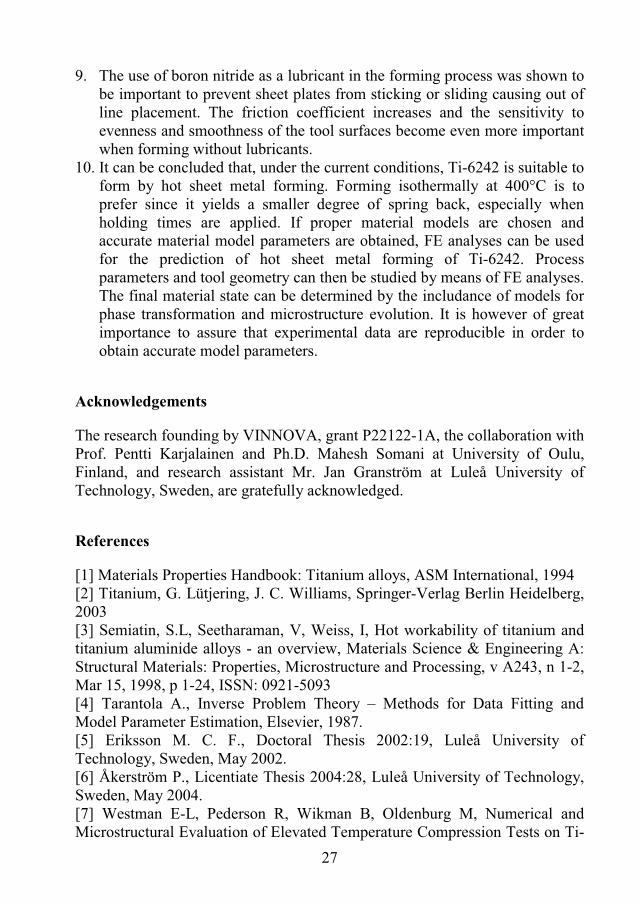
27
9. The use of boron nitride as a lubricant in the forming process was shown to be important to prevent sheet plates from sticking or sliding causing out of line placement. The friction coefficient increases and the sensitivity to evenness and smoothness of the tool surfaces become even more important when forming without lubricants.
10. It can be concluded that, under the current conditions, Ti-6242 is suitable to form by hot sheet metal forming. Forming isothermally at 400°C is to prefer since it yields a smaller degree of spring back, especially when holding times are applied. If proper material models are chosen and accurate material model parameters are obtained, FE analyses can be used for the prediction of hot sheet metal forming of Ti-6242. Process parameters and tool geometry can then be studied by means of FE analyses. The final material state can be determined by the includance of models for phase transformation and microstructure evolution. It is however of great importance to assure that experimental data are reproducible in order to obtain accurate model parameters.
Acknowledgements
The research founding by VINNOVA, grant P22122-1A, the collaboration with Prof. Pentti Karjalainen and Ph.D. Mahesh Somani at University of Oulu, Finland, and research assistant Mr. Jan Granström at Luleå University of Technology, Sweden, are gratefully acknowledged.
References
[1] Materials Properties Handbook: Titanium alloys, ASM International, 1994 [2] Titanium, G. Lütjering, J. C. Williams, Springer-Verlag Berlin Heidelberg, 2003[3] Semiatin, S.L, Seetharaman, V, Weiss, I, Hot workability of titanium and titanium aluminide alloys - an overview, Materials Science & Engineering A: Structural Materials: Properties, Microstructure and Processing, v A243, n 1-2, Mar 15, 1998, p 1-24, ISSN: 0921-5093 [4] Tarantola A., Inverse Problem Theory – Methods for Data Fitting and Model Parameter Estimation, Elsevier, 1987. [5] Eriksson M. C. F., Doctoral Thesis 2002:19, Luleå University of Technology, Sweden, May 2002. [6] Åkerström P., Licentiate Thesis 2004:28, Luleå University of Technology, Sweden, May 2004. [7] Westman E-L, Pederson R, Wikman B, Oldenburg M, Numerical and Microstructural Evaluation of Elevated Temperature Compression Tests on Ti-

28
6Al-4V, Ti-2003 Science and Technology, 10th World Conference on Titanium, Hamburg, Germany, 13-18 July 2003, Volume III, pages 1461-1468. [8] Materials Properties Handbook: Titanium alloys, Tachnical note 5A, Superplastic forming of Titanium Alloys, ASM International, 1994 [9] Tuegel, E.J, Pruitt, M.O, Hefti, L.D, SPF/DB takes off, Advanced Materials & Processes, v 136, n 1, Jul, 1989, p 36-41, ISSN: 0882-7958 [10] Bewlay B.P, Gigliotti M.F.X. Utyashev F.Z, Kaibyshev O.A, Superplastic roll forming of Ti alloys, Materials and Design, v 21, n 4, 2000, p 287-295, ISSN: 0264-1275 [11] Peter N, Manufacturing advantages of superplastically formed fine-grain TI-6Al-4V alloy Comley, Journal of Materials Engineering and Performance, v 13, n 6, December, 2004, p 660-664, ISSN: 1059-9495 [12] J. F. Thomas, Jr., S. I. Oh, H. L. Gegel, Sheet forming of titanium alloys, Metallurgical Society of AIME, Conference proceedings, C1982, pp 81-100, 1982[13] Shipton, M.H., Roberts, W.T., Hot deep drawing of titanium sheet, Materials Science and Technology, v 7, n 6, Jun, 1991, p 537-540, ISSN: 0267-0836[14] Alberti, N., Forcellese, A., Fratini, L., Gabrielli, F., Sheet metal forming of titanium blanks using flexible media, CIRP Annals - Manufacturing Technology, v 47, n 1, 1998, p 217-220, ISSN: 0007-8506 [15] Chan K.S., Koss D. A., Metallurgical Transactions A, v 14A, n 7, 1983, p 1343-1348, ISSN: 0360-2133 [16] El-Domiaty A., Journal of Materials Processing Technology, v 32, n 1-2, 1992, p 243-251, ISSN: 0924-0136 [17] Satoh, Joji, Gotoh, Manabu, Maeda, Yasuharu, Stretch-drawing of titanium sheets, Journal of Materials Processing Technology, v 139, n 1-3 SPEC, Aug 20, 2003, p 201-207, ISSN: 0924-0136 [18] Ding, R, Guo, Z.X, Wilson, A, Microstructural evolution of a Ti-6Al-4V alloy during thermomechanical processing, Materials Science and Engineering A, v 327, n 2, Apr 30, 2002, p 233-245, ISSN: 0921-5093 [19] Wagoner A.J., Bull C.W, Kumar K.S, Briant C.L, The influence of microstructure and strain rate on the compressive deformation behavior of Ti-6Al-4V, Johnson, Metallurgical and Materials Transactions A: Physical Metallurgy and Materials Science, v 34, n 2, February, 2003, p 295-306, ISSN: 1073-5623[20] Seetharaman V, Boothe L, Lombard C.M, Compressive deformation behavior of a Ti-6Al-4V alloy at high temperatures and strain rates, Proc Symp Microstruct Prop Relat Titanium Aluminides Alloys Presented 90 TMS Fall Meet, 1991, p 605-622, ISBN: 0-87339-130-6 [21] Kailas, Satish V., Prasad Y.V.R.K, Biswas S.K, Flow instabilities and fracture in Ti-6Al-4V deformed in compression at 298 K to 673 K,

29
Metallurgical and Materials Transactions A: Physical Metallurgy and Materials Science, v 25A, n 10, Oct, 1994, p 2173-2179, ISSN: 1073-5623 [22] Lee Woei-Shyan, Lin Ming-Tong, Effects of strain rate and temperature on the compressive deformation behaviour of Ti-6Al-4V alloy, Journal of Materials Processing Technology, v 71, n 2, Nov 15, 1997, p 235-246, ISSN: 0924-0136[23] Semiatin S.L, Bieler T.R, Effect of texture and slip mode on the anisotropy of plastic flow and flow softening during hot working of Ti-6Al-4V, Metallurgical and Materials Transactions A: Physical Metallurgy and Materials Science, v 32, n 7, July, 2001, p 1787-1799, ISSN: 1073-5623 [24] Semiatin S. L., Lahoti G. D., Deformation and Unstable Flow in Hot Forging of Ti-6Al-2Sn-4Zr-2Mo-0.1Si, Metallurgical Transactions A, v 12A, n 10, Oct, 1981, p 1705-1717. [25] Semiatin, S. L., Lahoti, G. D., The occurrence of shear bands in isothermal, hot forging, Metallurgical Transactions, v 13A, n 2, Feb, 1982, p 275-288, ISSN: 0360-2133 [26] Semiatin, S. L., Lahoti, G. D., Occurrence of shear bands in nonisothermal, hot forging of Ti-6Al-2Sn-4Zr-2Mo-0. 1Si, Metallurgical Transactions A, v 14A, n 1, Jan, 1983, p 105-115, ISSN: 0360-2133 [27] Dadras P., Thomas J. F. Jr., Characterization and Modeling for Forging Deformation of Ti-6Al-2Sn-4Zr-2Mo-0.1Si, Metallurgical Transactions A, v 12A, n 11, Nov, 1981, p 1867-1876, ISSN: 0360-2133. [28] Semiatin S. L., Thomas J. F. Jr, Dadras P. Processing-microstructure relationships for Ti-6Al-2Sn-4Zr-2Mo-0. 1Si, Metallurgical Transactions A, v 14A, n 11, Nov, 1983, p 2363-2374, ISSN: 0360-2133. [29] Pederson R., Doctoral Thesis 2004:19, Luleå University of Technology, Sweden, May 2004. [30] P. Åkerstöm, B. Wikman, M. Oldenburg, Material parameter estimation for a boron steel from simultaneous cooling and compression experiments, Accepted for publication in: Modelling Simulation Mater. Sci. Eng.
__________*Corresponding author: Tel.: +46-920-491193; fax: +46-920-491047 E-mail address: [email protected]


