material efficiency for smartphones - … · source: arthur d. little analysis kpi company 0,4 kpi...
TRANSCRIPT
Material efficiency for smartphones
Plenary session 2
June 28th, 2018

2
Compared to the holistic circular economy approach, Material Efficiency
KPIs are to be implemented by each player in their era of accountability
Source: Arthur D. Little analysis
Material efficiency for smartphones
Circular economy Material Efficiency KPIs
In a circular economy, each player must have a
holistic view of the value chain in which its
products are
Efficient and rigorous… but could be difficult to
implement across all stakeholders of a complex
value chain
Each player is empowered to monitor its KPIs at
its own level
Once standardized and harmonized across the
value chain, material efficiency KPIs will
increasingly be summed up, with a cradle-to-
grave approach
Production
UseRecycling
Raw
Materials
Player 1 Player 2 Player 3
KPIs calculated at firm
level, between the entry
gate and the exit gate
Holistic view

3
Material efficiency for smartphones
Source: WMF & Arthur D. Little analysis
Updated KPIs for WMF 2018
Updated set of KPIs
Use
Longer
Use
Less
Use
Smarter
Resale price
Product lifetime
% of innovative materials
Product performance vs. weight
Buy-to-use
% of recycled materials
End-of-life recycling
Overall product usage
Energy
Material value in the product / material value used in production
Total energy consumption to produce the product
Resale price after Y years / initial price (Y is industry specific)
Performance measurement of the product key functions vs. weight
Weight of recycled / total weight of materials in new product
Weight of materials effectively recycled / total weight of materials
Total lifetime of the product, from completion to waste
Weight of new or innovative materials / total weight of materials
% of the time the product is used relatively to its full capacity
Description

4
The smartphone industry value chain is composed of 4 steps, with several
types of players present in multiple steps
Material efficiency for smartphones
Source: Arthur D. Little analysis
Fabrication End of LifeUtilization
Components
(IC, display,
etc.)
Assembly &
testing
Recycling &
e-Waste
Conception
(R&D, product
design, etc.)
Marketing &
Sales
After Sale
Services /
Reparation
SM
ART
PH
ON
E L
IFE C
YC
LE
PLAY
ER
S
Reconditioning
& Resale
Distribution
OEMs
EMSs Carriers
Specialized
recycling comp.Repair shops
Specialized reconditioning companiesRetailers
Design
agencies

5
There are numerous players in the smartphone industry
Material efficiency for smartphones
Source: Arthur D. Little analysis
OEMs EMSs Carriers
Specialized
recycling
companies
Repair shops
Specialized
reconditioning
companies
ILLUSTRATIVE

6
Depending on their type, the players have a different impact on each KPI
Material efficiency for smartphones
Source: Arthur D. Little analysis
Legend:
Being in charge of design, conception
and fabrication, OEMs and EMSs have
a strong impact on all KPIs
OEMs are the only players able to
have a holistic view of their products
Carriers, repairers and
reconditioners can recycle the
product, extend its lifetime and
impact its residual value (resale
price)
Recycling companies’
impact is limited to
recycling the product
and the energy used
for reclycing
OEMs EMSs CarriersSpecialized
recycling
companies
Repair shopsSpecialized
reconditioning
companies
Use
Longer
Use
Less
Use
Smarter
Resale price
Product lifetime
% of innovative materials
Product perf. vs. weight
Buy-to-use
% of recycled materials
End-of-life recycling
Overall product usage
Energy
Limited impact of the KPI by the player
High impact of the KPI by the player

7
We have considered only the
three largest OEMs in our
analysis, representing 45% of
the global market (in units)
We have analysed the 3 largest OEMs: Samsung, Apple and Huawei
Material efficiency for smartphones
Source: Arthur D. Little analysis, Counterpoint
7%
Samsung
Xiaomi
LG
Vivo
HuaweiOppo
Apple
Others
21%
14%
10%
7%
2017
(in units)
4%7%
31%
OEM market sharesGlobal, 2017, in % of units sold
The next three OEMs do
not release Sustainability
or CSR report
8
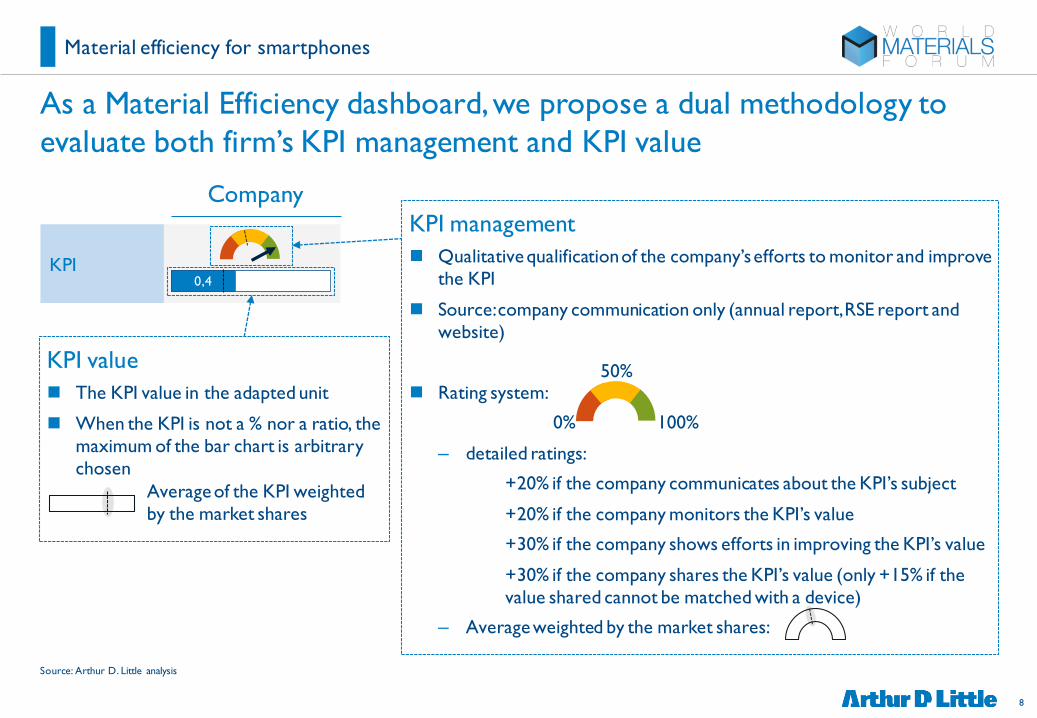
As a Material Efficiency dashboard, we propose a dual methodology to
evaluate both firm’s KPI management and KPI value
Material efficiency for smartphones
Source: Arthur D. Little analysis
KPI
Company
0,4
KPI management
Qualitative qualification of the company’s efforts to monitor and improve
the KPI
Source: company communication only (annual report, RSE report and
website)
Rating system:
– detailed ratings:
+20% if the company communicates about the KPI’s subject
+20% if the company monitors the KPI’s value
+30% if the company shows efforts in improving the KPI’s value
+30% if the company shares the KPI’s value (only +15% if the
value shared cannot be matched with a device)
– Average weighted by the market shares:
KPI value
The KPI value in the adapted unit
When the KPI is not a % nor a ratio, the
maximum of the bar chart is arbitrary
chosen
Average of the KPI weighted
by the market shares
0% 100%
50%

9
OEMs communicate about most KPIs’ subjects but rarely share values
Material efficiency for smartphones
Source: Arthur D. Little analysis, Samsung, Apple, Huawei1 Maximum recycling rate for iPhone 6 using Liam
Product lifetime(year)
Buy-to-use(ratio)
% of recycled
materials(%)
End-of-life
recycling(%)
Energy(Wh)
26%
3 years
?
?
1
?
?
?
?
?
?
Samsung Apple Huawei
?
?
?
?
?
Use
Longer
Use
Less

10
In spite of a very secretive policy, Apple is more communicative about its
KPIs, and shows the best results
Material efficiency for smartphones
Source: Arthur D. Little analysis, Samsung, Apple, Huawei1 Processor speed (MHz) / weight (g) ; Samsung Galaxy S9, iPhone 8, Huawei P202 Third-party data (Decluttr)
Resale price after 1 y.(ratio)
% of innovative materials (%)
Product performance vs. weight1 (ratio)
Overall product usage (%)
Samsung Apple Huawei
30% 45%
30%
16
All KPIs13% 24% 11%
?
2
?
1417
??
?
?
2Use
Longer
Use
Smarter

11
Material efficiency for smartphones
Source: Arthur D. Little analysis, Decluttr
Example of KPI value (resale price) – Both Apple and Samsung
smartphones similarly depreciate quickly over the first 2 years
-85%
-80%
-75%
-70%
-65%
-60%
-55%
-50%
-45%
-40%
-35%
-30%
-25%
0 1 2 3 4 5 6 7 8 9 10 11 12 13 14 15 16 17 18 19 20 21 22 23 24
Months after release
Average rate of depreciationSource Decluttr (US smartphone reseller), iPhone 5 to 7, Galaxy S3 to S7
Apple
iPhone
Samsung
Galaxy S

12
3. KPIs data analysis
Source: Arthur D. Little analysis, Apple
Example of KPI value : Product performance vs. weight of iPhones
522560
427
358383383
190194
129102100
0
100
200
300
400
500
600
iPhone iPhone 4iPhone 3G iPhone 4SiPhone
3GS
iPhone 6SiPhone 5 iPhone 8iPhone 5S iPhone 6 iPhone 7
Product performance vs. weight of iPhonesProcessor speed / weight, index 100 for iPhone 1

13
Overall, OEMs shows rather low performance on average, both for KPI
management and KPI value
Material efficiency for smartphones
Source: Arthur D. Little analysis
KPIs
Use Longer
Use
Less
Use
Smarter
Resale price
Product lifetime
% of innovative materials
Product performance vs. weight
Buy-to-use
% of recycled materials
End-of-life recycling
Overall product usage
Energy
KPI management average KPI value average
0%
0%
9%
0%
20%
25%
10%
78%
0%
14
Material efficiency for smartphones
Source: Arthur D. Little analysis
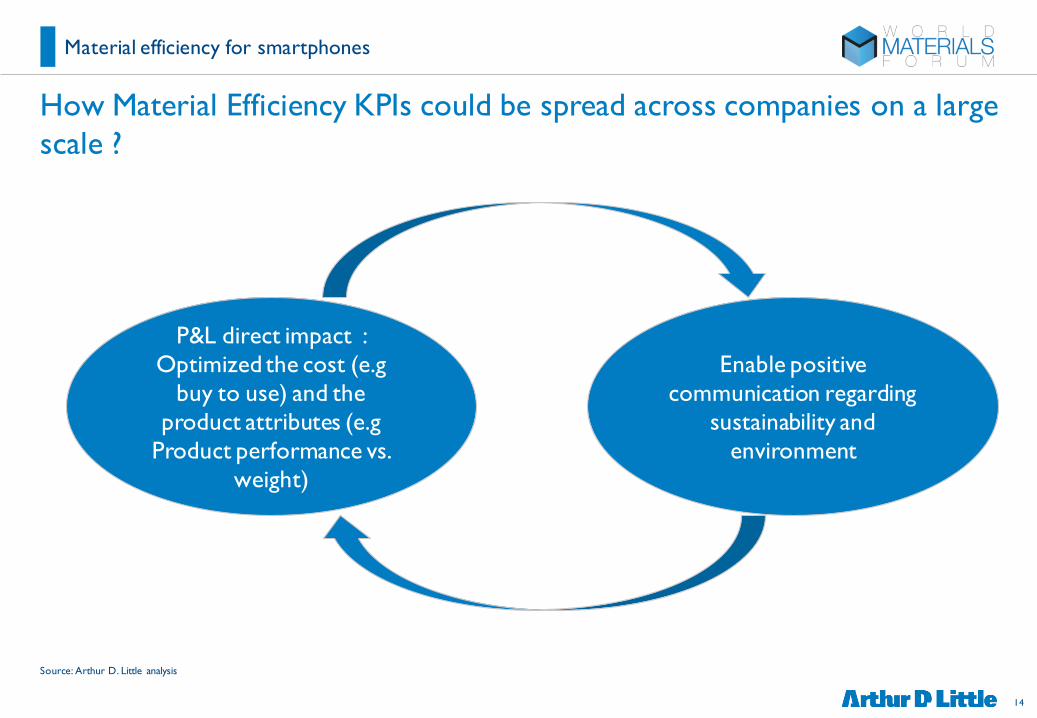
How Material Efficiency KPIs could be spread across companies on a large
scale ?
Cost management
Risk managementP&L direct impact :
Optimized the cost (e.g
buy to use) and the
product attributes (e.g
Product performance vs.
weight)
Enable positive
communication regarding
sustainability and
environment

Arthur D. Little has been at the forefront of innovation since 1886. We are an acknowledged thought leader in linking strategy, innovation and transformation in technology-intensive and converging industries. We navigate our clients through changing business ecosystems to uncover new growth opportunities. We enable our clients to build innovation capabilities and transform their organizations.
Our consultants have strong practical industry experience combined with excellent knowledge of key trends and dynamics. Arthur D. Little is present in the most important business centers around the world. We are proud to serve most of the Fortune 1000 companies, in addition to other leading firms and public sector organizations.
For further information please visit www.adlittle.com.
Copyright © Arthur D. Little 2018. All rights reserved.
Contacts:
Vincent BambergerManaging Partner
Arthur D. Little Paris7, place d’Iéna75116 [email protected]