material flow analysis of similar and dissimilar friction
TRANSCRIPT

Material Flow Analysis of Similar and Dissimilar
Friction Stir Welding
A Thesis Submitted in
Partial Fulfillment of the Requirements
for the Degree of
DOCTOR OF PHILOSOPHY
by
ARUN KUMAR KADIAN
(Roll No. 126103029)
DEPARTMENT OF MECHANICAL ENGINEERING
INDIAN INSTITUTE OF TECHNOLOGY GUWAHATI
GUWAHATI-781039, INDIA
December 2018

DEPARTMENT OF MECHANICAL ENGINEERING
INDIAN INSTITUTE OF TECHNOLOGY GUWAHATI
GUWAHATI–781039, ASSAM, INDIA
CERTIFICATE
This is to certify that the thesis entitled “Material Flow Analysis of Similar and
Dissimilar Friction Stir Welding” submitted by Mr. Arun Kumar Kadian (Reg. No.
126103029) to the Department of Mechanical Engineering, Indian Institute of
Technology Guwahati, is a record of original research work carried out under my
supervision and it has not been submitted elsewhere for the award of any other degree or
diploma.
The thesis in my opinion, has reached the standard fulfilling the requirements for the
award of degree of Doctor of Philosophy in accordance with the regulations of the
institute.
Prof. Pankaj Biswas
Department of Mechanical Engineering,
Indian Institute of Technology Guwahati,
Guwahati – 781039, India
21st December, 2018
TH-1875_126103029

Declaration
I declare that the present written submission is my thoughts in my own words. I have adequately
cited and referenced the original sources, where others’ works have been involved. I also declare
that I have followed all principles of academic morality and honesty and have neither fabricated
nor falsified any idea/data in the present thesis. I realize that any defilement of the above will be
cause for disciplinary action by the Institute and can also induce disciplinary action from the
sources which have thus not been properly cited.
(Arun Kumar Kadian)
Dated: 21st December, 2018 Reg. No. 126103029
TH-1875_126103029

Dedicated
To
My Family
TH-1875_126103029
ACKNOWLEDGEMENTS
I would like to express my heartfelt gratitude towards all those who have immensely
helped me during this long arduous journey and eventually assisted me to emerge as an
experienced researcher and a mature individual.
First and foremost, I must express my deepest sense of appreciation and respect for my
thesis supervisor Prof. Pankaj Biswas for providing me the opportunity to work under
their supervision. His persistent patience and friendliness in the moments of difficulties
have always been remembered and also his constant encouragement have played a
crucial role in writing the thesis and bringing it to its present form.
I would like to thank my doctoral committee members, Prof. P. S. Robi, Prof. M. Das,
and Prof. T. K. Mandal for carefully reading the reports at various stages of evaluation
and providing many useful comments, which have helped in the development of this
thesis.
My sincere gratefulness to past and present departmental heads Prof. D. Chakraborty,
Prof. P. Mahanta, Prof. A. K. Dass and Prof. S. K. Dwivedy for their kind permission for
enrollment, registration and several important supports at IIT Guwahati. I am also
grateful to all the faculty members of Mechanical Engineering Department for giving me
a comfortable and friendly environment for pursuing my research. I would also like to
acknowledge the contribution of office staff, for helping me with various academic as
well as non-academic issues.
I would like to express my sense of gratitude to Mr. N K Das, present Assistant
Workshop Superintendent and all the staffs of the workshop specially Mr. Dilip Chetri,
Mr. Dipak K. Deka, Mr. Chandan Banikya, Mr. Minesh Ch. Medhi, Mr. Nidul Saikia and
Mr. Amzad Khan for extending their help in fabrication of the different experimental set-
ups for this work.
I also wise to express my gratitude to the Central Instrument Facility, IIT Guwahati to
providing technical support with SEM, and FESEM.
The financial support of this research, which was provided by the Department of
Mechanical Engineering, Indian Institute of Technology Guwahati, is gratefully
acknowledged.
TH-1875_126103029

The most important support for this work came from my parents, Sri. Naresh Kumar
Kadian and Smt. Raj Bala Kadian, and my siblings, Mr. Varun Kumar Kadian and Miss
Komal Kadian for encouraging me to go still further at every points of life. I would like
to thank my extended family for all of their love and support through the years,
especially at peak of the economy encouraged me to pursue Ph.D on a modest stipend.
Finally the friends form an important part of this long and enduring journey, and without
their constant support and encouragement, the completion of this thesis perhaps would
have been an impossible task. I express my sincere thanks to Dr. Anil Deepati, Dr. Arpan
Mondal, Mr. Biplab Das, Dr. Syed Shahanawazuddin, Mr Shatrughan Jaiswal and Mr.
Rajendra Soni for their help and support.
I acknowledge the moral support of Prof. S. N. Bora, Mrs. Swapnali Bora, Prof. Gagan
Kumar, Dr. Punit Sharma, Dr. Pankaj Singh, Mr. Gaurav Kumar, Mr. Ashutosh Singh,
Mr. Kishor Gajrani, Mr. Anand Aggarwal, Mr. Mukul Parmanand, Mr. Shyam Trivedi,
Mr. Vinay Kulkarni, Mr. Jimmy Daimari, Mr. Nand Kishor Roy, Mr. Shiv Sahaya
Shukla, Mr. Vishesh Singh, Mr. Karam Malik, Mr. Gaurav Saini, Mr. Deepak Joshi, Mr.
Subrat Mallick, Dr. Ravindra Patil, my other hostel mates and colleagues. I shall forever
be grateful to all my friends and well-wishers.
I consider myself privileged and fortunate to work in the Indian Institute of Technology
Guwahati.
Above all, I am thankful to the Almighty.
21st December, 2018 Arun Kumar Kadian
TH-1875_126103029

i
Abstract
The friction stir welding is a solid-state joining process in which joining takes place
just below the melting point temperature where the material undergoes high plastic
deformation under the influence of rotating tool. The tool and process parameters (like
tool rotation speed, tool traverse speed, plunging force, tool geometry) not
only affect the welding temperature but also decide the material flow patterns in the
welding region. The knowledge of material flow provides the sufficient information to
the operator about the selection of right tool geometry in order to obtain a defect-
free weld. Therefore in this thesis, the numerical and experimental studies are
conducted to understand the material flow behaviour of friction stir welding process.
In this work, the numerical models are created for thermal and material flow analysis
of the process. The thermal analysis is conducted using heat generation equations
derived based on Coulombs fiction and the plastic deformation heat generation inside
the plate. The material flow models for similar and dissimilar friction stir welding are
developed to study the material flow behaviour in the weld region. The convective
heat loss is considered from all the surfaces and a comparative study has been made
with and without the use of temperature dependent material properties and their
significance in the finite volume method model. The backing plate heat loss is also
considered along with the convective heat loss in the simulation. The material flow
analysis of AA6061 weld plates is performed in ANSYS Fluent 14.5. It is observed
that the material properties are highly significant in the development of a flow model,
therefore temperature and strain rate dependent material properties have been used in
the current analysis. The viscosity of the material used in all the models is based on
Zener-Holloman parameters which are found to be best-suited for the material flow
model. Two types of models are used to study the material flow behaviour i.e.
turbulent and laminar model. The material flow velocities are analyzed to predict the
flow behaviour and characteristics in friction stir welding. The results obtained from
the numerical model are compared with experimental results.
The numerical models further extended to study the influence of seven different tool
geometries on material flow. It is observed that the tool pin geometry significantly
affects the material flow in the welding region. A swirling motion of the material is
TH-1875_126103029
ii
observed in all the cases but it took place at different positions according to different
tool pin geometries. A better material mixing is observed with tool having circular pin
profile in comparison to the flat pin profiles. It is observed from the viscosity
distribution that the conical pins are unable to mix the material properly near the probe
tip region.
This study is further extended to analyze the dissimilar friction stir welding. In this
case, cylindrical threaded tool geometry is considered to join Aluminium alloy (AA-
6061) and Copper alloy (Cu-B370) plates. The model used the volume of fluid (VOF)
approach in the commercial FVM package ANSYS fluent 14.5. Experiments are also
conducted to validate the model with thermal profiles and optical micrographs.
Furthermore, the effect of tool rotational and the welding speed are studied on the
material movement. It is found that process parameter had a huge impact on the nugget
zone formation during the welding. The tool rotaion and welding speed directly affect
the amount of platisized material mixing for conducting the dissimilar friction stir
welding.
For further study, the VOF model is extended to analyze the material flow behaviour
of a weldment having worm defect. It is found that the influence of tool shoulder is
more on the velocity response for defected plate in comparison to undefected plate in
the welding region.
TH-1875_126103029
iii
Table of contents
Abstract i
Table of contents iii
List of Figures vii
List of Tables xiii
Nomenclature xv
Chapter 1 Introduction 1
1.1 Preamble 1
1.2 Motivation 1
1.3 History 3
1.4 Terminology 4
1.5 Microstructural features 6
1.6 Process parameters 7
1.7 Research objectives 8
1.8 Thesis structure 8
1.9 Target applications 9
Chapter 2 Literature Review 11
2.1 Introduction 11
2.2 Material selection 11
2.3 Process parameters 14
2.4 Tool geometries 16
2.5 Microstructure 19
2.6 Defects 20
2.7 Material flow behaviour 22
2.8 Dissimilar friction stir welding 24
2.9 Analytical and numerical methods 26
TH-1875_126103029
iv
2.10 Summary 28
2.11 Gaps in literature 29
2.12 The scope of the thesis 30
Chapter 3 Model Methodology 31
3.1 Introduction 31
3.2 Heat generation in FSW tool 31
3.2.1 Heat generation due to flat cylindrical shoulder with cylindrical probe 31
3.2.2 Heat generation in flat cylindrical shoulder with conical probe 35
3.3 Heat generation due to plastic deformation 40
3.3.1 Heat generation in flat cylindrical shoulder and cylindrical probe 40
3.3.2 Heat generation in flat cylindrical shoulder with conical probe 42
3.4 Three-dimensional finite element model 44
3.4.1 Meshing details 50
3.5 Material flow models for similar material 53
3.5.1 Boundary conditions 55
3.5.2 Governing equations 56
3.5.3 Solver and discretization schemes 57
3.5.4 Material properties 57
3.6 Dissimilar material VOF Model 59
3.6.1 Boundary conditions 60
3.7 Experimental details 61
3.8 Summary 66
Chapter 4 Transient Thermal Analysis 67
4.1 Introduction 67
4.2 Effect of rotational speed 67
4.3 Effect of traverse speed 70
4.4 Effect of tool diameter 71
TH-1875_126103029
v
4.5 Results of sticking and sliding conditons 71
4.6 Temperature distribution along the thickness 73
4.7 Experimental details 74
4.8 Summary 75
Chapter 5 Material Flow Behaviour 77
5.1 Introduction 77
5.2 Modelling details 77
5.3 Results and discussion 79
5.4 Validation of model 88
5.5 Summary 89
Chapter 6 Material Flow Behaviour for Different Pin Profiles 91
6.1 Introduction 91
6.2 Modelling details 91
6.3 Results and discussion 93
6.3.1 Effect of rotational speed on material flow 107
6.3.2 Effect of translational velocity on material flow 109
6.4 Summary 111
Chapter 7 Material Flow Behaviour of Dissimilar FSW 113
7.1 Introduction 113
7.2 Modelling details 113
7.3 Results and discussion 114
7.4 Experimental procedure 121
7.5 Experimental results 122
7.6 Summary 126
Chapter 8 Material Flow Behaviour for Defected Geometry 127
8.1 Introduction 127
8.1 Modelling details 127
TH-1875_126103029
vi
8.2 Results and discussion 130
8.3 Summary 136
Chapter 9 Conclusions and Future Scope 139
9.1 Conclusions 139
9.2 Future scope 140
Bibliography 142
TH-1875_126103029
vii
List of Figures
Figure
No. Description
Page
No.
1.1 Welding timeline (1800-1991) from early age blacksmith to
advanced FSW solid state welding.
3
1.2 Different welding techniques categorized based on their
methodology.
4
1.3 Diagram showing various terminologies used in a butt joint
FSW with tool rotation and traverse direction.
5
1.4 Different forces acting in butt joint FSW. 5
1.5 Different zones found in FSW [13]. 6
2.1 Research articles per year (picture from INSPEC-© Elsevier
Inc.).
12
2.2 Different tool profiles used in Hattingh et al. [45]. 17
2.3 6061 Aluminium/Copper friction-stir weld composite (R=650
rpm, T=1 mm/s). (b) An enlarged view of a region in the weld
plane section marked (b) in (a) above showing intercalation
swirl microstructure [69].
20
3.1 Schematic diagram of flat cylindrical FSW tool. 32
3.2 Small elementary area of shoulder. 32
3.3 Schematic diagram of flat cylindrical shoulder and conical
probe.
36
3.4 Small elemental area of probe. 37
3.5 Small elemental triangle. 37
3.6 Solid 70 brick element (ANSYS) used for thermal analysis. 50
3.7 FE model and meshing view for transient thermal analysis. 51
3.8 The rise and fall of temperature across the weld line of all
four mesh sizes.
52
3.9 The variation of all four mesh sizes in the temperature profile. 52
3.10 (a) The model of the tool and (b) the meshing and the tool
impression.
53
3.11 The welding cross-sectional temperature profile on 54
TH-1875_126103029
viii
Advancing and retreating side. The positive value of Y is
Advancing and negative value of Y is retreating side while 0
is the centre line of the weld.
3.12 The difference in the peak temperature of all four meshes. 54
3.13 The schematic diagram of the material flow analysis of
similar FSW.
55
3.14 The temperature-dependent thermal conductivity and specific
heat of AA6061 alloy, along with the fitted curve [144, 146].
58
3.15 The Schematic diagram used in material flow model of
dissimilar FSW.
61
3.16 AA6061 workpieces used to perform welding. 62
3.17 Conical pin geometry used to perform similar welding. 62
3.18 FSW machine with thermocouples and system data
acquisition system.
63
3.19 Experimental setup for measuring the thermal profile of FSW. 64
3.20 The moving point method used in transient material flow
model to study the thermal profile of FSW.
64
3.21 Experimental setup of the FSW performed. 65
3.22 Procedure for microstructure analysis. 65
4.1 Location of point A and B on the plate top surface. 68
4.2 Temperature variation with rotational speed. 68
4.3 Transient temperature graph for 1400 rpm and 2mm/s tool
traverse speed.
69
4.4 Temperature profile of a 1400 rpm rotational speed at 50s. 69
4.5 Temperature variation with traverse speed. 70
4.6 Temperature profiles for different shoulder diameter. 71
4.7 Temperature variation at (a) point A and (b) point B. 72
4.8 Top and Bottom surface temperature at A and B points. 73
4.9 Temperature contours along the weld line and cross-section. 74
4.10 Comparison between numerical and experimental results. 75
5.1 (a) The model of the tool and (b) the meshing and the tool
impression on the plate.
78
5.2 Planes location used for analyzing the material flow in the 79
TH-1875_126103029

ix
study.
5.3 (a) Top view of the velocity vector and (b) cross-sectional
view at the central axis of the tool.
80
5.4 (a) Temperature profile with constant properties and (b)
temperature profile with temperature dependent properties.
82
5.5 Velocity vectors plots at (a) plane 1 and (b) plane 5 showing
top and cross-sectional view.
83
5.6 Temperature contour at (a) plane 1 and (b) plane 5. 84
5.7 Vector plots at (a) 0.2 mm from the top surface (plane 1), (b)
3 mm from the top surface (plane 2) and (c) 5.9 mm from the
top surface (plane 3).
85
5.8 (a) Top view of the velocity vector and (b) mid-section view
of the velocity vector using the turbulent model.
86
5.9 Viscosity variation implemented into the material. 87
5.10 Difference in temperature profile for advancing and retreating
side at a distance 20 mm away from the centre line.
88
5.11 Experiment and numerical thermal profile comparison of a
conical pin tool (a) advancing side and (b) retreating side at
1100 rpm and 2 mm/s welding speed.
89
6.1 Different types of pin profiles used in the analysis. 92
6.2 An oblique view of the mesh type used for the analysis where
the finer tetrahedral elements are used in the tool wall region
to capture more information under the tool.
92
6.3 The temperature variations at 0.1 mm above the bottom
surface of the plate for all cases on AS and RS. The Figure is
showing the temperature drop on moving away from the weld
zone where the positive and negative values of Y represent
the AS and RS respectively.
94
6.4 Temperature variations with time for all the geometries at 20
mm away from the centre line on (a) advancing side and (b)
retarding side.
94
6.5 The velocity vector plot of the tool wall for conical threaded
pin geometry (a) top view and (b) inclined view.
95
TH-1875_126103029

x
6.6 Velocity vectors around the pin for conical threaded pin
profile at all 8 directions around the pin at 50 s of the welding
time.
96
6.7 The vector plots showing the material movement under the
tool shoulder on front and back sides (along Y direction) of
the tool.
98
6.8 Velocity (m/s) profiles in direction of welding i.e. along X
direction (Vx) of all seven geometries. The cross-section view
shows the RS by -Y whereas, the AS by -Y of the material.
100
6.9 Velocity (m/s) profiles of the material movement towards and
away from the pin i.e. Y direction velocity component (Vy)
for all seven geometries.
101
6.10 Velocity (m/s) profiles for upward and downward material
movement along the height pin probe i.e. Z-direction velocity
component (Vz) of all seven geometries.
102
6.11 The vector plot of material movement perpendicular to the
weld line i.e. cross section of the welding at 50s.
103
6.12 Stream traces of conical pin geometry showing the flow
separation region on the advancing side of the weld.
104
6.13 Temperature distribution of conical threaded pin profile tool
for (a) anti-clockwise and (b) clockwise tool rotation.
105
6.14 Velocity vector plot conical threaded pin profile tool for (a)
anti-clockwise and (b) clockwise tool rotation.
106
6.15 A cross-section view of the FSW showing viscosity
distribution for a conical with grooves pin profile geometry.
107
6.16 Vector plot variation at (a) 900 rpm, (b) 1100 rpm and (c)
1300 rpm and 2 mm/s welding speed on plane 2.
109
6.17 Velocity vector plot at 1100 rpm with (a) 1.4 mm/s, (b) 2
mm/s and (c) 2.6 mm/s tool traverse speed at plane 2.
111
7.1 The pin profiles used in the analysis. 114
7.2 Mesh view of the cylindrical threaded pin wall embedded in
the plates.
114
7.3 Top surface temperature distribution contour of Al and Cu 115
TH-1875_126103029

xi
plate FSW. The Al plate is on advancing side while Cu is on
the retarding side. The front part shows the unwelded region
whereas the back side is the welded region.
7.4 The temperature distribution along the cross-section at the
mid-region of the plate placing Al and Cu on the advancing
and retarding side respectively.
116
7.5 The X-direction velocity (Vx) in the cross-section from the
mid-section of the plate for (a) 900 rpm, (b) 1100 rpm and (c)
1300 rpm. It is the rate and amount of material movement
along the weld line.
117
7.6 The Y-direction velocity (Vy) in the cross-section from the
mid-section of the plate for (a) 900 rpm, (b) 1100 rpm and (c)
1300 rpm. It is the rate and amount of material movement
forced away and attracted towards the tool pin.
117
7.7 The Z-direction velocity (Vz) in the cross-section from the
mid-section of the plate for (a) 900 rpm, (b) 1100 rpm and (c)
1300 rpm. It is the rate and amount of material movement
along the thickness of the plate around the tool surface.
118
7.8 The X-direction velocity (Vx) in the cross-section from the
mid-section of the plate for (a) 1.8 mm/s, (b) 2.0 mm/s and (c)
2.2 mm/s welding speed.
119
7.9 The Y-direction velocity (Vy) in the cross-section from the
mid-section of the plate for (a) 1.8 mm/s, (b) 2.0 mm/s and (c)
2.2 mm/s welding speed.
119
7.10 The Z-direction velocity (Vz) in the cross-section from the
mid-section of the plate for (a) 1.8 mm/s, (b) 2.0 mm/s and (c)
2.2 mm/s welding speed.
120
7.11 The viscosity variation below the tool on the advancing and
retarding side along the cross-section plane perpendicular to
the welding direction.
121
7.12 Tool used for performing the experiments. 122
7.13 Instron-8801 tensile testing machine with AA6061- Cu B370
weld sample.
123
TH-1875_126103029

xii
7.14 Microstructure of the weld nugget zone. 124
7.15 The Cu chunks move towards the Al side is visible here. 124
7.16 The temperature profile at 20 mm from the weld line (a)
advancing side and (b) retarding side.
125
8.1 Measurement of tunnel defect formed during the welding. 128
8.2 Defect measurement made 3.5 mm below the top surface in
geometry of the material flow model.
128
8.3 The model setup with all the walls and the material region
used in the analysis.
129
8.4 Observatory point situated at the middle of plate thickness
just behind the pin. Four points are under the shoulder while
one point is outside the shoulder region.
129
8.5 The comparison of velocity response obtained for defected
and undefected model in terms of (a) Resultant velocity
magnitude(V), (b) X-component velocity (Vx), (c) Y-
component velocity (Vy) and (d) Z-component velocity (Vz)
at point A.
130
8.6 The comparison of velocity response obtained for defected
and undefected model in terms of (a) Resultant velocity
magnitude(V), (b) X-component velocity (Vx), (c) Y-
component velocity (Vy) and (d) Z-component velocity (Vz)
at point B.
131
8.7 The X-velocity (Vx) components of defected and undefected
weld geometry at all five points. The velocity is along the
welding direction.
133
8.8 The Y-velocity (Vy) components of defected and undefected
weld geometry at all five points. The graph shows the
variation of Y-component of velocity with time.
134
8.9 The Z-velocity (Vz) components of defected and undefected
weld geometry at all five points. The graph shows the
variation of Z-component of velocity with time.
135
TH-1875_126103029

xiii
List of Tables
Table
No.
Description Page
No.
2.1 The process parameters used by the authors to conduct their
experiments.
15
2.2 Optimized FSW process parameters which provided defect-
free weld [36].
16
2.3 Tool geometries used for different alloys of Aluminium [47]. 17
3.1 Temperature-dependent material properties of Aluminium
used in FE analysis [142], [143].
45
3.2 Temperature-dependent friction coefficient of Aluminium and
steel [142], [143].
45
3.3 The peak temperature obtained for all four meshes. 51
3.4 The different mesh size taken for the analysis. 53
4.1 Maximum Temperature vs. Rotational speed. 67
4.2 The Maximum temperature at point A and B at different tool
traverse speed.
70
4.3 Physical properties of SS310. 75
6.1 The peak temperature obtained during the analysis. 93
6.2 Maximum and minimum velocities perpendicular to weld line. 99
7.1 The process parameter and the welding efficiency of joints
formed during the welding.
123
TH-1875_126103029

xiv
TH-1875_126103029
xv
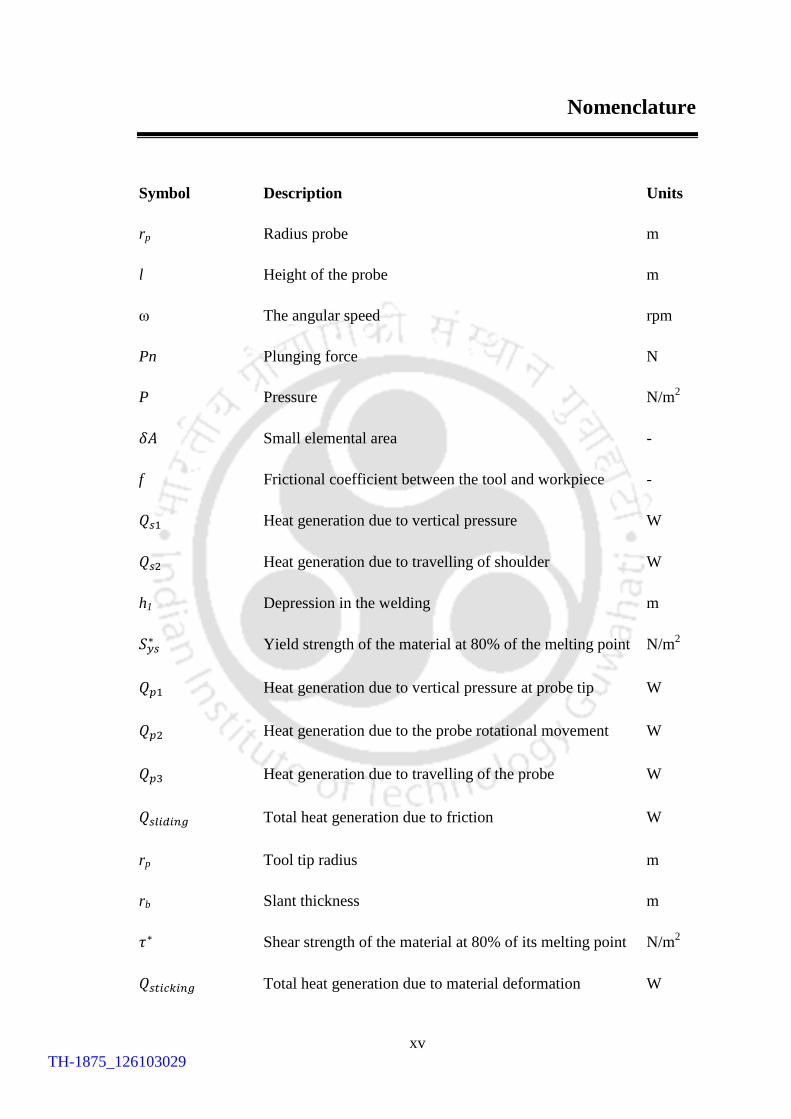
Nomenclature
Symbol Description Units
rp Radius probe m
l Height of the probe m
ω The angular speed rpm
Pn Plunging force N
P Pressure N/m2
𝛿𝐴 Small elemental area -
f Frictional coefficient between the tool and workpiece -
𝑄𝑠1 Heat generation due to vertical pressure W
𝑄𝑠2 Heat generation due to travelling of shoulder W
h1 Depression in the welding m
𝑆𝑦𝑠∗ Yield strength of the material at 80% of the melting point N/m
2
𝑄𝑝1 Heat generation due to vertical pressure at probe tip W
𝑄𝑝2 Heat generation due to the probe rotational movement W
𝑄𝑝3 Heat generation due to travelling of the probe W
𝑄𝑠𝑙𝑖𝑑𝑖𝑛𝑔 Total heat generation due to friction W
rp Tool tip radius m
rb Slant thickness m
𝜏∗ Shear strength of the material at 80% of its melting point N/m2
𝑄𝑠𝑡𝑖𝑐𝑘𝑖𝑛𝑔 Total heat generation due to material deformation W
TH-1875_126103029

xvi
𝛿 Sliding factor -
𝑄𝑡𝑜𝑡𝑎𝑙 Total heat generation W
K Thermal conductivity W/mK
T Temperature K
Density of the material kg/m3
c Specific heat J/kgK
t Time s
T Ambient temperature K
supq Heat flux supplied W/m2
convq Heat loss due to convection W
u, v and w The velocities in the X, Y and Z directions m/s
Fx, Fy and Fz Forces in X, Y and Z directions N
p Static pressure of the flow field N/m2
µ The viscosity of fluid Ns/m2
휀̇ Strain rate 1/s
𝜎𝑅 Effective stress N/m2
Q Activation energy (Al) kJ/mol
R Universal gas constant J/molK
Z Zener-Holloman parameter 1/s
E Activation energy (Cu) kJ/mol
β Volume fraction of the fluid -
α Tool area inside Al plate/ the total area of the tool wall -
TH-1875_126103029

xvii
Vx X- component of velocity obtained in results m/s
Vy Y- component of velocity obtained in results m/s
Vz Z- component of velocity obtained in results m/s
TH-1875_126103029

xviii
TH-1875_126103029
Chapter 1
Introduction
1.1 Preamble
The Friction Stir Welding (FSW) is a solid-state joining process which is known for its
significant advantages over conventional welding methods [1] for softer material like
Aluminium (Al), Copper (Cu) etc. The process invented by Thomas et al. [2] at The
Welding Institute (TWI), Cambridge, UK and patented in 1991 which requires no filler
material or consumable electrode. The welding takes place above the recrystallization
temperature (RT) but below the melting point (MP) temperature. Above the RT, the
material becomes soft enough that it can be mixed with the help of tool. Since the
temperature of welding goes to 80% of the melting point temperature, it is also known
as the hot working process. The material adjacent to the tool sticks to the tool wall and
moves with rotational movement of the tool. As the tool starts moving along weld line,
the fresh material from the front side of the tool pushes the old rotating material or the
soft material and replaces it to participate in welding and a welding mixture is left
behind the tool. The FSW Process is most suitable for critical applications, for the
joining of structural components made of Aluminium and its alloys. The history and
evolution of welding, FSW terminology, basic microstructure features of the welding
is described in the various section of the chapter. After having the basic understanding
of the welding process the governing process parameters are explained with their role
in the FSW process
1.2 Motivation
Light weight high strength materials have attracted a lot of industries because of the
fast mobility of products in day to day life. Due to product driven economies in the
world, countries want lighter products from their industries for mass transportation in
order to achieve higher and faster trade. Therefore, the vehicles needed to transport
these products have to be lighter such that a larger number of products can be
accommodated into the transporting vehicles. Thus, not only buyer based industries
TH-1875_126103029
Material Flow Analysis of Similar and Dissimilar Friction Stir Welding
2
want light weight material but the transport industries also need light weight high
strength material to increase the load as well as fuel efficiency [3].
Considering the current scenario, Aluminium is the best-suited material [4]. Earlier, it
was quite expensive because of difficult extraction, but the recent advances in past
decades led to the higher production of Aluminium [5]. In spite of the desirable
properties of Aluminium, industries were not able to use it on a full scale as in many
application the joining of metal is required and in this case, the metal is not perfectly
suited for welding. The welding of the mentioned metal is difficult to achieve due to
the problems caused by the metal oxide. Aluminium is a highly reactive metal with a
very high affinity towards the oxygen. Thus, in the open air, it readily reacts with the
oxygen present in the atmosphere to form an Aluminium oxide. The Aluminium oxide
is a much harder material and having a much higher melting point than the pure
Aluminium metal. This oxide layer causes a huge problem in welding in comparison to
any other commercial metals [6]. Therefore, a highly skilled worker is required with
huge experience in welding to form healthy Aluminium welding joints.
To overcome these welding difficulties, huge researches were carried out in the past
few decades. As a result in the year 1991, the welding Institute came up with a new
method of friction welding that can weld produce a good quality of butt weld with the
help of a spinning tool. This technique is quite new and shown promising results in
welding softer metal like Aluminium and Copper. A number of potential advantages of
FSW over conventional fusion-welding processes have been identified [7] like good
mechanical properties in the as-welded condition, Improved safety due to the absence
of toxic fumes or the spatter of molten material, no consumables - so economically
cheaper than conventional welding processes, easily automated on simple milling
machines - lower setup costs and less training, Low environmental impact- it is also
known as green welding and environmental friendly welding technology. According to
the survey conducted by AWS, the FSW can save up to $ 34.4 billion per year in the
USA. So, the adoption of FSW has increased and 10% of the welding process will be
replaced by FSW [8].
TH-1875_126103029
Introduction
3
1.3 History
Although, the solid state joining process is the oldest joining technique used by the
blacksmith in the middle age to make tools and weapons [9], the joining of metal
emerged as a manufacturing process in the late 1800’s. Since then, the welding
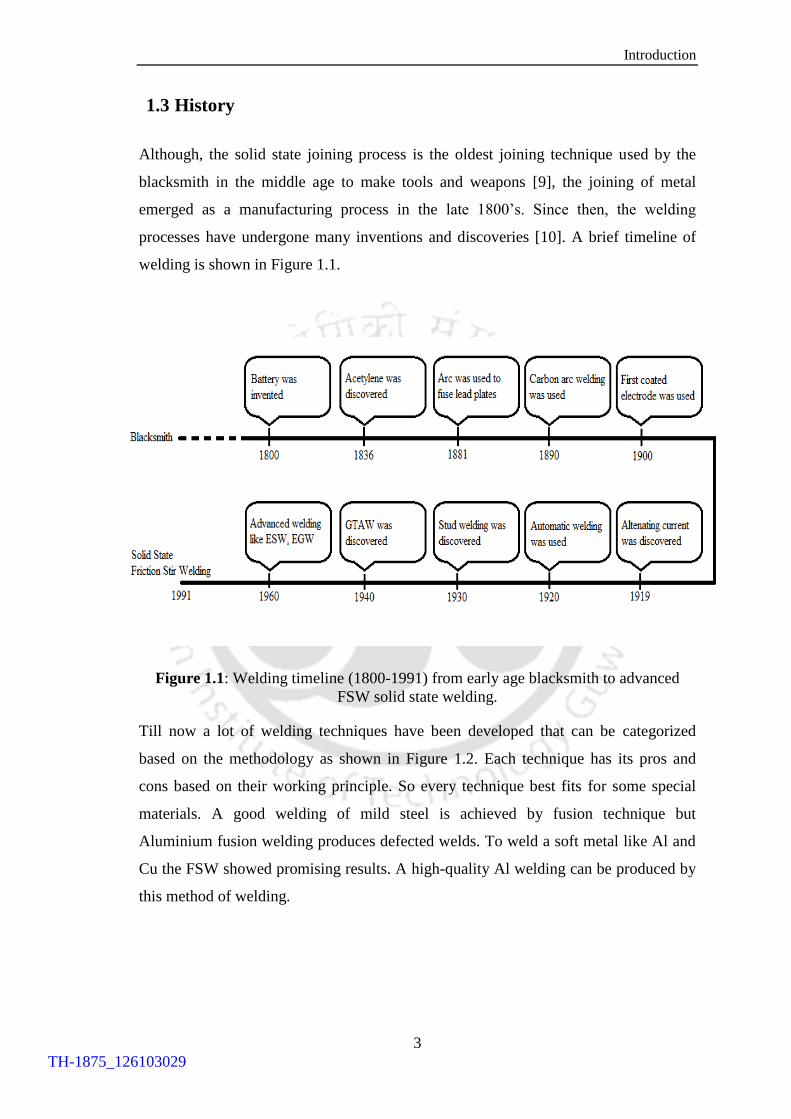
processes have undergone many inventions and discoveries [10]. A brief timeline of
welding is shown in Figure 1.1.
Figure 1.1: Welding timeline (1800-1991) from early age blacksmith to advanced
FSW solid state welding.
Till now a lot of welding techniques have been developed that can be categorized
based on the methodology as shown in Figure 1.2. Each technique has its pros and
cons based on their working principle. So every technique best fits for some special
materials. A good welding of mild steel is achieved by fusion technique but
Aluminium fusion welding produces defected welds. To weld a soft metal like Al and
Cu the FSW showed promising results. A high-quality Al welding can be produced by
this method of welding.
TH-1875_126103029

Material Flow Analysis of Similar and Dissimilar Friction Stir Welding
4
Figure 1.2: Different welding techniques categorized based on their methodology.
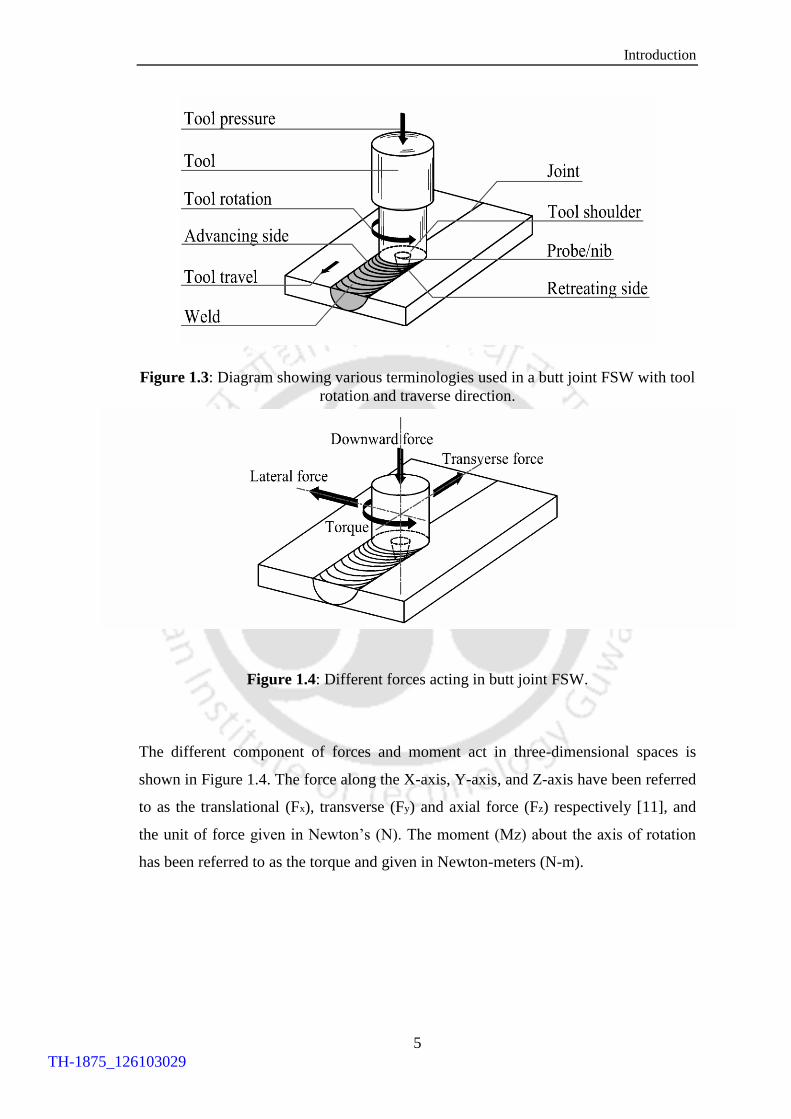
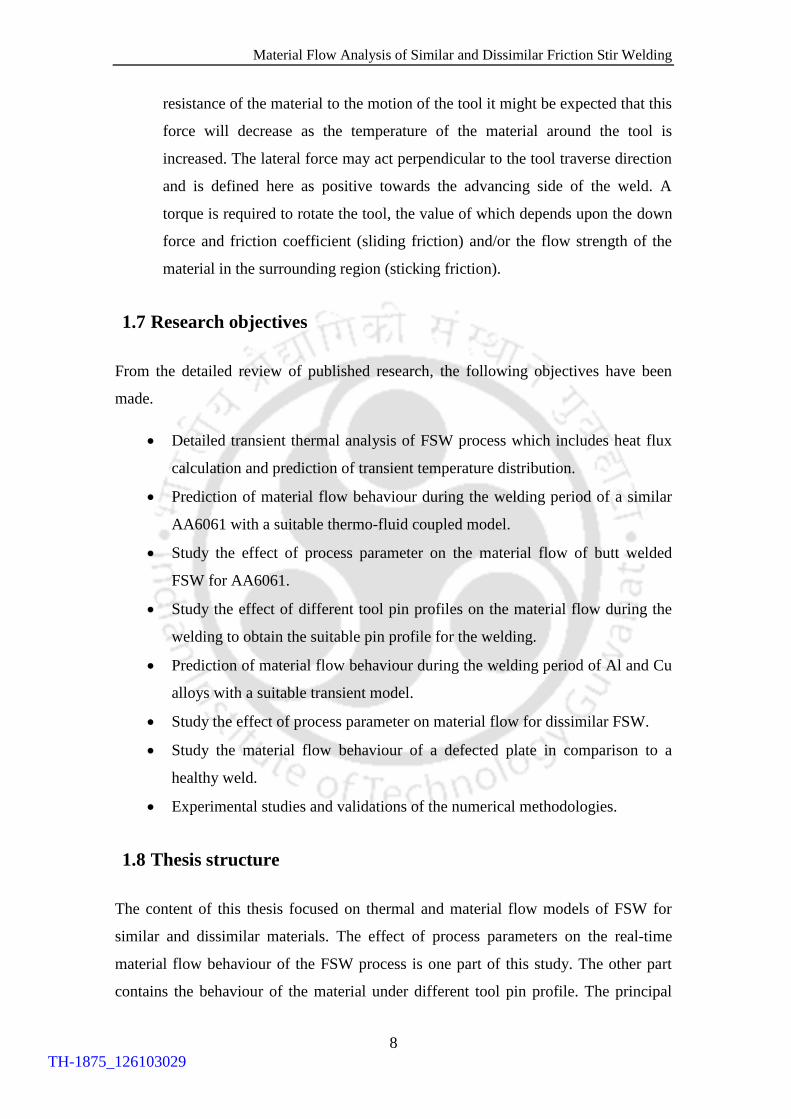
1.4 Terminology
The terminology of FSW is very important to have a better understanding of the
process. The rotating part is known as a tool which consists of a cylindrical shoulder
with a probe/tool pin. The material in which the tool plunged and welded can be called
as the work piece/part/sample/welded plate. The line joining the two pieces of the
workpieces where the samples are butted together is referred as the weld line. The
device used to support and clamp the workpiece is called the anvil/backing plate. The
tool rotates at an angular velocity given in revolutions per minute (rpm), which is
referred as rotational speed. The translational velocity at which the tool travels along
the weld line is called the feed rate or travel/ transverse speed i.e. in millimetre per
second (mm/s).
The side of the weld where the angular velocity and forward velocity of the tool is in
the same direction is called the advancing side. The other side where the angular
velocity and translational velocity are in opposite directions is called the retreating side
as shown in Figure 1.3.
TH-1875_126103029
Introduction
5
Figure 1.3: Diagram showing various terminologies used in a butt joint FSW with tool
rotation and traverse direction.
Figure 1.4: Different forces acting in butt joint FSW.
The different component of forces and moment act in three-dimensional spaces is
shown in Figure 1.4. The force along the X-axis, Y-axis, and Z-axis have been referred
to as the translational (Fx), transverse (Fy) and axial force (Fz) respectively [11], and
the unit of force given in Newton’s (N). The moment (Mz) about the axis of rotation
has been referred to as the torque and given in Newton-meters (N-m).
TH-1875_126103029

Material Flow Analysis of Similar and Dissimilar Friction Stir Welding
6
1.5 Microstructural features
In the FSW process, the microstructure can be broken up into four zones [12] as shown
in Figure 1.5. The stir zone (also nugget, dynamically recrystallized zone) is a region
of heavily deformed material that roughly corresponds to the location of the pin during
welding. The grains within the stir zone are roughly equiaxed and often an order of
magnitude smaller than the grains in the parent material.
The flow arm zone is on the upper surface of the weld and consists of material that is
dragged by the shoulder from the retreating side of the weld, around the rear of the
tool, and deposited on the advancing side.
The thermo-mechanically affected zone (TMAZ) occurs on either side of the stir zone.
In this region, the strain and temperature are lower and the effect of welding on the
microstructure is correspondingly smaller. Unlike the stir zone, the microstructure is
recognizably that of the parent material, albeit significantly deformed and rotated.
Although the term TMAZ technically refers to the entire deformed region it is often
used to describe any region not already covered by the terms stir zone and flow arm.
The heat-affected zone (HAZ) is common to all welding processes. As indicated by the
name, this region is subjected to a thermal cycle but is not deformed during welding.
The temperatures are lower than those in the TMAZ but may still have a significant
effect if the microstructure is thermally unstable. In fact, in age-hardened Aluminium
alloys, this region commonly exhibits the poorest mechanical properties.
Figure 1.5: Different zones found in FSW [13].
TH-1875_126103029

Introduction
7
1.6 Process parameters
There are different process parameters on which the friction stir welded material
quality depends. It is categorising into two main parts, one is related to tool movement
whereas other is related to welding pressure. The tool movement is controlled by the
tool rotational and travel speed while welding pressure is controlled by tool tilt, plunge
depth and plunging force.
The tool rotational and travel speed play a significant role in heating and
cooling of weldment which in turn affects the microstructure of the weld zone.
An increase in rotational speed of tool or decrease in its traverse speed results
into a hotter weld. In order to produce a successful weld, it is necessary that the
material surrounding the tool is hot enough to enable the extensive plastic flow
and minimize the forces acting on the tool. If the material is too cool then voids
or other flaws may appear in the stir zone and in extreme cases the tool may
break.
The tool tilt, plunge depth and plunging force are related to the welding
pressure. The plunge depth is defined as the depth of the lowest point of the
shoulder below the surface of the welded plate and has been found to be a
critical parameter for ensuring weld quality. Plunging the shoulder below the
plate surface increases the pressure below the tool and helps to ensure adequate
forging of the material at the rear of the tool [14]. Tilting the tool by 2-4
degrees, such that the rear of the tool is lower than the front, has been found to
assist this forging process [15]. The plunge depth needs to be correctly set, both
to ensure the necessary downward pressure is achieved and to ensure that the
tool fully penetrates the weld [16]. Considering a high required load for full
penetration of tool may deflect the welding machine, whereas the reduction in
plunge depth compared to the nominal setting may result in flaws in the weld
[17]. The plunging force has different component as mentioned in section 1.4.
A downward force is necessary to maintain the position of the tool at or below
the material surface. Some FSW machines operate under load control but in
many cases, the vertical position of the tool is pre-set and so the load varies
during welding. The traverse force acts parallel to the tool motion and is
positive in the traverse direction. Since this force arises as a result of the
TH-1875_126103029
Material Flow Analysis of Similar and Dissimilar Friction Stir Welding
8
resistance of the material to the motion of the tool it might be expected that this
force will decrease as the temperature of the material around the tool is
increased. The lateral force may act perpendicular to the tool traverse direction
and is defined here as positive towards the advancing side of the weld. A
torque is required to rotate the tool, the value of which depends upon the down
force and friction coefficient (sliding friction) and/or the flow strength of the
material in the surrounding region (sticking friction).
1.7 Research objectives
From the detailed review of published research, the following objectives have been
made.
Detailed transient thermal analysis of FSW process which includes heat flux
calculation and prediction of transient temperature distribution.
Prediction of material flow behaviour during the welding period of a similar
AA6061 with a suitable thermo-fluid coupled model.
Study the effect of process parameter on the material flow of butt welded
FSW for AA6061.
Study the effect of different tool pin profiles on the material flow during the
welding to obtain the suitable pin profile for the welding.
Prediction of material flow behaviour during the welding period of Al and Cu
alloys with a suitable transient model.
Study the effect of process parameter on material flow for dissimilar FSW.
Study the material flow behaviour of a defected plate in comparison to a
healthy weld.
Experimental studies and validations of the numerical methodologies.
1.8 Thesis structure
The content of this thesis focused on thermal and material flow models of FSW for
similar and dissimilar materials. The effect of process parameters on the real-time
material flow behaviour of the FSW process is one part of this study. The other part
contains the behaviour of the material under different tool pin profile. The principal
TH-1875_126103029

Introduction
9
intention of this study is to find the best tool geometry with suitable process parameter
to obtain a healthy and defect-free weld.
The content of this thesis is divided into the following chapters:
Chapter 1 gives the motivation, basic background on FSW and objectives of
the thesis work.
Chapter 2 provides a detailed review of the various study conducted on FSW
through numerical and experimental methods.
Chapter 3 contributes to the information regarding the methodologies applied
to conduct the current numerical and experimental study.
Chapter 4 presents the results on the transient thermal analysis focused on the
process parameter optimization.
Chapter 5 covers the results regarding the different material flow model used
for AA6061 friction welding analysis with experimental validation.
Chapter 6 contains the material flow behaviour of AA6061 under the influence
of different pin profiles and the effect of process parameters on material flow.
Chapter 7 is dedicated to the material flow modelling of Al and Cu alloys i.e.
dissimilar FSW and the study of material flow behaviours according to the
process parameter.
Chapter 8 contains a comparative study of defected and undefected FSW
material flow.
Chapter 9 summarizes the entire work of the thesis, the conclusions drawn
from the conducted research and the future scope of this particular area.
1.9 Target applications
The biggest challenge in performing FSW is to get a healthy defect-free weld that
depends on the welding process parameters including the tool geometry. The process
parameters change the material flow behaviours that either rectify or produce a defect
in the welding. The knowledge of material flow patterns provides sufficient
information in the selection of right tool for achieving a defect-free weld. The current
work provides the detailed information regarding the material flow for different tool
geometry used in similar and dissimilar FSW.
TH-1875_126103029

Material Flow Analysis of Similar and Dissimilar Friction Stir Welding
10
TH-1875_126103029
Chapter 2
Literature Review
2.1 Introduction
This chapter contains the review of the literature available in the field of FSW related
to the objective of the current thesis. The initial section of this chapter provides the
information regarding the material selections used in this present work. The section
also includes the details about the number of research articles published in the field of
FSW. The material selection is followed by the work conducted in the field of the
process parameter, microstructural study, tool geometries and common defects found
in FSW joints. The current thesis is primarily focused on the material flow behaviour
of the similar and dissimilar material. Therefore, the literature related to flow patterns
found in the FSW is studied in more details. This chapter also contains the detail
literature review on the selection of process parameter, tool geometry, material
position and the tool offset used in the dissimilar FSW process. The next section
provides the insight of different analytical and numerical simulation models used by
the researchers till the date.
2.2 Material selection
Pure Aluminium has the inadequate strength for any industrial application. This
weakness of metal can be overcome by alloying with elements like Magnesium,
Copper, Manganese, Zinc and Silicon. Desirable properties are achieved by controlling
the amount of alloying elements and heat treatments. Aluminium alloys have good
ductility and formability due to the face-centred cubic (FCC) microstructure. They are
classified in term of series according to the alloying elements. The AA1xxx, AA3xxx
and AA5xxx series are non-heat treatable and weldable alloys. Whereas, the AA2xxx,
AA6xxx and AA7xxx series are heat treatable and non-weldable alloys [6], [18].
Welding is a very important joining process used in any manufacturing industry. It is a
permanent, lightweight and leakproof joining process. There are many methods by
which welding can be performed. The fusion welding is the cheapest and fastest of all.
TH-1875_126103029

Material Flow Analysis of Similar and Dissimilar Friction Stir Welding
12
The main problem in fusion welding of Aluminium is the loss of strength and defect
formation. Defects like trapped porosity, dissolution of shielding gas, electrode
moisture, and flux inclusion are common with fusion welding of Aluminium.
Furthermore, the insufficient fusion of high melting (2060ºC) Aluminium oxide and
centerline solidification cracking formed during the welding process, add the
complexity to the joining process. In contrast, good healthy joints are obtained with no
significant loss of mechanical properties with FSW of Aluminium alloys.
As mentioned in the previous chapter this technique is among the new advancements
in joining. After the invention of this process by the TWI Institute, the UK in 1991, a
lot of research is carried out in order to make this technique easy and commercialized.
The general trend of recognized work published in this area by the researcher is shown
in Figure 2.1. A rising trend in this research field is observed from 2012 to 2016. In the
last 3-4 years, the research output has gone up to 2 times the previous rate of published
articles per year.
Figure 2.1: Research articles per year (picture from INSPEC-© Elsevier Inc.).
Prior to 2000, very less no of studies were conducted in the field of FSW. Majority of
researchers studied the microstructure formed during the welding of unweldable series
of welding. After the invention of this newer technique and better testing equipment,
TH-1875_126103029
Literature Review
13
the FSW research is extended to materials like Cu, Mg and harder material like mild
steel etc. In 1996, the microstructure formed by fusion and friction welding of AA8009
[19] was compared and found that fusion welding completely destroyed the
microstructure distribution while friction welding retained it with a little loss at the
welding edges. Another comparison of the microstructure was made among the two
alloys of Aluminium AA6061 and AA1100 [20] and found large columnar grain
structure in AA1100 plates which are a sign of dynamic recrystallization, a prominent
feature of FSW. On the extension of study on AA1100, it was found that the Cold
rolled AA1100 plates show better base plate and weld zone hardness than the casted
ones [21]. With the help of Transmission electron microscopy (TEM) study conducted
on AA6061 friction stir welded plates, it was found that the uniform microstructure
precipitations caused the material hardening in the welding region [22]. Later, a
similar study was conducted on AA6063 [23] and concluded that the hardness profile
depends greatly on precipitations than the grain size. The precipitations formed during
the welding were dissolved at higher temperatures. The unweldable alloys like
AA7075 [24] were welded through the FSW process but the tensile strength decreased
with a minor increase in the ductility in the process. Thus, the temperature at which
welding takes place has an important role in microstructure formation in the welding.
One such study was conducted on FSW of AA2024 [25]. Two experiments were
conducted, (a) at room temperature and (b) at -30ºC (with the help of liquid nitrogen)
and studied their microstructures. The microstructure obtained for the low temperature
welding was much finer than the room temperature welding. Later, Schofer [26]
informed that the lower distortions were observed in low heat input welding of
Aluminium alloys. The research was not restricted to similar materials; many studies
were conducted on the dissimilar Aluminium alloys due to good welding
compatibility. The welding microstructure was studied on AA1100 and AA6061 by
Murr et al. [27]. A healthy weld was obtained between the two alloys of Aluminium.
However, the study was further extended to obtain another dissimilar welding AA6061
and Cu. A poor weld was obtained between the two materials with a complex
microstructure. Later, two unweldable alloys AA6061 and AA2024 were joined at
different traverse and rotational speeds.
TH-1875_126103029

Material Flow Analysis of Similar and Dissimilar Friction Stir Welding
14
2.3 Process parameters
The process parameter decides the weld quality as the heat input and strain rate in the
weld zone depends on it. There are many process parameters in FSW i.e. tool rotation
speed, traverse speed, plunging force, tilt angle. Among these parameters, the most
important parameters are tool rotation and traverse speed. The rotational and traverse
speed selected by the user inturn select the rate of heat input in the weld zone. Peel et
al. [28] gave importance to the heat input instead of material deformation. From the
experiments, it was found that mechanical properties of the joint were more affected
by heat input produced at a constant rotational speed. The increase in traverse speed
led to the shrinkage in the weld zone. Moreover, higher values of longitudinal stresses
were obtained at higher values of traverse speed. Therefore, optimal process
parameters provided the best mechanical properties of the joint [29]. Lui et al. [30] and
Sakthivel et al. [31] created the underwater conditions to study the effect of traverse
speed on the microstructure of the weld zone. The grain size increased with the
traverse speed for certain limit and decrease with a further rise in traverse speed.
Therefore, under all environmental conditions, the narrowing of weld zone is observed
with the escalation in traverse speed.
The tensile testing conducted by the researchers found that the fracture occurs in the
heat affected zone for lower traverse speeds while for higher values of traverse speed
the fracture occurs at thermo-mechanically affected zone. Cavaliere et al. [32] studied
the effect of welding and rotational speed on the mechanical properties of the weld
joint. The welding parameters used for the analysis were significantly lower than the
other authors. Therefore, the higher values of parameters used to conduct the study
provided better results in terms of hardness, tensile and fracture strength, however, the
lower values of parameters provided the better ductility. In contrary to that, Kim et al.
[33] used much higher values of process parameters to perform the experiments. It was
observed that the higher rotational speed and traverse speed increase the grain
refinement. In another work, Cavaliere et al. [34] took a wide range of traverse speed
in which rise of yield strength and grain size was observed upto an optimal level, on a
further increase of parameters provided a decline in the same properties. The optimal
parameter provided by the different researcher is shown in Table 2.1.The parameters
like tool torque, temperature, frictional power significantly depend on the rotational
TH-1875_126103029

Literature Review
15
speed. Lombard et al. [35] worked on the effect of rotational speed on the weld quality
in terms of mechanical properties of the joint based on the pitch i.e. welding to
rotational speed ratio. Finding the optimum rotational speed and traverse speed is a
challenge for different researchers. It depends on the tool geometry as well as on the
weld material. Therefore, Balasubramanian [36] conducted a study to find the optimal
parameters for different alloys of Aluminium. The optimal parameter for different
alloys of Aluminium is given in Table 2.2. Based on these parameters different
relationships were found between the material properties and the process parameter.
The effect of process parameter on the corrosive behaviour of the weld zone was
studied by M. Jariyaboon et al. [37]. It was observed that for low rotational speeds, the
corrosion attack in the nugget region while for high rotational speeds, the corrosion
attack in the HAZ region. The fatigue strength of friction stir welds was studied in
comparison to the conventional welding methods. It was found that the fatigue strength
was better in case of FSW samples than the weld samples obtained from TIG and MIG
samples. According to Ericsson and Sandstrom [38], the fatigue strength is relatively
independent of the weld speed. However, some authors denied the above conclusion
and provided the optimum process parameter for fatigue and tensile strength of the
weldment. The onion ring formed on the surface of the welding is dependent on the
pitch of the welding i.e. rotations/traverse speed. Yong et al. [39] found that with
increase in tool rotation the onion ring region increases and grain size decreases.
Table 2.1: The process parameters used by the authors to conduct their experiments.
Authors Rotational
Speed (rpm)
Traverse speed
(mm/min)
Remarks
Elangovan and
Balasubramanian [29]
1600 37, 76, 125 Highest tensile strength at 76 mm/min with
square pin geometry
Lui et al. [30], Sakthivel
et al. [31]
800, 1000 50- 200 Improvement in tensile property with an
increase in traverse speed.
Cavaliere et al. [32] 500, 800,
1000
40, 56, 80 Low traverse speed and low rotation
higher ductility. High tensile strength at
higher tool rotation at 80 mm/ min traverse
speed.
Kim et al. [33] 750-1750 250-1000 Increase in grain refinement at higher
rotational speed.
Cavaliere et al. [34],
Ericsson and Sandstrom
[38]
1600 40-450 Grain size increase till 165 mm/min, yield
strength till 115 then decreases; 115
mm/min provided best fatigue strength.
Lombard et al. [35] 300-600 85-185 Frictional power (2200 J/s) provided the
best the optimum fatigue and tensile
strength.
TH-1875_126103029

Material Flow Analysis of Similar and Dissimilar Friction Stir Welding
16
Table 2.2: Optimized FSW process parameters which provided defect-free weld [36].
Alloy Tool rotational speed (rpm) Traverse speed (mm/min) Welding pitch (mm/rev)
AA1050 900 135 0.150
AA6061 1100 100 0.090
AA2024 1200 75 0.062
AA7039 1300 45 0.035
AA7075 1500 22 0.015
2.4 Tool geometries
The effects of tools were also investigated experimentally as well as numerically, as it
is a significant factor in deciding the weld parameters. Tool geometries play a
significant role in material movement in the weld zone. Every tool generates a
different amount of heat and displaces the material uniquely. Many defects in the weld
zone can be easily removed just by changing the tool geometry in the welding.
Therefore, three different types of geometries were used by Krasnowski et al. [40] to
study the microstructure and mechanical properties of the FSW joint. From the
analysis, it was concluded that the triflute geometry produced the best tensile strength
weld joint. Whereas, Colegrove and Shercliff [41] studied the trivex and triflute tool
and concluded that trivex tool produces less vertical and traversing forces in
comparison to triflute geometry. On the other hand, it was observed the scrolled probe
performed better than the plain cylindrical shoulder [42]. However, according to
Elangovan and Balasubramanian [29], the square pin profiled tool produced defect-
free welds, irrespective of the traverse speeds. The analysis was performed using five
different tool pin profiles (straight cylindrical, tapered cylindrical, threaded cylindrical,
triangular and square) at three different traverse speeds. So, there is no common
conclusion among the researchers on the FSW tool geometry.
The welds produced at a traverse speed of 0.76 mm/s showed superior tensile
properties, irrespective of tool pin profiles by Elangovan and Balasubramanian [29].
The 18 mm shoulder size was suggested by the author to obtain the defect-free weld.
In agreement to that, Arora et al. [43] suggested the same shoulder diameter for 1200
rpm tool rotation speed for best tensile properties in the weld zone. However, Fujii et
al. [44] found that the microstructure was not affected by the tool geometry by
performing welding with cylindrical, cylindrical threaded and triangular prism tool
pin. The studies didn’t limit to this, the D.G. Hattingh et al. [45] calculated the
TH-1875_126103029

Literature Review
17
welding forces for different tool geometries with the help of strain gauges fitted in the
tool holder. The different pin geometries used in the analysis is shown in Figure 2.2.
The effect of the shoulder on the microstructure was studied by Rodrigues et al. [46].
The scrolled shoulder produced smaller grain size in comparison to the flat shoulders.
The different tool geometries used for different Aluminium alloys are shown in Table
2.3.
Figure 2.2: Different tool profiles used in Hattingh et al. [45].
Table 2.3: Tool geometries used for different alloys of Aluminium [47].
Tool shape and size Tool material
Operating parameters Workpiece
material
Remarks
SS: Flat with scroll; SD:
10 mm; PL: 0–1.6 mm
[48]
H13 steel 2000 rpm 6111-T4 Al
alloy, 0.9 mm
thick
Better quality with a
pinless tool
PS: Triflute, Trivex [49] 394 and 457 rpm; 300–
540 mm/min
7075-T7351,
6.35 mm thick
Weld UTS: 470–488
MPa
PS: Threaded [50] 1. MP159;
2. Dievar tool
steel;
3. MP159 pin,
H13 shoulder
190–457 rev min21 ;
0.3–1.4 mm rev21
7075-T7351;
6.35 mm, 16
mm thick
Peak joint
efficiencies: 70–
100%
SS: Concave; SD: 15
mm; PS: straight
cylindrical, threaded,
triangular; PL: 4.7, 6
mm [44]
600–1500 ; 25–1000
mm/min ; 3º tilt
Al alloys, 5
mm thick
Peak joint efficiency:
92%
SD: 10–20 mm, flat; PD:
3–8 mm; PL: 4.2 mm;
PS: frustum and straight
cylindrical [51]
Steel 1400 rpm; 80 mm/min 7020-T6 Al
alloy, 4 mm
thick
Joint efficiencies:
y76%
SS: scroll, cavity, fillet;
PD: 1.7 mm; PS: straight
1810 rpm ; 460 mm/min;
2º tilt
6082-T6 Al,
1.5 mm thick
TH-1875_126103029
Material Flow Analysis of Similar and Dissimilar Friction Stir Welding
18
cylindrical; PL: 1.2 mm
[52]
SS: concave; SD: 26
mm; PD: 5.6 mm; PL:
5.9 mm; PS: threaded
[53]
286–1150 rpm; 30–210
mm/min
6061-T6 Al,
6.3 mm thick
SS:concave, convex,
flat; SD: 12 mm; PD: 5
mm; PL: 1.6 mm [54]
H13 steel 1500 rpm; 20 mm/min; 5754 Al, 1.32
mm thick
PD: 6 mm [55] Tool steel 1000 rpm; 120 mm/min A319 and
A413 Al alloy,
6 mm thick
No property
degradation in the
weld metal
SS: concave; SD: 13
mm; PS: straight
cylindrical, tapered
circular; PL: 3.19 mm:
PD: 5 mm [56]
High carbon steel 300–1620 rpm; 100–900
mm/min; 2.5º tilt
7020-T6 Al, 4
mm thick
SD: 25.4 mm; PD: 5.2–
7.6 mm; PL: 1.8–7.1 mm
[57]
H13 steel 650 rpm; 150-200
mm/min ; 3º tilt
6061-T6 Al,
9.5 mm and
12.7 mm thick
*SD: shoulder diameter; PL: pin length; PD: pin diameter; PS: pin shape; SS: shoulder shape
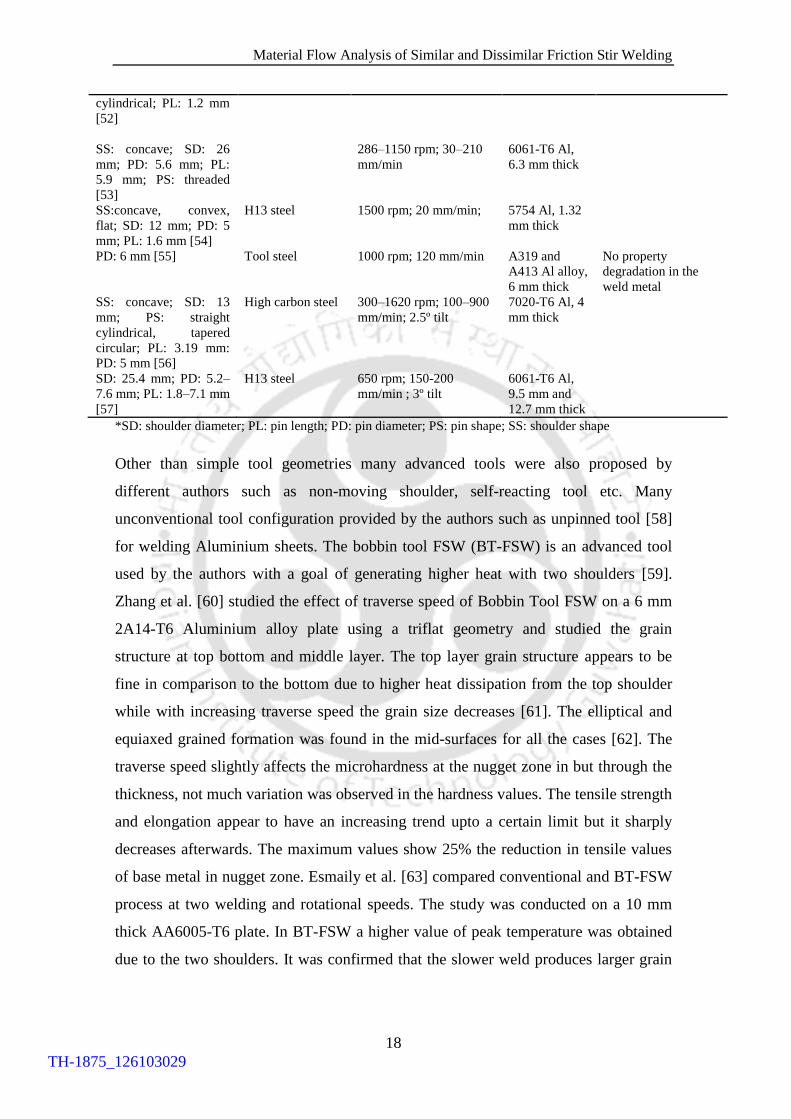
Other than simple tool geometries many advanced tools were also proposed by
different authors such as non-moving shoulder, self-reacting tool etc. Many
unconventional tool configuration provided by the authors such as unpinned tool [58]
for welding Aluminium sheets. The bobbin tool FSW (BT-FSW) is an advanced tool
used by the authors with a goal of generating higher heat with two shoulders [59].
Zhang et al. [60] studied the effect of traverse speed of Bobbin Tool FSW on a 6 mm
2A14-T6 Aluminium alloy plate using a triflat geometry and studied the grain
structure at top bottom and middle layer. The top layer grain structure appears to be
fine in comparison to the bottom due to higher heat dissipation from the top shoulder
while with increasing traverse speed the grain size decreases [61]. The elliptical and
equiaxed grained formation was found in the mid-surfaces for all the cases [62]. The
traverse speed slightly affects the microhardness at the nugget zone in but through the
thickness, not much variation was observed in the hardness values. The tensile strength
and elongation appear to have an increasing trend upto a certain limit but it sharply
decreases afterwards. The maximum values show 25% the reduction in tensile values
of base metal in nugget zone. Esmaily et al. [63] compared conventional and BT-FSW
process at two welding and rotational speeds. The study was conducted on a 10 mm
thick AA6005-T6 plate. In BT-FSW a higher value of peak temperature was obtained
due to the two shoulders. It was confirmed that the slower weld produces larger grain
TH-1875_126103029

Literature Review
19
size while the BT-FSW creates grain refinement and thus cause finer grain size in the
SZ and thus produce a better hardness in the SZ.
2.5 Microstructure
The microstructure of welding provides much information about the quality of the
weld. The mechanical properties are significantly affected by the microstructure of the
welded joint. The process parameters like the tool rotational speed, traverse speed, tool
selection, plunging force substantially affect the microstructure of the welding zone.
Therefore, the quality of the weld directly depends on the process parameters used for
performing the weld. The microstructural study revealed the nature of mixing the two
mating material particles. Many authors mixed the foreign particles into the welding
zone to study the distribution of the particle caused by the rotation of the tool. A
homogeneous mixing of a foreign particle in the welding of AA2124 was found by
Uzun [64]. Microstructure reveals the quality of the weld achieved with a particular
process parameter and the tool geometry. According to the Rodrigues et al. [46], tool
shoulder significantly affects the grain size of the weldment. The scrolled shoulder
produces a smaller grain structure in comparison to plain shoulder structure. The
mechanical properties of the weldments are dependent on the microstructure formed
during the welding. The microstructure explains the failure of the tensile test
specimens clearly for a healthy weld and a defected weld [65]. The study of
microstructure helps in providing an optimum process parameter to obtain the best
mechanical properties [66, 67]. The FSW can produce excellent electrochemical
behaviour of the weldment with good corrosion resistance [68].
The microstructure studied by Murr et al. [69], [70] revealed the variations of the
vortex and other swirl-like intercalations. The flow patterns of AA2024/6061 were
also studied using a light microscopy. A complex vortex, whorl, and swirl feature
characteristic were found in the mixing region shown in Figure2.3. The white regions
represent the Aluminium whereas the Cu is represented by black. The flow patterns
obtained were similar to extrusion. So tensile testing [71] were conducted on the FSW
of 2XXX, 5XXX, 6XXX, and 7XXX series of Aluminium alloys.
TH-1875_126103029

Material Flow Analysis of Similar and Dissimilar Friction Stir Welding
20
Figure 2.3: 6061 Aluminium/Copper friction-stir weld composite (R=650 rpm, T=1
mm/s). (b) An enlarged view of a region in the weld plane section marked (b) in (a)
above showing intercalation swirl microstructure[69].
The Friction stir process not only used for welding purpose but finds many other
applications related to microstructure refinement [72]. The Friction stir processing
provides microstructure refinement, densification and homogeneity in the material.
Therefore, the process is highly recommended in powder metallurgy of Aluminium
alloy [73], metal matrix composite [74], and cast Aluminium alloys [75]. The desired
mechanical properties in the processing zones are achieved by optimizing process
parameters, tool design and cooling rates.
2.6 Defects
The defect formation in the FSW process is much different than the common fusion
welding process. The common defects of the fusion welding processes are slag
inclusion, porosity, cracks etc. which occurs due to the liquid state of the material in
the weld region. However, in FSW the common defects are wormhole, tunnel defect,
crack, kissing bond etc. which occur due to insufficient mixing of plasticized material.
The process parameters have a significant role in the formation of a defect in FSW.
The heat input provided in the weld joint depends on the rotational speed, traverse
speed, tool shape and size, plunging depth as well as material to be weld. Based on the
heat input few authors characterize the FSW into two main categories i.e. ‘hot
welding’(HW) and ‘cold welding’ (CW) [76]. This difference in microstructure
conducted to a reduction in hardness around 15% in CW contrarily to the HW and a
TH-1875_126103029

Literature Review
21
reduction in elongation of 30% to 70% was observed for hot weld and cold welds
respectively. The hot welds have shown better ductility and produced less hard weld
zone in comparison to the clod welds [46]. The common flaws of cold welding FSW
are kissing bonding, void formation, tunnel etc. However, the common defects caused
by hot welding are flash formation, strength deterioration, cracking etc. The defect like
insufficient penetration, joining are formed by operators errors or by choosing the
wrong tool geometry. The defect formation and tool geometry used to weld the
material are closely related to each other. Fujii et al. [44] observed that the AA1050
and AA6061 have low resistance to the deformation in comparison to AA5083. Three
tool geometries were used for the experimentation. The welding performed by
cylindrical tools on first two materials was better than the triangular prism. However,
the triangular prism tool geometry was able to much better with AA5083 with a
defect-free weld even at higher traverse speed.
The flashing of the material at the edge of the tool shoulder is another problem faced
by many FSW operators. This is caused by higher heat input caused by the higher
rotation of the tool. According to Li et al. [77], higher tool pressure provide a support
to the tool rotation for flashing out the material on the retreating side. However,
according to Keivani et al. [78], the pin of the tool plays a significant role in deciding
the flashing out of the material. A high pin length causes the material extrusion toward
the tool shoulder and result in flashing out of the soft material. However, a very high
pin length cause the extrusion along the pin length and flashing out of the material
occur at the root of the weld.
The tunnel defect is generally formed at higher traverse speeds. At higher traverse
speeds, the insufficient mixing and less fluidity of the plasticized material occur in the
weld region due to low heat input [79]. So, this leads to the formation of the tunnel
defect in the weld region. For the increase of fluidity [80] of the material in the weld
region, the reduction in the traverse speed is recommended [81]. According to Zhao et
al. [82], the tunnel area formed in the weld zone increases with the traverse speed.
Therefore, a larger tool shoulder is recommended to increase the heat input in the weld
zone. The other defect form by low heat input is the ‘kissing bond’ which occur due to
insufficient mixing of the two mating plates [83]. These kissing bonds become the
source of crack formation in the weld region on the application of load. Thus, the
fatigue and tensile strength of the weldment decrease drastically in the presence of
TH-1875_126103029

Material Flow Analysis of Similar and Dissimilar Friction Stir Welding
22
kissing bond defect [84]. The kissing bond was caused due to improper mixing of the
material during the welding.
A void is a most common defect noticed by the authors, occurs on the advancing side
of the weld zone at high traverse speed. A small groove defect is noted at 200 mm/min
traverse speed [30], however bigger wormholes were noticed by Crawford et al. [85].
The most of the authors reported a defect on the advancing side. In contrary to that, the
study conducted by Elangovan and Balasubramanian [29] reported defects on the
retreating side. Sometimes, the overlapping passes of the FSW help in eliminating the
defect. The overlapping doesn’t change the microstructure much but alters the
mechanical properties of the joint. An insignificant effect on the microstructure of the
weld and a marginal improvement in the hardness and tensile strength of the FSW
joint was achieved by Leal and Loureiro [86] with overlapping passes. The
overlapping passes are a very effective way to eliminate the defects. However, some
authors claim that an offset pass provides better repair quality than the symmetrical
repair pass [87]. It is still unclear how much offset should be provided to obtain the
best mechanical properties of the joint.
2.7 Material flow behaviour
The material flow of FSW is a complex phenomenon which depends on the tool
geometry, process parameters and the welding material. The understanding of material
flow patterns of the welding provides significant information in selecting a proper tool
geometry and process parameter for a selected material. Different authors used
different approache to visualize the material flow of the welding. One approach was
the tracer technique in which foreign particles were injected in the weld zone before
the weld and position were traced after the welding. The other approach was dissimilar
material joining by FSW. Different tracer techniques were used by the researchers to
study the material flow behaviour of the Aluminium alloy under the tool geometry.
Reynold [88] used a marker insert technique to study the material flow in the welding
zone. The material used as the marker was AA5454-H32 in the welding of AA2195-
T8 under threaded pin geometry. It was found that the material flow was not
symmetrical around the weld line. The markers material was moved backwards during
the welding with a distance equivalent to the pin diameter. The material was pushed
TH-1875_126103029
Literature Review
23
downward on the advancing side while on the retreating side it was moved upward.
According to author [88], the stir action in the material was dominated in the top
region around the tool shoulder. However, it was found that the transportation of the
material across the centerline depend on the pin diameter of the tool. Guerra et al. [89]
used a Cu strip as a marker in the weld zone for studying the material flow. It was
observed that the front advancing side material was sloughed by the tool shoulder in
the form of an arc shape in the weld zone. However, the retreating side material was
extruded between the base material and the tool wall. A similar method was used by
the Schmidt et al. [90] i.e. Cu strip was placed between the two welding plates and
traced it with the X-ray and computer tomography (CT). However, Morisada et al. [91]
used tungsten as a tracer material to analyze material flow through X-ray technique.
The image produced in the procedure provided the information regarding the sticking
condition material flow. The X-ray technique proved vital for tracing most of the
materials like Cu as well as steel [92].
Colligan [93] used steel shot tracer technique to investigate the material flow. As the
name suggested, the spherical steel balls were placed in the path of the welding tool
and after the weld, the steel structure was traced with the help of radiography. In order
to get the real-time movement of the tracer material particles, a “stop action” technique
was used. In stop action technique the tool was stopped suddenly in the middle of
welding and reversed the direction of the weld which creates a keyhole in that position.
Later, that section of the weld was taken and plates were analyzed to obtain the stir
action of the tool on the material. Two types of behaviour were observed in the weld
zone i.e. chaotical and continuous distribution. In chaotical distribution, the steel material was
scattered all around the weld zone behind the tool while in continuous distribution a
continuous line of steel was obtained in the weld zone. Kumar et al. [94] used Particle image
velocimetry (PIV) technique in which micro-spherical glass tracers in a transparent
visco-plastic material was utilized to understand the material flow. Many authors
believe that the pin geometry affects the material flow but few authors denied the
above fact. Lorrain et al. [56] found the material flow with the unthreaded tool has the
same features as the material flow using classical threaded tools. Though these studies
produce a lot of understanding about the material flow behaviour of the material under the
FSW tool, the marker material particles have different mechanical properties than the base
TH-1875_126103029

Material Flow Analysis of Similar and Dissimilar Friction Stir Welding
24
material in terms of viscosity, and density. So, the information provided by the authors still
need better authentication.
2.8 Dissimilar friction stir welding
In the last decade, the substantial amounts of research were conducted on dissimilar
metal FSW. Prior to this, the researchers were primarily confined to similar metal
joining. The Dissimilar metal FSW process lacks the knowledge of weld quality
obtained in terms of microstructure, intermetallic compounds, defects and mechanical
properties of the joints. In the advanced world, many applications require dissimilar
metal joining such as mild steel-Cu, Al-Cu, Al-Ti etc. Joining dissimilar metals having
different mechanical properties is a tedious job. Many authors reported that FSW is
capable of joining the dissimilar materials. The tool and machine require for Al-Cu are
much cheaper in comparison to the equipment required to join harder materials.
Therefore, huge experiments were reported on Al-Cu to gain sufficient knowledge on
dissimilar metal FSW. The major problems associated with Al-Cu FSW process are
common with other dissimilar material FSW.
The Al and Cu have excellent electrical and mechanical properties thus the joining of
these two metals found many applications in sectors like power generation, electronic
and transportation [95], [96]. Though the research started on the dissimilar metal
joining in the late 90’s [69], the extensive experimentations begin after 2006 [97]. The
effect of process parameter like rotational, traverse speed, material position, tool
geometry, tool offset etc. on the microstructure formation in the weld zone were
reported in many articles. Two types of approaches were used by the authors for
studying the influence of rotational and traverse speed. One in which a single
parameter was varied with the remaining parameters constant, whereas in other
approach both the parameters were varied simultaneously. Xue et al. [98] used the
first approach to study the effect of rotational and traverse speed on microstructure.
Liu et al. [99] followed the same approach to study welding parameter on the
microstructure. Both of them concluded that the material interaction increases with
rotational speed keeping the transverse speed constant. However, a decrease in traverse
speed provided the same conclusion at a constant rotational speed. Abdollah-Zadeh et
al. [100] and Barekatain et al. [101] agreed to the same conclusions by performing the
TH-1875_126103029
Literature Review
25
experiments in a similar approach. However, discords are found in case of the effect of
process parameter on the surface finish of the weld joint among all authors. Higher
formation of the brittle intermetallic compound at lower values whereas insufficient
material mixing on higher values of traverse speeds were observed by Muthu and
Jayabalan [102]. The authors like Galvão et al. [103] and Bisadi et al. [104] used the
second approach to study the influence of rotational and traverse speed on the
microstructure. The Galvão used rotational to traverse speed (ω/v) ratio to determine
the weld quality and found that the material interaction increases with ratio while the
Bisadi used ω2/v ratio to decide that the higher values provide the better surface finish
and the best material interaction. The higher heat input values provide better material
mixing which occurs at higher rotational and lower traverse speed.
Some research articles placed Cu on the advancing side and some placed Al on the
advancing side. Though the material welding side significantly affects the welding
[97], there is no consensus among the authors regarding the material placement.
Galvão et al. [105] noticed that healthier welds were obtained by placing Cu on the
advancing side. A similar trend was observed by Xue et al. [98] and Liu et al. [99] and
found inconsistent weld was obtained by placing Al on the advancing side. In contrary
to that, Tan et al. [106], Kahl and Osikowicz [107], and Ouyang et al. [108] obtained a
sound weld on placing Al on the advancing side.
Tool offset plays a significant role in achieving a proper weld. Many authors obtained
a defect-free weld by offsetting the tool on the Al side. However, the amount of
offsetting is not fixed; different authors provided different values of offset. Okamura
and Aota [109] obtained better surface finish and less defective weld by completely
shifting the tool towards the Al side. In agreement with that, Genevois et al. [110]
achieved better surface finishing in joining AA1050 with pure Cu by doing the same.
In the above cases, the welding obtained was not considered as good as the joining
occurred by friction stirs diffusion bonding and many discontinuities were found in the
microstructure. Avettand-Fenoël et al. [111] concluded that the welding conditions
became worse on shifting the tool towards the interface. Similarly, Xue et al. [98]
found improvement in surface finish and reduction in brittle intermetallic compounds
formation by offsetting the tool on the Aluminium side.
TH-1875_126103029
Material Flow Analysis of Similar and Dissimilar Friction Stir Welding
26
2.9 Analytical and numerical methods
The analytical methods provide better insight of the process by decomposing the
complex process into simpler understandable equations having certain assumptions.
The above said decomposing process often used to analyze one or two aspects of the
process completely to make the problem simpler to understand. The information
gathered through these methods lead to a reduction in the number of experiments. The
numerical methods like FEM improve the research productivity as experiments are
costly and time-consuming.
The analytical study and numerical simulation is an important method for the
understanding the mechanisms of the FSW process. It provides insights into the
welding characteristics both qualitative and quantitative without performing costly
experiments. The numerical methods (in particular FEM and FVM) are more flexible
in treating complex geometries and boundary conditions, with respect to their
analytical counterparts. The FSW simulation typically involves studies of the rotation
and traverse speed on the temperature distribution and residual stresses in the work-
piece, etc. This simulation is a complex task since it involves the interaction of
thermal, mechanical and metallurgical phenomena. Different decoupled models were
proposed by the authors with a simplified thermal and material flow model in different
software. Vilaca et al. [112] determined the thermal history of 2D and 3D geometry
and studied the heat flow by conduction mechanism inside the plate domain with the
help of iSTIR model. The study was conducted for similar and dissimilar materials
which were verified with the experimental data. The thermal histories were recorded
with the help of thermocouples during the experiments. The analytical analysis was
performed by recording the thermal history distribution patterns. The mathematical
equations were fitted in the relation between the temperature and distance from the
centerline by Hwang et al. [113]. The temperature distribution equations obtained were
not general i.e. they belong to a specific case. Kim et al. [114] worked on an FVM
code, utilizing full sticking condition, to study the effect of parameters on thermal
history distribution whereas, Chen and Kovacevic [115] proposed a 3D finite element
model to study the effect of process parameters. More different approaches were used
to optimize the process parameters. Vilaca et al. [116] suggested an inverse
engineering approach by using the analytical thermal code iSTIR to establish the
TH-1875_126103029
Literature Review
27
correlation between the parameter of FSW and the properties of the resulting joints.
Hamilton et al. [117] used a new energy based slip factor in thermal modelling of
FSW. Further, the plasticity models were used by Hamilton et al. [118] and
Williamson [119], [120] to incorporate the heat generation with the plastic
deformation of the material. It was found that the contribution of heat generation with
plastic deformation was more at lower rotational speed. Kovacevic [121], [115] and
Aval et al. [122] worked on the 3D moving the coordinate model to study the transient
thermal history of the FSW process. The effect of process parameter on temperature
distribution on the material plate was studied and validated experimentally. The
studies are further extended to study residual stresses by Buffa [123], Kovacevic
[115]. The minimisation of residual stress was achieved by optimizing process
parameter. With the involvement of many factors in the thermal history distribution,
therefore obtaining a general temperature distribution is a big challenge. Zhang [124]
confirmed that the peak temperature and welding flash increases with rotational speed.
It was found that longitudinal residual stresses were much higher than the transverse
stresses and the simultaneous increase in rotating and translating speed leads to an
increase of residual stress. The analysis conducted for studying the structural aspect of
the welding is significantly affected by the boundary conditions [125]. The
unconventional tools like bobbin tool were studied by Hilgert et al. [126] with the
Arbitrary Lagrangian Eulerian (ALE) approach. Similarly, Assidi et al. [127]
formulated a 3D numerical simulation in FORGE3 F.E. software using Notron’s and
coulomb’s model with ALE formulation. The formulation achieved was best calibrated
with coulomb’s model using µ =0.3. So, selecting the right boundary condition for any
analysis is very important.
Different models were proposed to study material flow by the authors. The authors like
Feulvarch et al. [128], Chiumenti et al. [129], proposed a simple and robust moving
mesh technique for finite element simulation to study material flow and heat transfer in
the weld material with different kinds of tool pin geometry. The adaptive mesh is
based on the ALE technique. This method incorporated momentum and mass
conservation equations for flow problems, while energy balance equations are used for
thermal analysis. However, Dialami et al. [130] used the same mesh approach and
studied the material flow with particle tracer method. The predicted material flow was
compared with the flow obtained with material insert technique. Zhang et al. [131]
TH-1875_126103029

Material Flow Analysis of Similar and Dissimilar Friction Stir Welding
28
used finite element package ABAQUS to perform 3D material flow modelling of
FSW. The swirls motions were reported on the advancing side in the material flow of
material. Similar vortex formations were also reported by Jacquin et al. [132], in 3D
thermo-mechanical model based on Eulerian approach proposed by Heurtier et al.
[133]. Partial sliding and partial sticking with non-linear material properties [134]
were considered to perform the FSW simulation. However, Schmidt and Hattel [135]
worked on a completely thermal-mechanical coupled model in Computational fluid
dynamics (CFD) software packages. However, Zhang et al. [136] used a temperature-
dependent elastic visco-plastic model for the simulation of the FSW process. The non-
elastic response of the rate-dependent material in the large deformation problems was
calculated by using the closest point algorithm. Chuan et al. [137] studied the plastic
material flow by embedding the Copper sheets as marker material in the weld path
2024 Aluminium alloy plates. A three-dimensional model was developed to conduct
the numerical simulation of the temperature profile and plastic material flow in FSW.
Mendez et al. [138] coupled the plastic deformation and the heat transfer and derived
the expressions for the thickness of the shear layer, maximum temperature and
volumetric heat generation in the process.
Gemme et al. [139] studied the material behaviour in the dwell phase of FSW with a
visco-plastic model based on Norton Hoff law. The tool geometry is one parameter
that affect material flow significantly. The geometries were created in the 3D models
to study the friction stir spot welding by Hirasawa et al. [140]. The analysis predicted
that a triangular pin with a concave shoulder is the preferred tool geometry for friction
stir spot welding.
2.10 Summary
The researchers studied FSW of various similar and dissimilar materials and optimize
its process parameters. There was no consensus among the author regarding process
parameter to be used but an optimal range of rotational and traverse speed can be
obtained for a healthy weld from the above discussion. Various tool geometries were
studied by different authors. Since it is an evolving field, many unconventional tools
were proposed which specifies a special task. Each tool had certain set of a process
parameters in which it performs the best. From the above discussion, it came into
TH-1875_126103029

Literature Review
29
focus that the process parameter and tool selection is highly sensitive to the type of
materials and its thickness to be welded. The flow pattern study needs more
exploration as very less literature is available. Most authors used foreign particles as a
tracer material in welding which differs in mechanical properties of parent material.
So, the experimental results produced by the authors are insufficient to make any
conclusions. When it comes to dissimilar material, there are lots of uncertainties
regarding the process parameter, material placement and the tool offset. Different
authors produced different values of offset and process parameter. So, the study
regarding the dissimilar material FSW is inevitable.
2.11 Gaps in literature
From the above literature study the following gaps are observed:
Numerical simulation and analytical methods are mainly carried on Aluminium
and Aluminium alloys i.e. similar metals. No literature is available for
simulation of dissimilar material.
So far no vigorous work is conducted in simulation therefore; it doesn’t
provide sufficient understanding of material flow during the welding.
No comparative studies between different proposed models are found in the
literature like the turbulent and laminar models.
Effect of tool geometries on the material flow behaviour of the material is
absent in the literature.
The experimental study has been conducted on the dissimilar metals but the
harder material and lighter material positions have not specified some authors
says harder material to be placed on advancing side while some say lighter
material to be placed on advancing side.
Tool position or tool eccentricity is an important aspect for the welding of
dissimilar metal which needs to be focused as the weld quality and material
flow depends on the position of the tool.
Flow behaviour in the defected plate is not found in the literature.
TH-1875_126103029
Material Flow Analysis of Similar and Dissimilar Friction Stir Welding
30
2.12 The scope of the thesis
The current thesis is primarily focused on the study of the material flow of similar and
dissimilar material FSW. The initial work provided the heat generation formulation
caused by friction and plastic deformation. The formulation can be utilized to calculate
the heat flux for any numerical model. Further different material flow models are
presented based on the complexity of the model. Each model provides the significance
of each assumption used in the model. Further, the material flow for different tool
geometries is provided. These studies provide the insight of material movement under
the tool pin geometries used to perform the FSW. The information gathered from
these models can be utilized to select the right pin geometry for the FSW process. The
significance of process parameter on the material is also understood as it directly
affects the heat input in the material. The study is conducted for AA6061 and provides
the knowledge of temperature distribution on both advancing and retarding side. The
temperature distribution in turns changes the material properties which are utilized to
calculate the properties like the viscosity of the weld material.
The second part of the thesis deals with the material flow of dissimilar material which
is based on a novel model. The model utilized a volume of fluid approach and provides
a great insight into the material flow of Aluminium and Copper FSW. The thermal
profiles of the model are found to be in good agreement with the experiments. So, this
model can be utilized to study other dissimilar materials. These material flow models
can be utilized to study the material flow for the defect formation in the FSW process.
TH-1875_126103029

Chapter 3
Model Methodology
3.1 Introduction
This chapter includes all the methodology used to fulfil the objectives stated in the first
chapter. It provides the sequence in which work is performed based on each objective.
The theory adopted in the models and the setups used for experiments are detailed
below. The first section of the chapter includes the formulation of heat generation in
FSW. The second section includes the details of 3D finite element model used to
conduct the transient thermal analysis of FSW of AA6061. The above section is
followed by the detailed CFD model to study the material flow behaviour of FSW. The
later sections explain the model used to study the material flow behaviour of the
dissimilar material and the final section explains the setup used to conduct the
experiments and its details.
3.2 Heat generation in FSW tool
Heat generation formulations of friction stir welding i.e.
1) Flat Cylindrical shoulder with cylindrical probe.
2) Flat Cylindrical shoulder with conical probe.
3.2.1 Heat generation due to flat cylindrical shoulder with cylindrical probe
Let us consider a cylindrical tool whose shoulder radius is R and radius of its probe is
rp whereas considering the height of the probe as l which as shown in Figure 3.1. It is
considered that the angular speed of the tool is ω and acted upon a plunging force Pn
which generate a pressure P on the shoulder surface, due to this pressure the total heat
generation is calculated as follows.
TH-1875_126103029

Material Flow Analysis of Similar and Dissimilar Friction Stir Welding
32
Figure 3.1: Schematic diagram of flat cylindrical FSW tool.
3.2.1.1 Heat generation due to sliding in the shoulder
There are two components of heat generation in shoulder i.e.
(i) Heat generation due to vertical pressure
(ii) Heat generation due to travelling of shoulder
Heat generation due to vertical pressure is explained below.
Figure 3.2: Small elementary area of shoulder.
Heat generation due to vertical pressure
Area responsible for heat generation of the shoulder is shown in Figure 3.2. Taking an
elemental ring of thickness δr which is at r distance from the centre (O) of the area.
TH-1875_126103029

Model Methodology
33
Therefore the area of the elemental ring is given by Eq. (3.1),
𝛿𝐴 = 2𝜋𝑟𝛿𝑟 (3.1)
Normal force acting due to this elemental ring,
𝛿𝑁 = 𝑃. 2𝜋rδr (3.2)
Let us take the frictional coefficient between the tool and workpiece to be f.
Therefore, Frictional force,
𝛿𝐹 = 2𝑓𝑃𝜋rδr (3.3)
Heat generation due to elemental ring,
𝛿𝑄𝑠1 = 2𝑓𝑃𝜋rδr. ωr (3.4)
Integrating both sides of Eq. (3.4),
i.e. 𝑄𝑠1 = 2𝜋𝑓𝜔𝑃 ∫ 𝑟2𝛿𝑟𝑅
𝑟𝑝
Or 𝑄𝑠1 =2
3𝜋𝑓𝜔𝑃 (𝑅3 − 𝑟𝑝
3)
(3.5)
Heat generation due to travelling of tool shoulder
Let us consider the depression in the welding area is h1 and the tool moves with a
velocity of v, however, the yield strength of the material at 80% of the melting point
temperature is 𝑆𝑦𝑠∗ .
Since the tool is moving forward, therefore, the force acts upon the front half curved
surface area of the shoulder.
Area responsible for heat generation is given by Eq. (3.6),
𝐴 = 𝜋Rℎ1 (3.6)
Frictional force for heat generation
𝐹 = 𝑓𝜋𝑆𝑦𝑠∗ 𝑅ℎ1 (3.7)
Heat generation
TH-1875_126103029
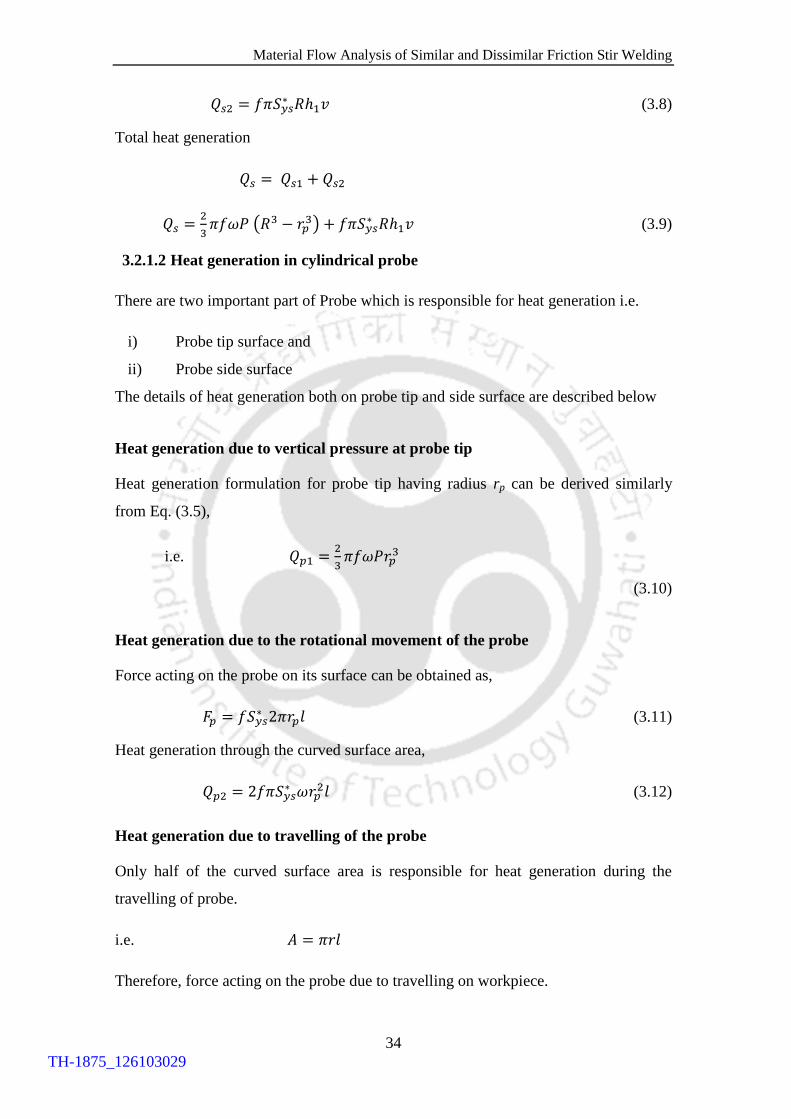
Material Flow Analysis of Similar and Dissimilar Friction Stir Welding
34
𝑄𝑠2 = 𝑓𝜋𝑆𝑦𝑠∗ 𝑅ℎ1𝑣 (3.8)
Total heat generation
𝑄𝑠 = 𝑄𝑠1 + 𝑄𝑠2
𝑄𝑠 =2
3𝜋𝑓𝜔𝑃 (𝑅3 − 𝑟𝑝
3) + 𝑓𝜋𝑆𝑦𝑠∗ 𝑅ℎ1𝑣 (3.9)
3.2.1.2 Heat generation in cylindrical probe
There are two important part of Probe which is responsible for heat generation i.e.
i) Probe tip surface and
ii) Probe side surface
The details of heat generation both on probe tip and side surface are described below
Heat generation due to vertical pressure at probe tip
Heat generation formulation for probe tip having radius rp can be derived similarly
from Eq. (3.5),
i.e. 𝑄𝑝1 =
2
3𝜋𝑓𝜔𝑃𝑟𝑝
3
(3.10)
Heat generation due to the rotational movement of the probe
Force acting on the probe on its surface can be obtained as,
𝐹𝑝 = 𝑓𝑆𝑦𝑠∗ 2𝜋𝑟𝑝𝑙 (3.11)
Heat generation through the curved surface area,
𝑄𝑝2 = 2𝑓𝜋𝑆𝑦𝑠∗ 𝜔𝑟𝑝
2𝑙 (3.12)
Heat generation due to travelling of the probe
Only half of the curved surface area is responsible for heat generation during the
travelling of probe.
i.e. 𝐴 = 𝜋𝑟𝑙
Therefore, force acting on the probe due to travelling on workpiece.
TH-1875_126103029
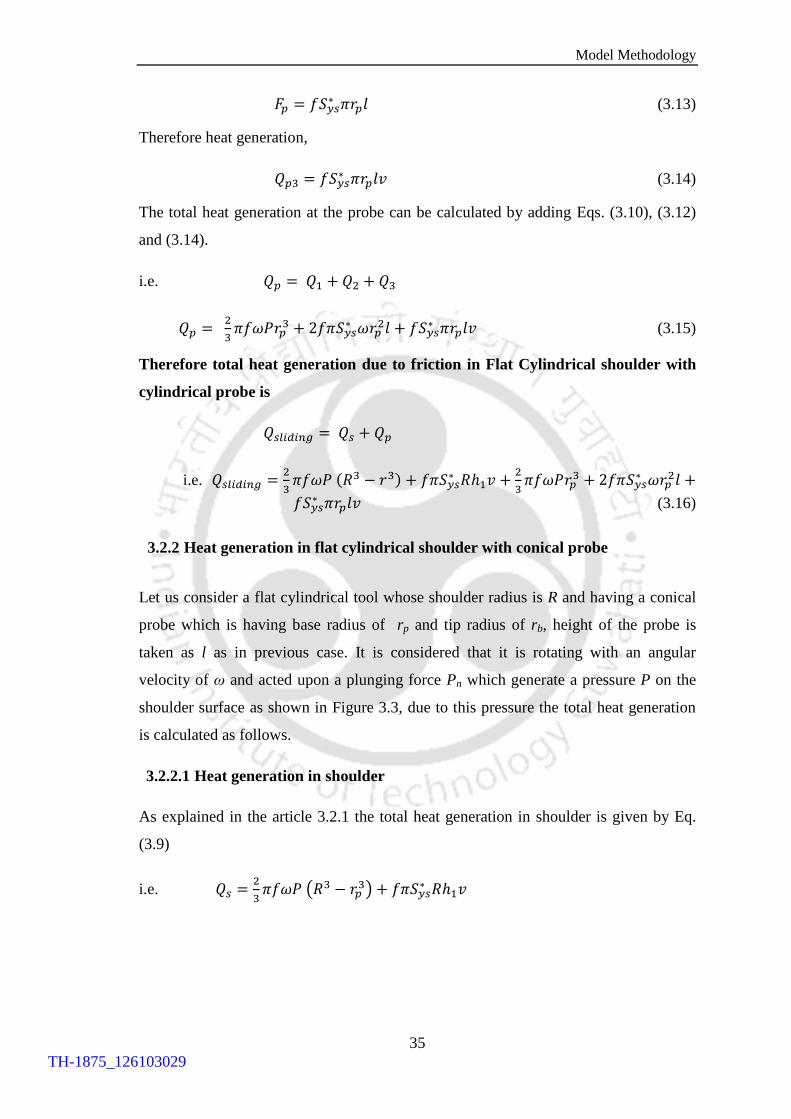
Model Methodology
35
𝐹𝑝 = 𝑓𝑆𝑦𝑠∗ 𝜋𝑟𝑝𝑙 (3.13)
Therefore heat generation,
𝑄𝑝3 = 𝑓𝑆𝑦𝑠∗ 𝜋𝑟𝑝𝑙𝑣 (3.14)
The total heat generation at the probe can be calculated by adding Eqs. (3.10), (3.12)
and (3.14).
i.e. 𝑄𝑝 = 𝑄1 + 𝑄2 + 𝑄3
𝑄𝑝 = 2
3𝜋𝑓𝜔𝑃𝑟𝑝
3 + 2𝑓𝜋𝑆𝑦𝑠∗ 𝜔𝑟𝑝
2𝑙 + 𝑓𝑆𝑦𝑠∗ 𝜋𝑟𝑝𝑙𝑣 (3.15)
Therefore total heat generation due to friction in Flat Cylindrical shoulder with
cylindrical probe is
𝑄𝑠𝑙𝑖𝑑𝑖𝑛𝑔 = 𝑄𝑠 + 𝑄𝑝
i.e. 𝑄𝑠𝑙𝑖𝑑𝑖𝑛𝑔 =2
3𝜋𝑓𝜔𝑃 (𝑅3 − 𝑟3) + 𝑓𝜋𝑆𝑦𝑠
∗ 𝑅ℎ1𝑣 +2
3𝜋𝑓𝜔𝑃𝑟𝑝
3 + 2𝑓𝜋𝑆𝑦𝑠∗ 𝜔𝑟𝑝
2𝑙 +
𝑓𝑆𝑦𝑠∗ 𝜋𝑟𝑝𝑙𝑣 (3.16)
3.2.2 Heat generation in flat cylindrical shoulder with conical probe
Let us consider a flat cylindrical tool whose shoulder radius is R and having a conical
probe which is having base radius of rp and tip radius of rb, height of the probe is
taken as l as in previous case. It is considered that it is rotating with an angular
velocity of ω and acted upon a plunging force Pn which generate a pressure P on the
shoulder surface as shown in Figure 3.3, due to this pressure the total heat generation
is calculated as follows.
3.2.2.1 Heat generation in shoulder
As explained in the article 3.2.1 the total heat generation in shoulder is given by Eq.
(3.9)
i.e. 𝑄𝑠 =2
3𝜋𝑓𝜔𝑃 (𝑅3 − 𝑟𝑝
3) + 𝑓𝜋𝑆𝑦𝑠∗ 𝑅ℎ1𝑣
TH-1875_126103029
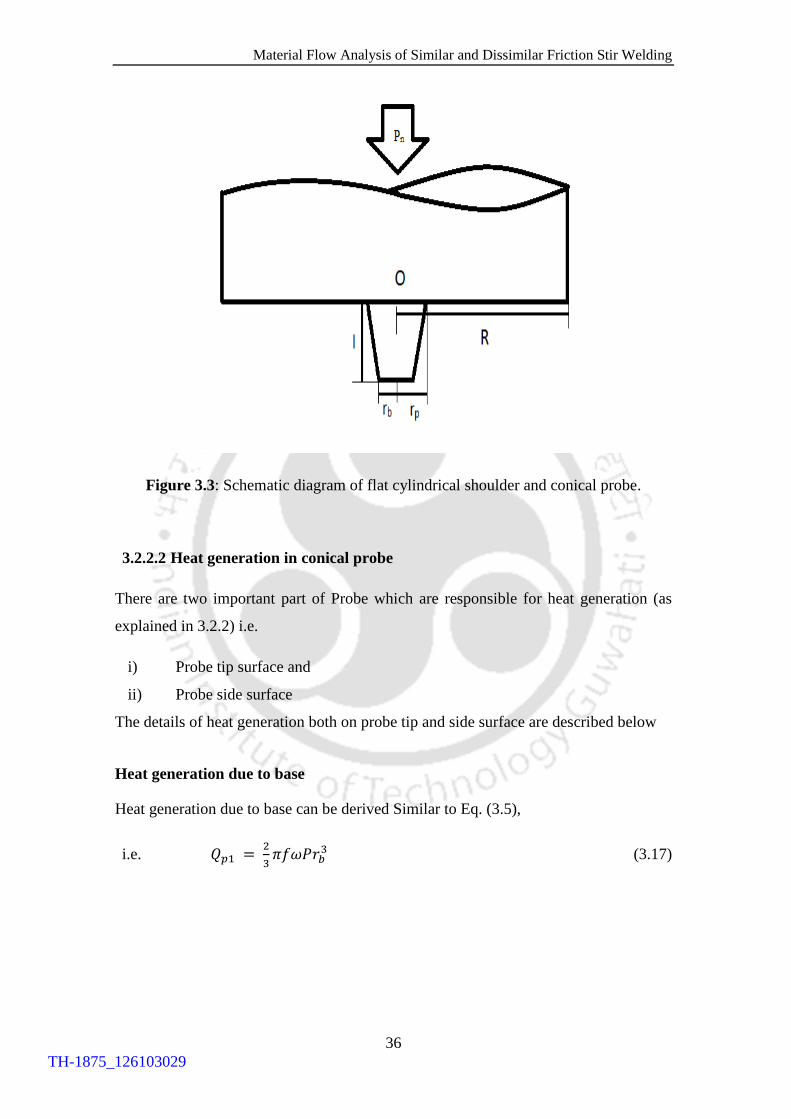
Material Flow Analysis of Similar and Dissimilar Friction Stir Welding
36
Figure 3.3: Schematic diagram of flat cylindrical shoulder and conical probe.
3.2.2.2 Heat generation in conical probe
There are two important part of Probe which are responsible for heat generation (as
explained in 3.2.2) i.e.
i) Probe tip surface and
ii) Probe side surface
The details of heat generation both on probe tip and side surface are described below
Heat generation due to base
Heat generation due to base can be derived Similar to Eq. (3.5),
i.e. 𝑄𝑝1 = 2
3𝜋𝑓𝜔𝑃𝑟𝑏
3 (3.17)
TH-1875_126103029
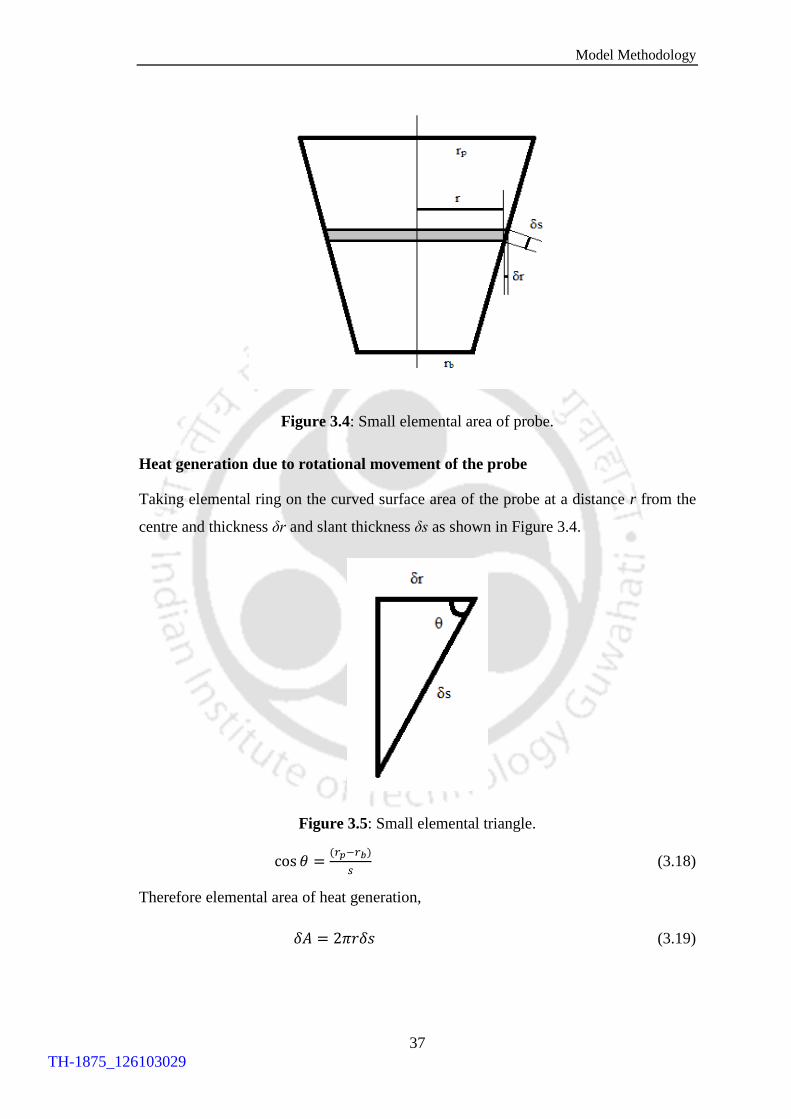
Model Methodology
37
Figure 3.4: Small elemental area of probe.
Heat generation due to rotational movement of the probe
Taking elemental ring on the curved surface area of the probe at a distance r from the
centre and thickness δr and slant thickness δs as shown in Figure 3.4.
Figure 3.5: Small elemental triangle.
cos 𝜃 =(𝑟𝑝−𝑟𝑏)
𝑠 (3.18)
Therefore elemental area of heat generation,
𝛿𝐴 = 2𝜋𝑟𝛿𝑠 (3.19)
TH-1875_126103029

Material Flow Analysis of Similar and Dissimilar Friction Stir Welding
38
Frictional heat generation can be obtained as,
𝛿𝐹𝑝 = 𝑓𝑆𝑦𝑠∗ . 2𝜋𝑟𝛿𝑠 (3.20)
Therefore heat generation,
𝛿𝑄𝑝2 = 2𝑓𝜔𝑆𝑦𝑠∗ 𝜋𝑟2𝛿𝑠 (3.21)
From Figure 3.5,
cos 𝜃 = 𝛿𝑟
𝛿𝑠
𝛿𝑠 =𝛿𝑟
cos 𝜃 (3.22)
By Pythagoras theorem,
𝑠 = √(𝑟𝑝 − 𝑟𝑏)2 + 𝑙2 (3.23)
From Eqs. (3.22) & (3.21)
𝛿𝑄𝑝2 = 2𝑓𝜋𝜔
cos 𝜃𝑆𝑦𝑠
∗ 𝑟2𝛿𝑟
Integrating both sides,
𝑄𝑝2 = 2𝑓𝜋𝜔
cos 𝜃𝑆𝑦𝑠
∗ ∫ 𝑟2𝛿𝑟𝑟𝑝
𝑟𝑏
𝑄𝑝2 =2
3
𝑓𝜋𝜔
cos 𝜃𝑆𝑦𝑠
∗ (𝑟𝑝3 − 𝑟𝑏
3)
Using Eqs. (3.18) & (3.23)
𝑄𝑝2 =2
3𝜋𝑓𝜔𝑆𝑦𝑠
∗ (𝑟𝑝2 + 𝑟𝑝𝑟𝑏 + 𝑟𝑏
2)√(𝑟𝑝 − 𝑟𝑏)2 + 𝑙2 (3.24)
Heat generation due to travelling of the probe
Let us consider that probe is moving with a velocity of 𝑣, taking yield strength of the
workpiece at 80% of its melting temperature S*
ys. In this heat generation we only
consider half of the curved surface area which is responsible for heat generation during
the travelling of workpiece.
𝛿𝐴 = 𝜋𝑟𝛿𝑠 (3.25)
TH-1875_126103029
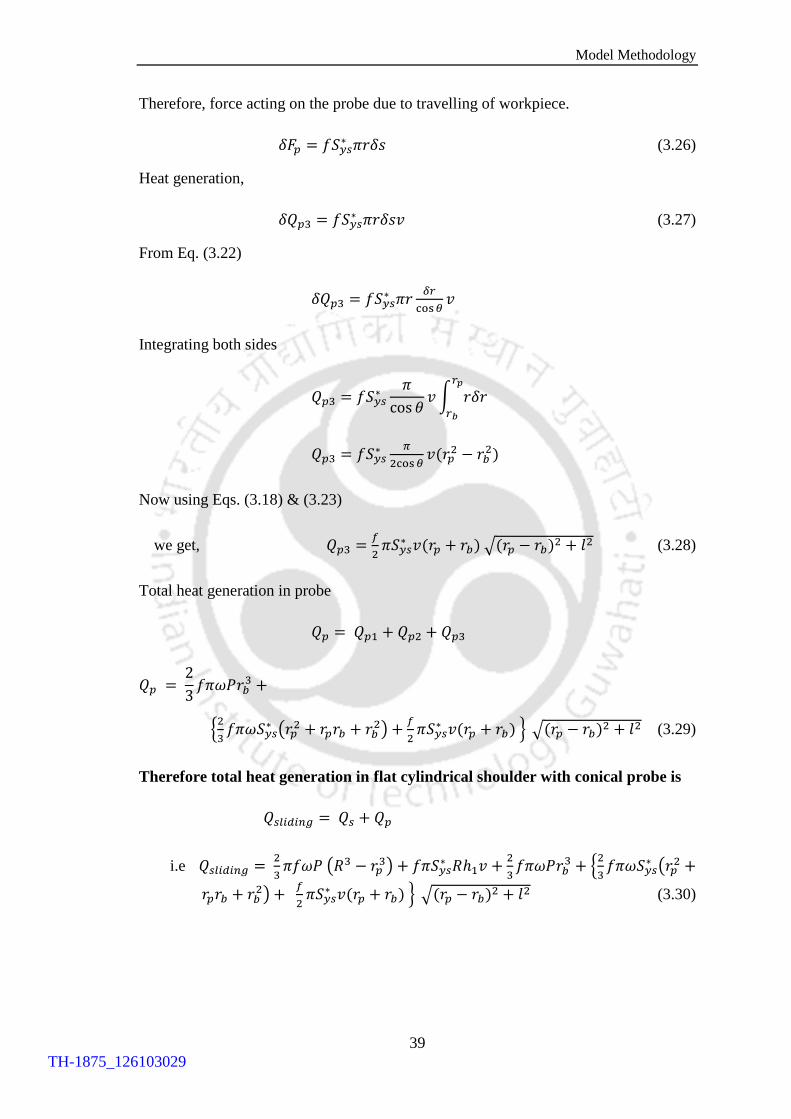
Model Methodology
39
Therefore, force acting on the probe due to travelling of workpiece.
𝛿𝐹𝑝 = 𝑓𝑆𝑦𝑠∗ 𝜋𝑟𝛿𝑠 (3.26)
Heat generation,
𝛿𝑄𝑝3 = 𝑓𝑆𝑦𝑠∗ 𝜋𝑟𝛿𝑠𝑣 (3.27)
From Eq. (3.22)
𝛿𝑄𝑝3 = 𝑓𝑆𝑦𝑠∗ 𝜋𝑟
𝛿𝑟
cos 𝜃𝑣
Integrating both sides
𝑄𝑝3 = 𝑓𝑆𝑦𝑠∗
𝜋
cos 𝜃𝑣 ∫ 𝑟𝛿𝑟
𝑟𝑝
𝑟𝑏
𝑄𝑝3 = 𝑓𝑆𝑦𝑠∗ 𝜋
2cos 𝜃𝑣(𝑟𝑝
2 − 𝑟𝑏2)
Now using Eqs. (3.18) & (3.23)
we get, 𝑄𝑝3 =𝑓
2𝜋𝑆𝑦𝑠
∗ 𝑣(𝑟𝑝 + 𝑟𝑏) √(𝑟𝑝 − 𝑟𝑏)2 + 𝑙2 (3.28)
Total heat generation in probe
𝑄𝑝 = 𝑄𝑝1 + 𝑄𝑝2 + 𝑄𝑝3
𝑄𝑝 = 2
3𝑓𝜋𝜔𝑃𝑟𝑏
3 +
{2
3𝑓𝜋𝜔𝑆𝑦𝑠
∗ (𝑟𝑝2 + 𝑟𝑝𝑟𝑏 + 𝑟𝑏
2) +𝑓
2𝜋𝑆𝑦𝑠
∗ 𝑣(𝑟𝑝 + 𝑟𝑏) } √(𝑟𝑝 − 𝑟𝑏)2 + 𝑙2 (3.29)
Therefore total heat generation in flat cylindrical shoulder with conical probe is
𝑄𝑠𝑙𝑖𝑑𝑖𝑛𝑔 = 𝑄𝑠 + 𝑄𝑝
i.e 𝑄𝑠𝑙𝑖𝑑𝑖𝑛𝑔 = 2
3𝜋𝑓𝜔𝑃 (𝑅3 − 𝑟𝑝
3) + 𝑓𝜋𝑆𝑦𝑠∗ 𝑅ℎ1𝑣 +
2
3𝑓𝜋𝜔𝑃𝑟𝑏
3 + {2
3𝑓𝜋𝜔𝑆𝑦𝑠
∗ (𝑟𝑝2 +
𝑟𝑝𝑟𝑏 + 𝑟𝑏2) +
𝑓
2𝜋𝑆𝑦𝑠
∗ 𝑣(𝑟𝑝 + 𝑟𝑏) } √(𝑟𝑝 − 𝑟𝑏)2 + 𝑙2 (3.30)
TH-1875_126103029
Material Flow Analysis of Similar and Dissimilar Friction Stir Welding
40
3.3 Heat generation due to plastic deformation
There are two sources of heat generation in the FSW process. One is friction heat
generation while the other is plastic heat generation. The friction heat generation is
discussed in the earlier section whereas this section covers the plastic heat generation.
The plastic heat generation is caused by the deformation of the material inside the
plate.
3.3.1 Heat generation in flat cylindrical shoulder and cylindrical probe
It is considered that the sticking velocity of the tool is 𝜔 and 𝜏 be the shear strength of
the workpiece and 𝜏∗ be the shear strength of the material at 80% of its melting point
temperature, due to this shearing stress between the layers the total heat generation is
calculated as follows.
3.3.1.1 Heat generation in shoulder
Taking an elemental ring of thickness δr which is at r distance from the centre O
Therefore the area of the elemental ring,
𝛿𝐴 = 2𝜋𝑟𝛿𝑟 (3.31)
Force acting in elemental ring,
𝛿𝐹 = 𝜏∗. 2𝜋rδr (3.32)
Heat generation due to elemental ring,
𝛿𝑄𝑠 = 2𝜏∗𝜋rδr. 𝜔r (3.33)
Integrating both sides of Eq. (3.33),
i.e. 𝑄𝑆 = 2𝜋𝜏∗𝜔 ∫ 𝑟2𝛿𝑟𝑅
𝑟𝑝
Or 𝑄𝑆 =2
3𝜋𝜔𝜏∗ (𝑅3 − 𝑟𝑝
3) (3.34)
TH-1875_126103029

Model Methodology
41
3.3.1.2 Heat generation in probe
There are two important part of Probe which is responsible for heat generation i.e.
i) Probe tip surface and
ii) Probe side surface
The details of heat generation both on probe tip and side surface are described below.
Heat generation in cylindrical probe tip
Heat generation in cylindrical probe tip can be derived similarly to Eq. (3.34),
𝑄𝑝1 =2
3𝜋𝜔𝜏∗𝑟𝑝
3
(3.35)
Heat generation due to the rotational movement of the probe
Force acting on the probe on its surface,
𝐹𝑝 = 𝜏∗. 2𝜋𝑟𝑝𝑙 (3.36)
Heat generation through the curved surface area,
𝑄𝑝2 = 2𝜋𝜏∗𝜔𝑟𝑝2𝑙 (3.37)
Total heat generation in probe,
𝑄𝑝 = 𝑄𝑝1 + 𝑄𝑝2
i.e. 𝑄𝑝 = 2
3𝜋𝜔𝜏∗𝑟𝑝
3 + 2𝜋𝜏∗𝜔𝑟𝑝2𝑙
Therefore total heat generation in Flat Cylindrical shoulder with cylindrical
probe is
𝑄𝑠𝑡𝑖𝑐𝑘𝑖𝑛𝑔 = 𝑄𝑠 + 𝑄𝑝
i.e. 𝑄𝑠𝑡𝑖𝑐𝑘𝑖𝑛𝑔 =2
3𝜋𝜔𝜏∗ (𝑅3 − 𝑟𝑝
3) +2
3𝜋𝜔𝜏∗𝑟𝑝
3 + 2𝜋𝜏∗𝜔𝑟𝑝2𝑙 (3.38)
TH-1875_126103029

Material Flow Analysis of Similar and Dissimilar Friction Stir Welding
42
3.3.2 Heat generation in flat cylindrical shoulder with conical probe
It is considered that sticking angular velocity is 𝜔 and 𝜏∗ be the shear strength of the
material at 80% of its melting point temperature, due to this shearing stress between
the layers the total heat generation is calculated as follows.
3.3.2.1 Heat generation in shoulder
The total heat generation in shoulder is given by Eq. (3.34)
i.e. 𝑄𝑠 =2
3𝜋𝜔𝜏∗ (𝑅3 − 𝑟𝑝
3)
3.3.2.2 Heat generation in conical probe
There are two important part of Probe which is responsible for heat generation i.e.
i) Probe tip surface and
ii) Probe side surface
The details of heat generation both on probe tip and side surface are described below.
Heat generation due to base
Heat generation due to probe base can be derived similarly to Eq. (3.35),
𝑄𝑝1 = 2
3𝜋𝜔𝜏∗𝑟𝑏
3 (3.39)
Heat generation due to rotational movement of the probe
Taking elemental ring on the curved surface area of the probe at a distance r from the
centre and thickness δr and slant thickness δs
cos 𝜃 =(𝑟𝑝−𝑟𝑏)
𝑠 (3.40)
Taking elemental area of heat generation,
𝛿𝐴 = 2𝜋𝑟𝛿𝑠 (3.41)
TH-1875_126103029

Model Methodology
43
Frictional heat generation,
𝛿𝐹𝑝 = 𝜏∗. 2𝜋𝑟𝛿𝑠 (3.42)
Heat generation,
𝛿𝑄2 = 2𝜔𝜏∗𝜋𝑟2𝛿𝑠 (3.43)
From Figure 3.5,
cos 𝜃 = 𝛿𝑟
𝛿𝑠
𝛿𝑠 =𝛿𝑟
cos 𝜃 (3.44)
whereas,
𝑠 = √(𝑟𝑝 − 𝑟𝑏)2 + 𝑙2 (3.45)
From Eqs. (3.43) and (3.44)
𝛿𝑄𝑝2 = 2𝜋𝜔
cos 𝜃𝜏∗𝑟2𝛿𝑟 (3.46)
Integrating both sides,
𝑄𝑝2 = 2𝜋𝜔
cos 𝜃𝜏∗ ∫ 𝑟2𝛿𝑟
𝑟𝑝
𝑟𝑏
𝑄𝑝2 =2
3
𝜋𝜔
cos 𝜃𝜏∗(𝑟𝑝
3 − 𝑟𝑏3) (3.47)
Using Eqs. (3.45) and (3.47)
𝑄𝑝2 =2
3𝜋𝜔𝜏∗(𝑟𝑝
2 + 𝑟𝑝𝑟𝑏 + 𝑟𝑏2)√(𝑟𝑝 − 𝑟𝑏)2 + 𝑙2 (3.48)
Total heat generation in probe
𝑄𝑝 = 𝑄𝑝1 + 𝑄𝑝2
𝑄𝑝 = 2
3𝜋𝜔𝜏∗𝑟𝑏
3 + {2
3𝜋𝜔𝜏∗(𝑟𝑝
2 + 𝑟𝑝𝑟𝑏 + 𝑟𝑏2) } √(𝑟𝑝 − 𝑟𝑏)2 + 𝑙2 (3.49)
TH-1875_126103029

Material Flow Analysis of Similar and Dissimilar Friction Stir Welding
44
Therefore total heat generation in Flat cylindrical shoulder with conical probe is
𝑄𝑠𝑡𝑖𝑐𝑘𝑖𝑛𝑔 = 𝑄𝑠 + 𝑄𝑝
i.e 𝑄𝑠𝑡𝑖𝑐𝑘𝑖𝑛𝑔 =2
3𝜋𝜔𝜏∗ (𝑅3 − 𝑟𝑝
3) +2
3𝜋𝜔𝜏∗𝑟𝑏
3 +
{2
3𝜋𝜔𝜏∗(𝑟𝑝
2 + 𝑟𝑝𝑟𝑏 + 𝑟𝑏2) } √(𝑟𝑝 − 𝑟𝑏)2 + 𝑙2 (3.50)
The above heat generation equations are derived for either completely sliding or
completely sticking condition. But in actual phenomenon, partial sliding and partial
sticking condition exist. To accommodate that, a sliding factor 𝛿 is introduced in the
heat generation equations which relates the two phenomenon of heat generation give in
Eq. (3.51).
𝑄𝑡𝑜𝑡𝑎𝑙 = (1 − 𝛿)𝑄𝑠𝑙𝑖𝑑𝑖𝑛𝑔 + 𝛿𝑄𝑠𝑡𝑖𝑐𝑘𝑖𝑛𝑔 (3.51)
The 𝛿 range from 0 to 1, when 𝛿=1 the sticking heat generation dominates over the
sliding heat generation. When 𝛿=0 the sliding heat generation dominates over the
sticking heat generation. But in the actual phenomenon, the sliding factor is much
closer 0.58 [141] as the high transportation of the softer material from the advancing
side to the retreating side occur on the tool front . On the retreating side, the material
gets extruded between the tool wall and the colder material away from the weld zone.
The extruded material is then forged by the tool on the trailing side to form a welded
joint.
3.4 Three-dimensional finite element model
A three-dimensional finite element transient thermal model is presented in the current
work to analyze the heat transfer and temperature distribution in an FSW process. All
the thermal properties are considered for the analysis. The temperature dependent
material properties of Aluminium alloy is shown in Table 3.1. The melting point of the
commercial grade Aluminium alloy is about 660oC. The temperature-dependent
friction coefficient of Aluminium and steel is shown in Table 3.2.
TH-1875_126103029
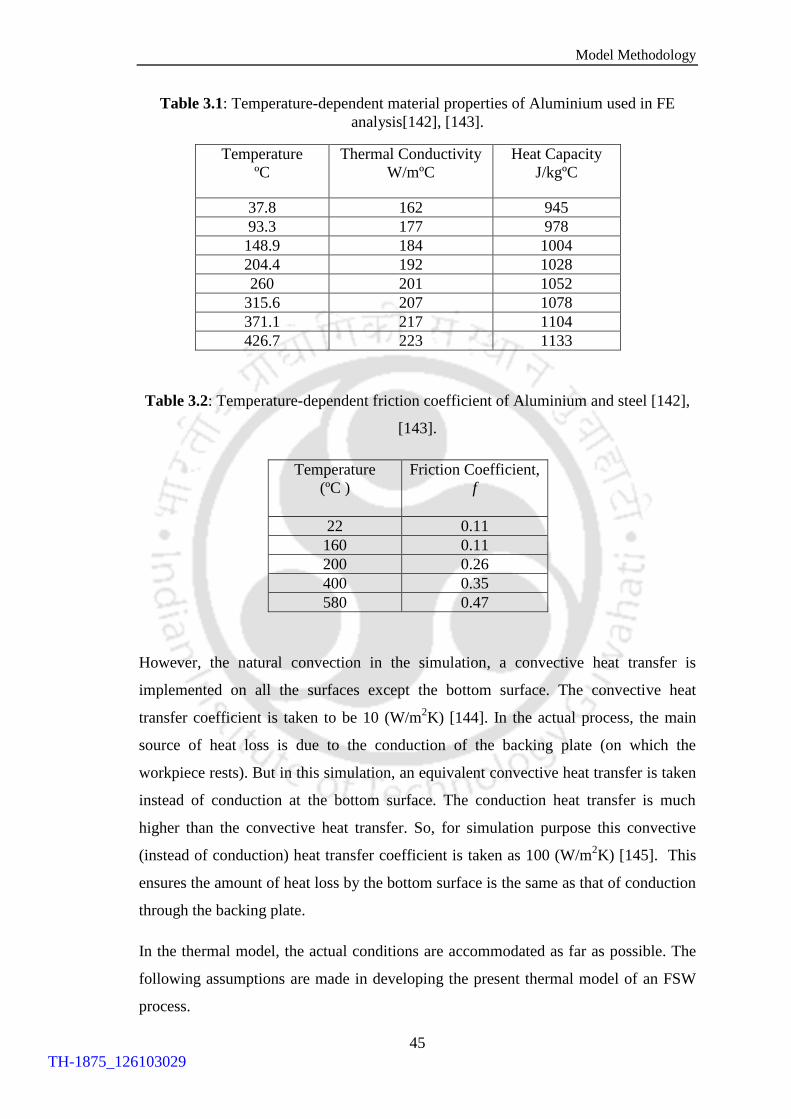
Model Methodology
45
Table 3.1: Temperature-dependent material properties of Aluminium used in FE
analysis[142], [143].
Temperature
ºC
Thermal Conductivity
W/mºC
Heat Capacity
J/kgºC
37.8 162 945
93.3 177 978
148.9 184 1004
204.4 192 1028
260 201 1052
315.6 207 1078
371.1 217 1104
426.7 223 1133
Table 3.2: Temperature-dependent friction coefficient of Aluminium and steel [142],
[143].
Temperature
(ºC )
Friction Coefficient,
f
22 0.11
160 0.11
200 0.26
400 0.35
580 0.47
However, the natural convection in the simulation, a convective heat transfer is
implemented on all the surfaces except the bottom surface. The convective heat
transfer coefficient is taken to be 10 (W/m2K) [144]. In the actual process, the main
source of heat loss is due to the conduction of the backing plate (on which the
workpiece rests). But in this simulation, an equivalent convective heat transfer is taken
instead of conduction at the bottom surface. The conduction heat transfer is much
higher than the convective heat transfer. So, for simulation purpose this convective
(instead of conduction) heat transfer coefficient is taken as 100 (W/m2K) [145]. This
ensures the amount of heat loss by the bottom surface is the same as that of conduction
through the backing plate.
In the thermal model, the actual conditions are accommodated as far as possible. The
following assumptions are made in developing the present thermal model of an FSW
process.
TH-1875_126103029

Material Flow Analysis of Similar and Dissimilar Friction Stir Welding
46
a) All the thermal properties are considered as a function of temperature.
b) Linear Newtonian convection cooling is considered on all the surfaces.
c) Heat generation is considered as a load.
The governing differential equation for heat conduction for a homogenous, isotropic
solid without heat generation in the rectangular coordinate system (x, y, z) can be
expressed as:
𝜕
𝜕𝑥[𝐾
𝜕𝑇
𝜕𝑥] +
𝜕
𝜕𝑦[𝐾
𝜕𝑇
𝜕𝑦] +
𝜕
𝜕𝑧[𝐾
𝜕𝑇
𝜕𝑧] = 𝜌𝑐
𝜕𝑇
𝜕𝑡 (3.52)
where
𝐾 = thermal conductivity
𝑇 = temperature
𝜌 = density of the material
𝑐 = specific heat
𝑡 = time
Above equation can be written as:
𝜌𝑐𝜕𝑇
𝜕𝑡= −{𝐿}𝑇{𝑞} (3.53)
where
x
Ly
z
= vector operator,
{𝑞} = heat flux vector,
qqLT
. , and
TTL
where
represents grad operator,
. represents divergence operator.
TH-1875_126103029

Model Methodology
47
Fourier’s law is used to relate the heat flux vector to the thermal gradient
{𝑞} = −[𝐷]{𝐿}𝑇
where
K
K
K
D
00
00
00
= conductivity matrix.
Equation (3.53) can be written as:
𝜌𝑐
𝜕𝑇
𝜕𝑡= {𝐿}𝑇([𝐷]{𝐿}𝑇) (3.54)
To solve Eq. (3.54), we need a set of boundary conditions.
(i) Initial condition
A specified initial temperature for the FSW that covers all the elements of the
specimen:
T= T for t = 0 (3.55)
where T is the ambient temperature.
To develop second and third boundary conditions we consider energy balance at the
work surface as:
Heat supply = Heat loss.
(ii) First boundary condition
A specific heat flows acts over tool surface S1:
supqqn (3.56)
The quantity nq represents the component of the conduction heat flux vector normal to
the work surface. The quantity supq represents the heat flux supplied to the work
surface in 2m
W , from an external FSW tool.
nqqT
n
on the surface S1 for t > 0 (3.57)
where
n = unit outward normal vector.
TH-1875_126103029
Material Flow Analysis of Similar and Dissimilar Friction Stir Welding
48
(iii) Second boundary condition:
Considering heat loss ( convq ) due to convection over remaining surface S2 (Newton’s
law of cooling):
convn qq
or
TThnq f
T
On surface S2 for t > 0. (3.58)
Pre-multiplying Eq. (3.54) by a virtual change in temperature, integrating over the
volume of the element, combining with Eqs. (3.57) and (3.58), and with some
algebraic manipulation we get:
2
1sup
2
1
SdTTTh
SdTqvoldTLDTLt
TTc
sf
vol s
T
(3.59)
where
δvol = volume of the element
δT= an allowable virtual temperature. tzyxT ,,,
Derivation of heat flow matrices
As stated before, the variable T is allowed to vary both in space and time. This
dependency is expressed as:
e
TTNT (3.60)
where
tzyxTT ,,, = temperature
zyxNN ,, = element shape function
tTT ee = nodal temperature vector.
The time derivatives of Eq. (3.60) may be written as:
e
TTN
t
TT
(3.61)
TH-1875_126103029
Model Methodology
49
T has the same form as T:
T = NTT
e (3.62)
The combination of TL is written as:
eTBTL
where
TNLB (3.63)
The variational statement of Eq. (3.59) can be combined with Eqs. (3.60, 3.61, 3.62 &
3.63) to yield:
21
21sups
e
T
f
T
es
T
e
vol vole
TT
ee
TT
e
SdTNThNTSdqNT
voldTBDBTvoldTNNTc
(3.64)
The density is assumed to remain constant and specific heat c may vary over the
element. Finally ee TT , and eT are nodal quantities and do not vary over the
element, so that they also may be taken out from the integrals. Now, since all
quantities are pre-multiplied by ,eT this term may also be dropped from the resulting
equation. Thus Eq. (3.64) may be reduced to:
1
2
2
sup 1
2 2
T T
e evol vol s
T
f f es
S
c N N d vol T B D B d vol T N q d S
T N h d S h N N T d S
(3.65)
Equation (3.65) can be rewritten as:
c
e
f
ee
tc
e
th
ee
t
e QQTKKTC
.
where
vol
Tt
e voldNNcC = element specific heat matrix
vol
Ttb
e voldBDBK )( = element diffusion conductivity matrix
2
)( 2S
T
f
tc
e SdNNhK = element convection surface conductivity matrix
TH-1875_126103029

Material Flow Analysis of Similar and Dissimilar Friction Stir Welding
50
1
)( 1supS
f
e SdqNQ = element heat flow vector for surface S1
2
)( 2S
f
c
e SdNhTQ = element convection surface heat flow vector.
The element specific heat matrix t
eC is evaluated from the specific heat of the
material. The solution is obtained using the ANSYS FE package.
3.4.1 Meshing details
For transient thermal analysis 3D 8 noded brick element, Solid 70 having temperature
as the degree of freedom is used as shown in Figure 3.6. The nodes are represented by
the small alphabets (i to p) and the face of element is represented by the numerical
value (1 to 6) It is ideal for the problems associated with transient thermal conduction.
The plate mesh for the transient thermal analysis is shown in Figure 3.7. The mesh is
finer in the weld region while coarse away for the weld line. The plate dimensions
used in the models are 200 × 150 × 6 mm for all the analysis.
Figure 3.6: Solid 70 brick element (ANSYS) used for thermal analysis.
TH-1875_126103029
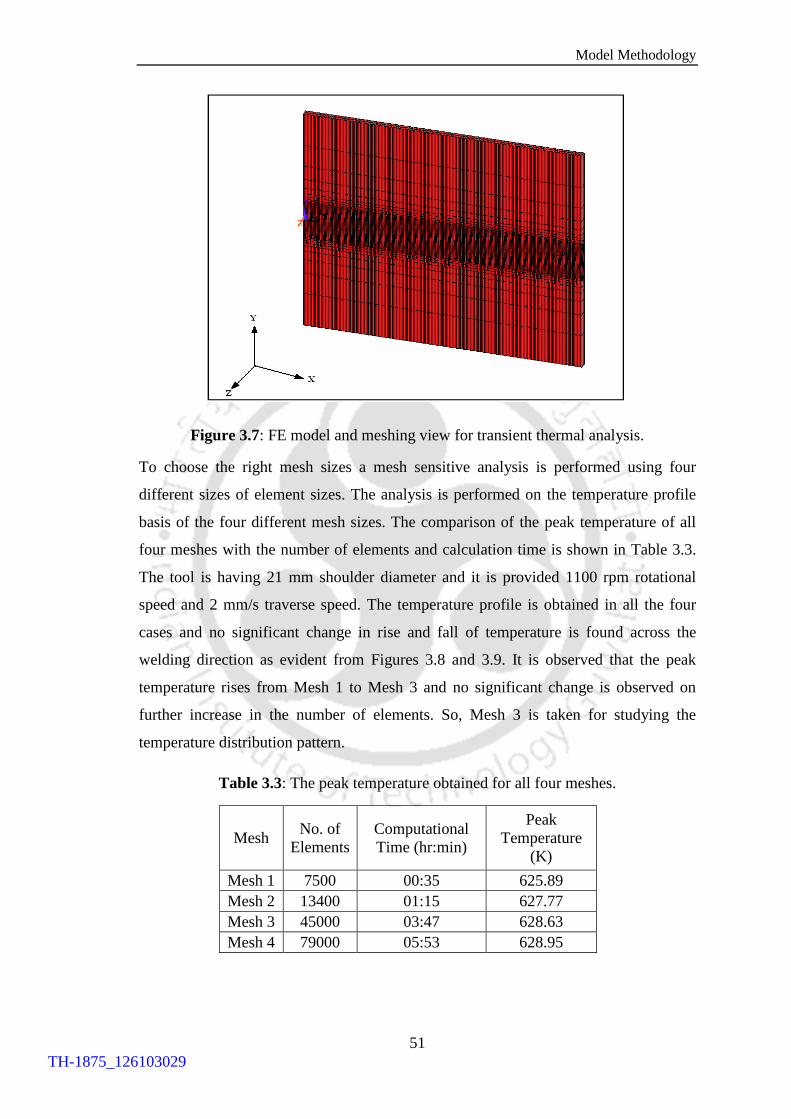
Model Methodology
51
Figure 3.7: FE model and meshing view for transient thermal analysis.
To choose the right mesh sizes a mesh sensitive analysis is performed using four
different sizes of element sizes. The analysis is performed on the temperature profile
basis of the four different mesh sizes. The comparison of the peak temperature of all
four meshes with the number of elements and calculation time is shown in Table 3.3.
The tool is having 21 mm shoulder diameter and it is provided 1100 rpm rotational
speed and 2 mm/s traverse speed. The temperature profile is obtained in all the four
cases and no significant change in rise and fall of temperature is found across the
welding direction as evident from Figures 3.8 and 3.9. It is observed that the peak
temperature rises from Mesh 1 to Mesh 3 and no significant change is observed on
further increase in the number of elements. So, Mesh 3 is taken for studying the
temperature distribution pattern.
Table 3.3: The peak temperature obtained for all four meshes.
Mesh No. of
Elements
Computational
Time (hr:min)
Peak
Temperature
(K)
Mesh 1 7500 00:35 625.89
Mesh 2 13400 01:15 627.77
Mesh 3 45000 03:47 628.63
Mesh 4 79000 05:53 628.95
TH-1875_126103029

Material Flow Analysis of Similar and Dissimilar Friction Stir Welding
52
-0.15 -0.10 -0.05 0.00 0.05 0.10 0.15300
350
400
450
500
550
600
650
700
Tem
pera
ture
(K
)
Y (m)
Mesh1
Mesh2
Mesh3
Mesh4
Figure 3.8: The rise and fall of temperature across the weld line of all four mesh sizes.
-0.05 -0.03 0.00 0.03 0.05450
500
550
600
650
700
Tem
pera
ture
(K
)
Y (m)
Mesh1
Mesh2
Mesh3
Mesh4
Figure 3.9: The variation of all four mesh sizes in the temperature profile.
TH-1875_126103029

Model Methodology
53
3.5 Material flow models for similar material
In this work, the finite volume model is employed for simulating the task. Aluminium
alloy 6061 is used as the plate material for the analysis. The dimensions of the plate
are 200 mm long, 150 mm total width and 6 mm thick. A 25 mm diameter tool
shoulder with a conical pin having 6 mm base and 3 mm pin tip diameter is used in
this study. The length of the pin is 5.75 mm having threads with a pitch 1.5 mm is
shown in Figure 3.10 (a). The tool is incorporated into the model as a wall with 0.1
mm depression in the weld plate due to the plunging force during the welding. The
weld plate is meshed using tetrahedral elements. The tools are incorporated as walls in
the weld plate into the model. The weld plate is meshed using tetrahedral elements.
The mesh is refined near the tool pin region shown in Figure 3.10 (b). The analysis is
performed in ANSYS Fluent 14.5. For further analysis, different tool geometries are
considered to study their effect on material flow.
(a) (b)
Figure 3.10: (a) The model of the tool, (b) the meshing and the tool impression.
Table 3.4: The different mesh size taken for the analysis.
Mesh No. of
Elements
Computational
Time (hr:min)
Peak
Temperature
(K)
Mesh1 33,669 8:33 742.25
Mesh2 132,533 13:47 744.44
Mesh3 198,057 18:16 746.07
Mesh4 394,145 32:17 746.87
TH-1875_126103029
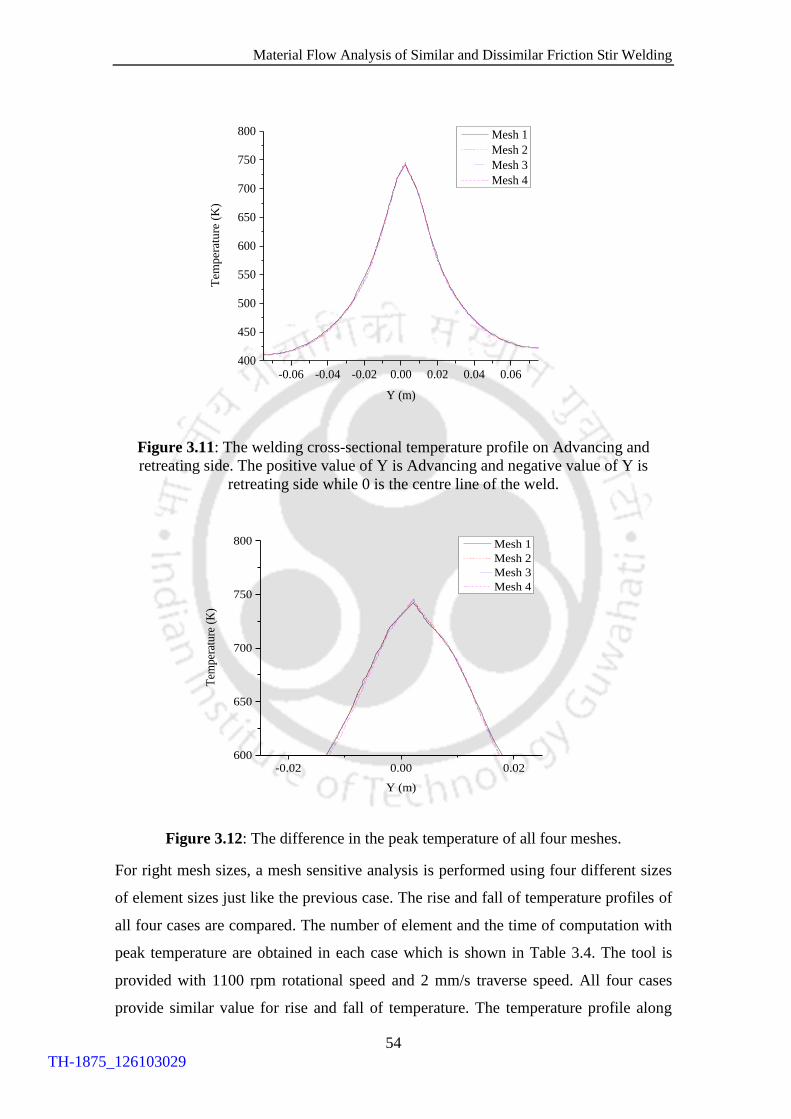
Material Flow Analysis of Similar and Dissimilar Friction Stir Welding
54
-0.06 -0.04 -0.02 0.00 0.02 0.04 0.06400
450
500
550
600
650
700
750
800
Tem
per
atu
re (
K)
Y (m)
Mesh 1
Mesh 2
Mesh 3
Mesh 4
Figure 3.11: The welding cross-sectional temperature profile on Advancing and
retreating side. The positive value of Y is Advancing and negative value of Y is
retreating side while 0 is the centre line of the weld.
-0.02 0.00 0.02600
650
700
750
800
Tem
per
ature
(K
)
Y (m)
Mesh 1
Mesh 2
Mesh 3
Mesh 4
Figure 3.12: The difference in the peak temperature of all four meshes.
For right mesh sizes, a mesh sensitive analysis is performed using four different sizes
of element sizes just like the previous case. The rise and fall of temperature profiles of
all four cases are compared. The number of element and the time of computation with
peak temperature are obtained in each case which is shown in Table 3.4. The tool is
provided with 1100 rpm rotational speed and 2 mm/s traverse speed. All four cases
provide similar value for rise and fall of temperature. The temperature profile along
TH-1875_126103029
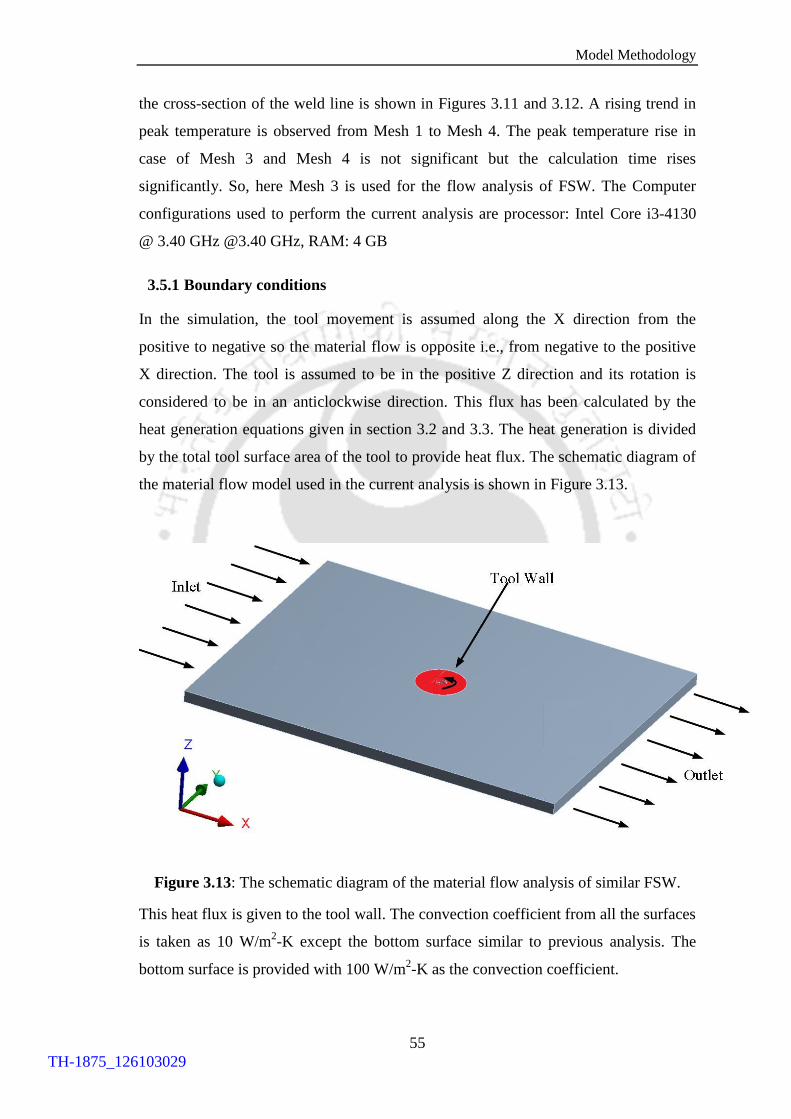
Model Methodology
55
the cross-section of the weld line is shown in Figures 3.11 and 3.12. A rising trend in
peak temperature is observed from Mesh 1 to Mesh 4. The peak temperature rise in
case of Mesh 3 and Mesh 4 is not significant but the calculation time rises
significantly. So, here Mesh 3 is used for the flow analysis of FSW. The Computer
configurations used to perform the current analysis are processor: Intel Core i3-4130
@ 3.40 GHz @3.40 GHz, RAM: 4 GB
3.5.1 Boundary conditions
In the simulation, the tool movement is assumed along the X direction from the
positive to negative so the material flow is opposite i.e., from negative to the positive
X direction. The tool is assumed to be in the positive Z direction and its rotation is
considered to be in an anticlockwise direction. This flux has been calculated by the
heat generation equations given in section 3.2 and 3.3. The heat generation is divided
by the total tool surface area of the tool to provide heat flux. The schematic diagram of
the material flow model used in the current analysis is shown in Figure 3.13.
Figure 3.13: The schematic diagram of the material flow analysis of similar FSW.
This heat flux is given to the tool wall. The convection coefficient from all the surfaces
is taken as 10 W/m2-K except the bottom surface similar to previous analysis. The
bottom surface is provided with 100 W/m2-K as the convection coefficient.
TH-1875_126103029
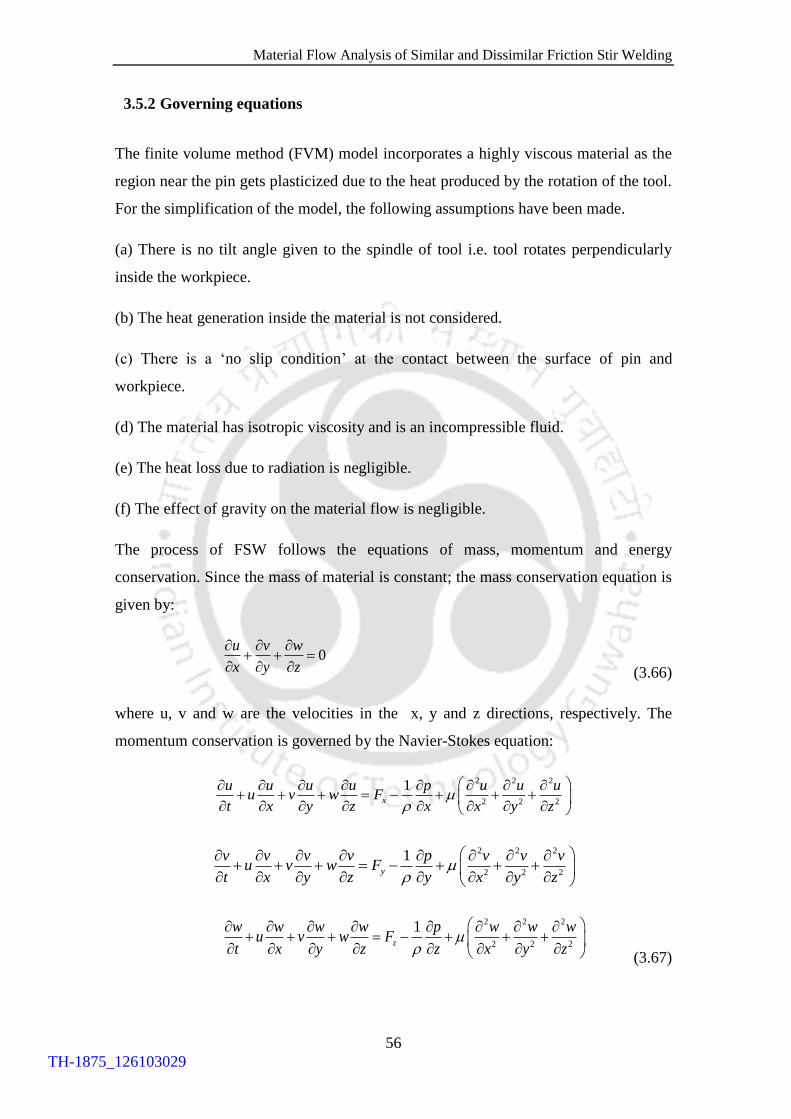
Material Flow Analysis of Similar and Dissimilar Friction Stir Welding
56
3.5.2 Governing equations
The finite volume method (FVM) model incorporates a highly viscous material as the
region near the pin gets plasticized due to the heat produced by the rotation of the tool.
For the simplification of the model, the following assumptions have been made.
(a) There is no tilt angle given to the spindle of tool i.e. tool rotates perpendicularly
inside the workpiece.
(b) The heat generation inside the material is not considered.
(c) There is a ‘no slip condition’ at the contact between the surface of pin and
workpiece.
(d) The material has isotropic viscosity and is an incompressible fluid.
(e) The heat loss due to radiation is negligible.
(f) The effect of gravity on the material flow is negligible.
The process of FSW follows the equations of mass, momentum and energy
conservation. Since the mass of material is constant; the mass conservation equation is
given by:
0u v w
x y z
(3.66)
where u, v and w are the velocities in the x, y and z directions, respectively. The
momentum conservation is governed by the Navier-Stokes equation:
2 2 2
2 2 2
1x
u u u u p u u uu v w F
t x y z x x y z
2 2 2
2 2 2
1y
v v v v p v v vu v w F
t x y z y x y z
2 2 2
2 2 2
1z
w w w w p w w wu v w F
t x y z z x y z
(3.67)
TH-1875_126103029
Model Methodology
57
where Fx, Fy and Fz are the forces in x, y and z directions, respectively; p is the static
pressure of the flow field; µ is the viscosity of fluid and ρ is the density of material.
The energy conservation equation is given by:
2 2 2
2 2 2
T T T T T T Tc u v w K
t x y z x y z
(3.68)
here c is the specific heat of material, K is the thermal conductivity of material and T is
the temperature of fluid.
3.5.3 Solver and discretization schemes
The details of the solution parameters used in the ANSYS Fluent package is provided
in this section. The double precision is used throughout the analysis. The transient
analysis is carried out using a pressure based solver as density is kept constant. The
second order implicit method is used to formulate the transient problem. The SIMPLE
scheme is used for pressure-velocity coupling. Different discretization schemes are
used in the analysis like least square cell-based discretization is used for convection-
diffusion terms. For pressure second order and for momentum and energy power law
discretization is used in the formulation. The linear system of equations are solved by
the Gauss-Seidel iteration methods where the initial values for pressure and u, v and w
are taken zero while Temperature is taken as 300 K (ambient) throughout the domain.
The residual values to stop the iteration process are taken as 10-4
for x, y and z
momentum and continuity equations while for the energy it is taken as 10-7
. The under-
relaxation factors are also altered to reduce the complexity of the problem. The typical
values for p, F, ρ, momentum and energy are 1, 1, 1, 0.85 and 0.9 respectively.
3.5.4 Material properties
The composition of the Aluminium 6061 alloy is Al (95.8-98.6), Cu (0.15-0.4), Mg
(0.8-1.2), Cr (0.04-0.35), Si (0.4-0.8) and Fe are the major components, whereas Mn,
Ti, Zn and other account less than 1 % by weight. However, Cu-B370 alloy contains
99.9 % Cu and Ni, Sn, Al, Fe and other account less than 0.1 % by weight.
TH-1875_126103029
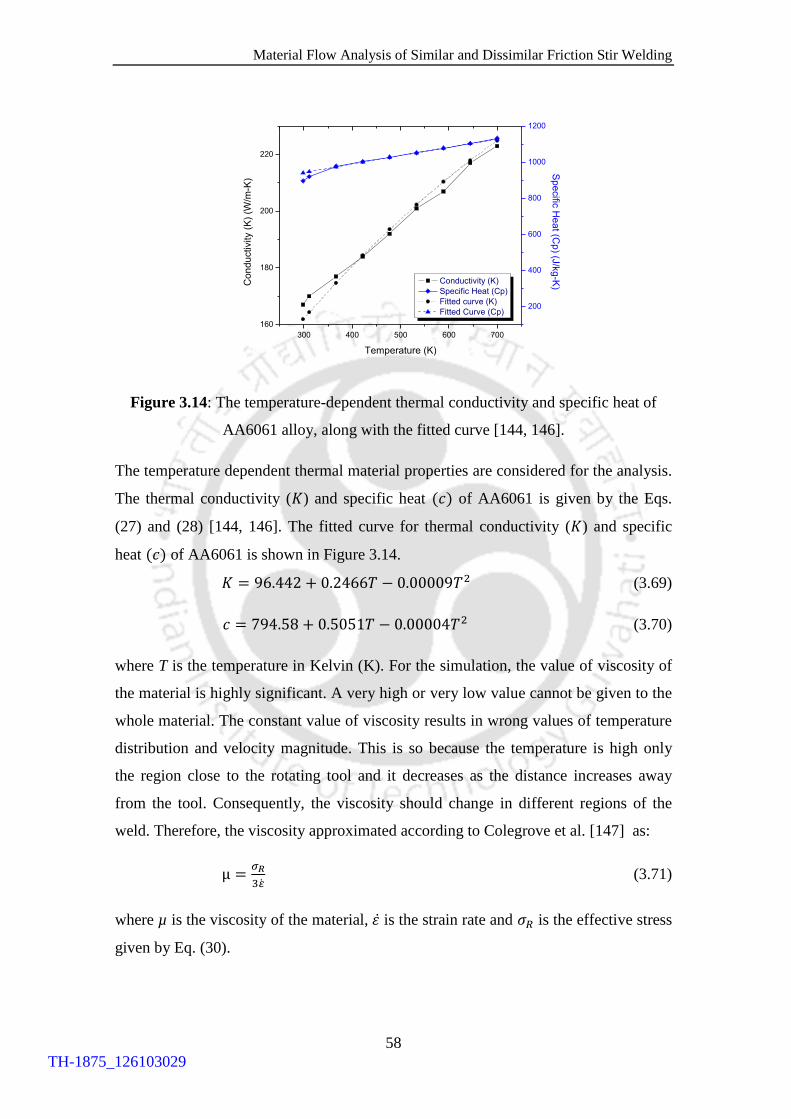
Material Flow Analysis of Similar and Dissimilar Friction Stir Welding
58
300 400 500 600 700
160
180
200
220
Conductivity (K)
Specific Heat (Cp)
Fitted curve (K)
Fitted Curve (Cp)
Temperature (K)
Co
nd
uctivity (
K)
(W/m
-K)
200
400
600
800
1000
1200
Sp
ecific
He
at (C
p) (J
/kg
-K)
Figure 3.14: The temperature-dependent thermal conductivity and specific heat of
AA6061 alloy, along with the fitted curve [144, 146].
The temperature dependent thermal material properties are considered for the analysis.
The thermal conductivity (𝐾) and specific heat (𝑐) of AA6061 is given by the Eqs.
(27) and (28) [144, 146]. The fitted curve for thermal conductivity (𝐾) and specific
heat (𝑐) of AA6061 is shown in Figure 3.14.
𝐾 = 96.442 + 0.2466𝑇 − 0.00009𝑇2 (3.69)
𝑐 = 794.58 + 0.5051𝑇 − 0.00004𝑇2 (3.70)
where T is the temperature in Kelvin (K). For the simulation, the value of viscosity of
the material is highly significant. A very high or very low value cannot be given to the
whole material. The constant value of viscosity results in wrong values of temperature
distribution and velocity magnitude. This is so because the temperature is high only
the region close to the rotating tool and it decreases as the distance increases away
from the tool. Consequently, the viscosity should change in different regions of the
weld. Therefore, the viscosity approximated according to Colegrove et al. [147] as:
µ =𝜎𝑅
3 ̇ (3.71)
where µ is the viscosity of the material, 휀̇ is the strain rate and 𝜎𝑅 is the effective stress
given by Eq. (30).
TH-1875_126103029

Model Methodology
59
11 2 2
1ln 1
n n
R
Z Z
A A
(3.72)
and
expQ
ZRT
(3.73)
where Q is the activation energy, R is the universal gas constant, T is the temperature,
Z is the Zener-Holloman parameter, α, A and n are constants related to the material.
The Tello et al. [148] experimentally obtained the material constant for AA6061 which
are as follows:
A = 1.63 x 10¹³ s-1
α = (1/60.7) MPa-1
n = 5.33
Q = 191 kJ/mol
A constant density is taken for the Aluminium and Cu alloys i.e. 2700 kg/m3 and 8960
kg/m3. The temperature dependent thermal conductivity and specific heat for Cu B370
is given by
𝐾 = 421.272 − 0.07009𝑇 − 0.00000125𝑇2 (3.74)
𝑐 = 373.2151 + 0.04384𝑇 + 0.000039𝑇2 (3.75)
The temperature dependent viscosity of Cu is approximated by the Arrhenius
equation[149]
𝑣𝐶𝑢 = 𝑣0 𝑒(
𝐸
𝑅𝑇) (3.76)
where 𝑣0 is the constant for Cu taken as 0.25 mPa-s[149], E is activation energy, R is
the universal gas constant and T is the temperature in K.
3.6 Dissimilar material VOF Model
The volume of fluid (VOF) model is used for the dissimilar material FSW analysis. It
is a multi-fluid interaction model in which the amount of fluid is determined by the
volume fraction (β) of the fluid. The volume fraction of A fluid varies between 0 to 1
i.e. 0 means no amount of A fluid is present in that cell and 1 means the cell is full of
TH-1875_126103029

Material Flow Analysis of Similar and Dissimilar Friction Stir Welding
60
fluid A. Similarly, for fluid B the volume fraction varies between 0 to 1, such that the
sum of all volume fraction is always unity. The governing equations are modified as:
The continuity equation:
𝜕
𝜕𝑡(𝛽𝐴𝜌𝐴) + ∇. (𝛽𝐴𝜌𝐴�⃗�) = 0 (3.77)
The momentum conservation is governed by the Navier-Stokes equation:
𝜕
𝜕𝑡(𝛽𝐴𝜌𝐴�⃗�) + 𝛻. (𝛽𝐴𝜌𝐴�⃗��⃗�) = �⃗� − ∇𝑝 + ∇. [𝜇𝐴(𝛽𝐴(∇�⃗� + ∇�⃗�𝑇))] + 𝛽𝐴𝜌𝐴�⃗� (3.78)
where p is the static pressure of the flow field; µ is the viscosity of the fluid and ρ is
the density of the material. The energy conservation equation is given by:
𝜌𝐴𝑐𝐴 (𝜕𝑇
𝜕𝑡+ �⃗�. ∇𝑇) = ∇. 𝐾𝐴(∇𝑇) (3.79)
here, c is the specific heat of material, K is the thermal conductivity of material and T
is the temperature of the fluid.
3.6.1 Boundary conditions
The heat input is provided as heat flux through the tool wall, which is based on the
heat generation Eq. (3.80).
𝑄𝑇 = (1 − 𝛿)𝑄𝑠𝑙𝑖𝑑𝑖𝑛𝑔 + 𝛿𝑄𝑠𝑡𝑖𝑐𝑘𝑖𝑛𝑔
(3.80)
where 𝛿 is the sliding factor which is taken as 0.58 [141], 𝑄𝑠𝑙𝑖𝑑𝑖𝑛𝑔 is the frictional heat
generation and 𝑄𝑠𝑡𝑖𝑐𝑘𝑖𝑛𝑔 is the sticking heat generation. Heat generation by sliding
and sticking condition is given by Eqs. (3.81) and (3.82).
𝑄𝑠𝑙𝑖𝑑𝑖𝑛𝑔 = α(2
3𝜋𝑓𝐴𝜔𝑃(𝑅3 − 𝑟𝑝
3) +2
3𝜋𝑓𝐴𝜔𝑃𝑟𝑝
3+ 𝑓𝐴𝜋𝑆𝑦𝑠𝐴 𝑟𝑝ℎ𝑣) + (1-α)(
2
3𝜋𝑓𝐶𝜔𝑃(𝑅3 −
𝑟𝑝3) +
2
3𝜋𝑓𝐶𝜔𝑃𝑟𝑝
3+ 𝑓𝐶𝜋𝑆𝑦𝑠𝐶 𝑟𝑝ℎ𝑣) (3.81)
𝑄𝑠𝑡𝑖𝑐𝑘𝑖𝑛𝑔= α(𝜋𝜔𝑙𝜏𝐴(𝑅2 − 𝑟𝑝2)) + (1-α)(𝜋𝜔𝑙𝜏𝐶(𝑅2 − 𝑟𝑝
2)) (3.82)
where α is the ratio of tool area inside Al plate to the total area of the tool wall, 𝑓𝐴
and 𝑓𝐶 are the coefficient of friction of Al and Cu taken as constant 0.3 [127] and 0.45
[150] respectively, 𝜔 and v are the rotational and travelling speed, P is the plunging
pressure and R and 𝑟𝑝 are the shoulder and pin radius, 𝜏𝐴, 𝜏𝐶 , 𝑆𝑦𝑠𝐴 and 𝑆𝑦𝑠
𝐶 are the
shear and yield strength of the Al and Cu and l is the height of the pin. The equation is
TH-1875_126103029

Model Methodology
61
further divided by the total area of the tool wall to get the value of heat flux. Similar to
the previous analysis, the convection coefficient from all the surfaces is taken as 10.0
W/m2-K except from the bottom surface as it remains in contact with the base plate so
the heat loss is due to conduction. The base plate considered in this case is mild steel
for which the convection coefficient is taken as 100 W/m2-K. The schematic diagram
of the model used in the present dissimilar material flow analysis is shown in Figure
3.15. The diagram shows all the solid and fluid regions along with advancing and
retreating sides and the co-ordinate system used in the present analysis. The origin of
the coordinate system is taken at the tool rotation axis on the top surface of the tool
wall same as previous analysis.
Figure 3.15: The Schematic diagram used in material flow model of dissimilar FSW.
3.7 Experimental details
Experiments are performed to study the thermal history data of the welding. This
thermal history is then compared with the thermal history obtained from the
simulation. The 6 mm thick with a surface area of 200 mm long and 75 mm wide
material is used for the experiments is i.e. same as simulation. The AA6061 workpiece
is prepared for similar FSW as shown in Figure 3.16.
TH-1875_126103029
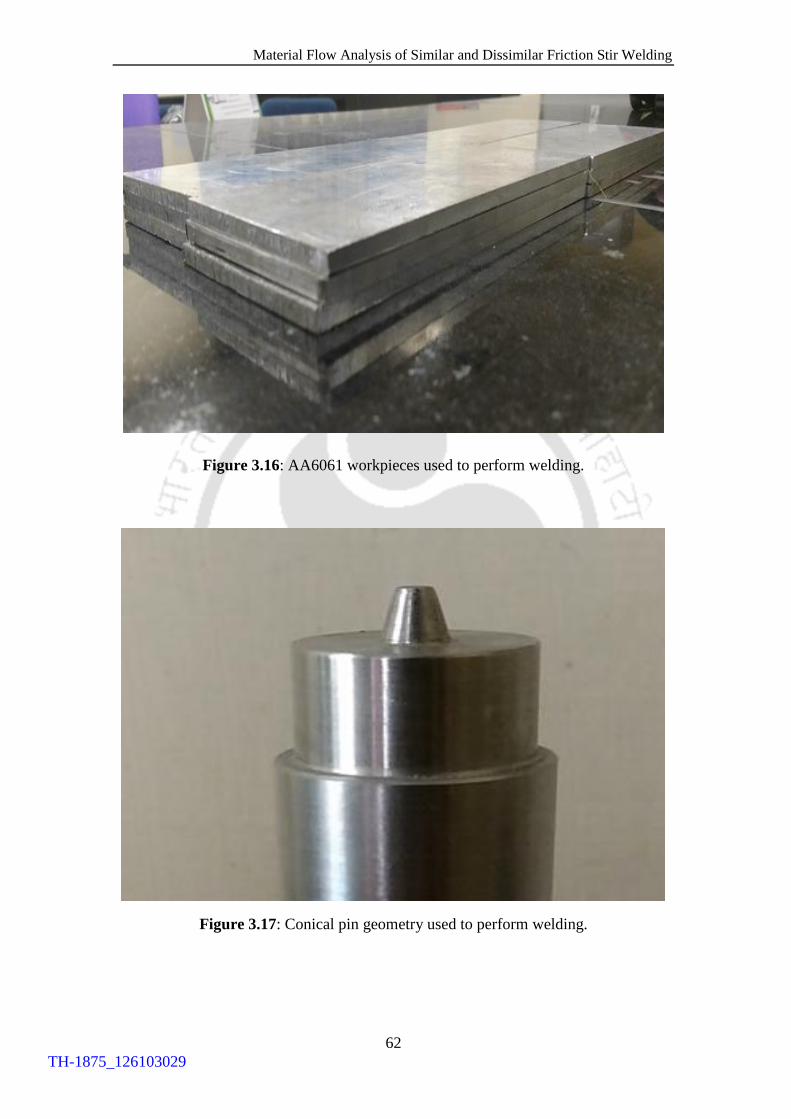
Material Flow Analysis of Similar and Dissimilar Friction Stir Welding
62
Figure 3.16: AA6061 workpieces used to perform welding.
Figure 3.17: Conical pin geometry used to perform welding.
TH-1875_126103029

Model Methodology
63
Figure 3.18: FSW machine with thermocouples and data acquisition system.
A conical SS310 alloy tool is used to perform the FSW as shown in Figure 3.17. The
reason for choosing this material is its ease of machinability, high strength, low
thermal conductivity, high formability and highly resistant to corrosion. For the
measurement of the temperature of the workpieces 1 mm diameter K-type
thermocouples (chromel and alumel wires) are used. The thermocouples are connected
to the data acquisition system (Agilent-34970A) to record the temperature data.
Different locations are chosen to attach the thermocouple based on the requirement.
The FSW machine with mounted tool and workpieces with thermocouples and data
acquisition system is shown in Figure 3.18. A square butt welding with zero root gap
is clamped into the horizontal bed. The milling machine with a 7.5 hp capacity is used
to perform the weld. The machine has a range of 50-1500 rpm tool rotation and 22-555
mm/min welding speed. The workpieces are kept on an anvil/backing plate of stainless
steel. All thermocouples are attached 20 mm away from the weld line to record the
temperature data. The schematic diagram of the experimental setup for recording
thermal profile is shown in Figure 3.19. Here, the tool moves to perform welding and
TH-1875_126103029
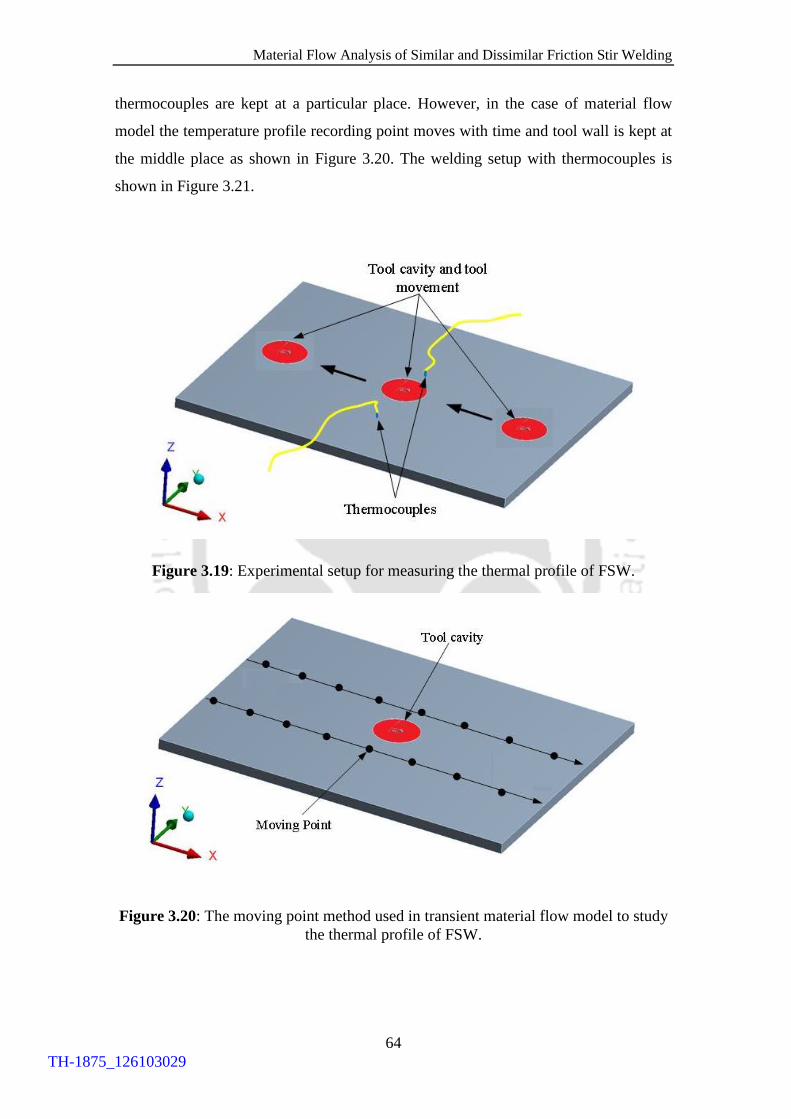
Material Flow Analysis of Similar and Dissimilar Friction Stir Welding
64
thermocouples are kept at a particular place. However, in the case of material flow
model the temperature profile recording point moves with time and tool wall is kept at
the middle place as shown in Figure 3.20. The welding setup with thermocouples is
shown in Figure 3.21.
Figure 3.19: Experimental setup for measuring the thermal profile of FSW.
Figure 3.20: The moving point method used in transient material flow model to study
the thermal profile of FSW.
TH-1875_126103029

Model Methodology
65
Figure 3.21: Experimental setup of the FSW performed.
Microstructural study
In FSW, the temperature of the process reaches upto 80-90% melting point
temperature of the base material. Therefore, the microstructure of the material changes
in the weld zone. The study of microstructure provides useful information regarding
the material flow from both sides of the weld plates. In case of dissimilar material
FSW, the microstructure study provides details about the dispersion one material into
other which eventually reveals the mixing phenomenon of the welding process. The
microstructure also helps in finding the defects in the welding joint. The procedure
adopted for studying the microstructure is shown in Figure 3.22.
Figure 3.22: Procedure for microstructure analysis.
The first step is the sectioning of the weld plate to obtain a sample. Then the specimen
is mounted in compression mounting compound (phenolic resin) in a hydraulically
operated press. The moulds are heated by a thermostatically controlled slip-on heater
and cooled by a finned slip-on cooler after reaching the curing temperature. Various
polishing papers starting from 240 grit size upto 2000 are used to polish the sample.
Polishing is performed by a single disc with five specimen holder automated polishing
TH-1875_126103029
Material Flow Analysis of Similar and Dissimilar Friction Stir Welding
66
machine. The specimen is rinsed with a continuous water supply. After grit polishing,
cloth polish using a metal polish (silvo for Aluminium; brasso for Copper samples) is
done. The polishing is performed with a slower disc rotation to obtain a scratchless
mirror-like finish. The polishing is followed by etching by Keller’s reagent. After
etching the sample is thoroughly examined using the optical microscope.
3.8 Summary
This chapter provides the details of methodologies used to reach the stated objectives
of the thesis. The chapter begins with the derivation of heat generation equations for
cylindrical and conical pin geometries. The heat generation equations are formulated
for frictional heat as well as plastic deformation heat. These equations are
implemented in a finite element 3D transient thermal model. The FE modelling details
are followed by the finite volume models which are used to analyze the material flow
behaviour of the material during the process. Different approaches are used to analyze
the similar material flow behaviour and dissimilar material flow behaviour of FSW
with suitable boundary conditions. The temperature dependent thermal material
properties are used in all the models. The mesh sensitivity analysis is carried out to
achieve the best possible solution. The last part of the chapter details the experimental
setup used for the validation of the model.
TH-1875_126103029

Chapter 4
Transient Thermal Analysis
4.1 Introduction
In this chapter, the finite element (FE) based model is used to study the transient
temperature distribution of AA6061 plates FSW. The heat source model is proposed
and the effect of process parameter on the temperature profile is studied. The
investigations are also conducted on the importance of sticking condition
implementation in the heat source. The shape of the contour along thickness is
analyzed to understand the significance of the base plate. The model proposed is well
verified with the experimentally obtained thermal profile.
4.2 Effect of rotational speed
For the study of the effect of rotational speed, a range of 1200-1600 rpm are taken with
2 mm/s welding speed and 27 mm shoulder diameter. Two points named as A and B is
considered for the study of temperatures. The point A is taken on the weld line and the
point B at a distance of 14 mm from the weld line (just outside the shoulder radius) as
shown in Figure 4.1. The maximum temperature at A and B is shown in Table 4.1 with
rotational speed. It is noted that the highest temperature is achieved in the case of
highest rotational speed. The temperature variation perpendicular to the weld line is
shown in Figure 4.2.
Table 4.1: Maximum Temperature vs. Rotational speed.
Rotational
Speed, ω
(rpm)
Max Temp
point A
(K)
Max Temp
point B
(K)
1200 673.3 598.7
1300 686.6 609.8
1400 698.9 620.1
1500 710.4 629.5
1600 721.2 638.2
TH-1875_126103029

Material Flow Analysis of Similar and Dissimilar Friction Stir Welding
68
Figure 4.1: Location of point A and B on the plate top surface.
0 20 40 60 80 100 120 140300
350
400
450
500
550
600
650
700
750
Tem
pera
ture
(K
)
Distance (mm)
1200rpm
1300rpm
1400rpm
1500rpm
1600rpm
Figure 4.2: Temperature variation at 2 mm/s tool traverse speed and 27 mm tool
shoulder diameter with rotational speed (t=50s).
TH-1875_126103029

Transient Thermal Analysis
69
0 20 40 60 80 100300
350
400
450
500
550
600
650
700
750
Te
mp
era
ture
(K
)
Time (s)
At point A
At point B
Figure 4.3: Transient temperature graph for 1400 rpm and 2 mm/s tool traverse speed.
Figure 4.4: Temperature profile for 1400 rpm rotational speed and 2 mm/s tool
traverse speed at 50s.
The temperature values attained in the weld line and at 14 mm away from the weld
line is shown in Figure 4.3. It shows the heating and cooling rate at the centre line and
away from the centre line. Whereas, the temperature contour of the 1400 rpm
TH-1875_126103029
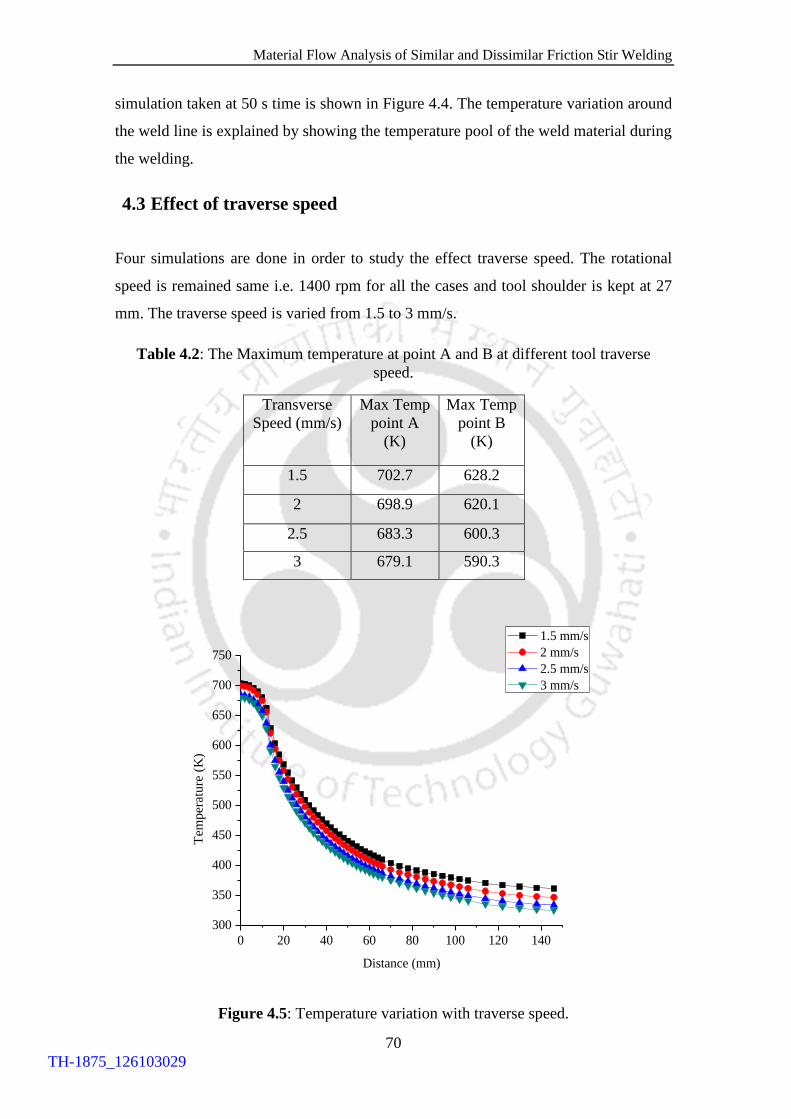
Material Flow Analysis of Similar and Dissimilar Friction Stir Welding
70
simulation taken at 50 s time is shown in Figure 4.4. The temperature variation around
the weld line is explained by showing the temperature pool of the weld material during
the welding.
4.3 Effect of traverse speed
Four simulations are done in order to study the effect traverse speed. The rotational
speed is remained same i.e. 1400 rpm for all the cases and tool shoulder is kept at 27
mm. The traverse speed is varied from 1.5 to 3 mm/s.
Table 4.2: The Maximum temperature at point A and B at different tool traverse
speed.
Transverse
Speed (mm/s)
Max Temp
point A
(K)
Max Temp
point B
(K)
1.5 702.7 628.2
2 698.9 620.1
2.5 683.3 600.3
3 679.1 590.3
0 20 40 60 80 100 120 140
300
350
400
450
500
550
600
650
700
750
Tem
per
ature
(K
)
Distance (mm)
1.5 mm/s
2 mm/s
2.5 mm/s
3 mm/s
Figure 4.5: Temperature variation with traverse speed.
TH-1875_126103029

Transient Thermal Analysis
71
The maximum temperature values at points A and B are noted and shown in Table 4.2.
Whereas, the temperature values with respect to the perpendicular distance from the
weld line is shown in Figure 4.5. It represents the maximum temperature attained at
the weld line with the cooling rate in the above cases.
4.4 Effect of tool diameter
For studying the tool diameter effect, the rotational speed of the tool is taken constant
at 1400 rpm and traverse speed is taken as 2 mm/s. The tool diameters are varied
between 21 to 30 mm. The temperature profiles for the different tool geometries are
shown in Figure 4.6.
0 20 40 60 80 100 120 140 160
300
350
400
450
500
550
600
650
700
750
Tem
pera
ture
(K
)
Distance (mm)
21 mm
24 mm
27mm
30mm
Figure 4.6: Temperature profiles for different shoulder diameter.
4.5 Results of sticking and sliding conditons
The temperature profiles of points A and B, with and without sticking conditions are
explained in Figure 4.7.
TH-1875_126103029

Material Flow Analysis of Similar and Dissimilar Friction Stir Welding
72
0 20 40 60 80 100
300
400
500
600
700
800
900
1000
Tem
per
ature
(K
)
Time (s)
A(only sliding)
A(sticking and sliding)
(a)
0 20 40 60 80 100
300
350
400
450
500
550
600
650
700
750
800
850
900
Tem
per
ature
(K
)
Time (s)
B(only sliding)
B(sticking and sliding)
(b)
Figure 4.7: Temperature variation at (a) point A and (b) point B.
The maximum welding temperature is very high when only sliding condition is
considered. It is found to be much higher than the melting point temperature of the
material i.e. 923 K. But the maximum temperature attained with sticking and sliding
TH-1875_126103029

Transient Thermal Analysis
73
condition remains well under the limits. The analysis is done at 1400 rpm rotational
speed, 2 mm/s welding or traverse speed for a 27 mm tool diameter. The maximum
welding temperature value in case of the complete sliding condition is 1020 K
however; the value for combined sticking and sliding condition is 723 K on the weld
line. The value obtained in the case of combined sticking and sliding condition is more
feasible. So, it is necessary to involve the sticking condition along with the sliding into
the heat source computation. The temperature obtained by the implementation of both
the condition is more reasonable and close to the real one.
4.6 Temperature distribution along the thickness
It is observed that there are temperature differences at the top and the bottom surface
of the weld plate. This difference in top and bottom surface is found higher at centre
line but it gradually decreases on moving away from the centre line or weld line. This
difference in temperature is studied at A and B is shown in Figure 4.8. The parameters
used in this study are 1500 rpm tool rotational speed, 2 mm/s welding speed and 27
mm tool shoulder diameter.
0 20 40 60 80 100
300
350
400
450
500
550
600
650
700
750
Tem
per
ature
(K
)
Time (s)
A (Top Surface)
A (Bottom Surface)
B (Top Surface)
B (Bottom Surface)
Figure 4.8: Top and Bottom surface temperature at A and B points.
TH-1875_126103029
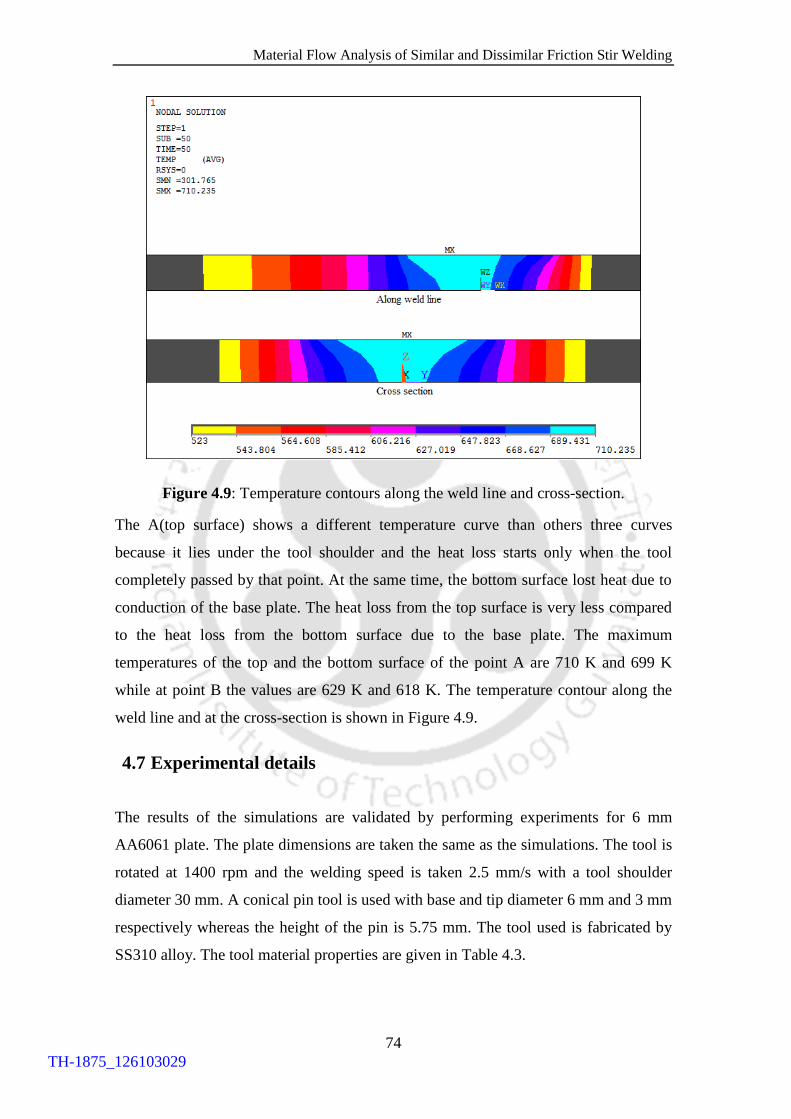
Material Flow Analysis of Similar and Dissimilar Friction Stir Welding
74
Figure 4.9: Temperature contours along the weld line and cross-section.
The A(top surface) shows a different temperature curve than others three curves
because it lies under the tool shoulder and the heat loss starts only when the tool
completely passed by that point. At the same time, the bottom surface lost heat due to
conduction of the base plate. The heat loss from the top surface is very less compared
to the heat loss from the bottom surface due to the base plate. The maximum
temperatures of the top and the bottom surface of the point A are 710 K and 699 K
while at point B the values are 629 K and 618 K. The temperature contour along the
weld line and at the cross-section is shown in Figure 4.9.
4.7 Experimental details
The results of the simulations are validated by performing experiments for 6 mm
AA6061 plate. The plate dimensions are taken the same as the simulations. The tool is
rotated at 1400 rpm and the welding speed is taken 2.5 mm/s with a tool shoulder
diameter 30 mm. A conical pin tool is used with base and tip diameter 6 mm and 3 mm
respectively whereas the height of the pin is 5.75 mm. The tool used is fabricated by
SS310 alloy. The tool material properties are given in Table 4.3.
TH-1875_126103029

Transient Thermal Analysis
75
Table 4.3: Physical properties of SS310.
Property Value
Hardness, Brinell 160
Tensile strength, ultimate (MPa) 655
Tensile strength, yield (MPa) 275
Thermal conductivity at 100 ºC (W/m
2 K) 14.2
The K-type thermocouples are used to obtain the thermal profile data with a data
acquisition system. Two thermocouples are applied at a distance of 20 mm from the
centre line. The thermocouple employed at the centre of the plate is taken to validate
the simulation results are shown in Figure 4.10. The peak temperature obtained in the
experiment is 576 K while in simulation it is 582 K. The maximum variation obtained
5.53 % between the experimental profile and the simulation profile.
0 20 40 60 80
300
350
400
450
500
550
600
650
Tem
pera
ture
(K
)
Time (s)
Simulation
Experiment
Figure 4.10: Comparison between numerical and experimental results.
4.8 Summary
In this chapter, the thermal transient analysis is performed and effect of rotational
speed, traverse speed and tool shoulder diameter has been studied. It is found that the
TH-1875_126103029

Material Flow Analysis of Similar and Dissimilar Friction Stir Welding
76
peak temperature rise with tool rotational speed and tool shoulder diameter, however,
it decreases with tool traverse speed. The significance of combined sticking and sliding
heat generation is also studied in this chapter. It is found that the dominance of
sticking heat generation increases at high tool rotation and traverse speed. The current
analysis provides similar temperature distribution on both advancing and retreating
side. So for validation, only advancing side temperature profile is taken from the
experiments. In the next chapter, different laminar and turbulent material flow models
are studied in ANSYS Fluent 14.0 and validated using the experiments.
TH-1875_126103029

Chapter 5
Material Flow Behaviour
5.1 Introduction
In the former chapter, the thermal aspect of FSW was studied. The effect of tool
rotational, traverse speed and shoulder size was studied on the welding temperature
profile of the plate. The significance of the sticking condition was realized in the
conducted study. In this study a threaded tool is considered for the analysis and the
material used is AA6061. The simulation has been carried out with appropriate
boundary conditions. Moreover, thermal analysis has also been carried out along with
the material flow. The analysis presented in this chapter shows the importance of
material properties with three laminar models and one turbulent model. Temperature-
dependent material properties are implemented to obtain the results of simulation
which is carried out in ANSYS Fluent 14.0. In order to justify the approximations and
boundary conditions employed in simulation, experimental validation of the same has
also been carried out.
5.2 Modelling details
In this work, the finite volume model is employed for simulating the material flow
behaviour of the FSW process. The tool geometry taken for the analysis is a conical
threaded pin with a flat shoulder. The threaded geometry is taken in order to study the
detailed material movement in the nugget zone. The threaded tool geometry provides
better understanding and comparison of the material flow formed in different models.
The plate material used for the analysis is Aluminium alloy 6061. The dimensions of
the plate are 200 mm long, 150 mm wide and 6 mm thick i.e. 200 × 150 × 6 mm. A 25
mm diameter tool shoulder has been used in this study as shown in Figure 5.1 (a). The
base diameter of the conical threaded pin is 6 mm and the tip diameter is 3 mm. The
length of the pin is 5.75 mm having threads with pitch of 1.5 mm. The tool is
incorporated into the model as a wall with 0.1 mm depression in the weld plate due to
the plunging force during the welding. The weld plate is meshed using tetrahedral
TH-1875_126103029

Material Flow Analysis of Similar and Dissimilar Friction Stir Welding
78
elements. The mesh is refined near the tool pin region which is shown in Figure 5.1
(b). The analysis is performed using this model in ANSYS Fluent 14.0.
(a)
(b)
Figure 5.1: (a) The model of the tool and (b) the meshing and the tool impression in
the plate.
TH-1875_126103029

Material Flow Behaviour
79
5.3 Results and discussion
For the convenience of understanding, five planes have been considered to show the
results as depicted in Figure 5.2. The planes 1, 2 and 3 are considered to lie at 0.2 mm,
3 mm and 5.9 mm from the top surface, respectively which are parallel to the top
surface. The planes 4 and 5 are taken at the mid-section of the weld plate which is at
weld line.
Figure 5.2: Planes location used for analyzing the material flow in the study.
For the initial analysis, the constant material properties have been taken. The specific
heat is considered to be around 80% of the melting point temperature which is taken as
1100 J/kg-K. In the same way, the thermal conductivity and the viscosity of the
material are considered 220 W/m-K and 1.3 kg/m-s, respectively. The material flow is
assumed as laminar and therefore, the model used in the analysis is a laminar model.
At the tool surface, the maximum velocity attained is 1.76 m/s while the maximum
velocity at the outer edge of the tool is 1.46 m/s. Figure 5.3 shows the top and front
view of the material movement around the tool geometry i.e., plane 1 and 5. The
Figure 5.3 (a) doesn’t include the tool wall which only shows the workpiece material
around the tool. The maximum velocity obtained in the material is 1.46 m/s towards
the outer edge of the tool and on the top surface of the material. The Figure 5.3 (b) also
shows that a swirl is formed by the movement of the material around the threaded tool
pin.
TH-1875_126103029

Material Flow Analysis of Similar and Dissimilar Friction Stir Welding
80
(a)
(b)
Figure 5.3: (a) Top view of the velocity vector and (b) cross-sectional view at the
central axis of the tool.
TH-1875_126103029

Material Flow Behaviour
81
The advancing side has this swirl on the top while on the retreating side the swirl is at
the bottom end of the material. The swirls movement has very low velocity as
compared to the material adjacent to the wall of the tool.
For further analysis, temperature dependent thermal material properties are considered.
Consequently, the specific heat and the thermal conductivity are implemented as a
function of temperature. The dependency of these thermal properties on temperature is
earlier defined in section 3.5.4. Therefore, the Eqs. (3.69) and (3.70) are employed in
the analysis. Moreover, the viscosity of the material is again taken as constant (1.3
kg/m-s) for this analysis. It is to note that the temperature dependent properties do not
affect the material flow significantly. A similar type of vector plot is obtained for the
velocities with a difference in thermal aspect and the temperature distribution in the
material. The difference between the two approaches is shown in Figure 5.4 by thermal
history of both the cases.
Figure 5.4a: Temperature profile with constant properties
TH-1875_126103029

Material Flow Analysis of Similar and Dissimilar Friction Stir Welding
82
Figure 5.4b: Temperature profile with temperature dependent properties.
The peak temperature obtained with constant material properties is 753 K whereas in
temperature-dependent case it is observed to be 773 K. From the above Figure 5.4 (a)
and (b) it is observed that during the initial analysis, a lower temperature gradient is
obtained in the case of constant material properties. On the other hand, with
temperature dependent thermal material properties the temperature contours are more
concentrated. The latter case resembles the realistic phenomenon much closely.
For further analysis, all temperature dependent thermal material properties along with
viscosity are implemented with the help of a user defined functions (UDF) based on
Zener-Hollomon equation given by Eqs. (3.71) and (3.72). The vector profile obtained
in this case is different from the previously discussed cases. Since the viscosity is
lower at higher temperatures, the regions with higher temperatures show maximum
velocity. A maximum velocity of 0.392 m/s is obtained near the pin. The vector plot
for this analysis is shown in Figure 5.5.
TH-1875_126103029

Material Flow Behaviour
83
(a)
(b)
Figure 5.5: Velocity vectors plots at (a) plane 1 and (b) plane 5 showing top and
cross-sectional view.
TH-1875_126103029

Material Flow Analysis of Similar and Dissimilar Friction Stir Welding
84
(a)
(b)
Figure 5.6: Temperature contour at (a) plane 1 and (b) plane 5.
The maximum temperature obtained in this case increases to 792 K which is 2.5%
higher than the previous case. The heat is more concentrated in this analysis as
TH-1875_126103029

Material Flow Behaviour
85
compared to previous ones. The temperature profile for the same is shown in Figure
5.6. In addition to that, heat generation is more towards the advancing side as
compared to the retarding side.
The velocity vector plots at three sections of the material have been shown in Figure
5.7. The three sections are parallel to the top surface at a distance of 0.2 mm, 3 mm
and 5.9 mm, respectively. The velocity drastically changes as observed from top to
bottom. The first plane is quite near to the tool surface and therefore the material
velocity is very high. The second plane lies in the middle of the material. Hence, the
material velocity near the pin wall is high and gradually decreases away from the weld
line. And the third plane is in between the tool tip and the bottom surface. The material
deformation is significantly less in this plane.
Figure 5.7: Vector plots at (a) 0.2 mm from the top surface (plane 1), (b) 3 mm
from the top surface (plane 2) and (c) 5.9 mm from the top surface (plane 3).
TH-1875_126103029

Material Flow Analysis of Similar and Dissimilar Friction Stir Welding
86
(a)
(b)
Figure 5.8: (a) Top view of the velocity vector and (b) mid-section view of the
velocity vector using the turbulent model.
TH-1875_126103029
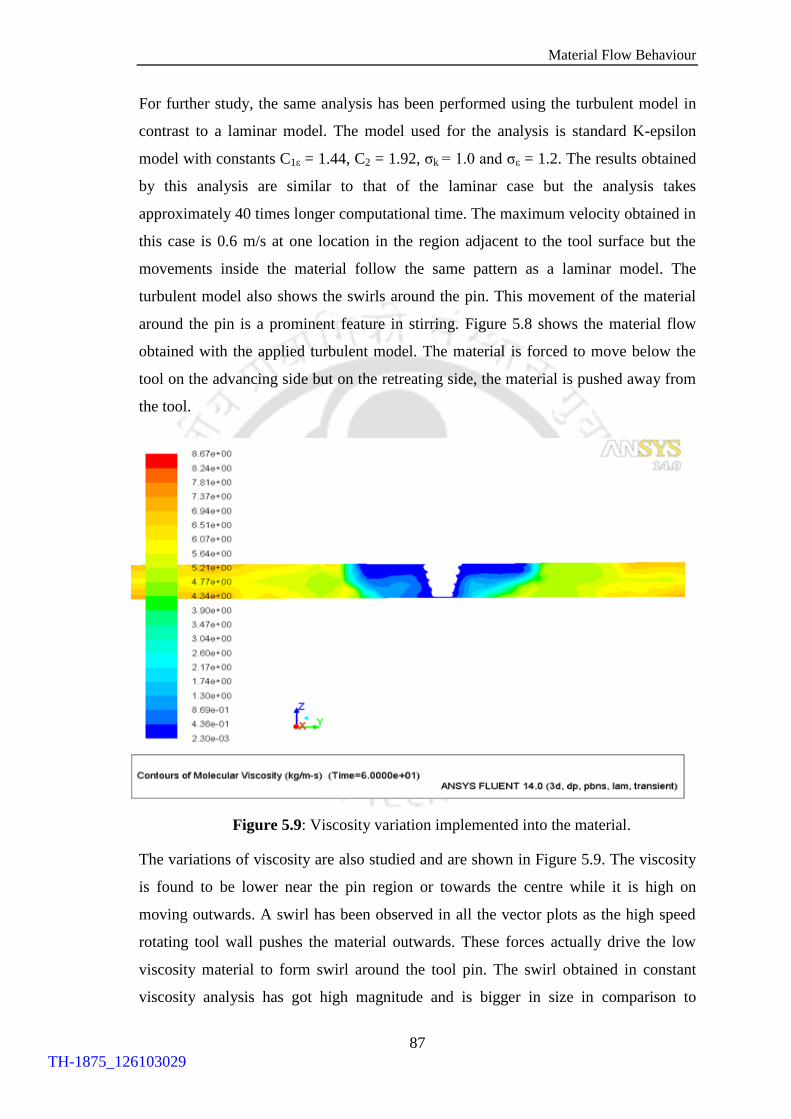
Material Flow Behaviour
87
For further study, the same analysis has been performed using the turbulent model in
contrast to a laminar model. The model used for the analysis is standard K-epsilon
model with constants C1ε = 1.44, C2 = 1.92, σk = 1.0 and σε = 1.2. The results obtained
by this analysis are similar to that of the laminar case but the analysis takes
approximately 40 times longer computational time. The maximum velocity obtained in
this case is 0.6 m/s at one location in the region adjacent to the tool surface but the
movements inside the material follow the same pattern as a laminar model. The
turbulent model also shows the swirls around the pin. This movement of the material
around the pin is a prominent feature in stirring. Figure 5.8 shows the material flow
obtained with the applied turbulent model. The material is forced to move below the
tool on the advancing side but on the retreating side, the material is pushed away from
the tool.
Figure 5.9: Viscosity variation implemented into the material.
The variations of viscosity are also studied and are shown in Figure 5.9. The viscosity
is found to be lower near the pin region or towards the centre while it is high on
moving outwards. A swirl has been observed in all the vector plots as the high speed
rotating tool wall pushes the material outwards. These forces actually drive the low
viscosity material to form swirl around the tool pin. The swirl obtained in constant
viscosity analysis has got high magnitude and is bigger in size in comparison to
TH-1875_126103029
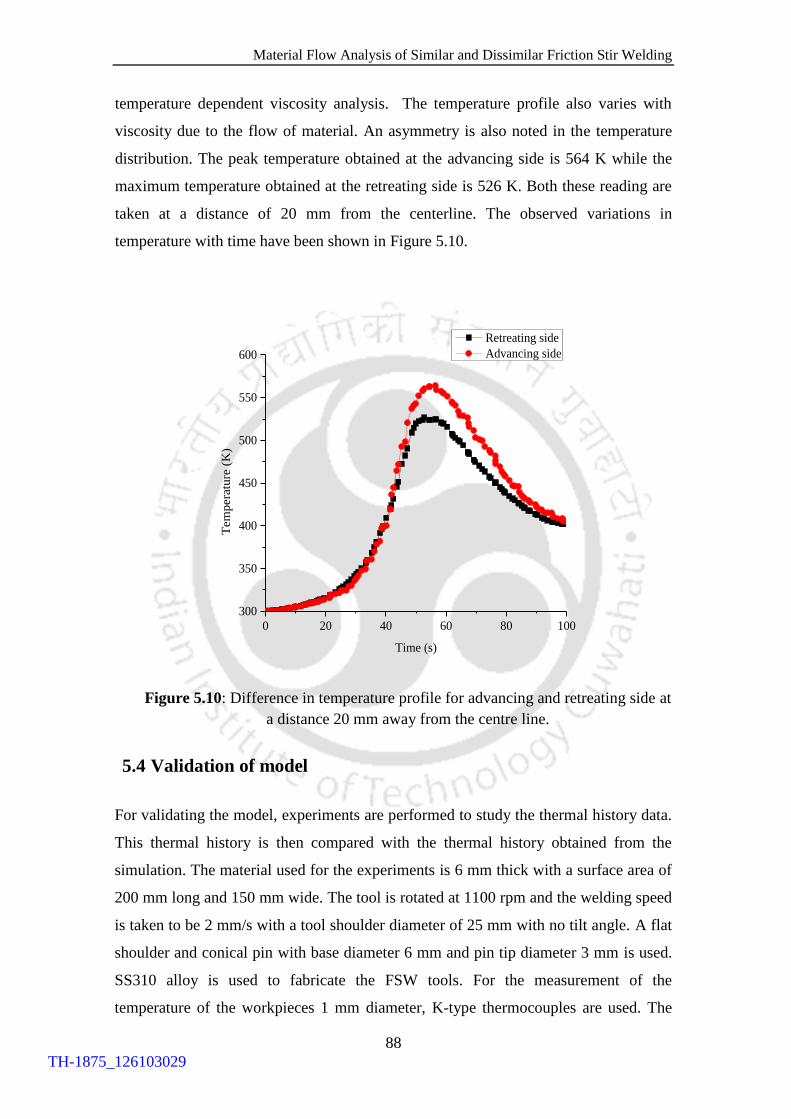
Material Flow Analysis of Similar and Dissimilar Friction Stir Welding
88
temperature dependent viscosity analysis. The temperature profile also varies with
viscosity due to the flow of material. An asymmetry is also noted in the temperature
distribution. The peak temperature obtained at the advancing side is 564 K while the
maximum temperature obtained at the retreating side is 526 K. Both these reading are
taken at a distance of 20 mm from the centerline. The observed variations in
temperature with time have been shown in Figure 5.10.
0 20 40 60 80 100
300
350
400
450
500
550
600
Tem
pera
ture
(K
)
Time (s)
Retreating side
Advancing side
Figure 5.10: Difference in temperature profile for advancing and retreating side at
a distance 20 mm away from the centre line.
5.4 Validation of model
For validating the model, experiments are performed to study the thermal history data.
This thermal history is then compared with the thermal history obtained from the
simulation. The material used for the experiments is 6 mm thick with a surface area of
200 mm long and 150 mm wide. The tool is rotated at 1100 rpm and the welding speed
is taken to be 2 mm/s with a tool shoulder diameter of 25 mm with no tilt angle. A flat
shoulder and conical pin with base diameter 6 mm and pin tip diameter 3 mm is used.
SS310 alloy is used to fabricate the FSW tools. For the measurement of the
temperature of the workpieces 1 mm diameter, K-type thermocouples are used. The
TH-1875_126103029

Material Flow Behaviour
89
thermocouples are connected to the data acquisition system (Agilent-34970A) to
record the temperature data. Two thermocouples are employed on both sides of the
plate at the centre of the weld. A square butt welding with zero root gap is clamped
into the horizontal bed. The milling machine with 7.5 hp capacity is used to perform
the square plate butt joining of FSW shown in Chapter 3.
The experimental and simulation thermal profile at a distance 20 mm away from the
weld line on the advancing and retreating side is shown in Figure 5.11. The peak
temperature obtained in experimental study is 601 K while in case of numerical
simulation it is 586 K on the advancing side. However, the maximum temperature
obtained by the thermocouple is 558 K whereas, the 550 K is the maximum
temperature obtained in the simulation on the retarding side. The temperature
difference is observed in the experimental and computed readings, due to the
assumptions made in the analysis. The environment temperature in the analysis is
assumed to be 300 K in the simulation but during the experiment, it may get varied.
(a) (b)
Figure 5.11: Experiment and Numerical thermal profile comparison of a conical pin
tool (a) advancing side and (b) retreating side at 1100 rpm and 2 mm/s welding speed.
5.5 Summary
In this chapter, different laminar and turbulent material flow models are proposed
considering constant and temperature dependent thermal material properties. The
TH-1875_126103029

Material Flow Analysis of Similar and Dissimilar Friction Stir Welding
90
comparison of different models is shown in terms of temperature and velocity vector
contours. The fastest and most accurate results are obtained from the laminar model
with all temperature dependent thermal material properties. The proposed model also
provides an accurate thermal profile on both advancing and retreating side. The
material flow models provide the information about the way in which the material
transports under a high rotating tool in FSW. The velocity vortex is noted on both the
side of the welding. The most accurate model is used for further analysis of the
influence of tool pin geometry and effect of the process parameter on material flow in
the next chapter.
TH-1875_126103029
Chapter 6
Material Flow Behaviour for Different Pin Profiles
6.1 Introduction
In the last chapter, different material flow models were proposed for the study of
material movement around the pin. The laminar flow model with temperature
dependent material properties was the most efficient among the proposed ones, in
terms of computational time and experimental matching. So, the same model is used
for the further study to analyze the significance of tool geometry. Since every tool
moves the material in a different manner so the knowledge of tool geometry effect on
the material flow is inevitable. In the current study, seven different types of tool
geometries are chosen and their effects on material flow are studied on deformation
zone. The appropriate boundary conditions are used in the simulations to meet the real
conditions. The analysis is performed on AA6061 in ANSYS Fluent 14.5. Based on
that, the thermal temperature distributions, vector plots and the effect of rotation
directions of a threaded tool are also studied.
6.2 Modelling details
In this work, Aluminium alloy 6061 plates are used to perform a finite volume model
simulation of a butt joint FSW. Different tool geometries are used to weld 200 mm
long, 150 mm wide and 6 mm thick plates. Tool shoulder size and pin length are kept
constant for all cases i.e. 25 mm shoulder diameter and pin length 5.75 mm. The
different pin geometries used in the current analysis is shown in Figure 6.1. The tools
are implemented in the form of wall into the material plates that are meshed using the
tetrahedral elements with a coarse mesh which are further refined near the tool region
as shown in Figure 6.2. The minimum edge length of the element is taken as 0.3 mm in
the tool region.
TH-1875_126103029

Material Flow Analysis of Similar and Dissimilar Friction Stir Welding
92
Figure 6.1: Different types of pin profiles used in the analysis.
Figure 6.2: An oblique view of the mesh type used for the analysis where the finer
tetrahedral elements are used in the tool wall region to capture more information under
the tool.
TH-1875_126103029
Material flow Behaviour for Different Pin Profiles
93
6.3 Results and discussion
The thermal-flow coupled models are used in the current analysis. Seven different
tool geometries are considered to find out the effect of tool pin profile on the material
flow during the welding. The temperature distribution is achieved by the thermal
analysis on the workpieces while the material movements inside the plate are
provided by the flow analysis. In the current study, the same process parameters are
given in each analysis to achieve a better comparison among all the cases. The
welding is performed along X-direction and the advancing side (AS) and retreating
side (RS) is on the positive and negative Y-directions respectively. The tool rotation
axis is considered as origin with depth of the plate is taken along negative Z-direction
as explained in section 3.5.1. All tool geometries are rotated with 1100 rpm and 2
mm/s tool travelling speed.
It is observed that AS has higher temperature than the RS. The peak temperature is
obtained on AS which is 35-40 K higher than the RS. The highest peak temperature is
obtained from the cylindrical pin geometry while the lowest peak temperature from
the conical pin geometry. The peak temperature values are given in Table 6.1.
Table 6.1: The peak temperature obtained during the analysis.
Tool pin profile Peak
Temperature
(K)
Conical 779
Conical
Threaded 801
Cylindrical 893
Square 830
Trigonal with
Curvature 828
Trigonal 794
Conical with
Grooves 801
The temperature variation on moving away from the weld line for all seven geometries
is shown in Figure 6.3. The temperature variation at a distance 20 mm away from the
weld line is shown in Figure 6.4.
TH-1875_126103029

Material Flow Analysis of Similar and Dissimilar Friction Stir Welding
94
Figure 6.3: The temperature variations at 0.1 mm above the bottom surface of the
plate for all cases on AS and RS. The Figure is showing the temperature drop on
moving away from the weld zone where the positive and negative values of Y
represent the AS and RS respectively.
Figure 6.4: Temperature variations with time for all the geometries at 20 mm away
from the centre line on (a) advancing side and (b) retarding side.
TH-1875_126103029

Material flow Behaviour for Different Pin Profiles
95
The temperature data obtained at a distance 20 mm away (AS and RS) from the weld
line do not show any significant differences in all the cases as evident from Figure
6.4. The temperature values obtained in this case are extremely close to each other for
all tool pin profiles. The temperature values are obtained at the points taken on the top
surface of the weld plate over the mid-section of the plate on either side of the weld
line. The velocity vector plot on the tool surface is shown in Figure 6.5.
Figure 6.5: The velocity vector plot of the tool wall for conical threaded pin geometry
(a) top view and (b) inclined view.
Though the tool shoulder and the pin, both affect the material flow, the material
movements influenced by the pin is studied the current analysis and hence, the tool
shoulder geometries are taken to be constant for all the cases. The vector plot on the
tool shoulder surface of conical threaded pin geometry is shown in Figure 6.5 (b). The
material movement caused by the tool shoulder is the same in all the cases which are
shown in Figure 6.5 (a).
TH-1875_126103029
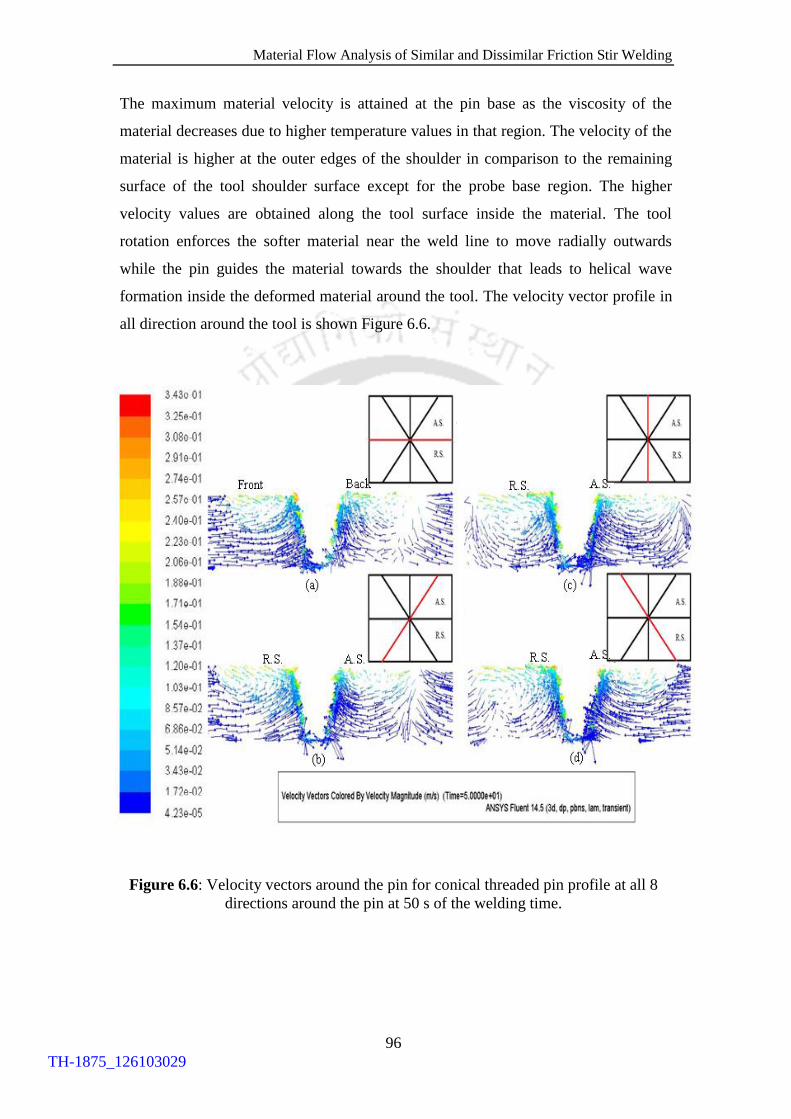
Material Flow Analysis of Similar and Dissimilar Friction Stir Welding
96
The maximum material velocity is attained at the pin base as the viscosity of the
material decreases due to higher temperature values in that region. The velocity of the
material is higher at the outer edges of the shoulder in comparison to the remaining
surface of the tool shoulder surface except for the probe base region. The higher
velocity values are obtained along the tool surface inside the material. The tool
rotation enforces the softer material near the weld line to move radially outwards
while the pin guides the material towards the shoulder that leads to helical wave
formation inside the deformed material around the tool. The velocity vector profile in
all direction around the tool is shown Figure 6.6.
Figure 6.6: Velocity vectors around the pin for conical threaded pin profile at all 8
directions around the pin at 50 s of the welding time.
TH-1875_126103029
Material flow Behaviour for Different Pin Profiles
97
It is observed that the shoulder controls the lateral movement (i.e. along X and Y
direction) whereas pin deals with the upward and downward movements (along Z
direction) of the material as evident from Figure 6.6 (a). On moving away from the
weld line, the deformation zone decreases and diminishes over the edge of the
shoulder. The material deformation zone is small because of the higher viscosity of
the material in that region due to the lower temperature values. The deformed material
circulates on the front side of the tool as the shoulder rebound the soft material back
in –X direction. Whereas, the back side of the tool has more deformation as viscosity
of the material is much lower due to high temperature. The front side of the tool is the
unwelded portion while the back side is the welded one. The deformation under the
tool shoulder increases in the RS as the viewing plane is rotated by 45° in
anticlockwise direction as shown in (b). The vector plot perpendicular to the weld line
is shown by (c) and the vector plot at an angle 135° anticlockwise to the weld line is
shown by (d). More deformation zone is found on RS in comparison to the AS which
is influenced by the tool movement and the welding direction. The material on the AS
flows in –X direction whereas the material movement direction is +X on the RS. The
shape and size of the pin of different tool geometries cause the material to behave
differently. The material movement along thickness (along Z direction) for all tool pin
geometries is shown in Figure 6.7.
The material movement caused on front and the back side of the tool by all pin
geometries along the weld line are shown here. Some similarities are found in the
vector plot with the geometries with round pin i.e. in case of (a, b, c, e and g) on the
front side of the tool. However, the pin geometries with flat surfaces are acted in a
different manner i.e. (d and f). The round pin geometries push the material upward
and thus help the soft material to form a circulating movement under the tool
shoulder. Whereas, the flat pin geometries has reversed the material flow direction
and do not support any circulated movement of the soft material. The flat surface of
the tool pin geometry cause material accumulation which may lead to higher force
generation on the tool. Whereas, the round pin geometries support the movement
caused by the shoulder and hence lead to a smoother flow of the material.
TH-1875_126103029

Material Flow Analysis of Similar and Dissimilar Friction Stir Welding
98
Figure 6.7: The vector plots showing the material movement under the tool shoulder
on front and back sides (along X direction) of the tool.
The maximum and minimum velocities in a plane perpendicular to the weld line for
all three directions are given in Table 6.2. It is seen that the maximum and minimum
X velocity i.e velocity along the weld line do not change with the pin profile but the
distribution pattern of velocities, changes with the pin profiles as shown in Figure 6.8.
The material movement towards the pin and the shoulder is affected by the pin profile
i.e. along the thickness (Z direction) as evident from the Figures 6.9 and 6.10.
TH-1875_126103029

Material flow Behaviour for Different Pin Profiles
99
Table 6.2: Maximum and minimum velocities perpendicular to weld line.
Tool Pin Profiles
Plane perpendicular to welding direction
Vx (m/s) Vy (m/s) Vz (m/s)
Minimum Maximum Minimum Maximum Minimum Maximum
Conical -1.416 1.415 -0.032 0.028 -0.012 0.023
Conical Threaded -1.396 1.383 -0.044 0.048 -0.008 0.031
Cylindrical -1.423 1.398 -0.032 0.026 -0.011 0.030
Square -1.407 1.405 -0.037 0.036 -0.009 0.022
Trigonal Curved -1.415 1.415 -0.029 0.033 -0.011 0.019
Trigonal -1.426 1.415 -0.038 0.030 -0.014 0.012
Conical with
grooves -1.428 1.426 -0.058 0.063 -0.004 0.076
The threaded tool provides more deformation area in the AS in comparison to the
plane conical profile as evident from the velocity profile contours shown in Figure 6.8
(a, b). The material movement is faster in case of threaded pin profile while the
mechanically affected areas for both the threaded and plane pin profiles (a, b) are
same. However, the lateral material movement for the plane conical profile is much
lower than the threaded pin profile shown in Figure 6.9 (a, b). The velocities values
obtained for upward and downward movement caused by the threaded pin are higher
than the plane conical pin and are much nearer to the pin boundary as shown in Figure
6.10 (a, b). The maximum upward velocity magnitude (i.e. Vz) is obtained in the pitch
region of the threaded pin geometry.
TH-1875_126103029
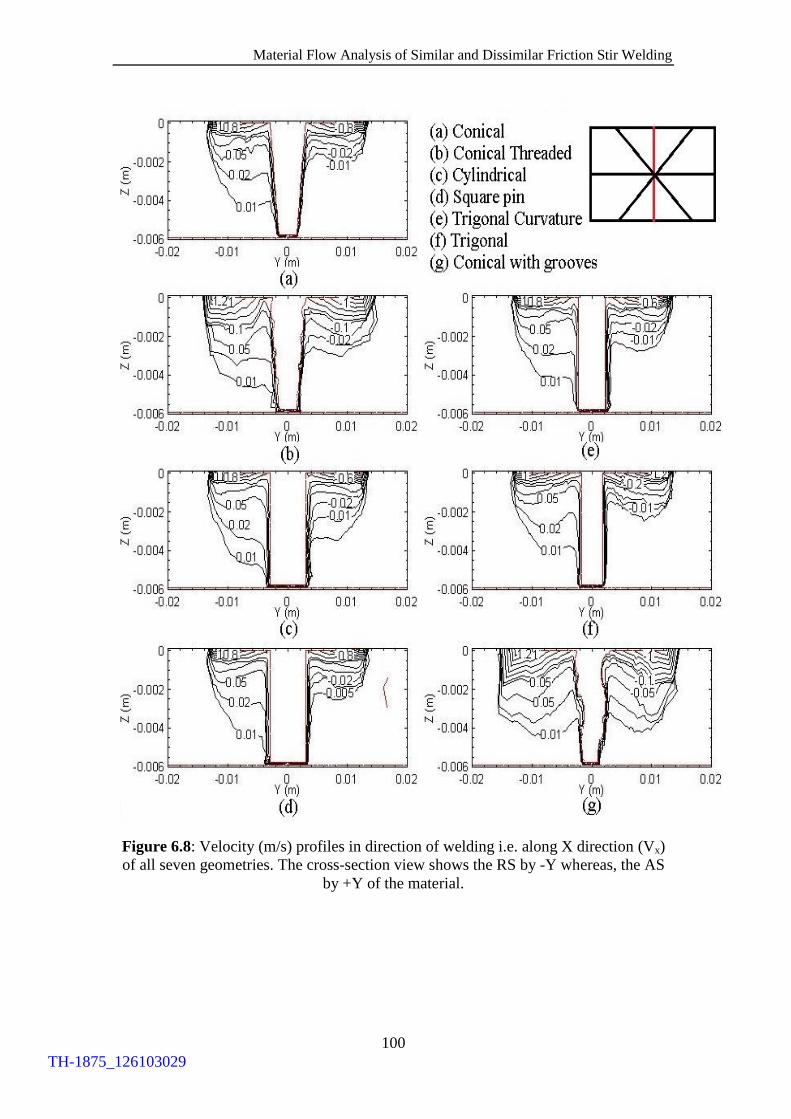
Material Flow Analysis of Similar and Dissimilar Friction Stir Welding
100
Figure 6.8: Velocity (m/s) profiles in direction of welding i.e. along X direction (Vx)
of all seven geometries. The cross-section view shows the RS by -Y whereas, the AS
by +Y of the material.
TH-1875_126103029

Material flow Behaviour for Different Pin Profiles
101
Figure 6.9: Velocity (m/s) profiles of the material movement towards and away from
the pin i.e. Y direction velocity component (Vy) for all seven geometries.
TH-1875_126103029

Material Flow Analysis of Similar and Dissimilar Friction Stir Welding
102
Figure 6.10: Velocity (m/s) profiles for upward and downward material movement
along the height pin probe i.e. Z-direction velocity component (Vz) of all seven
geometries.
Among the all pin profiles the maximum lateral (Vy) and upside material velocity
magnitude (Vz) are provided by the conical with grooves pin profile, which is much
higher than the other pin profiles as the viscosity of the material is low inside the
groove region due to higher strain and temperature.
TH-1875_126103029
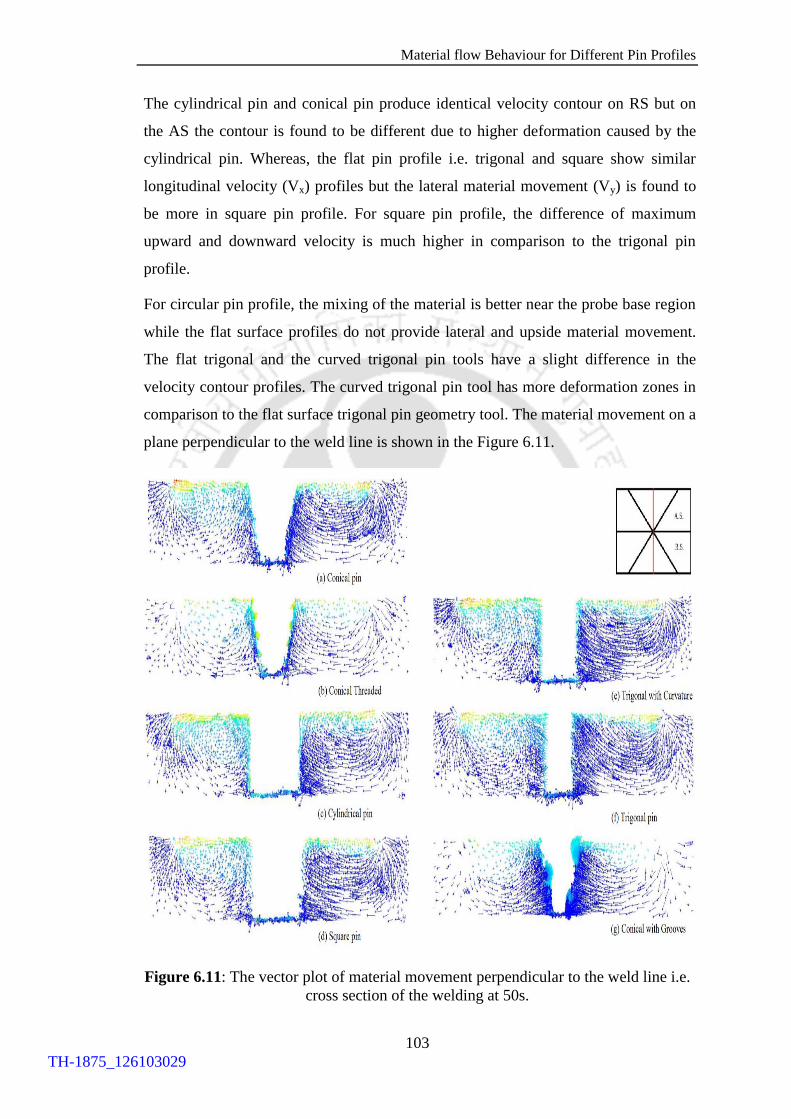
Material flow Behaviour for Different Pin Profiles
103
The cylindrical pin and conical pin produce identical velocity contour on RS but on
the AS the contour is found to be different due to higher deformation caused by the
cylindrical pin. Whereas, the flat pin profile i.e. trigonal and square show similar
longitudinal velocity (Vx) profiles but the lateral material movement (Vy) is found to
be more in square pin profile. For square pin profile, the difference of maximum
upward and downward velocity is much higher in comparison to the trigonal pin
profile.
For circular pin profile, the mixing of the material is better near the probe base region
while the flat surface profiles do not provide lateral and upside material movement.
The flat trigonal and the curved trigonal pin tools have a slight difference in the
velocity contour profiles. The curved trigonal pin tool has more deformation zones in
comparison to the flat surface trigonal pin geometry tool. The material movement on a
plane perpendicular to the weld line is shown in the Figure 6.11.
Figure 6.11: The vector plot of material movement perpendicular to the weld line i.e.
cross section of the welding at 50s.
TH-1875_126103029

Material Flow Analysis of Similar and Dissimilar Friction Stir Welding
104
The vortex formed by the helical movement of the material is observed on the RS in
all the cases but the vortex has different origins for different tool geometries. The
vortex form by the conical pin i.e. in Figure 6.11 (a) is just under the extreme edge of
the tool shoulder but in case of conical threaded pin i.e. in Figure 6.11 (b), the vortex
is closer to pin and well below the tool shoulder surface. However, on the AS, there is
no significant difference found in the deformation region in all the cases. In context of
total deformation, the maximum deformation zone is formed by the cylindrical pin
geometry i.e. in Figure 6.11 (c) while the lowest deformation zone is formed by
conical with grooves which are observed in Figure 6.11 (g). In case of threaded tool
geometries, it is observed that the maximum material movement took place around
the pin only and the pitch of the tool pin is acted as channels for the material
movements and thus the major material movement or the deformation takes place in
the thread pitch of the pin. In such cases, a better material mixing is obtained near the
weld line. The stream contour of the material flow of conical pin geometry at plane 2
is shown in Figure 6.12.
Figure 6.12: Stream traces of conical pin geometry showing the flow separation region
on the advancing side of the weld.
The flow separation region is shown in box situated on the advancing side just at the
edge of the tool shoulder as shown in Figure 6.12. This region has the maximum
probability of defect formation in the welding. For all the tool geometry it lies on the
advancing side of the welding.
TH-1875_126103029

Material flow Behaviour for Different Pin Profiles
105
Figure 6.13: Temperature distribution of conical threaded pin profile tool for (a) anti-
clockwise and (b) clockwise tool rotation.
In unthreaded tool geometries, it is observed if the tool rotation direction is changed
i.e. from clockwise to anticlockwise, the RS becomes AS and vice-versa. In such
cases, no significant change in temperature and velocity vector distribution is
observed. In threaded tool geometries also, similar trends are observed with small
variations in temperature distribution as well as in the vector plot. The temperature
distribution on a plane perpendicular to the weld line is shown in Figure 6.13 while
the velocity vector distribution is shown in Figure 6.14 on the same plane.
TH-1875_126103029

Material Flow Analysis of Similar and Dissimilar Friction Stir Welding
106
Figure 6.14: Velocity vector plot conical threaded pin profile tool for (a) anti-
clockwise and (b) clockwise tool rotation.
The temperature dependent viscosity is considered in all the cases. The viscosity
distribution is found to have small variations in each case depending on the
temperature and strain rate distribution. The viscosity variation in a plane
TH-1875_126103029

Material flow Behaviour for Different Pin Profiles
107
perpendicular to the weld line of the conical pin with grooves geometry is shown in
Figure 6.15. The viscosity is found to be very low near the pin region and the
viscosity increases on moving away from the pin region. Due to this fact, the material
deformation is found more near the pin region and very less away from the pin.
Figure 6.15: A cross-section view of the FSW showing viscosity distribution for a
conical with grooves pin profile geometry.
6.3.1 Effect of rotational speed on material flow
In order to analyze the influence of any parameter on material flow, various sections of
the weld plates are observed. The tool traverse speed is taken constant as 2 mm/s and
the rotational speed is varied as 900 rpm, 1100 rpm and 1300 rpm. The vector plot on a
plane 3 mm below the top surface of the material is shown in Figure 6.16.
TH-1875_126103029

Material Flow Analysis of Similar and Dissimilar Friction Stir Welding
108
Figure 6.16 (a)
Figure 6.16 (b)
TH-1875_126103029

Material flow Behaviour for Different Pin Profiles
109
(c)
Figure 6.16: Vector plot variation at (a) 900 rpm, (b) 1100 rpm and (c) 1300 rpm with
2 mm/s welding speed on plane 2.
At all the surfaces, it is noted that materials which are near to the rotating tool has very
high speed and the direction of rotation is same as the tool i.e. anti-clockwise in the
present case. It is observed that as the rpm of the pin increases, the speed of particles
near the tool pin also increase. High rotation velocity generates high deformation of
the material near to weld region which ultimately leads to high strain rate values and
low viscosity. Moreover, the area of deformation also increases with the increase in
tool rpm.
6.3.2 Effect of translational velocity on material flow
For the effects of tool traverse speed on material flow, the tool rotational speed is
taken constant as 1200 rpm and the rotational speed is varied as 1.4 mm/s, 2 mm/s and
2.6 mm/s. When material flow velocity vector by magnitude is plotted for all planes, it
is found that for each surface the material flow pattern remains same for all the tool
traverse speed. Material near the pin has same speed for all the cases as tool rotation
speed is constant.
TH-1875_126103029
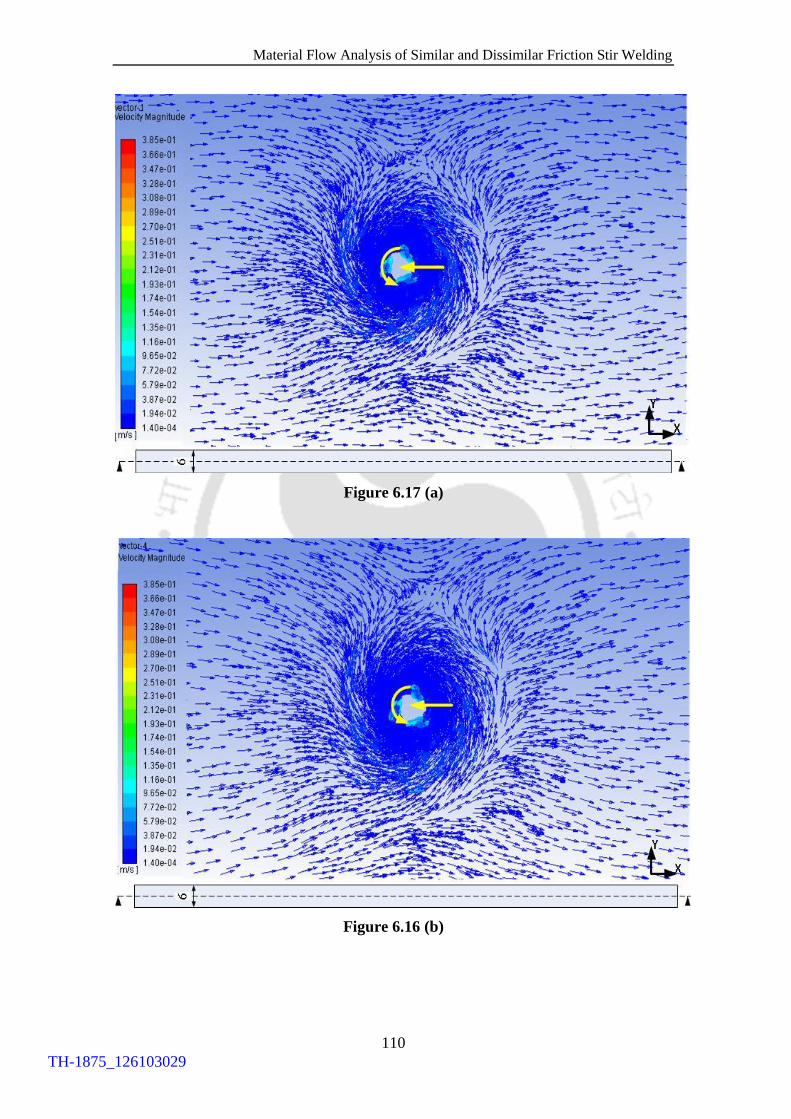
Material Flow Analysis of Similar and Dissimilar Friction Stir Welding
110
Figure 6.17 (a)
Figure 6.16 (b)
TH-1875_126103029

Material flow Behaviour for Different Pin Profiles
111
(c)
Figure 6.17: Velocity vector plot at 1100 rpm with (a) 1.4 mm/s, (b) 2 mm/s and (c)
2.6 mm/s tool traverse speed at plane 2.
The material flow width decreases as tool speed increases so less amount of material is
stirred as shown in Figure 6.17. Near the top surface, the mixing of stirred material at
the retreating side is found be good at 2 mm/s speed but not at the other two speed of
tool so to avoid defects optimum tool travel speed should be used.
6.4 Summary
In this chapter, the effect of tool pin geometry on the material flow is studied using a
laminar model. Seven different tool pin geometries are considered which provide
different material flow behaviours. The cylindrical geometries provided a uniform
thermal distribution, thus larger area of nugget zone whereas the threaded pin
geometries provided the smaller area with the higher rotation of material movement.
Due to this higher movement of material, the better material mixing characteristics are
obtained in the case of grooved and threaded pin geometries. The conical pin
geometries sometimes lack to move material from the bottom side of the plate due to
incapability to transfer heat to the bottom section of the workpiece. The material
vortex is observed in all tool geometries but the location is different for each case. The
TH-1875_126103029
Material Flow Analysis of Similar and Dissimilar Friction Stir Welding
112
material flow separation zone is observed on the advancing side of the welding where
the chances of the defects are very high. In the next chapter, the material flow
behaviour of dissimilar FSW is studied. A volume of fluid (VOF) approach is used to
study the mixing of Aluminium and Copper alloys fluids.
TH-1875_126103029

Chapter 7
Material Flow Behaviour of Dissimilar FSW
7.1 Introduction
In the former chapter, the effect of tool pin geometry was studied on the material
movement. The complete analysis was carried on a single material. The material flow
behaviour of Al-Cu FSW is studied in the current chapter. The proposed model uses
the volume of fluid (VOF) approach for the mixing of two fluids which is carried out
in the commercial finite volume methods (FVM) package ANSYS Fluent 14.5.
Experiments are conducted to justify the results obtained from the numerical
simulations. AA6061 and B370 Copper plates are used for conducting the dissimilar
FSW analysis. A cylindrical flat shoulder threaded tool is used to perform the welding.
Furthermore, the effect of tool rotation and welding speed on the material movement
are studied.
7.2 Modelling details
The FSW of Aluminium alloy 6061 and Copper B370 (Cu) plates are performed in a
numerical finite volume model. The Al and Cu plates dimensions used in the model is
same as the experiments i.e. the length of 200 mm, 100 mm width and a thickness of 6
mm. The dimensions of the tool used in the model remain same as experiment with
right helix thread (RHT) as shown in Figure 7.1. Likewise, the Copper plates are kept
on the retreating side (RS) whereas on advancing side (AS) Aluminium alloy plates are
placed with 1 mm eccentricity of the tool towards Aluminium side. The tool geometry
is introduced as a wall in the plates which are meshed with tetrahedral and brick
elements. A finer mesh is provided near the pin region to capture all features of the pin
as shown in Figure 7.2. The welding is performed along X-axis in the model. The
model used for the analysis is the volume of fluid model (VOF) to determine the
material mixing in the weld region. The complete model details are provided in
Section 3.6.
TH-1875_126103029
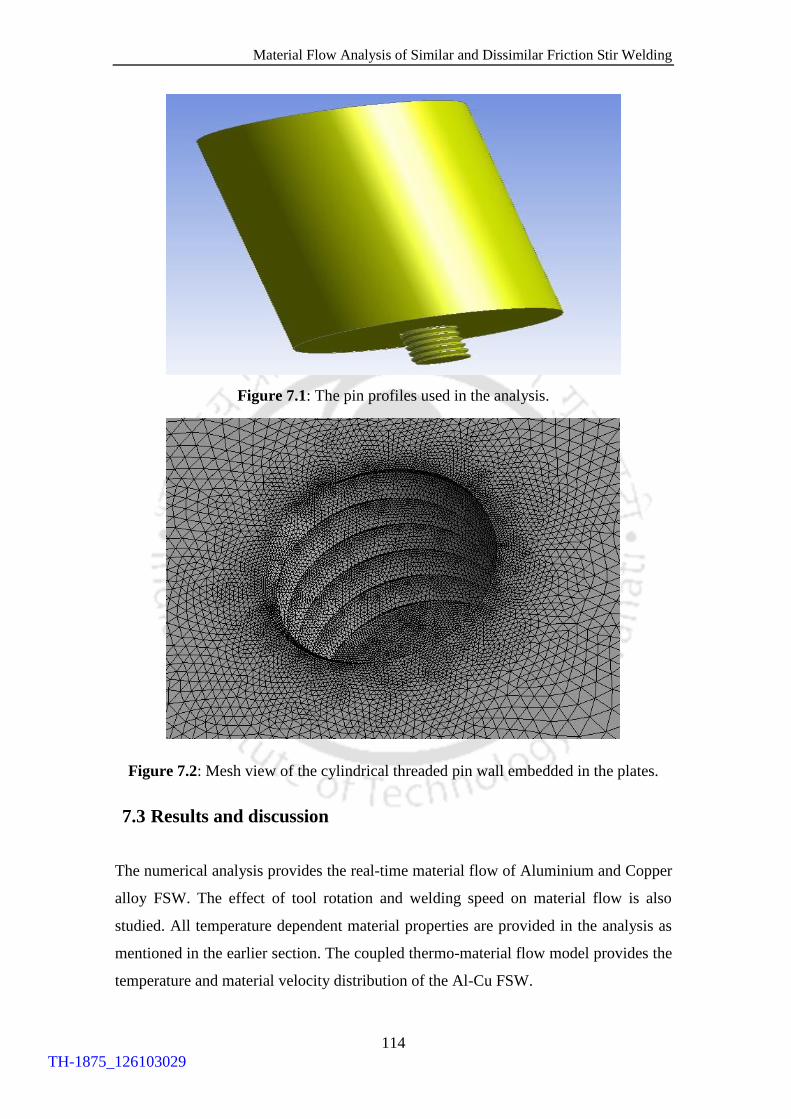
Material Flow Analysis of Similar and Dissimilar Friction Stir Welding
114
Figure 7.1: The pin profiles used in the analysis.
Figure 7.2: Mesh view of the cylindrical threaded pin wall embedded in the plates.
7.3 Results and discussion
The numerical analysis provides the real-time material flow of Aluminium and Copper
alloy FSW. The effect of tool rotation and welding speed on material flow is also
studied. All temperature dependent material properties are provided in the analysis as
mentioned in the earlier section. The coupled thermo-material flow model provides the
temperature and material velocity distribution of the Al-Cu FSW.
TH-1875_126103029
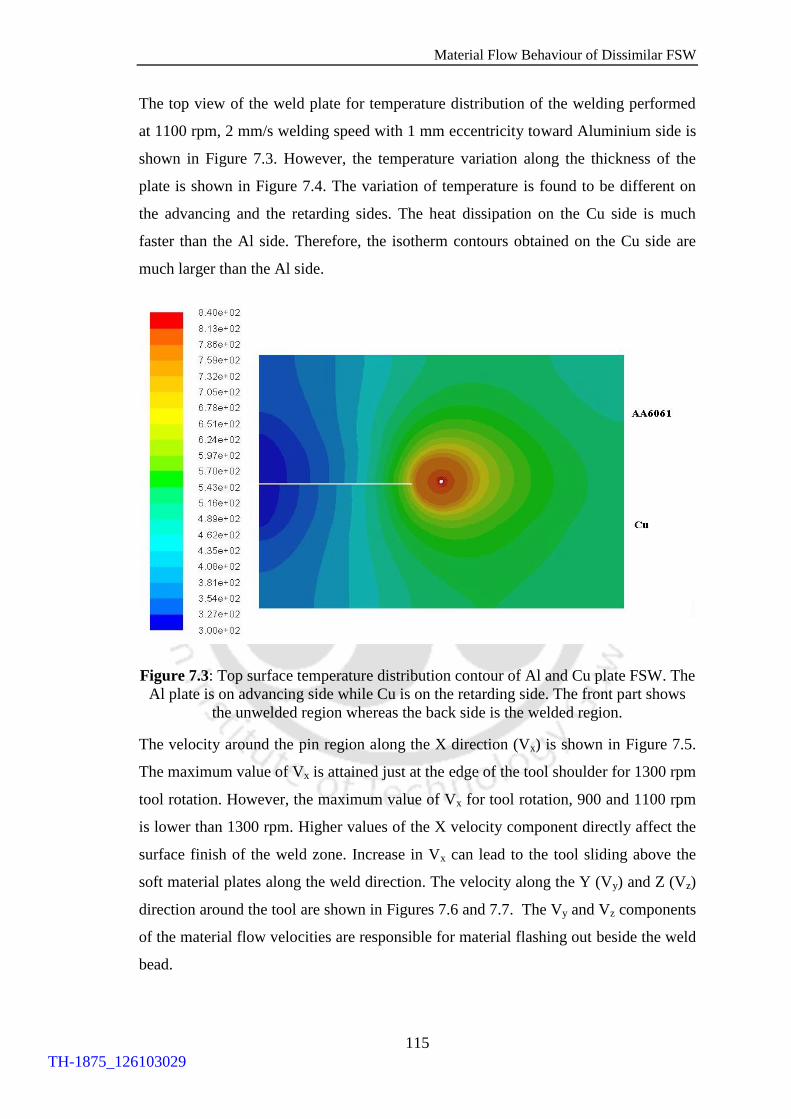
Material Flow Behaviour of Dissimilar FSW
115
The top view of the weld plate for temperature distribution of the welding performed
at 1100 rpm, 2 mm/s welding speed with 1 mm eccentricity toward Aluminium side is
shown in Figure 7.3. However, the temperature variation along the thickness of the
plate is shown in Figure 7.4. The variation of temperature is found to be different on
the advancing and the retarding sides. The heat dissipation on the Cu side is much
faster than the Al side. Therefore, the isotherm contours obtained on the Cu side are
much larger than the Al side.
Figure 7.3: Top surface temperature distribution contour of Al and Cu plate FSW. The
Al plate is on advancing side while Cu is on the retarding side. The front part shows
the unwelded region whereas the back side is the welded region.
The velocity around the pin region along the X direction (Vx) is shown in Figure 7.5.
The maximum value of Vx is attained just at the edge of the tool shoulder for 1300 rpm
tool rotation. However, the maximum value of Vx for tool rotation, 900 and 1100 rpm
is lower than 1300 rpm. Higher values of the X velocity component directly affect the
surface finish of the weld zone. Increase in Vx can lead to the tool sliding above the
soft material plates along the weld direction. The velocity along the Y (Vy) and Z (Vz)
direction around the tool are shown in Figures 7.6 and 7.7. The Vy and Vz components
of the material flow velocities are responsible for material flashing out beside the weld
bead.
TH-1875_126103029
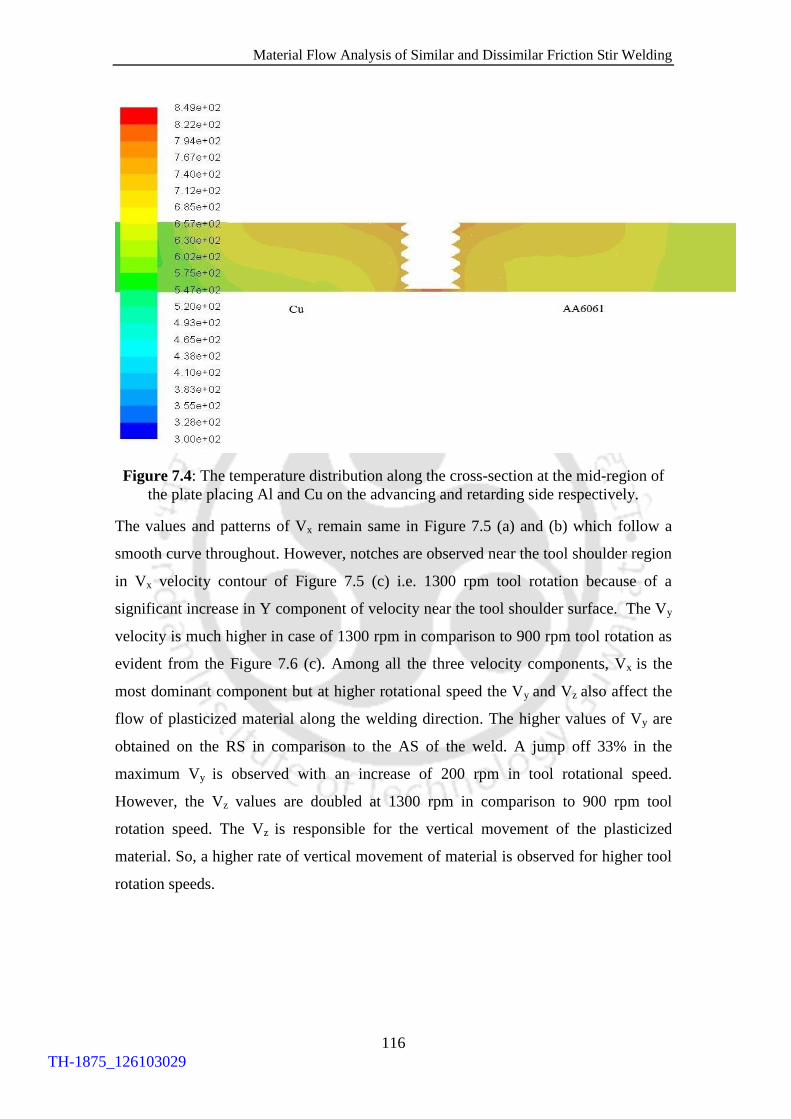
Material Flow Analysis of Similar and Dissimilar Friction Stir Welding
116
Figure 7.4: The temperature distribution along the cross-section at the mid-region of
the plate placing Al and Cu on the advancing and retarding side respectively.
The values and patterns of Vx remain same in Figure 7.5 (a) and (b) which follow a
smooth curve throughout. However, notches are observed near the tool shoulder region
in Vx velocity contour of Figure 7.5 (c) i.e. 1300 rpm tool rotation because of a
significant increase in Y component of velocity near the tool shoulder surface. The Vy
velocity is much higher in case of 1300 rpm in comparison to 900 rpm tool rotation as
evident from the Figure 7.6 (c). Among all the three velocity components, Vx is the
most dominant component but at higher rotational speed the Vy and Vz also affect the
flow of plasticized material along the welding direction. The higher values of Vy are
obtained on the RS in comparison to the AS of the weld. A jump off 33% in the
maximum Vy is observed with an increase of 200 rpm in tool rotational speed.
However, the Vz values are doubled at 1300 rpm in comparison to 900 rpm tool
rotation speed. The Vz is responsible for the vertical movement of the plasticized
material. So, a higher rate of vertical movement of material is observed for higher tool
rotation speeds.
TH-1875_126103029

Material Flow Behaviour of Dissimilar FSW
117
Figure 7.5: The X-direction velocity (Vx) in the cross-section from the mid-section of
the plate for (a) 900 rpm, (b) 1100 rpm and (c) 1300 rpm. It is the rate and amount of
material movement along the weld line.
Figure 7.6: The Y-direction velocity (Vy) in the cross-section from the mid-section of
the plate for (a) 900 rpm, (b) 1100 rpm and (c) 1300 rpm. It is the rate and amount of
material movement forced away and attracted towards the tool pin.
TH-1875_126103029

Material Flow Analysis of Similar and Dissimilar Friction Stir Welding
118
Figure 7.7: The Z-direction velocity (Vz) in the cross-section from the mid-section of
the plate for (a) 900 rpm, (b) 1100 rpm and (c) 1300 rpm. It is the rate and amount of
material movement along the thickness of the plate around the tool surface.
The lower rates of material movement contours (i.e. 0.2 and 0.1 m/s) are pushed away
from the tool surface while the higher rate material movement contours (0.4, 0.8 and 1
m/s) are pulled closer to the tool pin surface at higher rpm which is observed from
Figure 7.5. The flattening of lower magnitude contour at higher tool rotation suggests
that the nugget zone size increases significantly with increase in tool rotation speed.
The amount of upward moving plasticized material is increased with the tool rotation,
shown by 0.03 m/s contour area in Figure 7.7.
The velocity in X, Y and Z – direction with welding speed 1.8, 2.0 and 2.2 mm/s is
shown in Figures 7.8 to 7.10. The peak Vx remains same in all the cases. However, the
differences are observed in the contours such as 0.2 m/s contour moves closer to the
tool pin. The shrinkage of contour determines that the amount of plasticized material
movement along the weld line decreases with the increase in welding speed.
TH-1875_126103029

Material Flow Behaviour of Dissimilar FSW
119
Figure 7.8: The X-direction velocity (Vx) in the cross-section from the mid-section of
the plate for (a) 1.8 mm/s, (b) 2.0 mm/s and (c) 2.2 mm/s welding speed.
Figure 7.9: The Y-direction velocity (Vy) in the cross-section from the mid-section of
the plate for (a) 1.8 mm/s, (b) 2.0 mm/s and (c) 2.2 mm/s welding speed.
TH-1875_126103029

Material Flow Analysis of Similar and Dissimilar Friction Stir Welding
120
Figure 7.10: The Z-direction velocity (Vz) in the cross-section from the mid-section of
the plate for (a) 1.8 mm/s, (b) 2.0 mm/s and (c) 2.2 mm/s welding speed.
The Vy in Figure 7.9 follows the same trend i.e. higher velocity material movement
contour shrinkage is observed with increase in welding speed. The maximum and the
minimum velocity (Vy) of the materials remain constant for all the three cases.
However, the maximum velocity along the thickness (Vz) increases with increase in
welding speed. The maximum value is found to be 0.05 m/s for 2.2 mm/s welding
speed as shown in Figure 7.10.
The viscosity distribution on the AS and the RS is shown in Figure 7.11. The viscosity
calculated in the model is based on the strain rate and the temperature values as
explained in the earlier section 3.6.1. The higher viscosity region is found on the AS
due to the Cu particles movement on the Aluminium side whereas lower viscosity on
the Cu side is mainly due to the high Aluminium movement towards the retarding side
(Cu).
TH-1875_126103029

Material Flow Behaviour of Dissimilar FSW
121
Figure 7.11: The viscosity variation below the tool on the advancing and retarding
side along the cross-section plane perpendicular to the welding direction.
7.4 Experimental procedure
The commercial Aluminium alloy (AA6061) and Copper (Cu) B370 plates of 200 mm
length, 100 mm breadth and 6 mm thickness are used to perform by friction stir butt
welding. The Copper plates are kept on the RS whereas on AS Aluminium alloy plates
are placed. The tools are fabricated for the experiments using D3 Tool steel i.e. right
helix threaded tool (RHT) with flat cylindrical shoulder with 28 mm shoulder
diameter, and cylindrical pin with 6 mm pin diameter, 5.7 mm pin height and 1.1 mm
pitch of threads, shown in Figure 7.12.
A vertical milling machine of 7.5 hp motor capacity is modified and used as an FSW
machine. The edges of the workpieces are grind and cleaned with the methanol
thereafter wiped with the clean cloth to remove oxide films, oil and grease before
performing the experiments. Tool pins are placed such that it is 2 mm in Copper plates
and 4 mm in Aluminium alloy plates. To prevent the abutting of joint faces, the
workpieces are clamped rigidly on a cast iron backing plate.
TH-1875_126103029

Material Flow Analysis of Similar and Dissimilar Friction Stir Welding
122
Figure 7.12: Tool used for performing the experiments.
7.5 Experimental results
Experiments are performed in order to study the effect of tool rotation and welding
speed on the material mixing and joint efficiency. The experiments are done, firstly
keeping the welding speed constant at 2 mm/s and rotation speed are varied from 900-
1300 rpm then keeping the rotational speed constant at 1100 rpm and varying the
welding velocity 1.8-2.2 mm/s. The tensile test has been conducted by making ASTM
E8 standard samples from the welded plates. Instron-8801 tensile testing machine is
used to conduct tensile test with a maximum load capacity of 100 kN shown in Figure
7.13. The tensile test specimens are taken perpendicular to the weld line. The tensile
tests are conducted at a constant displacement rate of 1 mm/min.
The tensile test results of all the experiments are shown in Table 7.1. The joint
efficiency is the ratio of the maximum tensile strength of the sample to the maximum
strength of the weaker base metal element which is Aluminium in this case which has
a tensile strength of 110 MPa. The maximum efficiency of the joint is obtained for
1100 rpm and 2 mm/s welding speed. The microstructure of the base material and the
welded nugget zone is studied to understand the quality of the weld.
TH-1875_126103029

Material Flow Behaviour of Dissimilar FSW
123
Figure 7.13: Instron-8801 tensile testing machine with AA6061- Cu B370 weld
sample.
Table 7.1: The process parameter and the welding efficiency of joints formed during the
welding.
Tool
Rotation
(rpm)
Welding
speed
(mm/s)
Ultimate
tensile
strength
(MPa)
Efficiency
of the
joint (%)
Welding region Observations
900 2 53.7 48.84 Inadequate mixing
in weld zone
1100 2 82.8 75.3 Defect free weld,
failure outside
weld zone
1300 2 61.7 56.15 Defect free weld,
failure outside
weld zone
1100 1.8 78.2 71.15 Tunnel defect at
slow traverse speed
1100 2.2 52.5 48.07 Defect free weld,
failure outside
weld zone
TH-1875_126103029

Material Flow Analysis of Similar and Dissimilar Friction Stir Welding
124
Figure 7.14: Microstructure of the weld nugget zone.
Figure 7.15: The Cu chunks move towards the Al side is visible here.
The sample is taken from the mid-section of the plate and went through mounting,
coarse grinding, fine grinding, and polishing, etching and microscopic examination to
get the microstructure. The wet grit paper (P400 to P2000) on double-disc grinding
machines is used with the grinder followed by the velvet cloth polish with braso and
silvo combination to reveal the microstructure on the sample surface.
Copper
particles
Aluminium
particles
TH-1875_126103029

Material Flow Behaviour of Dissimilar FSW
125
The micrographs reveal parent material distribution in the nugget zone shown in
Figures 7.14 and 7.15. The sample for SEM is taken from the defect free weld formed
by 1100 rpm tool rotation and 2 mm/s welding speed. The movement of Cu towards
the Al side along with Al-Cu mixing in the Nugget zone is observed in the
micrographs. The viscosity distribution in the previous section suggested the same.
Figure 7.16: The temperature profile at 20 mm from the weld line (a) advancing side
and (b) retarding side.
The temperature profiles of the experimental and simulation model are compared in
Figure 7.16. The temperature data is taken at 20 mm away on both the sides of the
plates. The points are selected such that temperature rise and fall can be recorded.
Therefore, the points are taken at the mid-section of the welding direction. The
temperature readings are taken with 1 mm diameter K-type thermocouples (chromel
and alumel wires). The thermocouples are connected to the data acquisition system
(Agilent-34970A) to record the temperature data. The tool rotation speed is 1100 rpm,
2 mm/s welding speed and 1 mm eccentricity towards the Al side. The maximum
temperature obtained in the simulation at 20 mm away from the weld centre line is 653
K and 597 K on the advancing side and retreating side respectively. However, for the
experiments, it is found to be 642 K and 588 K on the advancing side and retreating
side respectively.
TH-1875_126103029

Material Flow Analysis of Similar and Dissimilar Friction Stir Welding
126
7.6 Summary
In this chapter, the material flow of dissimilar FSW is studied. The flow model used in
this analysis is a laminar model. The effect of the process parameter is also studied on
the material flow. It is found that the tool rotational and traverse speed affect the
nugget zone size. The model is well validated with the experiments. A tunnel defect is
formed during the experiments which are measured and modelled in geometry. In the
next chapter, a comparative study is conducted between the defected and a healthy
geometry. The study is based on the velocity response obtained along the weld line.
TH-1875_126103029

Chapter 8
Material Flow Behaviour for Defected Geometry
8.1 Introduction
In the former chapter, the material flow behaviour of dissimilar FSW was studied. The
effect of tool rotation and tool travel speed on material flow was studied on Al-Cu butt
welding joint. It was observed some set of parameters lead to defected weldment
formation. One of the common defects observed in such cases is the tunnel defect. In
this work, this tunnel defect is measured in detail with the experiments and
implemented in the material flow model. The comparative study has been performed
for a defected and undefected plate based on the velocity response during the welding.
The velocity response clearly shows the flow difference between the two plates.
8.1 Modelling details
A tunnel defect is found in the joining of AA6061 and Copper B370. The dimension
and the location are taken from the sample and the same is implemented in the material
flow model as shown in Figure 8.1. The Figure 8.2 shows the tool pin geometry along
with the defect size and shape that is used in the current analysis. The defect is an
oval-shaped cavity formed in the welded plate with the dimension of 1.4 mm length
and 0.8 mm breadth. The setup for the simulation is taken the same as the previous
analysis as shown in Figure 8.3. The tool is also taken same as 28 mm shoulder
diameter with a threaded pin length of 5.75 mm and 6 mm tool pin diameter. The tool
rotation is provided as 1100 rpm and 1.8 mm/s tool travel speed. The Aluminium alloy
is placed on the advancing side and the Copper alloy is placed on the retreating side
with 1 mm eccentricity towards the Aluminium alloy plate. In terms of the co-
ordinate system, the tool rotation axis is along the Z direction and the material flow is
along the X direction. The plate dimensions are also taken same as the experiment and
the previous simulation that is 200 × 150 × 6 mm. The outer region of the plate is
taken as solid while the central region is taken as fluid from 25 mm to -25 mm in Y
direction which is shown in Figure 8.3. The two fluids walls are used to input
TH-1875_126103029

Material Flow Analysis of Similar and Dissimilar Friction Stir Welding
128
the Aluminium and Copper fluid which are separated through a fine slit. The front side
of the tool is unwelded while the back side of the tool is welded. Therefore, the two
fluids are separated till the tool region then are allowed to mix under the tool due to the
rotation.
To compare the defected and undefected (healthy) weldments, 5 points are taken on X-
axis where the Y and Z coordinates are taken as 0 and -3 respectively. Four Points are
taken under the tool shoulder region i.e. from 5 to 12 mm and one point is taken
outside the tool shoulder region which is at 16 mm from the centre of the tool along
welding direction (X-axis) as shown in Figure 8.4.
Figure 8.1: Measurement of tunnel defect formed during the welding.
Figure 8.2: Defect measurement made 3.5 mm below the top surface in geometry of
the material flow model.
TH-1875_126103029

Material Flow Behaviour for Defected Geometry
129
Figure 8.3: The model setup with all the walls and the material region used in the
analysis.
Figure 8.4: Observatory point situated at the middle of plate thickness just behind the
pin. Four points are under the shoulder while one point is outside the shoulder region.
TH-1875_126103029
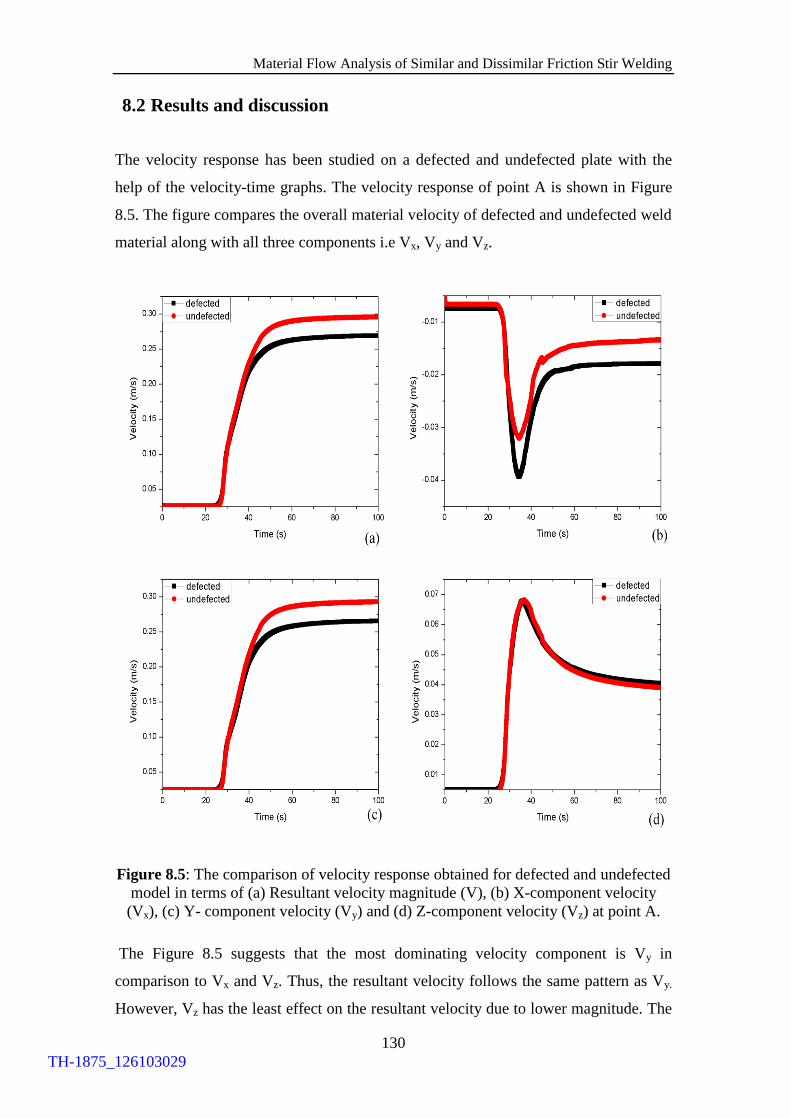
Material Flow Analysis of Similar and Dissimilar Friction Stir Welding
130
8.2 Results and discussion
The velocity response has been studied on a defected and undefected plate with the
help of the velocity-time graphs. The velocity response of point A is shown in Figure
8.5. The figure compares the overall material velocity of defected and undefected weld
material along with all three components i.e Vx, Vy and Vz.
Figure 8.5: The comparison of velocity response obtained for defected and undefected
model in terms of (a) Resultant velocity magnitude (V), (b) X-component velocity
(Vx), (c) Y- component velocity (Vy) and (d) Z-component velocity (Vz) at point A.
The Figure 8.5 suggests that the most dominating velocity component is Vy in
comparison to Vx and Vz. Thus, the resultant velocity follows the same pattern as Vy.
However, Vz has the least effect on the resultant velocity due to lower magnitude. The
TH-1875_126103029

Material Flow Behaviour for Defected Geometry
131
observatory points are just behind the tool pin and in the high influence of the tool
shoulder rotation which has a tangential velocity along Y-direction of the plate.
Therefore the magnitude of Vy is much higher than the other two components. The
same pattern is observed in the velocity response of point B as shown in Figure 8.6.
Figure 8.6: The comparison of velocity response obtained for defected and undefected
model in terms of (a) Resultant velocity magnitude(V), (b) X-component velocity (Vx),
(c) Y- component velocity (Vy) and (d) Z-component velocity (Vz) at point B.
On moving from point A to B, i.e away from the tool pin, the velocity magnitude in
the mid-thickness of the undefected plate increases from 0.29 to 0.36 m/s. A similar
trend is observed in the defected plate, the mid-thickness velocity increases from 0.24
to 0.29 m/s which is slightly less than the undefected plate. So, material velocity near
the tool pin region is higher for the undefected plate in comparison to the defected one.
TH-1875_126103029
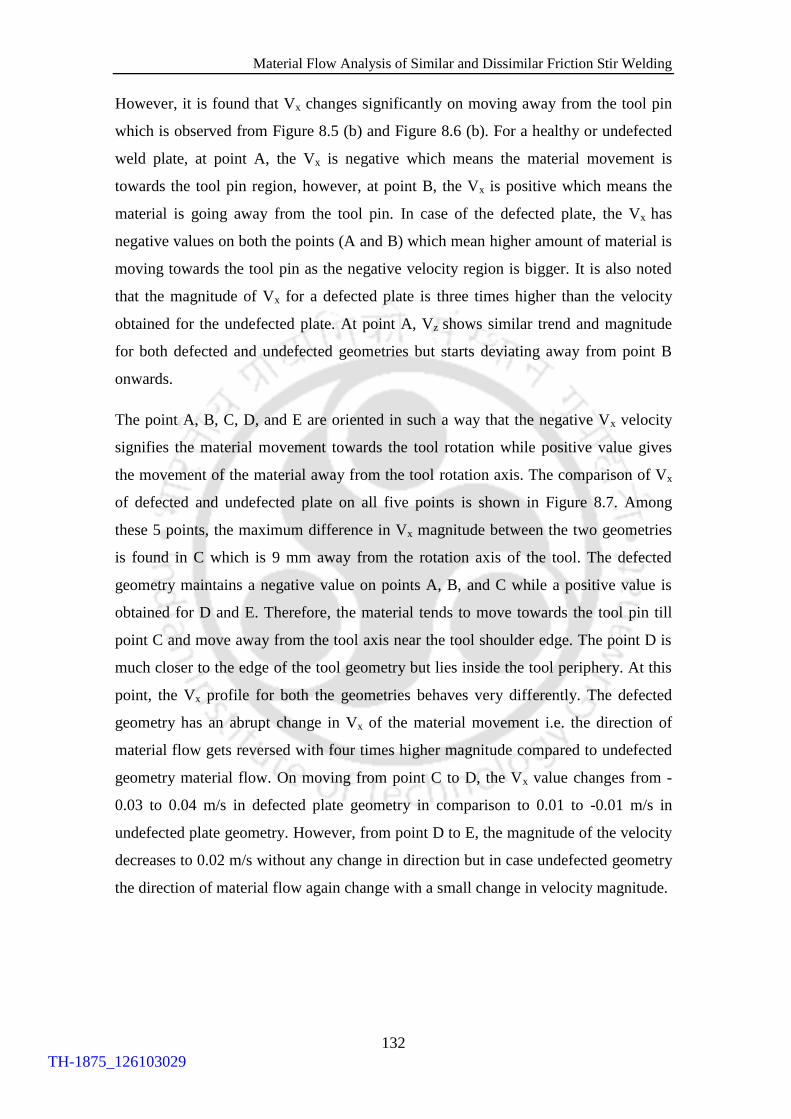
Material Flow Analysis of Similar and Dissimilar Friction Stir Welding
132
However, it is found that Vx changes significantly on moving away from the tool pin
which is observed from Figure 8.5 (b) and Figure 8.6 (b). For a healthy or undefected
weld plate, at point A, the Vx is negative which means the material movement is
towards the tool pin region, however, at point B, the Vx is positive which means the
material is going away from the tool pin. In case of the defected plate, the Vx has
negative values on both the points (A and B) which mean higher amount of material is
moving towards the tool pin as the negative velocity region is bigger. It is also noted
that the magnitude of Vx for a defected plate is three times higher than the velocity
obtained for the undefected plate. At point A, Vz shows similar trend and magnitude
for both defected and undefected geometries but starts deviating away from point B
onwards.
The point A, B, C, D, and E are oriented in such a way that the negative Vx velocity
signifies the material movement towards the tool rotation while positive value gives
the movement of the material away from the tool rotation axis. The comparison of Vx
of defected and undefected plate on all five points is shown in Figure 8.7. Among
these 5 points, the maximum difference in Vx magnitude between the two geometries
is found in C which is 9 mm away from the rotation axis of the tool. The defected
geometry maintains a negative value on points A, B, and C while a positive value is
obtained for D and E. Therefore, the material tends to move towards the tool pin till
point C and move away from the tool axis near the tool shoulder edge. The point D is
much closer to the edge of the tool geometry but lies inside the tool periphery. At this
point, the Vx profile for both the geometries behaves very differently. The defected
geometry has an abrupt change in Vx of the material movement i.e. the direction of
material flow gets reversed with four times higher magnitude compared to undefected
geometry material flow. On moving from point C to D, the Vx value changes from -
0.03 to 0.04 m/s in defected plate geometry in comparison to 0.01 to -0.01 m/s in
undefected plate geometry. However, from point D to E, the magnitude of the velocity
decreases to 0.02 m/s without any change in direction but in case undefected geometry
the direction of material flow again change with a small change in velocity magnitude.
TH-1875_126103029

Material Flow Behaviour for Defected Geometry
133
Figure 8.7: The X-velocity (Vx) components of defected and undefected weld
geometry at all five points. The velocity is along the welding direction.
TH-1875_126103029

Material Flow Analysis of Similar and Dissimilar Friction Stir Welding
134
Figure 8.8: The Y-velocity (Vy) components of defected and undefected weld
geometry at all five points. The graph shows the variation of Y-component of velocity
with time.
TH-1875_126103029
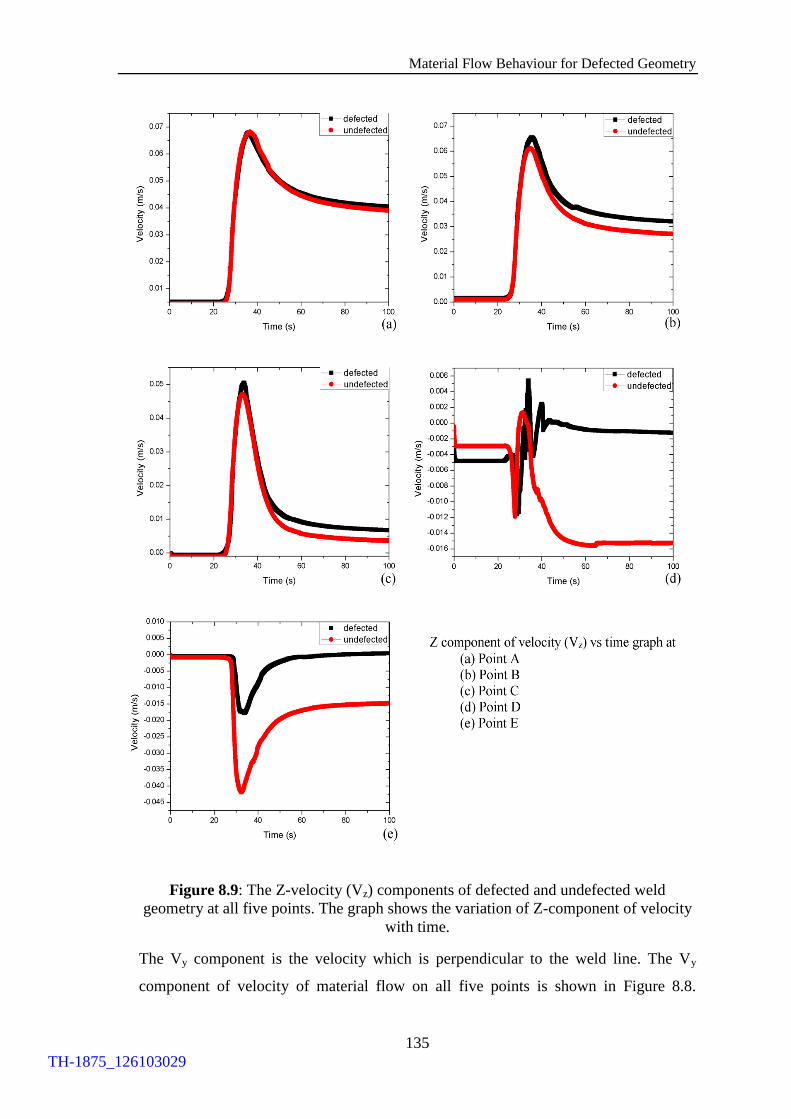
Material Flow Behaviour for Defected Geometry
135
Figure 8.9: The Z-velocity (Vz) components of defected and undefected weld
geometry at all five points. The graph shows the variation of Z-component of velocity
with time.
The Vy component is the velocity which is perpendicular to the weld line. The Vy
component of velocity of material flow on all five points is shown in Figure 8.8.
TH-1875_126103029

Material Flow Analysis of Similar and Dissimilar Friction Stir Welding
136
Among these 5 points, the maximum Vy value is obtained in point D for defected
geometry while the maximum value of Vy is observed at Point C for undefected
geometry. This suggests that the influence of tool shoulder is more in case of defected
geometries. The maximum and minimum value of Vy for defected geometry is 0.5 and
0.042 m/s at point D and E respectively. However, in the case of undefected plate
geometry shows 0.45 and 0.076 m/s as the maximum and minimum value at C and E
points. This suggests that the undefected plate geometry has smoother velocity profile
on moving away from the tool rotation axis. Since the Vy is the most dominant
velocity component; the resultant velocity also follows the same trend and magnitude
value as discussed previously for point A and B.
The Vz velocity component is responsible for material movement along the thickness
of the plate. The positive value shows the material movement towards the shoulder
(upward) and the negative value shows the material movement towards the base plate
(downward). The Vz component of velocity of material flow on all five points is shown
in Figure 8.9. The Vz component at point A, B, C shows no significant change between
defected and undefected plates. But a huge difference in the velocity of the two
geometries is obtained near the edge of the shoulder. The defected geometry shows the
upward movement of the material near the edge (Point D and E) but in case of healthy
or undefected weld, a downward movement of material is obtained near the edge.
These positive to negative values of Vz on moving away from the rotational axis
indicate a circular motion of material along the thickness of the plate for the
undefected geometry.
However, in the case of defected geometry, the Vz component values are positive on
all five points which indicate there is no downward movement of the material along
the thickness of the material. Therefore no circulation movement of the material is
obtained along the thickness of the material in case of defected geometry.
8.3 Summary
In this chapter, the velocity response of the defected and undefected plate material
flow is studied keeping same welding process parameters. The analysis is carried out
using a laminar material flow which was validated and detailed in previous chapter.
The velocity components of both the plates are studied separately at five points along
TH-1875_126103029

Material Flow Behaviour for Defected Geometry
137
the weld line. The results reveal that the influence of tool shoulder on the material
flow velocity is more in case of defected geometry. However, a smoother variation of
velocity component of material flow is observed in case of undefected plate.
TH-1875_126103029

Material Flow Analysis of Similar and Dissimilar Friction Stir Welding
138
TH-1875_126103029

Chapter 9
Conclusions and Future Scope
9.1 Conclusions
From this research work, the following conclusions can be drawn.
A 3-D FE model has been successfully developed considering the heat
generation due to both sticking and sliding conditions with 5.53 % error in
peak temperature. At higher tool rotational speed, the sticking condition
dominates over the sliding condition.
In case of material flow model, an asymmetry is found in the temperature
distribution on the AS and RS which is similar to the experimentally obtained
results.
No significant change in material velocity and temperature distribution is
observed between turbulent and laminar material flow models. A significant
reduction in analysis time is observed in the laminar model in comparison to
the turbulent model i.e. laminar analysis is 40 times faster than the turbulent
model.
A helical movement of the material is formed which moves around the pin in
FSW process both for clockwise and anti-clockwise rotation of the tool.
On the advancing side, the swirling movement is observed during the welding
near the top surface of the material and on the other hand at retreating side,
this movement is towards the bottom surface of the workpiece.
The tool pin profile has a significant effect in the nugget zone while it has a
negligible effect on the material flow behaviour away from the nugget zone.
The top surface material movement is governed by the tool shoulder but the
lateral and upward material movement inside the plate is governed by the pin
profile.
TH-1875_126103029
Material Flow Analysis of Similar and Dissimilar Friction Stir Welding
140
The swirling movement is found in all seven types of tool pin geometries but
the origin of the swirl and its size is different in each case. The swirl zone size
becomes more compact near to the pin in case threaded pin geometry which is
desirable.
In case cylindrical pin profile, the heating and deformation regions are more
uniform thus a uniform viscosity profile is obtained throughout the tool pin
height. This uniformity in viscosity profile decreases the probability of defect
formation. So, a threaded cylindrical tool pin profile is preferable to obtain a
defect free weld.
The probability of defect formation like worm or tunnel defect is more in
advancing side due to the presence of flow separation zone on the advancing
side.
For dissimilar materials FSW, on the Copper side, the heat dissipation is much
faster than the Aluminium side, thus the isotherms obtained on the Cu side are
much larger than the Al side.
In the material flow analysis, the peak magnitude of each component of
velocity is higher in case defected weld in the comparison with undefected
weld.
The undefected geometry provided much smoother variation in velocity
component of material flow in comparison to the defected geometry. A steep
rise and fall in velocity magnitude of X component are observed on moving
away from the tool rotation axis along the weld line.
A good circulation of material is observed for healthy weld geometry along
the thickness of the plate. However, no circulation of material is observed
along the thickness of the weld plate for a defected geometry.
9.2 Future scope
The current study is focused on the field of the material flow behaviour of the FSW
process. The study can be extended to the following future work.
TH-1875_126103029

Conclusions and Future Scope
141
The study can be used to understand the material flow behaviour of a hybrid
FSW process.
The current study can be used to find the material flow behaviour in case of
different defect formation in the FSW process.
The study can be utilised for any other combination of materials for similar as
well as dissimilar material.
The study can be further extended to thermo-mechanical analysis for residual
stresses and fatigue life prediction.
TH-1875_126103029

Bibliography
[1] E. Nicholas, "Developments in the friction-stir welding of metals," in ICAA-6,
6th International Conference on Aluminium Alloys. , Toyohashi, Japan, 1998.
[2] E. D. N. W.M. Thomas, J.C. Needham, M.G. Murch, P. Temple-Smith, C.J.
Dawes, "Friction-stir butt welding," 9125978.8, 1991.
[3] F. Stodolsky, A. Vyas, R. Cuenca, and L. Gaines, "Life-Cycle Energy Savings
Potential from Aluminum-Intensive Vehicles," 1995.
[4] L. Marretta, R. Di Lorenzo, F. Micari, J. Arinez, and D. Dornfeld, "Material
Substitution for Automotive Applications: A Comparative Life Cycle Analysis,"
in Leveraging Technology for a Sustainable World: Proceedings of the 19th
CIRP Conference on Life Cycle Engineering, University of California at
Berkeley, Berkeley, USA, May 23 - 25, 2012, D. A. Dornfeld and B. S. Linke,
Eds., ed Berlin, Heidelberg: Springer Berlin Heidelberg, 2012, pp. 61-66.
[5] H. Mahadevan and T. R. Ramachandran, "Recent trends in alumina and
aluminium production technology," Bulletin of Materials Science, vol. 19, pp.
905-920, 1996.
[6] G. Mathers, The welding of aluminium and its alloys: Woodhead publishing,
2002.
[7] E. Nicholas, "Developments in the friction stir welding of metals," in ICAA-6: 6
th International Conference on Aluminium Alloys, Toyohashi, Japan, 5-10 Japan
1998, 1998, pp. 139-151.
[8] W. J. Arbegast, "Friction stir welding after a decade of development," Welding
Journal, vol. 85, pp. 28-35, 2006.
[9] P. T. Houldcroft, Feng, Fim, and Fweldi, "Welding process developments and
future trends," Materials & Design, vol. 7, pp. 162-169, 1986.
[10] R. W. Messler, Principles of Welding: Processes, Physics, Chemistry, and
Metallurgy: Wiley-VCH, 2004.
[11] D. Hattingh, T. Van Niekerk, C. Blignault, G. Kruger, and M. James, "Analysis
of the FSW force footprint and its relationship with process parameters to
optimise weld performance and tool design," Welding in the World, vol. 48, pp.
50-58, 2004.
[12] L. Murr, G. Liu, and J. McClure, "Dynamic recrystallization in friction-stir
welding of aluminium alloy 1100," Journal of materials science letters, vol. 16,
pp. 1801-1803, 1997.
[13] S. Gopalakrishnan and N. Murugan, "Prediction of tensile strength of friction stir
welded aluminium matrix TiC p particulate reinforced composite," Materials &
Design, vol. 32, pp. 462-467, 2011.
[14] Z. Chen, T. Pasang, and Y. Qi, "Shear flow and formation of Nugget zone during
friction stir welding of aluminium alloy 5083-O," Materials Science and
Engineering: A, vol. 474, pp. 312-316, 2008.
[15] T. Hirata, T. Oguri, H. Hagino, T. Tanaka, S. W. Chung, Y. Takigawa, et al.,
"Influence of friction stir welding parameters on grain size and formability in
5083 aluminum alloy," Materials Science and Engineering: A, vol. 456, pp. 344-
349, 2007.
TH-1875_126103029
Bibliography
143
[16] K. Elangovan and V. Balasubramanian, "Influences of pin profile and rotational
speed of the tool on the formation of friction stir processing zone in AA2219
aluminium alloy," Materials Science and Engineering: A, vol. 459, pp. 7-18,
2007.
[17] S. Chionopoulos, C. Sarafoglou, D. Pantelis, and V. Papazoglou, "Effect of tool
pin and welding parameters on Friction Stir Welded (FSW) marine aluminium
alloys," in Proceedings of the 3rd International Conference on Manufacturing
Engineering (ICMEN), 2008, pp. 1-3.
[18] J. R. Davis, Aluminum and aluminum alloys: ASM international, 1993.
[19] M. B. D. Ellis and M. Strangwood, "Welding of rapidly solidified alloy 8009
(Al-8.5Fe-1.7Si-1.3V): preliminary study," Materials Science and Technology,
vol. 12, pp. 970-7, 1996.
[20] L. E. Murr, G. Liu, and J. C. McClure, "Dynamic recrystallization in friction-stir
welding of aluminium alloy 1100," Journal of Materials Science Letters, vol. 16,
pp. 1801-3, 1997.
[21] O. V. Flores, C. Kennedy, L. E. Murr, D. Brown, S. Pappu, B. M. Nowak, et al.,
"Microstructural issues in a friction-stir-welded aluminum alloy," Scripta
Materialia, vol. 38, pp. 703-8, 1998.
[22] L. E. Murr, G. Liu, and J. C. McClure, "A TEM study of precipitation and
related microstructures in friction-stir-welded 6061 aluminium," Journal of
Materials Science, vol. 33, pp. 1243-51, 1998.
[23] Y. S. Sato, H. Kokawa, M. Enomoto, and S. Jogan, "Microstructural evolution of
6063 aluminum during friction-stir welding," Metallurgical and Materials
Transactions A (Physical Metallurgy and Materials Science), vol. 30A, pp.
2429-37, 1999.
[24] M. W. Mahoney, C. G. Rhodes, J. G. Flintoff, R. A. Spuriing, and W. H. Bingel,
"Properties of friction-stir-welded 7075 T651 aluminum," Metallurgical and
Materials Transactions A (Physical Metallurgy and Materials Science), vol.
29A, pp. 1955-64, 1998.
[25] S. Benavides, Y. Li, L. E. Murr, D. Brown, and J. C. McClure, "Low-
temperature friction-stir welding of 2024 aluminum," Scripta Materialia, vol. 41,
pp. 809-815, 1999.
[26] E. Schofer, "Friction stir welding-joining of aluminium with low heat input,"
Materialwissenschaft und Werkstofftechnik, vol. 30, pp. 693-6, 1999.
[27] L. E. Murr, R. D. Flores, O. V. Flores, J. C. McClure, G. Liu, and D. Brown,
"Friction-stir welding: microstructural characterization," Materials Research
Innovations, vol. 1, pp. 211-23, 1998.
[28] M. Peel, A. Steuwer, M. Preuss, and P. J. Withers, "Microstructure, mechanical
properties and residual stresses as a function of welding speed in aluminium
AA5083 friction stir welds," Acta Materialia, vol. 51, pp. 4791-4801, 2003.
[29] K. Elangovan and V. Balasubramanian, "Influences of tool pin profile and
welding speed on the formation of friction stir processing zone in AA2219
aluminium alloy," Journal of Materials Processing Technology, vol. 200, pp.
163-175, 2008.
[30] H. J. Liu, H. J. Zhang, and L. Yu, "Effect of welding speed on microstructures
and mechanical properties of underwater friction stir welded 2219 aluminum
alloy," Materials & Design, vol. 32, pp. 1548-1553, 2011.
[31] T. Sakthivel, G. S. Sengar, and J. Mukhopadhyay, "Effect of welding speed on
microstructure and mechanical properties of friction-stir-welded aluminum," The
TH-1875_126103029
Material Flow Analysis of Similar and Dissimilar Friction Stir Welding
144
International Journal of Advanced Manufacturing Technology, vol. 43, pp. 468-
473, 2009.
[32] P. Cavaliere, G. Campanile, F. Panella, and A. Squillace, "Effect of welding
parameters on mechanical and microstructural properties of AA6056 joints
produced by Friction Stir Welding," Journal of Materials Processing
Technology, vol. 180, pp. 263-270, 2006.
[33] Y. G. Kim, H. Fujii, T. Tsumura, T. Komazaki, and K. Nakata, "Effect of
welding parameters on microstructure in the stir zone of FSW joints of
aluminum die casting alloy," Materials Letters, vol. 60, pp. 3830-3837, 2006.
[34] P. Cavaliere, A. Squillace, and F. Panella, "Effect of welding parameters on
mechanical and microstructural properties of AA6082 joints produced by friction
stir welding," Journal of Materials Processing Technology, vol. 200, pp. 364-
372, 2008.
[35] H. Lombard, D. G. Hattingh, A. Steuwer, and M. N. James, "Optimising FSW
process parameters to minimise defects and maximise fatigue life in 5083-H321
aluminium alloy," Engineering Fracture Mechanics, vol. 75, pp. 341-354, 2008.
[36] V. Balasubramanian, "Relationship between base metal properties and friction
stir welding process parameters," Materials Science and Engineering: A, vol.
480, pp. 397-403, 2008.
[37] M. Jariyaboon, A. Davenport, R. Ambat, B. Connolly, S. Williams, and D. Price,
"The effect of welding parameters on the corrosion behaviour of friction stir
welded AA2024–T351," Corrosion Science, vol. 49, pp. 877-909, 2007.
[38] M. Ericsson and R. Sandström, "Influence of welding speed on the fatigue of
friction stir welds, and comparison with MIG and TIG," International Journal of
Fatigue, vol. 25, pp. 1379-1387, 2003.
[39] K. Yong-Jai, S. Seong-Beom, and P. Dong-Hwan, "Friction stir welding of 5052
aluminum alloy plates," Transactions of Nonferrous Metals Society of China,
vol. 19, pp. s23-s27, 2009.
[40] C. H. K. Krasnowski, S. Dymek, "Influence of the tool shape and weld
configuration on microstructure and mechanical properties of the Al 6082 alloy
FSW joints," archives of civil and mechanical engineering, pp. 133-141, 2015.
[41] P. A. C. H. R. Shercliff, "Development of Trivex friction stir welding tool Part 2
– three-dimensional flow modelling," Science and Technology of Welding and
Joining, vol. 4, pp. 352-361, 2004.
[42] Y. Tozaki, Y. Uematsu, and K. Tokaji, "A newly developed tool without probe
for friction stir spot welding and its performance," Journal of Materials
Processing Technology, vol. 210, pp. 844-851, 2010.
[43] A. Arora, A. De, and T. DebRoy, "Toward optimum friction stir welding tool
shoulder diameter," Scripta Materialia, vol. 64, pp. 9-12, 2011.
[44] H. Fujii, L. Cui, M. Maeda, and K. Nogi, "Effect of tool shape on mechanical
properties and microstructure of friction stir welded aluminum alloys," Materials
Science and Engineering: A, vol. 419, pp. 25-31, 2006.
[45] C. B. D. G. Hattingh, T.I. van Niekerk, M.N. James, "Characterization of the
influences of FSW tool geometry on welding forces and weld tensile strength
using an instrumented tool," Journal of materials processing technology, pp. 46-
57, 2005.
[46] D. Rodrigues, A. Loureiro, C. Leitao, R. Leal, B. Chaparro, and P. Vilaça,
"Influence of friction stir welding parameters on the microstructural and
mechanical properties of AA 6016-T4 thin welds," Materials & Design, vol. 30,
pp. 1913-1921, 2009.
TH-1875_126103029

Bibliography
145
[47] R. Rai, A. De, H. K. D. H. Bhadeshia, and T. DebRoy, "Review: friction stir
welding tools," Science and Technology of Welding and Joining, vol. 16, pp.
325-342, 2011.
[48] D. Bakavos and P. Prangnell, "Effect of reduced or zero pin length and anvil
insulation on friction stir spot welding thin gauge 6111 automotive sheet,"
Science and Technology of Welding and Joining, vol. 14, pp. 443-456, 2009.
[49] P. A. Colegrove and H. Shercliff, "Development of Trivex friction stir welding
tool Part 2–three-dimensional flow modelling," Science and Technology of
Welding and Joining, vol. 9, pp. 352-361, 2004.
[50] P. Colegrove and H. Shercliff, "Experimental and numerical analysis of
aluminium alloy 7075-T7351 friction stir welds," Science and Technology of
Welding and Joining, vol. 8, pp. 360-368, 2003.
[51] K. Kumar, S. V. Kailas, and T. S. Srivatsan, "Influence of tool geometry in
friction stir welding," Materials and Manufacturing Processes, vol. 23, pp. 188-
194, 2008.
[52] A. Scialpi, L. De Filippis, and P. Cavaliere, "Influence of shoulder geometry on
microstructure and mechanical properties of friction stir welded 6082 aluminium
alloy," Materials & Design, vol. 28, pp. 1124-1129, 2007.
[53] H. Atharifar, D. Lin, and R. Kovacevic, "Numerical and experimental
investigations on the loads carried by the tool during friction stir welding,"
Journal of Materials Engineering and Performance, vol. 18, pp. 339-350, 2009.
[54] H. Badarinarayan, Y. Shi, X. Li, and K. Okamoto, "Effect of tool geometry on
hook formation and static strength of friction stir spot welded aluminum 5754-O
sheets," International Journal of Machine Tools and Manufacture, vol. 49, pp.
814-823, 2009.
[55] N. Rodriguez, E. Almanza, C. Alvarez, and L. Murr, "Study of friction stir
welded A319 and A413 aluminum casting alloys," Journal of materials science,
vol. 40, pp. 4307-4312, 2005.
[56] O. Lorrain, V. Favier, H. Zahrouni, and D. Lawrjaniec, "Understanding the
material flow path of friction stir welding process using unthreaded tools,"
Journal of Materials Processing Technology, vol. 210, pp. 603-609, 2010.
[57] C. D. Sorensen and A. L. Stahl, "Experimental measurements of load
distributions on friction stir weld pin tools," Metallurgical and Materials
Transactions B, vol. 38, pp. 451-459, 2007.
[58] M. Simoncini and A. Forcellese, "Effect of the welding parameters and tool
configuration on micro- and macro-mechanical properties of similar and
dissimilar FSWed joints in AA5754 and AZ31 thin sheets," Materials & Design,
vol. 41, pp. 50-60, 2012.
[59] A. L. Lafly, D. Alléhaux, F. Marie, C. Dalle Donne, and G. Biallas,
"Microstructure and Mechanical Properties of the Aluminium Alloy 6056
Welded by Friction Stir Welding Techniques," Welding in the World, vol. 50, pp.
98-106, 2006.
[60] H. Zhang, M. Wang, X. Zhang, and G. Yang, "Microstructural characteristics
and mechanical properties of bobbin tool friction stir welded 2A14-T6 aluminum
alloy," Materials & Design (1980-2015), vol. 65, pp. 559-566, 2015.
[61] T. Azimzadegan and S. Serajzadeh, "An Investigation into Microstructures and
Mechanical Properties of AA7075-T6 during Friction Stir Welding at Relatively
High Rotational Speeds," Journal of Materials Engineering and Performance,
vol. 19, pp. 1256-1263, 2010.
TH-1875_126103029

Material Flow Analysis of Similar and Dissimilar Friction Stir Welding
146
[62] P. B. Prangnell and C. P. Heason, "Grain structure formation during friction stir
welding observed by the ‘stop action technique’," Acta Materialia, vol. 53, pp.
3179-3192, 2005.
[63] M. Esmaily, N. Mortazavi, W. Osikowicz, H. Hindsefelt, J. E. Svensson, M.
Halvarsson, et al., "Bobbin and conventional friction stir welding of thick
extruded AA6005-T6 profiles," Materials & Design, vol. 108, pp. 114-125,
2016.
[64] H. Uzun, "Friction stir welding of SiC particulate reinforced AA2124 aluminium
alloy matrix composite," Materials & Design, vol. 28, pp. 1440-1446, 2007.
[65] L. Marzoli, A. Strombeck, J. Dos Santos, C. Gambaro, and L. Volpone, "Friction
stir welding of an AA6061/Al2O3/20p reinforced alloy," Composites Science
and Technology, vol. 66, pp. 363-371, 2006.
[66] P. Cavaliere, R. Nobile, F. Panella, and A. Squillace, "Mechanical and
microstructural behaviour of 2024–7075 aluminium alloy sheets joined by
friction stir welding," International Journal of Machine Tools and Manufacture,
vol. 46, pp. 588-594, 2006.
[67] P. Cavaliere, A. De Santis, F. Panella, and A. Squillace, "Effect of welding
parameters on mechanical and microstructural properties of dissimilar AA6082–
AA2024 joints produced by friction stir welding," Materials & Design, vol. 30,
pp. 609-616, 2009.
[68] C. Shen, J. Zhang, and J. Ge, "Microstructures and electrochemical behaviors of
the friction stir welding dissimilar weld," Journal of environmental sciences, vol.
23, pp. S32-S35, 2011.
[69] L. E. Murr, Y. Li, R. D. Flores, E. A. Trillo, and J. C. McClure, "Intercalation
vortices and related microstructural features in the friction-stir welding of
dissimilar metals," Materials Research Innovations, vol. 2, pp. 150-63, 1998.
[70] L. Ying, L. E. Murr, and J. C. McClure, "Solid-state flow visualization in the
friction-stir welding of 2024 Al to 6061 Al," Scripta Materialia, vol. 40, pp.
1041-6, 1999.
[71] A. P. Reynolds, W. D. Lockwood, and T. U. Seidel, "Processing-property
correlation in friction stir welds," Materials Science Forum, vol. 331-337, pp.
1719-24, 2000.
[72] R. S. Mishra and M. W. Mahoney, "Friction stir processing: a new grain
refinement technique to achieve high strain rate superplasticity in commercial
alloys," in Materials Science Forum, 2001, pp. 507-514.
[73] P. B. Berbon, W. H. Bingel, R. S. Mishra, C. C. Bampton, and M. W. Mahoney,
"Friction stir processing: a tool to homogenize nanocomposite aluminum alloys,"
Scripta Materialia, vol. 44, pp. 61-66, 2001.
[74] B. London, M. Mahoney, W. Bingel, M. Calabrese, R. Bossi, and D. Waldron,
"Material flow in friction stir welding monitored with Al-SiC and Al-W
composite markers," TMS2003, CA, K. Jata et al., eds, p. 3, 2003.
[75] Z. Ma, S. R. Sharma, R. S. Mishra, and M. W. Mahoney, "Microstructural
modification of cast aluminum alloys via friction stir processing," in Materials
Science Forum, 2003, pp. 2891-2896.
[76] J. Schneider, R. Beshears, and A. C. Nunes Jr, "Interfacial sticking and slipping
in the friction stir welding process," Materials Science and Engineering: A, vol.
435, pp. 297-304, 2006.
[77] B. Li, Y. Shen, and W. Hu, "The study on defects in aluminum 2219-T6 thick
butt friction stir welds with the application of multiple non-destructive testing
methods," Materials & Design, vol. 32, pp. 2073-2084, 2011.
TH-1875_126103029
Bibliography
147
[78] R. Keivani, B. Bagheri, F. Sharifi, M. Ketabchi, and M. Abbasi, "Effects of pin
angle and preheating on temperature distribution during friction stir welding
operation," Transactions of Nonferrous Metals Society of China, vol. 23, pp.
2708-2713, 2013.
[79] M. Grujicic, G. Arakere, H. Yalavarthy, T. He, C.-F. Yen, and B. Cheeseman,
"Modeling of AA5083 material-microstructure evolution during butt friction-stir
welding," Journal of Materials Engineering and Performance, vol. 19, pp. 672-
684, 2010.
[80] K. Kumar and S. V. Kailas, "The role of friction stir welding tool on material
flow and weld formation," Materials Science and Engineering: A, vol. 485, pp.
367-374, 2008.
[81] X. Hou, X. Yang, L. Cui, and G. Zhou, "Influences of joint geometry on defects
and mechanical properties of friction stir welded AA6061-T4 T-joints,"
Materials & Design, vol. 53, pp. 106-117, 2014.
[82] Y. Zhao, L. Zhou, Q. Wang, K. Yan, and J. Zou, "Defects and tensile properties
of 6013 aluminum alloy T-joints by friction stir welding," Materials & Design,
vol. 57, pp. 146-155, 2014.
[83] Y. S. Sato, H. Takauchi, S. H. C. Park, and H. Kokawa, "Characteristics of the
kissing-bond in friction stir welded Al alloy 1050," Materials Science and
Engineering: A, vol. 405, pp. 333-338, 2005.
[84] S. Di, X. Yang, D. Fang, and G. Luan, "The influence of zigzag-curve defect on
the fatigue properties of friction stir welds in 7075-T6 Al alloy," Materials
chemistry and physics, vol. 104, pp. 244-248, 2007.
[85] R. Crawford, G. Cook, A. Strauss, D. Hartman, and M. Stremler, "Experimental
defect analysis and force prediction simulation of high weld pitch friction stir
welding," Science and Technology of Welding and Joining, vol. 11, pp. 657-665,
2006.
[86] R. Leal and A. Loureiro, "Effect of overlapping friction stir welding passes in the
quality of welds of aluminium alloys," Materials & Design, vol. 29, pp. 982-991,
2008.
[87] H. Liu and H. Zhang, "Repair welding process of friction stir welding groove
defect," Transactions of Nonferrous Metals Society of China, vol. 19, pp. 563-
567, 2009.
[88] A. P. Reynolds, "Visualisation of material flow in autogenous friction stir
welds," Science and Technology of Welding and Joining, vol. 5, pp. 120-124,
2000.
[89] M. Guerra, J. C. McClure, L. E. Murr, and A. C. Nunes, "Metal flow during
friction stir welding," in Friction Stir Welding and Processing, 2001, pp. 25-34.
[90] H. N. B. Schmidt, T. L. Dickerson, and J. H. Hattel, "Material flow in butt
friction stir welds in AA2024-T3," Acta Materialia, vol. 54, pp. 1199-1209,
2006.
[91] Y. Morisada, H. Fujii, Y. Kawahito, K. Nakata, and M. Tanaka, "Three-
dimensional visualization of material flow during friction stir welding by two
pairs of X-ray transmission systems," Scripta Materialia, vol. 65, pp. 1085-1088,
2011.
[92] B. C. Liechty and B. W. Webb, "Flow field characterization of friction stir
processing using a particle-grid method," Journal of Materials Processing
Technology, vol. 208, pp. 431-443, 2008.
[93] K. Colligan, "Material flow behavior during friction welding of aluminum,"
Weld J, vol. 75, pp. 229s-237s, 1999.
TH-1875_126103029
Material Flow Analysis of Similar and Dissimilar Friction Stir Welding
148
[94] R. Kumar, V. Pancholi, and R. P. Bharti, "Material flow visualization and
determination of strain rate during friction stir welding," Journal of Materials
Processing Technology, vol. 255, pp. 470-476, 2018.
[95] E. L. Rooy, "Introduction to aluminum and aluminum alloys," ASM
International, Metals Handbook, Tenth Edition., vol. 2, pp. 3-14, 1990.
[96] D. Tyler and W. Black, "Introduction to copper and copper alloys," ASM
International, Metals Handbook, Tenth Edition., vol. 2, pp. 216-240, 1990.
[97] I. Galvão, A. Loureiro, and D. Rodrigues, "Critical review on friction stir
welding of aluminium to copper," Science and Technology of Welding and
Joining, vol. 21, pp. 523-546, 2016.
[98] P. Xue, D. Ni, D. Wang, B. Xiao, and Z. Ma, "Effect of friction stir welding
parameters on the microstructure and mechanical properties of the dissimilar Al–
Cu joints," Materials science and engineering: A, vol. 528, pp. 4683-4689, 2011.
[99] H. J. Liu, J. J. Shen, L. Zhou, Y. Q. Zhao, C. Liu, and L. Y. Kuang,
"Microstructural characterisation and mechanical properties of friction stir
welded joints of aluminium alloy to copper," Science and Technology of Welding
and Joining, vol. 16, pp. 92-98, 2011.
[100] A. Abdollah-Zadeh, T. Saeid, and B. Sazgari, "Microstructural and mechanical
properties of friction stir welded aluminum/copper lap joints," Journal of alloys
and Compounds, vol. 460, pp. 535-538, 2008.
[101] H. Barekatain, M. Kazeminezhad, and A. Kokabi, "Microstructure and
mechanical properties in dissimilar butt friction stir welding of severely plastic
deformed aluminum AA 1050 and commercially pure copper sheets," Journal of
Materials Science & Technology, vol. 30, pp. 826-834, 2014.
[102] M. F. X. Muthu and V. Jayabalan, "Tool travel speed effects on the
microstructure of friction stir welded aluminum–copper joints," Journal of
Materials Processing Technology, vol. 217, pp. 105-113, 2015.
[103] I. Galvao, J. Oliveira, A. Loureiro, and D. Rodrigues, "Formation and
distribution of brittle structures in friction stir welding of aluminium and copper:
influence of process parameters," Science and Technology of Welding and
Joining, vol. 16, pp. 681-689, 2011.
[104] H. Bisadi, A. Tavakoli, M. T. Sangsaraki, and K. T. Sangsaraki, "The influences
of rotational and welding speeds on microstructures and mechanical properties of
friction stir welded Al5083 and commercially pure copper sheets lap joints,"
Materials & Design, vol. 43, pp. 80-88, 2013.
[105] I. Galvao, R. Leal, A. Loureiro, and D. Rodrigues, "Material flow in
heterogeneous friction stir welding of aluminium and copper thin sheets,"
Science and technology of welding and joining, vol. 15, pp. 654-660, 2010.
[106] C. Tan, Z. Jiang, L. Li, Y. Chen, and X. Chen, "Microstructural evolution and
mechanical properties of dissimilar Al–Cu joints produced by friction stir
welding," Materials & Design, vol. 51, pp. 466-473, 2013.
[107] S. Kahl and W. Osikowicz, "Composite aluminum-copper sheet material by
friction stir welding and cold rolling," Journal of materials engineering and
performance, vol. 22, pp. 2176-2184, 2013.
[108] J. Ouyang, E. Yarrapareddy, and R. Kovacevic, "Microstructural evolution in the
friction stir welded 6061 aluminum alloy (T6-temper condition) to copper,"
Journal of Materials Processing Technology, vol. 172, pp. 110-122, 2006.
[109] H. Okamura and K. Aota, "Joining of dissimilar materials with friction stir
welding," Welding international, vol. 18, pp. 852-860, 2004.
TH-1875_126103029
Bibliography
149
[110] C. Genevois, M. Girard, B. Huneau, X. Sauvage, and G. Racineux, "Interfacial
reaction during friction stir welding of Al and Cu," Metallurgical and Materials
Transactions A, vol. 42, pp. 2290, 2011.
[111] M. Avettand-Fenoël, R. Taillard, G. Ji, and D. Goran, "Multiscale study of
interfacial intermetallic compounds in a dissimilar Al 6082-T6/Cu friction-stir
weld," Metallurgical and Materials Transactions A, vol. 43, pp. 4655-4666,
2012.
[112] P. Vilaça, L. Quintino, and J. F. dos Santos, "iSTIR—analytical thermal model
for friction stir welding," Journal of materials processing technology, vol. 169,
pp. 452-465, 2005.
[113] Y. Hwang, Z. Kang, Y. Chiou, and H. Hsu, "Experimental study on temperature
distributions within the workpiece during friction stir welding of aluminum
alloys," International Journal of Machine Tools and Manufacture, vol. 48, pp.
778-787, 2008.
[114] D. Kim, H. Badarinarayan, J. H. Kim, C. Kim, K. Okamoto, R. Wagoner, et al.,
"Numerical simulation of friction stir butt welding process for AA5083-H18
sheets," European Journal of Mechanics-A/Solids, vol. 29, pp. 204-215, 2010.
[115] C. Chen and R. Kovacevic, "Finite element modeling of friction stir welding—
thermal and thermomechanical analysis," International Journal of Machine
Tools and Manufacture, vol. 43, pp. 1319-1326, 2003.
[116] P. Vilaça, L. Quintino, J. F. dos Santos, R. Zettler, and S. Sheikhi, "Quality
assessment of friction stir welding joints via an analytical thermal model,
iSTIR," Materials Science and Engineering: A, vol. 445, pp. 501-508, 2007.
[117] C. Hamilton, S. Dymek, and A. Sommers, "A thermal model of friction stir
welding in aluminum alloys," International journal of machine tools and
manufacture, vol. 48, pp. 1120-1130, 2008.
[118] C. Hamilton, A. Sommers, and S. Dymek, "A thermal model of friction stir
welding applied to Sc-modified Al–Zn–Mg–Cu alloy extrusions," International
Journal of Machine Tools and Manufacture, vol. 49, pp. 230-238, 2009.
[119] K. M. Williamson and T. Abdel-Salam, "A moving boundary formulation for
recursive plastic heat release during friction stir welding," Journal of materials
processing technology, vol. 180, pp. 49-52, 2006.
[120] S. Mandal and K. Williamson, "A thermomechanical hot channel approach for
friction stir welding," Journal of materials processing technology, vol. 174, pp.
190-194, 2006.
[121] M. Song and R. Kovacevic, "Thermal modeling of friction stir welding in a
moving coordinate system and its validation," International Journal of Machine
Tools and Manufacture, vol. 43, pp. 605-615, 2003.
[122] H. J. Aval, S. Serajzadeh, and A. Kokabi, "Evolution of microstructures and
mechanical properties in similar and dissimilar friction stir welding of AA5086
and AA6061," Materials Science and Engineering: A, vol. 528, pp. 8071-8083,
2011.
[123] G. Buffa, A. Ducato, and L. Fratini, "Numerical procedure for residual stresses
prediction in friction stir welding," Finite elements in analysis and design, vol.
47, pp. 470-476, 2011.
[124] Z. Zhang and H. Zhang, "Numerical studies on controlling of process parameters
in friction stir welding," Journal of materials processing technology, vol. 209,
pp. 241-270, 2009.
TH-1875_126103029

Material Flow Analysis of Similar and Dissimilar Friction Stir Welding
150
[125] J. H. Hattel, K. L. Nielsen, and C. C. Tutum, "The effect of post-welding
conditions in friction stir welds: from weld simulation to ductile failure,"
European Journal of Mechanics-A/Solids, vol. 33, pp. 67-74, 2012.
[126] J. Hilgert, H. N. B. Schmidt, J. F. dos Santos, and N. Huber, "Thermal models
for bobbin tool friction stir welding," Journal of Materials Processing
Technology, vol. 211, pp. 197-204, 2011.
[127] M. Assidi, L. Fourment, S. Guerdoux, and T. Nelson, "Friction model for
friction stir welding process simulation: Calibrations from welding experiments,"
International Journal of Machine Tools and Manufacture, vol. 50, pp. 143-155,
2010.
[128] E. Feulvarch, J. Roux, and J. Bergheau, "A simple and robust moving mesh
technique for the finite element simulation of Friction Stir Welding," Journal of
Computational and Applied Mathematics, vol. 246, pp. 269-277, 2013.
[129] M. Chiumenti, M. Cervera, C. A. de Saracibar, and N. Dialami, "Numerical
modeling of friction stir welding processes," Computer methods in applied
mechanics and engineering, vol. 254, pp. 353-369, 2013.
[130] N. Dialami, M. Chiumenti, M. Cervera, and C. A. De Saracibar, "An apropos
kinematic framework for the numerical modeling of friction stir welding,"
Computers & Structures, vol. 117, pp. 48-57, 2013.
[131] H. Zhang, Z. Zhang, and J. Chen, "3D modeling of material flow in friction stir
welding under different process parameters," Journal of Materials Processing
Technology, vol. 183, pp. 62-70, 2007.
[132] D. Jacquin, B. De Meester, A. Simar, D. Deloison, F. Montheillet, and C.
Desrayaud, "A simple Eulerian thermomechanical modeling of friction stir
welding," Journal of Materials Processing Technology, vol. 211, pp. 57-65,
2011.
[133] P. Heurtier, M. Jones, C. Desrayaud, J. H. Driver, F. Montheillet, and D.
Allehaux, "Mechanical and thermal modelling of friction stir welding," Journal
of materials processing technology, vol. 171, pp. 348-357, 2006.
[134] V. Soundararajan, S. Zekovic, and R. Kovacevic, "Thermo-mechanical model
with adaptive boundary conditions for friction stir welding of Al 6061,"
International Journal of Machine Tools and Manufacture, vol. 45, pp. 1577-
1587, 2005.
[135] H. B. Schmidt and J. H. Hattel, "Thermal modelling of friction stir welding,"
Scripta Materialia, vol. 58, pp. 332-337, 2008.
[136] H. Zhang, Z. Zhang, B. Jun, Z. Lei, and J. Chen, "Effect of viscosity on material
behavior in friction stir welding process," Transactions of Nonferrous Metals
Society of China, vol. 16, pp. 1045-1052, 2006.
[137] C. WU, W. ZHANG, S. Lei, and M. CHEN, "Visualization and simulation of
plastic material flow in friction stir welding of 2024 aluminium alloy plates,"
Transactions of Nonferrous Metals Society of China, vol. 22, pp. 1445-1451,
2012.
[138] P. F. Mendez, K. E. Tello, and T. J. Lienert, "Scaling of coupled heat transfer
and plastic deformation around the pin in friction stir welding," Acta Materialia,
vol. 58, pp. 6012-6026, 2010.
[139] F. Gemme, Y. Verreman, L. Dubourg, and M. Jahazi, "Numerical analysis of the
dwell phase in friction stir welding and comparison with experimental data,"
Materials Science and Engineering: A, vol. 527, pp. 4152-4160, 2010.
[140] S. Hirasawa, H. Badarinarayan, K. Okamoto, T. Tomimura, and T. Kawanami,
"Analysis of effect of tool geometry on plastic flow during friction stir spot
TH-1875_126103029

Bibliography
151
welding using particle method," Journal of materials processing technology, vol.
210, pp. 1455-1463, 2010.
[141] G. N. Lampeas and I. D. Diamantakos, "Effects of Nonconventional Tools on the
Thermo-Mechanical Response of Friction Stir Welded Materials," Journal of
Manufacturing Science and Engineering, vol. 137, pp. 051020, 2015.
[142] R. Nandan, G. Roy, T. Lienert, and T. DebRoy, "Numerical modelling of 3D
plastic flow and heat transfer during friction stir welding of stainless steel,"
Science and Technology of Welding and Joining, vol. 11, pp. 526-537, 2006.
[143] R. Nandan, G. Roy, T. Lienert, and T. Debroy, "Three-dimensional heat and
material flow during friction stir welding of mild steel," Acta Materialia, vol. 55,
pp. 883-895, 2007.
[144] A. K. Kadian. P. Biswas, "A Comparative Study of Material Flow Behavior in
Friction Stir Welding Using Laminar and Turbulent Models," Journal of
Materials Engineering and Performance, vol. 24(10) pp. 4119–4127, 2015.
[145] S. D. C. Hamilton, A. Sommers, "A thermal model of friction stir welding in
aluminum alloys," International Journal of Machine Tools & Manufacture, pp.
1120–1130, 2008.
[146] M. R. H. Nazari, "Analysis of transient temperature and residual thermal stresses
in friction stir welding of aluminum alloy 6061-T6 via numerical simulation," Int
J Adv Manuf Technol, pp. 143–152, 2011.
[147] R. H. S. A.P. Colegrove, "3-Dimensional CFD modelling of flow round a
threaded friction stir welding tool profile," Journal of Materials Processing
Technology, pp. 320-327, 2005.
[148] A. P. G. K. E. Tello, and P. F. Mendez, "Constants for Hot Deformation
Constitutive Models for Recent Experimental Data," Science and Technology of
Welding and Joining, pp. 260-66, 2010.
[149] S. Gruner and W. Hoyer, "The dynamic viscosity of liquid Cu–Si alloys,"
Journal of Alloys and Compounds, vol. 460, pp. 496-499, 2008.
[150] L. Jin and R. Sandström, "Numerical simulation of residual stresses for friction
stir welds in copper canisters," Journal of Manufacturing Processes, vol. 14, pp.
71-81, 2012.
TH-1875_126103029
List of Publication
International Journals
1. Arun Kumar Kadian and Pankaj Biswas, “The study of material flow behaviour in
dissimilar material FSW of AA6061 and Cu-B370 alloys plates,” Journal of
Manufacturing Processes, Vol. 34, pp 96-105, 2018.
2. Arun Kumar Kadian and Pankaj Biswas, “Effect of tool pin profile on the material flow
characteristics of AA6061,” Journal of Manufacturing Processes, Vol. 26, pp 382–392,
2017.
3. Arun Kumar Kadian and Pankaj Biswas, “A Comparative Study of Material Flow
Behavior in Friction Stir Welding Using Laminar and Turbulent Models,” Journal of
Materials Engineering and Performance, Vol. 24, pp 4119-4127, 2015.
4. Anil Kumar Deepati, Arun Kumar Kadian and Pankaj Biswas, “Numerical and
experimental study on influence of tool plunging force and shoulder size on thermal
history of friction stir welding,” Int. J. Manufacturing Research, Vol. 10, No. 1, pp 64 –
86, 2015.
5. Arun Kumar Kadian & Pankaj Biswas, "Process Parameters effect on Thermal History of
Friction Stir Welding by Considering Combined Stick & Slip Condition of AA6061," Int.
J. Manufacturing Research, (under review) 2018.
6. Arun Kumar Kadian & Pankaj Biswas, "The comparative study of material flow
behaviour of defected and undefected plates FSW," (under preperation).
7. Arun Kumar Kadian & Pankaj Biswas, "A review paper on material flow behaviour of
friction stir welding," (under preperation).
8. Arun Kumar Kadian & Pankaj Biswas, "A comparison of Eulerian and Volume of Fluid
material flow model for Dissimilar FSW of AA6061 and Cu-B370 alloys plates,"(under
preperation).
TH-1875_126103029

Conferences
9. Arun Kumar Kadian, Gautam Puri, Pankaj Biswas, "Prediction of Thermal History of
Friction Stir Welding by Considering Combined Stick & Slip Condition of AA1100," in
5th International and 26th All India Manufacturing Technology, Design and Research
Conference, Guwahati, 2014.
10. Arun Kumar Kadian, Gautam Puri, Suman Das, Pankaj Biswas, "Effect of tool geometry
and process parameters on the material flow of friction stir welding," in 5th International
and 26th All India Manufacturing Technology, Design and Research Conference,
Guwahati, 2014.
11. Anil Kumar Deepati, Arun Kadian , Leena Nemade and Pankaj Biswas, “Effect of tool
shoulder diameter on thermal history of FSW of aluminium alloy,” in Twenty-First
International Symposium on Processing and Fabrication of Advanced Materials,
Guwahati, 2012.
12. Deepati Anil Kumar, Pankaj Biswas, Arun Kadian, Leena Nemade, “3D-Finite Element
modelling and the effect of backing plate on thermal history of FSW AA5083,” in
National Conference on Advances in Welding Technology- Indian welding society.
NERIST, Arunachal Pradesh, 2013.
13. Nandan Kanan Das, Arun Kumar Kadian, Avinish Tiwari, Pardeep Pankaj, Pankaj
Biswas, " Transient Thermal Analysis on Friction Stir Welding of AA6061," in
5th
International Conference on Production and Industrial Engineering
(CPIE-2018), Bangkok, Thailand, 2018.
14. Pardeep Pankaj, Avinish Tiwari, Arun Kumar Kadian, Pankaj Biswas, "Transient thermal
analysis of CO2 laser welding of AISI 304 stainless steel thin plates," in 5th
International
Conference on Production and Industrial Engineering
(CPIE-2018), Bangkok, Thailand, 2018.
TH-1875_126103029