materials and methods - inflibnetshodhganga.inflibnet.ac.in/bitstream/10603/4674/8/08_chapter...
TRANSCRIPT
Materials and Methods
Page 52
3.1 SAMPLING METHOD
The study was carried out for 13 different lakes of Urban Ahmedabad. Among
all these lake some of the lakes were from eastern Ahmedabad and some were from
western Ahmedabad. Therefore proper sampling method was necessary to get
accurate result. During the study of all the 13 lakes following points were kept in
mind.
3.1.1 SELECTION OF SAMPLING SITES
In the present study the sampling was done during morning hour. The water
samples were collected from five different points of lake. Among these (1) The inlet
point – points where the feeder opens in the lake, (2) Center point - the point which
represent the general water quality of the lake and (3) The outlets point - the place
where the overflows occurs, whereas remaining two point were selected randomly.
3.1.2 COLLECTION OF SAMPLES
The water samples were collected in the polyethylene bottles or in a glass
bottle. Initially the prewashed bottles were rinsed with the sample water. The closed
bottle was dipped in the lake at the depth of 0.5 to 0.7 m, and then a bottle was opened
inside and was closed again to bring it out at the surface. The samples were collected
from five different points and were mixed together to prepare an integrated sample.
3.1.3 SAMPLE HANDLING AND PRESERVATION
From the time of sample collection to the time of actually analyses, many
physical, chemical and biochemical reactions would change the quality of the water
sample, therefore to minimize this change the sample were preserved soon after the
collection. The water samples were preserved by adding chemical preservatives,
lowering the temperature or by the combination of both the method. The water
temperature, pH, dissolved oxygen, electrical conductivity and total dissolve solids

were analyzed immediately at a time of collection, whereas the
parameters were done in the laboratory.
The study was carried for
The collected water samples were brought to the laboratory and relevant analysis was
performed. pH was determined electrometr
conductivity was measured by conductivity meter, d
DO meter, total dissolve solid was measured by
turbidity is measured by Nepthal
magnesium, total hardness, nitrate
suggested by APHA
(1984). Estimation of s
3.2 PHYSICAL AND CHEMICAL
Physico chemical analysis of water means analysis of water for physical and
chemical parameters. The
follows
3.2.1 METHODS FOR PHYSICAL PARAMETERS
3.2.1.1 Temperature Measurement
The temperature of water was measured by using centigrade thermometer
Procedure
Bulb ofthermometer
wasimmersed in
the water
Materials and Methods
were analyzed immediately at a time of collection, whereas the analyses of remaining
done in the laboratory.
The study was carried for a period of 1 year. (March 2009 to February 2010
The collected water samples were brought to the laboratory and relevant analysis was
performed. pH was determined electrometrically using digital pH meter
easured by conductivity meter, dissolved oxygen is measured by
otal dissolve solid was measured by using TDS meter and similarly
urbidity is measured by Nepthalo turbidity meter. Alkalinity, chloride, TDS, calcium
hardness, nitrate and phosphate were determined by method
APHA (1985); Kumar and Ravindranath (1998);
(1984). Estimation of sodium was done by Flame Photometric method.
AND CHEMICAL METHOD
sico chemical analysis of water means analysis of water for physical and
chemical parameters. The methods used here to check the status of the lakes are as
FOR PHYSICAL PARAMETERS
Temperature Measurement
The temperature of water was measured by using centigrade thermometer
About 6"below the
surface water
It was keptsteady for a
period ofsufficient time
Materials and Methods
Page 53
analyses of remaining
a period of 1 year. (March 2009 to February 2010).
The collected water samples were brought to the laboratory and relevant analysis was
ically using digital pH meter, electrical
xygen is measured by
using TDS meter and similarly
o turbidity meter. Alkalinity, chloride, TDS, calcium,
determined by method
Trivedy and Goel
odium was done by Flame Photometric method.
sico chemical analysis of water means analysis of water for physical and
methods used here to check the status of the lakes are as
The temperature of water was measured by using centigrade thermometer
Temperaturewas noted

3.2.1.2 Electrical Conductivity
EC was determined by using Conductivity meter, Model: EQ
of conductivity measurement is m.mho/cm.
Principle
Water usually
electric current through water. Hence, conductivity may be defined as the measure of
ability of aqueous medium to carry on electric current. Conductivity is totally
dependent upon concentrat
Conductivity is generally measured by conductivity meter which consist
conductance cells having electrode of platinum, these electrode are placed
fixed distance.
As the ionizations
the result is measured at 25
Procedure
Materials and Methods
3.2.1.2 Electrical Conductivity
EC was determined by using Conductivity meter, Model: EQ
of conductivity measurement is m.mho/cm.
Water usually consists of various types of ions, these ions help in passing the
electric current through water. Hence, conductivity may be defined as the measure of
ability of aqueous medium to carry on electric current. Conductivity is totally
upon concentration of ions.
Conductivity is generally measured by conductivity meter which consist
conductance cells having electrode of platinum, these electrode are placed
ionizations of solutes are totally dependent on tempe
the result is measured at 250C.
Conductivity cellwas rinsed by
using 0.01 M KCLsolution
Temperature wasadjusted to 25
Then cell constantwas computed.
Conductivity cellwas then rinsed
with sample
Temperature wasthen adusted to
250C
Reading wasnoted in mho/cm
Materials and Methods
Page 54
EC was determined by using Conductivity meter, Model: EQ – 660. The unit
of various types of ions, these ions help in passing the
electric current through water. Hence, conductivity may be defined as the measure of
ability of aqueous medium to carry on electric current. Conductivity is totally
Conductivity is generally measured by conductivity meter which consists of
conductance cells having electrode of platinum, these electrode are placed parallel at a
of solutes are totally dependent on temperature, therefore all
Temperature wasadjusted to 250C
Conductivity cellwas then rinsed
with sample
Reading wasnoted in mho/cm

Materials and Methods
Page 55
Method of calibration
1. Approx. method (accuracy 2% to 3%) for cell const. K = 1
only. The following method was proceed
The instrument was allowed to warm up for 15 minutes.
The range switch was thrown in 2mM position (indicated by arrow).
Bring in standard conductance of 1.00mM by throwing the switch
down in EQ-660.
Now with the help of screwdriver turn the standardize shaft was turned
till the Digital display reads 1.000
Throw the standard cond. Switch up
The instrument is now ready for use.
2. Accurate Method (0.5% to 1% accuracy)
KCl Sol was prepared and was allowed to attain the room/ desired
temperature. The solution so prepared is temperature dependant
The cell K = 1 was dipped in the solution
The range switches in appropriate position so that full range of display
is read.
The std. cond. was checked and the switch is in upward position.
The standardize shaft was turned with screwdriver till the display reads
the correct conductance of the solution. The temperature effect has to
be considered.
The instrument thus calibrated also accounts for deviation in cell
constant to the extent of 10% K = 0.5 can also be used in this method.

Materials and Methods
Page 56
3.2.1.3 Turbidity
Turbidity of water sample was measured by using Digital Nephlo – Turbidity
meter, Model: 132 (Systronics)
Principle
In this method, when light is passed through a turbid sample , the particles
present in sample scatter some of the light and the light scattered is directly
proportional to the turbidity i.e. higher the turbidity, higher will be the light scattered,
the amount of light scattered by the sample is compared with the intensity of light
scattered by a standard suspension.
Turbidity can be determined for any kind of water sample, but it should be
debris and rapidly settable particles.
Apparatus and reagent preparation
(a) Nepthelometer
(b) Sample tubes: Should be free from any scratch
(c) Stock turbidity suspension
I. 1.0 gm of hydrazine sulphate (NH2)2, H2SO4 was dissolve in distilled
water to prepare 100 ml of solution using volumetric flask
II. 10.0 gm hexamethyline tetramine (CH2)6N4, was dissolve in distilled
water to prepare 100 ml of solution in volumetric flask
III. 5 ml of solution (I) and 5 ml of solution (II) were mixed and was allow
to stand for one day at 250C, then it was diluted to 100 ml. Therefore
standard suspension of 400 NTU (Nephelometric turbidity unit) is
prepared. This solution is stable up to one year.
(d) Standard turbidity suspension: 40 NTU solutions were prepared by diluting 10
ml of stock solution to 100 ml.

Procedure
3.2.1.4 Total Dissolved Solid
Total dissolved
is determined as the residue left after evaporation of filtered water at 103
suspended solids are the solids present in a suspended state.
Instrument was setto 100 by using
standardsuspension of 40
Outer surface of thesample tube wascleaned by using
tissue paper .
Reading was notedin NTU.
Calculation
Turbidity (NTU) = Nephelometer reading x 0.4 x dilution factor
Materials and Methods
Total Dissolved Solid
Total dissolved solid s are the solids present in water in the dissolved state and
is determined as the residue left after evaporation of filtered water at 103
suspended solids are the solids present in a suspended state.
Instrument was setto 100 by using
standardsuspension of 40
NTU.
Sample was addedin Sample tube
Outer surface of thesample tube wascleaned by using
tissue paper .
Sample tube wasthen put inside the
nepthelometer
Reading was notedin NTU.
Turbidity (NTU) = Nephelometer reading x 0.4 x dilution factor
Materials and Methods
Page 57
solid s are the solids present in water in the dissolved state and
is determined as the residue left after evaporation of filtered water at 1030C. Total
Sample was added
Sample tube wasthen put inside the
Turbidity (NTU) = Nephelometer reading x 0.4 x dilution factor

Materials and Methods
Page 58
Procedure
Calibration Method
Preparation of solution having 1382 ppm TDS:
The 20 ml sachet of HI70032 is dissolved in 1000 ml of distilled water to
prepare solution having TDS value 1382 ppm.
The TDS meter was immersed in the solution.
Then it was allowed to stand until it achieves stable reading.
Then with the help of small screw driver the calibration trimmer was adjusted,
till the display shows the reading of 1382 ppm.
Now the instrument is ready for use.
After calibrating theinstrument.
Water Sample was collectedin the Glass beaker.
TDS meter was thenimmeresed into this water
sample.
It was allowed to stand untilit achieves stable reading.
Reading was noted in ppm.

Materials and Methods
Page 59
3.2.2 METHODS FOR CHEMICAL PARAMETERS
3.2.2.1 pH Measurement
The pH of the sample was determined by digital pH meter Model: 511
(Testronics).
Instrument Calibration
The combination electrode was cleaned with distilled water observing proper
safety precautions
The combination electrode was connected to the meter
The temperature pot was kept on the temperature of the solution under test and
switch (mv/pH) on mv position.
The unit was switched on and was checked weather the led glows.
The electrode was dipped in the reference standard solution of 7 pH (pure
water)
The STAD pot was set and was adjusted so that digital indicator show zero.
Now mv/pH switch position was changed to pH, the digital indicator will read
7 pH.
The electrode was cleaned with distilled water.
The electrode was kept in 4 pH (reference standard solution) solutions. The
digital indicator read 4 pH. If not the slope and pot was adjusted so that the
digital indicators read 4 pH.
Corresponding mv readout was checked for reference.
Now the digital pH meter is ready to measure any solution
Between 0-14 pH at any temperature between 0 to 100oC

The electrode was cleaned with distilled water.
The temperature adjust pot was kept to the temperature of the solution under
test. And no change was made STAD adjust pot and slope adjusts pot.
Procedure
3.2.2.2 Total Alkalinity
Total alkalinity is the measure of the capacity of the water to neutralize a
strong acid. The alkalinity in the water is generally imparted by the salt of the
carbonates, bicarbonates, phosphates, nitrates, borates, silicates, etc. together
hydroxyl ions in the Free State. However, most of the ware is rich in carbonates and
bicarbonates with little concentration of other alkalinity imparting ions
alkalinity, carbonates and bicarbonates can be estimated by titrating the sample w
strong acid (HCl or H2
then further to pH between 4.2 and 5.4 with methyl orange or mixed indicator. In first
case, the value is called as phenolphthalein alkalinity (PA) and in second
pH meter was calibratedby following
manufacturer manual.
Half of the electrode wasthen dipped into sample
Materials and Methods
The electrode was cleaned with distilled water.
The temperature adjust pot was kept to the temperature of the solution under
test. And no change was made STAD adjust pot and slope adjusts pot.
l Alkalinity
Total alkalinity is the measure of the capacity of the water to neutralize a
strong acid. The alkalinity in the water is generally imparted by the salt of the
carbonates, bicarbonates, phosphates, nitrates, borates, silicates, etc. together
hydroxyl ions in the Free State. However, most of the ware is rich in carbonates and
bicarbonates with little concentration of other alkalinity imparting ions
alkalinity, carbonates and bicarbonates can be estimated by titrating the sample w
2SO4), first to pH 8.3 using phenolphthalein as an indicator and
then further to pH between 4.2 and 5.4 with methyl orange or mixed indicator. In first
case, the value is called as phenolphthalein alkalinity (PA) and in second
pH meter was calibratedby following
manufacturer manual.
Electrode was made dryby using tissue paper.
Half of the electrode wasthen dipped into sample
water.pH was noted.
Materials and Methods
Page 60
The temperature adjust pot was kept to the temperature of the solution under
test. And no change was made STAD adjust pot and slope adjusts pot.
Total alkalinity is the measure of the capacity of the water to neutralize a
strong acid. The alkalinity in the water is generally imparted by the salt of the
carbonates, bicarbonates, phosphates, nitrates, borates, silicates, etc. together with the
hydroxyl ions in the Free State. However, most of the ware is rich in carbonates and
bicarbonates with little concentration of other alkalinity imparting ions Total
alkalinity, carbonates and bicarbonates can be estimated by titrating the sample with a
), first to pH 8.3 using phenolphthalein as an indicator and
then further to pH between 4.2 and 5.4 with methyl orange or mixed indicator. In first
case, the value is called as phenolphthalein alkalinity (PA) and in second case; it is
Electrode was made dryby using tissue paper.
pH was noted.
Materials and Methods
Page 61
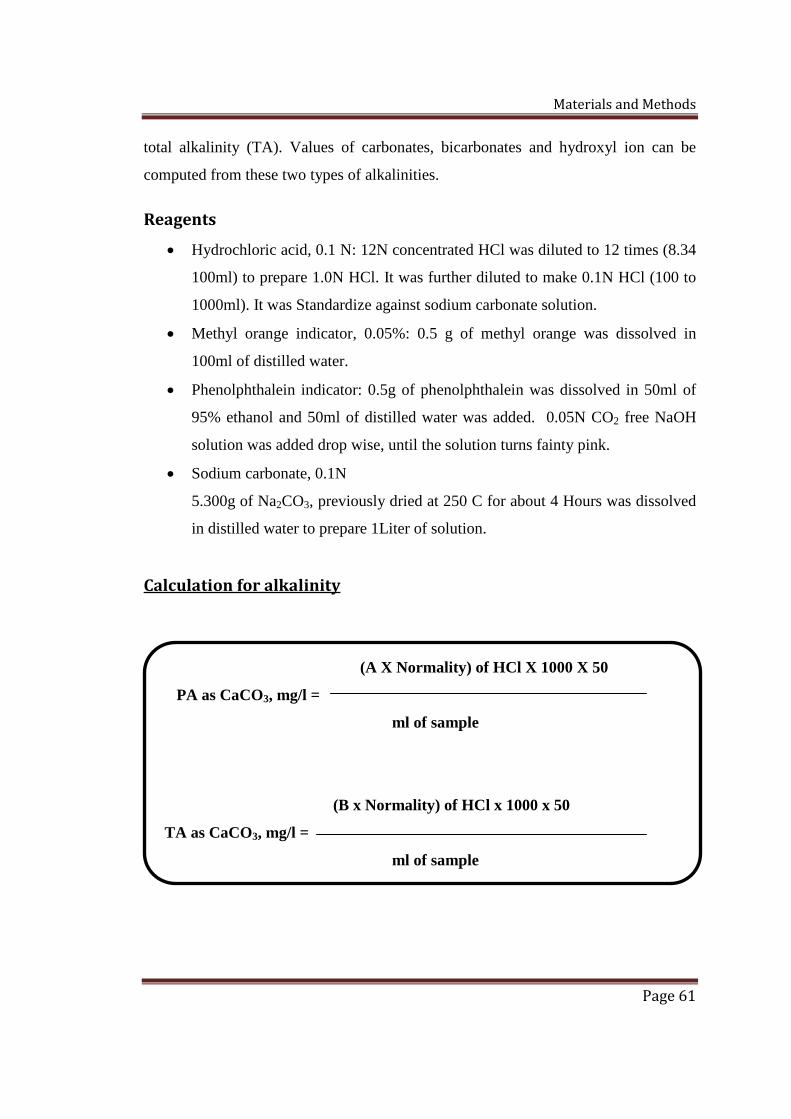
total alkalinity (TA). Values of carbonates, bicarbonates and hydroxyl ion can be
computed from these two types of alkalinities.
Reagents
Hydrochloric acid, 0.1 N: 12N concentrated HCl was diluted to 12 times (8.34
100ml) to prepare 1.0N HCl. It was further diluted to make 0.1N HCl (100 to
1000ml). It was Standardize against sodium carbonate solution.
Methyl orange indicator, 0.05%: 0.5 g of methyl orange was dissolved in
100ml of distilled water.
Phenolphthalein indicator: 0.5g of phenolphthalein was dissolved in 50ml of
95% ethanol and 50ml of distilled water was added. 0.05N CO2 free NaOH
solution was added drop wise, until the solution turns fainty pink.
Sodium carbonate, 0.1N
5.300g of Na2CO3, previously dried at 250 C for about 4 Hours was dissolved
in distilled water to prepare 1Liter of solution.
Calculation for alkalinity
(A X Normality) of HCl X 1000 X 50
PA as CaCO3, mg/l =
ml of sample
(B x Normality) of HCl x 1000 x 50
TA as CaCO3, mg/l =
ml of sample

Materials and Methods
Page 62
Procedure for Alkalinity
100ml of sample was taken in aconical flask
2 drops of phenolphthalein indicator.was added
The solution remaincolourless
Colour changes topink
PhenophthaleinAlkalinity = 0
Titrated with 0.1NHCl
2-3 drops of methylorange was added
Colour disappears atend point
Titrated with 0.1NHCl
The reading wasnoted as A
Colour changes fromyellow to pink at end
point
The reading wasnoted as B

Materials and Methods
Page 63
Where
A = ml of HCl used with only phenopthalein
B = ml of total HCl used with phenopthalein and methyl orange,
PA = phenopthalein alkalinity
TA = total alkalinity
3.2.2.3 TOTAL HARDNESS
Ethylene diamine tetra acetic acid (EDTA) and its sodium salt form a chelated
soluble complex when added to a solution of certain metal cations. Additional of
small amount of a dye such as Erichrome Black T to an aqueous solution of calcium
and magnesium ions of pH 10.0, turns the solution wine red. When EDTA is added as
titrant, the calcium and magnesium get complexed and the colour of the solution turns
from wine red to blue, marking the end point of the titration. This on calculating using
the formula gives the total hardness.
Metal + Indicator Metal-Indicator (complex).
Metal-Indicator + EDTA Metal-EDTA (Complex) + Indicator.
Reagent Preparation
Buffer Solution: 16.9 gm of ammonium chloride was dissolved in 143ml
ammonium hydroxide, 1.25 gm of magnesium EDTA was added and diluted
to 250 ml by using distill water.
Inhibitor: 4.5 gm of hydroxyl amine hydrochloride was dissolved in 100 ml
of 95% ethanol or isoprophyl alchol.
Eriochrome Black T indicator: 0.5 gm of the dye was mixed with 100 gm of
sodium chloride, to prepare a dry powder.
Murexide Indicator: 200 mg of murexide and 100 gm of solid sodium
chloride were grinded and mixed.
2 N Sodium hydroxide: 80 gm of sodium hydroxide was dissolved in distilled
water and was diluted to 1000 ml.

Materials and Methods
Page 64
0.01 M Standard EDTA solution: 3.723 gm of EDTA sodium salt was
dissolved and was diluted to 1000 ml in a volumetric flask.
Procedure
50 ml of water sample2 ml of buffer
solution.
1 ml of inhibitor.Pinch of Erichrome
Black T as indicator.
Titrated againstStandard EDTA (0.01
M) solution.
Colour changes fromwine red to blue.
Volume of EDTA Usedwas Noted as A ml.
Calculation
A X 1000Total Hardness mg/l as CaCO3 =
Volume of sample taken (in ml)

Materials and Methods
Page 65
3.2.2.4 Calcium
When the pH is adjusted to 12 or 13 by addition of sodium hydroxide,
magnesium is precipiated as hydroxide. The Murexide indicator gives a colour
change from pink to purple when all the calcium has been complexed.
Reagent preparation
(Same as in Total Hardness)
Procedure
50 ml of watersample.
1 ml of 2 N NaOH.Pinch of
murexideindicator
Titrated againstEDTA.
Colour changesfrom pink to
purple.
Note down thevolume of EDTArequired (A ml).
CalculationA x 1000 ml
Calcium hardness =mg/l as CaCO3 Volume of water sample taken in ml
A x 400.8Calcium mg/l =
Volume of water sample taken in ml
Materials and Methods
Page 66
3.2.2.5 Magnesium
Like calcium magnesium is also found in all natural waters and its sources are
from rocks. Its generally occurs in concentrations lower than those of calcium.
Magnesium is a necessary constituent of chlorophyll. Its high content reduces the
utility of water for domestic use. A concentration above 500 mg/l imparts an
unpleasant taste and renders the water unfit for drinking purposes.
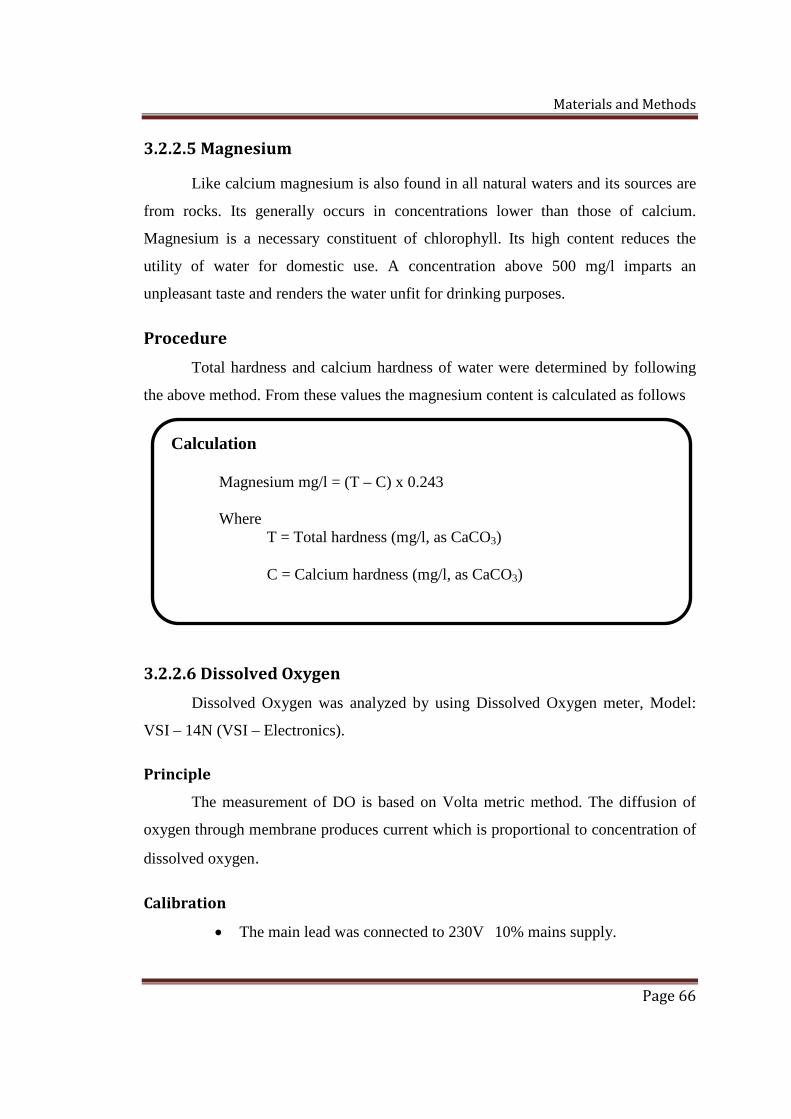
Procedure
Total hardness and calcium hardness of water were determined by following
the above method. From these values the magnesium content is calculated as follows
3.2.2.6 Dissolved Oxygen
Dissolved Oxygen was analyzed by using Dissolved Oxygen meter, Model:
VSI – 14N (VSI – Electronics).
Principle
The measurement of DO is based on Volta metric method. The diffusion of
oxygen through membrane produces current which is proportional to concentration of
dissolved oxygen.
Calibration
The main lead was connected to 230V 10% mains supply.
Calculation
Magnesium mg/l = (T – C) x 0.243
WhereT = Total hardness (mg/l, as CaCO3)
C = Calcium hardness (mg/l, as CaCO3)

Materials and Methods
Page 67
A 200 ma fused was provided at the rear panel for the safety of a
circuit.
The display was adjusted to zero with ‘ZERO’ knob.
The DO probe was connected in the DO sockets provide in the rear
side of the instrument.
The probe was put in 1-2% Sodium Sulphite Na2 S03 solution and
allows about 2 minutes to attain equilibrium.
The instrument read zero or up to 0.2ppm. The probe is good enough.
If it does not become zero, it was adjusted to zero by using ‘ZERO’
knob.
The DO probe was dipped in double distilled water after washing it
thoroughly with distilled water.
Referring to the value of DO in distilled and with the help of ‘CALIB’
knob. The reading was adjusted to the proper value when the sample is
being stirred at continues speed.
Now the instrument was calibrated.
Procedure
After completionof calibration.
Water sample wastaken in a BOD
bottle.
The temperatureof water sample
was noted.
Now DO problewas dipped in the
sample waterstirred by
magnetic stirrer.
The displayshowing reading
was noted.
This was theamount of DO
recorded.

Materials and Methods
Page 68
3.2.2.7 Biochemical Oxygen Demand (BOD)
Principle
Biochemical Oxygen Demand (BOD) is the measure of degradable organic
material present in the water sample, and can be defined as the amount of oxygen
required by the microorganisms in stabilizing the biological degradable organic matter
under aerobic conditions.
The principle of the method involves, measuring the difference of the oxygen
concentration between the sample and after incubating it for 5 days at 20 C
Reagents Preparation
BOD-free water: Double distill water was used
BOD Incubators: Having a temperature control at 20 0C
Phosphate buffer: 8.5 gm KH2PO4, 21.75 gm K2HPO4, 33.4 gm
Na2HPO4.7H2O and 1.7gm NH4Cl was dissolved in distilled water to prepare
1 liter of solution. pH was adjusted to 7.2.
Magnesium Sulphate: 22.5 gm MgSO4.7H2O was dissolved in distilled water
to prepare 1 liter of solution
Calcium Chloride: 27.5 g of anhydrous CaCl2 was dissolved in distilled water
to prepare 1 liter of solution.
Ferric chloride: 0.25 g FeCl3 6H2O distilled water was dissolved to prepare 1
liter of solution.
Allylthiourea solution: 100 mg of allylthiourea was dissolved in distill water
and was diluted to 100 ml.
Sodium Sulphite Solution, 0.025 N: 1.575 g Na 2SO4 was dissolved and was
diluted to 1000 ml. Solution was freshly prepared.
Preparation of dilution water: Dilution water was used to dilute water sample,
containing large amount of organic matter and do not contain dissolved
oxygen. Initially the BOD free double distilled water was aerated for about
half an hour using an aerator. Then 1 ml of phosphate buffer, magnesium

Materials and Methods
Page 69
sulphate, calcium chloride and ferric chloride solution was added to 1000 ml
aerated distilled water This is dilution water.
Preparation of Percentage Dilution of Polluted Water
SamplePercentage
dilution
Dilution mixture
Water sample
ml
Dilution water
ml
Total
ml
Polluted
waters
50 500 ml 500 ml 1000 ml
25 250 ml 750 ml 1000 ml
20 200 ml 800 ml 1000 ml
10 100 ml 900 ml 1000 ml
Procedure
Water sample wasdiluted by dilutionwater if required.
The pH of watersample was
adjusted to 7.0 byusing acid or base.
Two BOD bottlewere filled by this
sample water.
1 ml ofallylthiourea
solution was addedto each bottle.
Dissolved oxygenof one bottle was
analysed.It was noted as D1.
Second bottle waskept in BOD
incubator at 200Cfor 5 days.
Other two BODbottles were filled
with dilutionwater.
Dissolved oxygenof one bottle of
dilution water wasnoted immediately.
Second bootle wasalso incubated for
5 days at 200C.
Dissolved oxygenfor sample waterwas noted as D3.
Dissolved oxygenfor dilution water
was also noted.

Materials and Methods
Page 70
Calculation
3.2.2.8 Chloride
Principle
Silver nitrate reacts with chloride to form very slightly soluble white
precipitate of AgCl. At the end point when all the chlorides get precipitated, free
silver ion reacts with chromate of reddish brown colour.
Reagent preparation
Potassium chromate indicator: 25 gm of potassium chromate was dissolved in
100 ml distilled water. Then silver nitrate solution was added to it until a
definite red precipitated get formed. Then it was kept for 12 hours. After that it
was diluted to 500 ml by using distill water.
0.0282 N Silver nitrate solution: 4.791 gm of silver nitrate was dissolved in
distilled water and was diluted to 1000 ml.
(D1 – D3 – BC) x 100
BOD (mg/l) =
Percentage dilution of sample
Where
D1 = Initial dissolved oxygen in sample (mg/l).
D3 = Dissolved oxygen left out in the sample after 5 days of
incubation (mg/l).
BC (Blank Correction) = Difference between the DO
content of the blank on initial day and after 5th day of
incubation

Materials and Methods
Page 71
0.0282 n Sodium chloride: 1.648 mg sodium chloride was dissolved in
distilled water and was diluted to 100 ml. 1.0 ml of this solution contain 1.0
mg of chloride.
Procedure
Calculation
100 ml of watersample was taken.
pH was adjustedbetween 7.0 and 8.0.
Add 2 ml K2CrO4 asindicator
Titrated againstsilver nitrate.
Brick red precipitateformed.
Volume of silvernitrate used wasnoted as A (ml).
(A – B) x N x 35.45 x 1000
Chloride mg/l =
Volume of sample (ml)
Where
A= ml of AgNO3 required for titration
N= Normality of AgNO3 used.
35.45= Equivalent weight of chloride and the factor of 1000
is for conversion to one liter

Materials and Methods
Page 72
3.2.2.9 Sodium
Flame Photometric Method
Principle
Sodium can be determined by using flame photometer at 589nm. When
sample is produced in flame it comes to excitation condition and produce
characteristic light. The light intensity at 589nm is proportional to concentration of
sodium which can be read by using light dispersion devices.
Reagents
Stock sodium solution (100 mg/L Na): 2.542 g NaCl dried at 1400C was
dissolved in distilled water to make one liter of a solution (1 ml = 1.00 mg
Na).
Intermediate sodium solution: 10 ml of stock solution was dissolved in
distilled water and make volume to 100 ml. (1 ml. = 0.10 mg Na)
Nitric acid: HNO3 concentrated.
Hydrochloric acid: HCl concentrated.
Hydrogen peroxide: H2O2, 30%
Ammonium hydroxide: NH4OH concentrated.
Preparation of calibration curve
1. The following procedure was used for pretreatment of the sample The sample
of suitable size in a 250 ml conical flask was taken and was acidify it with
nitric acid. It was evaporated to dryness on a water bath. Again 25ml of
concentrated HNO3 was added to boil until the acid was evaporated to small
volume. The presence of brown fumes indicates the un oxidized organic
matter. Now some more conc. HNO3 and small quantities of H2O2 was added
for complete ashing of organic matter. The final residue is colourless on
drying. The presence of more iron and copper salts may impart a colour to it.
The residue in small amount of HCl and distilled water was warmed. The

Materials and Methods
Page 73
content was filtered and was neutralize with conc. NH4OH. It was diluted to
suitable volume.
2. For non polluted samples or the sample where only dissolved sodium is to be
estimated, the sample was through a filter paper to remove any suspended
matter which otherwise may clog the capillary of the instrument.
3. Calibration curve was prepared in the range of 0 – 1, 0 – 10 or 0 – 100 mg/l,
by using standard sodium solution.
Procedure
Calculation
After calibrating theinstrument.
Suitable amount ofsample was filtered to
remove suspendedmatter.
By using flamephotometer
concentration of sodiumwas recorded.
Calibration curve wasprepared by following
the instruction providedby manufacturer
Sodium was determinedby using calibration
curve.
Sodium mg/l = (mg Na/l in sample) x dilution ratio

Materials and Methods
Page 74
3.2.2.11 Nitrates
Principal
Nitrate when reacts with brucine produces yellow colour is presence of H2SO4
this can be measured spectrophotometrically at 410nm.
Apparatus
Spectrophotometer, nessler tubes, test tubes, 100 ml beakers, water bath
measuring cylinder, physical balance and pipettes.
Preparation of Reagents
Nitrate Stock solution : 722 mg anhydrous potassium nitrate was dissolved in
100 ml distilled water and final volume was made 100 ml in a volumetric
flask
1 ml of this solution will contain 0.1 mg nitrate nitrogen
Standard nitrate solution: 100 ml. nitrate stock solution was prepared in a
1000ml volumetric flask and the level was made up to 1000 ml.
1 ml of this solution will contain 0.01 mg nitrate nitrogen.
Brucine-sulfanilic acid solution: 1 gm of brucine sulphate and 100 mg.
sulfanilic acid was dissolved in 70 ml. hot distilled water. 3 ml. concentrated
HCl was added to this solution. The solution was cooled and was dilute to 100
ml with distilled water. This solution was stable for several months.
Sulphuric acid solution: 500 ml of conc. sulphuric acid was added to 75 ml
distilled water carefully. Then it is cooled at room temperature. Toxic, avoid
ingestion
Sodium Arsenite solution: 1.83 gm of sodium arsenite (NaAsO2) was
dissolved in 100 ml distilled water.
Sodium Chloride solution: 300 gm NaCl was dissolved in distilled water and
was diluted to 1000 ml.

Materials and Methods
Page 75
Procedure
Preparation of Standard Curve
Into a series of 50 ml. nessler tubes, 0.5, 1.0, 1.5, 2.0, 2.5, 3.0, 3.5, 4.0, 4.5, 5.0
ml of nitrate standard solution was pipetted .The volume was made to 5 ml in
each tube by adding the appropriate volume of distilled water. The standards
were labeled.
A beaker containing 5 ml of distilled water was taken as a blank.
2ml of sample wastaken in 50 mlnessler tube.
1 ml of Brucinesulfanilic acid
solution was addedand was mixed nicely.
10 ml of sulphuricacid was added and
was mixed nicely.
Then it was kept indark for 10 minutes
10 ml of distill waterwas added.
Then it was kept indark for 20 to 30
minute
Absorbance wasmeasured at 410 nm.
By using standardcurve concentrationof nitrate nitrogen in
sample wascalculated.

Materials and Methods
Page 76
1 ml of brucine sulfanilic acid solution was added to the blank and standard,
then they were mixed nicely.
10 ml of sulphuric acid was carefully added to each nessler tube and was
nicely mixed.
.The nessler tubes were kept in the dark for 10 minutes.
10 ml of distilled water was added to each of the standards and blank.
Then all the nessler tubes were kept in the dark for 20 to 30 minutes.
The blank was used to set the spectrophotometer or colorimeter at 100 %
transmittance at a wave length of 410 nm.
The absorbances of the standards were measured.
After that standard curve was prepared to find out the concentration of nitrate
nitrogen in sample.
Calculation
3.2.2.12 TOTAL PHOSPHATE
Principal
Organic phosphorus is converted to orthophosphates by heating or by
persulphate digestion while inorganic phosphates are converted to orthophosphates by
H2SO4 digestion. The phosphates thus released can be determined calorometrically
mg nitrate nitrogen x 1000 mg/l nitrate nitrogen =
Volume of sample taken for estimation (in ml)
Nitrate in mg/l = mg/l nitrate nitrogen x 4.43

Materials and Methods
Page 77
Chemical
Potassium dihydrogen phosphate (KH2PO4), ammonium molybdate,
concentrated sulphuric acid, stannous chloride (SnCl2.2H2O), glycerol, concentrated
nitric acid and distilled water, phenolphthalein, Sodium hydroxide and
phenolphthalein indicator
Apparatus
Spectrophotometer or colorimeter, volumetric flasks, beakers, test tubes,
nessler tubes, glass rod, measuring cylinder, physical balance, kjeldahl flask, burette,
bunsen burner, tripod stand and wire gauze.
Preparation of reagents
Stock phosphate solution: 439 mg of potassium hydrogen phosphate was
dissolved in distilled water and the volume was made to 1000ml. 1 ml = 100
microgram of phosphate or 0.1 mg of phosphate.
Phosphate working solution: 10 ml stock solution was diluted to 1000 ml
using distilled water. This solution was freshly prepared. 1 ml = 1 microgram
of phosphate or 0.001 mg of phosphate.
Ammonium molybdate solution: 25 gm of ammonium molybdatewas
dissolved in about 200 ml distilled water. 280 ml of concentrated sulphuric
acid was added to 400 ml distilled water. To the dilute acid, molybdate
solution was added to make final volume 1000 ml.
Strong acid reagent: Carefully add 75 ml concentrated sulphuric acid to 150
ml distilled water. 2 ml of concentrated nitric acid, was added, allowed to cool
and 250 ml was diluted with distilled water.
Stannous chloride: 2.5 gm of stannous chloride was dissolved in 100 ml of
glycerol. This was heated on a water bath to insure complete dissolution. It
was mixed well by stirring with a glass rod.
1 N sodium hydroxide: 40 gm of sodium hydroxide pellets was dissolved in
about 200 ml of distilled water. And total volume was made to 1000 ml in a
volumetric flask.

Materials and Methods
Page 78
Phenolphthalein: It was prepared as it was prepared in the section of the
alkalinity measurement.
Procedure
Preparation of Standard Curve
1. Appropriate amounts of phosphate working solution were pippeted to cover
the range of 0.3 to 1.5 mg/l into the series of 100 ml nessler tubes. These tubes
serve as standards. A nessler tube containing 100 ml distilled water was
included as the blank.
100 ml of thesample was takenin a kjeldahl flask.
1 ml of conc.sulphuric acid and5 ml of conc. nitric
acid was added.
The sample washeated until thesolution become
colourless.
It was Cooled.
20 ml of distilledwater and 2 drops of
phenolphthaleinindicator was added.
Titrated againstsodium hydroxide
until the appearanceof pale pink colour.
The solution wastransfer to the 100ml of volumetric
flask and was diluteup to the mark.
4 ml of ammoniummolybdate solutionwas added and was
mixed well.
0.5 ml of stannouschloride was added.
After 10 to 12minutes colour
developed.
OD was measuredat 690nm using
spectrophotometer.
Comparing the valuewith standard curve.phosphorus content
can be found

Materials and Methods
Page 79
2. To the standards and blank 4 ml of ammonium molybdate solution was added
and was mixed well.
3. 0.5 ml of stannous chloride was added to all the tubes and was mixed well
4. It takes 10 – 12 minutes for the development of colour.
5. The spectrophotometer or colorimeter was calibrated using the blank solution
and distilled water.
6. The intensity of blue coloured complex at 690 nm using a spectrophotometer
was measured.
7. A standard curve was prepared by plotting the phosphate concentration of the
standard solution on the x axis and the optical density on the y axis.
8. The phosphorous content of the sample was found by matching its absorbance
(S) with the standard curve.
9. The result was expressed as mg phosphate as phosphorous. If it has to be
expressed in term of Phosphates multiply by a factor of 3.066.
Calculation
Phosphate mg/l = phosphorus mg/l x 3.066

Materials and Methods
Page 80
3.3 BOTANICAL METHOD
The physical and chemical characteristics of water affect the abundance,
species composition, stability and productivity of the indigenous populations of
aquatic organisms. The botanical methods used for assessing water quality include
collection, counting and identification of phytoplankton. The work involving
phytoplankton analysis would help in:
Explaining the cause of colour and turbidity and the presence of objectionable
odour, tastes and visible particles in waters.
The interpretation of chemical analyses.
Identifying the nature, extent and biological effects of pollution.
3.3.1 Phytoplankton net
The phytoplankton net is a field-equipment used to trap phytoplankton. It has
a polyethylene filter of a defined mesh size and a graduated measuring jar attached to
the other end. A handle holds the net. The mesh size of the net determines the size
range of the plankton trapped
3.3.2 Sampling Procedure
Plankton net number 25 of mesh size 20 μm was used for collecting samples.
100 liters of water was measured in a graduated bucket and filtered through the net
and concentrated in a 100 ml bottle. Samples were collected as close to the water
surface as possible in the morning hours and preserved for further analysis.
3.3.3 Labelling
The samples were labeled with the date, time of sampling, study area-lake
name and the volume measured and pasted on the containers.
3.3.4 Preservation of the sample
Between the time that a sample is collected in the field and until its analysis in
the laboratory, physical, chemical and biochemical changes may take place altering
the intrinsic quality of the sample. It is therefore necessary to preserve the samples

Materials and Methods
Page 81
before shipping, to prevent or minimize changes. This is done by various procedures
such as keeping the samples in the dark, adding chemical preservatives, lowering the
temperature to retard reactions by freezing or by a combination of these methods. For
a phytoplankton sample to be analyzed for an extended period, commonly two
preservatives are used: Lugol’s iodine using acetic acid which will stain cells
brownish yellow and will maintain cell morphology and of 4% formaldehyde.
Preparation of Lugol Solution.: 100 gm of KI and 5 gm Iodide crystals were
dissolved in 20 ml of distilled water. then 5 gm of anhydrous sodium acetate
was dissolved in 50 ml distilled water now both of this were mixed and Lugol
solution get prepared. 0.5 ml of lugol should be added to preserve 100 ml of
sample
Prparation of 4% Formaline: 4 ml of concentrated formalin was diluted to 100
ml with distill water.
3.3.5 Concentration technique
The phytoplankton nets were used to collect samples for the quantitative
estimation, by filtering a known volume of water (100 litres) through the net. The
sample was allowed to settle for 24-48 hours and was further concentrated to
approximately 30 ml by decanting. The concentration factor is used during the
calculations.
3.3.6 Qualitative and quantitative analysis of phytoplankton
Detailed analyses of phytoplanktonic populations are done by estimating the
numbers in each species. The phytoplankton consisting of individual cells, filaments
and colonies are counted as individual cells. When colonies of species are counted,
the average number of cells per colony is counted, and in filamentous algae, the
average length of the filament has to be determined.
Device used for this analysis is Sedgwick Rafter counting cell. Sedgwick Rafter cell is
approximately 50 mm long, 20 mm wide and 1 mm deep. The total volume of the cell
is 1 ml.

Materials and Methods
Page 82
3.3.7 Mounting the slides
Concentrated samples in a bottle are mixed uniformly by gentle inversion.
Then by using bore pipette 1 ml of sample was transfer on Sedgwick Rafter count
cell. Now it was covered by using cover slip, avoiding any kind of air bubble. Then it
was kept for 10-15 minutes so that all plankton may settle down. Now the Sedgwick
rafter counting cell is placed under microscope and then plankton was counted by
moving the cell horizontally and vertically. The process was repeated twice.
3.3.8 Microscope
A binocular compound microscope is used in the counting of plankton with
different eyepieces such as 10X and 40X. The microscope is calibrated using an
ocular micrometer.
3.3.9 Procedure for Plankton Measurement
100 liter of waterwas filtered through
plankton net.
Suitable amount ofpreservative was
added in thecollected samples.
The sample wasallowed to settle for
24-48 hours.
Furtherconcentrated to
approximately 30 mlby decanting.
1 ml ofconcentrated
sample was addedto sedgwick Rafter
counting cell.
The cell wascounted by moving
the cellhorizontally and
vertically.
The observednumber of planktonwas then applied to
the formula.

Materials and Methods
Page 83
3.3.10 Phytoplankton Identification
From the concentrated sample, the slides for the plankton were prepared. Then
these slides were placed under microscope, and the phytoplanktons were observed in
100 X in binocular microscope. The images of the phytoplankton were captured by
using digital camera. Later on the phytoplankton were identified by using the book “
The Fresh Water Algae” by Prescott (1970).
The status of the water can be evaluated by performing all the above methods-
physical, chemical and botanical. The result are then compared with the WHO and
BIS standard and on the basis of this the quality of water can be judged. And presence
of some algal blooms also shows the richness of the nutrient in the water.
Formula =
where,n = Number of plankton / liter of water.a = Average no of plankton in one small counting chamber of S-R cell.c = ml of plankton concentrate.l = Volume of original water filtered in litre.
(a x 1000) cn =
l
Materials and Methods
Page 84
3.4 Correlation
It is essential to understand the relationship between different water quality
parameter when the study is completed.
3.3.1 Relationship between the parameters (Correlation)
Any relationship between the two variable is known as correlation. If one
variable increases or decreases with a corresponding increase or decrease of the other
variable, a direct positive correlation exists between the two variables. If one variable
decrease with an increase in the other variable, then there is a negative or inverse
correlation. There are two different methods to study correlation
3.3.1.1 Graphic method
It is the simplest method of showing the relationship between two variable . in
this one variable is represented on X-axis and other variable on Y-axis on graph
paper. Data corresponding to X and Y axis were plotted in form of dots. And then
estimated lines joining first and last points was drawn on the graph paper to find out
correlation.
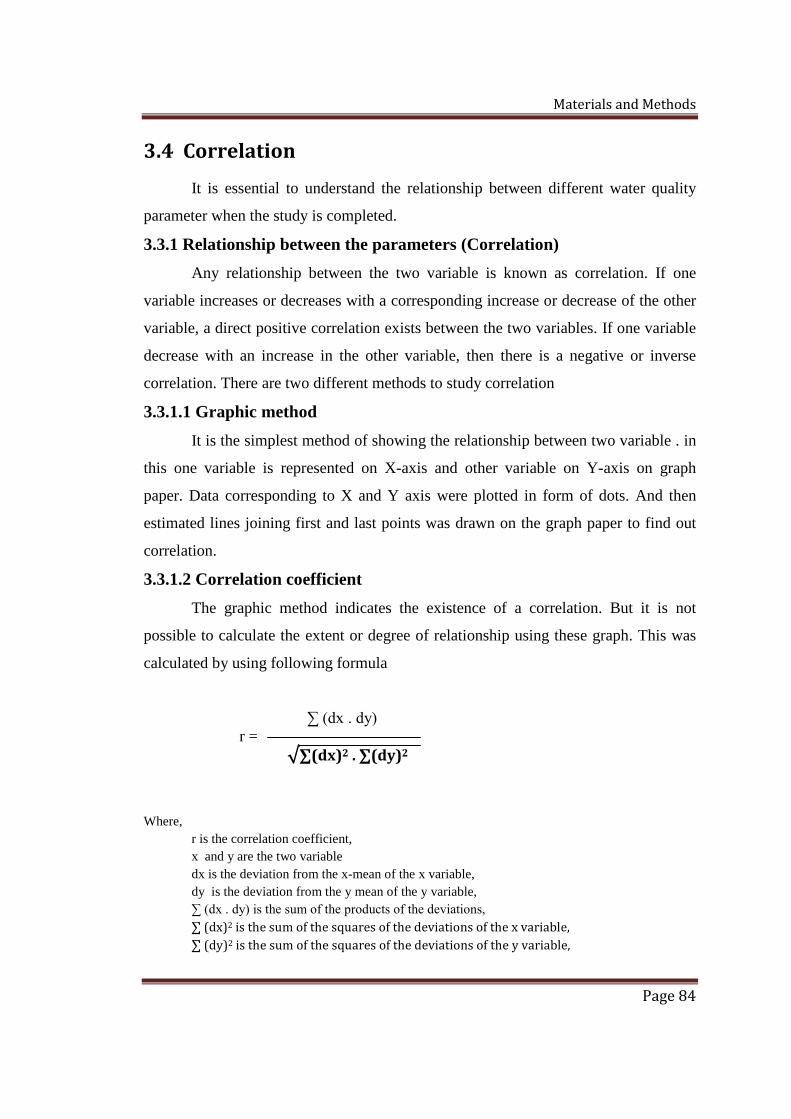
3.3.1.2 Correlation coefficient
The graphic method indicates the existence of a correlation. But it is not
possible to calculate the extent or degree of relationship using these graph. This was
calculated by using following formula
∑ (dx . dy) r =
√∑(dx)2 . ∑(dy)2
Where,
r is the correlation coefficient,
x and y are the two variable
dx is the deviation from the x-mean of the x variable,
dy is the deviation from the y mean of the y variable,
∑ (dx . dy) is the sum of the products of the deviations,
∑ (dx)2 is the sum of the squares of the deviations of the x variable,
∑ (dy)2 is the sum of the squares of the deviations of the y variable,

Materials and Methods
Page 85
The variable in table were written in short form, its full form were as follows
TEMP = TEMPERATURE
EC = ELCTRICAL CONDUCTIVITY
TUR = TURBIDITY
TDS = TOTAL DISSOVED SOLIDS
ALK = ALKALINITY
TH = TOTAL HARDNESS
CAL = CALCIUM
MAG = MAGNESIUM
DO = DISSOLVED OXYGEN
BOD = BIOCHEMICAL OXYGEN DEMAND
Cl = CHLORIDE
Na = SODIUM
NO3 = NITRATE
PO4 = PHOSPHATE
CYN = CYANOPHYCEAE
CHL = CHLOROPHYCEAE
BAC = BACCILARIOPHYCEAE
EUG =EUGLENOPHYCEAE
The correlations were done seasonally for 13 different lakes. All the 19
parameters were correlated with each other to check there relationship.