materials world modules - 2002: a nationally
TRANSCRIPT
Journal of Materials Education Vol. 32 (5-6): 185 - 230 (2010)
MATERIALS WORLD MODULES - 2002: A NATIONALLY REPRESENTATIVE EVALUATION OF CLASSROOM GAINS Barbara J. Pellegrini External Formative Evaluator, STEP Consulting, Benton Harbor, MI; [email protected] ABSTRACT For more than a decade, policy activists have called for the inclusion of technological design as a component of secondary science. The National Science Education Standards (NSES) included it in 1996 as part of the science curricula. Yet, technological design has not been fully embraced by science teachers. This nationally representative study examines how much science content classrooms gained in a randomly selected sample of 118 science classrooms in 42 states that used Materials World Modules-2002 as a two-week design supplement to the typical canon of science curricula. The study used a quasi-experimental pre-post design and then aggregated results using meta analytical techniques. On average classrooms gained 2.65 standard deviations or an average of 31.8% over their pretest means. Girls gained significantly more than boys both in terms of content acquisition and design achievement. But boys gained more in terms of science esteem. Teachers and students reported improved acquisition of science processes and design skills, and both teachers and students reported being moderately satisfied with the module experience. INTRODUCTION In recent years, science policy proponents at both the national and state levels have launched intensive efforts to improve secondary science education by emphasizing fundamental concepts and principles of the National Science Education Standards1, one of which is technological design. More recently, a strong concern about the preparation of future engineers was raised in, Maintaining a Strong Engineering Workforce: ACT Policy Report 2. The consensus of these policy documents is that learning to act and think as a problem-solver must have a permanent place in our K-12
educational system. In this report, we present nationally representative evidence in support of design as a component of science instruction by drawing from data collected during a five-year formative evaluation of eight supplementary modules developed for the Materials World Modules (MWM) program at Northwestern University, Evanston, IL. Background The MWM program originated in 1993 with support from Northwestern University and a grant from the National Science Foundation (NSF # 9353833). From its inception, MWM
Pellegrini 186
set a priority to address the needs of science teachers and students. Among other reasons, teachers said that they wanted to provide their classes with stimulating activities that connected science to everyday life, to find practical ways of promoting collaborative learning, and to incorporate cutting-edge scientific research into their curricula. With these needs in mind, collaborative teams, comprised of university scientists and engineers, secondary science teachers and students, editors, and graphic designers, developed ten modules that included teacher and student booklets and supply kits. The program introduced teachers and students to the compelling field of materials science and to engage them in design activity as practicing engineers would do. MWM was intended to supplement traditional science, math and technology courses for middle and high school students. By use of active hands-on learning, the MWM approach combines the processes of scientific inquiry with those of engineering design and thereby engages students (of all ability levels) in authentic real-world problem solving and product development. Building on the success of the original MWM program, the MWM-2002 program funded in 1999 by the NSF (# 9818861) intended to enhance the dissemination of the program by devising an electronic system to: (1) customize modules based on class characteristics, and (2) to speed up the delivery of the modules by transmitting text materials on-line. As the program developed across time, it became apparent that a quantitative study was needed to determine how much classrooms gained from a design experience. The literature, at the time, contained a rich collection of qualitative data, but only a hint of the quantitative possibilities. The simple satisfaction ratings used by MWM in the past would not be enough to create claims in support of MWM-2002. Therefore, a randomized national study as a component of formative evaluation was selected as the logical course of action. Study Objectives The module development teams often wondered
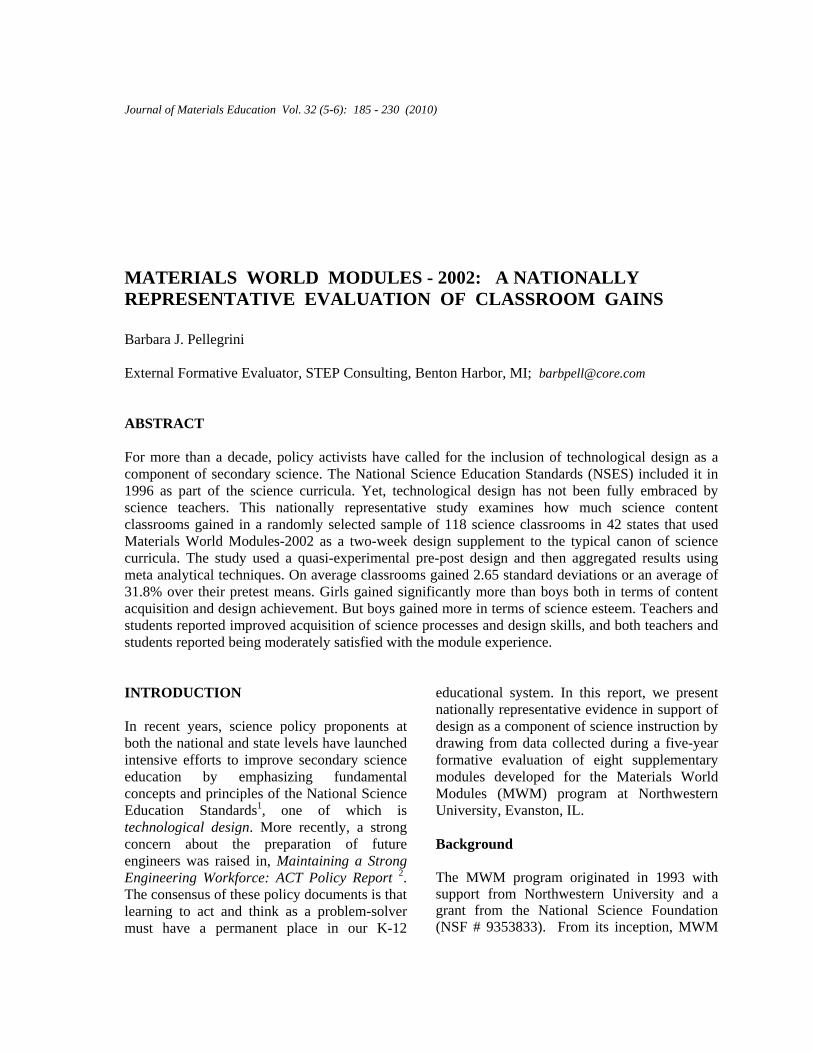
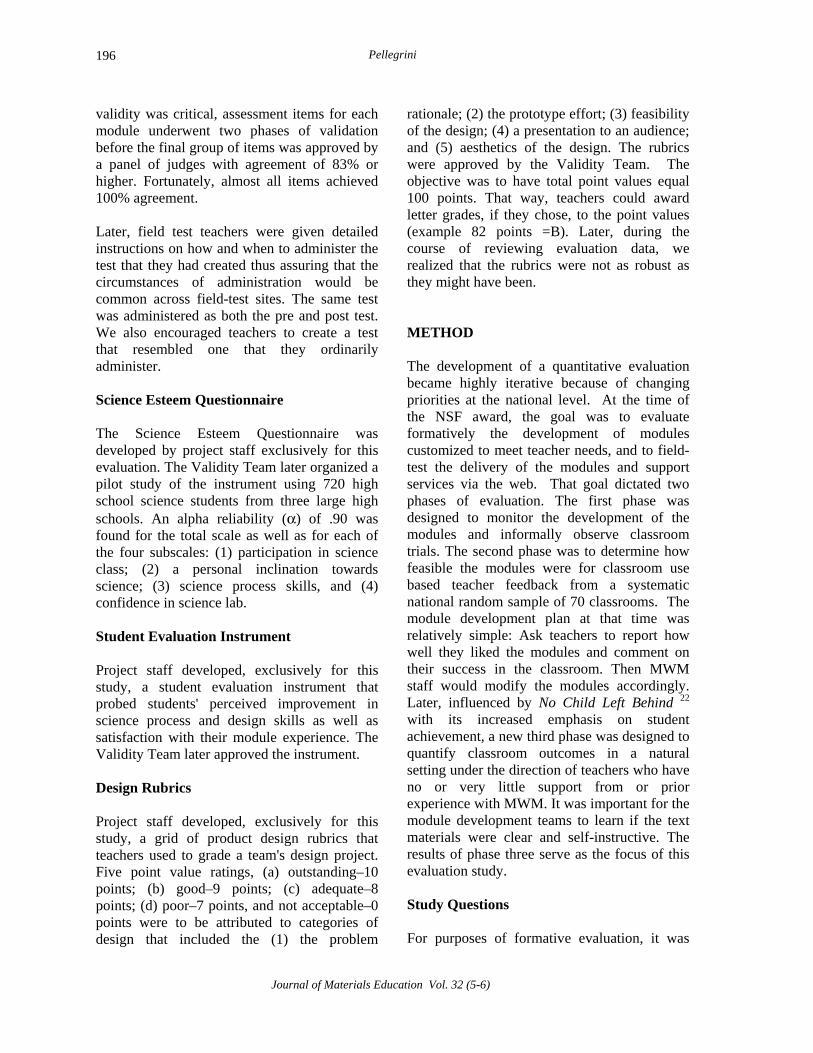
about the extent to which the MWM-2002 modules would contribute to learning across a variety of science course titles. Would a given module work at all levels of science classes? Could modules be customized and successfully delivered on-line? Could the field of materials science provide the most compelling opportunity to demonstrate the integration of design with core science concepts? How self-instructive or "educative" should the text materials be? Finally, if school systems were going to adopt design, they would need to know what outcomes to expect before they invested heavily in time, professional development and supplies. Our hope was that a quantitative evaluation would support those who advocated for design in science classrooms and add to their arguments for its adoption. The evaluation eventually included three phases. See Figure 1, MWM 2002 Evaluation Logic Model. Phase One concerned the informal develop-ment of individual module activities and design projects. No formal assessments were attempted. Rather, we simply monitored the collaborative efforts between the developers and volunteer teachers in nearby Chicago area high schools. Several module iterations followed. Phase Two was a nationwide random pilot-test that addressed feasibility issues. The results indicated whether or not the first four modules could be delivered electronically and found acceptable by a variety of science teachers. For this phase, each teacher completed a lengthy on-line feasibility survey after classroom imple-mentation. No classroom performance data were collected. Module iterations again followed. Phase Three was a second nationwide random field-test at the beta level that addressed classroom outcomes both in terms of classroom learning gains and satisfaction with the module experience. The objectives were to document the classroom gains that occurred in a randomized national sample of high school science classes, and to relate those gains with a set of independent contextual variables. In addition, teachers and students completed
Journal of Materials Education Vol. 32 (5-6)

Materials World Modules-2002: A Nationally Representative Evaluation of Classrooms Gains
Journal of Materials Education Vol. 32 (5-6)
187
Classroom gains
Module creation
Feasibility trials
Sample selection
Instructions & materials to field-test teachers
Data collection & analysis
Classroomimplementation
Moduleiterations
IRB Approval
Bank of validated test items
Classroom Outcomes
Phase 1 & 2 Phase 3
Figure 1. MWM 2002 Evaluation Logic Model questionnaires that probed their satisfaction with the module experience in addition to perceived gains in process skills. DESCRIPTIONS Technological Design Since 1996, the inclusion of technological design in the National Science Education Standards1 has failed to generate the level of attention that it deserves among high school science teachers. The reason, in part, may be due to semantics. What originally was termed technological design for K-12 purposes, has traditionally been known as engineering design to those in the field of engineering. Further, for most educators and for the general public as well, the word technology is associated more readily with computer-driven information and learning systems. A very similar term, technology education is now the preferred term
for a cluster of courses formerly known as industrial arts. Because the term is so strongly identified with computers or industrial arts, technology has not been readily identified with science3. In addition, many science teachers still believe that design projects demand less academic rigor and rightly belong in the technology education department. As Lewis3 observed,
As school subjects, science on one hand, and technology (or technology education) on the other, have had separate existences, the one being well established and bearing high status, the other striving for legitimacy as valid school knowledge, its status often insecure. " (p 1).
As many scientists can attest, design has played a critical role historically in the advancement of scientific theory. One only has to review the biographies of Pierre and Marie Curie to learn that it was the technological design skills of
Pellegrini 188
Pierre Curie that enabled both of them to identify and measure radioactivity4. Similarly, many other scientists earned Nobel Prizes because of innovative technological breakthroughs that provided them with opportunities to observe phenomena not observed or measured before. Materials World Modules - 2002 The MWM-2002 project, served as the focus of this randomized study. The goal was to create ten customized supplementary on-line modules for use in all secondary science classrooms. Drawing on topics from the integrated field of materials science and combining them with core concepts and processes of the National Science Education Standards, the modules introduced teachers and students to (1) the ways in which scientists integrate basic science concepts to create modern materials, and (2) to introduce students to the processes of design thinking. This evaluation report presents field test results from the first eight of ten modules. The other two modules were not included in this study because they were field-tested under non-randomized conditions. MWM-2002 MODULE DEVELOPMENT From its inception, the philosophy of MWM has been to respect teachers as intellectual leaders who make instructional decisions based on their learning goals for the class5,6. Therefore, the program has partnered with them as co-developers. Several teams of materials scientists and high school science teachers worked in parallel for close to four years. Each team developed a separate module and for each activity in a module, focused on a discrete science construct and emphasized its applied use. Several iterations were made to determine the feasibility of each activity in its relationship to the suggested design project. Finally, the module development team sequenced the flow of four to five activities that created a cognitive scaffold towards the culminating design project. The teams strived to align each module with the National Science Education Standards as they
selected compelling hands-on classroom activities from the field of materials science. Alongside this effort, a separate team of project staff researched and prepared hundreds of supply kits that accompanied the modules into the classrooms. Each module came with a Teacher Edition (TE) and a Pupil Edition (PE) plus a bank of validated assessment items. Additionally, the TE had supporting teacher information in the form of optional short articles plus a section titled Adapting-to-the-Modules. The collection of short articles highlighted applications of the topic or explained in greater detail the mechanisms behind the topic. Adapting-to-the-Modules gave teachers guidance for preparing supplies plus additional background inform-ation including samples of two-week lesson plans, and general guidelines for managing student teams. The MWM-2002 modules were made available at three levels of difficulty: introductory, regular or advanced, differentiated only by the level of inquiry demanded of students. The advanced versions, for example, promoted open-ended inquiry whereas introductory versions promoted structured guided inquiry.
• The introductory level consisted of the basic activity with detailed step-by-step activity instruction, pre-lab materials, and detailed activity data table(s). Pre-lab worksheets included articles and questions that focused on key vocabulary for advancing the acquisition of knowledge/comprehension. The worksheets also included guided "write ups" for stating the purpose of the lab activity.
• The regular level provided the basic activity with occasional guided steps and detailed data table(s). Pre-lab worksheets were options that could be used at the teacher’s discretion.
• The advanced level provided the basic activity with minimal guidance to foster more independent learning. Students were
Journal of Materials Education Vol. 32 (5-6)
Materials World Modules-2002: A Nationally Representative Evaluation of Classrooms Gains 189
expected to design their own data table(s), use more mathematics, and do more sophisticated lab write ups in response to the research questions posed in the activity. The Pre-lab worksheets were optional.
Design of MWM-2002 Modules The design of each module followed a common template. MWM-2002 followed the general curricular template established for the original set of MWM modules that were developed during the mid 1990s. The template consisted of five components, all of which were team-centered.
1. The Hook The hook is the first hands-on activity in a module experience. It is designed to elicit a team's interest in the theme of the module or compel it to wonder about a related phenomenon.
2. Staging Activities Over a period of 4-5 days, student teams engaged in a series of four to five scaffolded activities that prepare them for the culminating design project. During this time, teams, aided by background readings, initiated lab investigations, and learned the science content relevant to a module's theme.
3. Design Challenge During the final week of the project, student teams applied what they have learned in the staging activities to create a functional prototype of a design that addresses a real world problem.
4. Redesign Student teams engaged in a series of iterations that further allowed them to apply what they have learned from their initial prototype experience. The goal was to assess and improve the performance of their prototype.
5. Communication Student teams prepared a presentation to communicate their design problem and its solution to a group of peers or outside
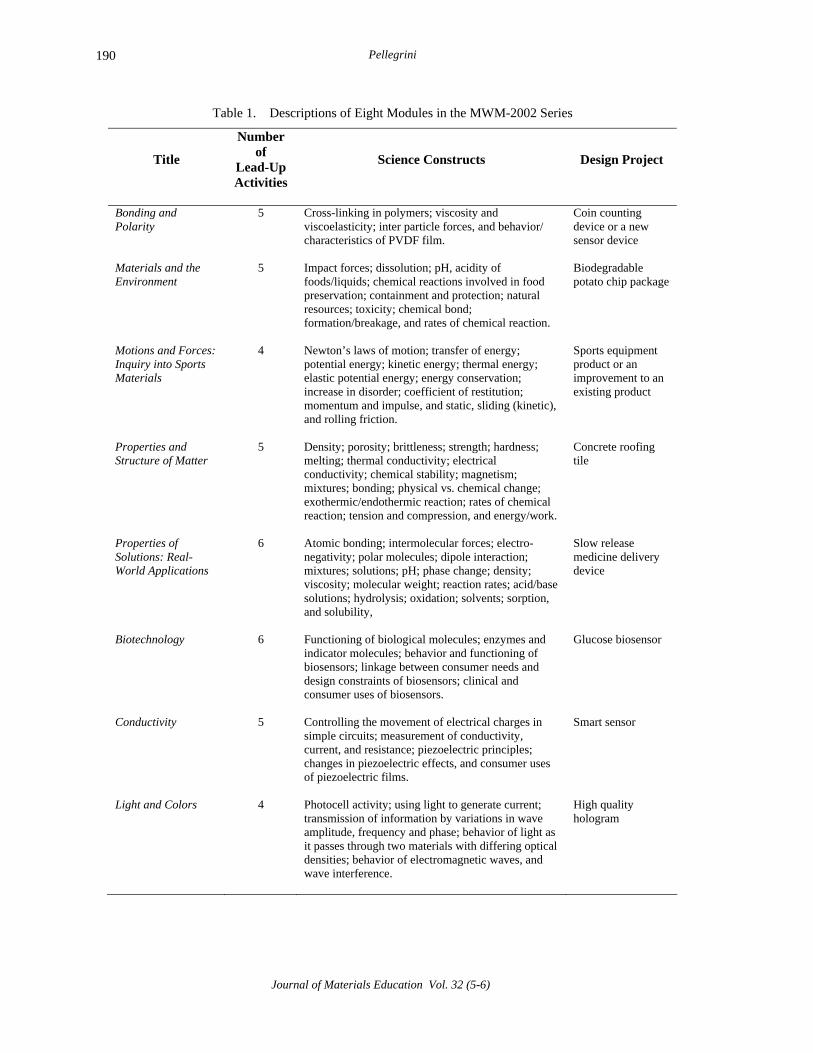
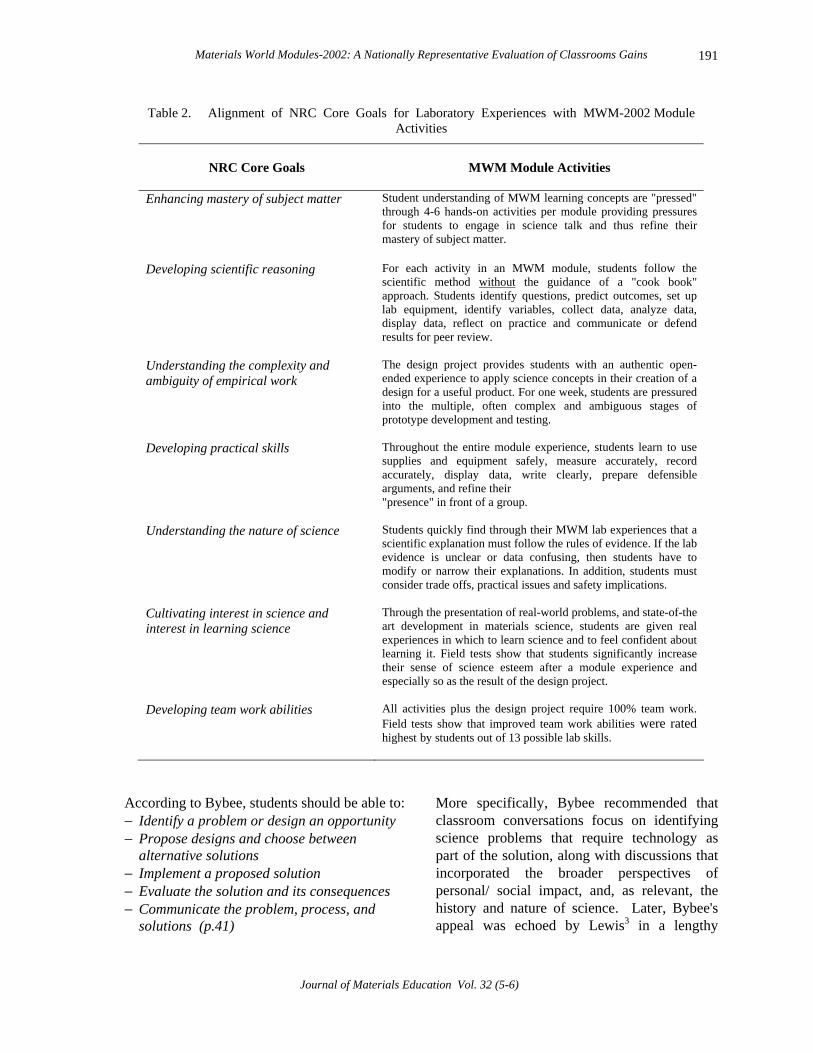
classroom guests. Each module required about two weeks to complete. Teachers elected what module to teach, its level of difficulty, when to teach it, the amount of time to spend on it, what assessment items to use, the scope of the design project, and the structure of an oral or written presentation. Each teacher's participation and implementation was totally unique. Descriptions of the eight modules that served as the basis for this evaluation are provided in Table 1. MWM Alignment with NRC Core Goals for Laboratory Experiences Since 1994, the design of all MWM modules followed the template described earlier in this paper. It was reassuring to find that the template aligned with the recent guidelines established for laboratory science as articulated in America's Lab Report7 and with those articulated by Dieter8 for materials process engineering. Table 2 compares the NRC core goals with activities included in the MWM-2002 modules. LITERATURE REVIEW: DESIGN AS A COMPONENT OF SCIENCE INSTRUCTION In 1998, Roger Bybee, Executive Director, Science, Mathematics, and Engineering Education, National Science Foundation (NSF) authored an article in the Science Teacher9 arguing for the inclusion of technological design as a component of science instruction. Bybee, in an effort to build a bridge between the formerly separated areas, differentiated between the processes of science and technology, and explained how each can contribute to students' cognitive and problem solving abilities when used together. He further articulated what students should know and what students should be able to do after engaging in a combined experience.
Journal of Materials Education Vol. 32 (5-6)
Pellegrini
Journal of Materials Education Vol. 32 (5-6)
190
Table 1. Descriptions of Eight Modules in the MWM-2002 Series
Title
Number of
Lead-Up Activities
Science Constructs
Design Project
Bonding and Polarity
5 Cross-linking in polymers; viscosity and viscoelasticity; inter particle forces, and behavior/ characteristics of PVDF film.
Coin counting device or a new sensor device
Materials and the Environment
5 Impact forces; dissolution; pH, acidity of foods/liquids; chemical reactions involved in food preservation; containment and protection; natural resources; toxicity; chemical bond; formation/breakage, and rates of chemical reaction.
Biodegradable potato chip package
Motions and Forces: Inquiry into Sports Materials
4 Newton’s laws of motion; transfer of energy; potential energy; kinetic energy; thermal energy; elastic potential energy; energy conservation; increase in disorder; coefficient of restitution; momentum and impulse, and static, sliding (kinetic), and rolling friction.
Sports equipment product or an improvement to an existing product
Properties and Structure of Matter
5 Density; porosity; brittleness; strength; hardness; melting; thermal conductivity; electrical conductivity; chemical stability; magnetism; mixtures; bonding; physical vs. chemical change; exothermic/endothermic reaction; rates of chemical reaction; tension and compression, and energy/work.
Concrete roofing tile
Properties of Solutions: Real-World Applications
6 Atomic bonding; intermolecular forces; electro-negativity; polar molecules; dipole interaction; mixtures; solutions; pH; phase change; density; viscosity; molecular weight; reaction rates; acid/base solutions; hydrolysis; oxidation; solvents; sorption, and solubility,
Slow release medicine delivery device
Biotechnology
6 Functioning of biological molecules; enzymes and indicator molecules; behavior and functioning of biosensors; linkage between consumer needs and design constraints of biosensors; clinical and consumer uses of biosensors.
Glucose biosensor
Conductivity 5 Controlling the movement of electrical charges in simple circuits; measurement of conductivity, current, and resistance; piezoelectric principles; changes in piezoelectric effects, and consumer uses of piezoelectric films.
Smart sensor
Light and Colors 4 Photocell activity; using light to generate current; transmission of information by variations in wave amplitude, frequency and phase; behavior of light as it passes through two materials with differing optical densities; behavior of electromagnetic waves, and wave interference.
High quality hologram
Materials World Modules-2002: A Nationally Representative Evaluation of Classrooms Gains 191
Table 2. Alignment of NRC Core Goals for Laboratory Experiences with MWM-2002 Module Activities
NRC Core Goals
MWM Module Activities
Enhancing mastery of subject matter
Student understanding of MWM learning concepts are "pressed" through 4-6 hands-on activities per module providing pressures for students to engage in science talk and thus refine their mastery of subject matter.
Developing scientific reasoning For each activity in an MWM module, students follow the scientific method without the guidance of a "cook book" approach. Students identify questions, predict outcomes, set up lab equipment, identify variables, collect data, analyze data, display data, reflect on practice and communicate or defend results for peer review.
Understanding the complexity and ambiguity of empirical work
The design project provides students with an authentic open- ended experience to apply science concepts in their creation of a design for a useful product. For one week, students are pressured into the multiple, often complex and ambiguous stages of prototype development and testing.
Developing practical skills Throughout the entire module experience, students learn to use supplies and equipment safely, measure accurately, record accurately, display data, write clearly, prepare defensible arguments, and refine their "presence" in front of a group.
Understanding the nature of science
Students quickly find through their MWM lab experiences that a scientific explanation must follow the rules of evidence. If the lab evidence is unclear or data confusing, then students have to modify or narrow their explanations. In addition, students must consider trade offs, practical issues and safety implications.
Cultivating interest in science and interest in learning science
Through the presentation of real-world problems, and state-of-the art development in materials science, students are given real experiences in which to learn science and to feel confident about learning it. Field tests show that students significantly increase their sense of science esteem after a module experience and especially so as the result of the design project.
Developing team work abilities All activities plus the design project require 100% team work. Field tests show that improved team work abilities were rated highest by students out of 13 possible lab skills.
According to Bybee, students should be able to: − Identify a problem or design an opportunity − Propose designs and choose between
alternative solutions − Implement a proposed solution − Evaluate the solution and its consequences − Communicate the problem, process, and
solutions (p.41)
More specifically, Bybee recommended that classroom conversations focus on identifying science problems that require technology as part of the solution, along with discussions that incorporated the broader perspectives of personal/ social impact, and, as relevant, the history and nature of science. Later, Bybee's appeal was echoed by Lewis3 in a lengthy
Journal of Materials Education Vol. 32 (5-6)

Pellegrini 192
retrospective that constructed a convincing argument for the inclusion of technological design as an important component of science instruction. Since 1998, there has been a modest and steady stream of literature suggesting the superior performance that can be obtained when students learn science by engaging in design. To better appreciate the significance and place of quantitative findings from this nationally representative study, we present, a chron-ological sampling of former literature. In 2001, Benenson10 argued that technology could play an essential role in the schools to advance learning across many disciplines because the goals of technology are similar to goals in other subjects. He further elaborated on the development and field-testing of five technology guides that make up The City Technology Curriculum Guides in support of elementary education. The results, based on interview data, found that teachers believed that technology education (both process and content) could be integrated into both the formal and informal curricula. No student achievement data were reported. Also in 2001, Crismond11 reported on a qualitative study in which three groups of high school and post high school subjects (naive, novice and expert) were given mechanical devices to investigate and then redesign. He investigated gender differences in how process skills and concepts were utilized by each of the three groups. Although the number of subjects in the study (16 males and 16 females) lacked minimum numbers for statistical significance, Crismond found (by observing six case-study teams) that females in the naive group were more methodical than male investigators and that neither gender intuitively recommend redesign as an option. For novice subjects, Crismond found that some females preferred to work alone using hands-on trials rather than discussion or principled reasoning to resolve issues. Male novice subjects, on the other hand, were keenly observant and some spontaneously suggested redesign tasks. The female expert groups showed skill in working collaboratively
and systematically exchanging observations and ideas before beginning their work. Male experts, by contrast, were more eager to test devices in order to confirm their predictions. Crismond's research demonstrated gender differences that should be considered as a variable in future studies. Roth12, realizing the similarities between science and technology, reported on a qualitative study in which 26 educationally challenged students in 6th and 7th grades in a suburban large city of western Canada were introduced to a technological problem solving curricula using simple machines. Roth planned three episodes of data collection that later were observed and recorded before, during and after each episode. Students also were tested using written and practical formats. His goal was to learn how students know and learn science through technological design activities. Roth found (1) that when students are called on to develop their own designs, the lessons start automatically at developmentally appropriate points for each student and that motivation naturally becomes intrinsic; (2) that students embed their knowledge of science when they produce sketches or drawings which later are used with gestures to explain their ideas to others; (3) that when students manipulate objects for understanding, it is more effective than manipulating mental images; (4) that students who sustained an interest in talking design also increased their competence in talking design, and (5) the production of a prototype or artifact enables students to talk more in depth about the issues at hand and to engage in meaningful critiques. Roth summar-ized an interesting explanation of the difference between science and technology. When doing science, the goal is to translate observable phenomena/artifacts into abstract symbols that capture a theory or law. When doing technology the dynamics of the goal are reversed; symbolic laws and theory are translated into observable phenomena /artifacts. Custer et al.13 conducted an exploratory study to
Journal of Materials Education Vol. 32 (5-6)
Materials World Modules-2002: A Nationally Representative Evaluation of Classrooms Gains 193
identify key factors that influence the problem-solving abilities of high school students. While the sample was small (n = 27), the authors proposed a model of quantitative assessment known as the Student Individualized Performance (SIP) Rubric. The SIP included four dimensions, (1) Problem and Design Clarification, (2) Develop a Design, (3) Model/Prototype, and (4) Evaluate the Design/Solution. Each dimension was further sub-divided into three components to better assess students while they were engaged in a stimulus project, the redesign of a school locker. The authors suggested further research based on their findings. Custer's work would influence the rubrics that had been proposed for evaluating the MWM-2002 design projects. In 2002, Baumgartner6 designed a fine-grained qualitative study in which he frequently observed three high school teachers implement Materials World Modules (MWM) over the course of one semester. He found that teachers use the modules for differing goals and that each teacher's implementation was totally unique. Luehmann14, using a sample of 30 secondary science teachers, identified six factors that influence teachers' decision-making as they consider potential adoption of computer assisted project-based learning. The factors were: (1) trust that the project will serve their needs and that of their students; (2) a perception of one's role and affiliation; (3) personal efficacy to carry out the innovation; (4) processing how to achieve the desired goals; (5) a reflection of current situational constraints, and (6) the expectation that contextual idiosyncrasies will arise. Luehmann's qualit-ative findings validated the constraints that already had been identified by the MWM program as it prepared for the web delivery of MWM-2002 materials. Kolodner15, using middle school classrooms, introduced Learning by Design, a series of eight-week-long units supported by software that engaged students in design challenges as hooks for learning science content. The author
claimed that students learned science content as well as or better than students taught in the traditional manner. The findings were based on qualitative authentic assessment of science process and design skills as opposed to quantitative assessment of student content gains. The student skills (working in a team, designing an investigation, communicating results, etc) discussed by Kolodner were very similar to those reported by teachers during Phases 1 and 2 of the MWM-2002 program. Satchwell and Loepp16 introduced IMaST, a three-year-long middle school curriculum of 16 open-ended modules based on constructivist theory that integrated technology, science and mathematics. The modules were aligned with NSES for each of the three disciplines. The design teams were comprised of nine middle school teachers who worked collaborative for three years with IMaST project staff. The modules were revised after each field-test and eventually prepared for publication. For the evaluation, a total of 539 students in eight schools were assigned to one of two classes, IMaST or Traditonal. In addition to authentic assessment of design projects and qualitative responses from teachers, the authors measured effectiveness by combining relevant subtests of the Third International Mathematics and Science Study (TIMSS) plus the Stanford Achievement Test (SAT). They found that IMaST students' computational skills as measured by the SAT were higher than or as high as traditionally taught students. More interestingly, students in IMaST classes showed significantly higher gains in science processes as compared with science knowing when measured using the combined pre-post subtests of the TIMSS. For the Traditional classes, there was a slight opposite effect. Thus, Satchwell and Loepp provided quantitative evidence that the integration of math, science and technology could benefit students at the middle school level by significantly improving their science process skills as they learned science content. In 2003, Hickey et al.17 conducted a study of a short-term design-based genetics module involving 31 high school life science classes
Journal of Materials Education Vol. 32 (5-6)
Pellegrini 194
taught by 13 teachers in eight schools. The genetics module, delivered via computer application, contained 17 activities intended to supplant the traditional curriculum in genetics rather than supplement it. The investigators reported their findings using T units and these converted to an effect size of roughly 1.0. A follow-up study of the same genetics module, using a revised delivery context, resulted in a gain of 3.1 standard deviations, equivalent to an effect size of 3.1. Fortus et al.18, in 2004, investigated whether significant scientific knowledge was con-structed when 92 students in three ninth grade physical science classes were engaged in three consecutive open-ended Design-Based Science units. The goal was to document the extent to which students learn science through design projects. In addition to assessing pre-post achievement gains in science, the investigators assessed student posters and design artifacts to determine the extent to which students applied newly learned scientific concepts and addressed various constraints posed by the design project. The investigators reported the following effect sizes based on Glass's equation for each module: Extreme Structures (ES, 2.1); Environmentally Safe Batteries (ES, 1.9), and Safer Cellular Phones (ES 2.7). The authors cautioned that it is often arduous and time-consuming for teachers to implement a science curriculum that is driven by design projects. Teachers typically want to know in advance how the designs will turn out and be assured that students, once they are preoccupied with the design project, will actually learn the science. In 2008, Apedoe et al.19 reported results of a pre/post study involving 380 students in 9th, 10th, 11th, and 12th grade chemistry classes who participated in an eight-week high school chemistry unit, The Heating/Cooling System. The unit was designed so that students had to employ scientific inquiry as they designed and tested a chemically generated heating or cooling device that met a consumer need. The five participating teachers taught the unit in at least two classes or sections of chemistry. The
assessment consisted of 24 questions taken from the Chemical Concept Inventory and the American Chemical Society's (ACS) Test Item Bank. Results revealed statistically significant gains (13%) in accuracy for understanding chemistry concepts, with an overall pre/post effect size (Cohen's d) of .31. Finally, the authors reported that student interest in and awareness of engineering was statistically higher among students who had engaged in the Heating/ Cooling unit as compared with peers who had not. Mehalik et al.20 conducted a paired exper-imental/contrast design in one urban district to investigate the effectiveness of a systems engineering approach to the teaching of electricity at the middle school level. A total of 10 teachers (587 students) participated in the systems design group and five teachers (466 students) participated in the traditional scripted inquiry group. The teachers were not randomly selected rather they were recruited and then volunteered. The design group used a custom-ized four-week module titled, Electrical Alarm System: Design, Construction, and Reflection whereas the scripted inquiry group used the district's standard curricular modules that covered the same concepts. Students in the design group were encouraged to design an alarm system that was of special interest to them, thus adding a heightened sense of motivation to engage in the class. Both groups were administered the same researcher devel-oped pre/post tests that measured changes in student knowledge of electrical concepts. Overall, the design group achieved a pre/post effect size of .89 (Cohen's d) or twice that as the scripted inquiry group. Little differences were noted for gender and socio-economic differences. The systems design approach was most helpful to low achieving African-American students. When taken together, these studies strongly suggest that design can be successfully integrated with science content, but that the process can be time-consuming and often
Journal of Materials Education Vol. 32 (5-6)

Materials World Modules-2002: A Nationally Representative Evaluation of Classrooms Gains 195
perplexing for the teachers. Further, the findings summarized above are, for the most part, based on non-representative or conveni-ence sampling. This study, however, will add to the discussion of achievement gains and design as a component of science instruction by contributing findings from a nationally representative random sample. Thus, future practitioners will have a baseline against which to anticipate outcomes and compare results. INSTRUMENT DEVELOPMENT Prior to the actual evaluation activities, it was necessary to write several data collection instruments as well as validate a bank of student assessment items for each module. Some of the materials science content was unique to the program and not likely to be found in science texts in use at the time. Test Item Validation A Validity Team of 10 highly experienced secondary science educators and MWM staff met for close to a year and a half to write and validate assessment items for an item bank that would accompany each of the eight modules. The Validity Team was charged to: − write assessment items for each module
activity spanning the Bloom's Taxonomy range from knowledge to evaluation;
− validate assessment items for each activity in a module;
− validate the MWM 2002 Product Design Rubrics;
− validate and pilot the MWM 2002 Science Esteem Questionnaire; and
− validate the Student Evaluation form. We designed the study to test the effectiveness of MWM-2002 under natural classroom conditions. One of those conditions was to allow each teacher to create his/her own test. But this condition raised issues as to whether we could determine the reliability of each classroom's test. A determination of statistical reliability depends on having a large enough sample of students who take the same test. That
would be impossible because class size varied from 5-29 students in our sample of field test classrooms. Guided, instead, by the classic wisdom of Morris and Fitz-Gibbon (1978) 21, regarding the measurement of achievement, we chose, instead, to focus on validity. Reliability would follow. In the words of Morris and Fitz-Gibbon:
Is a valid measure reliable? In general, yes. A valid test is one that has demonstrated its power to detect some real ability, attitude, or prevailing situation that the test user can identify and characterize. If the ability or skill being measured is itself stable, and if respondents' answers to the items are not affected by other unpredictable factors, then each administration of the instrument should yield essentially the same result. All the reliability studies in the world will not guarantee validity. - Morris and Fitz-Gibbon (1978) 21, pp. 90-91
The Validity Team addressed content validity, construct validity, face validity as well as issues related to gender and cultural bias, syntactical style, hierarchy of questioning asking, etc. The team could not address concurrent validity with published texts because of the amount of materials science content included in the modules. The modules were supplementary by design and not intended for comparison against standard science content. The validation of module test items for eight modules was completed after an intensive review of each module activity (49 in all). We wanted each module to be accompanied by a sufficient number of items per activity (14-16) so that teachers could customize their class-room tests to align tightly with the module activities that they chose to implement. Assessment Items For each module activity, the objective was to write approximately 10 multiple choice items, three-four short answer items, and two-four long answer items. In sum, the test bank for each module would contain a total of approximately 60 to 80 items. Because item
Journal of Materials Education Vol. 32 (5-6)
Pellegrini 196
validity was critical, assessment items for each module underwent two phases of validation before the final group of items was approved by a panel of judges with agreement of 83% or higher. Fortunately, almost all items achieved 100% agreement. Later, field test teachers were given detailed instructions on how and when to administer the test that they had created thus assuring that the circumstances of administration would be common across field-test sites. The same test was administered as both the pre and post test. We also encouraged teachers to create a test that resembled one that they ordinarily administer. Science Esteem Questionnaire The Science Esteem Questionnaire was developed by project staff exclusively for this evaluation. The Validity Team later organized a pilot study of the instrument using 720 high school science students from three large high schools. An alpha reliability (α) of .90 was found for the total scale as well as for each of the four subscales: (1) participation in science class; (2) a personal inclination towards science; (3) science process skills, and (4) confidence in science lab. Student Evaluation Instrument Project staff developed, exclusively for this study, a student evaluation instrument that probed students' perceived improvement in science process and design skills as well as satisfaction with their module experience. The Validity Team later approved the instrument. Design Rubrics Project staff developed, exclusively for this study, a grid of product design rubrics that teachers used to grade a team's design project. Five point value ratings, (a) outstanding–10 points; (b) good–9 points; (c) adequate–8 points; (d) poor–7 points, and not acceptable–0 points were to be attributed to categories of design that included the (1) the problem
rationale; (2) the prototype effort; (3) feasibility of the design; (4) a presentation to an audience; and (5) aesthetics of the design. The rubrics were approved by the Validity Team. The objective was to have total point values equal 100 points. That way, teachers could award letter grades, if they chose, to the point values (example 82 points =B). Later, during the course of reviewing evaluation data, we realized that the rubrics were not as robust as they might have been. METHOD The development of a quantitative evaluation became highly iterative because of changing priorities at the national level. At the time of the NSF award, the goal was to evaluate formatively the development of modules customized to meet teacher needs, and to field-test the delivery of the modules and support services via the web. That goal dictated two phases of evaluation. The first phase was designed to monitor the development of the modules and informally observe classroom trials. The second phase was to determine how feasible the modules were for classroom use based teacher feedback from a systematic national random sample of 70 classrooms. The module development plan at that time was relatively simple: Ask teachers to report how well they liked the modules and comment on their success in the classroom. Then MWM staff would modify the modules accordingly. Later, influenced by No Child Left Behind 22 with its increased emphasis on student achievement, a new third phase was designed to quantify classroom outcomes in a natural setting under the direction of teachers who have no or very little support from or prior experience with MWM. It was important for the module development teams to learn if the text materials were clear and self-instructive. The results of phase three serve as the focus of this evaluation study. Study Questions For purposes of formative evaluation, it was
Journal of Materials Education Vol. 32 (5-6)
Materials World Modules-2002: A Nationally Representative Evaluation of Classrooms Gains 197
important to obtain answers to the following questions. 1) How much did classrooms gain? 2) How successful were the student design
projects? 3) What science process and design skills
were most improved? 4) Was there a change in students' sense of
science esteem? 5) Was there a difference in achievement
between boys and girls? 6) What is the relationship between classroom
outcomes and the context of the school? 7) What is the relationship between classroom
outcomes and the context of the classroom? 8) What is the relationship between classroom
outcomes and the characteristics of the teacher?
Rationale for the Design of the Study Because the modules were designed to be supplementary materials for all titles of science classes with implementation unique to each classroom site, there could be no common set of field test conditions. Each classroom would have to be regarded as a separate research entity. The descriptive approach we used, however, did meet the definition of a scientific study in education as defined in Scientific Research in Education (NRC, 2002) 23.
To be scientific, the design must allow direct, empirical investigation of an important question, account for the context in which the study is carried out, align with a conceptual framework, reflect careful and thorough reasoning, and disclose results to encourage debate in the scientific community. (p. 6)
If the design directly addresses a question that can be addressed empirically, is linked to prior research and relevant theory, is competently implemented in context, logically links the findings to interpretation, and is made accessible to scientific scrutiny, it could then be considered scientific. (p.97)
Research Design The most appropriate design was the quasi-
experimental pre-post method wherein classrooms acted as their own controls. The use of a pretest facilitated a more accurate measure of how much the classrooms knew before the module experience. Shapiro24 presented evidence that "prior knowledge has a marked effect on learning outcomes" (p.159) and strongly recommended pre-post designs for studies of learning outcomes. The primary unit of analysis for content gains was the classroom because teachers tended to adopt an instructional strategy based on how well it would go over with the class as a whole. Further, federal restrictions regulating the privacy of human subjects combined with the necessity of obtaining individual parent permission signatures for each underage student made it impractical to use the student as the primary unit of analysis. A major objective of the evaluation was to describe the variations in classroom gains that occurred because teachers used different modules, or that classrooms varied in contextual characteristics (urban vs. rural; teacher gender, science class title, etc.) The primary interest was in capturing authentic "snapshots" of what occurred in various types of classrooms. We then used meta-analytical techniques to report classroom outcomes per contextual variable. Achievement gains were reported using three metrics, standardized mean gain effect size (Becker, 1988 25; Morris, 2000 26; Lipsey and Wilson, 2001 27); normalized gain <g> (Hake, 1998 28, 29), and simple value added (Meyer, 1996 30 and Meyer 2000 31). The reasons for using three outcome measures will be explained later in this section. The most important consideration was making sure that the methodology matched the research questions. As stated earlier, our focus was on gains per individual classrooms and not on comparing classrooms that used MWM-2002 with those that did not. Finally, the study received approval from the Northwestern University Institutional Review Board (IRB).
Journal of Materials Education Vol. 32 (5-6)
Pellegrini 198
Data Collection Support staff at Northwestern University diligently managed a protocol for collecting classroom data that provided teachers with a detailed packet of explicit instructions and worksheets. For example, teachers were advised to create their own test (minimum of 30 items) from the bank of assessment items (60-80) that accompanied each module. Additionally, teachers were given explicit guidelines for when to administer the pretest (2 weeks before the module) and the posttest (within 3 days of completing a module). Besides test items, teachers were provided with a standard set of rubrics for grading a student teams' design project. So while students received individual scores for their pre and post tests, each student received the same design score as other members of his/her team. Further, teachers administered the individual pre and post science esteem questionnaires and student evaluations of the module experience. Within each classroom, teachers collected pre and post coded test data from each student and entered the raw scores into the worksheet provided by the project. All of the original student science esteem questionnaires and student evaluations were collected and sent to the program office. No student names or other identifying information were made available to the evaluator, ensuring that the data could not be linked to students by name or school. Later, teachers completed an on-line evaluation in which they rated various components of the module experience. As a condition of receiving a generous stipend for their out of class work, teachers had to submit all of the data required. Teachers downloaded all MWM-2002 text materials and instruments from the MWM web-site (http://www.materialsworldmodules.org), with limited support and with no professional development other than the teacher's edition of instructions and recommendations that accompanied each module. Simply stated, "How self-instructive or educative would the MWM- 2002 text materials be?" If professional development had been included, it would have been nearly impossible to sort out whether it was the professional development or
the text materials that influenced the classroom gains. Dependent Variables Before discussing the outcome measures used for this study, it is important to explain why a standardized test, such as a state test, was not used as an outcome instrument. There were several practical reasons. Firstly, a standardized test is a coarse-grained measure of achievement and we were interested in a fine-grained measure that reflected each teacher's goals for his/her class and unit of study. Secondly, students met for approximately10 hours of class time, roughly 1.1% of a school year. Because standardized tests measure science achievement that was acquired over a year or more of instruction, it seemed unlikely that we would be able to detect any appreciable gains for the very short 10 hours that students were engaged in a module. Thirdly, each state used a unique science achievement test that was administered only once during the high school years. The MWM-2002 modules were intended to be field-tested across grades 9-12 and not limited to just the year of a state test. Lastly, the release of data such as individual student scores on standardized tests requires individual written parent permission. Obtaining permission slips for research purposes from several thousand parents would have severely limited the number of field test classrooms or reduced the number of student subjects per class to a point that claims of achievement or non- achievement would have been spurious at best. Therefore, we decided instead to use three outcome measures of achievement that are described below. Taken together, their triangulation would reveal a clearer picture of content gains. 1). Standardized mean gain effect size. The recommended way to measure change in educational and social research is to report results using effect size with its respective 95% confidence interval or CI (Thompson, 2002 32; Cumming and Finch, 2001 33; APA, 2001 34.) An effect size, simply stated, is a measure of change from a pre to a post condition stated in standard deviation units.
Journal of Materials Education Vol. 32 (5-6)
Materials World Modules-2002: A Nationally Representative Evaluation of Classrooms Gains 199
There are several methods for calculating effect sizes and the differences occur in the denominator depending on the study's methodology and available data. One of the methods, standardized mean gain effect size, first proposed by Becker25 and reaffirmed by Lipsey and Wilson27 is recommended for use when analyzing results of several pre/ post contrasts in which the operationalizations are different. (Generally, it yields a more conservative estimate than Cohen's d). MWM-2002 consisted of eight different modules each implemented in a different setting with differing goals. For example, each teacher composed a different test that was used for both pre and post measurement. By standardizing the effect sizes, the results from various classrooms could be compared across module titles. The equation is based on the mean gain of the class from the pre-test to the post-test condition plus the statistical correlation (r) between the pre-test and post-test scores when expressed in original scoring units i.e. points correct. Thus, student differences are taken into account. Finally, the effect size equation may not be user-friendly to those outside of the educational research community. The equation for calculating the standardized mean gain effect size is:
ESsg = Gsdg
2(1 – r) The equation for calculating the accompanying standard error is:
sgSE = 2(1− r)n
+ sg2ES
2n (Lipsey and Wilson27; Becker25)
where G is the mean gain for the class (mean post-test score – mean pre-test score.) sd is the standard deviation of G (gain.) r is the correlation between the mean pre-test and mean post-test scores. ES is the standardized mean gain effect size. n is the common sample size.
2). Normalized gain <g>. As mentioned previously, there are communication drawbacks to reporting results in terms of effect size. Normalized gain, however, is easier to understand and calculate and so we elected to use it as a second metric for reporting classroom gains. Previously, this method had been used to evaluate the effectiveness of interactively taught undergraduate introductory courses in engineering and physics (Hake28,29). “Interactively taught” refers to a hands-on, inquiry-based approach. By using normalized gain, we can better compare our results with those obtained for engineering undergraduates. Furthermore, any science teacher could replicate <g> easily for future class comparative purposes. For this method, the raw points correct for both the class pre-test and post-test are converted to percentage correct. Subsequently, the value obtained from the equation can be compared and meta analyzed across sites. The equation for calculating normalized gain <g> is: <g> = <% Post> – <% Pre> 100% – <% Pre> (Hake 28,29)
The symbol < > indicates that for each class there is both a pre-test and a post-test score for the same student. % Pre is the mean class percent correct for the pre-test. % Post is the mean class percent for the post-test. Interpretation is very straightforward. Basically an obtained value of .57 means that the class as a whole gained the equivalent of 57% of the maximum gain possible for a given test. Said another way, the class progressed 57% beyond the mean pre-test score towards a perfect score of 100% for every student in the class. Hake 28,29 recommended the following interpretations: <g> 0 – .30 = small gain <g> .31–.70 = moderate gain <g> .71 – 1.00 = high gain 3). Value added. Value added is very easy to calculate and understood easily by teachers and
Journal of Materials Education Vol. 32 (5-6)
Pellegrini 200
laypersons interested in knowing, on average, how much classes as a whole gained from a supplementary activity. Meyer30,31 proposed the use of value added as a better indicator of achievement than reporting only average or median test outcome scores. In its basic form, value added reports the average gains made by a group of students across a span of time. Value added is usually determined by a regression model in which all of the nonschool factors that might influence achievement over the course of several years are factored in. For this evaluation, the regression model was not required because the use of MWM occurred over the short time span of only two weeks. Plus the evaluation did not deal with a school or its community as a whole, but only with one science class in a school that was taught by one teacher. The simple form of value added therefore was deemed the most practical. The basic equation for calculating value added is:
% Value Added = (Post test class average% - Pre test class average%)
For example: If a class averaged 70% on the posttest and 30% on the pretest, then the gain or value added would be 40%. 4). Additional measures. Other outcome measures included: (a) student design scores; (b) pre/post student ratings from a 25-item science esteem questionnaire; (c) an 85 item on-line survey of teacher satisfaction, and (d) a 20 item student self report of skill improvement and module satisfaction. Independent Variables
As stated earlier, we summarized classroom gains using a meta analysis and reported student outcomes according to the following contextual (independent) variables. (See Table 17: A Meta Analysis of MWM-2002 Classroom Outcomes). − U.S. geographical region − NCES locale code − Percent of under-represented students in the
school
− MWM 2002 module − Module level of difficulty − Type of science class − Teacher gender − Teacher years of experience − Teacher level of academic preparation − Class size − Student gender. Classroom Observations No classroom observations were planned for several reasons: (1) the geographical spread of the field-test sites and related travel expenses; (2) issues related to the development of a valid MWM classroom observation protocol along with a cadre of trained observers, and (3) classroom calendar issues. The Randomized National Study Sample The systematic random sample of 5,434 schools was drawn from a list of traditional high schools in the United States obtained from Quality Educational Data (QED), a national database of schools. We mailed invitation packets to the science department chairs in each of the schools and received 461responses indicating a teacher's interest to participate in the evaluation study. We limited the study to only one teacher and one classroom per school. In spite of their willingness to participate, only 155 of the 461 teachers submitted data packets, and of those 118 were "clean" enough for data analysis purposes. In the end, the modules reached 118 classrooms, and 2,297 students in 42 states and 40 titles of science classes. Of the total number of students in the study, we obtained complete pre and post data sets from 2,026 (88%) of them, with the loss of 271 data sets most likely because of absences, school withdrawals, negligence, etc. U.S. geographical distribution. The eight modules reached 42 states across six geographical regions of the country according to the U.S. percentage of high schools in each region (North East, South East, North Central, South Central, North West and South West.) In
Journal of Materials Education Vol. 32 (5-6)
Materials World Modules-2002: A Nationally Representative Evaluation of Classrooms Gains
Journal of Materials Education Vol. 32 (5-6)
201
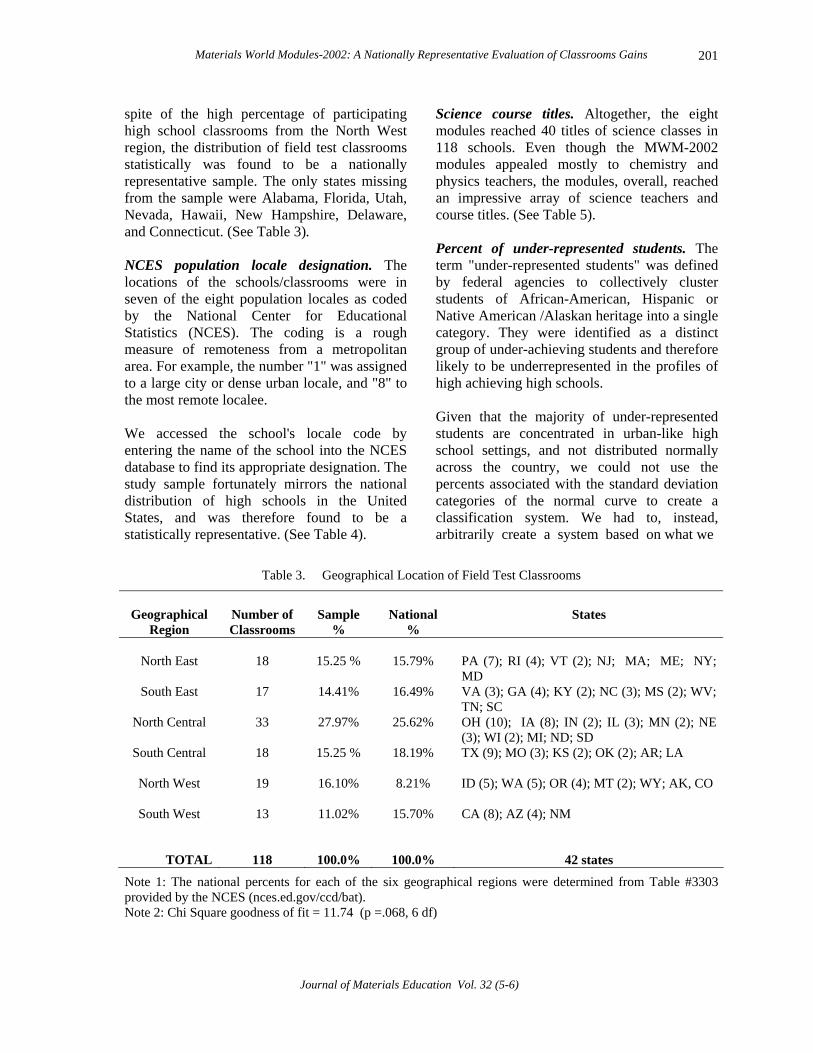
spite of the high percentage of participating high school classrooms from the North West region, the distribution of field test classrooms statistically was found to be a nationally representative sample. The only states missing from the sample were Alabama, Florida, Utah, Nevada, Hawaii, New Hampshire, Delaware, and Connecticut. (See Table 3). NCES population locale designation. The locations of the schools/classrooms were in seven of the eight population locales as coded by the National Center for Educational Statistics (NCES). The coding is a rough measure of remoteness from a metropolitan area. For example, the number "1" was assigned to a large city or dense urban locale, and "8" to the most remote localee. We accessed the school's locale code by entering the name of the school into the NCES database to find its appropriate designation. The study sample fortunately mirrors the national distribution of high schools in the United States, and was therefore found to be a statistically representative. (See Table 4).
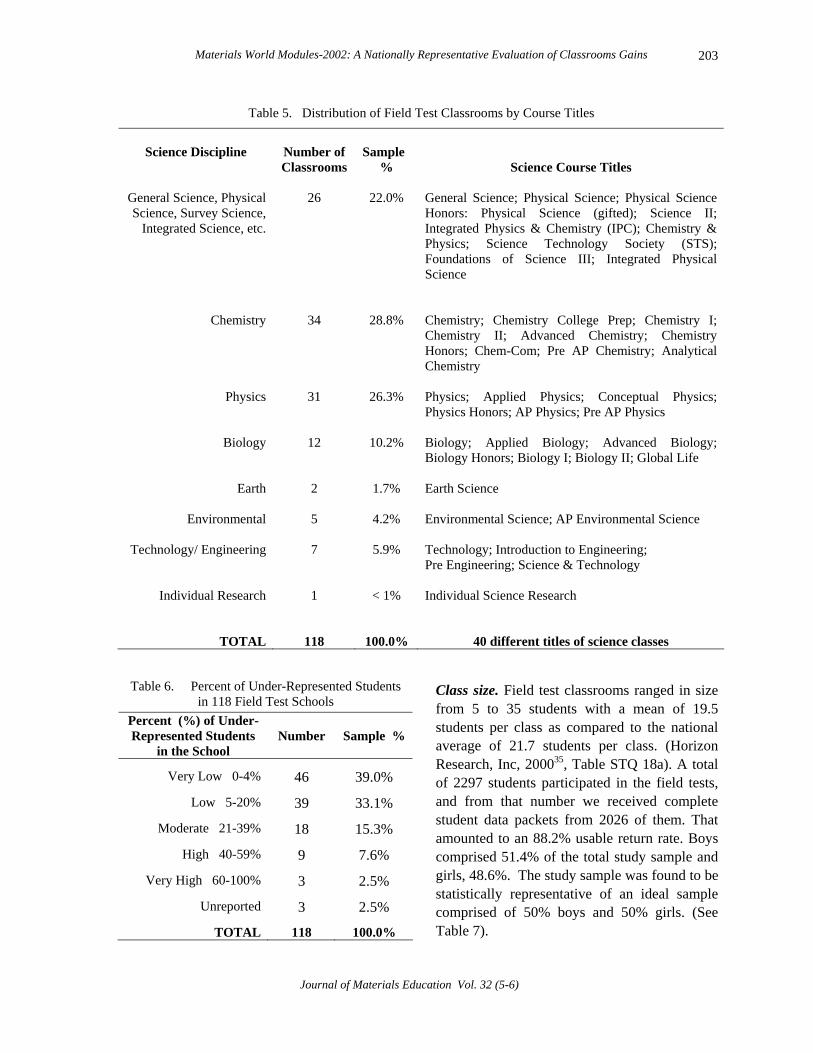
Science course titles. Altogether, the eight modules reached 40 titles of science classes in 118 schools. Even though the MWM-2002 modules appealed mostly to chemistry and physics teachers, the modules, overall, reached an impressive array of science teachers and course titles. (See Table 5). Percent of under-represented students. The term "under-represented students" was defined by federal agencies to collectively cluster students of African-American, Hispanic or Native American /Alaskan heritage into a single category. They were identified as a distinct group of under-achieving students and therefore likely to be underrepresented in the profiles of high achieving high schools. Given that the majority of under-represented students are concentrated in urban-like high school settings, and not distributed normally across the country, we could not use the percents associated with the standard deviation categories of the normal curve to create a classification system. We had to, instead, arbitrarily create a system based on what we
Table 3. Geographical Location of Field Test Classrooms
Geographical
Region
Number of Classrooms
Sample
%
National
%
States
North East
18
15.25 %
15.79%
PA (7); RI (4); VT (2); NJ; MA; ME; NY; MD
South East 17 14.41% 16.49% VA (3); GA (4); KY (2); NC (3); MS (2); WV; TN; SC
North Central 33 27.97% 25.62% OH (10); IA (8); IN (2); IL (3); MN (2); NE (3); WI (2); MI; ND; SD
South Central
18 15.25 % 18.19% TX (9); MO (3); KS (2); OK (2); AR; LA
North West
19 16.10% 8.21% ID (5); WA (5); OR (4); MT (2); WY; AK, CO
South West 13 11.02% 15.70% CA (8); AZ (4); NM
TOTAL
118
100.0%
100.0%
42 states
Note 1: The national percents for each of the six geographical regions were determined from Table #3303 provided by the NCES (nces.ed.gov/ccd/bat). Note 2: Chi Square goodness of fit = 11.74 (p =.068, 6 df)

Pellegrini 202
Table 4. Number of Field Test Schools /Classrooms by NCES Population Locales
NCES Population Locales
Description
Number of Field-Test
Schools
Sample %
National %
1. Large Central City
City with a population over 250,000
8
6.9%
10.2 %
2. Mid-Sized Central City
City with population less than 250,000
7
6.0%
10.5 %
3. Urban Fringe of a Large City
Suburb of a large city
22
19.0%
18.0%
4. Urban Fringe of a Mid-Sized City
Suburb of a mid-sized city
14
12.1%
10.0%
5. Large Town
Incorporated area outside of a city and with a population of 25,000 or more
0
0%
0.8%
6. Small Town Incorporated area outside of a city and with a population of 2,500 or more
17
14.6 %
10.8%
7. Rural Outside a Metropolitan Statistical Area
A rural territory away from a large or mid-sized city
35
30.2%
24.2%
8. Rural inside a Metropolitan Statistical Area
A rural territory close to a large or mid-sized city
13
11.2%
15.5%
TOTAL
116
100.0%
100%
Note 1: NCES did not report locale information for two schools. Note 2: The national percents were calculated from table #3303 obtained from NCES (nces.ed.gov/ccd/bat). Note 3: Chi Square goodness of fit = 9.91 (p =.293, 8 df) inferred from the literature regarding the concentration of minorities and under-achievement. Furthermore, the largest majority of high schools in the U.S. are in towns or rural areas that are not likely to have high concentrations of under-represented students except in locales near Alaskan Indian or Native American reservations and in small towns near the Mexican border. We chose to highlight the overall high school milieu as the dominant influencing agent of achievement as opposed to the actual socio/ethnic percentage breakdown of any single science classroom. A typical science class amounts to roughly 15% of a regular school day and it is likely that student attitudes and expectations are influenced more heavily
by the other 85% of the day. Students have a variety of close friends with whom they socialize or see throughout the school day or even after school. It would have been too narrow in scope to consider only the under-represented make up of the science class as shaping any student's attitude towards science achievement.
For every participating high school, we calculated the percent of under-represented students based on the school profile that we downloaded from the NCES website. Even though two thirds of our field tests were conducted in schools with low concentrations of under-represented students, we were able to reach schools that ranged in the percent of under-represented students from 0 to 98.6% as reported by NCES. (See Table 6) .
Journal of Materials Education Vol. 32 (5-6)
Materials World Modules-2002: A Nationally Representative Evaluation of Classrooms Gains 203
Table 5. Distribution of Field Test Classrooms by Course Titles
Science Discipline
Number of Classrooms
Sample
%
Science Course Titles
General Science, Physical Science, Survey Science,
Integrated Science, etc.
26
22.0%
General Science; Physical Science; Physical Science Honors: Physical Science (gifted); Science II; Integrated Physics & Chemistry (IPC); Chemistry & Physics; Science Technology Society (STS); Foundations of Science III; Integrated Physical Science
Chemistry
34
28.8%
Chemistry; Chemistry College Prep; Chemistry I; Chemistry II; Advanced Chemistry; Chemistry Honors; Chem-Com; Pre AP Chemistry; Analytical Chemistry
Physics 31 26.3% Physics; Applied Physics; Conceptual Physics; Physics Honors; AP Physics; Pre AP Physics
Biology 12 10.2% Biology; Applied Biology; Advanced Biology; Biology Honors; Biology I; Biology II; Global Life
Earth 2 1.7% Earth Science
Environmental 5 4.2% Environmental Science; AP Environmental Science
Technology/ Engineering 7 5.9% Technology; Introduction to Engineering; Pre Engineering; Science & Technology
Individual Research 1 < 1% Individual Science Research
TOTAL
118
100.0%
40 different titles of science classes
Table 6. Percent of Under-Represented Students in 118 Field Test Schools
Percent (%) of Under-Represented Students
in the School
Number
Sample %
Very Low 0-4%
46
39.0%
Low 5-20%
39
33.1%
Moderate 21-39%
18
15.3%
High 40-59%
9
7.6%
Very High 60-100%
3
2.5%
Unreported
3
2.5%
TOTAL
118
100.0%
Class size. Field test classrooms ranged in size from 5 to 35 students with a mean of 19.5 students per class as compared to the national average of 21.7 students per class. (Horizon Research, Inc, 200035, Table STQ 18a). A total of 2297 students participated in the field tests, and from that number we received complete student data packets from 2026 of them. That amounted to an 88.2% usable return rate. Boys comprised 51.4% of the total study sample and girls, 48.6%. The study sample was found to be statistically representative of an ideal sample comprised of 50% boys and 50% girls. (See Table 7).
Journal of Materials Education Vol. 32 (5-6)

Pellegrini 204
Table 7. The Study Sample: Class Size Range and Number of Students by Module and by Gender
MWM 2002 Module
Number of Classrooms
Class Size Range
Total # Students
Total # Boys
Total # Girls
Bonding & Polarity
13
5 - 26
196
82
114
Materials & the Environment
15 5 - 23 243 114 129
Motions & Forces
16 8 - 28 307 173 134
Properties of Matter
15 6 - 28 272 157 115
Properties of Solutions
16 6 - 28 261 125 136
Biotechnology
10 9 - 28 177 84 93
Conductivity
16 5 - 29 259 139 120
Light & Colors
17 10 - 30 311 167 144
TOTALS
118
5-35
2026
1041
(51.4%)
985
(48.6%) Teacher gender. Among the 118 classroom sites, women teachers slightly outnumbered men teachers (women = 65 or 55.1%); (men = 53 or 44.9 %.) The actual percentages of men and women secondary science teachers in the U.S. public high schools as reported by Horizon Research, Inc.35 is equal at 50% respectively. Even though the percentage of women teachers in the sample was approximately 5% higher than the national average, the sample is none-the-less statistically representative of an ideal sample in which 50% are men and 50% women. (See Table 8).
Table 8. Percent of Field Test Teachers by Gender
Teacher Gender
Number Sample %
National %
Men
53
44.9%
50%
Women
65
55.1%
50%
TOTAL
118
100.0%
100%
Note 1: Chi Square goodness of fit = 1.22 (p = .543, 2 df) Note 2: The national percent was obtained from Table STQ 39, Horizon Research Inc.35 .
The range of teachers' academic preparation ranged from bachelors to doctoral degrees with the largest group being those with master's degrees plus credits beyond (42.4%). The field-test sample statistically mirrors the national per-centages of teachers for each of three levels of academic preparation at the high school level (gr.9-12). The study sample was found to stat-istically represent the national profile.(Table 9).
Table 9. Teachers' Level of Academic Preparation
Teachers' Level of Academic Preparation
Number Sample %
National %
Bachelor's
49
42.6%
43%
Master's
63
54.8%
53%
Doctoral
3
2.5%
4%
TOTAL
115
99.9%
100%
Note 1 Due to rounding, total percents may not equal 100. Note 2: Three teachers did not report their level of academic preparation. Note 3: The national percents were determined from table STQ4a, Horizon Research, Inc.35. Note 4: Chi Square goodness of fit = .63 (p = .890, 3 df)
Journal of Materials Education Vol. 32 (5-6)
Materials World Modules-2002: A Nationally Representative Evaluation of Classrooms Gains 205
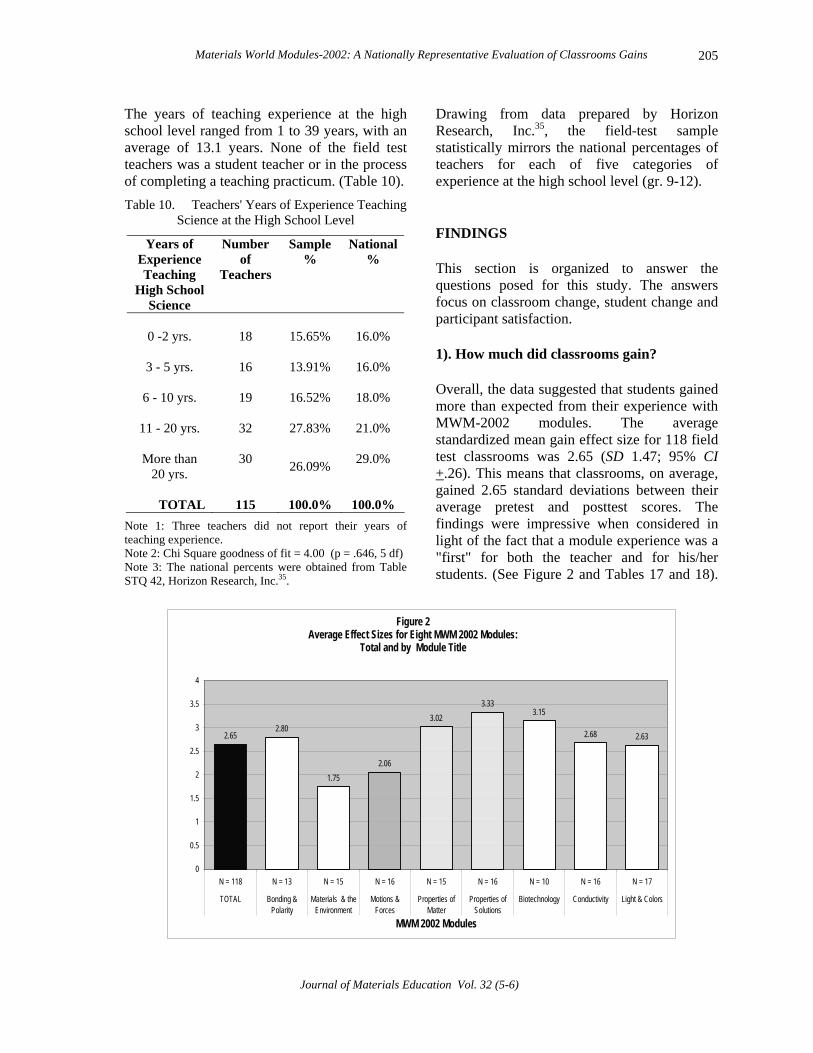
The years of teaching experience at the high school level ranged from 1 to 39 years, with an average of 13.1 years. None of the field test teachers was a student teacher or in the process of completing a teaching practicum. (Table 10).
Table 10. Teachers' Years of Experience Teaching Science at the High School Level
Years of Experience Teaching
High School Science
Number of
Teachers
Sample %
National %
0 -2 yrs.
18
15.65%
16.0%
3 - 5 yrs.
16
13.91%
16.0%
6 - 10 yrs.
19
16.52%
18.0%
11 - 20 yrs.
32
27.83%
21.0%
More than
20 yrs.
30
26.09%
29.0%
TOTAL
115
100.0%
100.0%
Note 1: Three teachers did not report their years of teaching experience. Note 2: Chi Square goodness of fit = 4.00 (p = .646, 5 df) Note 3: The national percents were obtained from Table STQ 42, Horizon Research, Inc.35.
Drawing from data prepared by Horizon Research, Inc.35, the field-test sample statistically mirrors the national percentages of teachers for each of five categories of xperience at the high school level (gr. 9-12).
INDINGS
ge, student change and articipant satisfaction.
). How much did classrooms gain?
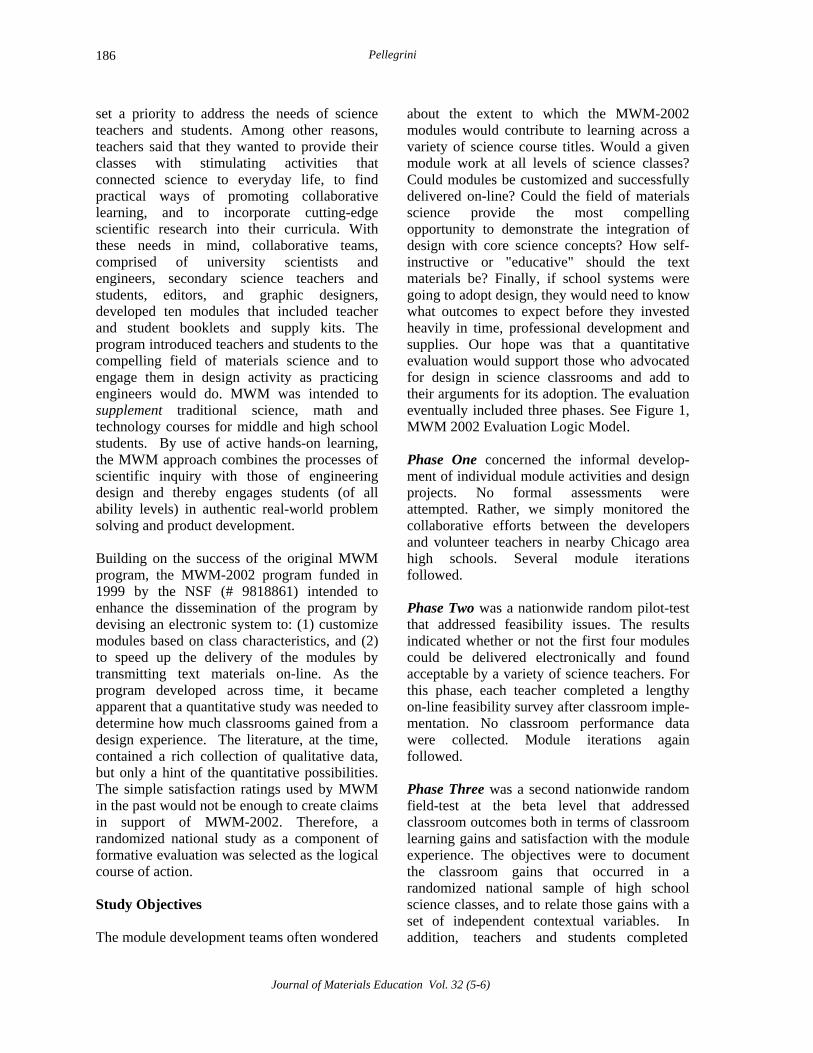
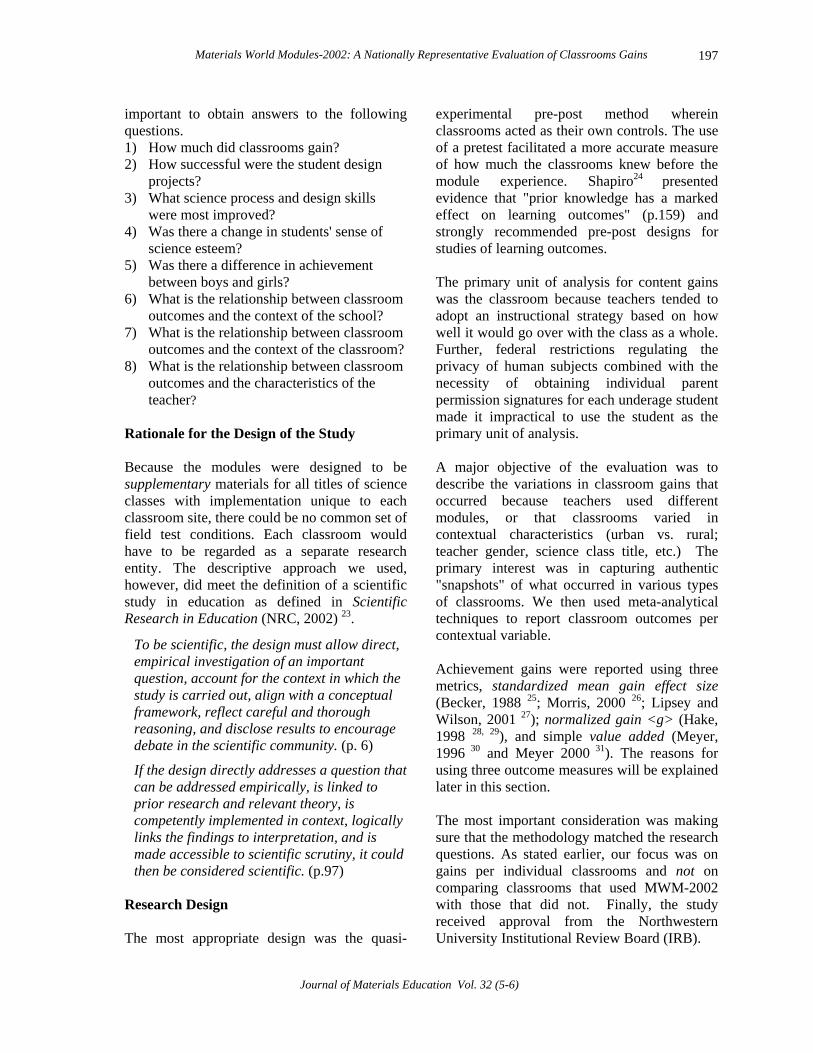
e F This section is organized to answer the questions posed for this study. The answers focus on classroom chanp 1 Overall, the data suggested that students gained more than expected from their experience with MWM-2002 modules. The average standardized mean gain effect size for 118 field test classrooms was 2.65 (SD 1.47; 95% CI +.26). This means that classrooms, on average, gained 2.65 standard deviations between their average pretest and posttest scores. The findings were impressive when considered in light of the fact that a module experience was a "first" for both the teacher and for his/her students. (See Figure 2 and Tables 17 and 18).
Figure 2 Average Effect Sizes for Eight MWM 2002 Modules:
Total and by Module Title
2.652.80
1.752.06
3.023.33
3.15
2.68 2.63
0
0.5
1
1.5
2
2.5
3
3.5
4
N = 118 N = 13 N = 15 N = 16 N = 15 N = 16 N = 10 N = 16 N = 17
TOTAL Bonding &Polarity
Materials & theEnvironment
Motions &Forces
Properties ofMatter
Properties ofSolutions
Biotechnology Conductivity Light & Colors
MWM 2002 Modules
Journal of Materials Education Vol. 32 (5-6)
Pellegrini 206
In so much as secondary science is organized around units lasting about two to three weeks in length, we were disappointed to find no national study that investigated increment of learning per unit of time shorter than one year. This lack of comparative information suggested that we had to compare our findings with smaller scale studies conducted by other researchers. The effect sizes for eight MWM-2002 modules were slightly higher on average than the effect sizes of 2.1, 1.9 and 2.7 reported by Fortus et al.18 for three design-based learning modules taught by the same teacher in three ninth and tenth grade physical science classes involving a total of 92 students. In addition, the findings surpassed the roughly 1 standard deviation (equivalent to an effect size of 1.00) reported by Hickey et al.17 for the study of a somewhat similar short-term design-based genetics module involving 31classes taught by 13 teachers. The Hickey et al. study differed in one important way: The genetics module with 17 activities was intended to
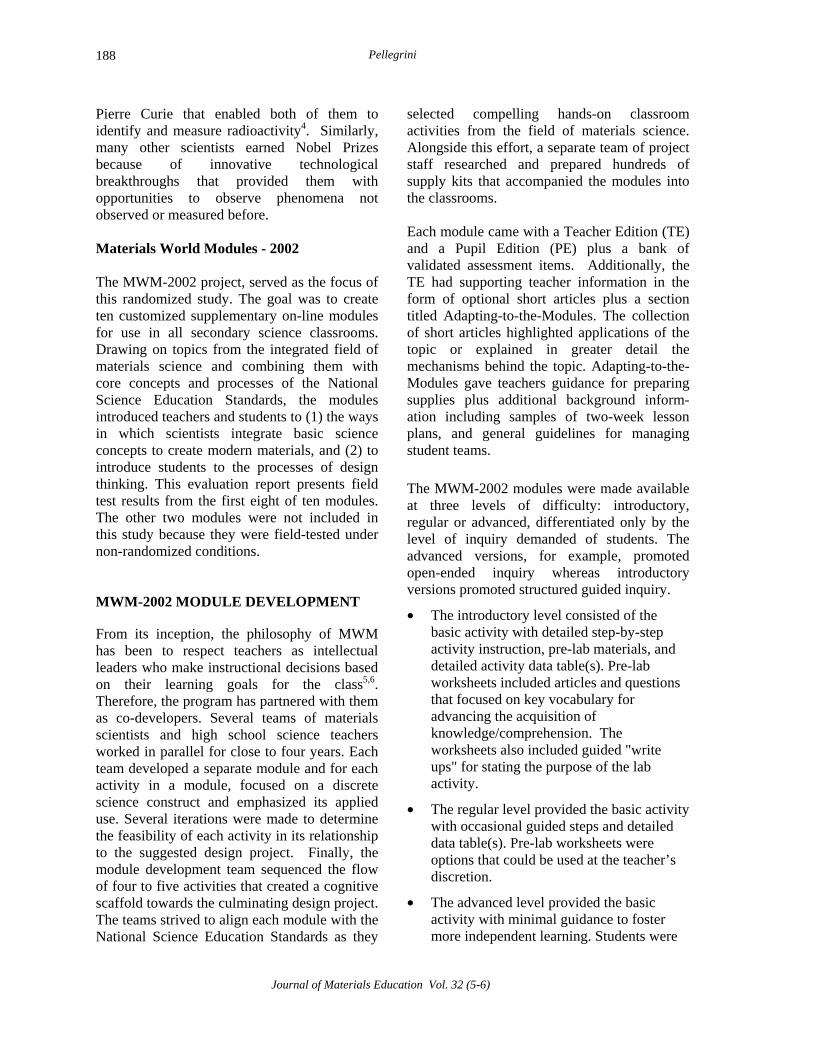
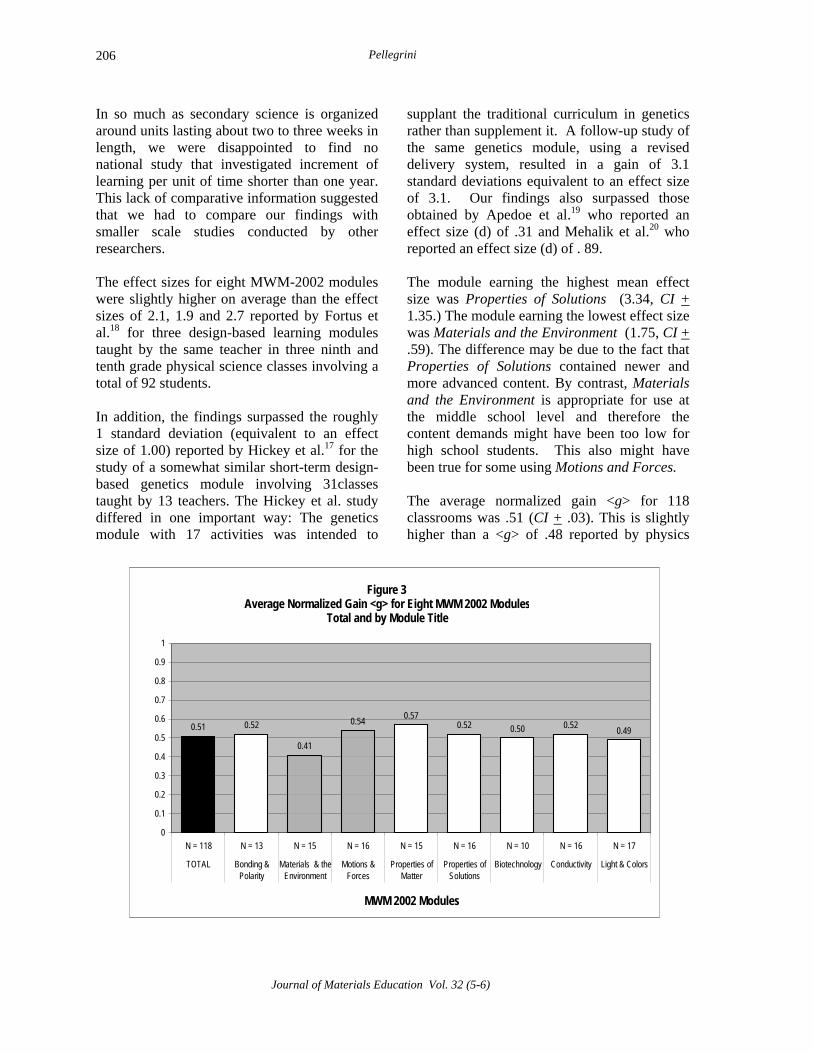
supplant the traditional curriculum in genetics rather than supplement it. A follow-up study of the same genetics module, using a revised delivery system, resulted in a gain of 3.1 standard deviations equivalent to an effect size of 3.1. Our findings also surpassed those obtained by Apedoe et al.19 who reported an effect size (d) of .31 and Mehalik et al.20 who reported an effect size (d) of . 89. The module earning the highest mean effect size was Properties of Solutions (3.34, CI + 1.35.) The module earning the lowest effect size was Materials and the Environment (1.75, CI + .59). The difference may be due to the fact that Properties of Solutions contained newer and more advanced content. By contrast, Materials and the Environment is appropriate for use at the middle school level and therefore the content demands might have been too low for high school students. This also might have been true for some using Motions and Forces. The average normalized gain <g> for 118 classrooms was .51 (CI + .03). This is slightly higher than a <g> of .48 reported by physics
Figure 3Average Normalized Gain <g> for Eight MWM 2002 Modules
Total and by Module Title
0.51 0.52
0.41
0.54 0.570.52 0.50 0.52 0.49
0
0.1
0.2
0.3
0.4
0.5
0.6
0.7
0.8
0.9
1
N = 118 N = 13 N = 15 N = 16 N = 15 N = 16 N = 10 N = 16 N = 17
TOTAL Bonding &Polarity
Materials & theEnvironment
Motions &Forces
Properties ofMatter
Properties ofSolutions
Biotechnology Conductivity Light & Colors
MWM 2002 Modules
Journal of Materials Education Vol. 32 (5-6)
Materials World Modules-2002: A Nationally Representative Evaluation of Classrooms Gains 207
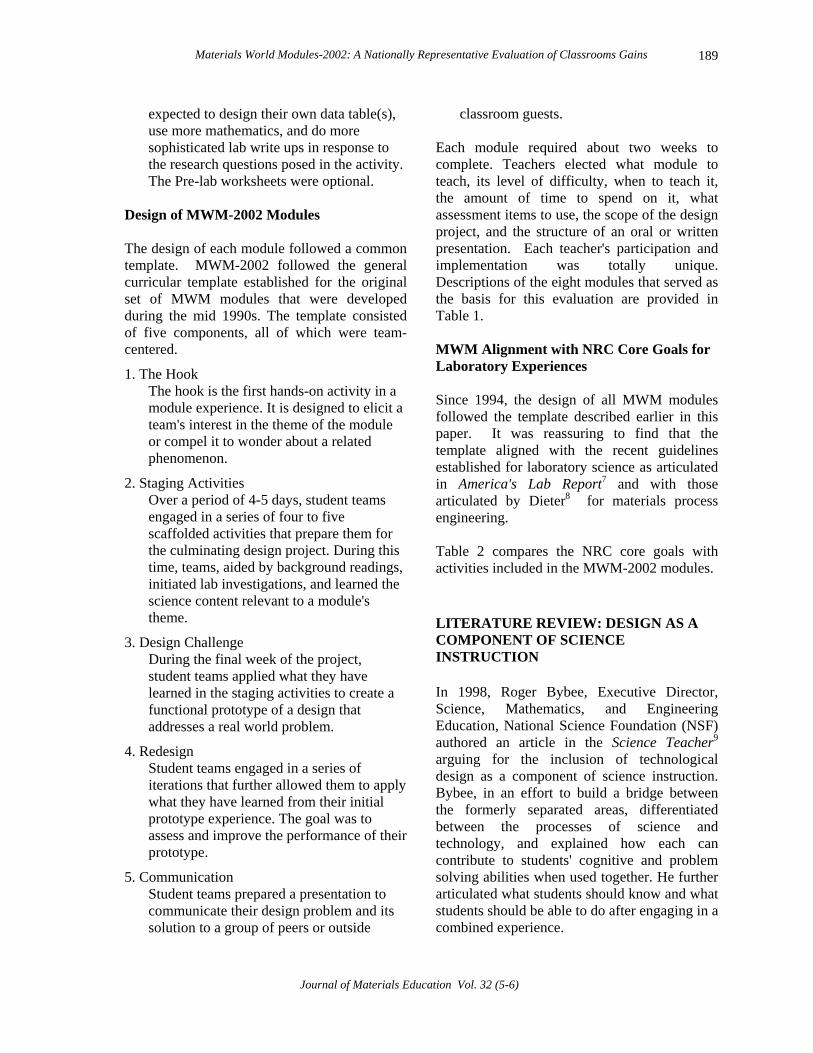
Figure 4 Average Percent (%) Value Added for Eight MWM 2002 Module
Total and by Module Title
31.75 32.03
23.3527.97
36.36 35.96 36.9633.01 30.22
0.00
10.00
20.00
30.00
40.00
50.00
60.00
70.00
80.00
90.00
100.00
N = 118 N = 13 N = 15 N = 16 N = 15 N = 16 N = 10 N = 16 N = 17
TOTAL Bonding &Polarity
Materials & theEnvironment
Motions &Forces
Properties ofMatter
Properties ofSolutions
Biotechnology Conductivity Light & Colors
MWM 2002 Modules
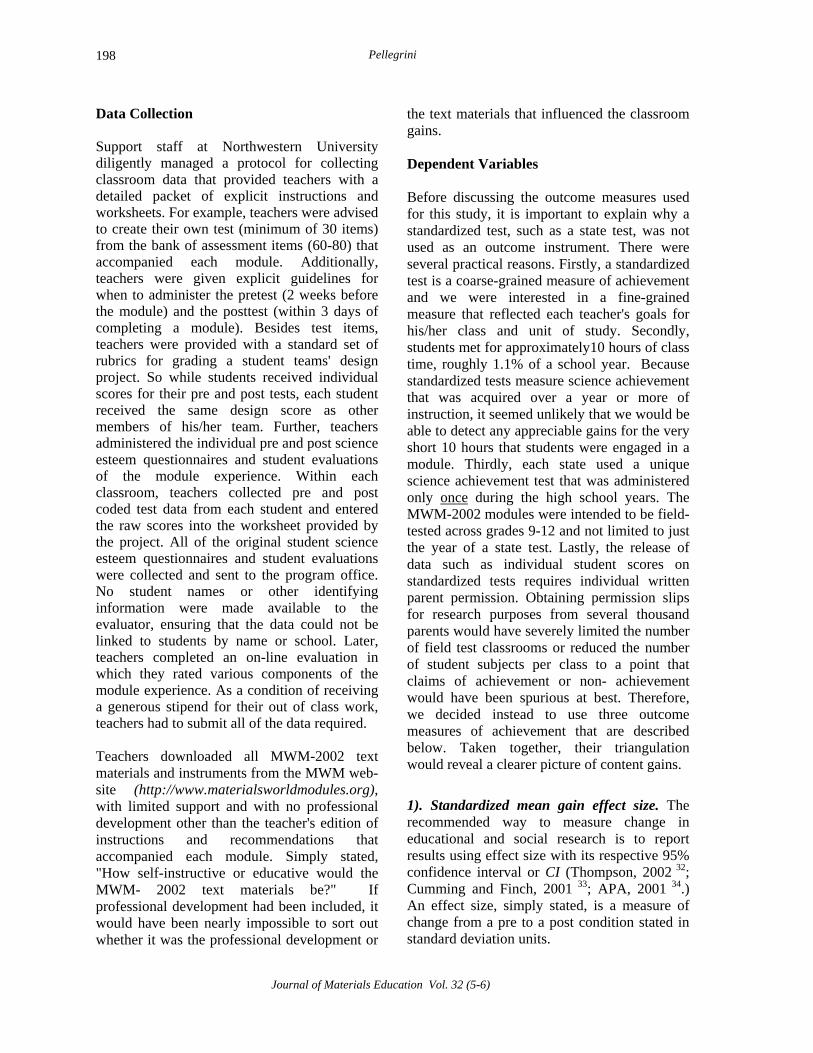
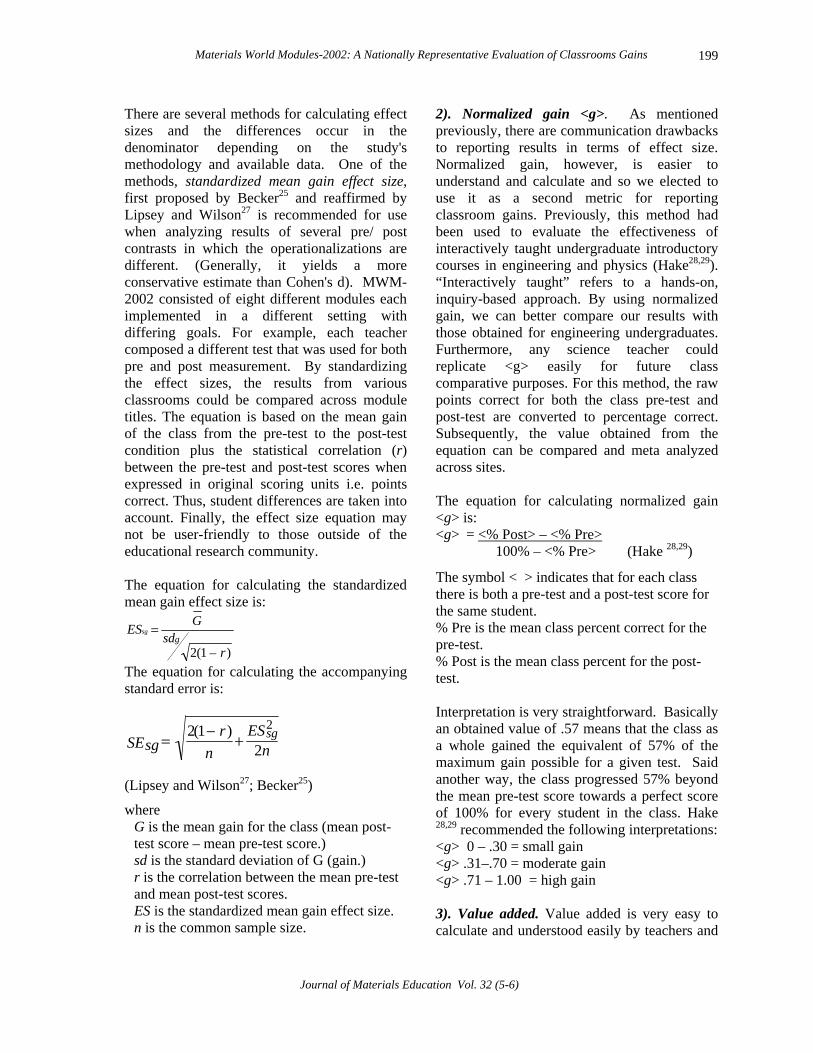
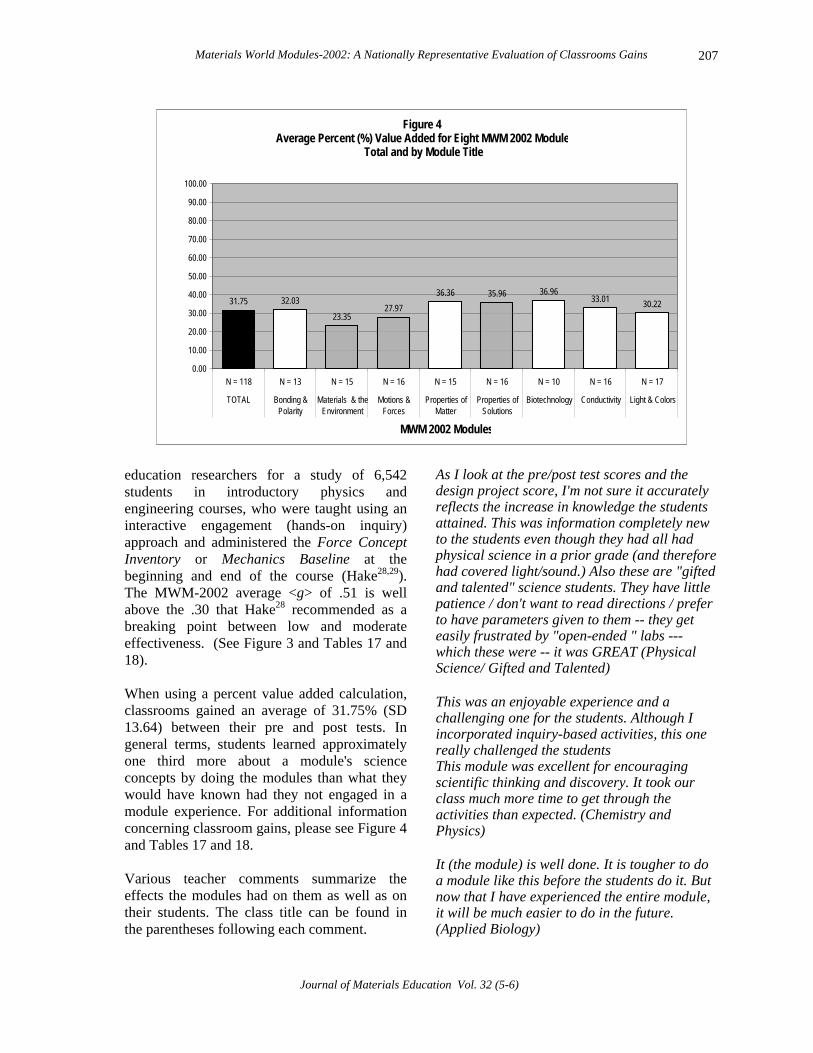
education researchers for a study of 6,542 students in introductory physics and engineering courses, who were taught using an interactive engagement (hands-on inquiry) approach and administered the Force Concept Inventory or Mechanics Baseline at the beginning and end of the course (Hake28,29). The MWM-2002 average <g> of .51 is well above the .30 that Hake28 recommended as a breaking point between low and moderate effectiveness. (See Figure 3 and Tables 17 and 18). When using a percent value added calculation, classrooms gained an average of 31.75% (SD 13.64) between their pre and post tests. In general terms, students learned approximately one third more about a module's science concepts by doing the modules than what they would have known had they not engaged in a module experience. For additional information concerning classroom gains, please see Figure 4 and Tables 17 and 18. Various teacher comments summarize the effects the modules had on them as well as on their students. The class title can be found in the parentheses following each comment.
As I look at the pre/post test scores and the design project score, I'm not sure it accurately reflects the increase in knowledge the students attained. This was information completely new to the students even though they had all had physical science in a prior grade (and therefore had covered light/sound.) Also these are "gifted and talented" science students. They have little patience / don't want to read directions / prefer to have parameters given to them -- they get easily frustrated by "open-ended " labs --- which these were -- it was GREAT (Physical Science/ Gifted and Talented) This was an enjoyable experience and a challenging one for the students. Although I incorporated inquiry-based activities, this one really challenged the students This module was excellent for encouraging scientific thinking and discovery. It took our class much more time to get through the activities than expected. (Chemistry and Physics) It (the module) is well done. It is tougher to do a module like this before the students do it. But now that I have experienced the entire module, it will be much easier to do in the future. (Applied Biology)
Journal of Materials Education Vol. 32 (5-6)
Pellegrini 208
My students didn't like having to think! It was great for forcing them to really know what was going on. (Chemistry II) Overall a very good learning experience for my students and me. Thanks for the opportunity to learn something new in technology! (Technology) I enjoyed incorporating these activities because (1) there is reinforcement on topics taught, and (2) the creation of their "own" activity takes theory taught with creativity and merges them together. (Physics Honors) Teachers were offered one of three levels of module difficulty thus enabling them to customize the module experience to their classes. Teachers could download the same MWM- 2002 module in introductory, regular or advanced versions. An ANOVA of all three metrics for measuring classroom gains (effect sizes, normalized gain and percent value added) for the three levels of difficulty showed no significant difference between them even though a difference would have been expected. (See Table 11 and Tables 17 and 18). From a practical perspective, the regular version appeared to be the most promising. This is probably due in part to the manner in which the other two versions were developed. During the early stages of module development, the developers found it confounding to try and develop three separate levels of the same content. To address this perplexing issue, the developers decided to vary the customization of the modules by varying the degree of inquiry
demanded for each version. For example, the advanced version contained the same content material and design project as the other two versions, but was structured with an open inquiry approach. That is, students had to figure out more procedures for themselves. The regular and introductory versions also contained the same content material and design project but they varied somewhat in the depth of content and the level of inquiry (mostly guided inquiry) provided to the students. For example, students using the introductory version were given prepared lab sheets with explicit directions. The variation in inquiry levels is probably the reason why some teachers commented on their need for more direction. It may have been that some teachers, not being familiar with MWM-2002, ordered difficulty levels that were inappropriate for their classes Their comments indicated that they and their students wanted to have clearer procedures to follow. A typical comment: The module was fun and interesting---the only problem we had was there was not much direction in setting up the design project (Pre AP Chemistry) Of interest, however, was the finding that there was a near significant difference in the average design scores for each of the three levels of difficulty (ANOVA p = .054). The advanced version was used more regularly by advanced or AP classes. One can reasonably assume that the higher design scores were due in part to the advanced level of the students themselves and their confidence for addressing design challenges and problem solving. (See Table 11).
Table 11. MWM 2002 Achievement Gains by Module Level of Difficulty MWM 2002 Module Level of Difficulty
Effect Size with 95% CI
Normalized Gain with 95% CI
% Value Added with 95% CI
Design Score
Introductory (n = 26)
2.45 + .66
.46 + .09
29.82% + 6.34
82.00 + 4.93
Regular (n = 66)
2.72 + .29
.52 + .04
32.65% + 3.00
83.86 + 1.86
Advanced (n = 26)
2.68 + .77
.53 + .05
31.39% + 6.14
87.65 + 2.64
ANOVA (p =.727) ANOVA (p = .216) ANOVA (p = .665) ANOVA (p =.054)
Journal of Materials Education Vol. 32 (5-6)
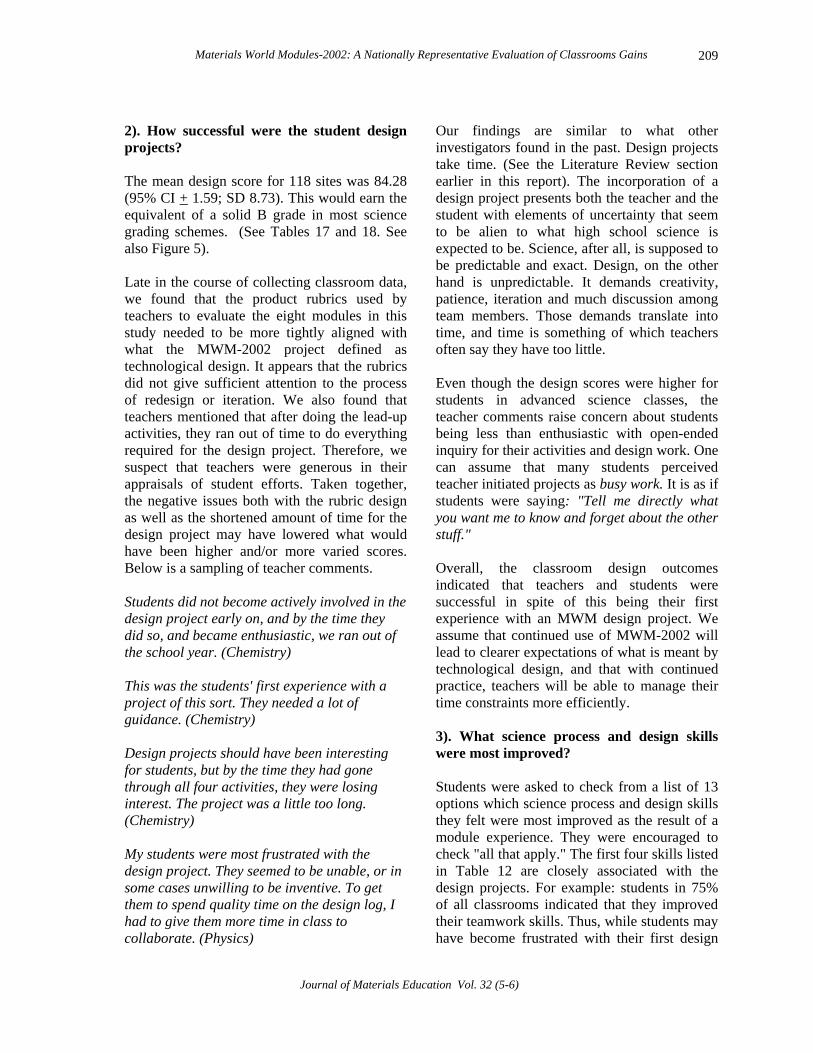
Materials World Modules-2002: A Nationally Representative Evaluation of Classrooms Gains 209
2). How successful were the student design projects? The mean design score for 118 sites was 84.28 (95% CI + 1.59; SD 8.73). This would earn the equivalent of a solid B grade in most science grading schemes. (See Tables 17 and 18. See also Figure 5). Late in the course of collecting classroom data, we found that the product rubrics used by teachers to evaluate the eight modules in this study needed to be more tightly aligned with what the MWM-2002 project defined as technological design. It appears that the rubrics did not give sufficient attention to the process of redesign or iteration. We also found that teachers mentioned that after doing the lead-up activities, they ran out of time to do everything required for the design project. Therefore, we suspect that teachers were generous in their appraisals of student efforts. Taken together, the negative issues both with the rubric design as well as the shortened amount of time for the design project may have lowered what would have been higher and/or more varied scores. Below is a sampling of teacher comments. Students did not become actively involved in the design project early on, and by the time they did so, and became enthusiastic, we ran out of the school year. (Chemistry) This was the students' first experience with a project of this sort. They needed a lot of guidance. (Chemistry) Design projects should have been interesting for students, but by the time they had gone through all four activities, they were losing interest. The project was a little too long. (Chemistry) My students were most frustrated with the design project. They seemed to be unable, or in some cases unwilling to be inventive. To get them to spend quality time on the design log, I had to give them more time in class to collaborate. (Physics)
Our findings are similar to what other investigators found in the past. Design projects take time. (See the Literature Review section earlier in this report). The incorporation of a design project presents both the teacher and the student with elements of uncertainty that seem to be alien to what high school science is expected to be. Science, after all, is supposed to be predictable and exact. Design, on the other hand is unpredictable. It demands creativity, patience, iteration and much discussion among team members. Those demands translate into time, and time is something of which teachers often say they have too little. Even though the design scores were higher for students in advanced science classes, the teacher comments raise concern about students being less than enthusiastic with open-ended inquiry for their activities and design work. One can assume that many students perceived teacher initiated projects as busy work. It is as if students were saying: "Tell me directly what you want me to know and forget about the other stuff." Overall, the classroom design outcomes indicated that teachers and students were successful in spite of this being their first experience with an MWM design project. We assume that continued use of MWM-2002 will lead to clearer expectations of what is meant by technological design, and that with continued practice, teachers will be able to manage their time constraints more efficiently. 3). What science process and design skills were most improved? Students were asked to check from a list of 13 options which science process and design skills they felt were most improved as the result of a module experience. They were encouraged to check "all that apply." The first four skills listed in Table 12 are closely associated with the design projects. For example: students in 75% of all classrooms indicated that they improved their teamwork skills. Thus, while students may have become frustrated with their first design
Journal of Materials Education Vol. 32 (5-6)
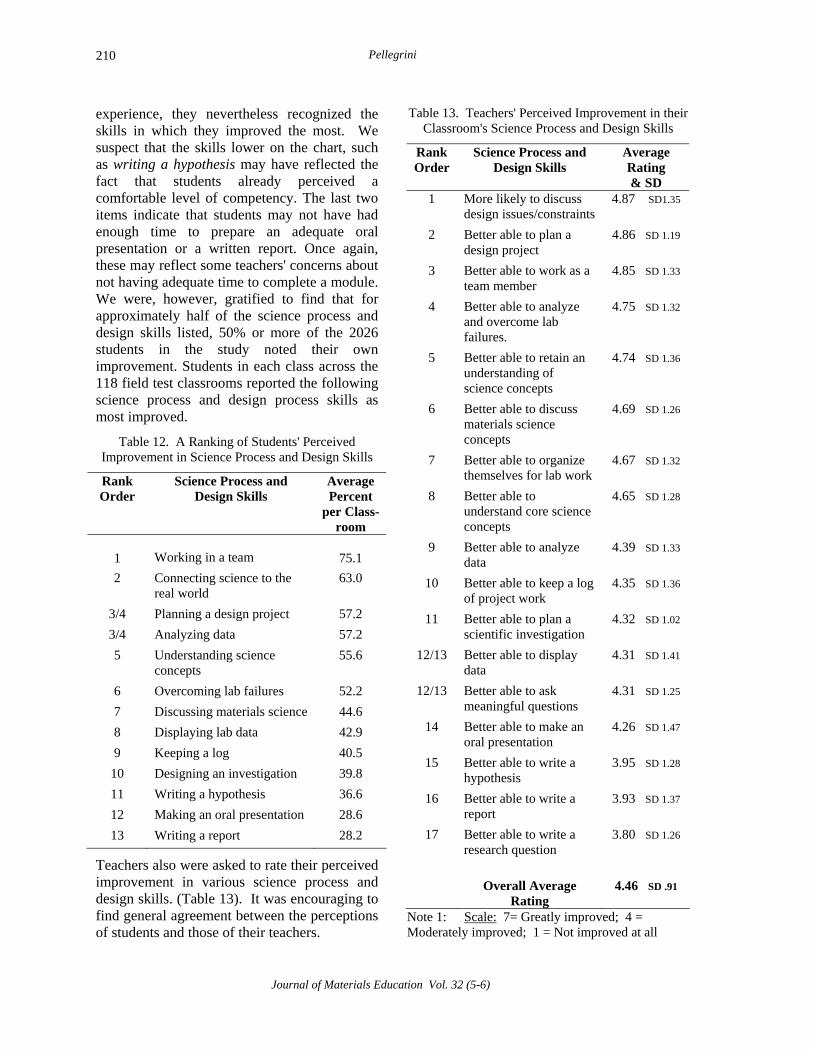
Pellegrini 210
experience, they nevertheless recognized the skills in which they improved the most. We suspect that the skills lower on the chart, such as writing a hypothesis may have reflected the fact that students already perceived a comfortable level of competency. The last two items indicate that students may not have had enough time to prepare an adequate oral presentation or a written report. Once again, these may reflect some teachers' concerns about not having adequate time to complete a module. We were, however, gratified to find that for approximately half of the science process and design skills listed, 50% or more of the 2026 students in the study noted their own improvement. Students in each class across the 118 field test classrooms reported the following science process and design process skills as most improved.
Table 12. A Ranking of Students' Perceived Improvement in Science Process and Design Skills
Rank Order
Science Process and Design Skills
Average Percent
per Class-room
1
Working in a team
75.1 2 Connecting science to the
real world 63.0
3/4 Planning a design project 57.2 3/4 Analyzing data 57.2 5 Understanding science
concepts 55.6
6 Overcoming lab failures 52.2 7 Discussing materials science 44.6 8 Displaying lab data 42.9 9 Keeping a log 40.5
10 Designing an investigation 39.8 11 Writing a hypothesis 36.6 12 Making an oral presentation 28.6 13 Writing a report 28.2
Teachers also were asked to rate their perceived improvement in various science process and design skills. (Table 13). It was encouraging to find general agreement between the perceptions of students and those of their teachers.
Table 13. Teachers' Perceived Improvement in their Classroom's Science Process and Design Skills
Rank Order
Science Process and Design Skills
Average Rating & SD
1 More likely to discuss design issues/constraints
4.87 SD1.35
2 Better able to plan a design project
4.86 SD 1.19
3 Better able to work as a team member
4.85 SD 1.33
4 Better able to analyze and overcome lab failures.
4.75 SD 1.32
5 Better able to retain an understanding of science concepts
4.74 SD 1.36
6 Better able to discuss materials science concepts
4.69 SD 1.26
7 Better able to organize themselves for lab work
4.67 SD 1.32
8 Better able to understand core science concepts
4.65 SD 1.28
9 Better able to analyze data
4.39 SD 1.33
10 Better able to keep a log of project work
4.35 SD 1.36
11 Better able to plan a scientific investigation
4.32 SD 1.02
12/13 Better able to display data
4.31 SD 1.41
12/13 Better able to ask meaningful questions
4.31 SD 1.25
14 Better able to make an oral presentation
4.26 SD 1.47
15 Better able to write a hypothesis
3.95 SD 1.28
16 Better able to write a report
3.93 SD 1.37
17 Better able to write a research question
3.80 SD 1.26
Overall Average
Rating
4.46 SD .91
Note 1: Scale: 7= Greatly improved; 4 = Moderately improved; 1 = Not improved at all
Journal of Materials Education Vol. 32 (5-6)
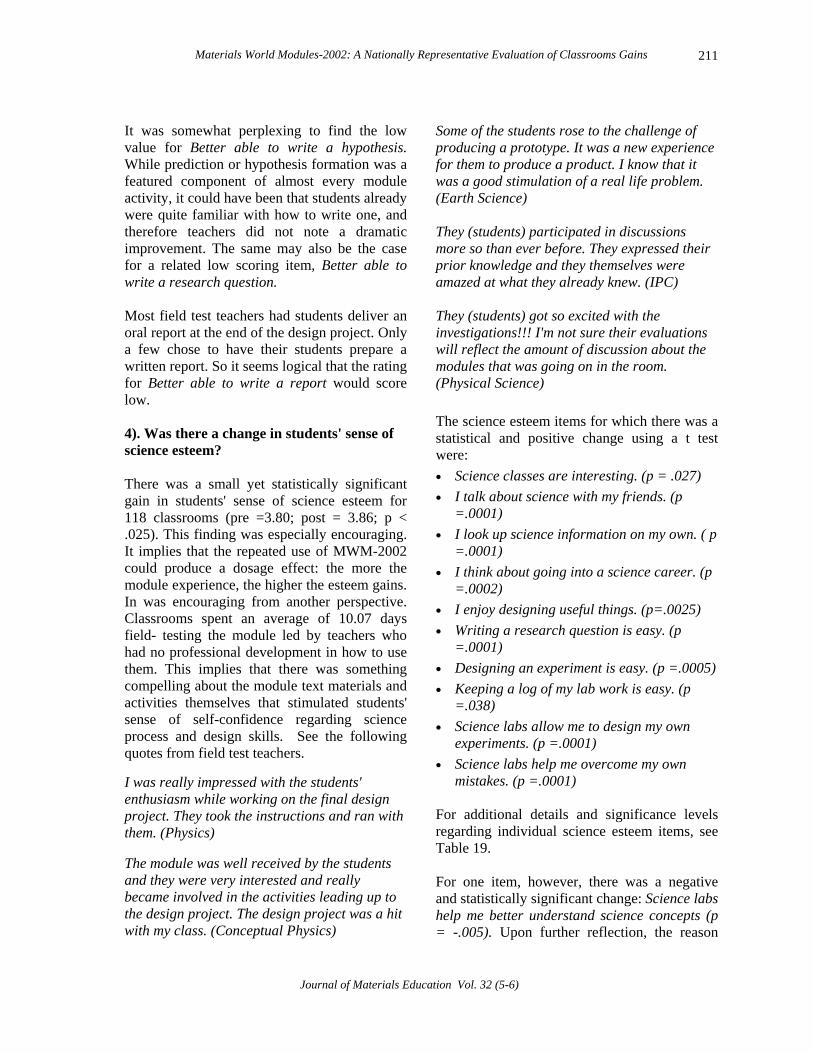
Materials World Modules-2002: A Nationally Representative Evaluation of Classrooms Gains 211
It was somewhat perplexing to find the low value for Better able to write a hypothesis. While prediction or hypothesis formation was a featured component of almost every module activity, it could have been that students already were quite familiar with how to write one, and therefore teachers did not note a dramatic improvement. The same may also be the case for a related low scoring item, Better able to write a research question. Most field test teachers had students deliver an oral report at the end of the design project. Only a few chose to have their students prepare a written report. So it seems logical that the rating for Better able to write a report would score low. 4). Was there a change in students' sense of science esteem? There was a small yet statistically significant gain in students' sense of science esteem for 118 classrooms (pre =3.80; post = 3.86; p < .025). This finding was especially encouraging. It implies that the repeated use of MWM-2002 could produce a dosage effect: the more the module experience, the higher the esteem gains. In was encouraging from another perspective. Classrooms spent an average of 10.07 days field- testing the module led by teachers who had no professional development in how to use them. This implies that there was something compelling about the module text materials and activities themselves that stimulated students' sense of self-confidence regarding science process and design skills. See the following quotes from field test teachers. I was really impressed with the students' enthusiasm while working on the final design project. They took the instructions and ran with them. (Physics) The module was well received by the students and they were very interested and really became involved in the activities leading up to the design project. The design project was a hit with my class. (Conceptual Physics)
Some of the students rose to the challenge of producing a prototype. It was a new experience for them to produce a product. I know that it was a good stimulation of a real life problem. (Earth Science) They (students) participated in discussions more so than ever before. They expressed their prior knowledge and they themselves were amazed at what they already knew. (IPC) They (students) got so excited with the investigations!!! I'm not sure their evaluations will reflect the amount of discussion about the modules that was going on in the room. (Physical Science) The science esteem items for which there was a statistical and positive change using a t test were: • Science classes are interesting. (p = .027) • I talk about science with my friends. (p
=.0001) • I look up science information on my own. ( p
=.0001) • I think about going into a science career. (p
=.0002) • I enjoy designing useful things. (p=.0025) • Writing a research question is easy. (p
=.0001) • Designing an experiment is easy. (p =.0005) • Keeping a log of my lab work is easy. (p
=.038) • Science labs allow me to design my own
experiments. (p =.0001) • Science labs help me overcome my own
mistakes. (p =.0001) For additional details and significance levels regarding individual science esteem items, see Table 19. For one item, however, there was a negative and statistically significant change: Science labs help me better understand science concepts (p = -.005). Upon further reflection, the reason
Journal of Materials Education Vol. 32 (5-6)
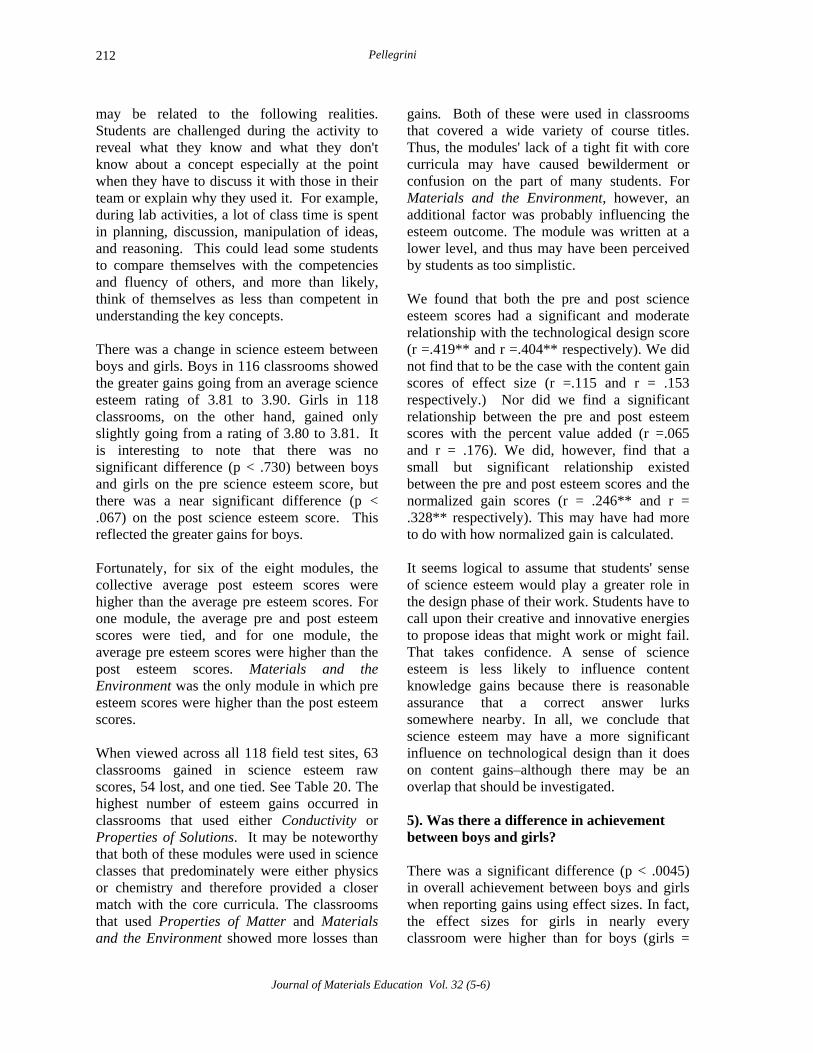
Pellegrini 212
may be related to the following realities. Students are challenged during the activity to reveal what they know and what they don't know about a concept especially at the point when they have to discuss it with those in their team or explain why they used it. For example, during lab activities, a lot of class time is spent in planning, discussion, manipulation of ideas, and reasoning. This could lead some students to compare themselves with the competencies and fluency of others, and more than likely, think of themselves as less than competent in understanding the key concepts. There was a change in science esteem between boys and girls. Boys in 116 classrooms showed the greater gains going from an average science esteem rating of 3.81 to 3.90. Girls in 118 classrooms, on the other hand, gained only slightly going from a rating of 3.80 to 3.81. It is interesting to note that there was no significant difference (p < .730) between boys and girls on the pre science esteem score, but there was a near significant difference (p < .067) on the post science esteem score. This reflected the greater gains for boys. Fortunately, for six of the eight modules, the collective average post esteem scores were higher than the average pre esteem scores. For one module, the average pre and post esteem scores were tied, and for one module, the average pre esteem scores were higher than the post esteem scores. Materials and the Environment was the only module in which pre esteem scores were higher than the post esteem scores. When viewed across all 118 field test sites, 63 classrooms gained in science esteem raw scores, 54 lost, and one tied. See Table 20. The highest number of esteem gains occurred in classrooms that used either Conductivity or Properties of Solutions. It may be noteworthy that both of these modules were used in science classes that predominately were either physics or chemistry and therefore provided a closer match with the core curricula. The classrooms that used Properties of Matter and Materials and the Environment showed more losses than
gains. Both of these were used in classrooms that covered a wide variety of course titles. Thus, the modules' lack of a tight fit with core curricula may have caused bewilderment or confusion on the part of many students. For Materials and the Environment, however, an additional factor was probably influencing the esteem outcome. The module was written at a lower level, and thus may have been perceived by students as too simplistic. We found that both the pre and post science esteem scores had a significant and moderate relationship with the technological design score (r =.419** and r =.404** respectively). We did not find that to be the case with the content gain scores of effect size (r =.115 and r = .153 respectively.) Nor did we find a significant relationship between the pre and post esteem scores with the percent value added (r =.065 and r = .176). We did, however, find that a small but significant relationship existed between the pre and post esteem scores and the normalized gain scores (r = .246** and r = .328** respectively). This may have had more to do with how normalized gain is calculated. It seems logical to assume that students' sense of science esteem would play a greater role in the design phase of their work. Students have to call upon their creative and innovative energies to propose ideas that might work or might fail. That takes confidence. A sense of science esteem is less likely to influence content knowledge gains because there is reasonable assurance that a correct answer lurks somewhere nearby. In all, we conclude that science esteem may have a more significant influence on technological design than it does on content gains–although there may be an overlap that should be investigated. 5). Was there a difference in achievement between boys and girls? There was a significant difference (p < .0045) in overall achievement between boys and girls when reporting gains using effect sizes. In fact, the effect sizes for girls in nearly every classroom were higher than for boys (girls =
Journal of Materials Education Vol. 32 (5-6)
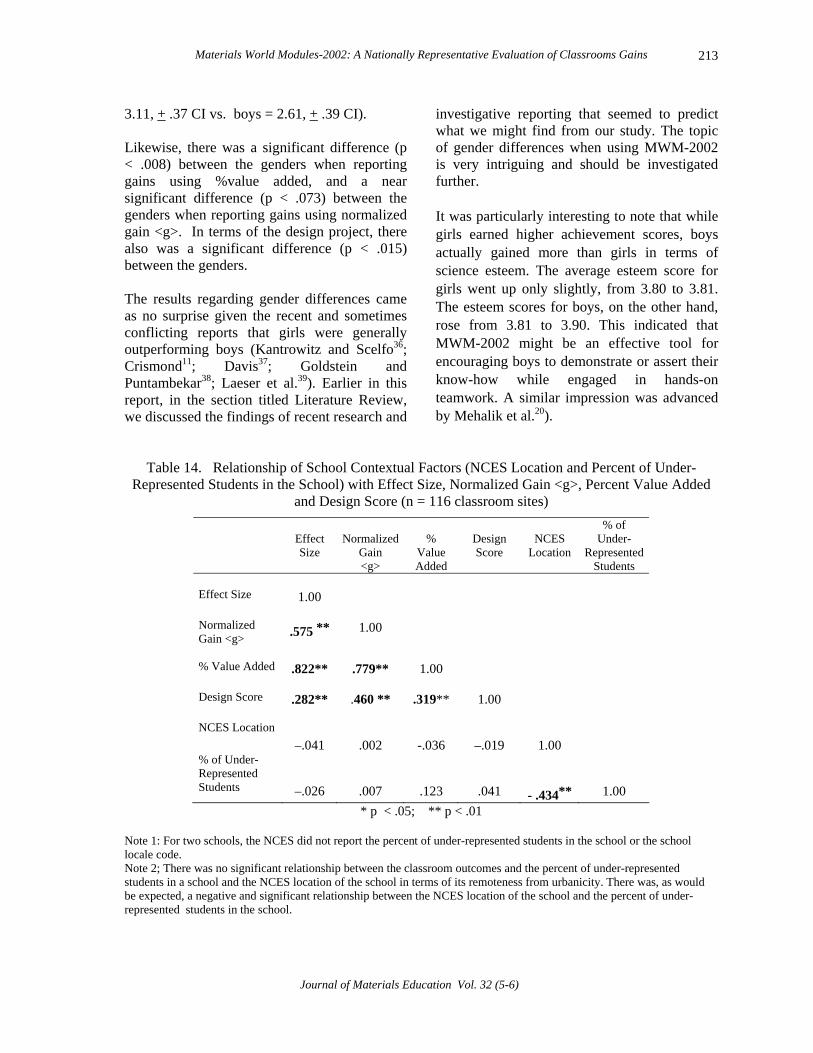
Materials World Modules-2002: A Nationally Representative Evaluation of Classrooms Gains
Journal of Materials Education Vol. 32 (5-6)
213
3.11, + .37 CI vs. boys = 2.61, + .39 CI). Likewise, there was a significant difference (p < .008) between the genders when reporting gains using %value added, and a near significant difference (p < .073) between the genders when reporting gains using normalized gain <g>. In terms of the design project, there also was a significant difference (p < .015) between the genders. The results regarding gender differences came as no surprise given the recent and sometimes conflicting reports that girls were generally outperforming boys (Kantrowitz and Scelfo36; Crismond11; Davis37; Goldstein and Puntambekar38; Laeser et al.39). Earlier in this report, in the section titled Literature Review, we discussed the findings of recent research and
investigative reporting that seemed to predict what we might find from our study. The topic of gender differences when using MWM-2002 is very intriguing and should be investigated further. It was particularly interesting to note that while girls earned higher achievement scores, boys actually gained more than girls in terms of science esteem. The average esteem score for girls went up only slightly, from 3.80 to 3.81. The esteem scores for boys, on the other hand, rose from 3.81 to 3.90. This indicated that MWM-2002 might be an effective tool for encouraging boys to demonstrate or assert their know-how while engaged in hands-on teamwork. A similar impression was advanced by Mehalik et al.20).
Table 14. Relationship of School Contextual Factors (NCES Location and Percent of Under-Represented Students in the School) with Effect Size, Normalized Gain <g>, Percent Value Added
and Design Score (n = 116 classroom sites)
Effect Size
Normalized
Gain <g>
%
Value Added
Design Score
NCES
Location
% of Under-
Represented Students
Effect Size
1.00
Normalized Gain <g>
.575 **
1.00
% Value Added
.822**
.779**
1.00
Design Score
.282**
.460 **
.319**
1.00
NCES Location
–.041
.002
-.036
–.019
1.00
% of Under- Represented Students
–.026
.007
.123
.041
- .434**
1.00 * p < .05; ** p < .01
Note 1: For two schools, the NCES did not report the percent of under-represented students in the school or the school locale code. Note 2; There was no significant relationship between the classroom outcomes and the percent of under-represented students in a school and the NCES location of the school in terms of its remoteness from urbanicity. There was, as would be expected, a negative and significant relationship between the NCES location of the school and the percent of under-represented students in the school.

Pellegrini 214
6). What is the relationship between student outcomes and the context of the school? Two factors were investigated: (1) the percent of under-represented students in the school, and (2) the NCES locale of the school, which we used as a rough measure of remoteness from a large urban statistical area. The percent of under-represented students in a school was not significantly related with content achievement, i.e. effect size, normalized gain, percent value added and the design score. Similarly, the NCES locale was not significantly related to achievement. As would we expected, there was a significant and moderate negative relationship between the
NCES location of the school and the percent of underrepresented students in the school (r = –.434, p < .01). This was not a concern. It only meant that schools in major urban locations had the highest percent of under-represented students in the sample. The data suggested that MWM-2002 could be used successfully in any contextual school setting. 7). What is the relationship between student outcomes and the context of the classroom? Four factors were investigated: (1) the science esteem score of the class prior to a module experience; (2) module level of difficulty; (3) class size, and (4) class time or the number of days that the module was taught. (Table 15).
Table 15. Relationship of Classroom Contextual Factors with Effect Size, Normalized Gain <g>, Percent
Value Added and Design Score
* p < .05; ** p < .01
Effect Size
Normalized
Gain <g>
% Value Added
Design Score
Student Science Esteem (pre)
Module Level of
Difficulty
Class Size
Class Time (days)
Effect Size
1.00
Normalized Gain <g>
.575**
1.00
% Value Added
.822**
.779**
1.00
Design Score
.282**
.460**
.319**
1.00
Student Science Esteem (pre)
.114
.245**
.064
.417**
1.00
Module Level of Difficulty
.051
.143
.038
.216*
.352**
1.00
Class Size
– .008
.074
.019
.049
– .099
.029
1.00
Class Time (days)
–.026
–.030
.086
–.089
–.239*
– .181
.016
1.00
Note 1: Two classroom teachers did not return the requested information. Note 2: Students' sense of science esteem prior to engaging in a module experience appeared to have significantly
influenced the normalized gain scores and the design scores. This, in part, was positively related to a module's level of difficulty and negatively related to the amount of class time provided for the module.
Journal of Materials Education Vol. 32 (5-6)

Materials World Modules-2002: A Nationally Representative Evaluation of Classrooms Gains 215
The class' collective sense of science esteem prior to the module experience was sign-ificantly related to a module's level of difficulty (r = .352, p <.01). This meant that a class with a strong collective sense of science esteem could probably do well using the advanced version. Science esteem was negatively and significantly related to the amount of time a module was taught (r = –.239, p <.01). This indicated that students possibly became frustrated with or confused about their own performance in classrooms when there was an insufficient amount of time to satisfactorily complete a module experience. This may have affected the results of the design project as well because a class' collective sense of science esteem was significantly and positively related to the class' average design score (r =.417, p < .01). The higher the esteem level of the class going into a module experience, the higher the design scores tended to be. The four factors describing the context of the classroom were not significantly related with effect size or the percent value added. The normalized gain, however was positively and significantly related with a class' collective sense of science esteem (r =.245, p < .01). This may have been due in part to the equation used to calculate normalized gain. The equation for effect size, on the other hand, reports new information learned in standard deviation units that are not linear as are normalized gain units. The class' collective sense of science esteem was positively related to the design score (r = .417, p <.01). It seems reasonable that students' perceived level of confidence in science would influence their success in tackling new and unfamiliar tasks and thinking through various failure situations such as those encountered in a design project. The pre esteem score mean was positively and significantly associated with the module level of difficulty (r = .352, p < .01). This was due in part to the design of the advanced versions of
each module. The more advanced versions limited the amount of guidance given to stud-ents thereby challenging them to work at a higher level of inquiry and to draw more heavily on their sense of self confidence. Classroom design scores were positively and significantly related to a module's level of difficulty (r = .216, p < .05), although the relationship was not strong. Honors and AP Classes tended to use the advanced version of a module. Such classes also tended to go into a module experience with a higher collective level of science esteem. 8). What is the relationship between student outcomes and the characteristics of the teacher? Four factors were analyzed: (1) teacher gender; (2) teacher academic preparation; (3) years of teaching experience, and (4) hours of preparation to teach a module. (See Table 16). As expected, there was a positive and significant relationship (r = .365, p < .01) between the teacher's years of experience and the teacher's level of academic preparation. The longer a teacher remains in teaching, the higher the probability of earning an advanced degree. There was a positive and significant relationship (r = .190, p < .05) between a teacher's gender and the amount of time spent in module preparation. Women teachers spent more time in preparation than their male counterparts. The data indicated that MWM-2002 could be taught successfully by all science teachers, but those holding a master's degree and those with six or more years of experience had an advantage. Chemistry and physics teachers also had an advantage probably because much of the MWM-2002 content was more closely related to their areas of expertise. (See Table 17, Meta Analysis of MWM 2002 Classroom Outcomes).
Journal of Materials Education Vol. 32 (5-6)

Pellegrini 216
Table 16. Relationship of Teacher Characteristics with Effect Size, Normalized Gain <g>, Percent Value Added and Design Score (n = 116 classroom)
* p < .05; * p < .01
Meta-Analysis and Summary Tables
Because this formative evaluation is a descriptive study of field test findings, we have included a meta analysis in Table 17 that reports gains by 11 contextual variables along with ANOVAs that indicate whether or not there was a significant difference within the variable categories. A significant variation is indicated by a value lower than .05. A value higher than .05 indicates no significant difference. The self-explanatory tables on the following pages summarized data obtained for the collective group of 118 field-test classrooms. They are:
− Table17: A Meta Analysis of MWM-2002 Classroom Outcomes
− Table18: Summary of MWM-2002 Classroom Outcomes; Total, by Module, and by Student Gender
− Table19: Change in Students' Sense of Science Esteem
− Table 20: Change in Students' Sense of Science Esteem: Total. by Module Title , and by Student Gender
− Table 21: Student Satisfaction with MWM-2002 Modules: Total and by Module Title
− Table 22: Overall Teacher Satisfaction with On-Line Text Materials for Eight MWM-2002 Modules
− Table 23: Overall Teacher Satisfaction with the Classroom Implementation of Eight MWM-2002 Modules
Effect Size
Normalized Gain <g>
% Value Added
Design Score
Teacher Gender
Teacher Academic
Prep.
Teacher Yrs. of
Experience
Module Prep. Hours
Effect Size
1.00
Normalized Gain <g>
.575**
1.00
% Value Added
.822**
.779**
1.00
Design Score
.282**
.460**
.319**
1.00
Teacher Gender
.036
.074
.073
.151
1.00
Teacher Academic Prep.
.224*
.145
.131
–.013
–.221*
1.00
Teacher Yrs. of Experience
.116
.093
.028
.016
–.170
.365**
1.00
Module Prep. Hours
.066
.082
.148
.023
.190*
.011
.065
1.00
Journal of Materials Education Vol. 32 (5-6)

Materials World Modules-2002: A Nationally Representative Evaluation of Classrooms Gains 217
Table 17. Meta Analysis of MWM-2002 Classroom Outcomes (n = 118 classroom)
Independent Variable
n
Average Standardized Mean Gain Effect Size & 95% CI
Average Normalized
Gain <g>
& 95% CI
Average Value Added (%)
& 95% CI
Average Class Design
Score & 95% CI 100 = Hi
Module
Bonding & Polarity Materials & the Environ Motions & Forces Properties of Matter Properties of Solutions Biotechnology Conductivity Light and Colors
13 15 16 15 16 10 16 17
2.80 + .70 1.75 + .59 2.06 + .52 3.02 + .68 3.33 + 1.35 3.15 + .89 2.68 + .66 2.63 + .62
ANOVA (p = .050)
.52 + .09 .41 + .09 .54 + .08 .57 + .10 .52 + .09 .50 + .14 .52 + .11 .49 + .10 ANOVA (p = .448)
32.03% + 6.63 23.35% + 6.75 27.97% + 5.99 36.36% + 8.67 35.96% + 9.20 36.96% + 9.76 33.01% + 6.31 30.22% + 6.35
ANOVA (p = .096)
85.67 + 4.93 81.73 + 4.97 84.34 + 2.75 84.92 + 3.60 84.67 + 4.40 85.11 + 3.71 83.02 + 5.98 85.22 + 6.65 ANOVA (p .943)
U.S. Geo-region
North East NE South East SE North Central NC South Central SC North West NW South West SW
18 17 33 18 19 13
2.05 + .58 2.78 + .78 3.25 + .63 2.57 + .69 2.49 + .56 2.16 + .61
ANOVA (p = .061)
.46 + .10 .52 + .09 .55 + .05 .50 + .11 .51 + .09 .47 + .10 ANOVA (p =.549)
26.52% + 7.13 32.36% + 6.84 35.37% + 5.01 32.86% + 6.84 31.64% + 6.50 27.63% + 6.56
ANOVA (p = .279)
84.05 + 5.47 86.73 + 6.44 85.51 + 2.14 86.40 + 2.71 80.37 + 4.64 81.09 + 3.29 ANOVA (p .123)
% of Under-represented Students in the School
Very Low 0-4% Low 5-20% Moderate 21-39% High 40-59% Very High 60-100% Unreported
46 39 18 9 3 3
2.58 + .40 2.61 + .56 2.69 + .74 2.57 + .82 3.10 + 4.28
–
ANOVA (p = .983)
.49 + .06 .53 + .06 .54 + .10 .46 + .14 .51 + .46
_
ANOVA (p =.717)
29.12% + 3.46 32.17% + 4.85 32.57% + 7.29
33.57% + 10.15 40.27% + 46.74
–
ANOVA (p = .551)
84.08 + 2.55 83.22 + 2.59 86.42 + 5.88 84.46 + 5.85 86.68 + 13.72
–
ANOVA (p=.762) Community (NCES Locale by Code)
1 Large City 2 Mid Size City 3 Fringe /Large City 4 Fringe /Mid Size City 5 Large Town 6 Small Town 7 Rural not in MSA 8 Rural in MSA 8 Unreported
8 7
22 14 0
17 35 13 2
2.69 + 1.75 2.67 + .90 3.10 + .93 1.97 + .60
– 2.65 + .58 2.60 + .47 2.64 + .71
– ANOVA (p = .558)
.51 + .14
.54 + .17
.53 + .10
.44 + .09 –
.51 + .08
.52 + .07
.51 + .11 –
ANOVA (p = .895)
28.54% + 9.84 34.27% + 14.65 35.41% + 7.82 26.05% + 7.57
– 34.36% + 6.56 30.48% + 3.98 30.40% + 7.83
– ANOVA (p = .462)
83.33 + 13.24 84.64 + 7.88 84.67 + 4.37 86.04 + 4.88
– 84.46 + 4.17 82.87 + 2.52 86.16 + 4.54
– ANOVA (p = .905)
Journal of Materials Education Vol. 32 (5-6)
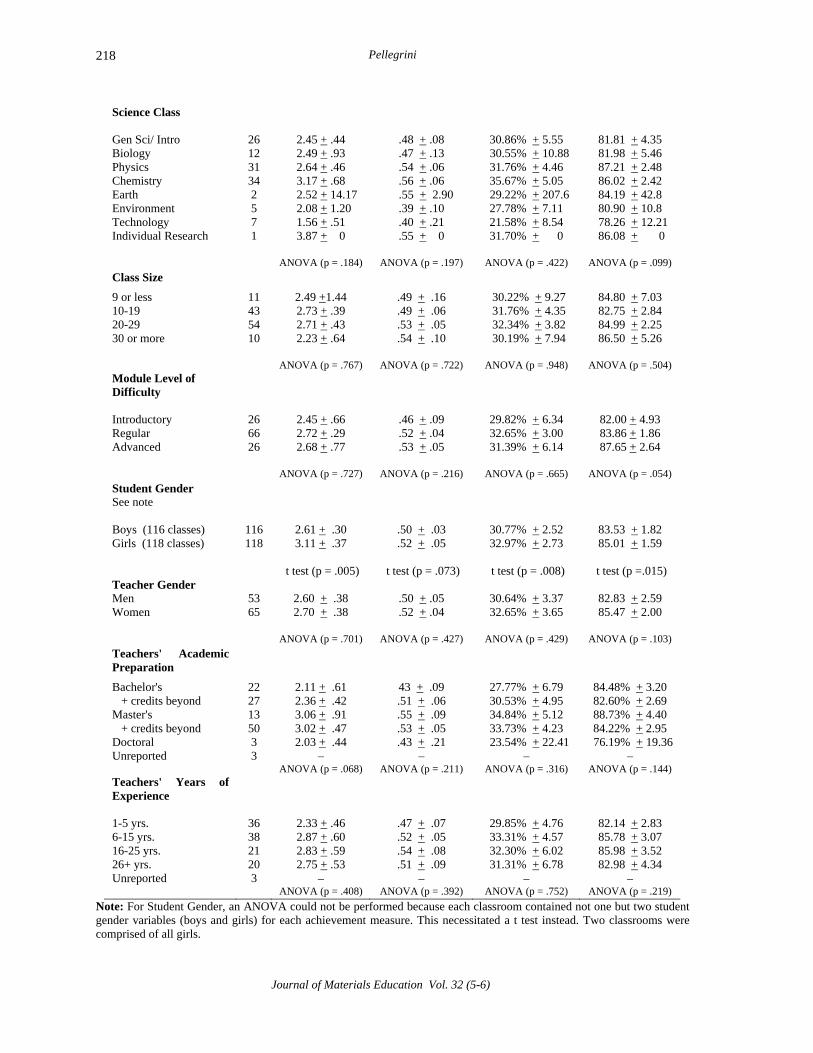
Pellegrini 218
Science Class Gen Sci/ Intro Biology Physics Chemistry Earth Environment Technology Individual Research
26 12 31 34 2 5 7 1
2.45 + .44 2.49 + .93 2.64 + .46 3.17 + .68
2.52 + 14.17 2.08 + 1.20 1.56 + .51 3.87 + 0
ANOVA (p = .184)
.48 + .08 .47 + .13 .54 + .06 .56 + .06
.55 + 2.90 .39 + .10 .40 + .21 .55 + 0
ANOVA (p = .197)
30.86% + 5.55
30.55% + 10.88 31.76% + 4.46 35.67% + 5.05
29.22% + 207.6 27.78% + 7.11 21.58% + 8.54 31.70% + 0
ANOVA (p = .422)
81.81 + 4.35 81.98 + 5.46 87.21 + 2.48 86.02 + 2.42 84.19 + 42.8 80.90 + 10.8
78.26 + 12.21 86.08 + 0
ANOVA (p = .099)
Class Size
9 or less 10-19 20-29 30 or more
11 43 54 10
2.49 +1.44 2.73 + .39 2.71 + .43 2.23 + .64
ANOVA (p = .767)
.49 + .16
.49 + .06
.53 + .05
.54 + .10
ANOVA (p = .722)
30.22% + 9.27 31.76% + 4.35 32.34% + 3.82 30.19% + 7.94 ANOVA (p = .948)
84.80 + 7.03 82.75 + 2.84 84.99 + 2.25 86.50 + 5.26
ANOVA (p = .504)
Module Level of Difficulty
Introductory Regular Advanced
26 66 26
2.45 + .66 2.72 + .29 2.68 + .77
ANOVA (p = .727)
.46 + .09 .52 + .04 .53 + .05
ANOVA (p = .216)
29.82% + 6.34 32.65% + 3.00 31.39% + 6.14
ANOVA (p = .665)
82.00 + 4.93 83.86 + 1.86 87.65 + 2.64
ANOVA (p = .054)
Student Gender See note
Boys (116 classes) Girls (118 classes)
116 118
2.61 + .30 3.11 + .37
t test (p = .005)
.50 + .03 .52 + .05
t test (p = .073)
30.77% + 2.52 32.97% + 2.73
t test (p = .008)
83.53 + 1.82 85.01 + 1.59
t test (p =.015)
Teacher Gender Men Women
53 65
2.60 + .38 2.70 + .38
ANOVA (p = .701)
.50 + .05
.52 + .04
ANOVA (p = .427)
30.64% + 3.37 32.65% + 3.65
ANOVA (p = .429)
82.83 + 2.59 85.47 + 2.00
ANOVA (p = .103)
Teachers' Academic Preparation
Bachelor's + credits beyond Master's + credits beyond Doctoral Unreported
22 27 13 50 3 3
2.11 + .61 2.36 + .42 3.06 + .91 3.02 + .47 2.03 + .44
– ANOVA (p = .068)
43 + .09 .51 + .06 .55 + .09 .53 + .05 .43 + .21
– ANOVA (p = .211)
27.77% + 6.79 30.53% + 4.95 34.84% + 5.12 33.73% + 4.23
23.54% + 22.41 –
ANOVA (p = .316)
84.48% + 3.20 82.60% + 2.69 88.73% + 4.40 84.22% + 2.95
76.19% + 19.36 –
ANOVA (p = .144) Teachers' Years of Experience
1-5 yrs. 6-15 yrs. 16-25 yrs. 26+ yrs. Unreported
36 38 21 20 3
2.33 + .46 2.87 + .60 2.83 + .59 2.75 + .53
– ANOVA (p = .408)
.47 + .07 .52 + .05 .54 + .08 .51 + .09
– ANOVA (p = .392)
29.85% + 4.76 33.31% + 4.57 32.30% + 6.02 31.31% + 6.78
– ANOVA (p = .752)
82.14 + 2.83 85.78 + 3.07 85.98 + 3.52 82.98 + 4.34
– ANOVA (p = .219)
Note: For Student Gender, an ANOVA could not be performed because each classroom contained not one but two student gender variables (boys and girls) for each achievement measure. This necessitated a t test instead. Two classrooms were comprised of all girls.
Journal of Materials Education Vol. 32 (5-6)
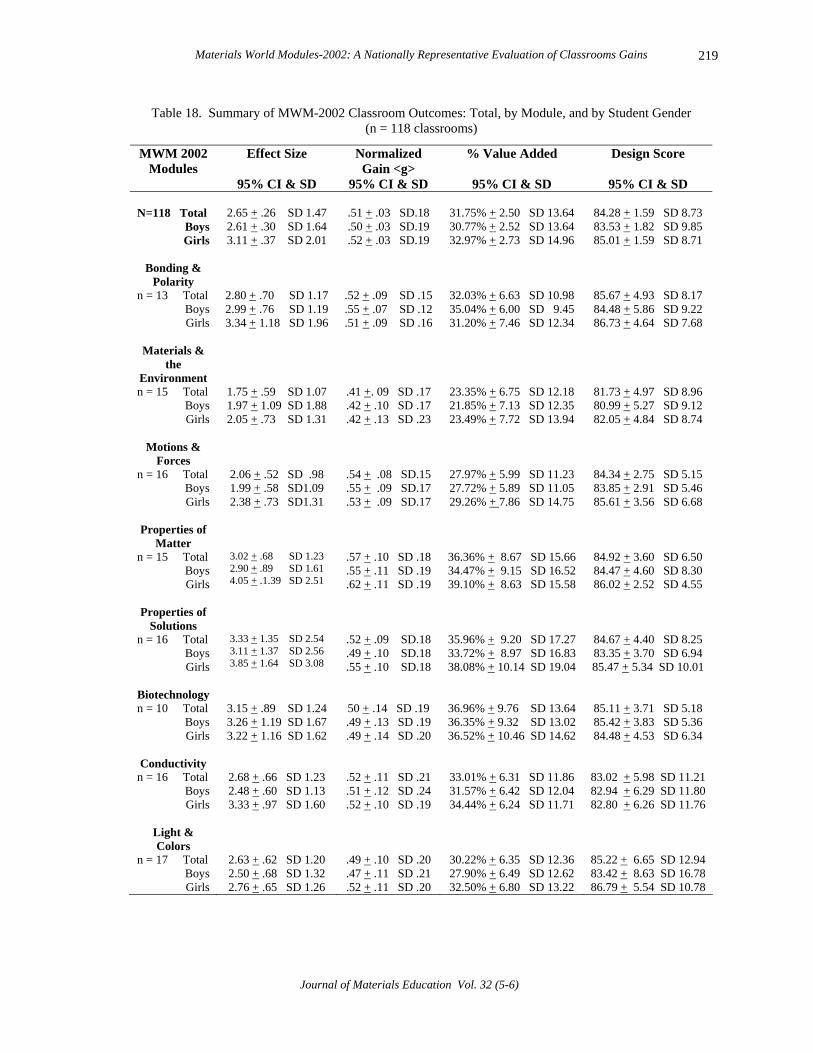
Materials World Modules-2002: A Nationally Representative Evaluation of Classrooms Gains 219
Table 18. Summary of MWM-2002 Classroom Outcomes: Total, by Module, and by Student Gender (n = 118 classrooms)
MWM 2002 Modules
Effect Size
95% CI & SD
Normalized Gain <g>
95% CI & SD
% Value Added
95% CI & SD
Design Score
95% CI & SD
N=118 Total Boys Girls
2.65 + .26 SD 1.47 2.61 + .30 SD 1.64 3.11 + .37 SD 2.01
.51 + .03 SD.18 .50 + .03 SD.19 .52 + .03 SD.19
31.75% + 2.50 SD 13.64 30.77% + 2.52 SD 13.64 32.97% + 2.73 SD 14.96
84.28 + 1.59 SD 8.73 83.53 + 1.82 SD 9.85 85.01 + 1.59 SD 8.71
Bonding & Polarity
n = 13 Total Boys Girls
2.80 + .70 SD 1.17 2.99 + .76 SD 1.19 3.34 + 1.18 SD 1.96
.52 + .09 SD .15
.55 + .07 SD .12
.51 + .09 SD .16
32.03% + 6.63 SD 10.98 35.04% + 6.00 SD 9.45 31.20% + 7.46 SD 12.34
85.67 + 4.93 SD 8.17 84.48 + 5.86 SD 9.22 86.73 + 4.64 SD 7.68
Materials & the
Environment n = 15 Total
Boys Girls
1.75 + .59 SD 1.07 1.97 + 1.09 SD 1.88 2.05 + .73 SD 1.31
.41 +. 09 SD .17
.42 + .10 SD .17
.42 + .13 SD .23
23.35% + 6.75 SD 12.18 21.85% + 7.13 SD 12.35 23.49% + 7.72 SD 13.94
81.73 + 4.97 SD 8.96 80.99 + 5.27 SD 9.12 82.05 + 4.84 SD 8.74
Motions &
Forces n = 16 Total
Boys Girls
2.06 + .52 SD .98 1.99 + .58 SD1.09 2.38 + .73 SD1.31
.54 + .08 SD.15
.55 + .09 SD.17
.53 + .09 SD.17
27.97% + 5.99 SD 11.23 27.72% + 5.89 SD 11.05 29.26% + 7.86 SD 14.75
84.34 + 2.75 SD 5.15 83.85 + 2.91 SD 5.46 85.61 + 3.56 SD 6.68
Properties of
Matter n = 15 Total
Boys Girls
3.02 + .68 SD 1.23 2.90 + .89 SD 1.61 4.05 + .1.39 SD 2.51
.57 + .10 SD .18
.55 + .11 SD .19
.62 + .11 SD .19
36.36% + 8.67 SD 15.66 34.47% + 9.15 SD 16.52 39.10% + 8.63 SD 15.58
84.92 + 3.60 SD 6.50 84.47 + 4.60 SD 8.30 86.02 + 2.52 SD 4.55
Properties of
Solutions n = 16 Total
Boys Girls
3.33 + 1.35 SD 2.54 3.11 + 1.37 SD 2.56 3.85 + 1.64 SD 3.08
.52 + .09 SD.18
.49 + .10 SD.18
.55 + .10 SD.18
35.96% + 9.20 SD 17.27 33.72% + 8.97 SD 16.83 38.08% + 10.14 SD 19.04
84.67 + 4.40 SD 8.25 83.35 + 3.70 SD 6.94 85.47 + 5.34 SD 10.01
Biotechnology n = 10 Total
Boys Girls
3.15 + .89 SD 1.24 3.26 + 1.19 SD 1.67 3.22 + 1.16 SD 1.62
50 + .14 SD .19 .49 + .13 SD .19 .49 + .14 SD .20
36.96% + 9.76 SD 13.64 36.35% + 9.32 SD 13.02 36.52% + 10.46 SD 14.62
85.11 + 3.71 SD 5.18 85.42 + 3.83 SD 5.36 84.48 + 4.53 SD 6.34
Conductivity n = 16 Total
Boys Girls
2.68 + .66 SD 1.23 2.48 + .60 SD 1.13 3.33 + .97 SD 1.60
.52 + .11 SD .21
.51 + .12 SD .24
.52 + .10 SD .19
33.01% + 6.31 SD 11.86 31.57% + 6.42 SD 12.04 34.44% + 6.24 SD 11.71
83.02 + 5.98 SD 11.21 82.94 + 6.29 SD 11.80 82.80 + 6.26 SD 11.76
Light & Colors
n = 17 Total Boys Girls
2.63 + .62 SD 1.20 2.50 + .68 SD 1.32 2.76 + .65 SD 1.26
.49 + .10 SD .20
.47 + .11 SD .21
.52 + .11 SD .20
30.22% + 6.35 SD 12.36 27.90% + 6.49 SD 12.62 32.50% + 6.80 SD 13.22
85.22 + 6.65 SD 12.94 83.42 + 8.63 SD 16.78 86.79 + 5.54 SD 10.78
Journal of Materials Education Vol. 32 (5-6)
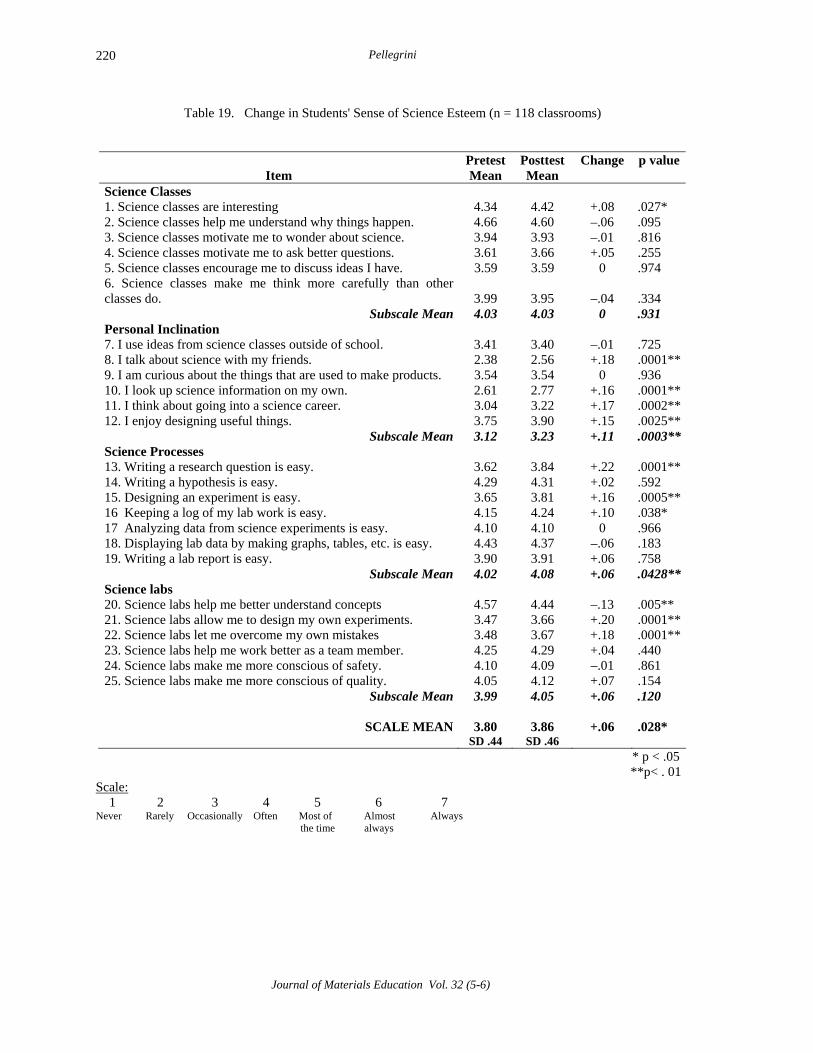
Pellegrini 220
Table 19. Change in Students' Sense of Science Esteem (n = 118 classrooms)
Item
Pretest Mean
Posttest Mean
Change
p value
Science Classes 1. Science classes are interesting
4.34
4.42
+.08
.027*
2. Science classes help me understand why things happen. 4.66 4.60 –.06 .095 3. Science classes motivate me to wonder about science. 3.94 3.93 –.01 .816 4. Science classes motivate me to ask better questions. 3.61 3.66 +.05 .255 5. Science classes encourage me to discuss ideas I have. 3.59 3.59 0 .974 6. Science classes make me think more carefully than other classes do.
3.99
3.95
–.04
.334
Subscale Mean 4.03 4.03 0 .931 Personal Inclination 7. I use ideas from science classes outside of school.
3.41
3.40
–.01
.725
8. I talk about science with my friends. 2.38 2.56 +.18 .0001**9. I am curious about the things that are used to make products. 3.54 3.54 0 .936 10. I look up science information on my own. 2.61 2.77 +.16 .0001**11. I think about going into a science career. 3.04 3.22 +.17 .0002**12. I enjoy designing useful things. 3.75 3.90 +.15 .0025**
Subscale Mean 3.12 3.23 +.11 .0003**Science Processes 13. Writing a research question is easy.
3.62
3.84
+.22
.0001**
14. Writing a hypothesis is easy. 4.29 4.31 +.02 .592 15. Designing an experiment is easy. 3.65 3.81 +.16 .0005**16 Keeping a log of my lab work is easy. 4.15 4.24 +.10 .038* 17 Analyzing data from science experiments is easy. 4.10 4.10 0 .966 18. Displaying lab data by making graphs, tables, etc. is easy. 4.43 4.37 –.06 .183 19. Writing a lab report is easy. 3.90 3.91 +.06 .758
Subscale Mean 4.02 4.08 +.06 .0428**Science labs 20. Science labs help me better understand concepts
4.57
4.44
–.13
.005**
21. Science labs allow me to design my own experiments. 3.47 3.66 +.20 .0001**22. Science labs let me overcome my own mistakes 3.48 3.67 +.18 .0001**23. Science labs help me work better as a team member. 4.25 4.29 +.04 .440 24. Science labs make me more conscious of safety. 4.10 4.09 –.01 .861 25. Science labs make me more conscious of quality. 4.05 4.12 +.07 .154
Subscale Mean 3.99 4.05 +.06 .120
SCALE MEAN
3.80 SD .44
3.86
SD .46
+.06
.028*
* p < .05 **p< . 01
Scale: 1 2 3 4 5 6 7 Never Rarely Occasionally Often Most of Almost Always the time always
Journal of Materials Education Vol. 32 (5-6)
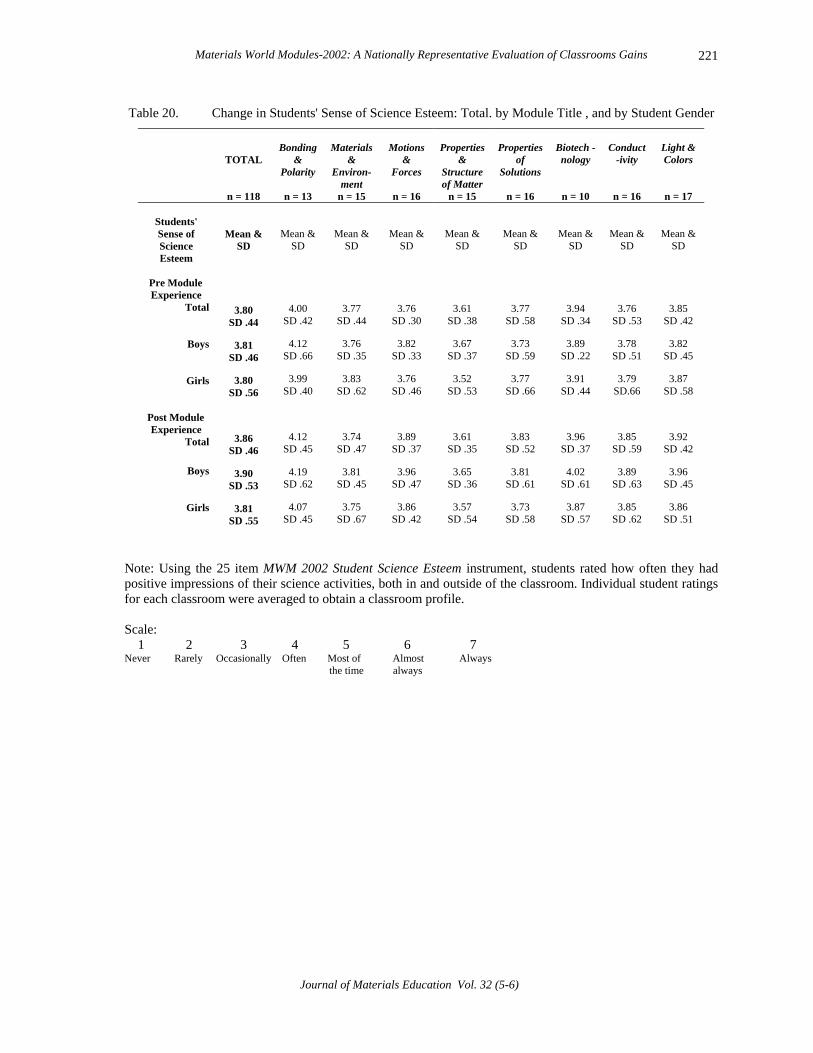
Materials World Modules-2002: A Nationally Representative Evaluation of Classrooms Gains 221
Table 20. Change in Students' Sense of Science Esteem: Total. by Module Title , and by Student Gender
TOTAL
n = 118
Bonding
& Polarity
n = 13
Materials
& Environ-
ment n = 15
Motions
& Forces
n = 16
Properties
& Structure of Matter
n = 15
Properties
of Solutions
n = 16
Biotech -nology
n = 10
Conduct
-ivity
n = 16
Light & Colors
n = 17
Students' Sense of Science Esteem
Mean & SD
Mean & SD
Mean & SD
Mean & SD
Mean & SD
Mean & SD
Mean & SD
Mean & SD
Mean & SD
Pre Module Experience
Total
Boys
Girls
Post Module Experience
Total
Boys
Girls
3.80 SD .44
3.81 SD .46
3.80 SD .56
3.86 SD .46
3.90 SD .53
3.81 SD .55
4.00 SD .42
4.12 SD .66
3.99 SD .40
4.12 SD .45
4.19 SD .62
4.07 SD .45
3.77 SD .44
3.76 SD .35
3.83 SD .62
3.74 SD .47
3.81 SD .45
3.75 SD .67
3.76 SD .30
3.82 SD .33
3.76 SD .46
3.89 SD .37
3.96 SD .47
3.86 SD .42
3.61 SD .38
3.67 SD .37
3.52 SD .53
3.61 SD .35
3.65 SD .36
3.57 SD .54
3.77 SD .58
3.73 SD .59
3.77 SD .66
3.83 SD .52
3.81 SD .61
3.73 SD .58
3.94 SD .34
3.89 SD .22
3.91 SD .44
3.96 SD .37
4.02 SD .61
3.87 SD .57
3.76 SD .53
3.78 SD .51
3.79 SD.66
3.85 SD .59
3.89 SD .63
3.85 SD .62
3.85 SD .42
3.82 SD .45
3.87 SD .58
3.92 SD .42
3.96 SD .45
3.86 SD .51
Note: Using the 25 item MWM 2002 Student Science Esteem instrument, students rated how often they had positive impressions of their science activities, both in and outside of the classroom. Individual student ratings for each classroom were averaged to obtain a classroom profile. Scale: 1 2 3 4 5 6 7 Never Rarely Occasionally Often Most of Almost Always the time always
Journal of Materials Education Vol. 32 (5-6)
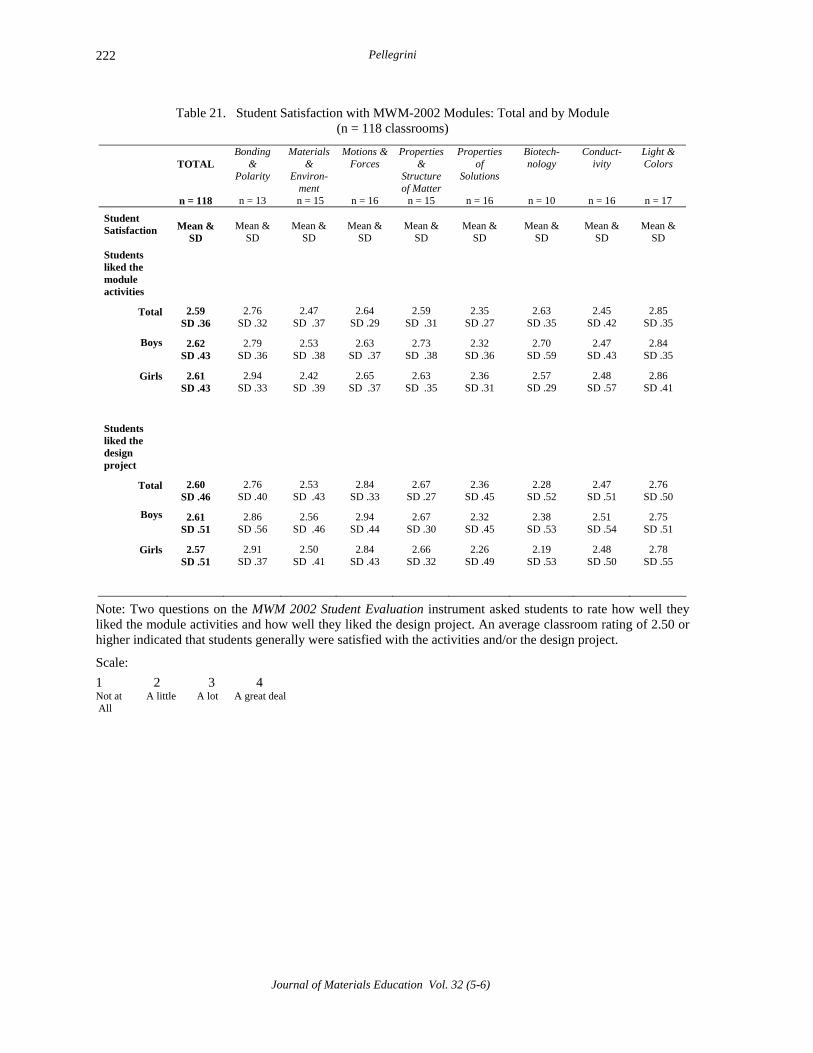
Pellegrini 222
Table 21. Student Satisfaction with MWM-2002 Modules: Total and by Module (n = 118 classrooms)
TOTAL
n = 118
Bonding &
Polarity
n = 13
Materials &
Environ-ment
n = 15
Motions & Forces
n = 16
Properties &
Structure of Matter
n = 15
Properties of
Solutions
n = 16
Biotech-nology
n = 10
Conduct-ivity
n = 16
Light & Colors
n = 17
Student Satisfaction
Mean &
SD
Mean &
SD
Mean &
SD
Mean &
SD
Mean &
SD
Mean &
SD
Mean &
SD
Mean &
SD
Mean &
SD
Students liked the module activities
Total
Boys
Girls
2.59 SD .36
2.62 SD .43
2.61 SD .43
2.76 SD .32
2.79 SD .36
2.94 SD .33
2.47 SD .37
2.53 SD .38
2.42 SD .39
2.64 SD .29
2.63 SD .37
2.65 SD .37
2.59 SD .31
2.73 SD .38
2.63 SD .35
2.35 SD .27
2.32 SD .36
2.36 SD .31
2.63 SD .35
2.70 SD .59
2.57 SD .29
2.45 SD .42
2.47 SD .43
2.48 SD .57
2.85 SD .35
2.84 SD .35
2.86 SD .41
Students liked the design project
Total
Boys
Girls
2.60 SD .46
2.61 SD .51
2.57 SD .51
2.76 SD .40
2.86 SD .56
2.91 SD .37
2.53 SD .43
2.56 SD .46
2.50 SD .41
2.84 SD .33
2.94 SD .44
2.84 SD .43
2.67 SD .27
2.67 SD .30
2.66 SD .32
2.36 SD .45
2.32 SD .45
2.26 SD .49
2.28 SD .52
2.38 SD .53
2.19 SD .53
2.47 SD .51
2.51 SD .54
2.48 SD .50
2.76 SD .50
2.75 SD .51
2.78 SD .55
Note: Two questions on the MWM 2002 Student Evaluation instrument asked students to rate how well they liked the module activities and how well they liked the design project. An average classroom rating of 2.50 or higher indicated that students generally were satisfied with the activities and/or the design project.
Scale:
1 2 3 4 Not at A little A lot A great deal All
Journal of Materials Education Vol. 32 (5-6)

Materials World Modules-2002: A Nationally Representative Evaluation of Classrooms Gains
Journal of Materials Education Vol. 32 (5-6)
223
Table 23. Overall Teacher Satisfaction with the Classroom Implementation of Eight MWM-2002
Modules (n = 118 classroom)
Table 22. Overall Teacher Satisfaction with On-line Text Materials for Eight MWM-2002 Modules
(n= 118 classroom sites)
Item
Mean &
SD 1. The professional look of the on-line text materials:
6.12
SD 1.04
2. The clarity of the teacher's instructional materials:
5.11
SD 1.30
3. The clarity of the students' instructional materials:
5.04
SD 1.19
4. The completeness of the teacher's instructional materials:
5.49
SD 1.24
5. The completeness of the students' instructional materials:
5.32
SD 1.22
6. The interest level of the student background readings:
5.10
SD 1.29
7. The intellectual appropriateness of the student background readings:
5.36
SD 1.42
8. The clarity of the student lab sheets:
5.06
SD 1.37
9. The intellectual appropriateness of the student lab activities:
5.39
SD 1.27
10. The clarity of all activity procedures:
5.17
SD 1.14
Scale Mean
5.31
SD .92
Item
Mean & SD 1. Your degree of ease in imple-menting the module:
5.01 SD 1.41
2. Your degree of confidence while teaching the module:
5.03
SD 1.39
3. The degree to which the module achieved your goals for the class:
5.07
SD 1.41
4. The degree to which the module added depth to the concept(s) being taught:
5.68
SD 1.35
5. The degree to which the module supplemented your current curriculum:
5.57
SD 1.30
6. The degree to which the module enriched your current curriculum:
5.94
SD 1.29
7. The degree to which students took charge of their own learning:
4.72
SD 1.59
8. The degree to which students were engaged in the activities:
5.65
SD 1.28
9. The degree to which students enjoyed the module activities:
5.34
SD 1.36
10. The success of the student design project:
4.75
SD 1.44
11.The degree to which students surprised you with what they had learned:
4.84
SD 1.14
12. The degree to which students discussed connections with real world applications:
5.13
SD 1.39
13. The turn-around time between your order & delivery of packaged materials:
6.75
SD .64
Scale Mean
5.35 SD.87
Scale: 1 2 3 4 5 6 7 Not satisfied Moderately Very at all satisfied satisfied
Scale: Scale Reliability: Cronbach's alpha = .906 1 2 3 4 5 6 7
Not satisfied Moderately Very at all satisfied satisfied
Scale Reliability: Cronbach's alpha =.888

Pellegrini 224
DISCUSSION Schools, Teachers and Design Given the findings of previous investigators in combination with the findings described above, it seems indefensible that design has not been given more attention in the science curricula. The question might be asked: Why don't science teachers emphasize technological design? The answer is probably a combination of the following. 1). Departmentalization of the high school curricula. High schools have been organized by discipline for over 100 years. Lewis3 reported that science on the one hand and technology (or technology education) on the other, have had separate existences in spite of their connection in contemporary times. Secondary teachers are certified to teach a specific discipline; high schools are organized into departments identified by discipline. Students flow from one discipline to another throughout the course of a single day. This traditional pattern hardly presents an opportunity to demonstrate that today's real-world scientific endeavors demand cross-disciplinary expertise. 2). Traditional focus of pre-service preparation programs. College students wishing to become science teachers typically major in a science discipline as opposed to an engineering one. Science courses do not emphasize design projects whereas engineering courses do. Darling-Hammond40 and Jones41 reported that teacher preparation programs in science education emphasize scientific inquiry as opposed to technological design. Some states have granted provisional certification or certified individuals to teach all secondary science subjects prepared with only an array of science survey coursework. Unfortunately, this background of survey courses fosters teacher reliance on the science text resulting in little confidence to expand beyond it. In the end, because teachers lack depth, students are denied the opportunity to explore the application of those concepts for addressing everyday needs and problems.
3). Issues at the classroom level. Technological design is a time-consuming and costly process (Kolodner15; Fortus18; Wilson and Harris42). The hands-on nature of investigation requires adequate equipment, supplies and space (Wilson and Harris42; Satchwell and Loepp16). Most teachers are assigned four or five science classes a day (roughly 100-150 students) with an average of 1 hour per day for preparation. Many lack an actual degree in the science they teach43. Most science textbooks omit a discussion of technological design. Teachers find that classroom control is a major issue and have difficulty switching to a new style of management (Fortus et al.18). Many teachers have never participated in authentic research or engaged in technological design as part of their preparation to teach. Because of current political pressures, school boards and administrators are placing greater emphasis on the results of standardized tests while cutting budgets at the same time. Lack of available time is probably a major factor. Teachers are reluctant to take time away from covering concepts they believe might appear on the test. Several teacher and student comments collected during this study mention that there was not enough time to do justice to the quality of the module experience. In the present climate, teachers may wonder how much students actually learn from short-term technological design projects and whether it's worth the time and effort to engage in a supplementary activity. 4). Professional development. It may be prohibitive for districts to invest in professional development to incorporate design projects into the science curricula. One-day workshops still dominate the usual design of professional development for science teachers, the format being to have teachers experience exactly what their students will experience. The expectation has been, "Here is something innovative, now go do it." But that expectation has grossly underestimated what it takes for professional development to produce statistically significant change. Yoon et al.44 found in their review of professional development that teachers required
Journal of Materials Education Vol. 32 (5-6)
Materials World Modules-2002: A Nationally Representative Evaluation of Classrooms Gains 225
approximately 30 hours of intensive, content-rich, sustained, and on-site training to achieve an adequate level of competence. Earlier, Garet et al.45 found in their national evaluation of the effectiveness of the Eisenhower program for science teachers that professional development was made effective when it was intensive, sustained over time, job-embedded, and focused on the content of the subject matter, and was structured as active learning with collective participation. Perhaps then, the most economical avenue for introducing design projects may be in the quality of guidance given to teachers in the text materials themselves, which apparently was the case with MWM-2002. A teacher's sustained repetition of MWM appears likely to produce a dosage effect both in terms of student success and professional development. 5). Student characteristics. Students who have been identified as low achieving often are thought of as being poor risks for project-based learning. Mehalik et al.20, however, reported that design projects were most helpful to low-achieving African-American students. We had similar impressions. The percent of under-represented students in a school had little or no influence on classroom outcomes. Science classrooms in schools with high percentages of under-represented students did just as well as classrooms in schools with very low percentages of under-represented students. Of concern, however, was the attitude of some students in honors and AP classes who were heavily focused on mastering only the content, probably in anticipation of a higher score on a standardized test that could influence their admission to college. They appeared to have little patience for engaging in projects that require iteration and evaluation. 6). Student confidence. Design projects can be unsettling to some students. They are required to work in teams, and thereby risk exposing what they know or don't know. But esteem is often the result of a classroom's collective sense of morale. In our study, we found that the class' collective sense of science esteem was positively related to the design score. It seems
reasonable that students' perceived level of confidence in science would influence their success in tackling new and unfamiliar tasks as well as thinking through various failure situations such as those encountered in a design project. CONCLUSIONS The results of this large-scale, nationally representative evaluation demonstrate that technological or engineering design can be taught effectively at the high school level. The term technological design became awkward to use, and should be changed to engineering design which conveys a more accurate description of the MWM approach. The study sample was found to be nationally representative in terms of (1) U.S. geographical region; (2) type of community or NCES locale code; (3) teacher gender; (4) student gender; (5) teachers' level of academic preparation, and (6) teachers' years of experience teaching science at the high school level. The materials science concepts featured in the modules offered highly compelling topics that definitely enriched the learning of science content emphasized in the NSES, and NRC Core Goals for Laboratory Experiences. The data strongly suggest that MWM-2002 could be used by all teachers (even first-time users) in all science classrooms. Success is more likely, however, in classrooms with a high collective sense of science esteem, and under the direction of teachers with master's degrees and more than five years of experience. Because of the chemical and physical concepts emphasized in most of the MWM-2002 modules, chemistry and physics teachers would have an advantage. The on-line delivery of MWM-2002 text materials, while successful in facilitating a speedy turn around between the time a module was ordered and the delivery of text materials, had some drawbacks. Teachers mentioned that
Journal of Materials Education Vol. 32 (5-6)
Pellegrini 226
reproducing the Teacher's Edition (TE) and Pupil Editions (PE) consumed a great deal of paper and required a lot of download time plus out of school work. The regular version of the modules was apparently more practical than either the introductory or advanced versions. There was not enough difference in module content to justify three levels of difficulty; but there was a noticeable difference among the three levels in the amount of inquiry support provided to the students. Those in classrooms using the advanced version (open-ended inquiry) often became impatient and lacked motivation to take the design project seriously. There were gender differences. Girls achieved higher results than boys for content acquisition in terms of effect sizes, normalized gains, percent value added and design scores. Boys, however, gained more than girls in terms of science esteem. Gender differences warrant further investigation, and especially for those science populations in large urban schools. The design scores, while favorable, should be viewed with caution for two reasons. It is likely that teachers were generous in their use of the suggested rubrics. Further, the rubrics may not have been as sensitive to the elements of technological design as they might have been. Time was essential to success. For some classrooms, students possibly became frustrated with or confused about their own performance because of an insufficient amount of time to satisfactorily complete a module experience. For other classrooms, teachers reported that student teams spent many hours outside of class working on their design or presentation. It now seems apparent that an MWM-2002 module could require three rather than two weeks of class time. Even so, the benefits would be worth the extra time, even in the present climate of standardized test pressures.
Given that teachers received no professional development, it was encouraging to note that the presentation of text materials was clear and apparently self-instructive. It is likely that repeated use of MWM-2002 would produce a dosage effect, and thereby over time, generate greater familiarity with design processes , and thus higher levels of module performance. A class's collective sense of science esteem may more strongly influence its design scores than its achievement scores. Classrooms with high collective senses of science esteem tended to be more successful. Overall, teachers indicated a moderate degree of satisfaction with MWM-2002. They were, however, highly pleased with the degree to which students were engaged in the module experience, and the degree to which the materials science content enriched their current curriculum. The MWM-2002 modules in this study yielded varying degrees of success probably because of the unique or cognitive demands of the activities and design project. The modules with the highest gains introduced concepts not typically found in science texts; those with the lowest gains may have been too intuitive for high school audiences. This study found that impressive classroom gains can be achieved if there is a (1) tight alignment between the module content and core curricula; (2) tight alignment of validated test items with the module content; (3) adequate in-class time for implementation, and (4) robust test items thus producing a contrast between the pre and post raw scores. Finally, the results of this national study offer classroom researchers and practitioners a suitable baseline against which to compare gains made at the level of the science unit. Until now, there has been no such nationally based evidence.
Journal of Materials Education Vol. 32 (5-6)

Materials World Modules-2002: A Nationally Representative Evaluation of Classrooms Gains 227
ACKNOWLEDGMENTS This evaluation was supported by a National Science Foundation award (# 9818861) to the Materials Research Center, Northwestern University, Evanston, IL. Special recognition is extended to Principal Investigator, R.P.H. Chang, for his encouragement and leadership of the project and to materials science engineer, Matthew Hsu, Ph.D. who patiently led the development of all modules in the MWM series. Finally, my special appreciation is extended to Beth Abbott and Anne Muller of Northwestern University for their diligence in selecting the randomized sample, for preparing the mailing packets, for endless hours in the preparation and shipping of supply kits, and for insuring the completeness of data packets that arrived from teachers across the country. REFERENCES 1. National Research Council, National
science education standards, National Academy Press, Washington, DC (1996), pp. 173-207.
2. R.J. Noeth, T. Cruce and M.T. Harmston,
Maintaining a strong engineering workforce: ACT policy report, ACT Office of Policy Research, 2003. Retrieved May 1, 2007 from www.act.org/research/policy/index.html .
3. T. Lewis, Design and inquiry: Bases for an
accommodation between science and technology education in the curriculum? Journal of Research in Science Teaching, (43)3, 255-281 (2006).
4. B. Goldsmith, Obsessive genius: The inner
world of Marie Curie, Norton, New York, 2005.
5. E.J. Baumgartner and B.J. Reiser, Inquiry
through design: Situating and supporting inquiry through design projects in high school science classrooms, Paper presented at the National Association for Research in
Science Teaching 1997 Conference, Oak Brook, IL, (1997).
6. E.J. Baumgartner, Science by design. How
teachers support scientific inquiry through design projects, unpublished doctoral dissertation, Northwestern University, Evanston, IL, 2002.
7. National Research Council, America's Lab
Report: Investigations in High School Science, Committee on High School Science Laboratories: Role and Vision, S.R. Singer, M.L. Hilton, and H.A. Schweingruber, eds., Board on Science Education, Center for Education,. Division of Behavioral and Social Sciences and Education, The National Academies Press, Washington, DC (2006).
8. G.E. Dieter, Engineering design: A
materials and processing approach (2nd ed.), McGraw-Hill, New York, 1991, pp.1-53.
9. R.W. Bybee, Bridging science and
technology. The Science Teacher, September, 1998, pp. 38-42.
10. G. Benenson, The unrealized potential of
everyday technology as a context for learning, Journal of Research in Science Teaching, 38(7), 730-745 (2001).
11. D. Crismond, Learning and using science
ideas when doing investigative-and-redesign tasks: A study of naive, novice, and expert designers doing constrained and scaffolded design work, Journal of Research in Science Teaching, 38(7), 791-820 (2001).
12. W.-M. Roth, Learning science through
technological design, Journal of Research in Science Teaching, 38 (7), 768-780 (2001).
13. R.L. Custer, B.G. Valesey, and B.N. Burke,
An assessment model for a design approach to technological problem solving. Journal
Journal of Materials Education Vol. 32 (5-6)

Pellegrini 228
of Technology Education, 12 (2) (2001). Retrieved January 14, 2005 from http://scholar.lib.vt.edu/ejournals/JTE/v12n2/custer.html.
14. A.L. Luehmann, Factors affecting
secondary science teachers' appraisal and adoption of technology-rich project-based learning environments. Paper presented at the annual meeting of the American Educational Research Association (AERA), New Orleans, LA, (April 5, 2002).
15. J.L. Kolodner, Facilitating the learning of
design practices: Lessons from an inquiry into science education, Journal of Industrial Teacher Education, 39 (3), 9-40 (2002).
16. R.E. Satchwell and F.L. Loepp, Designing
and implementing an integrated mathematics, science, and technology curriculum for the middle school, Journal of Industrial Teacher Education, 39 (3). (2002). Retrieved January 10, 2005 from http://scholar.lib.vt.edu/ejournals/JITE .
17. D.T. Hickey, A.C.H. Kindfield, P. Horwitz
and M.A.T. Christie, Integrating curriculum, instruction, assessment, and evaluation in a technology-supported genetics learning environment, American Educational Research Journal, 40(2), 495-538 (2003).
18. D. Fortus, R.C. Dershimer, J. Krajcik, R.W.
Marx and R. Mamlok-Naaman, Design-based science and student learning, Journal of Research in Science Teaching, 41(10), 1081-1110 (2004).
19. X.S. Apedoe, B. Reynolds, M.R. Ellefson,
and C.D. Schunn, Bringing engineering design into high school science classrooms: The heating/cooling unit, Journal of Science Education and Technology 17, 454-465, (2008).
20. M.M. Mehalik, Y. Doppelt and C.D.
Schunn, Middle-school science through
design-based learning versus scripted inquiry: Better overall science concept learning and equity gap reduction, Journal of Engineering Education, 97(1), 1-15 (2008).
21. L.L. Morris and C.T. Fitz-Gibbon, How to
measure achievement, Sage, Thousand Oaks, CA, (1978), pp. 89-90.
22. No Child Left Behind Act of 2001,
Pub.L.No.107-110 (2001). 23. National Research Council, Scientific
research in education, Committee on Scientific Principles for Education Research, R.J. Shavelsonand L. Towne, Editors, Center for Education, Division of Behavioral and Social Sciences and Education, National Academy Press,Washington, DC (2002).
24. A.M. Shapiro, How including prior
knowledge as a subject variable may change outcomes of learning research, American Educational Research Journal, 41, 159-189 (2004).
25. B.J. Becker, Synthesizing standardized
mean-change measures, British Journal of Mathematical and Statistical Psychology, 41, 257-278, (1988).
26. S.B. Morris, Distribution of the
standardized mean change effect size for meta-analysis on repeated measures, British Journal of Mathematics and Statistical Psychology, 53, 17-29 (2000).
27. M.W. Lipsey and D.B. Wilson, Practical
meta-analysis, Sage, Thousand Oaks, CA, 2001, pp. 44-46. Also M.W. Lipsey and D.B. Wilson, The efficacy of psychological, educational, and behavioral treatment: Confirmation from meta-analysis, American Psychologist, December, 1993, pp. 1181-1209.
28. R.R. Hake, Interactive-engagement vs.
traditional methods: A six-thousand student
Journal of Materials Education Vol. 32 (5-6)
Materials World Modules-2002: A Nationally Representative Evaluation of Classrooms Gains 229
survey of mechanics test data for introductory physics courses, American Journal of Physics, 66, 64-74 (1998). Retrieved September 15, 2003 from http://www.physics.indiana.edu/~hake.
29. R.R. Hake, Interactive-engagement
methods in introductory mechanics courses. Unpublished paper. Retrieved September 15, 2003 from http://www. physics.indiana.edu/~hake.
30. R.H. Meyer, Value-added indicators of
school performance, in E.A. Hanushek and D.W. Jorgenson (eds.), Improving America's Schools: The role of Incentives, National Academy Press,Washington, DC, (2000), pp.197-223.
31. R.H. Meyer, Value-added indicators: A
powerful tool for evaluating science and mathematics programs and policies, NISE Brief (3)3, National Center for Improving Science Education, Madison, WI, 2000.
32. B. Thompson, What future quantitative
social science research could look like: Confidence intervals for effect sizes, Educational Researcher, 31, 25-32 (2002).
33. G. Cumming and S. Finch, A primer on the
understanding, use, and calculation of confidence intervals that are based on central and noncentral distributions, Educational and Psychological Measurements, 61(4), 532-574 (2001).
34. Publications manual of the American
Psychological Association (5th ed.), American Psychological Association, Washington, DC (2001).
35. The 2000 national survey of science and
mathematics education: Compendium of tables, Horizon Research, Inc., Chapel Hill, NC (2000). Retrieved August 16, 2006 from http://2000survey.horizonresearch .com/reports/tables/tables_complete.pdf .
36. B. Kantrowitz and J. Scelfo, Science and
the gender gap. Newsweek, September 25, 2006, pp 67-72.
37. M. Davis, M. Gender gap in GPAs seen as
linked to self-discipline, Education Week, February 14, 2007, p.8.
38. J. Goldstein and S. Puntambekar, The brink
of change: Gender in technology-rich collaborative learning environments, Journal of Science Education and Technology, 13(4), 505-521 (2004).
39. M. Laeser, B.M. Moskal, R. Knecht and D.
Lasich, Engineering design: Examining the impact of gender and the team's gender composition, Journal of Engineering Education, 49-56, January, 2003.
40. L. Darling-Hammond, Educating the
academy's greatest failure or its most important future. Academe, 85 (1), 26-33 (1999).
41. E. Jones, Curriculum reform in the
professions: Preparing students for a changing world, ERIC Clearinghouse on Higher Education, (ED 470541), Washington, DC, 2002.
42. V. Wilson,and M. Harris, Designing the
best: A review of effective teaching and learning of design and technology, International Journal of Technology and Design Education, 13 (3), 223-241 (2003).
43. Council of Chief State School Officers
(CCSSC). http://www.ccsso.org/Resources.html.
44. K.S. Yoon, T. Duncan, S.W-Y. Lee, B.
Scarloss and K. Shapley, Reviewing the evidence on how teacher professional development affects student achievement (Issues and Answers Report, REI 2007-No. 033), Washington, DC: U.S. Department of Education, Institute of Education Sciences, National Center for Education Evaluation and Regional Assistance, Regional Educational Laboratory Southwest.
Journal of Materials Education Vol. 32 (5-6)

Pellegrini
Journal of Materials Education Vol. 32 (5-6)
230
45. M.S. Garet, A. Porter, L. Desimone, B.
Birman and K.S. Yoon, What makes professional development effective? Results from a national sample of teachers, American Educational Research Journal, 38(4), 915-945 (2001).