maternal and child health status and child health status a summary of the title v needs assessment...
TRANSCRIPT

Maternal and ChildHealth Status
A Summary of the Title V Needs Assessmentfor the Maternal and Child Health Population
North Dakota 2002
North Dakota Department of Human ServicesChildren's Special Health Services UnitMedical Services Division
North Dakota Department of HealthDivision of Maternal and Child Health
Maternal and ChildHealth Status
A Summary of the Title V Needs Assessmentfor the Maternal and Child Health Population
North Dakota 2002
John Hoeven, GovernorDr. Terry Dwelle, State Health Officer
Terry Bohn, Editor
North Dakota Department of Human ServicesChildren's Special Health Services UnitMedical Services Division
North Dakota Department of HealthDivision of Maternal and Child Health


1
Table of Contents
Introduction ........................................................................................................... 3
List of Tables ......................................................................................................... 5
Demographics ........................................................................................................ 7
Title V Population Groups .................................................................................... 13
Infant Population ...................................................................................... 15
Child Population ...................................................................................... 23
Children With Special Health Care Needs ................................................ 28
Adolescent Population ............................................................................. 37
Maternal Population ................................................................................. 47
Health Care System ............................................................................................. 59
Racial Health Disparities ....................................................................................... 63
Methods and Explanation ..................................................................................... 73
Tables .................................................................................................................. 77

2

3
Introduction
The Maternal and Child Health Services Title V Block Grant program provides federalfunding to the North Dakota Department of Health’s Division of Maternal and ChildHealth (MCH) and the North Dakota Department of Human Services’ Children’sSpecial Health Services (CSHS) Division.
The maternal and child health population consists of five groups: (1) infants birth toage 1; (2) children ages 1 through 9; (3) adolescents ages 10 through 19; and (4)women of childbearing age (ages 20 through 44). The MCH population also includeschildren with special health care needs from birth to age 21.
One of the requirements for the MCH Block Grant application is an annual statewideneeds assessment of the maternal and child health population. The needs assessmentprocess involves the collection of information about the health status of, health careutilization by, and health care access for the maternal and child health population.
The purpose of the needs assessment is to document unmet needs and gaps in servicesand to identify priorities. The identification and selection of priority needs helps MCHand CSHS plan programs and services designed to improve the health of mothers,infants, children – including children with special health care needs – and adolescents.
This document is a summary of much of the data collected for the Title V needsassessment. It is hoped that this information will be helpful to partners – such as localpublic health units, Regional and Tribal Children’s Services Coordinating committees,and county social service agencies – in conducting local needs assessments and inplanning programs and services at the community level.

4
5
List of Tables
1. Child Population by Age and Race2. Maternal Population by Age and Race3. Child Population Younger Than 18 by Race and County4. Female Population Ages 20 Through 44 by Race and County5. Children Ages 5 Through 17 in Poverty by County6. Children Younger than 18 in Poverty by County7. Estimated Median Household Income by County8. Live Births by County9. Birth Rates by County10. Fetal Deaths by County11. Fetal Death Rates by County12. Infant Deaths by County13. Infant Death Rates by County14. Neonatal Deaths by County15. Neonatal Death Rates by County16. Breastfeeding Rates at Hospital Discharge by County17. Child and Adolescent Deaths and Rates by County18. Child Deaths and Rates by County – All Causes – Ages 1 Through 919. Child Deaths and Rates – Unintentional Injury – Ages 1 Through 920. Child Deaths and Rates – Motor Vehicles – Ages 1 Through 921. Children Receiving Food Stamps by County22. Children Receiving Free and Reduced-Price School Lunch23. Children Enrolled in WIC by County24. Children Enrolled in Medicaid by County25. Child Abuse and Neglect by County26. Congenital Anomalies by County, 1994 Through 200027. Children Served by CSHS, by County28. Special Education Enrollment by County29. Head Start Enrollment by County30. Adolescent Deaths and Rates by County – Ages 10 Through 1931. Adolescent Deaths and Rates – Accidental – Ages 10 Through 1932. Adolescent Deaths and Rates – Motor Vehicle – Ages 10 Through 1933. Adolescent Deaths and Rates – Suicide – Ages 10 Through 1434. Adolescent Deaths and Rates – Suicide – Ages 15 Through 1935. Adolescent Deaths and Rates – Suicide – Ages 10 Through 1936. Teen Pregnancies by County37. Teen Pregnancy Rates by County

6
List of Tables, continued
38. Teen Births by County39. Teen Birth Rates by County40. Out-of-Wedlock Pregnancies by County41. Out-of-Wedlock Pregnancy Rates by County42. Out-of-Wedlock Births by County43. Out-of-Wedlock Birth Rates by County44. Domestic Violence Incidence by County

7
Demographics

8
9
Demographics
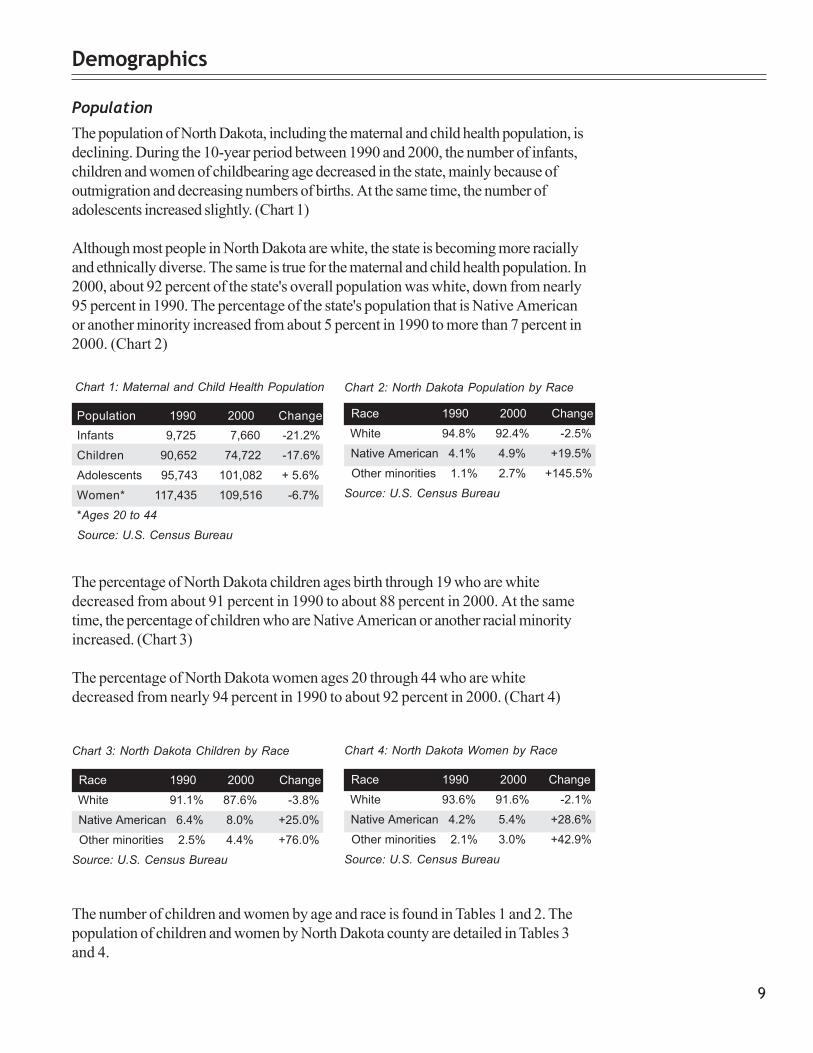
The population of North Dakota, including the maternal and child health population, isdeclining. During the 10-year period between 1990 and 2000, the number of infants,children and women of childbearing age decreased in the state, mainly because ofoutmigration and decreasing numbers of births. At the same time, the number ofadolescents increased slightly. (Chart 1)
Although most people in North Dakota are white, the state is becoming more raciallyand ethnically diverse. The same is true for the maternal and child health population. In2000, about 92 percent of the state's overall population was white, down from nearly95 percent in 1990. The percentage of the state's population that is Native Americanor another minority increased from about 5 percent in 1990 to more than 7 percent in2000. (Chart 2)
Population
The percentage of North Dakota children ages birth through 19 who are whitedecreased from about 91 percent in 1990 to about 88 percent in 2000. At the sametime, the percentage of children who are Native American or another racial minorityincreased. (Chart 3)
The percentage of North Dakota women ages 20 through 44 who are whitedecreased from nearly 94 percent in 1990 to about 92 percent in 2000. (Chart 4)
The number of children and women by age and race is found in Tables 1 and 2. Thepopulation of children and women by North Dakota county are detailed in Tables 3and 4.
Population 1990 2000 ChangeInfants 9,725 7,660 -21.2%
Children 90,652 74,722 -17.6%
Adolescents 95,743 101,082 + 5.6%
Women* 117,435 109,516 -6.7%
*Ages 20 to 44
Source: U.S. Census Bureau
Chart 1: Maternal and Child Health Population
Race 1990 2000 Change
White 94.8% 92.4% -2.5%
Native American 4.1% 4.9% +19.5%
Other minorities 1.1% 2.7% +145.5%
Source: U.S. Census Bureau
Chart 2: North Dakota Population by Race
Race 1990 2000 Change
White 91.1% 87.6% -3.8%
Native American 6.4% 8.0% +25.0%
Other minorities 2.5% 4.4% +76.0%
Source: U.S. Census Bureau
Chart 3: North Dakota Children by Race
Race 1990 2000 Change
White 93.6% 91.6% -2.1%
Native American 4.2% 5.4% +28.6%
Other minorities 2.1% 3.0% +42.9%
Source: U.S. Census Bureau
Chart 4: North Dakota Women by Race
10
Year North Dakota United States1993 16.2% 22.7%
1995 15.9% 20.8%
1996 15.0% 20.5%
1997 16.8% 19.9%
2000 15.2% 16.2%
Source: U.S. Census Bureau
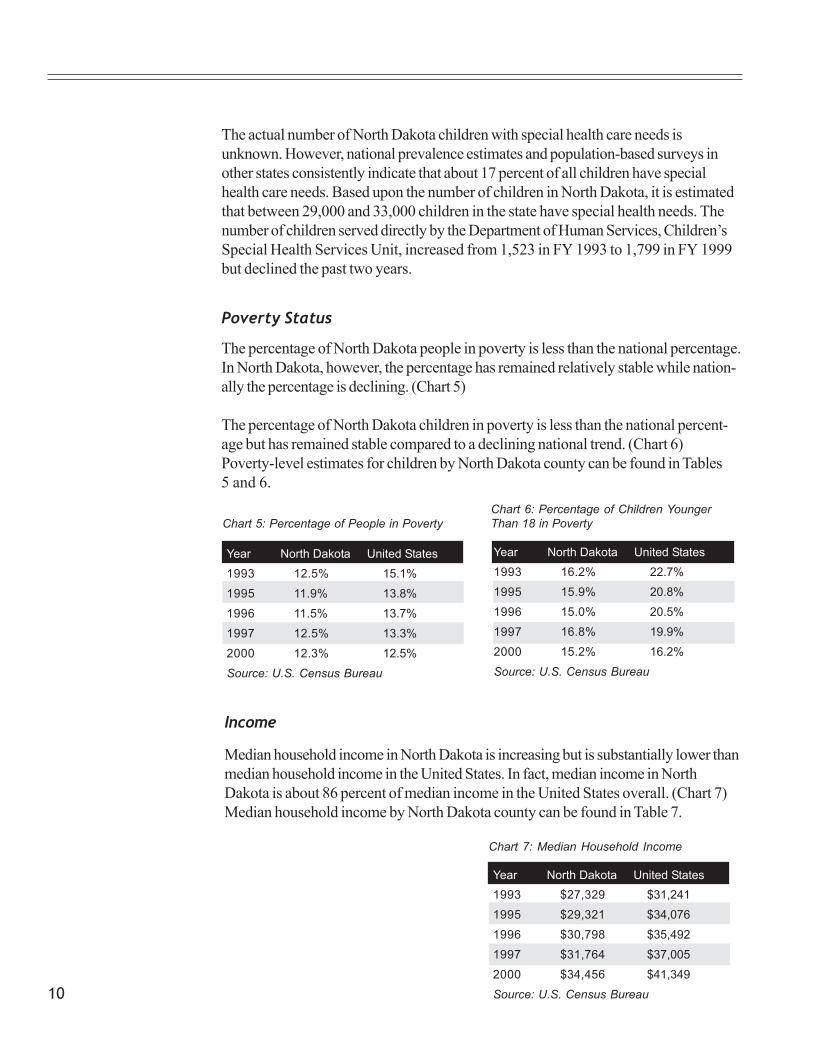
The percentage of North Dakota people in poverty is less than the national percentage.In North Dakota, however, the percentage has remained relatively stable while nation-ally the percentage is declining. (Chart 5)
The percentage of North Dakota children in poverty is less than the national percent-age but has remained stable compared to a declining national trend. (Chart 6)Poverty-level estimates for children by North Dakota county can be found in Tables5 and 6.
Poverty Status
Income
Median household income in North Dakota is increasing but is substantially lower thanmedian household income in the United States. In fact, median income in NorthDakota is about 86 percent of median income in the United States overall. (Chart 7)Median household income by North Dakota county can be found in Table 7.
The actual number of North Dakota children with special health care needs isunknown. However, national prevalence estimates and population-based surveys inother states consistently indicate that about 17 percent of all children have specialhealth care needs. Based upon the number of children in North Dakota, it is estimatedthat between 29,000 and 33,000 children in the state have special health needs. Thenumber of children served directly by the Department of Human Services, Children’sSpecial Health Services Unit, increased from 1,523 in FY 1993 to 1,799 in FY 1999but declined the past two years.
Chart 6: Percentage of Children YoungerThan 18 in Poverty
Year North Dakota United States1993 12.5% 15.1%
1995 11.9% 13.8%
1996 11.5% 13.7%
1997 12.5% 13.3%
2000 12.3% 12.5%
Source: U.S. Census Bureau
Chart 5: Percentage of People in Poverty
Year North Dakota United States1993 $27,329 $31,241
1995 $29,321 $34,076
1996 $30,798 $35,492
1997 $31,764 $37,005
2000 $34,456 $41,349
Source: U.S. Census Bureau
Chart 7: Median Household Income
11
Health Insurance Coverage Status
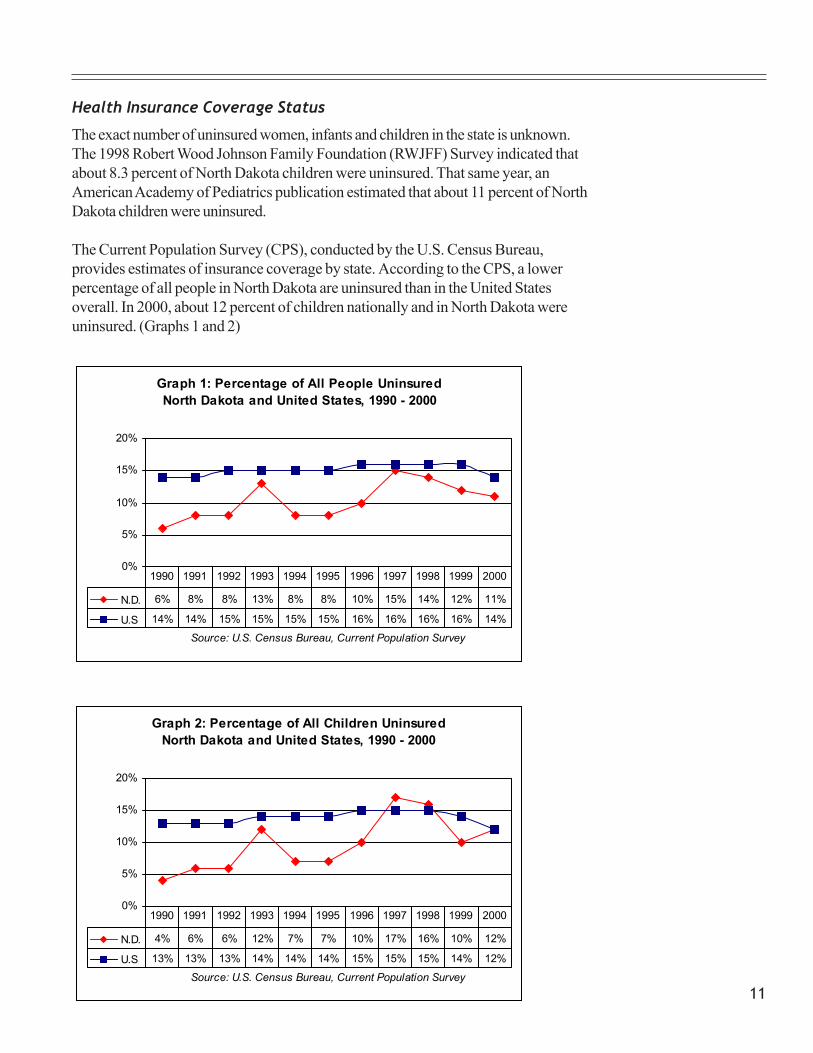
The exact number of uninsured women, infants and children in the state is unknown.The 1998 Robert Wood Johnson Family Foundation (RWJFF) Survey indicated thatabout 8.3 percent of North Dakota children were uninsured. That same year, anAmerican Academy of Pediatrics publication estimated that about 11 percent of NorthDakota children were uninsured.
The Current Population Survey (CPS), conducted by the U.S. Census Bureau,provides estimates of insurance coverage by state. According to the CPS, a lowerpercentage of all people in North Dakota are uninsured than in the United Statesoverall. In 2000, about 12 percent of children nationally and in North Dakota wereuninsured. (Graphs 1 and 2)
Graph 2: Percentage of All Children Uninsured North Dakota and United States, 1990 - 2000
0%
5%
10%
15%
20%
Source: U.S. Census Bureau, Current Population Survey
N.D. 4% 6% 6% 12% 7% 7% 10% 17% 16% 10% 12%
U.S 13% 13% 13% 14% 14% 14% 15% 15% 15% 14% 12%
1990 1991 1992 1993 1994 1995 1996 1997 1998 1999 2000
Graph 1: Percentage of All People Uninsured North Dakota and United States, 1990 - 2000
0%
5%
10%
15%
20%
Source: U.S. Census Bureau, Current Population Survey
N.D. 6% 8% 8% 13% 8% 8% 10% 15% 14% 12% 11%
U.S 14% 14% 15% 15% 15% 15% 16% 16% 16% 16% 14%
1990 1991 1992 1993 1994 1995 1996 1997 1998 1999 2000

12
Uninsurance rates from the CPS are significantly higher than the RWJFF survey, partlydue to differences in the definition of insurance coverage, particularly the considerationof Indian Health Service (IHS) as an insurance coverage. IHS was considered healthcare coverage in the RWJFF survey, but not in the CPS. The CPS is considered by thestate Title V program to be a more accurate representation of the percentage ofuninsured children in North Dakota.

13
Title V Population Groups

14
15
Infant Population
Births
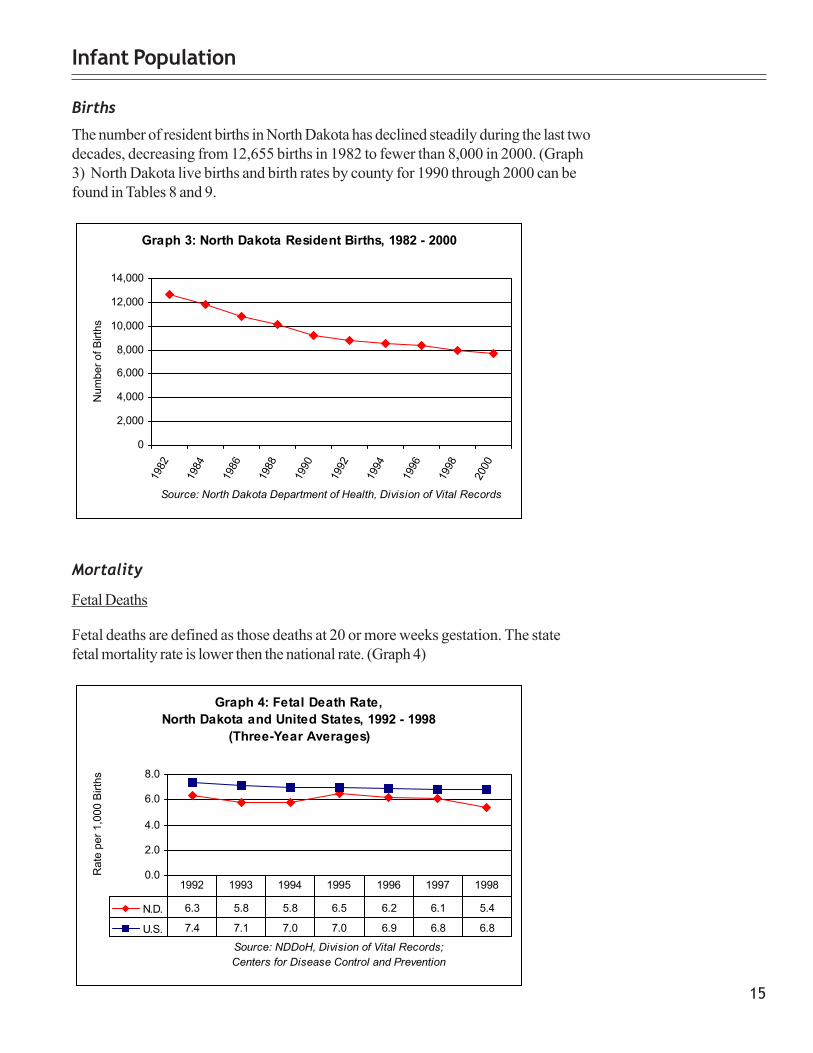
The number of resident births in North Dakota has declined steadily during the last twodecades, decreasing from 12,655 births in 1982 to fewer than 8,000 in 2000. (Graph3) North Dakota live births and birth rates by county for 1990 through 2000 can befound in Tables 8 and 9.
Fetal Deaths
Fetal deaths are defined as those deaths at 20 or more weeks gestation. The statefetal mortality rate is lower then the national rate. (Graph 4)
Mortality
Graph 3: North Dakota Resident Births, 1982 - 2000
0
2,000
4,000
6,000
8,000
10,000
12,000
14,000
1982
1984
1986
1988
1990
1992
1994
1996
1998
2000
Source: North Dakota Department of Health, Division of Vital Records
Num
ber o
f Birt
hs
Graph 4: Fetal Death Rate, North Dakota and United States, 1992 - 1998
(Three-Year Averages)
0.0
2.0
4.0
6.0
8.0
Source: NDDoH, Division of Vital Records; Centers for Disease Control and Prevention
Rat
e pe
r 1,0
00 B
irths
N.D. 6.3 5.8 5.8 6.5 6.2 6.1 5.4
U.S. 7.4 7.1 7.0 7.0 6.9 6.8 6.8
1992 1993 1994 1995 1996 1997 1998
16
North Dakota fetal deaths and fetal death rates by county for 1990 through 2000 canbe found in Tables 10 and 11.
Infant Mortality
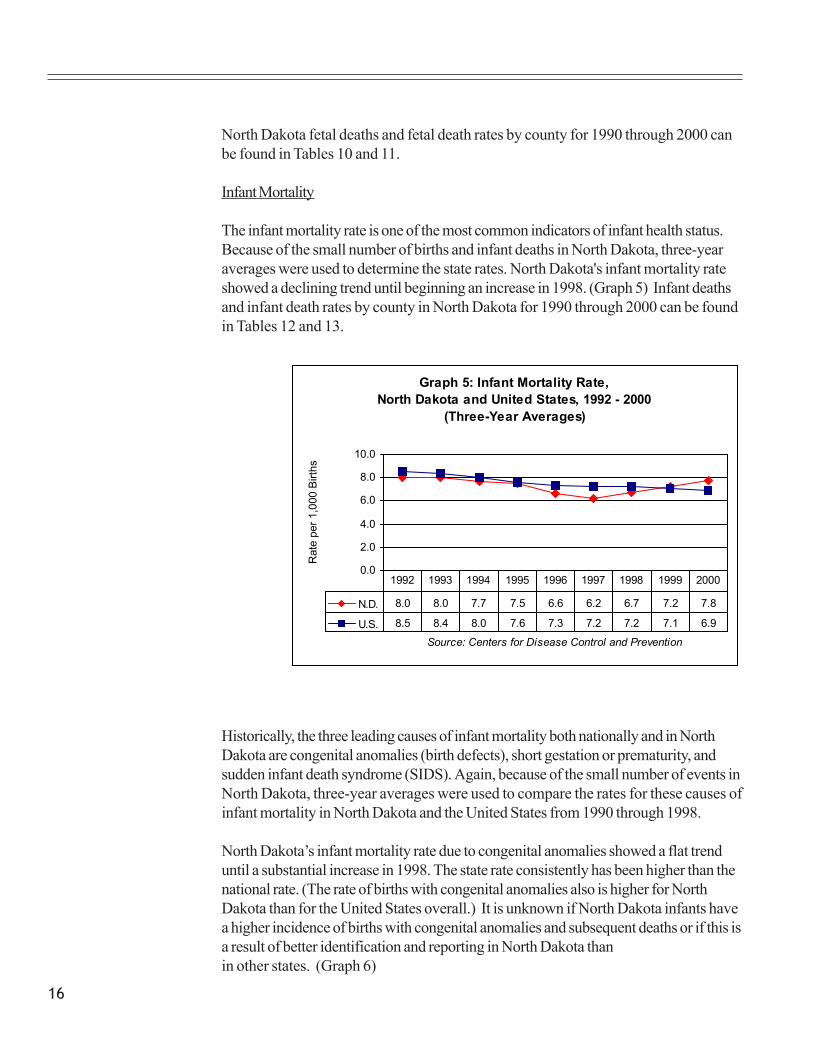
The infant mortality rate is one of the most common indicators of infant health status.Because of the small number of births and infant deaths in North Dakota, three-yearaverages were used to determine the state rates. North Dakota's infant mortality rateshowed a declining trend until beginning an increase in 1998. (Graph 5) Infant deathsand infant death rates by county in North Dakota for 1990 through 2000 can be foundin Tables 12 and 13.
Historically, the three leading causes of infant mortality both nationally and in NorthDakota are congenital anomalies (birth defects), short gestation or prematurity, andsudden infant death syndrome (SIDS). Again, because of the small number of events inNorth Dakota, three-year averages were used to compare the rates for these causes ofinfant mortality in North Dakota and the United States from 1990 through 1998.
North Dakota’s infant mortality rate due to congenital anomalies showed a flat trenduntil a substantial increase in 1998. The state rate consistently has been higher than thenational rate. (The rate of births with congenital anomalies also is higher for NorthDakota than for the United States overall.) It is unknown if North Dakota infants havea higher incidence of births with congenital anomalies and subsequent deaths or if this isa result of better identification and reporting in North Dakota thanin other states. (Graph 6)
Graph 5: Infant Mortality Rate, North Dakota and United States, 1992 - 2000
(Three-Year Averages)
0.0
2.0
4.0
6.0
8.0
10.0
Source: Centers for Disease Control and Prevention
Rat
e pe
r 1,0
00 B
irths
N.D. 8.0 8.0 7.7 7.5 6.6 6.2 6.7 7.2 7.8
U.S. 8.5 8.4 8.0 7.6 7.3 7.2 7.2 7.1 6.9
1992 1993 1994 1995 1996 1997 1998 1999 2000

17
Although lower than the national rate, the state’s infant mortality rate due to shortgestation or prematurity shows an increasing trend. (Graph 7)
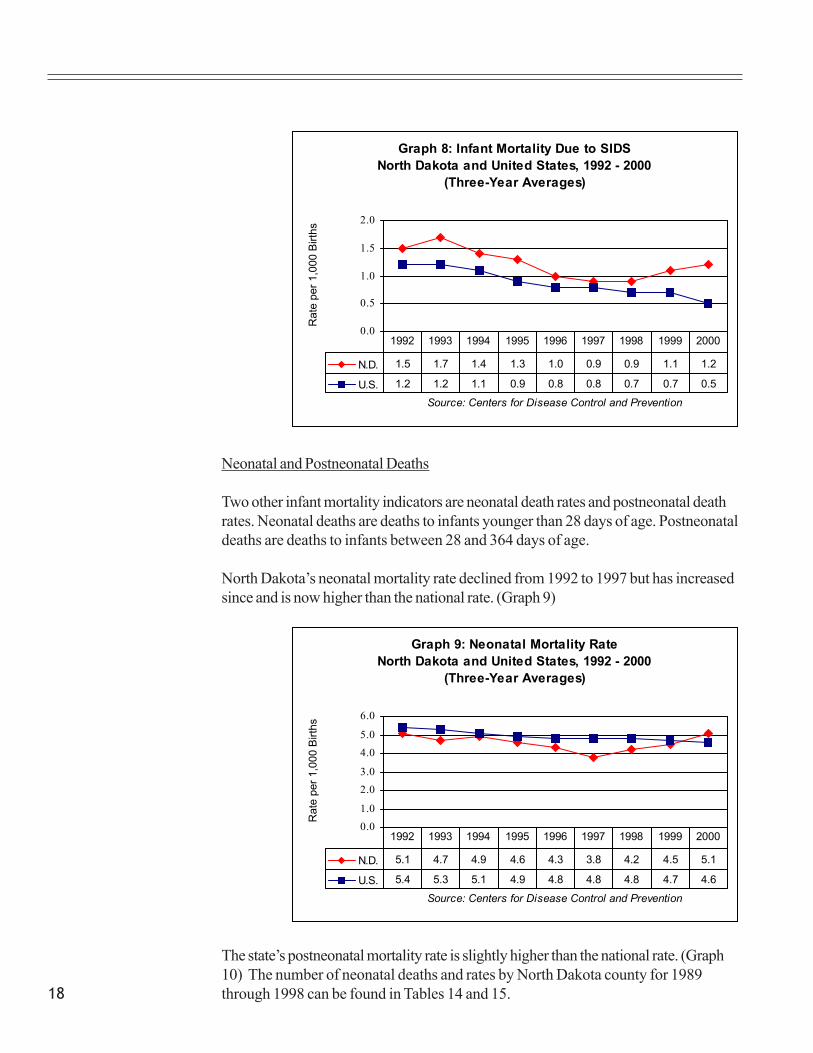
The North Dakota infant mortality rate due to SIDS showed a declining trend until anincrease beginning in 1999; North Dakota’s rate has consistently been higher thannational rates. (Graph 8) It is unknown if the state has a higher rate of SIDS or if thisis due to better diagnosis of SIDS death in North Dakota than in other states
Graph 7: Infant Mortality Due to Short Gestation/Prematurity
North Dakota and United States, 1992 - 2000 (Three-Year Averages)
0.00.20.40.60.81.01.2
Source: Centers for Disease Control and Prevention
Rat
e pe
r 1,0
00 B
irths
N.D. 0.7 0.3 0.5 0.4 0.6 0.6 0.8 0.8 0.9
U.S. 1.0 1.1 1.1 1.0 1.0 1.0 1.0 1.1 1.1
1992 1993 1994 1995 1996 1997 1998 1999 2000
Graph 6: Infant Mortality Due to Congenital Anomalies
North Dakota and United States, 1992 - 2000 (Three-Year Averages)
0.00.51.01.52.02.53.03.5
Source: Centers for Disease Control and Prevention
Rat
e pe
r 1,0
00 B
irths
N.D. 2.1 2.3 2.3 2.2 2.0 1.8 2.9 2.2 2.1
U.S. 1.8 1.8 1.7 1.7 1.6 1.6 1.6 1.4 1.4
1992 1993 1994 1995 1996 1997 1998 1999 2000
18
Neonatal and Postneonatal Deaths
Two other infant mortality indicators are neonatal death rates and postneonatal deathrates. Neonatal deaths are deaths to infants younger than 28 days of age. Postneonataldeaths are deaths to infants between 28 and 364 days of age.
North Dakota’s neonatal mortality rate declined from 1992 to 1997 but has increasedsince and is now higher than the national rate. (Graph 9)
The state’s postneonatal mortality rate is slightly higher than the national rate. (Graph10) The number of neonatal deaths and rates by North Dakota county for 1989through 1998 can be found in Tables 14 and 15.
Graph 9: Neonatal Mortality Rate North Dakota and United States, 1992 - 2000
(Three-Year Averages)
0.01.0
2.03.0
4.05.0
6.0
Source: Centers for Disease Control and Prevention
Rat
e pe
r 1,0
00 B
irths
N.D. 5.1 4.7 4.9 4.6 4.3 3.8 4.2 4.5 5.1
U.S. 5.4 5.3 5.1 4.9 4.8 4.8 4.8 4.7 4.6
1992 1993 1994 1995 1996 1997 1998 1999 2000
Graph 8: Infant Mortality Due to SIDS North Dakota and United States, 1992 - 2000
(Three-Year Averages)
0.0
0.5
1.0
1.5
2.0
Source: Centers for Disease Control and Prevention
Rat
e pe
r 1,0
00 B
irths
N.D. 1.5 1.7 1.4 1.3 1.0 0.9 0.9 1.1 1.2
U.S. 1.2 1.2 1.1 0.9 0.8 0.8 0.7 0.7 0.5
1992 1993 1994 1995 1996 1997 1998 1999 2000

19
Low Birth Weight
Low birth weight is defined as live births weighing less than 2,500 grams or 5 pounds,8 ounces. The percentage of low birth-weight births increased slightly from 1992 to2000 in both North Dakota and the United States. However, the state rate continuesto be more than one percentage point below the national rate. Because of the smallnumber of events in North Dakota, three-year averages were used for state rates.(Graph 11)
Birth Weight
Graph 10: Postneonatal Mortality Rate North Dakota and United States, 1992 - 2000
(Three-Year Averages)
0.00.51.01.52.02.53.03.5
Source: Centers for Disease Control and Prevention
Rat
e pe
r 1,0
00 B
irths
N.D. 2.9 3.2 2.8 2.8 2.2 2.4 2.4 2.7 2.7
U.S. 3.1 3.1 2.9 2.7 2.6 2.5 2.4 2.3 2.3
1992 1993 1994 1995 1996 1997 1998 1999 2000
Graph 11: Low Birth-Weight Births North Dakota and United States, 1992 - 2000
(Three-Year Averages)
0%
2%
4%
6%
8%
Source: Centers for Disease Control and Prevention
Per
cent
age
N.D. 5.2% 5.1% 5.2% 5.4% 5.5% 5.7% 6.1% 6.3% 6.4%
U.S. 7.1% 7.2% 7.3% 7.3% 7.4% 7.5% 7.6% 7.8% 7.6%
1992 1993 1994 1995 1996 1997 1998 1999 2000

20
Graph 12: Very Low Birth Weight North Dakota and United States, 1992 - 2000
(Three-Year Averages)
0.0%
0.5%
1.0%
1.5%
Source: NDDoH, Division of Vital Records; Centers for Disease Control and Prevention
Per
cent
age
N.D. 0.9% 0.9% 1.0% 1.0% 1.0% 1.0% 1.1% 1.2% 1.2%
U.S. 1.3% 1.3% 1.3% 1.4% 1.4% 1.4% 1.4% 1.5% 1.4%
1992 1993 1994 1995 1996 1997 1998 1999 2000
Very Low Birth Weight
Very low birth weight is defined as live births weighing less than 1,500 grams, or 3pounds, 4 ounces. The percentage of very low birth-weight births in North Dakota andthe United States has increased slightly since 1992; however, the state rate remainslower than the national rate. Three-year averages were used for state rates. (Graph 12)
Characteristics of low birth-weight and very low birth-weight infants:
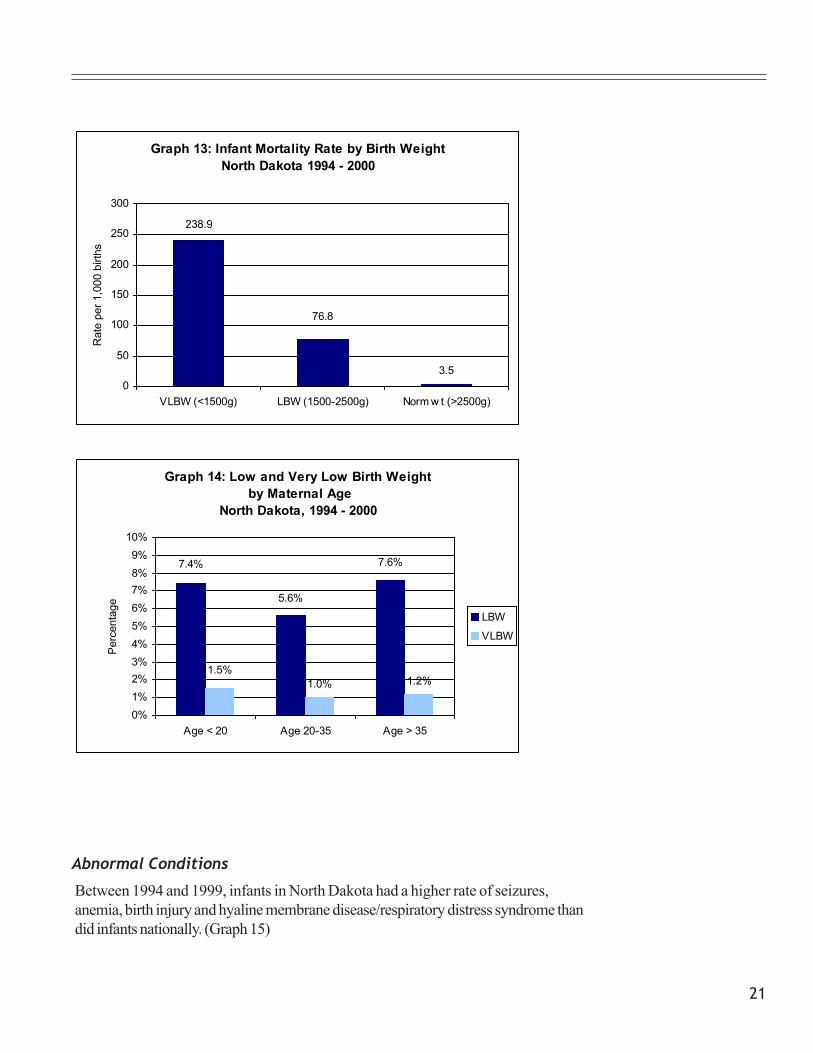
• Very low birth-rate infants are nearly 100 times more likely to die during their firstyear of life than normal birth-weight infants. (Graph 13)
• Babies born to women younger than 20 or older than 35 were more likely to beborn at low or very low birth weights than babies born to mothers ages 20through 35. (Graph 14)
• Low birth-weight or very low birth-weight infants were slightly less likely to beborn to mothers who received prenatal care beginning in the first trimester thanwere normal birth-weight infants.
21
Abnormal Conditions
Between 1994 and 1999, infants in North Dakota had a higher rate of seizures,anemia, birth injury and hyaline membrane disease/respiratory distress syndrome thandid infants nationally. (Graph 15)
Graph 13: Infant Mortality Rate by Birth Weight North Dakota 1994 - 2000
3.5
76.8
238.9
0
50
100
150
200
250
300
VLBW (<1500g) LBW (1500-2500g) Norm w t (>2500g)
Rat
e pe
r 1,0
00 b
irths
Graph 14: Low and Very Low Birth Weight by Maternal Age
North Dakota, 1994 - 2000
1.0% 1.2%
7.4%
5.6%
7.6%
1.5%
0%1%2%3%4%5%6%7%8%9%
10%
Age < 20 Age 20-35 Age > 35
Per
cent
age
LBW
VLBW

22
Between 1998 and 2000, more than one-half of North Dakota mothers werebreastfeeding their infants upon discharge from the hospital. (Graph 16) Breastfeedingrates by county in North Dakota can be found in Table 16.
Breastfeeding
Newborns are screened shortly after birth for a number of metabolic disorders,including phenylketonuria (PKU) and galactosemia. All occurant births – births toNorth Dakota residents and nonresidents born in North Dakota hospitals – arescreened. Since 1993, the number of screenings has exceeded the number ofoccurant births.
Newborn Metabolic Screening
Graph 15: Abnormal Conditions of the Newborn North Dakota and United States, 1994 - 1999
13.8
2.14.2
1.5
6.5
3.01.10.7
0.02.04.06.08.0
10.012.014.016.0
Seizures Anemia Birth Injury HMD/RDS*
Source: NDDoH, Division of Vital Records; Centers for Disease Control and Prevention
*Hyaline Membrane Disease/Respiratory Distress Syndrome
Rat
e pe
r 1,0
00 b
irths
N.D.
U.S.
Graph 16: Breastfeeding at Hospital Discharge North Dakota 1998 - 2000
53.1%
50.2%
51.7%
49%
49%
50%
50%
51%51%
52%
52%
53%
53%
54%
1998 1999 2000
Per
cent
age

23
The child population is defined as children between the ages of 1 and 9. Mortality datafor children are divided into two age categories: children ages 1 through 4 and childrenages 5 through 9.
Child Population
Child Mortality
Death rates per 100,000 North Dakota children ages 1 through 4 and 5 through 9from all causes, from unintentional injuries, and from motor vehicle accidents werecompared to United States rates from 1992 through 2000. Because of small numbers,the North Dakota deaths and rates were averaged over three years. Child and adoles-cent death rates by county can be found in Table 17.
Overall Mortality
Deaths from all causes to North Dakota children ages 1 through 4 showed an upwardtrend until 1996, but have declined since. As of 1998, the mortality rate for this groupin North Dakota is slightly less than the rate for all children in the United States.(Graph 17) The overall mortality rate for North Dakota children age 5 through 9 hasshown a slight declining trend and is similar to the national trend. (Graph 18) Deaths ofchildren by county can be found in Table 18.
Graph 17: Overall Mortality Rate, Children Ages 1 - 4 North Dakota and United States, 1992 - 2000
(Three-Year Averages)
0
10
20
30
40
50
Source: Centers for Disease Control and Prevention
Rat
e pe
r 100
,000
N.D. 34 32.4 36.1 42.9 46.8 39.6 32.9 35.5 31.4
U.S. 43.6 44.8 42.9 40.6 38.3 35.8 34.6 34.7 32.6
1992 1993 1994 1995 1996 1997 1998 1999 2000

24
The two leading causes of mortality in children ages 1 through 9 in both North Dakotaand the United States are unintentional injuries and motor vehicle crashes.
Unintentional Injuries
The death rate due to unintentional injuries for North Dakota children ages 1 through 4declined beginning in 1995 and is now slightly lower than the national rate. (Graph 19)The state child death rate due to unintentional injuries for children ages 5 through 9increased until 1997, declined since 1998, and was lower than the national rate in2000. (Graph 20) Deaths by county of children ages 1 through 9 due to unintentionalinjury can be found in Table 19.
Graph 19: Unintentional Injury Morality RateChildren Ages 1 - 4
North Dakota and United States, 1992 - 2000 (Three-Year Averages)
0
5
10
15
20
Source: Centers for Disease Control and Prevention
Rat
e pe
r 100
,000
N.D. 6.3 8.3 9.5 17.5 16.9 16.2 10.3 13.6 11.5
U.S. 15.9 16.4 15.9 14.5 13.8 13.1 12.7 12.6 11.7
1992 1993 1994 1995 1996 1997 1998 1999 2000
Graph 18: Overall Mortality Rate, Children Ages 5 - 9 North Dakota and United States, 1992 - 2000
(Three-Year Averages)
05
1015
2025
30
Source: Centers for Disease Control and Prevention
Rat
e pe
r 100
,000
N.D. 24.5 19.8 17.4 19.9 18.9 20.1 15.3 14.1 12.6
U.S. 20.4 21.1 19.9 19.7 19.4 18.5 17.7 17.4 16.5
1992 1993 1994 1995 1996 1997 1998 1999 2000

25
Motor Vehicle Crashes
The motor vehicle mortality rate for North Dakota children ages 1 through 4 hasincreased since 1993 but remains lower than the national rate. (Graph 21) The deathrate for North Dakota children ages 5 through 9 also has increased since 1995.(Graph 22) Deaths by county of children ages 1 through 9 due to motor vehiclefatalities can be found in Table 20.
Graph 20: Unintentional Injury Mortality Rate,Children Ages 5 - 9
North Dakota and United States, 1992 - 2000 (Three-Year Averages)
0
5
10
15
Source: Centers for Disease Control and Prevention
Rat
e pe
r 100
,000
N.D. 10.6 9.5 8.4 10.6 11.6 12.7 10.0 6.3 4.7
U.S. 8.9 8.6 8.5 8.4 8.2 7.8 7.8 7.3 6.8
1992 1993 1994 1995 1996 1997 1998 1999 2000
Graph 21: Motor Vehicle Death Rate Children Ages 1 - 4
North Dakota and United States, 1992 - 1999 (Three-Year Averages)
0
2
4
6
8
Source: Centers for Disease Control and Prevention
Rat
e pe
r 100
,000
N.D. 1.8 0.9 1.0 2.9 4.0 4.1 3.1 4.2
U.S. 5.4 5.6 5.9 5.2 5.3 5.0 4.9 4.7
1992 1993 1994 1995 1996 1997 1998 1999

26
Participation in Programs and Services
The percentage of North Dakota children who received food stamps, who participatedin the free and reduced school-lunch program and the WIC program, and who wereenrolled in Medicaid remained relatively constant from 1995 through 1999. (Chart 8)
The percentage of North Dakota children by county who received food stamps from1995 through 1999 is found in Table 21. County data for the percentage of NorthDakota children who participated in the free and reduced-price school-lunch programfrom 1995 through 1999 is found in Table 22. North Dakota children by county whoparticipated in WIC from 1995 through 2000 is found in Table 23, and Medicaidenrollment by county for 1994 through 1999 is in Table 24.
The percentage of North Dakota children who were victims of child abuse and neglectincreased from 4 percent in 1996 to 4.4 percent in 1999. Table 25 shows the totalnumber and percentage of child abuse and neglect victims by county in North Dakotafor 1996 through 1999.
Child Abuse and Neglect
Chart 8: Percentage of Children Enrolled in Programs and Services
Program/Service 1995 1996 1997 1998 1999
Food stamps 18.2% 17.5% 17.0% 17.1% 17.4%
School lunch 28.3% 28.6% 29.0% 28.2% 29.1%
WIC 16.3% 16.2% 17.0% 18.2% 16.7%
Medicaid 17.4% 17.4% 17.2% 17.5% 17.5%
Source: Kids Count
Graph 22: Motor Vehicle Death Rate Children Ages 5 - 9
North Dakota and United States, 1992 - 1999 (Three-Year Averages)
0
2
4
6
Source: Centers for Disease Control and Prevention
Rat
e pe
r 100
,000
N.D. 5.3 4.1 4.2 2.1 2.9 4.5 4.6 3.1
U.S. 4.9 4.7 4.7 4.7 4.5 4.3 4.2 4.5
1992 1993 1994 1995 1996 1997 1998 1999
27
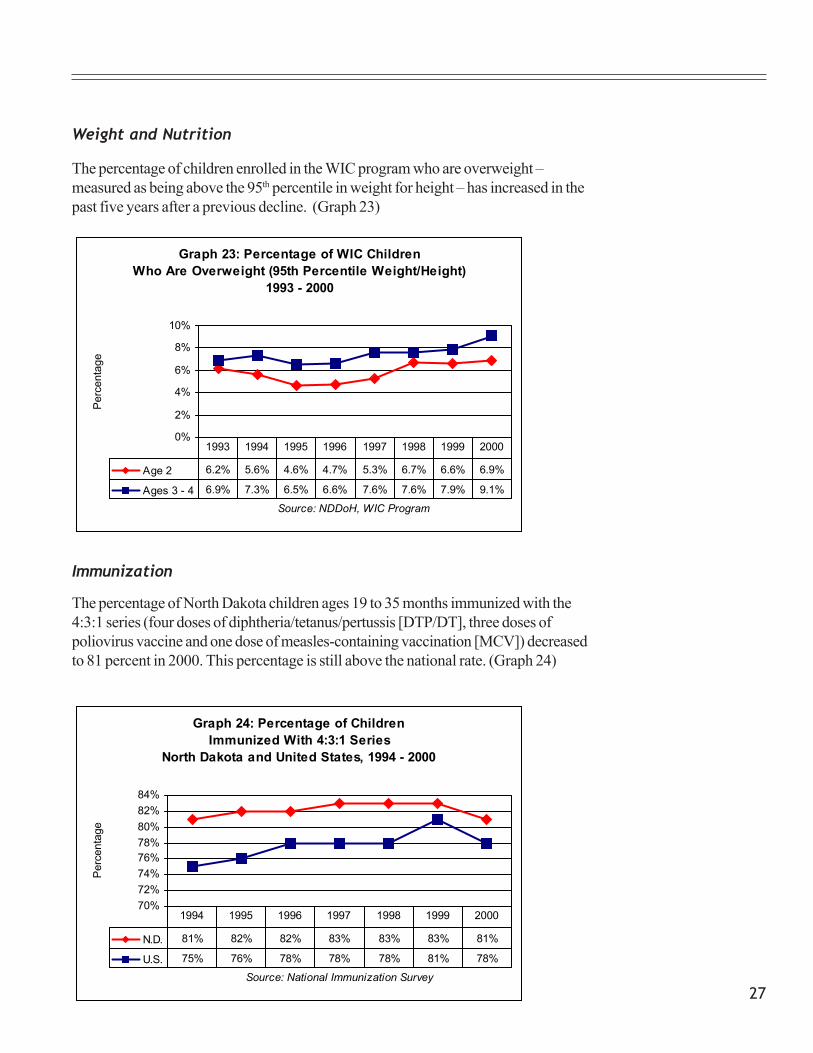
Weight and Nutrition
The percentage of children enrolled in the WIC program who are overweight –measured as being above the 95th percentile in weight for height – has increased in thepast five years after a previous decline. (Graph 23)
Immunization
The percentage of North Dakota children ages 19 to 35 months immunized with the4:3:1 series (four doses of diphtheria/tetanus/pertussis [DTP/DT], three doses ofpoliovirus vaccine and one dose of measles-containing vaccination [MCV]) decreasedto 81 percent in 2000. This percentage is still above the national rate. (Graph 24)
Graph 23: Percentage of WIC Children Who Are Overweight (95th Percentile Weight/Height)
1993 - 2000
0%
2%
4%
6%
8%
10%
Source: NDDoH, WIC Program
Per
cent
age
Age 2 6.2% 5.6% 4.6% 4.7% 5.3% 6.7% 6.6% 6.9%
Ages 3 - 4 6.9% 7.3% 6.5% 6.6% 7.6% 7.6% 7.9% 9.1%
1993 1994 1995 1996 1997 1998 1999 2000
Graph 24: Percentage of Children Immunized With 4:3:1 Series
North Dakota and United States, 1994 - 2000
70%72%74%76%78%80%82%84%
Source: National Immunization Survey
Per
cent
age
N.D. 81% 82% 82% 83% 83% 83% 81%
U.S. 75% 76% 78% 78% 78% 81% 78%
1994 1995 1996 1997 1998 1999 2000

28
Children with special health care needs are children who have chronic physical, devel-opmental or behavorial conditions. About 17 percent of North Dakota children (morethan 30,000) have a special health care need.
Children With Special Health Care Needs
Prevalence of Chronic Conditions
The number of North Dakota children who have chronic health conditions is unknown.Prevalence estimates are based upon a number of sources, including national preva-lence estimates from the National Health Interview Survey on Disability and the Marchof Dimes, as well as the incidence of congenital anomalies as reported on NorthDakota birth certificates.
National Health Interview Survey on Disability
The National Health Interview Survey on Disability from 1999 was conducted by theNational Center for Health Statistics at the Centers for Disease Control andPrevention. Results from this national household-based telephone survey were used tocalculate the number of children with certain chronic health conditions and the rate per1,000 children for the United States overall. The national rate per 1,000 is multipliedby the North Dakota child population to calculate state-based estimates of chronichealth conditions. (Chart 9)
Chart 9: Prevalence Rate and Estimated Number of Children With SelectedChronic Conditions in North Dakota
Condition Rate/1,000 N.D. Estimate
Asthma 110.4 17,758
Hearing impairment* 29.3 4,713
Vision impairment** 21.7 3,490
Cerebral Palsy 4.8 772
Congenital heart disease 2.2 354
Diabetes 1.4 225
Muscular Dystrophy 0.5 80
Cystic fibrosis 0.1 16
*Hearing without aids: a little difficulty, a lot of difficulty or deaf**Trouble seeing with glasses/contacts
Source: 1999 National Health Interview Survey on Disability, National Center forHealth Statistics

29
March of Dimes
The following chart, which shows state estimates based upon national incidence ratesfor other chronic health conditions, was developed using state and national estimatesfrom the March of Dimes. (Chart 10)
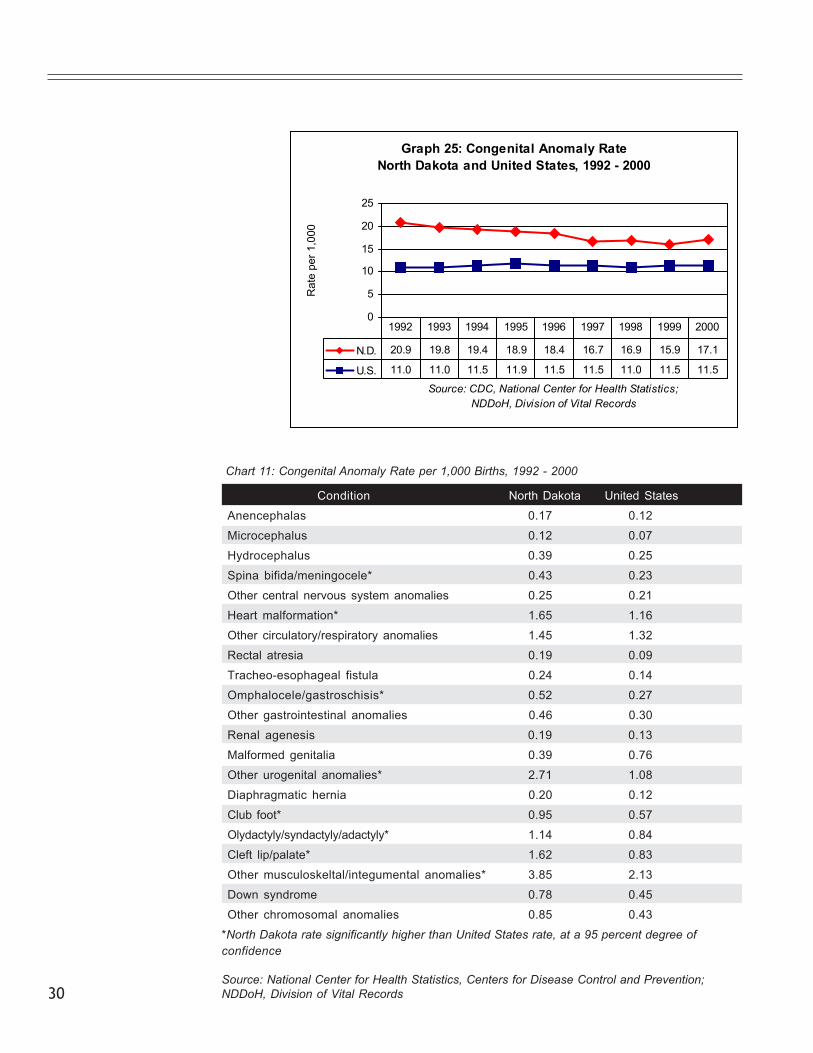
Congenital anomalies are 22 specific birth defects that are identifiable at or shortlyafter birth and are recorded on the child’s birth certificate. Between 1992 and 2000,the North Dakota rate of births with one or more congenital anomalies per 1,000 livebirths was higher than the United States rate. (Graph 25)
Chart 11 compares congenital anomaly rates for North Dakota and the United States.The number of total anomalies and the number of births with one or more congenitalanomaly by county in North Dakota for 1994 through 2000 are shown in Table 26.
Congenital Anomalies
Condition Rate of Occurrence* Occurrences Per Year*
Structural/MetabolicHeart and circulation 1 in 115 births 67
Muscles and skeleton 1 in 130 births 59
Genital and urinary tract 1 in 135 births 57
Nervous system and eye 1 in 235 births 33
Chromosomal syndromes 1 in 600 births 13
Club foot 1 in 735 births 10
Down Syndrome (Trisomy 21) 1 in 900 births 9
Respiratory tract 1 in 900 births 9
Cleft lip/palate 1 in 930 births 8
Spina bifida 1 in 2,000 births 4
Metabolic disorders 1 in 3,500 births 2
Anencephaly 1 in 8,000 births <1
PKU 1 in 12,000 births <1
Congenital InfectionsCongenital syphilis 1 in 2,000 births 4
Congenital HIV infection 1 in 2,700 births 3
Congenital rubella syndrome 1 in 100,000 births <1
Other ConditionsFetal alcohol syndrome 1 in 1,000 births 8
Rh disease 1 in 1,400 births 5
*Estimates
Source: March of Dimes Birth Defects Foundation
Chart 10: Estimated Incidence Rate and Number of ChildrenWith Chronic Conditions in North Dakota
30
Graph 25: Congenital Anomaly Rate North Dakota and United States, 1992 - 2000
0
5
10
15
20
25
Source: CDC, National Center for Health Statistics; NDDoH, Division of Vital Records
Rat
e pe
r 1,0
00
N.D. 20.9 19.8 19.4 18.9 18.4 16.7 16.9 15.9 17.1
U.S. 11.0 11.0 11.5 11.9 11.5 11.5 11.0 11.5 11.5
1992 1993 1994 1995 1996 1997 1998 1999 2000
Chart 11: Congenital Anomaly Rate per 1,000 Births, 1992 - 2000
Condition North Dakota United States
Anencephalas 0.17 0.12
Microcephalus 0.12 0.07
Hydrocephalus 0.39 0.25
Spina bifida/meningocele* 0.43 0.23
Other central nervous system anomalies 0.25 0.21
Heart malformation* 1.65 1.16
Other circulatory/respiratory anomalies 1.45 1.32
Rectal atresia 0.19 0.09
Tracheo-esophageal fistula 0.24 0.14
Omphalocele/gastroschisis* 0.52 0.27
Other gastrointestinal anomalies 0.46 0.30
Renal agenesis 0.19 0.13
Malformed genitalia 0.39 0.76
Other urogenital anomalies* 2.71 1.08
Diaphragmatic hernia 0.20 0.12
Club foot* 0.95 0.57
Olydactyly/syndactyly/adactyly* 1.14 0.84
Cleft lip/palate* 1.62 0.83
Other musculoskeltal/integumental anomalies* 3.85 2.13
Down syndrome 0.78 0.45
Other chromosomal anomalies 0.85 0.43
*North Dakota rate significantly higher than United States rate, at a 95 percent degree ofconfidence
Source: National Center for Health Statistics, Centers for Disease Control and Prevention;NDDoH, Division of Vital Records
31
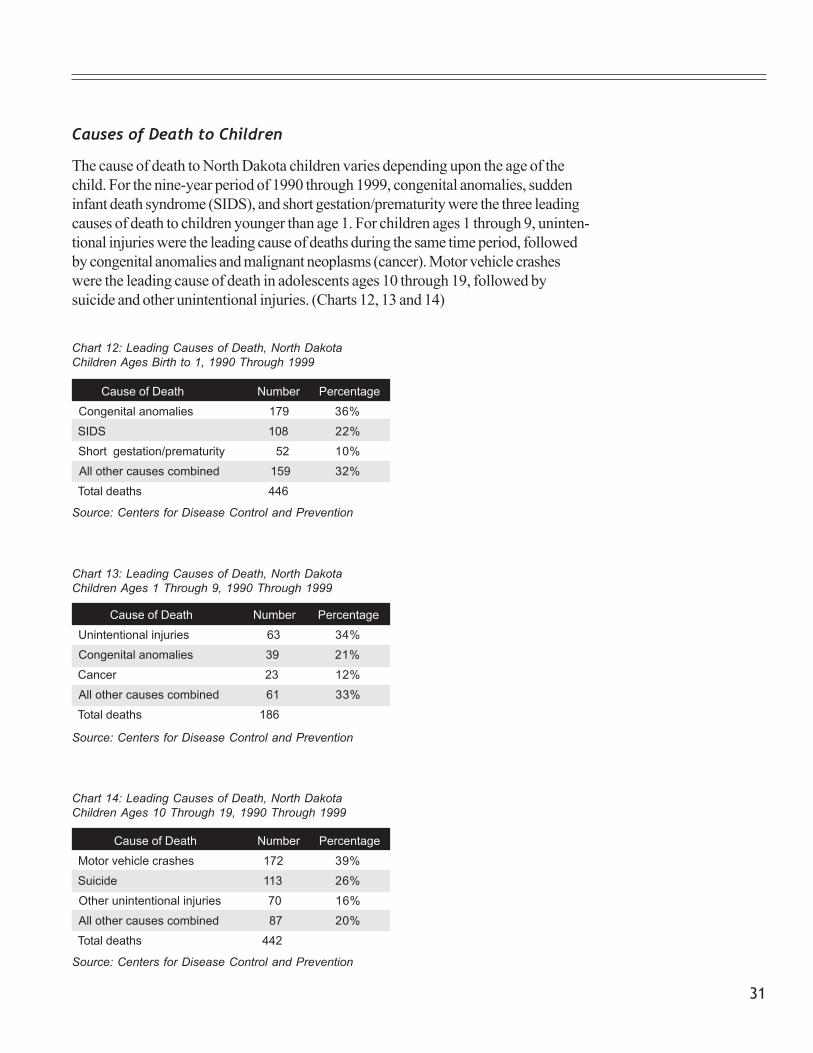
Causes of Death to Children
The cause of death to North Dakota children varies depending upon the age of thechild. For the nine-year period of 1990 through 1999, congenital anomalies, suddeninfant death syndrome (SIDS), and short gestation/prematurity were the three leadingcauses of death to children younger than age 1. For children ages 1 through 9, uninten-tional injuries were the leading cause of deaths during the same time period, followedby congenital anomalies and malignant neoplasms (cancer). Motor vehicle crasheswere the leading cause of death in adolescents ages 10 through 19, followed bysuicide and other unintentional injuries. (Charts 12, 13 and 14)
Chart 12: Leading Causes of Death, North DakotaChildren Ages Birth to 1, 1990 Through 1999
Source: Centers for Disease Control and Prevention
Cause of Death Number Percentage
Congenital anomalies 179 36%
SIDS 108 22%
Short gestation/prematurity 52 10%
All other causes combined 159 32%
Total deaths 446
Source: Centers for Disease Control and Prevention
Chart 13: Leading Causes of Death, North DakotaChildren Ages 1 Through 9, 1990 Through 1999
Cause of Death Number Percentage
Unintentional injuries 63 34%
Congenital anomalies 39 21%
Cancer 23 12%
All other causes combined 61 33%
Total deaths 186
Cause of Death Number Percentage
Motor vehicle crashes 172 39%
Suicide 113 26%
Other unintentional injuries 70 16%
All other causes combined 87 20%
Total deaths 442
Source: Centers for Disease Control and Prevention
Chart 14: Leading Causes of Death, North DakotaChildren Ages 10 Through 19, 1990 Through 1999

32
Pediatric Hospitalization
Causes
The total number of hospital admissions for North Dakota children ages birththrough 20 decreased from more than 11,000 in 1996 to fewer than 8,500 in 1997.Mental health disorders are the leading cause of hospitalization for children ages 6through 11 and 12 through 17. The three leading causes of pediatric hospitalization aresummarized in Charts 15, 16 and 17
Source: North Dakota Health Care Claims System
Chart 16: Leading Causes of Pediatric Hospitalization,North Dakota Children Ages 6 to 11, 1997 Through 1998
Cause Number Percentage
Mental disorders 297 22.9%
Respiratory diseases 213 16.4%
Metabolic disorders 186 14.4%
All other causes 599 46.3%
Total hospitalizations 1,295
Cause Number Percentage
Mental disorders 1,655 48.1%
Injuries and poisoning 317 9.2%
Pregnancy/childbirth 289 8.4%
All other causes 1,181 34.3%
Total hospitalizations 3,442
Source: North Dakota Health Care Claims System
Chart 17: Leading Causes of Pediatric Hospitalization,North Dakota Children Ages 12 to 17, 1997 Through 1998
Chart 15: Leading Causes of Pediatric Hospitalization,North Dakota Children Ages Birth to 5, 1997 Through 1998
Source: North Dakota Health Care Claims System
Cause Number Percentage
Newborn delivery 9,359 74.1%
Respiratory diseases 1,329 10.5%
Metabolic disorders 363 2.8%
All other causes 1,578 12.5%
Total hospitalizations 12,629

33
Children with special health care needs are served by a number of public and privateservice systems.
Children’s Special Health Services
Between federal fiscal year (FFY) 1993 and FFY 2000, the Children’s Special HealthServices (CSHS) Unit in the North Dakota Department of Human Services directlyserved an average of more than 1,600 children per year. Table 27 shows the numberof children by county served by CSHS from FFY 1993 through FFY 2000.
Between FFY 1993 and FFY 2000, the percentage of children ages birth through 2served by CSHS increased from 9.7 percent to 14.4 percent.
The percentage of children served by CSHS who are Native American increased from6.7 percent in FFY 1993 to 9.6 percent in FFY 2000.
Graph 26 shows the most common conditions of children served by CSHS from 1993through 1999.
Service Use
Graph 26: Most Common Conditions of Children Served by CHSH, FFY 1993 Through 1999
225
232
241
266
553
1,280
2,938
3,064
0 500 1,000 1,500 2,000 2,500 3,000 3,500
Spina Bif ida
Diabetes
Cerebral Palsy
Hearing Loss
Malocclusion
Clef t Lip/Palate
Scoliosis
Cardiac
Source: CSHS program database
The primary source of information about the children served by the Children’s SpecialHealth Services Unit is the Family Needs Assessment Survey. Results for the 1999survey can be obtained by calling the CSHS Unit at 1.800.755.2714.

34
Head Start
The number of children enrolled in Head Start increased from 2,414 in 1997 to2,513 in 1999. The number of children served and the percentage of 3 to 4 yearolds enrolled by county can be found in Table 29.
The number of children by county enrolled in special education in North Dakota for1995 through 1999 can be found in Table 28.
Special Education
Many children with special health care needs are served through the Department ofPublic Instruction’s Special Education Program. From the 1994-1995 school year tothe 2000-2001 school year, between 12,000 and 13,000 North Dakota children wereenrolled in special education programs, most often for speech and language impair-ments and learning disabilities. The conditions for which there was the greatest in-crease in the number of children served were serious emotional disturbance, otherhealth impairment, autism and traumatic brain injuries. (Chart 18)
Eligibility Category ‘94-’95 ‘95-’96 ‘96-’97 ‘97-’98 ‘98-’99 ‘99-’00 ‘00-’01
Deaf/blind 2 2 1 5 5 2 2
Taumatic brain injury 23 21 22 27 29 31 35
Autism 44 58 67 81 96 112 135
Vision impaired 61 60 68 66 58 61 60
Hearing impaired 127 111 99 108 110 109 104
Orthopedically impaired 178 180 181 181 188 177 158
Other health impaired 231 287 344 375 471 542 640
Emotionally disturbed 617 691 779 812 903 973 1,037
Mental retardation 1,295 1,295 1,282 1,269 1,236 1,241 1,246
Speech/language impaired 3,892 4,060 4,191 4,333 4,306 4,416 4,251
Learning disability 5,558 5,542 5,627 5,697 5,620 5,686 5,620
Source: North Dakota Department of Public Instruction, Special Education Program
Chart 18: Eligibility Category of Children Served by Special Education Programs,For School Years 1994 Through 2001

35
Chart 19: Children by Race Ages Birth Through 3 Served by EarlyIntervention Programs, 1998 Through 2000
Child’s Race 1998 1999 2000
White (Not Hispanic) 237 264 306
American Indian or Alaska Native 45 47 42
Asian or Pacific Islander 3 3 6
Black or African American 6 8 3
Hispanic or Latino 7 6 6
All Children Ages 0 to 3 298 328 363Source: North Dakota Department of Human Services,Developmental Disabilities Division, Infant Development Program
Supplemental Security Income
Many children who have disabilities or chronic illnesses receive Supplemental SecurityIncome (SSI) benefits. In North Dakota, the number of children who receive benefitsdecreased from 1,776 in 1996 to 1,456 in 2000, primarily due to federal changes inSSI eligibility criteria. The percentage of North Dakota child SSI recipients who areNative American is about 15 percent. (Graph 27)
Early Intervention
The Infant Development Program, administered by the North Dakota Department ofHuman Services’ Disability Services Division, serves infants and toddlers to age 3 whohave or may be at risk for developing a developmental delay. The number of childrenserved through early intervention increased each year between 1998 and 2000.(Chart 19)
Graph 27: Number of North Dakota Children Receiving SSI Benefits, 1996 - 2000
1,7761,664 1,629 1,590
1,456
1,000
1,200
1,400
1,600
1,800
2,000
1996 1997 1998 1999 2000
Source: Social Security Administration
Num
ber o
f Chi
ldre
n

36
Birth Review Program
The North Dakota Birth Review Program is an interagency effort among the state’sHealth, Human Services and Public Instruction departments. The purpose of the BirthReview Program is to notify the parents of newborns about the availability of resourcesand services if they should have any concerns about the health and development oftheir babies. Of particular concern are babies who had one or more risk conditionsassociated with their births that might make them more likely to develop health ordevelopmental problems.
Shortly after the birth of a child, parents are mailed a letter asking them to contact theChildren’s Special Health Services Unit for information about available services.Between 1996 and 1998, more births with risks were notified and more families choseto participate by responding to the notification. (Chart 20)
Screening newborns for hearing loss prior to hospital discharge helps to identify hearingproblems early. In addition, proper treatment and intervention at an early age can helpminimize the effects of hearing loss in young children. The percentage of all newbornsscreened increased from 39 percent in 1998 to 42 percent in 2000. (Chart 21)
Newborn Hearing Screening
Chart 20: North Dakota Birth Review Program Participation, 1996 Through 1998 Program Participation 1996 1997 1998
Births with risks notified 643 771 828
Families with risks who participated 210 246 358
Percentage of families who participated 33% 32% 43%
Source: Birth Review Program, Children’s Special Health Services
Chart 21: Newborn Hearing Screening by Facility, 1998 Through 2000
Facility and Location 1998 1999 2000
Altru Health System, Grand Forks 1,200 1,039 1,230
MeritCare Medical Center, Fargo 1,482 1,379 1,418
Trinity Hospital, Minot 580 692 700
Medcenter One Health Systems, Bismarck 26 54 97
St. Alexius Medical Center, Bismarck 300 200 192
Dakota/Heartland Health System, Fargo NR 33 54
Total number of infants screened 3,588 3,397 3,691
Total number of in-state births 9,156 8,879 8,847
Percentage of infants screened 39.2% 38.3% 41.7%
Source: Newborn Hearing Screening Report, Children’s Special Health Services

37
Adolescent Population
Adolescents are defined as children and teenagers between the ages of 10 and 19.Data for adolescents is grouped into two categories: ages 10 through 14 and ages15 through 19.
Mortality
The mortality rate is one of the most common indicators of adolescent health status.The adolescent mortality rate for North Dakota from 1990 through 2000 was graphedover time to display trends and was compared to the rate for the United States overallto identify differences between state and national rates. Because of the small numberof deaths in North Dakota, three-year averages were used for the state rates.
Overall Mortality
The overall mortality rate for North Dakota adolescents ages 10 through 14 has showna declining trend since 1995 but has remained slightly higher than the national rate. Themortality rate for North Dakota adolescents ages 15 through 19 has shown a some-what flat trend, but because the national rate is declining, the state rate now is slightlyhigher than the national rate. (Graphs 28 and 29) Deaths of children ages 10 through19 by county can be found in Table 30.
Graph 28: Overall Mortality Rate Adolescents Ages 10 - 14
North Dakota and United States, 1992 - 2000 (Three-Year Averages)
0
10
20
30
40
Source: Centers for Disease Control and Prevention
Rat
e pe
r 100
,000
N.D. 24.3 23.9 27.4 31.1 29.3 27.8 25.7 24.8 21.6
U.S. 24.6 25.6 25.2 25.5 24.0 23.2 22.1 21.1 20.5
1992 1993 1994 1995 1996 1997 1998 1999 2000

38
Three of the leading causes of adolescent mortality are deaths due to unintentionalinjuries, deaths caused by motor vehicle crashes, and suicide.
Unintentional Injuries
The mortality rate due to unintentional injuries for North Dakota adolescents ages 10through 14 has increased since 1997, while the national rate has decreased. The ratefor adolescents ages 15 through 19 was similar to the national rate until an increase in1998. (Graphs 30 and 31) Deaths by county of children ages 10 through 19 due toaccidents can be found in Table 31.
Graph 29: Overall Mortality Rate Adolescents Ages 15 - 19
North Dakota and United States, 1992 - 2000(Three-Year Averages)
0
20
4060
80
100
Source: Centers for Disease Control and Prevention
Rat
e pe
r 100
,000
N.D. 71.0 62.3 71.4 72.7 76.5 70.6 73.7 72.9 66.2
U.S. 84.3 86.9 86.8 83.5 78.6 74.9 70.6 69.8 67.7
1992 1993 1994 1995 1996 1997 1998 1999 2000
Graph 30: Unintentional Injury Mortality Rate Adolescents Ages 10 - 14
North Dakota and United States, 1992 - 2000 (Three-Year Averages)
02468
10121416
Source: Centers for Disease Control and Prevention
Rat
e pe
r 100
,000
N.D. 9.5 8.6 12.4 12.3 13.0 9.9 12.8 13.1 14.7
U.S. 9.7 10.1 10.2 10.2 9.7 9.7 8.9 8.3 7.7
1992 1993 1994 1995 1996 1997 1998 1999 2000

39
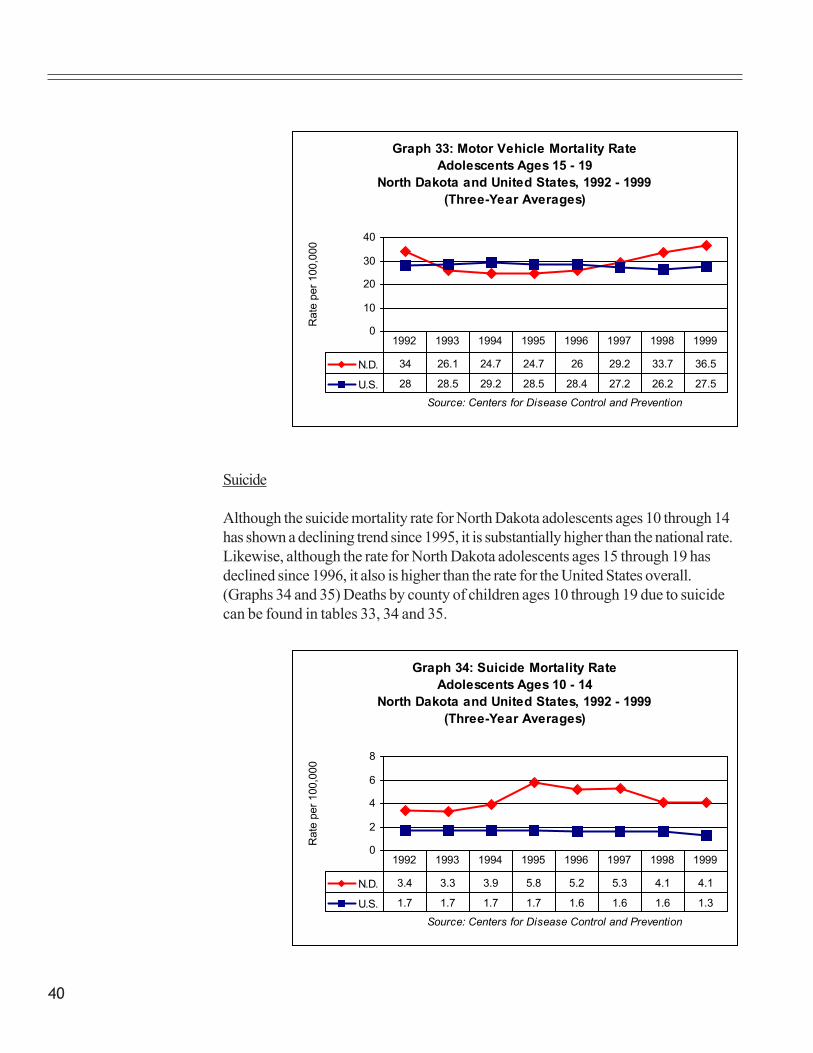
Motor Vehicle Crashes
Although the mortality rate for North Dakota adolescents ages 10 through 14 due tomotor vehicle crashes has fluctuated, the 1998 and 1999 rates were the same as thenational rate. Since 1995, the national motor vehicle death rate for adolescents ages 15through 19 has decreased, while the North Dakota rate has increased to surpass thenational rate. (Graphs 32 and 33) Deaths of children ages 10 through 19 due tomotor vehicle accidents can be found in Table 32.
Graph 31: Unintentional Injury Mortality Rate Adolescents Ages 15 - 19
North Dakota and United States, 1992 - 2000 (Three-Year Averages)
0
10
2030
40
50
Source: Centers for Disease Control and Prevention
Rat
e pe
r 100
,000
N.D. 37.7 31.1 34.6 33.6 35.3 33.7 39.4 40.9 34.4
U.S. 36.5 37.3 37.3 36.7 36.2 34.6 33.7 33.9 33.1
1992 1993 1994 1995 1996 1997 1998 1999 2000
Graph 32: Motor Vehicle Mortality Rate Adolescents Ages 10 - 14
North Dakota and United States, 1992 - 1998 (Three-Year Averages)
0
2
4
6
8
Source: Centers for Disease Control and Prevention
Rat
e pe
r 100
,000
N.D. 3.4 2.7 6.5 6.5 7.2 4.6 5.4 5.5
U.S. 5.5 5.8 6.0 6.0 5.8 5.8 5.4 5.5
1992 1993 1994 1995 1996 1997 1998 1999
40
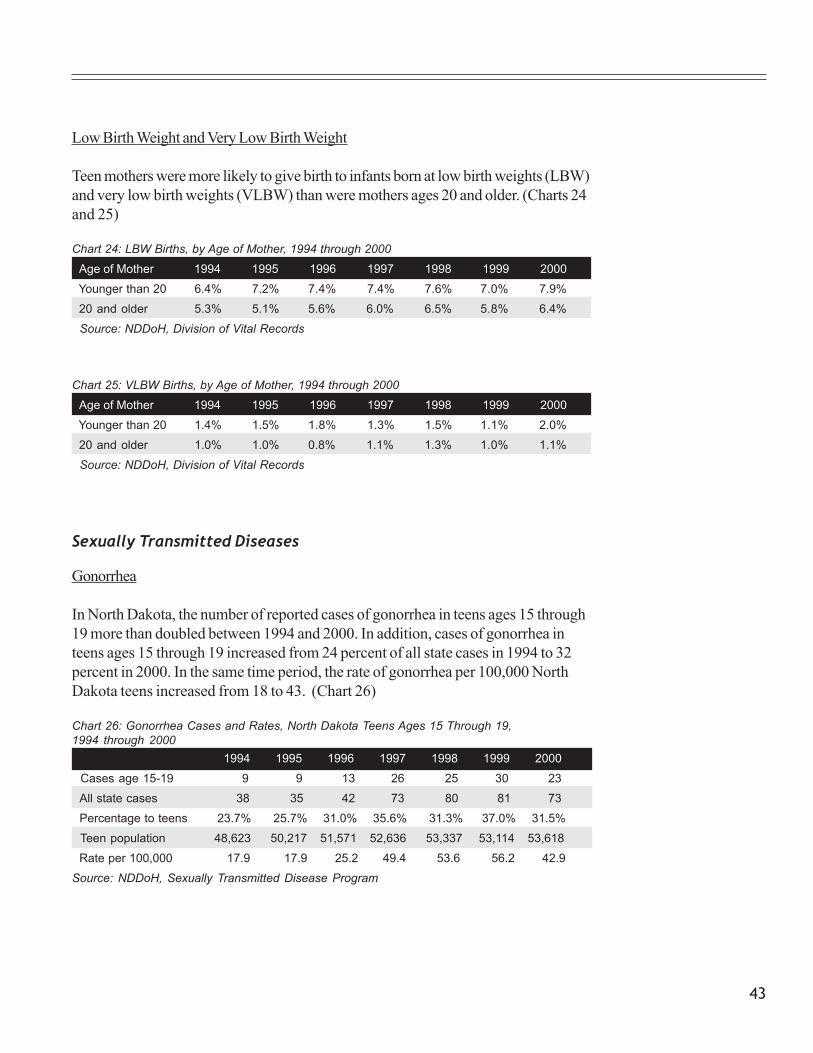
Suicide
Although the suicide mortality rate for North Dakota adolescents ages 10 through 14has shown a declining trend since 1995, it is substantially higher than the national rate.Likewise, although the rate for North Dakota adolescents ages 15 through 19 hasdeclined since 1996, it also is higher than the rate for the United States overall.(Graphs 34 and 35) Deaths by county of children ages 10 through 19 due to suicidecan be found in tables 33, 34 and 35.
Graph 33: Motor Vehicle Mortality Rate Adolescents Ages 15 - 19
North Dakota and United States, 1992 - 1999 (Three-Year Averages)
0
10
20
30
40
Source: Centers for Disease Control and Prevention
Rat
e pe
r 100
,000
N.D. 34 26.1 24.7 24.7 26 29.2 33.7 36.5
U.S. 28 28.5 29.2 28.5 28.4 27.2 26.2 27.5
1992 1993 1994 1995 1996 1997 1998 1999
Graph 34: Suicide Mortality Rate Adolescents Ages 10 - 14
North Dakota and United States, 1992 - 1999 (Three-Year Averages)
0
2
4
6
8
Source: Centers for Disease Control and Prevention
Rat
e pe
r 100
,000
N.D. 3.4 3.3 3.9 5.8 5.2 5.3 4.1 4.1
U.S. 1.7 1.7 1.7 1.7 1.6 1.6 1.6 1.3
1992 1993 1994 1995 1996 1997 1998 1999

41
Both the United States and North Dakota pregnancy rates for teens ages 15 through19 declined slightly between 1990 and 1996. In 1996, the state rate was less thanone-half the national rate. (Graph 36) The number of teen pregnancies and teenpregnancy rates by North Dakota county can be found in tables 36 and 37.
Teen Pregnancies
Graph 35: Suicide Mortality Rate Adolescents Ages 15 - 19
North Dakota and United States, 1992 - 1999 (Three-Year Averages)
0
5
1015
20
25
Source: Centers for Disease Control and Prevention
Rat
e pe
r 100
,000
N.D. 19.6 18.1 18.4 19.2 22 19.4 17.2 15.7
U.S. 10.8 10.9 11.1 10.5 9.7 9.5 11.1 8.2
1992 1993 1994 1995 1996 1997 1998 1999
Graph 36: Teen (Ages 15 - 19) Pregnancy Rates North Dakota and United States, 1990 - 1996
020
406080
100
120140
Source: National Center for Health Statistics
Rat
e pe
r 1,0
00
N.D. 48.1 45.4 48.1 47.4 46.0 47.0 44.8
U.S. 116.3 116.5 112.8 110.4 107.6 102.7 98.7
1990 1991 1992 1993 1994 1995 1996

42
Teen Births
The number of births to North Dakota teens ages 15 through 19 decreased from 810in 1995 to 707 in 2000.
Between 1990 and 2000, the United States birth rate for teens ages 15 through 19decreased slightly; at the same time, the North Dakota teen birth rate remained aboutthe same until 1999, when the rate began a dramatic decline. The national teen birthrate remains considerably higher than the state rate. (Graph 37) The number of teenbirths and teen birth rates by county is in Tables 38 and 39.
Alcohol and Tobacco Use During Pregnancy
Teen mothers were slightly more likely to use alcohol and more than twice as likely touse tobacco during their pregnancies than were North Dakota mothers ages 20 andolder. (Charts 22 and 23)
Graph 37: Teen (Ages 15 - 19) Birth Rates North Dakota and United States, 1990 - 2000
0
20
40
60
80
Source: National Center for Health Statistics
Rat
e pe
r 1,0
00
N.D. 35.6 34.8 36.7 37.3 35.7 36.3 35.8 34.0 35.0 31.9 27.3
U.S. 59.9 62.1 60.7 59.6 58.9 56.8 54.4 52.3 51.1 49.6 48.7
1990 1991 1992 1993 1994 1995 1996 1997 1998 1999 2000
Chart 22: Births With Maternal Alcohol Use, by Age of Mother, 1994 through 2000
Age of Mother 1994 1995 1996 1997 1998 1999 2000
Younger than 20 1.8% 2.2% 2.0% 1.6% 1.7% 1.5% 3.7%
20 or older 1.6% 1.3% 1.5% 1.1% 1.1% 1.1% 1.0%
Source: NDDoH, Division of Vital Records
Chart 23: Births With Maternal Tobacco Use, by Age of Mother, 1994 through 2000
Age of Mother 1994 1995 1996 1997 1998 1999 2000
Younger than 20 30.3% 27.9% 32.7% 37.0% 33.4% 36.6% 33.5%
20 or older 18.2% 16.7% 16.8% 18.2% 17.8% 17.3% 13.0%
Source: NDDoH, Division of Vital Records
43
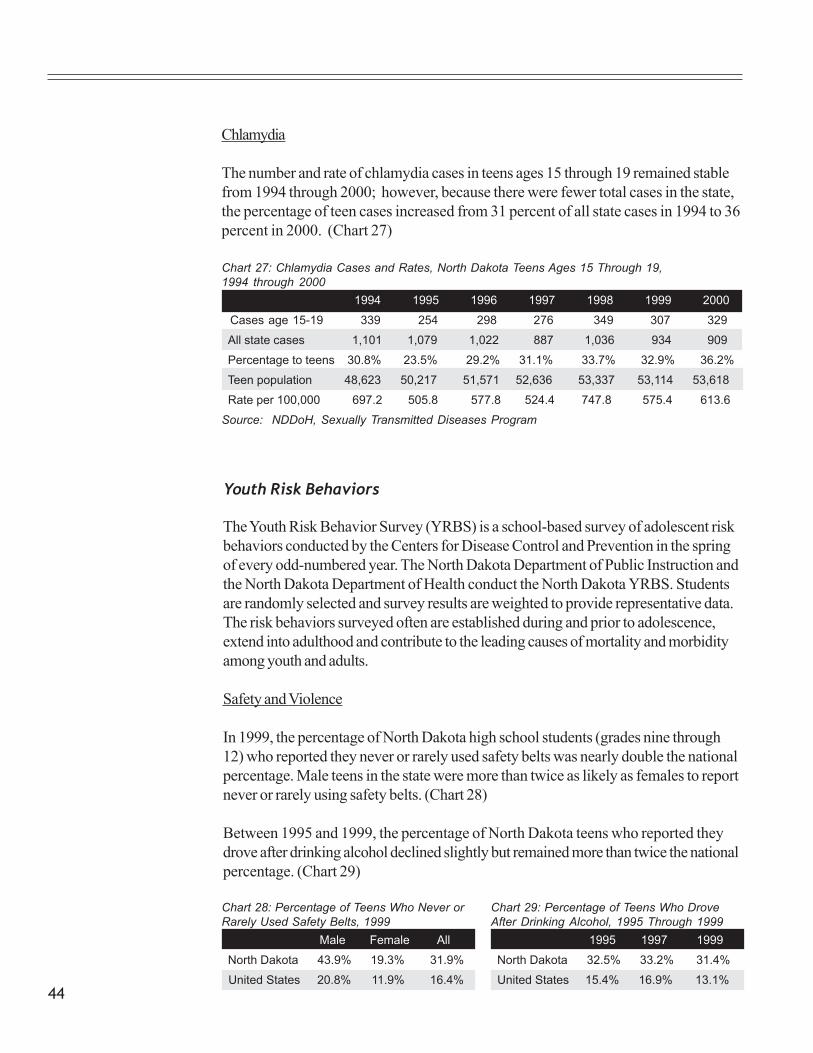
Low Birth Weight and Very Low Birth Weight
Teen mothers were more likely to give birth to infants born at low birth weights (LBW)and very low birth weights (VLBW) than were mothers ages 20 and older. (Charts 24and 25)
Sexually Transmitted Diseases
Gonorrhea
In North Dakota, the number of reported cases of gonorrhea in teens ages 15 through19 more than doubled between 1994 and 2000. In addition, cases of gonorrhea inteens ages 15 through 19 increased from 24 percent of all state cases in 1994 to 32percent in 2000. In the same time period, the rate of gonorrhea per 100,000 NorthDakota teens increased from 18 to 43. (Chart 26)
Chart 26: Gonorrhea Cases and Rates, North Dakota Teens Ages 15 Through 19,1994 through 2000
1994 1995 1996 1997 1998 1999 2000
Cases age 15-19 9 9 13 26 25 30 23
All state cases 38 35 42 73 80 81 73
Percentage to teens 23.7% 25.7% 31.0% 35.6% 31.3% 37.0% 31.5%
Teen population 48,623 50,217 51,571 52,636 53,337 53,114 53,618
Rate per 100,000 17.9 17.9 25.2 49.4 53.6 56.2 42.9
Source: NDDoH, Sexually Transmitted Disease Program
Chart 24: LBW Births, by Age of Mother, 1994 through 2000
Age of Mother 1994 1995 1996 1997 1998 1999 2000
Younger than 20 6.4% 7.2% 7.4% 7.4% 7.6% 7.0% 7.9%
20 and older 5.3% 5.1% 5.6% 6.0% 6.5% 5.8% 6.4%
Source: NDDoH, Division of Vital Records
Chart 25: VLBW Births, by Age of Mother, 1994 through 2000
Age of Mother 1994 1995 1996 1997 1998 1999 2000
Younger than 20 1.4% 1.5% 1.8% 1.3% 1.5% 1.1% 2.0%
20 and older 1.0% 1.0% 0.8% 1.1% 1.3% 1.0% 1.1%
Source: NDDoH, Division of Vital Records
44
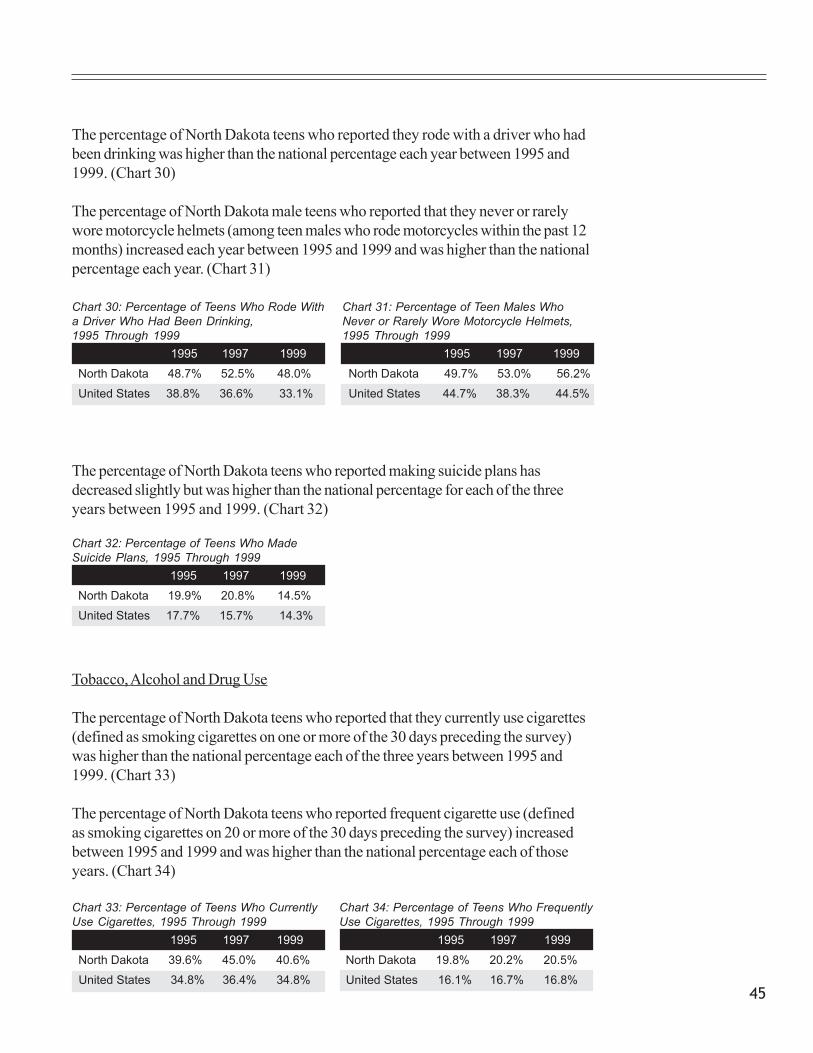
Chart 28: Percentage of Teens Who Never orRarely Used Safety Belts, 1999
Male Female All
North Dakota 43.9% 19.3% 31.9%
United States 20.8% 11.9% 16.4%
Chart 29: Percentage of Teens Who DroveAfter Drinking Alcohol, 1995 Through 1999
1995 1997 1999 1
North Dakota 32.5% 33.2% 31.4%
United States 15.4% 16.9% 13.1%
The Youth Risk Behavior Survey (YRBS) is a school-based survey of adolescent riskbehaviors conducted by the Centers for Disease Control and Prevention in the springof every odd-numbered year. The North Dakota Department of Public Instruction andthe North Dakota Department of Health conduct the North Dakota YRBS. Studentsare randomly selected and survey results are weighted to provide representative data.The risk behaviors surveyed often are established during and prior to adolescence,extend into adulthood and contribute to the leading causes of mortality and morbidityamong youth and adults.
Safety and Violence
In 1999, the percentage of North Dakota high school students (grades nine through12) who reported they never or rarely used safety belts was nearly double the nationalpercentage. Male teens in the state were more than twice as likely as females to reportnever or rarely using safety belts. (Chart 28)
Between 1995 and 1999, the percentage of North Dakota teens who reported theydrove after drinking alcohol declined slightly but remained more than twice the nationalpercentage. (Chart 29)
Youth Risk Behaviors
Chart 27: Chlamydia Cases and Rates, North Dakota Teens Ages 15 Through 19,1994 through 2000
1994 1995 1996 1997 1998 1999 2000
Cases age 15-19 339 254 298 276 349 307 329
All state cases 1,101 1,079 1,022 887 1,036 934 909
Percentage to teens 30.8% 23.5% 29.2% 31.1% 33.7% 32.9% 36.2%
Teen population 48,623 50,217 51,571 52,636 53,337 53,114 53,618
Rate per 100,000 697.2 505.8 577.8 524.4 747.8 575.4 613.6
Source: NDDoH, Sexually Transmitted Diseases Program
Chlamydia
The number and rate of chlamydia cases in teens ages 15 through 19 remained stablefrom 1994 through 2000; however, because there were fewer total cases in the state,the percentage of teen cases increased from 31 percent of all state cases in 1994 to 36percent in 2000. (Chart 27)
45
Chart 30: Percentage of Teens Who Rode Witha Driver Who Had Been Drinking,1995 Through 1999
1995 1997 1999
North Dakota 48.7% 52.5% 48.0%
United States 38.8% 36.6% 33.1%
The percentage of North Dakota teens who reported they rode with a driver who hadbeen drinking was higher than the national percentage each year between 1995 and1999. (Chart 30)
The percentage of North Dakota male teens who reported that they never or rarelywore motorcycle helmets (among teen males who rode motorcycles within the past 12months) increased each year between 1995 and 1999 and was higher than the nationalpercentage each year. (Chart 31)
The percentage of North Dakota teens who reported making suicide plans hasdecreased slightly but was higher than the national percentage for each of the threeyears between 1995 and 1999. (Chart 32)
Tobacco, Alcohol and Drug Use
The percentage of North Dakota teens who reported that they currently use cigarettes(defined as smoking cigarettes on one or more of the 30 days preceding the survey)was higher than the national percentage each of the three years between 1995 and1999. (Chart 33)
The percentage of North Dakota teens who reported frequent cigarette use (definedas smoking cigarettes on 20 or more of the 30 days preceding the survey) increasedbetween 1995 and 1999 and was higher than the national percentage each of thoseyears. (Chart 34)
Chart 31: Percentage of Teen Males WhoNever or Rarely Wore Motorcycle Helmets,1995 Through 1999
1995 1997 1999
North Dakota 49.7% 53.0% 56.2%
United States 44.7% 38.3% 44.5%
Chart 32: Percentage of Teens Who MadeSuicide Plans, 1995 Through 1999
1995 1997 1999
North Dakota 19.9% 20.8% 14.5%
United States 17.7% 15.7% 14.3%
Chart 33: Percentage of Teens Who CurrentlyUse Cigarettes, 1995 Through 1999
1995 1997 1999
North Dakota 39.6% 45.0% 40.6%
United States 34.8% 36.4% 34.8%
Chart 34: Percentage of Teens Who FrequentlyUse Cigarettes, 1995 Through 1999
1995 1997 1999
North Dakota 19.8% 20.2% 20.5%
United States 16.1% 16.7% 16.8%
46
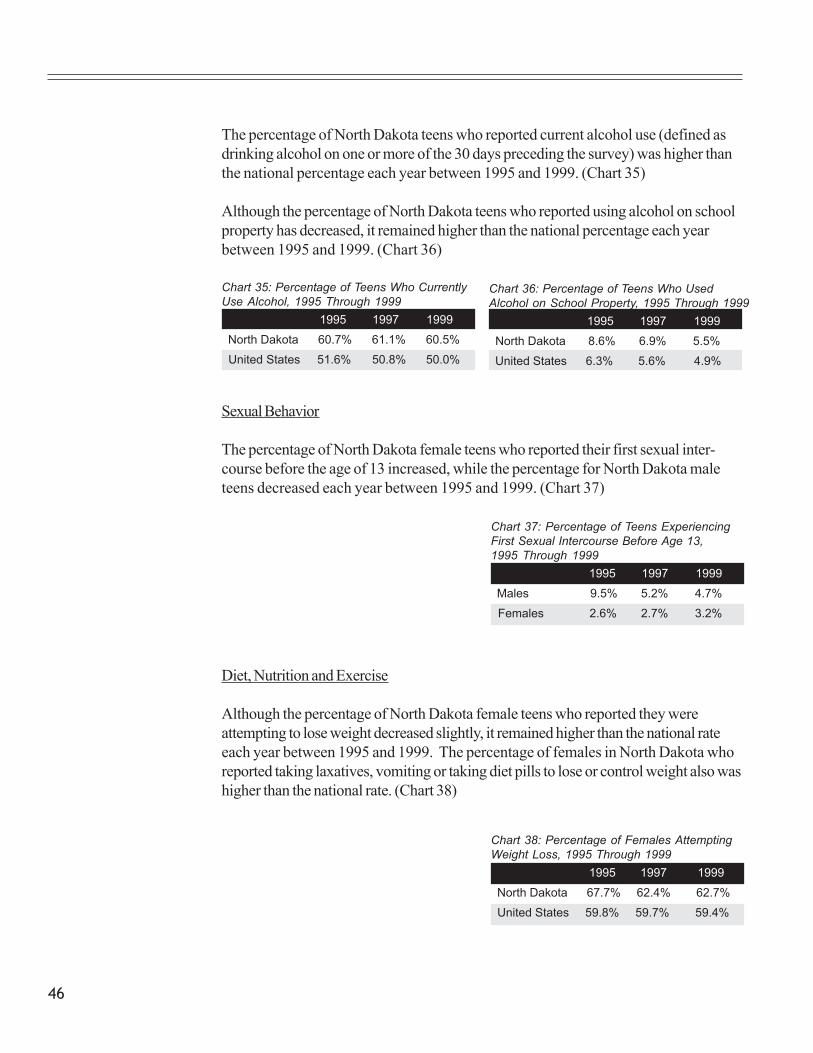
Chart 37: Percentage of Teens ExperiencingFirst Sexual Intercourse Before Age 13,1995 Through 1999
1995 1997 1999
Males 9.5% 5.2% 4.7%
Females 2.6% 2.7% 3.2%
Chart 35: Percentage of Teens Who CurrentlyUse Alcohol, 1995 Through 1999
1995 1997 1999
North Dakota 60.7% 61.1% 60.5%
United States 51.6% 50.8% 50.0%
The percentage of North Dakota teens who reported current alcohol use (defined asdrinking alcohol on one or more of the 30 days preceding the survey) was higher thanthe national percentage each year between 1995 and 1999. (Chart 35)
Although the percentage of North Dakota teens who reported using alcohol on schoolproperty has decreased, it remained higher than the national percentage each yearbetween 1995 and 1999. (Chart 36)
Sexual Behavior
The percentage of North Dakota female teens who reported their first sexual inter-course before the age of 13 increased, while the percentage for North Dakota maleteens decreased each year between 1995 and 1999. (Chart 37)
Chart 36: Percentage of Teens Who UsedAlcohol on School Property, 1995 Through 1999
1995 1997 1999
North Dakota 8.6% 6.9% 5.5%
United States 6.3% 5.6% 4.9%
Diet, Nutrition and Exercise
Although the percentage of North Dakota female teens who reported they wereattempting to lose weight decreased slightly, it remained higher than the national rateeach year between 1995 and 1999. The percentage of females in North Dakota whoreported taking laxatives, vomiting or taking diet pills to lose or control weight also washigher than the national rate. (Chart 38)
Chart 38: Percentage of Females AttemptingWeight Loss, 1995 Through 1999 1995 1997 1999
North Dakota 67.7% 62.4% 62.7%
United States 59.8% 59.7% 59.4%
47
Maternal Population
The maternal population is defined as women of childbearing age, from age 20through 44.
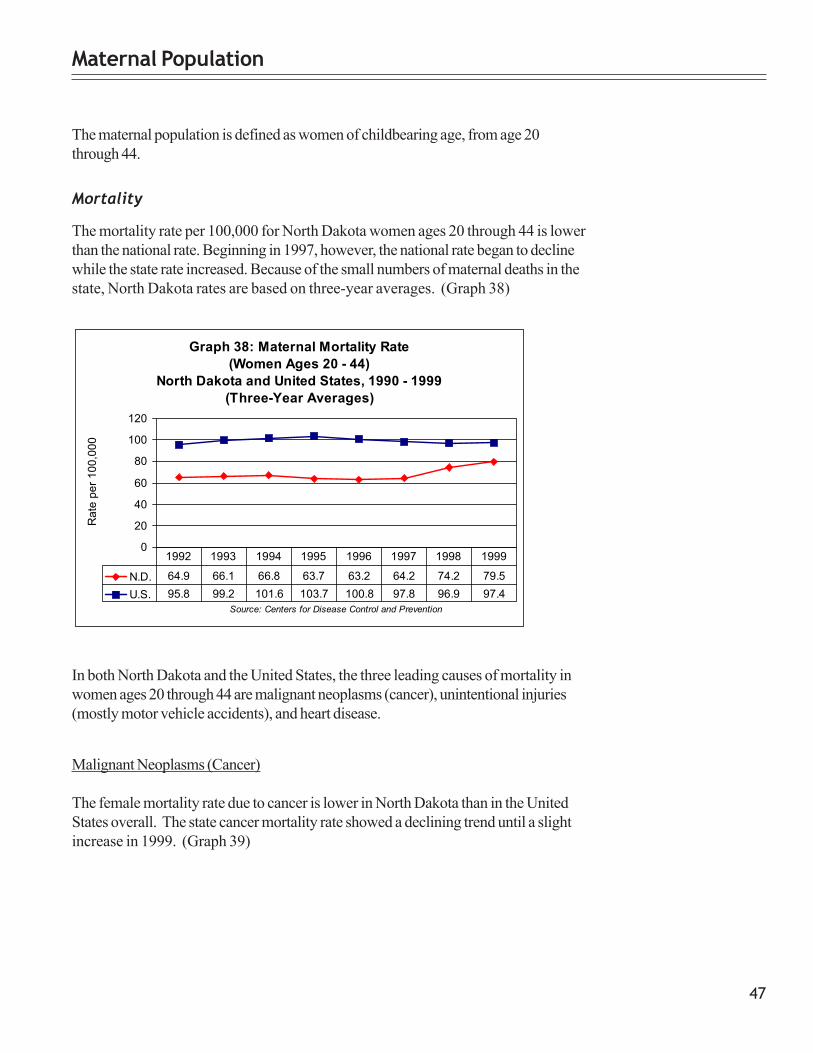
The mortality rate per 100,000 for North Dakota women ages 20 through 44 is lowerthan the national rate. Beginning in 1997, however, the national rate began to declinewhile the state rate increased. Because of the small numbers of maternal deaths in thestate, North Dakota rates are based on three-year averages. (Graph 38)
Mortality
In both North Dakota and the United States, the three leading causes of mortality inwomen ages 20 through 44 are malignant neoplasms (cancer), unintentional injuries(mostly motor vehicle accidents), and heart disease.
Malignant Neoplasms (Cancer)
The female mortality rate due to cancer is lower in North Dakota than in the UnitedStates overall. The state cancer mortality rate showed a declining trend until a slightincrease in 1999. (Graph 39)
Graph 38: Maternal Mortality Rate (Women Ages 20 - 44)
North Dakota and United States, 1990 - 1999(Three-Year Averages)
0
20
40
60
80
100
120
Source: Centers for Disease Control and Prevention
Rat
e pe
r 100
,000
N.D. 64.9 66.1 66.8 63.7 63.2 64.2 74.2 79.5U.S. 95.8 99.2 101.6 103.7 100.8 97.8 96.9 97.4
1992 1993 1994 1995 1996 1997 1998 1999

48
In 1997, according to the North Dakota Cancer Registry Annual Report, there were437 known cases of breast cancer in North Dakota and 117 deaths; in addition, therewere 22 known cases of cervical cancer and 10 deaths.
Unintentional Injuries
From 1992 through 1999, the North Dakota mortality rate due to unintentional injuriesin women ages 20 through 44 increased to a rate higher than the United States rate.(Graph 40)
Graph 39: Maternal Mortality - Malignant Neoplasms North Dakota and United States, 1992 - 1999
(Three-Year Averages)
0
5
10
15
20
25
30
Source: Centers for Disease Control and Prevention
Rat
e pe
r 100
,000
N.D. 23.3 23.5 22.2 22.3 19.5 17.6 19.9 20.8
U.S. 25.2 24.3 24.6 24.7 24.8 24.8 24.4 23.7
1992 1993 1994 1995 1996 1997 1998 1999
Graph 40: Maternal Mortality - Unintentional Injuries North Dakota and United States, 1992 - 1999
(Three-Year Averages)
0.0
5.0
10.0
15.0
20.0
25.0
Source: Centers for Disease Control and Prevention
Rat
e pe
r 100
,000
N.D. 12.0 12.3 14.4 13.6 15.4 13.8 19.0 19.9
U.S. 14.7 15.4 15.6 16.0 16.5 16.4 16.6 16.3
1992 1993 1994 1995 1996 1997 1998 1999
49
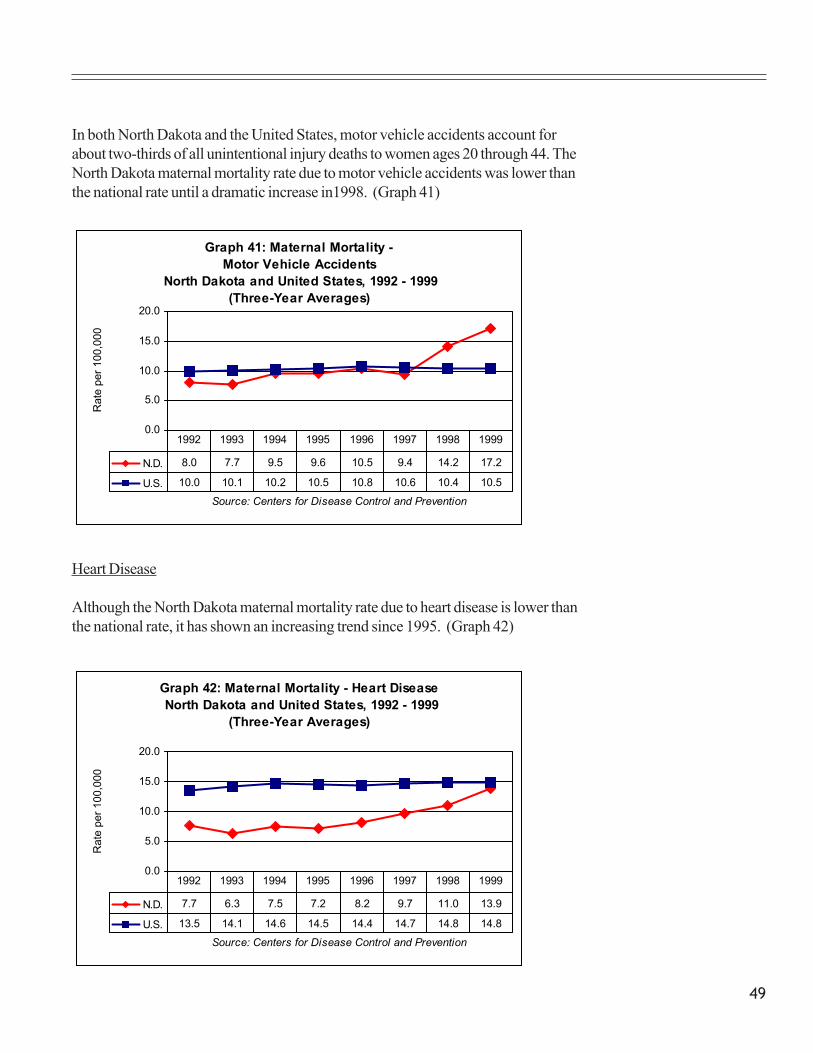
In both North Dakota and the United States, motor vehicle accidents account forabout two-thirds of all unintentional injury deaths to women ages 20 through 44. TheNorth Dakota maternal mortality rate due to motor vehicle accidents was lower thanthe national rate until a dramatic increase in1998. (Graph 41)
Heart Disease
Although the North Dakota maternal mortality rate due to heart disease is lower thanthe national rate, it has shown an increasing trend since 1995. (Graph 42)
Graph 41: Maternal Mortality - Motor Vehicle Accidents
North Dakota and United States, 1992 - 1999 (Three-Year Averages)
0.0
5.0
10.0
15.0
20.0
Source: Centers for Disease Control and Prevention
Rat
e pe
r 100
,000
N.D. 8.0 7.7 9.5 9.6 10.5 9.4 14.2 17.2
U.S. 10.0 10.1 10.2 10.5 10.8 10.6 10.4 10.5
1992 1993 1994 1995 1996 1997 1998 1999
Graph 42: Maternal Mortality - Heart Disease North Dakota and United States, 1992 - 1999
(Three-Year Averages)
0.0
5.0
10.0
15.0
20.0
Source: Centers for Disease Control and Prevention
Rat
e pe
r 100
,000
N.D. 7.7 6.3 7.5 7.2 8.2 9.7 11.0 13.9
U.S. 13.5 14.1 14.6 14.5 14.4 14.7 14.8 14.8
1992 1993 1994 1995 1996 1997 1998 1999

50
The fertility rate in North Dakota – the number of births per 1,000 women ages 15through 44 – not only is lower than in the United States overall, but also has beendeclining at a faster rate than the national rate. (Graph 43)
Fertility
Adequacy of Prenatal Care
The percentage of North Dakota mothers who received adequate prenatal care duringtheir pregnancies – defined as care that began in the first trimester and followed aprescribed number of visits by the gestational age (Kessner Index) – increasedbetween 1994 and 2000. (Graph 44)
Pregnancy and Birth
Graph 44: North Dakota Women Who Received Adequate Prenatal Care, 1994 - 2000
65.0%
66.5%67.1%
67.8%
68.9%69.6%
70.6%
64%
66%
68%
70%
72%
1994 1995 1996 1997 1998 1999 2000
Source: NDDoH, Division of Vital Records
Per
cent
age
Graph 43: Fertility Rate - Women Ages 15 - 44 North Dakota and United States, 1990 - 2000
0.0
10.0
20.0
30.0
40.0
50.0
60.0
70.0
80.0
Source: Centers for Disease Control and Prevention
Rat
e pe
r 1,0
00
N.D. 66.2 63.4 63.0 62.2 61.4 60.6 59.7 59.8 56.7 57.3 58.8U.S. 70.9 69.6 68.9 67.6 66.7 65.6 65.3 65.0 65.6 65.9 67.6
1990 1991 1992 1993 1994 1995 1996 1997 1998 1999 2000

51
Wedlock Status
In North Dakota, a decreasing percentage of births occur to married women. Althoughthe percentage of North Dakota out-of-wedlock births was lower than the nationalpercentage between 1990 and 2000, the number of women giving birth out of wedlockincreased. (Graph 45)
The number of out-of-wedlock pregnancies and out-of-wedlock pregnancy rates bycounty can be found in tables 40 and 41. The number of out-of-wedlock births andout-of-wedlock birth rates by county can be found in tables 42 and 43.
Plurality
Between 1994 and 2000, about 97 percent of all births to North Dakota women weresingle births and about 3 percent were multiple births.
Number of Pregnancies
Between 1994 and 2000, about one-third of North Dakota births were the mothers’first babies and about 30 percent their second. Women who had more than two priorbirths accounted for more than one-third of all births.
Graph 45: Percentage of Out-of-Wedlock Births North Dakota and United States, 1990 - 2000
0%
10%
20%
30%
40%
Source: National Center for Health Statistics
Per
cent
age
N.D. 18% 22% 23% 23% 23% 24% 25% 26% 27% 28% 28%
U.S. 28% 30% 30% 31% 33% 32% 32% 32% 33% 33% 33%
1990 1991 1992 1993 1994 1995 1996 1997 1998 1999 2000
Weight Gain
Between 1994 and 2000, less than 30 percent of births occurred to women whogained less than 25 pounds during pregnancy. More than one-third of women gainedbetween 25 and 34 pounds, and nearly 36 percent of women gained more than 35pounds during pregnancy. (Graph 46)

52
Graph 47: Percentage of Births to Women Who Used Tobacco During Pregnancy
North Dakota and United States, 1994 - 2000
0%
5%
10%
15%
20%
25%
Source: National Center for Health Statistics
Per
cent
age
N.D. 19.3% 17.7% 18.3% 19.9% 19.4% 19.1% 17.9%
U.S. 14.6% 13.9% 13.9% 13.2% 12.9% 12.6% 12.2%
1994 1995 1996 1997 1998 1999 2000
Graph 46: North Dakota Resident Births by Maternal Weight Gain, 1994 - 2000
9%
19%
34%36%
2%
0%
5%
10%
15%
20%
25%
30%
35%
40%
< 15 lbs. 15-24 lbs. 25-34 lbs. > 34 lbs. Unknown
Per
cent
age
Gestational Age
More than 90 percent of all births between 1994 and 2000 occurred at between 37and 42 weeks gestation. The percentage of births that occurred at less than 37 weeksincreased from 7.7 percent of all births in 1994 to 8.8 percent of births in 2000.
Tobacco and Alcohol Use
The percentage of North Dakota women who reported using tobacco during preg-nancy has declined since 1997 but has remained higher than the national percentage.(Graph 47) About 1 percent of women nationally and in North Dakota used alcoholduring their pregnancies.
53
Maternal Medical Risk Factors
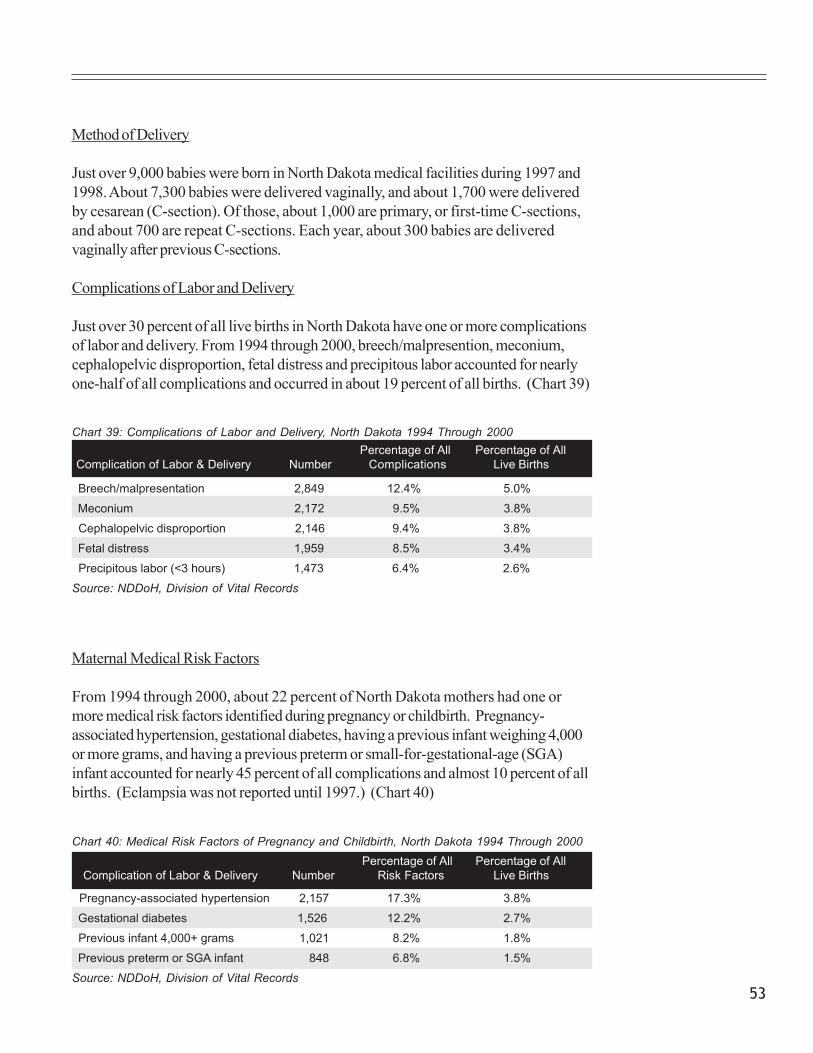
From 1994 through 2000, about 22 percent of North Dakota mothers had one ormore medical risk factors identified during pregnancy or childbirth. Pregnancy-associated hypertension, gestational diabetes, having a previous infant weighing 4,000or more grams, and having a previous preterm or small-for-gestational-age (SGA)infant accounted for nearly 45 percent of all complications and almost 10 percent of allbirths. (Eclampsia was not reported until 1997.) (Chart 40)
Breech/malpresentation 2,849 12.4% 5.0%
Meconium 2,172 9.5% 3.8%
Cephalopelvic disproportion 2,146 9.4% 3.8%
Fetal distress 1,959 8.5% 3.4%
Precipitous labor (<3 hours) 1,473 6.4% 2.6%
Source: NDDoH, Division of Vital Records
Chart 39: Complications of Labor and Delivery, North Dakota 1994 Through 2000 Percentage of All Percentage of All
Complication of Labor & Delivery Number Complications Live Births
Pregnancy-associated hypertension 2,157 17.3% 3.8%
Gestational diabetes 1,526 12.2% 2.7%
Previous infant 4,000+ grams 1,021 8.2% 1.8%
Previous preterm or SGA infant 848 6.8% 1.5%
Source: NDDoH, Division of Vital Records
Chart 40: Medical Risk Factors of Pregnancy and Childbirth, North Dakota 1994 Through 2000 Percentage of All Percentage of All Complication of Labor & Delivery Number Risk Factors Live Births
Method of Delivery
Just over 9,000 babies were born in North Dakota medical facilities during 1997 and1998. About 7,300 babies were delivered vaginally, and about 1,700 were deliveredby cesarean (C-section). Of those, about 1,000 are primary, or first-time C-sections,and about 700 are repeat C-sections. Each year, about 300 babies are deliveredvaginally after previous C-sections.
Complications of Labor and Delivery
Just over 30 percent of all live births in North Dakota have one or more complicationsof labor and delivery. From 1994 through 2000, breech/malpresention, meconium,cephalopelvic disproportion, fetal distress and precipitous labor accounted for nearlyone-half of all complications and occurred in about 19 percent of all births. (Chart 39)
54
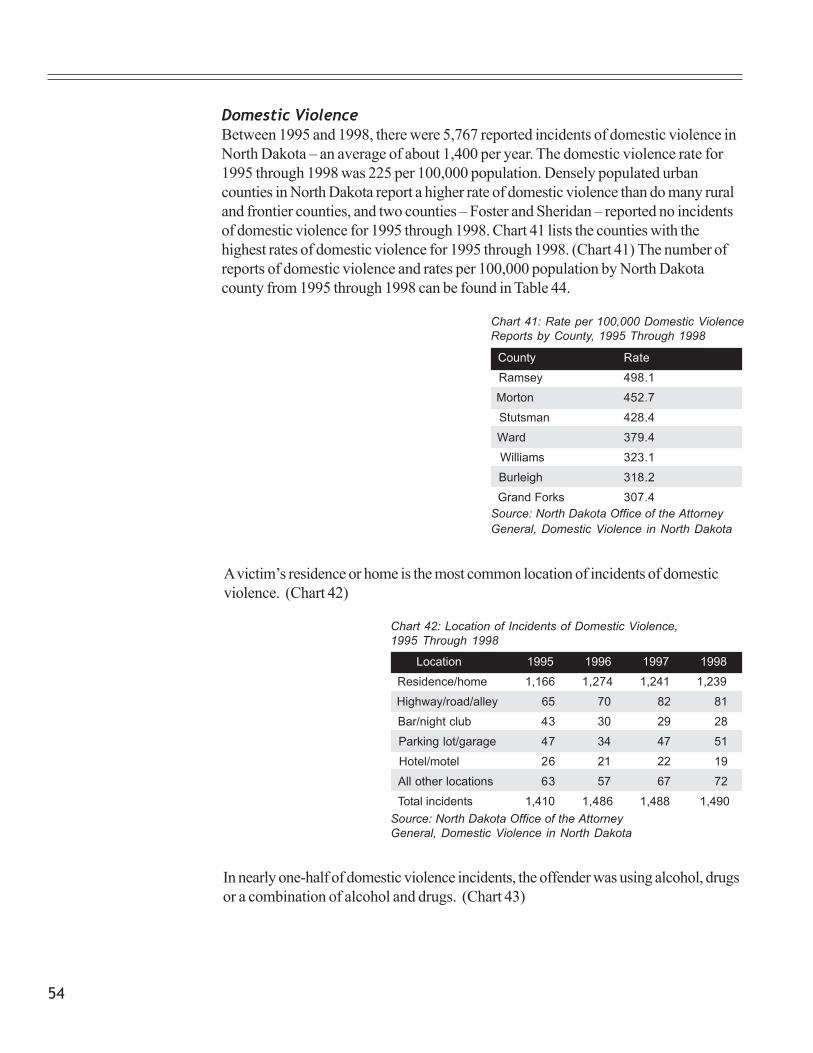
A victim’s residence or home is the most common location of incidents of domesticviolence. (Chart 42)
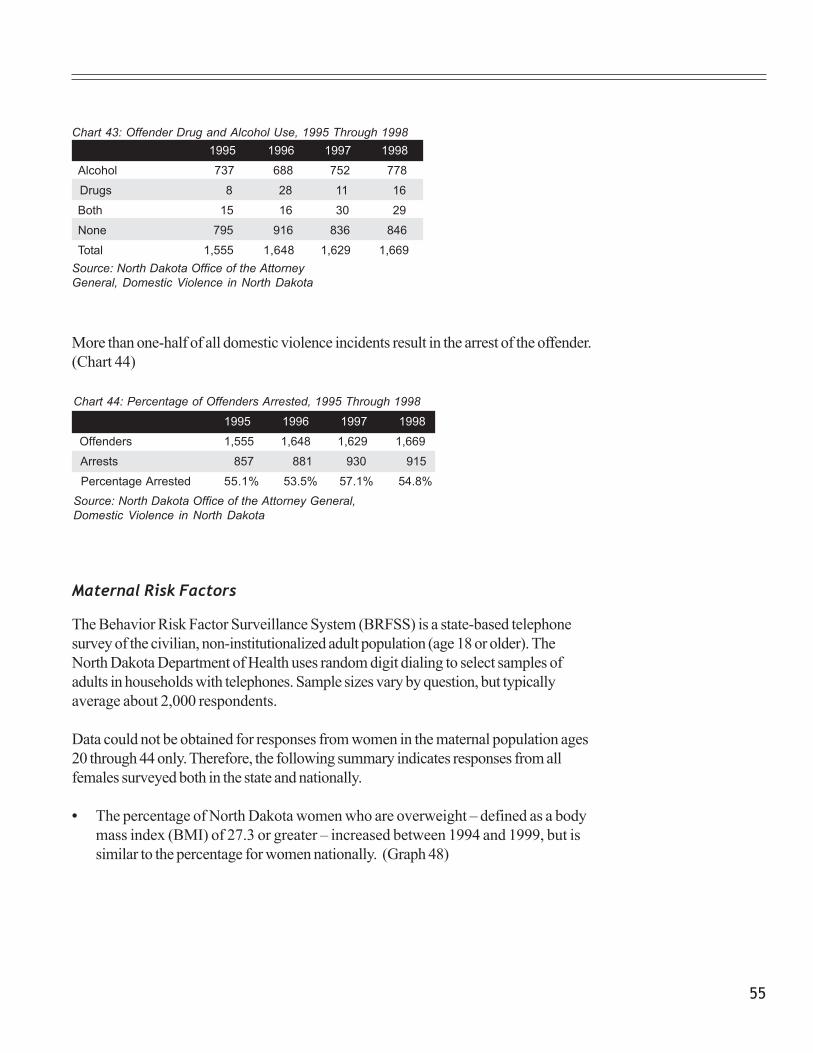
In nearly one-half of domestic violence incidents, the offender was using alcohol, drugsor a combination of alcohol and drugs. (Chart 43)
Between 1995 and 1998, there were 5,767 reported incidents of domestic violence inNorth Dakota – an average of about 1,400 per year. The domestic violence rate for1995 through 1998 was 225 per 100,000 population. Densely populated urbancounties in North Dakota report a higher rate of domestic violence than do many ruraland frontier counties, and two counties – Foster and Sheridan – reported no incidentsof domestic violence for 1995 through 1998. Chart 41 lists the counties with thehighest rates of domestic violence for 1995 through 1998. (Chart 41) The number ofreports of domestic violence and rates per 100,000 population by North Dakotacounty from 1995 through 1998 can be found in Table 44.
Domestic Violence
County Rate
Ramsey 498.1
Morton 452.7
Stutsman 428.4
Ward 379.4
Williams 323.1
Burleigh 318.2
Grand Forks 307.4Source: North Dakota Office of the AttorneyGeneral, Domestic Violence in North Dakota
Chart 41: Rate per 100,000 Domestic ViolenceReports by County, 1995 Through 1998
Location 1995 1996 1997 1998
Residence/home 1,166 1,274 1,241 1,239
Highway/road/alley 65 70 82 81
Bar/night club 43 30 29 28
Parking lot/garage 47 34 47 51
Hotel/motel 26 21 22 19
All other locations 63 57 67 72
Total incidents 1,410 1,486 1,488 1,490
Chart 42: Location of Incidents of Domestic Violence,1995 Through 1998
Source: North Dakota Office of the AttorneyGeneral, Domestic Violence in North Dakota
55
More than one-half of all domestic violence incidents result in the arrest of the offender.(Chart 44)
The Behavior Risk Factor Surveillance System (BRFSS) is a state-based telephonesurvey of the civilian, non-institutionalized adult population (age 18 or older). TheNorth Dakota Department of Health uses random digit dialing to select samples ofadults in households with telephones. Sample sizes vary by question, but typicallyaverage about 2,000 respondents.
Data could not be obtained for responses from women in the maternal population ages20 through 44 only. Therefore, the following summary indicates responses from allfemales surveyed both in the state and nationally.
• The percentage of North Dakota women who are overweight – defined as a bodymass index (BMI) of 27.3 or greater – increased between 1994 and 1999, but issimilar to the percentage for women nationally. (Graph 48)
Maternal Risk Factors
Chart 44: Percentage of Offenders Arrested, 1995 Through 1998
1995 1996 1997 1998
Offenders 1,555 1,648 1,629 1,669
Arrests 857 881 930 915
Percentage Arrested 55.1% 53.5% 57.1% 54.8%Source: North Dakota Office of the Attorney General,Domestic Violence in North Dakota
Chart 43: Offender Drug and Alcohol Use, 1995 Through 1998 1995 1996 1997 1998
Alcohol 737 688 752 778
Drugs 8 28 11 16
Both 15 16 30 29
None 795 916 836 846
Total 1,555 1,648 1,629 1,669Source: North Dakota Office of the AttorneyGeneral, Domestic Violence in North Dakota

56
• Between 1995 and 1999, the percentage of North Dakota women who reportedthey were binge drinkers – defined as consuming five or more drinks on occasionone or more times in the previous month – was higher than the national percentage.(Chart 46)
• In 1995 and 1997, the percentage of North Dakota women who reported theyalways wore safety belts when they rode in or drove a car was substantially lowerthan the percentage for all women in the United States. (Chart 47)
1995 1997 1999
North Dakota 7.5% 10.6% 9.9%
United States 6.9% 6.7% 7.4%
Chart 46: Binge Drinking,North Dakota and United States,1995 Through 1999
1995 1997
North Dakota 49.6% 50.9%
United States 73.5% 74.8%
Chart 47: Safety Belt Use,North Dakota and United States,1995 Through 1997
Graph 48: Percentage of Women Who Are Overweight (BMI>=27.3)
North Dakota and United States, 1994 - 1999
0%
10%
20%
30%
40%
Source: Behavior Risk Factor Surveillance System
Per
cent
age
N.D. 23.2% 28.1% 31.6% 30.9% 30.8% 33.2%
U.S. 25.1% 24.6% 28.7% 29.4% 31.4% 33.3%
1994 1995 1996 1997 1998 1999
• The percentage of North Dakota women who reported they participated in regularand sustained physical activity decreased between 1996 and 2000 and is nowlower than the national percentage. (Chart 45)
Chart 45: Participation in Physical Activity,North Dakota and United States, 1996 Through 2000 1996 1998 2000 Physical Activity N.D. U.S. N.D. U.S. N.D. U.S.
Regular and sustained 17.6% 20.4% 17.2% 19.5% 13.6% 21.2%
Vigorous 13.3% 15.2% 11.5% 13.6% 15.6% 14.8%
57
1995 1997 1999
North Dakota 21.7% 31.6% 33.1%
United States 20.4% 28.8% 29.8%
Chart 48: Told Had High Blood Cholesterol,North Dakota and United States,1995 Through 1999
• The percentage of North Dakota women who ever had their blood cholesteroltested or who had their blood cholesterol tested within the previous five years islower than the national percentage. The percentage of North Dakota women whoreported they were ever told by a health professional that they had high bloodcholesterol increased between 1995 and 1999 and was higher than the nationalpercentage. (Chart 48)
• The percentage of North Dakota women who reported they had been told by ahealth professional that their blood pressure was too high increased and was higherthan the percentage for all women in the United States from 1995 to 1999.(Chart 49)
1995 1997 1999
North Dakota 22.3% 25.4% 26.7%
United States 22.7% 23.6% 24.7%
Chart 49: Told Blood Pressure Too High,North Dakota and United States,1995 Through 1999

58

59
Health Care System

60
Health Care System
Capacity
Access to health care for the maternal and child health population is influenced by anumber of factors, including how health care is financed and the number and locationof health care facilities and providers. From 1994 through 1999, the number of hospi-tals and hospitals beds in the state decreased, but the number of practicing health careprofessionals increased. (Chart 50)
Although the number of hospitals with pediatric beds decreased from 1994 to 1998,the number of pediatricians and pediatric specialists practicing in the state increased,while the number of pediatric dentists remained at four. (Chart 51)
Pediatric Providers
Locations of Providers
For many women, infants and children, the distance to health care facilities is a barrierto accessing needed care. About one-half of the population of North Dakota isconcentrated in Burleigh, Cass, Grand Forks and Ward counties, and a majority ofhealth care providers live or practice there. (Chart 52)
Chart 50: Change in Number of Health Care Facilities, Providers and Associated Professionals
Health Care Facilities 1994 - 1995 1998 - 1999 Change
General hospitals 50 46 – 4
Hospital beds 4,052 3,192 – 860
Health Care Providers
Family practice physicians 329 352 + 33
Dentists 287 288 + 1
Psychiatrists 81 82 + 1
Obstetricians 51 58 + 7
OB/GYNs 59 51 – 8
Associated Health Professionals
Registered nurses 6,159 8,296 + 2,137
Licensed practical nurses 2,561 3,162 + 601
Advance practice nurses 124 399 + 275
Audiologists 32 42 + 10
Speech therapists 231 279 + 48
Chart 51: Pediatric Health Care Facilities and Providers
Health Care Facilities 1994 -1995 1998 - 1999 Change
Hospitals with pediatric beds 29 20 – 9
Health Care Providers
Pediatricians 68 82 + 14
Pediatric specialists 39 48 + 9
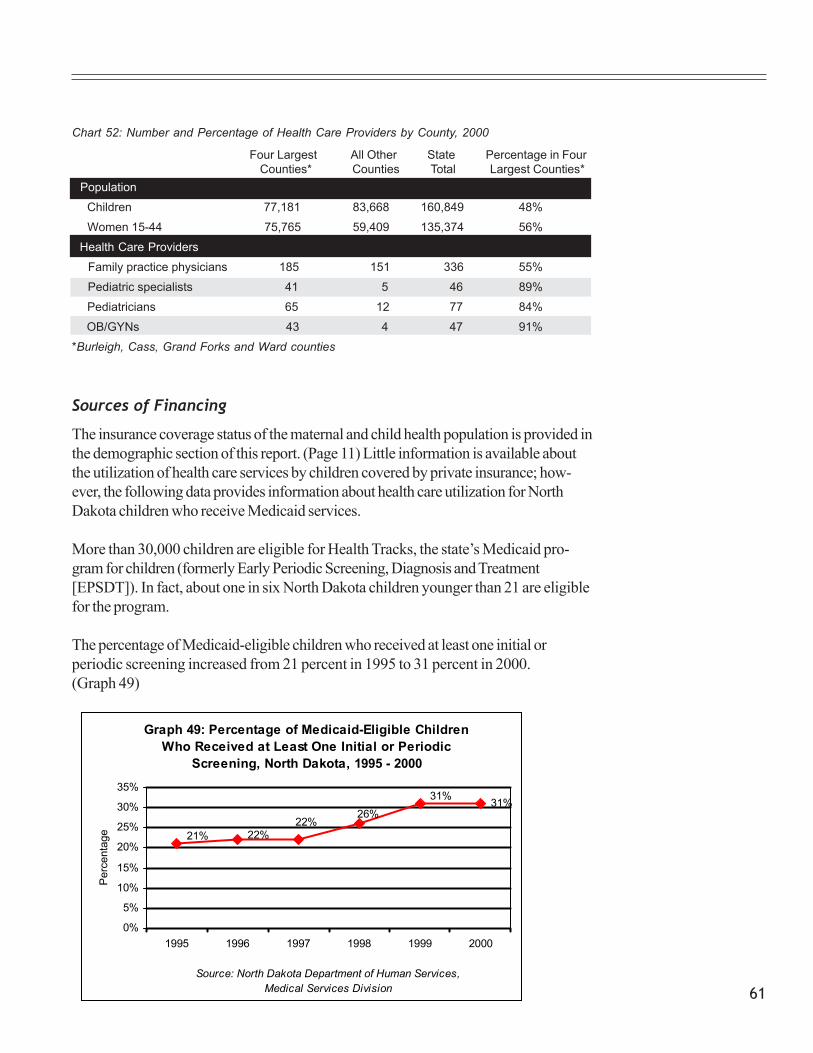
61
The insurance coverage status of the maternal and child health population is provided inthe demographic section of this report. (Page 11) Little information is available aboutthe utilization of health care services by children covered by private insurance; how-ever, the following data provides information about health care utilization for NorthDakota children who receive Medicaid services.
More than 30,000 children are eligible for Health Tracks, the state’s Medicaid pro-gram for children (formerly Early Periodic Screening, Diagnosis and Treatment[EPSDT]). In fact, about one in six North Dakota children younger than 21 are eligiblefor the program.
The percentage of Medicaid-eligible children who received at least one initial orperiodic screening increased from 21 percent in 1995 to 31 percent in 2000.(Graph 49)
Sources of Financing
Four Largest All Other State Percentage in Four Counties* Counties Total Largest Counties*
Population
Children 77,181 83,668 160,849 48%
Women 15-44 75,765 59,409 135,374 56%
Health Care Providers
Family practice physicians 185 151 336 55%
Pediatric specialists 41 5 46 89%
Pediatricians 65 12 77 84%
OB/GYNs 43 4 47 91%
*Burleigh, Cass, Grand Forks and Ward counties
Chart 52: Number and Percentage of Health Care Providers by County, 2000
Graph 49: Percentage of Medicaid-Eligible Children Who Received at Least One Initial or Periodic
Screening, North Dakota, 1995 - 2000
31%31%26%
22%22%21%
0%
5%
10%
15%
20%
25%
30%
35%
1995 1996 1997 1998 1999 2000
Source: North Dakota Department of Human Services, Medical Services Division
Per
cent
age

62
Between 1995 and 2000, 60 percent of Medicaid-eligible infants received a screening;however, the percentage of children who receive a screening decreases sharply aschildren get older. In fact, between 1995 and 2000, only 21 percent of children olderthan 15 received a screening. (Graph 50)
Graph 50: Percentage of Medicaid-Eligible Children Who Received Initial or Periodic Screening, by Age
North Dakota, 1995 - 2000
60%
36%
26%21%
0%
10%
20%
30%
40%
50%
60%
70%
Age < 1 Age 1-5 Age 6-14 Age 15-20
Source: NDDHS, Medical Services Division
Per
cent
age

63
Racial Health Disparities

64
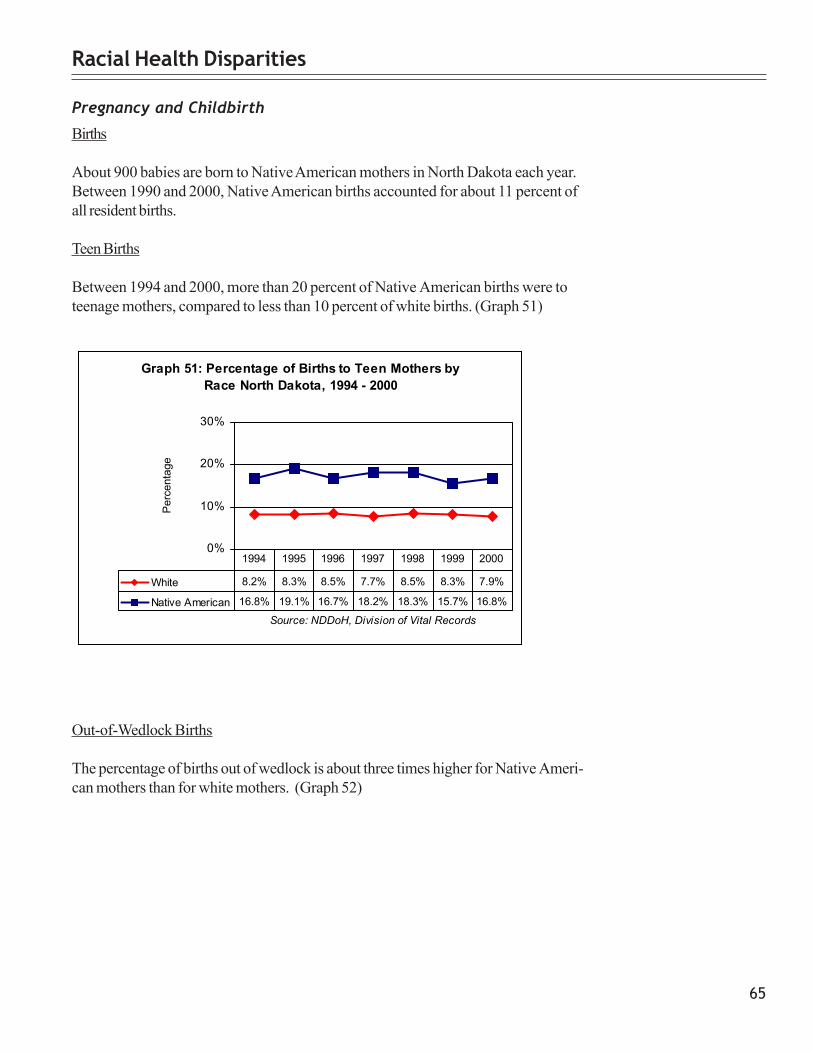
65
Racial Health Disparities
Pregnancy and Childbirth
Births
About 900 babies are born to Native American mothers in North Dakota each year.Between 1990 and 2000, Native American births accounted for about 11 percent ofall resident births.
Teen Births
Between 1994 and 2000, more than 20 percent of Native American births were toteenage mothers, compared to less than 10 percent of white births. (Graph 51)
Out-of-Wedlock Births
The percentage of births out of wedlock is about three times higher for Native Ameri-can mothers than for white mothers. (Graph 52)
Graph 51: Percentage of Births to Teen Mothers by Race North Dakota, 1994 - 2000
0%
10%
20%
30%
Source: NDDoH, Division of Vital Records
Per
cent
age
White 8.2% 8.3% 8.5% 7.7% 8.5% 8.3% 7.9%
Native American 16.8% 19.1% 16.7% 18.2% 18.3% 15.7% 16.8%
1994 1995 1996 1997 1998 1999 2000

66
Infant’s Race LBW VLBW
Native American 7.3% 1.5%
White 5.7% 1.0%
Source: NDDoH, Division of Vital Records
Chart 53: Percentage of North Dakota InfantsBorn LBW and VLBW, by Race,1994 Through 2000
Mother’s Race Tobacco Alcohol
Native American 39.7% 4.6%
White 16.5% 1.0%
Source: NDDoH, Division of Vital Records
Chart 54: Percentage of North Dakota WomenWho Use Tobacco & Alcohol, By Race,1994 Through 2000
Birth Weight
Between 1994 and 2000, Native American infants in North Dakota were slightly morelikely to be born low birth weight (LBW) and very low birth weight (VLBW) thanwere white infants. (Chart 53)
Tobacco and Alcohol Use
Between 1994 and 2000, Native American mothers in North Dakota were more thanthree times as likely to use tobacco during pregnancy and more than four times aslikely to use alcohol than were white mothers. (Chart 54)
Graph 52: Out-of-Wedlock Births by RaceNorth Dakota, 1994 - 2000
0%
20%
40%
60%
80%
Source: NDDoH, Division of Vital Records
Per
cent
age
Native American 64.2% 63.9% 66.2% 67.4% 67.7% 66.1% 69.2%
White 18.5% 19.2% 20.4% 20.9% 22.0% 22.6% 23.1%
1994 1995 1996 1997 1998 1999 2000

67
Prenatal Care
Between 1994 and 2000, the percentage of Native American mothers who receivedfirst trimester prenatal care increased from 46 percent to 64 percent; however, the rateis still substantially lower than the rate for white mothers. (Graph 53)
Breastfeeding Rates
The most reliable source of breastfeeding rates is from data collected through theSpecial Supplemental Nutrition Program for Women, Infant and Children (WIC).Between 1993 and 2000, the percentage of Native American mothers who breastfedtheir infants both at the initial newborn screening and at six months after birth hasincreased, but is still lower than the rate for white mothers. (Graph 54)
Child Health Status
Graph 53: Percentage First Trimester Prenatal Care by Race, North Dakota, 1994 - 2000
0%
20%
40%
60%
80%
100%
Source: NDDoH, Division of Vital Records
Per
cent
age
White 84.5% 85.1% 86.1% 86.4% 86.9% 88.4% 89.6%
Native American 71.0% 73.0% 75.1% 72.6% 74.4% 74.0% 67.3%
1994 1995 1996 1997 1998 1999 2000
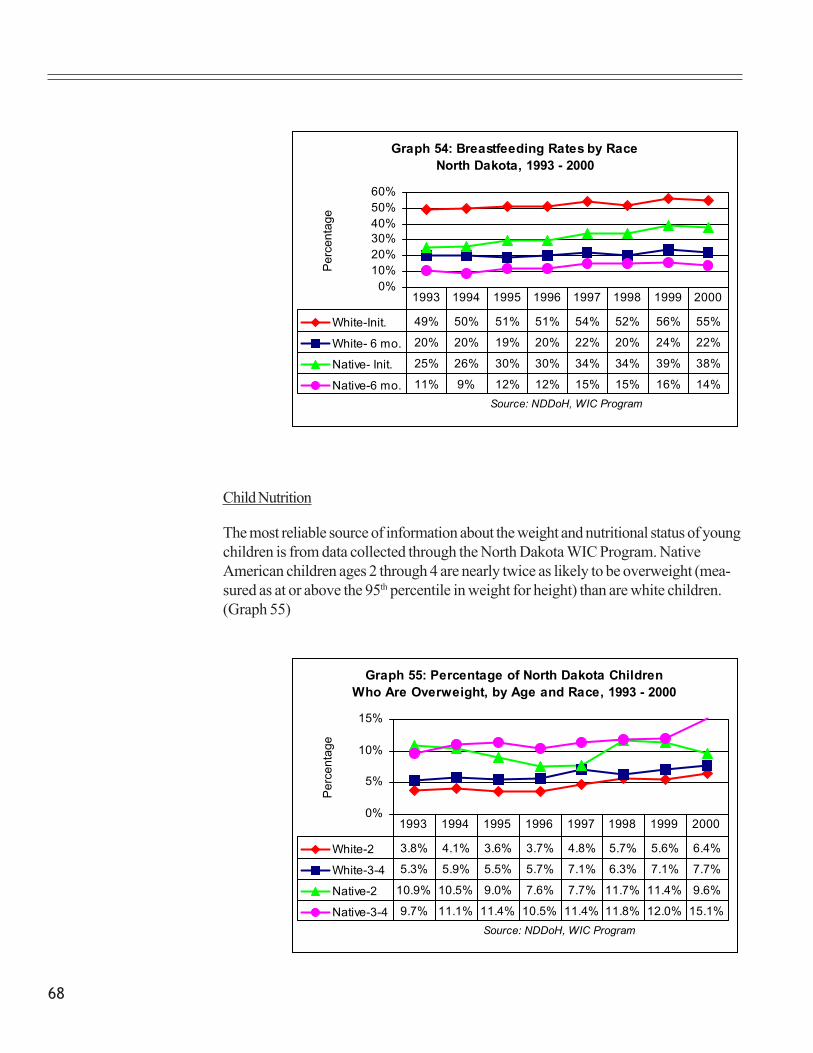
68
Child Nutrition
The most reliable source of information about the weight and nutritional status of youngchildren is from data collected through the North Dakota WIC Program. NativeAmerican children ages 2 through 4 are nearly twice as likely to be overweight (mea-sured as at or above the 95th percentile in weight for height) than are white children.(Graph 55)
Graph 54: Breastfeeding Rates by RaceNorth Dakota, 1993 - 2000
0%10%20%30%40%50%60%
Source: NDDoH, WIC Program
Per
cent
age
White-Init. 49% 50% 51% 51% 54% 52% 56% 55%
White- 6 mo. 20% 20% 19% 20% 22% 20% 24% 22%
Native- Init. 25% 26% 30% 30% 34% 34% 39% 38%
Native-6 mo. 11% 9% 12% 12% 15% 15% 16% 14%
1993 1994 1995 1996 1997 1998 1999 2000
Graph 55: Percentage of North Dakota Children Who Are Overweight, by Age and Race, 1993 - 2000
0%
5%
10%
15%
Source: NDDoH, WIC Program
Per
cent
age
White-2 3.8% 4.1% 3.6% 3.7% 4.8% 5.7% 5.6% 6.4%
White-3-4 5.3% 5.9% 5.5% 5.7% 7.1% 6.3% 7.1% 7.7%
Native-2 10.9% 10.5% 9.0% 7.6% 7.7% 11.7% 11.4% 9.6%
Native-3-4 9.7% 11.1% 11.4% 10.5% 11.4% 11.8% 12.0% 15.1%
1993 1994 1995 1996 1997 1998 1999 2000

69
Infant Mortality
Between 1992 and 1998, the infant mortality rate for Native American infants in NorthDakota was 7.8 per 1,000 births, compared to 5.0 for white infants. The infantmortality rate for sudden infant death syndrome (SIDS) was hearly three times higherfor Native American infants than for white infants. However, the mortality rate due tobirth defects was the same for both races, and infant mortality due to small gestationalage (SGA) or prematurity was slightly lower for Native American infants than for whiteinfants. (Graph 56)
Graph 56: Infant Mortality by Cause and RaceNorth Dakota, 1990 - 1998
0
2
4
6
8
10
Source: NDDoH, Division of Vital Records
Rat
e pe
r 1,0
00 b
irths
White 5.9 1.1 2.2 0.7
Native American 7.8 2.9 2.2 0.5
All Causes SIDS B. Defects SGA
Child Mortality
Between 1990 and 1998, mortality rate for Native American children age 1 through 9was 51.3 per 100,000, compared to 35.5 for white children. In addition, the mortalityrate due to unintentional injuries was more than four times higher for Native Americanchildren than for white. (Graph 57)

70
Graph 57: Child Mortality (Age 1-9) by Cause and Race, North Dakota, 1990 - 1998
0
10
20
30
40
50
60
Source: Centers for Disease Control and Prevention
Rat
e pe
r 100
,000
White 35.5 8.7 2.2
Native American 51.3 30.8 5.1
All Causes Unintentional Motor Vehicle
Adolescent Mortality
Between 1990 and 1998, the mortality rate for Native American adolescents age 10through 19 for all causes, for unintentional injuries including motor vehicle accidents,and for suicide was two to three times higher than the rate for white adolescents inNorth Dakota. (Graph 58)
Graph 58: Adolescent Mortality (Age 10-19) by Cause and Race, North Dakota, 1990 - 1998
0
20
40
60
80
100
120
Source: Centers for Disease Control and Prevention
Rat
e pe
r 100
,000
White 39.8 21.1 14.6 9.6
Native American 99.9 58.9 41.0 32.1
All Causes Injuries Motor Vehicle Suicide

71
Maternal Mortality
The mortality rate for Native American females age 15 through 44 is more than threetimes higher than the rate for white females. The rate due to injuries, including motorvehicle accidents, is several times higher for Native American females than for white;however, the mortality rate due to cancer is nearly the same for both Native Americanand white females. (Graph 59)
Graph 59: Maternal Mortality (Females Age 15-44) by Cause and Race, North Dakota 1990 - 1998
0
50
100
150
200
Source: Centers for Disease Control and Prevention
Rat
e pe
r 100
,000
White 48.5 17.8 12.4 9.6 4.8
Native American 146.3 18.3 71.7 109.7 9.8
All Causes Cancer All Injuries Motor Vehicles
Heart Disease

72
73
Methods and Explanation

74
75
Methods and Explanation
All rates expressed are per 1,000 population unless noted otherwise. Populationnumbers for each of the MCH population groups are annual estimates obtained fromthe U.S. Census Bureau.
Rates and Populations
Because of the low number of many birth and death events in North Dakota, three-year averaging was used for many of the rates presented. The reporting year includedthe selected calendar year plus the two previous years. For example, rates reportedfor 1998 included data from 1996, 1997 and 1998.
Birth and Death Statistics
Three-Year Averaging
Whenever possible, birth and death statistics were obtained from the North DakotaDepartment of Health, Division of Vital Records. Some state and all national birth anddeath data were collected primarily from the two data sources in the Centers forDisease Control and Prevention: CDC Wonder, and the National Center for HealthStatistics. On some occasions, state data from Vital Records and the CDC differedslightly. These differences were most often caused by differences in organizationaltimelines (i.e., an event occurred in North Dakota in 1997 and was recorded by VitalRecords as occurring that year; the same event may not have been reported to CDCbefore their deadline and, therefore, was recorded as a 1998 event).

76

77
Tables

78
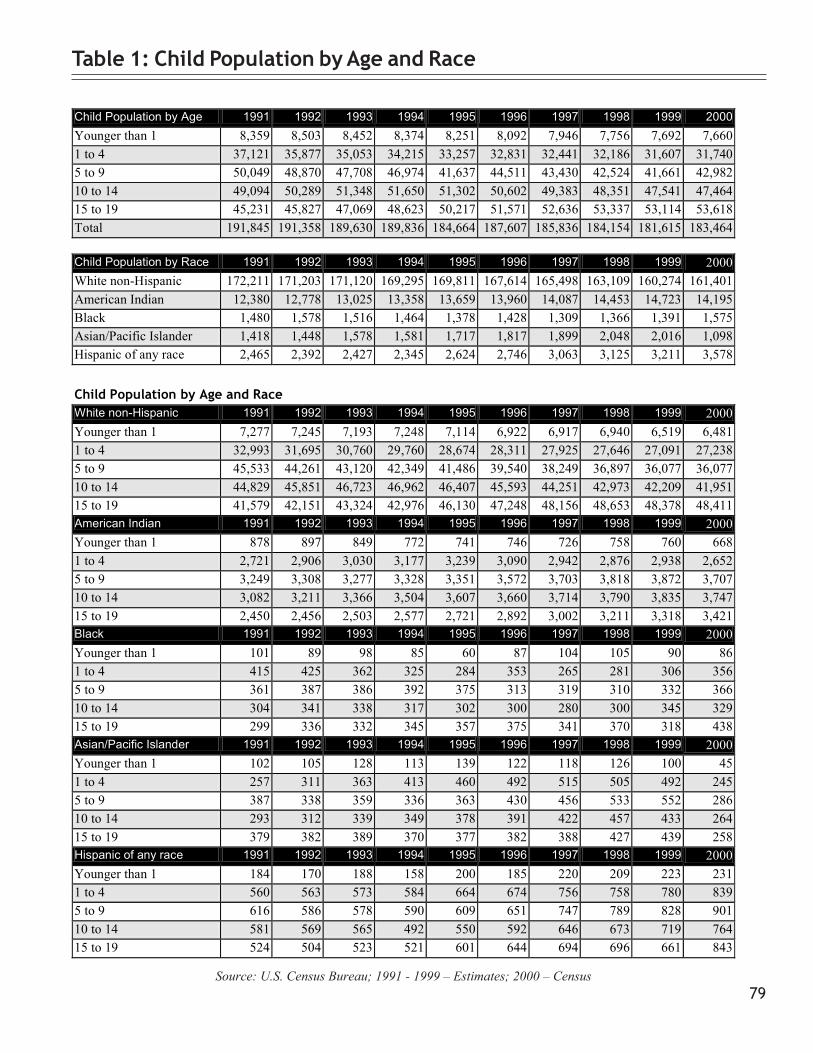
79
Child Population by Age and Race White non-Hispanic 1991 1992 1993 1994 1995 1996 1997 1998 1999 2000 Younger than 1 7,277 7,245 7,193 7,248 7,114 6,922 6,917 6,940 6,519 6,481 1 to 4 32,993 31,695 30,760 29,760 28,674 28,311 27,925 27,646 27,091 27,238 5 to 9 45,533 44,261 43,120 42,349 41,486 39,540 38,249 36,897 36,077 36,077 10 to 14 44,829 45,851 46,723 46,962 46,407 45,593 44,251 42,973 42,209 41,951 15 to 19 41,579 42,151 43,324 42,976 46,130 47,248 48,156 48,653 48,378 48,411 American Indian 1991 1992 1993 1994 1995 1996 1997 1998 1999 2000 Younger than 1 878 897 849 772 741 746 726 758 760 668 1 to 4 2,721 2,906 3,030 3,177 3,239 3,090 2,942 2,876 2,938 2,652 5 to 9 3,249 3,308 3,277 3,328 3,351 3,572 3,703 3,818 3,872 3,707 10 to 14 3,082 3,211 3,366 3,504 3,607 3,660 3,714 3,790 3,835 3,747 15 to 19 2,450 2,456 2,503 2,577 2,721 2,892 3,002 3,211 3,318 3,421 Black 1991 1992 1993 1994 1995 1996 1997 1998 1999 2000 Younger than 1 101 89 98 85 60 87 104 105 90 86 1 to 4 415 425 362 325 284 353 265 281 306 356 5 to 9 361 387 386 392 375 313 319 310 332 366 10 to 14 304 341 338 317 302 300 280 300 345 329 15 to 19 299 336 332 345 357 375 341 370 318 438 Asian/Pacific Islander 1991 1992 1993 1994 1995 1996 1997 1998 1999 2000 Younger than 1 102 105 128 113 139 122 118 126 100 45 1 to 4 257 311 363 413 460 492 515 505 492 245 5 to 9 387 338 359 336 363 430 456 533 552 286 10 to 14 293 312 339 349 378 391 422 457 433 264 15 to 19 379 382 389 370 377 382 388 427 439 258 Hispanic of any race 1991 1992 1993 1994 1995 1996 1997 1998 1999 2000 Younger than 1 184 170 188 158 200 185 220 209 223 231 1 to 4 560 563 573 584 664 674 756 758 780 839 5 to 9 616 586 578 590 609 651 747 789 828 901 10 to 14 581 569 565 492 550 592 646 673 719 764 15 to 19 524 504 523 521 601 644 694 696 661 843
Table 1: Child Population by Age and Race
Source: U.S. Census Bureau; 1991 - 1999 – Estimates; 2000 – Census
Child Population by Age 1991 1992 1993 1994 1995 1996 1997 1998 1999 2000 Younger than 1 8,359 8,503 8,452 8,374 8,251 8,092 7,946 7,756 7,692 7,660 1 to 4 37,121 35,877 35,053 34,215 33,257 32,831 32,441 32,186 31,607 31,740 5 to 9 50,049 48,870 47,708 46,974 41,637 44,511 43,430 42,524 41,661 42,982 10 to 14 49,094 50,289 51,348 51,650 51,302 50,602 49,383 48,351 47,541 47,464 15 to 19 45,231 45,827 47,069 48,623 50,217 51,571 52,636 53,337 53,114 53,618 Total 191,845 191,358 189,630 189,836 184,664 187,607 185,836 184,154 181,615 183,464 Child Population by Race 1991 1992 1993 1994 1995 1996 1997 1998 1999 2000 White non-Hispanic 172,211 171,203 171,120 169,295 169,811 167,614 165,498 163,109 160,274 161,401 American Indian 12,380 12,778 13,025 13,358 13,659 13,960 14,087 14,453 14,723 14,195 Black 1,480 1,578 1,516 1,464 1,378 1,428 1,309 1,366 1,391 1,575 Asian/Pacific Islander 1,418 1,448 1,578 1,581 1,717 1,817 1,899 2,048 2,016 1,098 Hispanic of any race 2,465 2,392 2,427 2,345 2,624 2,746 3,063 3,125 3,211 3,578

80
Maternal Population by Age and Race White non-Hispanic 1991 1992 1993 1994 1995 1996 1997 1998 1999 2000 20 to 24 21,112 20,932 20,761 20,349 20,004 19,566 19,723 19,984 20,190 21,419 25 to 29 21,137 20,181 19,461 19,268 19,289 19,417 19,013 18,401 17,407 16,717 30 to 34 24,343 23,664 22,939 22,023 20,984 20,097 19,254 18,226 17,604 16,758 35 to 39 23,198 23,414 23,550 23,553 23,371 23,181 22,610 21,908 20,867 21,460 40 to 44 19,815 20,234 21,010 21,833 22,593 23,188 23,410 23,408 23,090 23,939 American Indian 1991 1992 1993 1994 1995 1996 1997 1998 1999 2000 20 to 24 1,238 1,259 1,220 1,129 1,031 1,088 1,183 1,249 1,332 1,361 25 to 29 1,194 1,152 1,140 1,145 1,107 1,227 1,190 1,163 1,123 1,097 30 to 34 1,095 1,107 1,079 1,119 1,101 1,053 1,020 1,022 1,005 1,170 35 to 39 899 887 901 932 993 1,386 1,006 955 1,009 1,257 40 to 44 677 722 748 798 822 862 904 941 927 1,049 Black 1991 1992 1993 1994 1995 1996 1997 1998 1999 2000 20 to 24 228 204 181 232 182 241 249 268 185 238 25 to 29 220 193 213 184 201 179 176 176 212 141 30 to 34 135 157 165 190 203 148 130 132 151 96 35 to 39 107 138 120 96 95 122 120 134 124 111 40 to 44 34 70 84 96 82 92 94 85 45 83 Asian/Pacific Islander 1991 1992 1993 1994 1995 1996 1997 1998 1999 2000 20 to 24 221 250 259 296 283 309 243 239 240 175 25 to 29 194 219 209 195 240 269 325 295 292 232 30 to 34 205 201 174 161 174 194 215 226 203 243 35 to 39 172 189 193 168 177 163 156 166 150 201 40 to 44 169 179 180 173 167 178 170 167 171 148 Hispanic of any race 1991 1992 1993 1994 1995 1996 1997 1998 1999 2000 20 to 24 309 364 325 348 430 473 473 449 438 421 25 to 29 243 277 326 281 324 340 287 340 398 342 30 to 34 207 178 219 242 254 278 307 272 254 251 35 to 39 159 147 139 174 199 209 231 253 257 252 40 to 44 109 105 120 109 108 135 134 160 194 184
Table 2: Maternal Population by Age and Race
Source: U.S. Census Bureau; 1991 - 1999 – Estimates; 2000 – Census
Maternal Population by Age 1991 1992 1993 1994 1995 1996 1997 1998 1999 2000 20 to 24 23,109 23,008 22,744 22,370 21,945 21,675 21,877 22,127 22,385 25,436 25 to 29 22,990 22,017 21,341 21,076 21,156 21,411 21,029 20,311 19,432 23,672 30 to 34 25,981 25,300 24,564 23,732 22,705 21,743 20,720 19,808 19,217 18,524 35 to 39 24,535 24,769 24,896 24,930 24,838 24,653 24,116 23,340 22,407 18,561 40 to 44 20,804 21,317 22,139 23,022 23,790 24,456 24,720 24,682 24,427 23,323 Total 117,419 116,411 115,684 115,130 114,434 113,938 112,462 110,268 107,868 109,516 Maternal Population by Race 1991 1992 1993 1994 1995 1996 1997 1998 1999 2000 White non-Hispanic 109,605 108,425 107,721 107,026 1062,41 105,449 104,010 101,927 99,158 100,293 American Indian 5,103 5,127 5,088 5123 5,054 5,616 5,303 5,330 5,396 5,934 Black 724 762 763 798 763 782 769 795 717 669 Asian/Pacific Islander 961 1038 1,015 993 1,041 1,113 1,109 1,093 1,056 999 Hispanic of any race 1,027 1,071 1,129 1,154 1,315 1,435 1,432 1,474 1,541 1,450

81
Table 3: Child Population Younger Than 18 by Race and County – 2000
Source: U.S. Census Bureau - 2000
White Black Am. Indian Asian Pac. Island Other Race 2+ Races Hispanic
County Total Num Pct Num Pct Num Pct Num Pct Num Pct Num Pct Num Pct Num Pct Adams 601 591 98.3% 2 0.3% 1 0.2% 0 0.0% 0 0.0% 2 0.3% 5 0.8% 3 0.5% Barnes 2,624 2,526 96.3% 19 0.7% 40 1.5% 3 0.1% 0 0.0% 5 0.2% 31 1.2% 18 0.7% Benson 2,513 826 32.9% 4 0.2% 1,657 65.9% 1 0.0% 0 0.0% 5 0.2% 20 0.8% 29 1.2% Billings 221 216 97.7% 0 0.0% 0 0.0% 0 0.0% 0 0.0% 0 0.0% 5 2.3% 1 0.5% Bottineau 1,587 1,494 94.1% 11 0.7% 41 2.6% 4 0.3% 0 0.0% 4 0.3% 33 2.1% 14 0.9% Bowman 780 765 98.1% 0 0.0% 0 0.0% 1 0.1% 0 0.0% 2 0.3% 12 1.5% 10 1.3% Burke 467 458 98.1% 2 0.4% 3 0.6% 0 0.0% 0 0.0% 0 0.0% 4 0.9% 4 0.9% Burleigh 17,175 15,753 91.7% 57 0.3% 925 5.4% 85 0.5% 5 0.1% 32 0.2% 314 1.8% 168 1.0% Cass 28,848 26,644 92.4% 391 1.4% 415 1.4% 406 1.4% 13 0.1% 191 0.7% 788 2.7% 604 2.1% Cavalier 1,188 1,143 96.2% 3 0.3% 9 0.8% 3 0.3% 0 0.0% 3 0.3% 27 2.3% 17 1.4% Dickey 1,369 1,310 95.7% 3 0.2% 9 0.7% 13 0.9% 8 0.0% 15 1.1% 19 1.4% 30 2.2% Divide 462 450 97.4% 0 0.0% 2 0.4% 5 1.1% 0 0.0% 2 0.4% 3 0.6% 5 1.1% Dunn 986 791 80.2% 0 0.0% 176 17.8% 1 0.1% 0 0.0% 0 0.0% 18 1.8% 8 0.8% Eddy 651 605 92.9% 1 0.2% 24 3.7% 2 0.3% 0 0.2% 3 0.5% 15 2.3% 9 1.4% Emmons 1,075 1,060 98.6% 0 0.0% 1 0.1% 2 0.2% 5 0.5% 5 0.5% 2 0.2% 17 1.6% Foster 985 962 97.7% 4 0.4% 9 0.9% 0 0.0% 0 0.0% 1 0.1% 9 0.9% 2 0.2% G. Valley 545 514 94.3% 0 0.0% 12 2.2% 0 0.0% 5 0.0% 5 0.9% 14 2.6% 16 2.9% G. Forks 15,735 14,036 89.2% 277 1.8% 580 3.7% 114 0.7% 8 0.1% 167 1.1% 553 3.5% 520 3.3% Grant 666 610 91.6% 0 0.0% 32 4.8% 7 1.1% 0 0.0% 8 1.2% 9 1.4% 12 1.8% Griggs 621 613 98.7% 0 0.0% 2 0.3% 1 0.2% 3 0.0% 3 0.5% 2 0.3% 6 1.0% Hettinger 634 620 97.8% 3 0.5% 5 0.8% 0 0.0% 0 0.0% 0 0.0% 6 0.9% 1 0.2% Kidder 638 632 99.1% 4 0.6% 0 0.0% 0 0.0% 0 0.0% 0 0.0% 2 0.3% 7 1.1% LaMoure 1,138 1,121 98.5% 1 0.1% 3 0.3% 3 0.3% 0 0.0% 2 0.2% 8 0.7% 14 1.2% Logan 522 512 98.1% 2 0.4% 1 0.2% 3 0.6% 0 0.0% 1 0.2% 3 0.6% 4 0.8% McHenry 1,434 1,405 98.0% 0 0.0% 7 0.5% 0 0.0% 0 0.0% 1 0.1% 21 1.5% 7 0.5% McIntosh 656 638 97.3% 0 0.0% 1 0.2% 4 0.6% 0 0.0% 2 0.3% 11 1.7% 7 1.1% McKenzie 1,756 1,148 65.4% 2 0.1% 576 32.8% 0 0.0% 0 0.0% 0 0.0% 30 1.7% 30 1.7% McLean 2,212 1,934 87.4% 2 0.1% 213 9.6% 5 0.2% 0 0.0% 9 0.4% 49 2.2% 43 1.9% Mercer 2,513 2,352 93.6% 2 0.1% 66 2.6% 10 0.4% 9 1.4% 2 0.1% 55 2.2% 15 0.6% Morton 6,823 6,331 92.8% 22 0.3% 256 3.8% 11 0.2% 2 0.1% 16 0.2% 185 2.7% 77 1.1% Mountrail 1,860 947 50.9% 3 0.2% 816 43.9% 4 0.2% 1 0.1% 10 0.5% 79 4.2% 62 3.3% Nelson 820 798 97.3% 1 0.1% 3 0.4% 2 0.2% 0 0.0% 2 0.2% 14 1.7% 4 0.5% Oliver 566 553 97.7% 1 0.2% 5 0.9% 2 0.4% 0 0.0% 0 0.0% 5 0.9% 9 1.6% Pembina 2,140 2,000 93.5% 2 0.1% 26 1.2% 7 0.3% 0 0.0% 50 2.3% 55 2.6% 111 5.2% Pierce 1,115 1,088 97.6% 5 0.4% 12 1.1% 3 0.3% 0 0.0% 1 0.1% 6 0.5% 12 1.1% Ramsey 3,019 2,638 87.4% 9 0.3% 252 8.3% 6 0.2% 3 0.2% 9 0.3% 102 3.4% 34 1.1% Ransom 1,471 1,414 96.1% 5 0.3% 4 0.3% 4 0.3% 0 0.0% 15 1.0% 29 2.0% 26 1.8% Renville 609 590 96.9% 2 0.3% 4 0.7% 3 0.5% 1 0.0% 0 0.0% 10 1.6% 10 1.6% Richland 4,437 4,243 95.6% 17 0.4% 94 2.1% 13 0.3% 4 0.1% 9 0.2% 57 1.3% 47 1.1% Rolette 4,985 752 15.1% 2 0.0% 4131 82.9% 2 0.0% 0 0.0% 2 0.0% 96 1.9% 67 1.3% Sargent 1,155 1,121 97.1% 1 0.1% 13 1.1% 1 0.1% 3 0.0% 13 1.1% 6 0.5% 12 1.0% Sheridan 366 358 97.8% 2 0.5% 4 1.1% 0 0.0% 0 0.0% 1 0.3% 1 0.3% 1 0.3% Sioux 1,630 126 7.7% 0 0.0% 1486 91.2% 0 0.0% 1 0.1% 0 0.0% 17 1.0% 37 2.3% Slope 194 193 99.5% 0 0.0% 0 0.0% 0 0.0% 1 0.0% 0 0.0% 1 0.5% 0 0.0% Stark 5,781 5,548 96.0% 20 0.3% 81 1.4% 17 0.3% 0 0.0% 24 0.4% 91 1.6% 87 1.5% Steele 624 610 97.8% 0 0.0% 3 0.5% 1 0.2% 0 0.0% 4 0.6% 6 1.0% 3 0.5% Stutsman 5,005 4,836 96.6% 17 0.3% 41 0.8% 22 0.4% 1 0.1% 11 0.2% 76 1.5% 66 1.3% Towner 708 687 97.0% 1 0.1% 14 2.0% 0 0.0% 0 0.0% 0 0.0% 6 0.8% 2 0.3% Traill 2,104 2,002 95.2% 2 0.1% 41 1.9% 3 0.1% 1 0.0% 32 1.5% 23 1.1% 84 4.0% Walsh 3,091 2,829 91.5% 16 0.5% 39 1.3% 2 0.1% 2 0.1% 134 4.3% 69 2.2% 314 10.2% Ward 15,423 13,749 89.1% 385 2.5% 466 3.0% 112 0.7% 8 0.1% 131 0.8% 572 3.7% 429 2.8% Wells 1,149 1,133 98.6% 6 0.5% 6 0.5% 3 0.3% 0 0.0% 0 0.0% 1 0.1% 6 0.5% Williams 5,172 4,596 88.9% 5 0.1% 297 5.7% 12 0.2% 4 0.0% 12 0.2% 249 4.8% 82 1.6% N. Dakota 160,849 140,871 87.6% 1,314 0.8% 12,904 8.0% 903 0.6% 87 0.1% 946 0.6% 3,824 2.4% 3,203 2.0%

82
Table 4: Female Population Age 20 – 44 by Race and County – 2000
Source: U.S. Census Bureau
White Black Am. Indian Asian Pac. Island Other Race 2+ Races Hispanic County Total Num Pct Num Pct Num Pct Num Pct Num Pct Num Pct Num Pct Num Pct Adams 318 311 97.8% 3 0.9% 2 0.6% 1 0.3% 0 0.0% 1 0.3% 5 0.8% 3 0.5% Barnes 1,736 1,700 97.9% 8 0.5% 15 0.9% 5 0.3% 0 0.0% 2 0.1% 31 1.2% 18 0.7% Benson 941 402 42.7% 0 0.0% 529 56.2% 0 0.0% 0 0.0% 2 0.2% 20 0.8% 29 1.2% Billings 128 126 98.4% 0 0.0% 0 0.0% 0 0.0% 0 0.0% 0 0.0% 5 2.3% 1 0.5% Bottineau 885 855 96.6% 0 0.0% 23 2.6% 1 0.1% 0 0.0% 2 0.2% 33 2.1% 14 0.9% Bowman 430 425 98.8% 0 0.0% 1 0.2% 0 0.0% 0 0.0% 2 0.5% 12 1.5% 10 1.3% Burke 245 242 98.8% 0 0.0% 1 0.4% 1 0.4% 0 0.0% 0 0.0% 4 0.9% 4 0.9% Burleigh 12,625 11,949 94.6% 15 0.1% 485 3.8% 67 0.5% 7 0.1% 28 0.2% 314 1.8% 168 1.0% Cass 25,911 24,644 95.1% 156 0.6% 331 1.3% 394 1.5% 9 0.0% 117 0.5% 788 2.7% 604 2.1% Cavalier 531 517 97.4% 0 0.0% 5 0.9% 1 0.2% 0 0.0% 0 0.0% 27 2.3% 17 1.4% Dickey 851 825 96.9% 0 0.0% 6 0.7% 7 0.8% 0 0.0% 8 0.9% 19 1.4% 30 2.2% Divide 232 229 98.7% 0 0.0% 0 0.0% 2 0.9% 0 0.0% 1 0.4% 3 0.6% 5 1.1% Dunn 469 395 84.2% 0 0.0% 72 15.4% 0 0.0% 0 0.0% 0 0.0% 18 1.8% 8 0.8% Eddy 353 341 96.6% 0 0.0% 10 2.8% 0 0.0% 0 0.0% 1 0.3% 15 2.3% 9 1.4% Emmons 503 492 97.8% 0 0.0% 3 0.6% 1 0.2% 2 0.4% 4 0.8% 2 0.2% 17 1.6% Foster 534 530 99.3% 0 0.0% 3 0.6% 0 0.0% 0 0.0% 1 0.2% 9 0.9% 2 0.2% G. Valley 257 254 98.8% 0 0.0% 0 0.0% 0 0.0% 0 0.0% 1 0.4% 14 2.6% 16 2.9% G. Forks 13,413 12,374 92.3% 182 1.4% 394 2.9% 192 1.4% 12 0.1% 102 0.8% 553 3.5% 520 3.3% Grant 301 295 98.0% 0 0.0% 4 1.3% 0 0.0% 0 0.0% 1 0.3% 9 1.4% 12 1.8% Griggs 303 301 99.3% 0 0.0% 0 0.0% 1 0.3% 0 0.0% 1 0.3% 2 0.3% 6 1.0% Hettinger 295 293 99.3% 0 0.0% 0 0.0% 1 0.3% 0 0.0% 0 0.0% 6 0.9% 1 0.2% Kidder 334 332 99.4% 0 0.0% 2 0.6% 0 0.0% 0 0.0% 0 0.0% 2 0.3% 7 1.1% LaMoure 574 568 99.0% 0 0.0% 1 0.2% 3 0.5% 0 0.0% 0 0.0% 8 0.7% 14 1.2% Logan 246 246 100.0 0 0.0% 0 0.0% 0 0.0% 0 0.0% 0 0.0% 3 0.6% 4 0.8% McHenry 769 757 98.4% 1 0.1% 4 0.5% 1 0.1% 0 0.0% 0 0.0% 21 1.5% 7 0.5% McIntosh 351 346 98.6% 0 0.0% 1 0.3% 1 0.3% 0 0.0% 1 0.3% 11 1.7% 7 1.1% McKenzie 774 562 72.6% 1 0.1% 196 25.3% 1 0.1% 0 0.0% 2 0.3% 30 1.7% 30 1.7% McLean 1,197 1,075 89.8% 0 0.0% 96 8.0% 2 0.2% 0 0.0% 3 0.3% 49 2.2% 43 1.9% Mercer 1,288 1,234 95.8% 0 0.0% 34 2.6% 3 0.2% 5 0.4% 4 0.3% 55 2.2% 15 0.6% Morton 4,191 3,995 95.3% 1 0.0% 128 3.1% 18 0.4% 0 0.0% 7 0.2% 185 2.7% 77 1.1% Mountrail 909 521 57.3% 0 0.0% 360 39.6% 2 0.2% 0 0.0% 2 0.2% 79 4.2% 62 3.3% Nelson 407 400 98.3% 0 0.0% 2 0.5% 2 0.5% 0 0.0% 0 0.0% 14 1.7% 4 0.5% Oliver 262 254 96.9% 1 0.4% 4 1.5% 0 0.0% 0 0.0% 0 0.0% 5 0.9% 9 1.6% Pembina 1,142 1,068 93.5% 1 0.1% 31 2.7% 4 0.4% 0 0.0% 16 1.4% 55 2.6% 111 5.2% Pierce 603 594 98.5% 0 0.0% 3 0.5% 3 0.5% 0 0.0% 0 0.0% 6 0.5% 12 1.1% Ramsey 1822 1,645 90.3% 4 0.2% 128 7.0% 10 0.5% 0 0.0% 2 0.1% 102 3.4% 34 1.1% Ransom 822 797 97.0% 1 0.1% 5 0.6% 6 0.7% 0 0.0% 2 0.2% 29 2.0% 26 1.8% Renville 335 323 96.4% 1 0.3% 4 1.2% 2 0.6% 0 0.0% 1 0.3% 10 1.6% 10 1.6% Richland 2,769 2,661 96.1% 0 0.0% 80 2.9% 8 0.3% 0 0.0% 2 0.1% 57 1.3% 47 1.1% Rolette 2,288 466 20.4% 1 0.0% 1,776 77.6% 1 0.0% 0 0.0% 5 0.2% 96 1.9% 67 1.3% Sargent 567 554 97.7% 0 0.0% 2 0.4% 0 0.0% 0 0.0% 4 0.7% 6 0.5% 12 1.0% Sheridan 186 185 99.5% 0 0.0% 1 0.5% 0 0.0% 0 0.0% 0 0.0% 1 0.3% 1 0.3% Sioux 688 85 12.4% 0 0.0% 599 87.1% 0 0.0% 1 0.1% 0 0.0% 17 1.0% 37 2.3% Slope 96 95 99.0% 0 0.0% 1 1.0% 0 0.0% 0 0.0% 0 0.0% 1 0.5% 0 0.0% Stark 3,848 3,747 97.4% 2 0.1% 43 1.1% 12 0.3% 1 0.0% 18 0.5% 91 1.6% 87 1.5% Steele 275 266 96.7% 0 0.0% 3 1.1% 0 0.0% 0 0.0% 1 0.4% 6 1.0% 3 0.5% Stutsman 3,502 3,399 97.1% 6 0.2% 48 1.4% 18 0.5% 4 0.1% 8 0.2% 76 1.5% 66 1.3% Towner 361 342 94.7% 0 0.0% 16 4.4% 0 0.0% 0 0.0% 0 0.0% 6 0.8% 2 0.3% Traill 1,239 1,199 96.8% 1 0.1% 15 1.2% 3 0.2% 0 0.0% 13 1.0% 23 1.1% 84 4.0% Walsh 1,740 1,633 93.9% 3 0.2% 28 1.6% 4 0.2% 0 0.0% 55 3.2% 69 2.2% 314 10.2% Ward 11,035 10,069 91.2% 275 2.5% 265 2.4% 163 1.5% 10 0.1% 107 1.0% 572 3.7% 429 2.8% Wells 628 619 98.6% 0 0.0% 4 0.6% 3 0.5% 0 0.0% 0 0.0% 1 0.1% 6 0.5% Williams 3,007 2,756 91.7% 6 0.2% 170 5.7% 8 0.3% 0 0.0% 6 0.2% 249 4.8% 82 1.6% N. Dakota 109,516 100,293 91.6% 669 0.6% 5,934 5.4% 952 0.9% 51 0.0% 533 0.5% 3,824 2.4% 3,203 2.0%

83
Source: Current Population Survey, U.S. Census Bureau
Table 5: Children Ages 5 Through 17 in Poverty by County
1989 1993 1995 1997 County Number Percent Number Percent Number Percent Number Percent Adams 83 13.8% 60 10.8% 67 13.0% 81 16.4% Barnes 392 17.0% 372 16.8% 346 16.6% 356 17.1% Benson 716 40.5% 661 38.4% 624 37.5% 623 35.8% Billings 114 41.0% 52 17.5% 54 19.4% 43 17.1% Bottineau 231 14.8% 204 13.2% 208 14.5% 209 15.2% Bowman 114 14.7% 96 13.5% 92 13.7% 89 13.5% Burke 87 14.5% 71 13.9% 73 15.9% 62 15.3% Burleigh 1,151 9.4% 1,304 9.8% 1,295 10.0% 1,327 10.4% Cass 1,531 8.6% 1,882 9.5% 1,864 9.7% 1,890 9.6% Cavalier 160 13.2% 140 12.5% 134 13.5% 153 16.8% Dickey 208 18.1% 209 18.0% 181 17.3% 190 18.2% Divide 52 9.6% 58 12.6% 61 14.8% 66 17.4% Dunn 215 23.2% 148 16.8% 151 18.5% 163 21.2% Eddy 90 15.9% 62 11.0% 68 12.7% 90 16.8% Emmons 181 19.4% 145 16.0% 160 19.1% 158 20.6% Foster 106 12.9% 111 13.9% 111 14.9% 115 15.8% Golden Valley 73 15.5% 49 11.3% 61 15.0% 70 18.8% Grand Forks 1,443 11.7% 1,614 12.4% 1,508 12.3% 1,517 13.2% Grant 244 33.3% 163 24.4% 158 26.0% 168 30.6% Griggs 94 14.4% 92 15.1% 94 17.0% 101 19.2% Hettinger 146 21.8% 106 17.5% 103 18.6% 94 18.3% Kidder 162 23.4% 131 19.2% 126 20.3% 129 22.5% LaMoure 191 16.9% 152 14.1% 148 14.9% 147 15.7% Logan 127 23.8% 84 17.1% 87 19.8% 90 21.5% McHenry 301 19.0% 231 17.4% 226 18.1% 250 20.8% McIntosh 144 21.8% 103 16.9% 106 19.1% 119 24.5% McKenzie 412 26.9% 295 21.0% 325 24.4% 330 25.4% McLean 302 12.9% 277 12.1% 275 12.7% 293 14.0% Mercer 158 6.8% 154 6.8% 152 7.1% 172 8.1% Morton 764 14.4% 710 13.1% 682 13.1% 795 15.7% Mountrail 327 20.8% 300 19.7% 285 19.5% 311 21.7% Nelson 106 13.3% 101 13.6% 90 13.5% 90 14.6% Oliver 69 11.6% 55 9.3% 69 12.3% 76 13.8% Pembina 232 11.9% 215 11.5% 205 11.6% 217 12.8% Pierce 162 15.8% 134 13.8% 131 14.4% 158 17.5% Ramsey 329 13.4% 418 16.9% 395 17.1% 420 19.0% Ransom 137 11.9% 118 10.2% 109 10.0% 114 10.5% Renville 102 14.9% 59 9.1% 68 11.4% 76 13.1% Richland 464 13.5% 444 12.7% 415 12.7% 430 13.2% Rolette 1,983 58.8% 1,590 42.8% 1,594 41.8% 1,358 34.3% Sargent 93 10.0% 82 8.8% 92 10.5% 88 10.1% Sheridan 125 32.4% 79 22.0% 77 24.4% 83 29.7% Sioux 651 55.0% 549 44.5% 617 48.4% 557 41.7% Slope 52 24.4% 29 14.2% 30 15.5% 29 14.9% Stark 753 15.2% 776 15.3% 723 15.3% 716 15.5% Steele 61 13.0% 49 10.7% 50 11.7% 73 17.8% Stutsman 602 14.0% 565 13.5% 567 14.6% 562 15.3% Towner 129 18.8% 96 14.9% 101 71.2% 106 19.1% Traill 202 12.0% 220 12.9% 214 13.3% 211 13.0% Walsh 505 18.0% 431 16.2% 443 16.5% 481 18.3% Ward 1,393 12.6% 1,681 14.6% 1,503 13.3% 1,579 14.5% Wells 211 19.8% 158 15.9% 153 16.6% 158 17.8% Williams 570 12.0% 747 16.1% 711 16.1% 665 15.7% North Dakota 19,251 15.2% 18,632 14.4% 18,182 14.7% 18,448 15.3%

84
Table 6: Children Younger Than 18 in Poverty by County
1989 1993 1995 1997County Number Percent Number Percent Number Percent Number PercentAdams 119 14.1% 95 13.0% 109 15.8% 119 18.1%Barnes 609 19.1% 552 18.9% 528 18.8% 520 18.6%Benson 1,141 45.7% 949 39.1% 892 37.8% 932 38.5%Billings 170 46.3% 66 17.8% 62 17.4% 46 14.0%Bottineau 358 17.3% 289 14.8% 286 15.4% 305 17.2%Bowman 166 16.1% 126 13.9% 129 14.7% 117 13.7%Burke 124 16.5% 100 16.1% 109 19.0% 85 17.0%Burleigh 1,959 11.5% 2,149 12.1% 1,988 11.3% 2,148 12.3%Cass 2,650 10.2% 3,105 11.4% 2,981 11.0% 3,178 11.5%Cavalier 244 14.5% 201 13.7% 204 15.4% 222 18.3%Dickey 310 20.1% 293 20.0% 263 19.4% 267 19.7%Divide 85 12.0% 82 13.7% 88 15.9% 93 18.3%Dunn 306 24.0% 206 17.7% 220 20.0% 218 21.2%Eddy 136 17.9% 90 12.7% 98 14.2% 137 19.8%Emmons 252 19.8% 193 16.6% 230 21.0% 215 21.5%Foster 160 14.3% 152 14.6% 158 15.9% 157 16.1%Golden Valley 115 18.8% 68 12.4% 87 16.7% 96 20.0%Grand Forks 2,522 13.5% 2,633 14.2% 2,385 13.3% 2,353 14.1%Grant 354 36.2% 214 25.3% 216 27.5% 239 33.7%Griggs 150 17.1% 128 16.4% 137 19.1% 142 20.7%Hettinger 205 22.0% 146 18.4% 152 20.6% 130 18.9%Kidder 235 25.6% 175 20.6% 179 22.6% 174 23.7%LaMoure 284 19.0% 202 14.8% 207 16.2% 188 15.5%Logan 188 26.1% 113 17.9% 124 21.4% 123 22.4%McHenry 443 24.5% 325 19.6% 332 20.8% 368 24.0%McIntosh 208 23.0% 137 17.3% 151 20.6% 179 27.8%McKenzie 671 31.2% 435 22.6% 439 23.5% 464 25.8%McLean 468 15.1% 423 14.7% 418 15.1% 425 15.9%Mercer 248 7.6% 233 7.7% 224 7.6% 246 8.5%Morton 1,206 16.6% 1,084 15.3% 1,031 14.8% 1,240 18.3%Mountrail 508 23.9% 434 21.3% 435 22.0% 463 24.0%Nelson 155 14.7% 134 14.3% 124 14.5% 120 15.1%Oliver 98 12.5% 77 10.6% 97 13.7% 97 14.1%Pembina 371 14.1% 315 13.0% 297 12.7% 329 14.7%Pierce 236 17.9% 188 15.7% 194 16.8% 233 20.4%Ramsey 559 16.6% 618 18.8% 590 18.7% 658 22.0%Ransom 209 13.6% 178 12.1% 164 11.6% 157 11.1%Renville 144 16.4% 81 10.1% 90 12.0% 102 13.8%Richland 807 16.7% 693 14.8% 618 13.8% 649 14.6%Rolette 3,206 66.9% 2,303 45.3% 2,175 39.7% 2,012 36.2%Sargent 143 11.4% 120 10.1% 135 11.9% 123 10.9%Sheridan 191 35.9% 116 24.7% 115 27.5% 122 32.8%Sioux 1,042 62.3% 762 43.5% 773 42.7% 753 40.8%Slope 73 25.9% 40 15.9% 38 15.7% 34 14.1%Stark 1,171 17.1% 1,114 16.7% 1,035 16.3% 1,051 17.0%Steele 89 13.7% 71 11.7% 78 13.5% 113 20.3%Stutsman 990 16.8% 875 15.9% 845 16.3% 854 17.3%Towner 195 19.6% 144 16.8% 155 19.3% 146 19.3%Traill 348 15.3% 318 14.6% 288 13.7% 299 14.1%Walsh 789 20.5% 625 18.0% 653 18.2% 719 20.4%Ward 2,466 15.0% 2,589 16.1% 2,277 14.1% 2,451 15.7%Wells 310 21.0% 219 16.9% 220 18.0% 225 19.1%Williams 921 14.3% 1,078 17.8% 1,017 17.4% 976 17.5%North Dakota 31,163 17.5% 28,256 16.2% 26,838 15.9% 27,807 16.8%
Source: U.S. Census Bureau, Current Population Survey
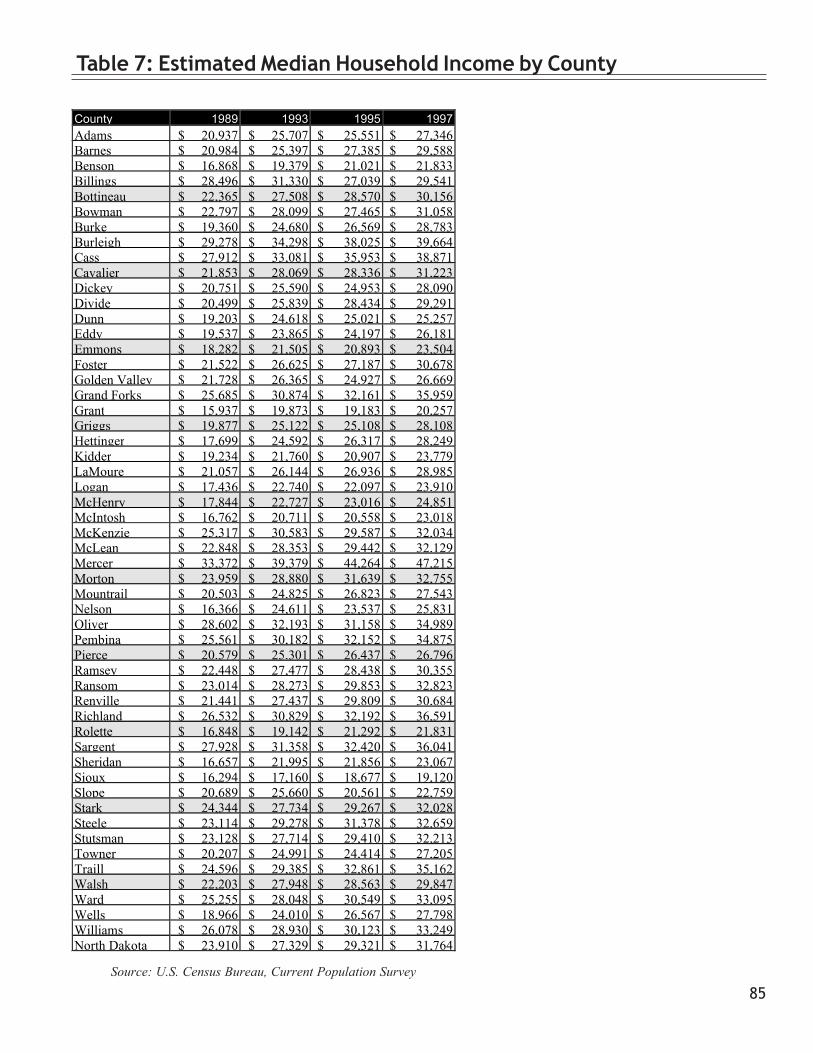
85
Table 7: Estimated Median Household Income by County
County 1989 1993 1995 1997Adams $ 20,937 $ 25,707 $ 25,551 $ 27,346Barnes $ 20,984 $ 25,397 $ 27,385 $ 29,588Benson $ 16,868 $ 19,379 $ 21,021 $ 21,833Billings $ 28,496 $ 31,330 $ 27,039 $ 29,541Bottineau $ 22,365 $ 27,508 $ 28,570 $ 30,156Bowman $ 22,797 $ 28,099 $ 27,465 $ 31,058Burke $ 19,360 $ 24,680 $ 26,569 $ 28,783Burleigh $ 29,278 $ 34,298 $ 38,025 $ 39,664Cass $ 27,912 $ 33,081 $ 35,953 $ 38,871Cavalier $ 21,853 $ 28,069 $ 28,336 $ 31,223Dickey $ 20,751 $ 25,590 $ 24,953 $ 28,090Divide $ 20,499 $ 25,839 $ 28,434 $ 29,291Dunn $ 19,203 $ 24,618 $ 25,021 $ 25,257Eddy $ 19,537 $ 23,865 $ 24,197 $ 26,181Emmons $ 18,282 $ 21,505 $ 20,893 $ 23,504Foster $ 21,522 $ 26,625 $ 27,187 $ 30,678Golden Valley $ 21,728 $ 26,365 $ 24,927 $ 26,669Grand Forks $ 25,685 $ 30,874 $ 32,161 $ 35,959Grant $ 15,937 $ 19,873 $ 19,183 $ 20,257Griggs $ 19,877 $ 25,122 $ 25,108 $ 28,108Hettinger $ 17,699 $ 24,592 $ 26,317 $ 28,249Kidder $ 19,234 $ 21,760 $ 20,907 $ 23,779LaMoure $ 21,057 $ 26,144 $ 26,936 $ 28,985Logan $ 17,436 $ 22,740 $ 22,097 $ 23,910McHenry $ 17,844 $ 22,727 $ 23,016 $ 24,851McIntosh $ 16,762 $ 20,711 $ 20,558 $ 23,018McKenzie $ 25,317 $ 30,583 $ 29,587 $ 32,034McLean $ 22,848 $ 28,353 $ 29,442 $ 32,129Mercer $ 33,372 $ 39,379 $ 44,264 $ 47,215Morton $ 23,959 $ 28,880 $ 31,639 $ 32,755Mountrail $ 20,503 $ 24,825 $ 26,823 $ 27,543Nelson $ 16,366 $ 24,611 $ 23,537 $ 25,831Oliver $ 28,602 $ 32,193 $ 31,158 $ 34,989Pembina $ 25,561 $ 30,182 $ 32,152 $ 34,875Pierce $ 20,579 $ 25,301 $ 26,437 $ 26,796Ramsey $ 22,448 $ 27,477 $ 28,438 $ 30,355Ransom $ 23,014 $ 28,273 $ 29,853 $ 32,823Renville $ 21,441 $ 27,437 $ 29,809 $ 30,684Richland $ 26,532 $ 30,829 $ 32,192 $ 36,591Rolette $ 16,848 $ 19,142 $ 21,292 $ 21,831Sargent $ 27,928 $ 31,358 $ 32,420 $ 36,041Sheridan $ 16,657 $ 21,995 $ 21,856 $ 23,067Sioux $ 16,294 $ 17,160 $ 18,677 $ 19,120Slope $ 20,689 $ 25,660 $ 20,561 $ 22,759Stark $ 24,344 $ 27,734 $ 29,267 $ 32,028Steele $ 23,114 $ 29,278 $ 31,378 $ 32,659Stutsman $ 23,128 $ 27,714 $ 29,410 $ 32,213Towner $ 20,207 $ 24,991 $ 24,414 $ 27,205Traill $ 24,596 $ 29,385 $ 32,861 $ 35,162Walsh $ 22,203 $ 27,948 $ 28,563 $ 29,847Ward $ 25,255 $ 28,048 $ 30,549 $ 33,095Wells $ 18,966 $ 24,010 $ 26,567 $ 27,798Williams $ 26,078 $ 28,930 $ 30,123 $ 33,249North Dakota $ 23,910 $ 27,329 $ 29,321 $ 31,764
Source: U.S. Census Bureau, Current Population Survey
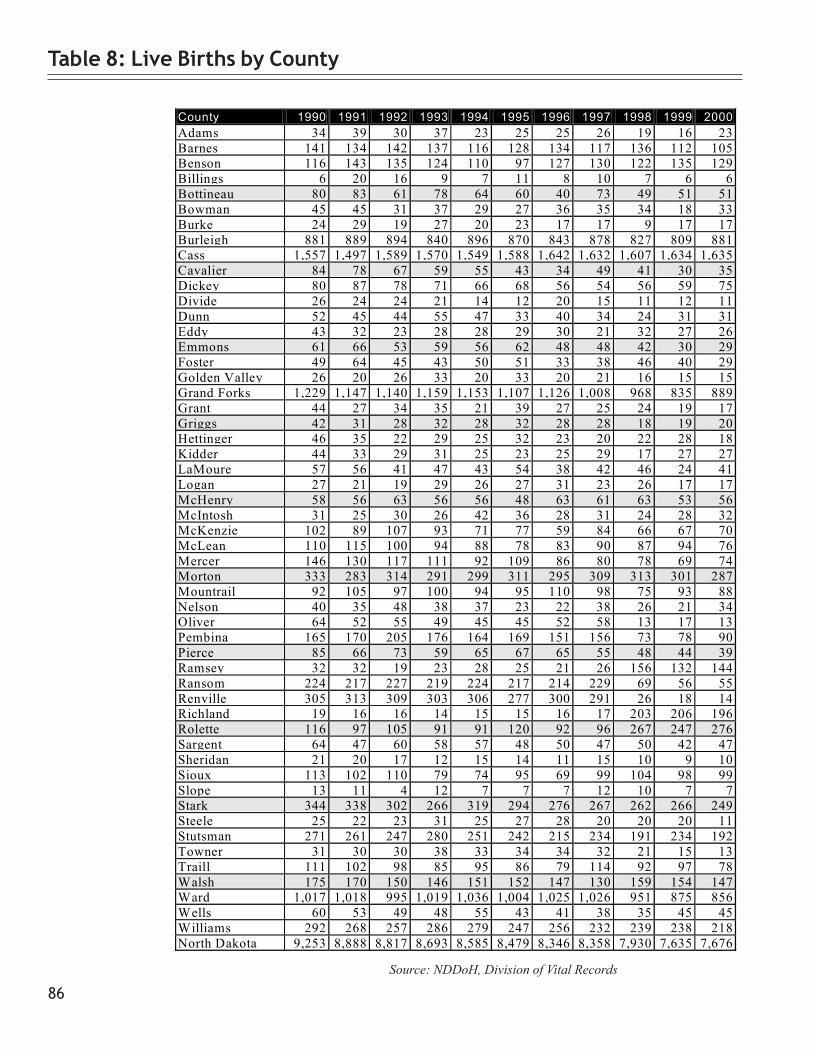
86
Table 8: Live Births by County
County 1990 1991 1992 1993 1994 1995 1996 1997 1998 1999 2000 Adams 34 39 30 37 23 25 25 26 19 16 23 Barnes 141 134 142 137 116 128 134 117 136 112 105 Benson 116 143 135 124 110 97 127 130 122 135 129 Billings 6 20 16 9 7 11 8 10 7 6 6 Bottineau 80 83 61 78 64 60 40 73 49 51 51 Bowman 45 45 31 37 29 27 36 35 34 18 33 Burke 24 29 19 27 20 23 17 17 9 17 17 Burleigh 881 889 894 840 896 870 843 878 827 809 881 Cass 1,557 1,497 1,589 1,570 1,549 1,588 1,642 1,632 1,607 1,634 1,635 Cavalier 84 78 67 59 55 43 34 49 41 30 35 Dickey 80 87 78 71 66 68 56 54 56 59 75 Divide 26 24 24 21 14 12 20 15 11 12 11 Dunn 52 45 44 55 47 33 40 34 24 31 31 Eddy 43 32 23 28 28 29 30 21 32 27 26 Emmons 61 66 53 59 56 62 48 48 42 30 29 Foster 49 64 45 43 50 51 33 38 46 40 29 Golden Valley 26 20 26 33 20 33 20 21 16 15 15 Grand Forks 1,229 1,147 1,140 1,159 1,153 1,107 1,126 1,008 968 835 889 Grant 44 27 34 35 21 39 27 25 24 19 17 Griggs 42 31 28 32 28 32 28 28 18 19 20 Hettinger 46 35 22 29 25 32 23 20 22 28 18 Kidder 44 33 29 31 25 23 25 29 17 27 27 LaMoure 57 56 41 47 43 54 38 42 46 24 41 Logan 27 21 19 29 26 27 31 23 26 17 17 McHenry 58 56 63 56 56 48 63 61 63 53 56 McIntosh 31 25 30 26 42 36 28 31 24 28 32 McKenzie 102 89 107 93 71 77 59 84 66 67 70 McLean 110 115 100 94 88 78 83 90 87 94 76 Mercer 146 130 117 111 92 109 86 80 78 69 74 Morton 333 283 314 291 299 311 295 309 313 301 287 Mountrail 92 105 97 100 94 95 110 98 75 93 88 Nelson 40 35 48 38 37 23 22 38 26 21 34 Oliver 64 52 55 49 45 45 52 58 13 17 13 Pembina 165 170 205 176 164 169 151 156 73 78 90 Pierce 85 66 73 59 65 67 65 55 48 44 39 Ramsey 32 32 19 23 28 25 21 26 156 132 144 Ransom 224 217 227 219 224 217 214 229 69 56 55 Renville 305 313 309 303 306 277 300 291 26 18 14 Richland 19 16 16 14 15 15 16 17 203 206 196 Rolette 116 97 105 91 91 120 92 96 267 247 276 Sargent 64 47 60 58 57 48 50 47 50 42 47 Sheridan 21 20 17 12 15 14 11 15 10 9 10 Sioux 113 102 110 79 74 95 69 99 104 98 99 Slope 13 11 4 12 7 7 7 12 10 7 7 Stark 344 338 302 266 319 294 276 267 262 266 249 Steele 25 22 23 31 25 27 28 20 20 20 11 Stutsman 271 261 247 280 251 242 215 234 191 234 192 Towner 31 30 30 38 33 34 34 32 21 15 13 Traill 111 102 98 85 95 86 79 114 92 97 78 Walsh 175 170 150 146 151 152 147 130 159 154 147 Ward 1,017 1,018 995 1,019 1,036 1,004 1,025 1,026 951 875 856 Wells 60 53 49 48 55 43 41 38 35 45 45 Williams 292 268 257 286 279 247 256 232 239 238 218 North Dakota 9,253 8,888 8,817 8,693 8,585 8,479 8,346 8,358 7,930 7,635 7,676
Source: NDDoH, Division of Vital Records
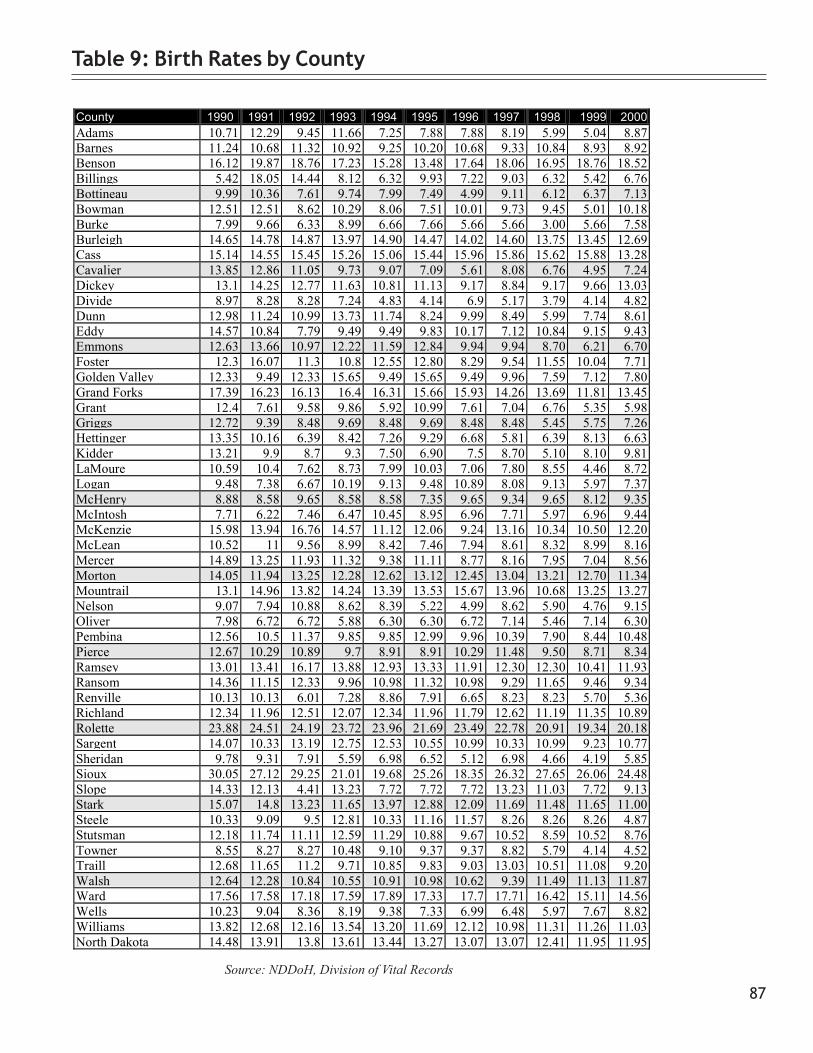
87
Table 9: Birth Rates by County
County 1990 1991 1992 1993 1994 1995 1996 1997 1998 1999 2000 Adams 10.71 12.29 9.45 11.66 7.25 7.88 7.88 8.19 5.99 5.04 8.87 Barnes 11.24 10.68 11.32 10.92 9.25 10.20 10.68 9.33 10.84 8.93 8.92 Benson 16.12 19.87 18.76 17.23 15.28 13.48 17.64 18.06 16.95 18.76 18.52 Billings 5.42 18.05 14.44 8.12 6.32 9.93 7.22 9.03 6.32 5.42 6.76 Bottineau 9.99 10.36 7.61 9.74 7.99 7.49 4.99 9.11 6.12 6.37 7.13 Bowman 12.51 12.51 8.62 10.29 8.06 7.51 10.01 9.73 9.45 5.01 10.18 Burke 7.99 9.66 6.33 8.99 6.66 7.66 5.66 5.66 3.00 5.66 7.58 Burleigh 14.65 14.78 14.87 13.97 14.90 14.47 14.02 14.60 13.75 13.45 12.69 Cass 15.14 14.55 15.45 15.26 15.06 15.44 15.96 15.86 15.62 15.88 13.28 Cavalier 13.85 12.86 11.05 9.73 9.07 7.09 5.61 8.08 6.76 4.95 7.24 Dickey 13.1 14.25 12.77 11.63 10.81 11.13 9.17 8.84 9.17 9.66 13.03 Divide 8.97 8.28 8.28 7.24 4.83 4.14 6.9 5.17 3.79 4.14 4.82 Dunn 12.98 11.24 10.99 13.73 11.74 8.24 9.99 8.49 5.99 7.74 8.61 Eddy 14.57 10.84 7.79 9.49 9.49 9.83 10.17 7.12 10.84 9.15 9.43 Emmons 12.63 13.66 10.97 12.22 11.59 12.84 9.94 9.94 8.70 6.21 6.70 Foster 12.3 16.07 11.3 10.8 12.55 12.80 8.29 9.54 11.55 10.04 7.71 Golden Valley 12.33 9.49 12.33 15.65 9.49 15.65 9.49 9.96 7.59 7.12 7.80 Grand Forks 17.39 16.23 16.13 16.4 16.31 15.66 15.93 14.26 13.69 11.81 13.45 Grant 12.4 7.61 9.58 9.86 5.92 10.99 7.61 7.04 6.76 5.35 5.98 Griggs 12.72 9.39 8.48 9.69 8.48 9.69 8.48 8.48 5.45 5.75 7.26 Hettinger 13.35 10.16 6.39 8.42 7.26 9.29 6.68 5.81 6.39 8.13 6.63 Kidder 13.21 9.9 8.7 9.3 7.50 6.90 7.5 8.70 5.10 8.10 9.81 LaMoure 10.59 10.4 7.62 8.73 7.99 10.03 7.06 7.80 8.55 4.46 8.72 Logan 9.48 7.38 6.67 10.19 9.13 9.48 10.89 8.08 9.13 5.97 7.37 McHenry 8.88 8.58 9.65 8.58 8.58 7.35 9.65 9.34 9.65 8.12 9.35 McIntosh 7.71 6.22 7.46 6.47 10.45 8.95 6.96 7.71 5.97 6.96 9.44 McKenzie 15.98 13.94 16.76 14.57 11.12 12.06 9.24 13.16 10.34 10.50 12.20 McLean 10.52 11 9.56 8.99 8.42 7.46 7.94 8.61 8.32 8.99 8.16 Mercer 14.89 13.25 11.93 11.32 9.38 11.11 8.77 8.16 7.95 7.04 8.56 Morton 14.05 11.94 13.25 12.28 12.62 13.12 12.45 13.04 13.21 12.70 11.34 Mountrail 13.1 14.96 13.82 14.24 13.39 13.53 15.67 13.96 10.68 13.25 13.27 Nelson 9.07 7.94 10.88 8.62 8.39 5.22 4.99 8.62 5.90 4.76 9.15 Oliver 7.98 6.72 6.72 5.88 6.30 6.30 6.72 7.14 5.46 7.14 6.30 Pembina 12.56 10.5 11.37 9.85 9.85 12.99 9.96 10.39 7.90 8.44 10.48 Pierce 12.67 10.29 10.89 9.7 8.91 8.91 10.29 11.48 9.50 8.71 8.34 Ramsey 13.01 13.41 16.17 13.88 12.93 13.33 11.91 12.30 12.30 10.41 11.93 Ransom 14.36 11.15 12.33 9.96 10.98 11.32 10.98 9.29 11.65 9.46 9.34 Renville 10.13 10.13 6.01 7.28 8.86 7.91 6.65 8.23 8.23 5.70 5.36 Richland 12.34 11.96 12.51 12.07 12.34 11.96 11.79 12.62 11.19 11.35 10.89 Rolette 23.88 24.51 24.19 23.72 23.96 21.69 23.49 22.78 20.91 19.34 20.18 Sargent 14.07 10.33 13.19 12.75 12.53 10.55 10.99 10.33 10.99 9.23 10.77 Sheridan 9.78 9.31 7.91 5.59 6.98 6.52 5.12 6.98 4.66 4.19 5.85 Sioux 30.05 27.12 29.25 21.01 19.68 25.26 18.35 26.32 27.65 26.06 24.48 Slope 14.33 12.13 4.41 13.23 7.72 7.72 7.72 13.23 11.03 7.72 9.13 Stark 15.07 14.8 13.23 11.65 13.97 12.88 12.09 11.69 11.48 11.65 11.00 Steele 10.33 9.09 9.5 12.81 10.33 11.16 11.57 8.26 8.26 8.26 4.87 Stutsman 12.18 11.74 11.11 12.59 11.29 10.88 9.67 10.52 8.59 10.52 8.76 Towner 8.55 8.27 8.27 10.48 9.10 9.37 9.37 8.82 5.79 4.14 4.52 Traill 12.68 11.65 11.2 9.71 10.85 9.83 9.03 13.03 10.51 11.08 9.20 Walsh 12.64 12.28 10.84 10.55 10.91 10.98 10.62 9.39 11.49 11.13 11.87 Ward 17.56 17.58 17.18 17.59 17.89 17.33 17.7 17.71 16.42 15.11 14.56 Wells 10.23 9.04 8.36 8.19 9.38 7.33 6.99 6.48 5.97 7.67 8.82 Williams 13.82 12.68 12.16 13.54 13.20 11.69 12.12 10.98 11.31 11.26 11.03 North Dakota 14.48 13.91 13.8 13.61 13.44 13.27 13.07 13.07 12.41 11.95 11.95 Source: NDDoH, Division of Vital Records

88
Table 10: Fetal Deaths by County
County 1990 1991 1992 1993 1994 1995 1996 1997 1998 1999 2000 Adams 0 0 0 0 0 0 0 0 0 0 0 Barnes 1 2 0 0 0 1 0 0 1 0 0 Benson 1 2 0 1 2 2 1 0 2 1 0 Billings 0 0 0 0 0 0 0 0 0 0 1 Bottineau 0 0 0 0 0 3 0 0 0 0 1 Bowman 0 0 0 0 0 0 0 0 0 0 0 Burke 0 0 0 0 0 1 0 0 1 0 0 Burleigh 5 7 5 4 8 7 3 5 5 5 3 Cass 12 5 9 15 8 12 9 9 11 10 11 Cavalier 0 0 1 0 2 1 1 1 0 0 0 Dickey 0 1 2 0 1 0 0 0 0 0 0 Divide 0 0 2 0 0 0 1 0 0 0 0 Dunn 1 0 0 0 1 0 0 2 0 0 0 Eddy 0 0 1 1 1 0 1 0 0 0 0 Emmons 0 0 0 0 1 0 0 0 0 1 1 Foster 0 0 0 0 0 1 0 0 2 0 0 Golden Valley 0 0 0 0 1 0 0 0 0 0 0 Grand Forks 15 8 8 5 2 12 6 6 8 2 4 Grant 1 0 0 0 1 0 0 0 0 0 0 Griggs 0 0 0 0 0 0 0 0 0 0 0 Hettinger 1 0 0 0 0 1 0 0 0 0 0 Kidder 0 0 2 0 0 0 0 0 0 0 0 LaMoure 0 0 0 1 0 2 0 0 0 0 0 Logan 1 1 0 0 0 0 1 0 1 0 0 McHenry 1 1 0 0 0 0 0 0 1 1 0 McIntosh 0 0 0 0 0 1 0 1 0 0 0 McKenzie 1 0 1 1 0 0 2 1 0 0 1 McLean 2 2 1 1 1 0 0 0 0 0 0 Mercer 1 0 2 1 0 1 0 1 0 0 2 Morton 0 0 2 3 5 0 0 2 0 2 1 Mountrail 3 0 0 0 1 1 1 1 0 2 0 Nelson 0 0 0 0 0 0 0 0 3 0 0 Oliver 0 0 0 0 0 0 1 0 0 0 0 Pembina 0 0 0 2 0 0 0 2 1 2 0 Pierce 0 1 0 0 0 1 0 0 0 0 1 Ramsey 0 1 1 1 2 2 0 0 1 1 0 Ransom 0 0 0 0 0 0 1 0 3 0 1 Renville 0 0 0 0 0 0 0 0 0 0 0 Richland 0 0 0 0 0 0 0 0 0 3 0 Rolette 4 1 4 2 2 2 2 2 3 1 4 Sargent 1 0 0 1 0 0 0 1 0 0 0 Sheridan 0 0 0 1 0 0 0 0 0 0 0 Sioux 2 0 0 0 0 1 3 1 1 0 1 Slope 0 0 0 0 0 0 0 0 0 0 0 Stark 2 3 0 1 0 4 1 0 0 1 1 Steele 1 0 0 1 0 0 0 0 0 0 0 Stutsman 0 0 0 2 2 2 0 0 0 3 2 Towner 0 0 0 0 0 0 1 0 0 0 0 Traill 0 0 0 3 0 0 0 1 0 0 0 Walsh 2 2 1 0 3 1 0 2 1 0 0 Ward 8 10 6 5 3 7 7 2 3 3 10 Wells 0 0 0 0 0 0 0 0 0 1 1 Williams 2 3 3 0 1 1 0 4 1 0 0 North Dakota 68 50 51 52 48 67 42 44 49 39 46
Source: NDDoH, Division of Vital Records

89
Table 11: Fetal Death Rates by County
County 1990 1991 1992 1993 1994 1995 1996 1997 1998 1999 2000 Adams 0.00 0.00 0.00 0.00 0.00 0.00 0.00 0.00 0.00 0.00 0.00 Barnes 7.09 14.93 0.00 0.00 0.00 7.81 0.00 0.00 7.35 0.00 0.00 Benson 8.62 13.99 0.00 8.06 18.18 20.62 7.87 0.00 16.39 7.41 0.00 Billings 0.00 0.00 0.00 0.00 0.00 0.00 0.00 0.00 0.00 0.00 166.67 Bottineau 0.00 0.00 0.00 0.00 0.00 50.00 0.00 0.00 0.00 0.00 19.61 Bowman 0.00 0.00 0.00 0.00 0.00 0.00 0.00 0.00 0.00 0.00 0.00 Burke 0.00 0.00 0.00 0.00 0.00 43.48 0.00 0.00 111.11 0.00 0.00 Burleigh 5.68 7.87 5.59 4.76 8.93 8.05 3.56 5.69 6.05 6.18 3.41 Cass 7.71 3.34 5.66 9.55 5.16 7.56 5.48 5.51 6.85 6.12 6.73 Cavalier 0.00 0.00 14.93 0.00 36.36 23.26 29.41 20.41 0.00 0.00 0.00 Dickey 0.00 11.49 25.64 0.00 15.15 0.00 0.00 0.00 0.00 0.00 0.00 Divide 0.00 0.00 83.33 0.00 0.00 0.00 50.00 0.00 0.00 0.00 0.00 Dunn 19.23 0.00 0.00 0.00 21.28 0.00 0.00 58.82 0.00 0.00 0.00 Eddy 0.00 0.00 43.48 35.71 35.71 0.00 33.33 0.00 0.00 0.00 0.00 Emmons 0.00 0.00 0.00 0.00 17.86 0.00 0.00 0.00 0.00 33.33 34.00 Foster 0.00 0.00 0.00 0.00 0.00 19.61 0.00 0.00 43.48 0.00 48.00 Golden Valley 0.00 0.00 0.00 0.00 50.00 0.00 0.00 0.00 0.00 0.00 0.00 Grand Forks 12.21 6.97 7.02 4.31 1.73 10.84 5.33 5.95 8.26 2.40 4.50 Grant 22.73 0.00 0.00 0.00 47.62 0.00 0.00 0.00 0.00 0.00 0.00 Griggs 0.00 0.00 0.00 0.00 0.00 0.00 0.00 0.00 0.00 0.00 0.00 Hettinger 21.74 0.00 0.00 0.00 0.00 31.25 0.00 0.00 0.00 0.00 0.00 Kidder 0.00 0.00 68.97 0.00 0.00 0.00 0.00 0.00 0.00 0.00 0.00 LaMoure 0.00 0.00 0.00 21.28 0.00 37.04 0.00 0.00 0.00 0.00 0.00 Logan 37.04 47.62 0.00 0.00 0.00 0.00 32.26 0.00 38.46 0.00 0.00 McHenry 17.24 17.86 0.00 0.00 0.00 0.00 0.00 0.00 15.87 18.87 0.00 McIntosh 0.00 0.00 0.00 0.00 0.00 27.78 0.00 32.26 0.00 0.00 0.00 McKenzie 9.80 0.00 9.35 10.75 0.00 0.00 33.90 11.90 0.00 0.00 14.29 McLean 18.18 17.39 10.00 10.64 11.36 0.00 0.00 0.00 0.00 0.00 0.00 Mercer 6.85 0.00 17.09 9.01 0.00 9.17 0.00 12.50 0.00 0.00 27.03 Morton 0.00 0.00 6.37 10.31 16.72 0.00 0.00 6.47 0.00 6.64 3.48 Mountrail 32.61 0.00 0.00 0.00 10.64 10.53 9.09 10.20 0.00 21.51 0.00 Nelson 0.00 0.00 0.00 0.00 0.00 0.00 0.00 0.00 115.38 0.00 0.00 Oliver 0.00 0.00 0.00 0.00 0.00 0.00 62.50 0.00 0.00 0.00 0.00 Pembina 0.00 0.00 0.00 21.98 0.00 0.00 0.00 20.83 13.70 25.64 0.00 Pierce 0.00 19.23 0.00 0.00 0.00 22.22 0.00 0.00 0.00 0.00 25.64 Ramsey 0.00 5.88 4.88 5.68 12.20 11.83 0.00 0.00 6.41 7.58 0.00 Ransom 0.00 0.00 0.00 0.00 0.00 0.00 15.38 0.00 43.48 0.00 18.18 Renville 0.00 0.00 0.00 0.00 0.00 0.00 0.00 0.00 0.00 0.00 0.00 Richland 0.00 0.00 0.00 0.00 0.00 0.00 0.00 0.00 0.00 14.56 0.00 Rolette 13.11 3.19 12.94 6.60 6.54 7.22 6.67 6.87 11.24 4.05 14.49 Sargent 15.63 0.00 0.00 17.24 0.00 0.00 0.00 21.28 0.00 0.00 0.00 Sheridan 0.00 0.00 0.00 83.33 0.00 0.00 0.00 0.00 0.00 0.00 0.00 Sioux 17.70 0.00 0.00 0.00 0.00 10.53 43.48 10.10 9.62 0.00 10.10 Slope 0.00 0.00 0.00 0.00 0.00 0.00 0.00 0.00 0.00 0.00 0.00 Stark 5.81 8.88 0.00 3.76 0.00 13.61 3.62 0.00 0.00 3.76 4.02 Steele 40.00 0.00 0.00 32.26 0.00 0.00 0.00 0.00 0.00 0.00 0.00 Stutsman 0.00 0.00 0.00 7.14 7.97 8.26 0.00 0.00 0.00 12.82 10.42 Towner 0.00 0.00 0.00 0.00 0.00 0.00 29.41 0.00 0.00 0.00 0.00 Traill 0.00 0.00 0.00 35.29 0.00 0.00 0.00 8.77 0.00 0.00 0.00 Walsh 11.43 11.76 6.67 0.00 19.87 6.58 0.00 15.38 6.29 0.00 0.00 Ward 7.87 9.82 6.03 4.91 2.90 6.97 6.83 1.95 3.15 3.43 11.68 Wells 0.00 0.00 0.00 0.00 0.00 0.00 0.00 0.00 0.00 22.22 22.22 Williams 6.85 11.19 11.67 0.00 3.58 4.05 0.00 17.24 4.18 0.00 0.00 North Dakota 7.35 5.63 5.78 5.98 5.59 7.90 5.03 5.26 6.18 5.11 5.99
Source: NDDoH, Division of Vital Records

90
Table 12: Infant Deaths by County
County 1990 1991 1992 1993 1994 1995 1996 1997 1998 1999 2000 Adams 0 0 1 1 0 0 0 0 2 0 0 Barnes 3 1 1 3 0 1 0 0 2 0 0 Benson 3 3 1 2 0 0 1 1 0 0 0 Billings 0 0 0 0 0 0 0 0 0 0 0 Bottineau 1 0 1 1 0 0 0 1 1 1 1 Bowman 0 0 0 0 1 0 1 0 0 0 0 Burke 1 0 0 0 0 1 0 0 0 0 0 Burleigh 3 12 7 8 4 10 4 9 11 6 3 Cass 15 6 5 8 12 8 7 9 15 7 17 Cavalier 0 0 2 0 0 0 0 0 0 0 0 Dickey 1 0 0 0 1 0 0 0 0 1 0 Divide 1 0 1 0 0 0 0 0 1 0 0 Dunn 1 0 0 0 1 0 0 0 0 1 0 Eddy 1 0 0 0 2 0 0 0 0 0 1 Emmons 1 0 0 0 0 1 0 0 0 0 0 Foster 1 1 0 1 0 0 0 0 0 0 0 Golden Valley 0 0 0 0 0 0 0 0 0 0 0 Grand Forks 13 2 8 9 6 4 3 5 6 5 6 Grant 0 0 0 0 0 0 0 1 2 0 0 Griggs 1 0 0 0 0 0 0 0 0 0 1 Hettinger 0 0 0 0 0 0 0 0 1 0 1 Kidder 0 0 0 0 0 1 0 0 0 0 0 LaMoure 1 0 1 1 0 0 1 1 0 0 0 Logan 0 0 0 0 0 0 1 1 0 0 0 McHenry 1 1 2 1 1 0 1 0 0 0 0 McIntosh 1 0 0 1 0 2 0 0 0 0 0 McKenzie 0 0 1 1 0 1 2 0 1 3 1 McLean 0 0 1 2 0 1 0 0 0 0 1 Mercer 0 3 1 0 0 2 0 0 0 0 1 Morton 0 2 2 3 3 4 1 0 0 2 3 Mountrail 1 0 1 0 1 0 3 2 1 1 2 Nelson 0 0 1 1 0 0 1 0 1 0 0 Oliver 0 0 0 0 0 0 0 0 1 0 0 Pembina 0 1 0 0 0 1 0 4 1 1 0 Pierce 1 1 0 0 0 3 1 0 0 0 0 Ramsey 4 3 1 2 0 0 0 1 1 1 3 Ransom 0 0 0 0 0 0 0 0 0 1 0 Renville 0 0 0 0 0 0 0 0 0 0 0 Richland 1 1 1 1 2 1 2 1 2 3 0 Rolette 4 5 3 2 3 7 2 1 3 2 5 Sargent 0 0 0 0 0 0 0 1 0 0 0 Sheridan 0 2 0 0 0 0 0 1 0 0 0 Sioux 3 1 6 1 2 0 1 0 3 3 0 Slope 0 0 0 0 0 0 0 0 0 0 0 Stark 2 4 2 4 5 2 3 3 2 2 2 Steele 0 0 0 3 0 0 0 0 0 0 0 Stutsman 0 2 1 2 1 1 0 2 1 1 0 Towner 0 0 0 0 3 0 0 0 0 0 0 Traill 2 1 1 0 0 1 0 2 1 1 3 Walsh 1 2 3 3 0 0 0 1 1 1 1 Ward 6 13 12 5 13 8 8 5 6 8 7 Wells 0 0 0 0 0 0 0 0 0 0 Williams 1 5 2 3 1 1 1 0 2 1 2 North Dakota 75 72 69 69 62 61 44 52 68 52 61 Source: NDDoH, Division of Vital Records
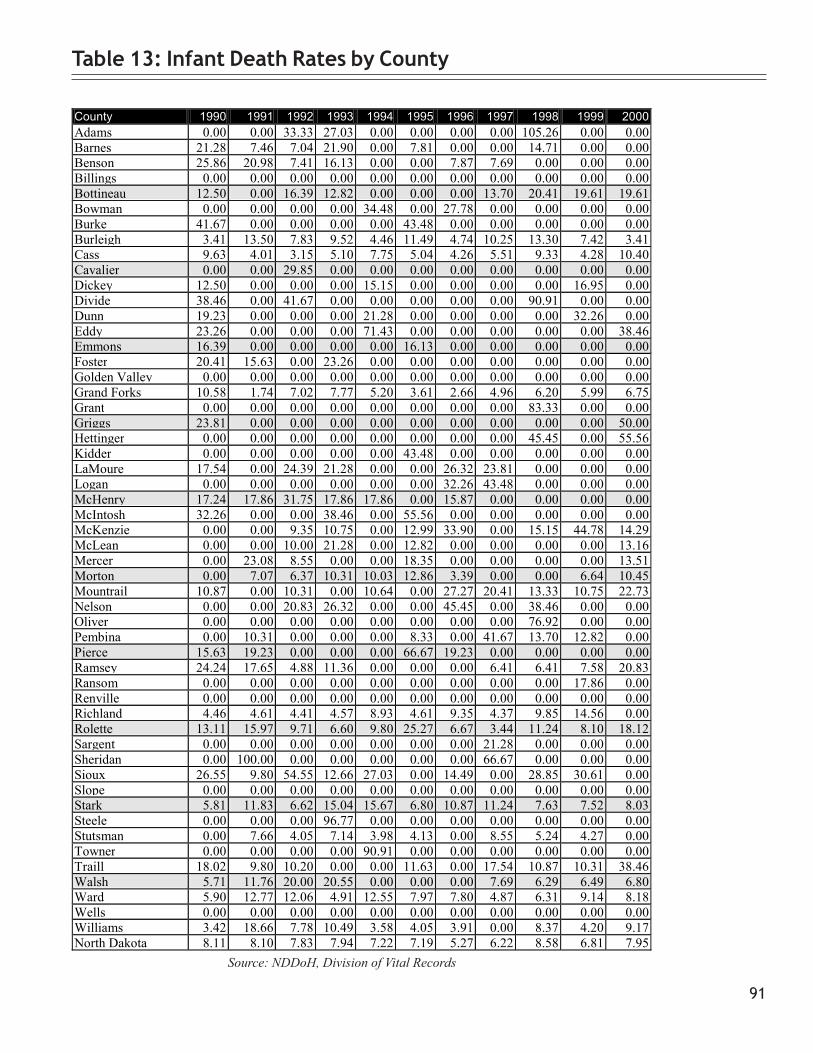
91
Table 13: Infant Death Rates by County
Source: NDDoH, Division of Vital Records
County 1990 1991 1992 1993 1994 1995 1996 1997 1998 1999 2000 Adams 0.00 0.00 33.33 27.03 0.00 0.00 0.00 0.00 105.26 0.00 0.00 Barnes 21.28 7.46 7.04 21.90 0.00 7.81 0.00 0.00 14.71 0.00 0.00 Benson 25.86 20.98 7.41 16.13 0.00 0.00 7.87 7.69 0.00 0.00 0.00 Billings 0.00 0.00 0.00 0.00 0.00 0.00 0.00 0.00 0.00 0.00 0.00 Bottineau 12.50 0.00 16.39 12.82 0.00 0.00 0.00 13.70 20.41 19.61 19.61 Bowman 0.00 0.00 0.00 0.00 34.48 0.00 27.78 0.00 0.00 0.00 0.00 Burke 41.67 0.00 0.00 0.00 0.00 43.48 0.00 0.00 0.00 0.00 0.00 Burleigh 3.41 13.50 7.83 9.52 4.46 11.49 4.74 10.25 13.30 7.42 3.41 Cass 9.63 4.01 3.15 5.10 7.75 5.04 4.26 5.51 9.33 4.28 10.40 Cavalier 0.00 0.00 29.85 0.00 0.00 0.00 0.00 0.00 0.00 0.00 0.00 Dickey 12.50 0.00 0.00 0.00 15.15 0.00 0.00 0.00 0.00 16.95 0.00 Divide 38.46 0.00 41.67 0.00 0.00 0.00 0.00 0.00 90.91 0.00 0.00 Dunn 19.23 0.00 0.00 0.00 21.28 0.00 0.00 0.00 0.00 32.26 0.00 Eddy 23.26 0.00 0.00 0.00 71.43 0.00 0.00 0.00 0.00 0.00 38.46 Emmons 16.39 0.00 0.00 0.00 0.00 16.13 0.00 0.00 0.00 0.00 0.00 Foster 20.41 15.63 0.00 23.26 0.00 0.00 0.00 0.00 0.00 0.00 0.00 Golden Valley 0.00 0.00 0.00 0.00 0.00 0.00 0.00 0.00 0.00 0.00 0.00 Grand Forks 10.58 1.74 7.02 7.77 5.20 3.61 2.66 4.96 6.20 5.99 6.75 Grant 0.00 0.00 0.00 0.00 0.00 0.00 0.00 0.00 83.33 0.00 0.00 Griggs 23.81 0.00 0.00 0.00 0.00 0.00 0.00 0.00 0.00 0.00 50.00 Hettinger 0.00 0.00 0.00 0.00 0.00 0.00 0.00 0.00 45.45 0.00 55.56 Kidder 0.00 0.00 0.00 0.00 0.00 43.48 0.00 0.00 0.00 0.00 0.00 LaMoure 17.54 0.00 24.39 21.28 0.00 0.00 26.32 23.81 0.00 0.00 0.00 Logan 0.00 0.00 0.00 0.00 0.00 0.00 32.26 43.48 0.00 0.00 0.00 McHenry 17.24 17.86 31.75 17.86 17.86 0.00 15.87 0.00 0.00 0.00 0.00 McIntosh 32.26 0.00 0.00 38.46 0.00 55.56 0.00 0.00 0.00 0.00 0.00 McKenzie 0.00 0.00 9.35 10.75 0.00 12.99 33.90 0.00 15.15 44.78 14.29 McLean 0.00 0.00 10.00 21.28 0.00 12.82 0.00 0.00 0.00 0.00 13.16 Mercer 0.00 23.08 8.55 0.00 0.00 18.35 0.00 0.00 0.00 0.00 13.51 Morton 0.00 7.07 6.37 10.31 10.03 12.86 3.39 0.00 0.00 6.64 10.45 Mountrail 10.87 0.00 10.31 0.00 10.64 0.00 27.27 20.41 13.33 10.75 22.73 Nelson 0.00 0.00 20.83 26.32 0.00 0.00 45.45 0.00 38.46 0.00 0.00 Oliver 0.00 0.00 0.00 0.00 0.00 0.00 0.00 0.00 76.92 0.00 0.00 Pembina 0.00 10.31 0.00 0.00 0.00 8.33 0.00 41.67 13.70 12.82 0.00 Pierce 15.63 19.23 0.00 0.00 0.00 66.67 19.23 0.00 0.00 0.00 0.00 Ramsey 24.24 17.65 4.88 11.36 0.00 0.00 0.00 6.41 6.41 7.58 20.83 Ransom 0.00 0.00 0.00 0.00 0.00 0.00 0.00 0.00 0.00 17.86 0.00 Renville 0.00 0.00 0.00 0.00 0.00 0.00 0.00 0.00 0.00 0.00 0.00 Richland 4.46 4.61 4.41 4.57 8.93 4.61 9.35 4.37 9.85 14.56 0.00 Rolette 13.11 15.97 9.71 6.60 9.80 25.27 6.67 3.44 11.24 8.10 18.12 Sargent 0.00 0.00 0.00 0.00 0.00 0.00 0.00 21.28 0.00 0.00 0.00 Sheridan 0.00 100.00 0.00 0.00 0.00 0.00 0.00 66.67 0.00 0.00 0.00 Sioux 26.55 9.80 54.55 12.66 27.03 0.00 14.49 0.00 28.85 30.61 0.00 Slope 0.00 0.00 0.00 0.00 0.00 0.00 0.00 0.00 0.00 0.00 0.00 Stark 5.81 11.83 6.62 15.04 15.67 6.80 10.87 11.24 7.63 7.52 8.03 Steele 0.00 0.00 0.00 96.77 0.00 0.00 0.00 0.00 0.00 0.00 0.00 Stutsman 0.00 7.66 4.05 7.14 3.98 4.13 0.00 8.55 5.24 4.27 0.00 Towner 0.00 0.00 0.00 0.00 90.91 0.00 0.00 0.00 0.00 0.00 0.00 Traill 18.02 9.80 10.20 0.00 0.00 11.63 0.00 17.54 10.87 10.31 38.46 Walsh 5.71 11.76 20.00 20.55 0.00 0.00 0.00 7.69 6.29 6.49 6.80 Ward 5.90 12.77 12.06 4.91 12.55 7.97 7.80 4.87 6.31 9.14 8.18 Wells 0.00 0.00 0.00 0.00 0.00 0.00 0.00 0.00 0.00 0.00 0.00 Williams 3.42 18.66 7.78 10.49 3.58 4.05 3.91 0.00 8.37 4.20 9.17 North Dakota 8.11 8.10 7.83 7.94 7.22 7.19 5.27 6.22 8.58 6.81 7.95

92
Table 14: Neonatal Deaths by County
Source: NDDoH, Division of Vital Records
County 1990 1991 1992 1993 1994 1995 1996 1997 1998 1999 2000 Adams 0 0 1 0 0 0 0 0 0 0 0 Barnes 2 1 1 3 0 0 0 0 2 0 0 Benson 1 1 0 1 0 0 1 0 0 0 0 Billings 0 0 0 0 0 0 0 0 0 0 0 Bottineau 1 0 0 1 0 0 0 0 1 1 1 Bowman 0 0 0 0 0 0 1 0 0 0 0 Burke 1 0 0 0 0 0 0 0 0 0 0 Burleigh 3 7 5 5 2 5 3 7 6 5 1 Cass 10 4 3 6 11 6 7 4 9 4 12 Cavalier 0 0 1 0 0 0 0 0 0 0 0 Dickey 1 0 0 0 1 0 0 0 0 1 0 Divide 1 0 1 0 0 0 0 0 0 0 0 Dunn 1 0 0 0 0 0 0 0 0 0 0 Eddy 1 0 0 0 2 0 0 0 0 0 0 Emmons 1 0 0 0 0 1 0 0 0 0 1 Foster 1 0 0 1 0 0 0 0 0 0 0 Golden Valley 0 0 0 0 0 0 0 0 0 0 0 Grand Forks 8 1 5 4 4 3 0 1 4 2 5 Grant 0 0 0 0 0 0 0 0 2 0 0 Griggs 1 0 0 0 0 0 0 0 0 0 1 Hettinger 0 0 0 0 0 0 0 0 1 0 0 Kidder 0 0 0 0 0 1 0 0 0 0 0 LaMoure 1 0 1 0 0 0 1 1 0 0 0 Logan 0 0 0 0 0 0 1 1 0 0 0 McHenry 0 0 1 1 1 0 1 0 0 0 0 McIntosh 0 0 0 1 0 0 0 0 0 0 0 McKenzie 0 0 0 0 0 1 2 0 0 0 0 McLean 0 0 1 0 0 0 0 0 0 2 0 Mercer 0 1 1 0 0 1 0 0 0 0 1 Morton 0 1 1 1 1 4 0 0 0 1 1 Mountrail 1 0 1 0 0 0 1 1 1 1 2 Nelson 0 0 1 0 0 0 1 0 1 0 0 Oliver 0 0 0 0 0 0 0 0 1 0 0 Pembina 0 0 0 0 0 0 0 4 1 1 0 Pierce 1 0 0 0 0 1 0 0 0 0 0 Ramsey 2 2 1 0 0 0 0 0 0 0 3 Ransom 0 0 0 0 0 0 0 0 0 0 0 Renville 0 0 0 0 0 0 0 0 0 0 0 Richland 1 1 1 1 1 0 0 1 1 2 0 Rolette 2 3 3 1 2 4 1 0 0 1 3 Sargent 0 0 0 0 0 0 0 0 0 0 0 Sheridan 0 2 0 0 0 0 0 1 0 0 0 Sioux 0 0 3 0 1 0 1 0 3 2 0 Slope 0 0 0 0 0 0 0 0 0 0 0 Stark 1 3 1 4 5 1 2 2 1 2 2 Steele 0 0 0 2 0 0 0 0 0 0 0 Stutsman 0 0 1 1 1 1 0 0 1 0 0 Towner 0 0 0 0 3 0 0 0 0 0 0 Traill 2 1 1 0 0 1 0 2 0 0 1 Walsh 1 1 3 2 0 0 0 1 1 1 1 Ward 6 9 5 2 9 4 7 4 5 7 6 Wells 0 0 0 0 0 0 0 0 0 0 0 Williams 1 3 1 3 0 1 1 0 2 1 1 North Dakota 52 41 44 40 44 35 31 30 43 34 42

93
Table 15: Neonatal Death Rates by County
Source: NDDoH, Division of Vital Records
County 1990 1991 1992 1993 1994 1995 1996 1997 1998 1999 2000 Adams 0.00 0.00 33.33 0.00 0.00 0.00 0.00 0.00 0.00 0.00 0.00 Barnes 14.18 7.46 7.04 21.90 0.00 0.00 0.00 0.00 14.71 0.00 0.00 Benson 8.62 6.99 0.00 8.06 0.00 0.00 7.87 0.00 0.00 0.00 0.00 Billings 0.00 0.00 0.00 0.00 0.00 0.00 0.00 0.00 0.00 0.00 0.00 Bottineau 12.50 0.00 0.00 12.82 0.00 0.00 0.00 0.00 20.41 19.61 19.61 Bowman 0.00 0.00 0.00 0.00 0.00 0.00 27.78 0.00 0.00 0.00 0.00 Burke 41.67 0.00 0.00 0.00 0.00 0.00 0.00 0.00 0.00 0.00 0.00 Burleigh 3.41 7.87 5.59 5.95 2.23 5.75 3.56 7.97 7.26 6.18 1.14 Cass 6.42 2.67 1.89 3.82 7.10 3.78 4.26 2.45 5.60 2.45 7.34 Cavalier 0.00 0.00 14.93 0.00 0.00 0.00 0.00 0.00 0.00 0.00 0.00 Dickey 12.50 0.00 0.00 0.00 15.15 0.00 0.00 0.00 0.00 16.95 0.00 Divide 38.46 0.00 41.67 0.00 0.00 0.00 0.00 0.00 0.00 0.00 0.00 Dunn 19.23 0.00 0.00 0.00 0.00 0.00 0.00 0.00 0.00 0.00 0.00 Eddy 23.26 0.00 0.00 0.00 71.43 0.00 0.00 0.00 0.00 0.00 0.00 Emmons 16.39 0.00 0.00 0.00 0.00 16.13 0.00 0.00 0.00 0.00 34.48 Foster 20.41 0.00 0.00 23.26 0.00 0.00 0.00 0.00 0.00 0.00 0.00 Golden Valley 0.00 0.00 0.00 0.00 0.00 0.00 0.00 0.00 0.00 0.00 0.00 Grand Forks 6.51 0.87 4.39 3.45 3.47 2.71 0.00 1.00 4.13 2.40 5.62 Grant 0.00 0.00 0.00 0.00 0.00 0.00 0.00 0.00 83.33 0.00 0.00 Griggs 23.81 0.00 0.00 0.00 0.00 0.00 0.00 0.00 0.00 0.00 50.00 Hettinger 0.00 0.00 0.00 0.00 0.00 0.00 0.00 0.00 45.45 0.00 0.00 Kidder 0.00 0.00 0.00 0.00 0.00 43.48 0.00 0.00 0.00 0.00 0.00 LaMoure 17.54 0.00 24.39 0.00 0.00 0.00 26.32 23.81 0.00 0.00 0.00 Logan 0.00 0.00 0.00 0.00 0.00 0.00 32.26 43.48 0.00 0.00 0.00 McHenry 0.00 0.00 15.87 17.86 17.86 0.00 15.87 0.00 0.00 0.00 0.00 McIntosh 0.00 0.00 0.00 38.46 0.00 0.00 0.00 0.00 0.00 0.00 0.00 McKenzie 0.00 0.00 0.00 0.00 0.00 12.99 33.90 0.00 0.00 0.00 0.00 McLean 0.00 0.00 10.00 0.00 0.00 0.00 0.00 0.00 0.00 21.28 0.00 Mercer 0.00 7.69 8.55 0.00 0.00 9.17 0.00 0.00 0.00 0.00 13.51 Morton 0.00 3.53 3.18 3.44 3.34 12.86 0.00 0.00 0.00 3.32 3.48 Mountrail 10.87 0.00 10.31 0.00 0.00 0.00 9.09 10.20 13.33 10.75 22.73 Nelson 0.00 0.00 20.83 0.00 0.00 0.00 45.45 0.00 38.46 0.00 0.00 Oliver 0.00 0.00 0.00 0.00 0.00 0.00 0.00 0.00 76.92 0.00 0.00 Pembina 0.00 0.00 0.00 0.00 0.00 0.00 0.00 41.67 13.70 12.82 0.00 Pierce 15.63 0.00 0.00 0.00 0.00 22.22 0.00 0.00 0.00 0.00 0.00 Ramsey 12.12 11.76 4.88 0.00 0.00 0.00 0.00 0.00 0.00 0.00 20.83 Ransom 0.00 0.00 0.00 0.00 0.00 0.00 0.00 0.00 0.00 0.00 0.00 Renville 0.00 0.00 0.00 0.00 0.00 0.00 0.00 0.00 0.00 0.00 0.00 Richland 4.46 4.61 4.41 4.57 4.46 0.00 0.00 4.37 4.93 9.71 0.00 Rolette 6.56 9.58 9.71 3.30 6.54 14.44 3.33 0.00 0.00 4.05 10.87 Sargent 0.00 0.00 0.00 0.00 0.00 0.00 0.00 0.00 0.00 0.00 0.00 Sheridan 0.00 100.00 0.00 0.00 0.00 0.00 0.00 66.67 0.00 0.00 0.00 Sioux 0.00 0.00 27.27 0.00 13.51 0.00 14.49 0.00 28.85 20.41 0.00 Slope 0.00 0.00 0.00 0.00 0.00 0.00 0.00 0.00 0.00 0.00 0.00 Stark 2.91 8.88 3.31 15.04 15.67 3.40 7.25 7.49 3.82 7.52 8.03 Steele 0.00 0.00 0.00 64.52 0.00 0.00 0.00 0.00 0.00 0.00 0.00 Stutsman 0.00 0.00 4.05 3.57 3.98 4.13 0.00 0.00 5.24 0.00 0.00 Towner 0.00 0.00 0.00 0.00 90.91 0.00 0.00 0.00 0.00 0.00 0.00 Traill 18.02 9.80 10.20 0.00 0.00 11.63 0.00 17.54 0.00 0.00 12.82 Walsh 5.71 5.88 20.00 13.70 0.00 0.00 0.00 7.69 6.29 6.49 6.80 Ward 5.90 8.84 5.03 1.96 8.69 3.98 6.83 3.90 5.26 8.00 7.01 Wells 0.00 0.00 0.00 0.00 0.00 0.00 0.00 0.00 0.00 0.00 0.00 Williams 3.42 11.19 3.89 10.49 0.00 4.05 3.91 0.00 8.37 4.20 4.59 North Dakota 5.62 4.61 4.99 4.60 5.13 4.13 3.71 3.59 5.42 4.45 5.47

94
Table 16: Breastfeeding Rates at Hospital Discharge by County
1998 1999 2000 County Births Number Percent Births Number Percent Births Number Percent Adams 19 10 52.6% 16 12 75.0% 22 14 63.6% Barnes 136 70 51.5% 112 53 47.3% 104 60 57.7% Benson 121 34 28.1% 135 39 28.9% 123 44 35.8% Billings 7 3 42.9% 6 4 66.7% 5 5 100.0% Bottineau 48 23 47.9% 51 23 45.1% 50 27 54.0% Bowman 33 19 57.6% 18 13 72.2% 32 25 78.1% Burke 9 3 33.3% 17 5 29.4% 14 6 42.9% Burleigh 820 457 55.7% 810 463 57.2% 869 473 54.4% Cass 1,602 860 53.7% 1,635 859 52.5% 1595 883 55.4% Cavalier 41 16 39.0% 30 16 53.3% 34 18 52.9% Dickey 34 23 67.6% 59 20 33.9% 46 26 56.5% Divide 11 6 54.5% 12 5 41.7% 11 8 72.7% Dunn 24 15 62.5% 31 21 67.7% 31 17 54.8% Eddy 32 17 53.1% 27 18 66.7% 26 17 65.4% Emmons 42 23 54.8% 30 22 73.3% 28 15 53.6% Foster 46 17 37.0% 40 22 55.0% 29 13 44.8% Golden Valley 16 10 62.5% 15 9 60.0% 14 10 71.4% Grand Forks 959 593 61.8% 836 522 62.4% 859 483 56.2% Grant 23 11 47.8% 19 13 68.4% 16 9 56.3% Griggs 18 8 44.4% 19 8 42.1% 19 9 47.4% Hettinger 21 11 52.4% 28 16 57.1% 17 6 35.3% Kidder 17 10 58.8% 27 13 48.1% 26 8 30.8% LaMoure 42 27 64.3% 24 17 70.8% 39 22 56.4% Logan 26 15 57.7% 17 6 35.3% 17 13 76.5% McHenry 63 34 54.0% 53 26 49.1% 54 32 59.3% McIntosh 24 17 70.8% 28 12 42.9% 26 14 53.8% McKenzie 62 30 48.4% 68 27 39.7% 61 31 50.8% McLean 87 43 49.4% 94 49 52.1% 74 41 55.4% Mercer 78 41 52.6% 69 35 50.7% 68 41 60.3% Morton 311 144 46.3% 301 133 44.2% 282 141 50.0% Mountrail 75 30 40.0% 93 37 39.8% 85 34 40.0% Nelson 26 12 46.2% 21 12 57.1% 33 13 39.4% Oliver 13 7 53.8% 17 9 52.9% 12 7 58.3% Pembina 72 39 54.2% 78 44 56.4% 88 44 50.0% Pierce 48 27 56.3% 44 22 50.0% 39 25 64.1% Ramsey 154 70 45.5% 132 63 47.7% 137 77 56.2% Ransom 65 34 52.3% 56 33 58.9% 48 24 50.0% Renville 26 14 53.8% 18 11 61.1% 14 11 78.6% Richland 46 24 52.2% 206 38 18.4% 63 35 55.6% Rolette 266 52 19.5% 247 41 16.6% 262 46 17.6% Sargent 35 17 48.6% 42 18 42.9% 30 17 56.7% Sheridan 10 8 80.0% 9 4 44.4% 9 3 33.3% Sioux 104 34 32.7% 98 29 29.6% 97 24 24.7% Slope 9 7 77.8% 7 2 28.6% 6 4 66.7% Stark 261 120 46.0% 267 127 47.6% 243 135 55.6% Steele 20 9 45.0% 20 8 40.0% 11 6 54.5% Stutsman 191 89 46.6% 235 112 47.7% 190 100 52.6% Towner 21 7 33.3% 15 6 40.0% 13 3 23.1% Traill 92 60 65.2% 97 47 48.5% 75 33 44.0% Walsh 159 84 52.8% 154 73 47.4% 145 76 52.4% Ward 948 509 53.7% 876 486 55.5% 835 493 59.0% Wells 35 16 45.7% 45 24 53.3% 45 26 57.8% Williams 239 125 52.3% 238 132 55.5% 208 128 61.5% N.D. Residents 7,687 3,984 51.8% 7642 3859 50.5% 7279 3875 53.2% Out-of-State Residents 1,478 758 51.3% 1471 718 48.8% 1379 723 52.4% Overall Total 9,165 4,742 51.7% 9113 4577 50.2% 8658 4598 53.1%
Source: NDDoH, Division of Vital Records

95
1995 1996 1997 1998 1999 2000 County Deaths Rate Deaths Rate Deaths Rate Deaths Rate Deaths Rate Deaths Rate Adams 0 0.00 0 0.00 0 0 1 119.19 0 0.00 0 0.00 Barnes 1 29.31 1 29.31 1 29.31 3 87.92 0 0.00 0 0.00 Benson 1 39.05 6 234.28 0 0 2 78.09 5 195.24 2 77.07 Billings 0 0.00 1 269.54 0 0 0 0.00 0 0.00 1 436.68 Bottineau 0 0.00 0 0.00 0 0 0 0.00 2 87.57 0 0.00 Bowman 1 97.09 0 0.00 0 0 1 97.09 0 0.00 0 0.00 Burke 1 130.55 1 130.55 2 261.1 0 0.00 0 0.00 0 0.00 Burleigh 9 50.40 10 56.00 6 33.6 3 16.80 5 28.00 5 26.63 Cass 12 42.68 5 17.78 5 17.78 2 7.11 4 14.23 4 12.53 Cavalier 0 0.00 0 0.00 1 60.57 0 0.00 2 121.14 0 0.00 Dickey 1 59.42 1 59.42 0 0 1 59.42 0 0.00 3 202.57 Divide 0 0.00 0 0.00 1 144.1 0 0.00 0 0.00 0 0.00 Dunn 1 79.30 1 79.30 0 0 3 237.91 1 79.30 0 0.00 Eddy 0 0.00 0 0.00 0 0 1 131.75 0 0.00 2 290.70 Emmons 1 77.82 1 77.82 0 0 0 0.00 0 0.00 0 0.00 Foster 0 0.00 0 0.00 0 0 3 264.08 0 0.00 1 97.47 Golden Valley 0 0.00 1 148.15 1 148.2 0 0.00 1 148.15 0 0.00 Grand Forks 2 9.63 9 43.33 2 9.63 7 33.70 3 14.44 4 21.60 Grant 0 0.00 0 0.00 1 104.2 0 0.00 0 0.00 0 0.00 Griggs 2 227.27 0 0.00 0 0 1 113.64 0 0.00 0 0.00 Hettinger 0 0.00 0 0.00 1 108.8 0 0.00 1 108.81 2 302.57 Kidder 0 0.00 0 0.00 1 105.3 2 210.53 0 0.00 0 0.00 LaMoure 1 66.23 1 66.23 1 66.23 1 66.23 0 0.00 1 81.77 Logan 0 0.00 0 0.00 1 141 0 0.00 0 0.00 0 0.00 McHenry 0 0.00 0 0.00 1 54.79 0 0.00 0 0.00 0 0.00 McIntosh 0 0.00 0 0.00 0 0 0 0.00 1 111.73 0 0.00 McKenzie 4 186.57 2 93.28 1 46.64 0 0.00 3 139.93 1 54.38 McLean 1 32.22 2 64.43 1 32.22 1 32.22 2 64.43 1 42.70 Mercer 3 93.52 1 31.17 2 62.34 4 124.69 2 62.34 0 0.00 Morton 7 94.01 4 53.72 4 53.72 5 67.15 2 26.86 2 27.70 Mountrail 2 90.66 2 90.66 6 272 1 45.33 2 90.66 0 0.00 Nelson 2 186.74 0 0.00 0 0 0 0.00 1 93.37 0 0.00 Oliver 0 0.00 0 0.00 0 0 0 0.00 0 0.00 0 0.00 Pembina 1 37.40 0 0.00 1 37.4 0 0.00 1 37.40 0 0.00 Pierce 0 0.00 0 0.00 0 0 0 0.00 0 0.00 1 84.18 Ramsey 1 28.10 2 56.20 1 28.1 1 28.10 4 112.39 0 0.00 Ransom 1 62.81 1 62.81 1 62.81 1 62.81 1 62.81 0 0.00 Renville 0 0.00 1 110.38 1 110.4 0 0.00 0 0.00 1 254.08 Richland 6 107.35 1 17.89 2 17.89 1 17.89 1 17.89 2 37.83 Rolette 2 40.03 3 60.05 1 40.03 2 40.03 3 60.05 1 19.18 Sargent 1 78.37 0 0.00 1 78.37 2 156.74 0 0.00 0 0.00 Sheridan 0 0.00 0 0.00 1 191.9 0 0.00 0 0.00 1 257.07 Sioux 2 120.55 0 0.00 0 60.28 6 361.66 1 60.28 1 58.65 Slope 0 0.00 0 0.00 1 0 0 0.00 0 0.00 0 0.00 Stark 1 14.09 3 42.27 0 14.09 2 28.18 2 28.18 2 30.93 Steele 0 0.00 0 0.00 0 0 0 0.00 1 154.80 0 0.00 Stutsman 3 48.53 2 32.35 0 0 2 32.35 1 16.18 1 18.00 Towner 1 99.60 0 0.00 0 0 0 0.00 1 99.60 0 0.00 Traill 1 40.80 0 0.00 0 0 1 40.80 1 40.80 1 43.42 Walsh 3 76.43 0 0.00 3 76.43 2 50.96 3 76.43 1 30.67 Ward 8 46.24 5 28.90 7 40.46 6 34.68 7 40.46 5 30.08 Wells 1 68.63 0 0.00 0 0 0 0.00 0 0.00 0 0.00 Williams 0 0.00 1 15.21 4 60.84 5 76.05 3 45.63 5 89.72 North Dakota 84 44.97 68 36.40 64 34.26 73 39.08 67 35.87 51 29.01
Table 17: Child and Adolescent Deaths and Rates by County
Source: NDDoH, Division of Vital Records

96
Table 18: Child Deaths and Rates by County – All Causes – Ages 1 – 9
1979-1983 1984-1988 1989-1993 1994-1998 1979-1998 County Num Rate Num Rate Num Rate Num Rate Num Rate Adams 0 0.00 1 42.83 0 0.00 0 0.00 1 12.42 Barnes 1 11.40 5 58.71 3 40.89 2 32.28 11 35.69 Benson 7 102.91 6 81.61 4 61.84 2 33.06 19 71.24 Billings 0 0.00 0 0.00 0 0.00 0 0.00 0 0.00 Bottineau 0 0.00 0 0.00 1 21.25 0 0.00 1 4.87 Bowman 3 92.36 1 33.19 0 0.00 1 58.45 5 49.15 Burke 0 0.00 2 93.55 2 131.06 2 183.65 6 84.93 Burleigh 11 26.67 14 31.04 10 23.26 10 24.97 45 26.57 Cass 22 37.05 21 31.01 17 25.20 13 20.06 73 28.15 Cavalier 0 0.00 4 87.62 0 0.00 0 0.00 4 25.07 Dickey 2 41.09 0 0.00 1 27.89 0 0.00 3 18.75 Divide 1 49.68 1 51.71 1 64.35 0 0.00 3 44.90 Dunn 3 83.68 2 53.81 3 97.06 4 155.46 12 92.55 Eddy 0 0.00 1 49.41 0 0.00 0 0.00 1 13.67 Emmons 1 26.03 0 0.00 1 36.00 1 46.04 3 24.33 Foster 2 60.11 0 0.00 2 73.21 0 0.00 4 34.33 Golden Valley 1 54.76 0 0.00 0 0.00 0 0.00 1 16.19 Grand Forks 16 32.23 17 31.89 19 38.35 11 25.24 63 32.13 Grant 1 33.42 1 35.51 0 0.00 0 0.00 2 21.09 Griggs 2 86.62 0 0.00 1 49.98 1 62.77 4 48.67 Hettinger 0 0.00 1 39.09 0 0.00 1 62.70 2 22.54 Kidder 1 36.21 1 39.02 0 0.00 0 0.00 2 22.44 LaMoure 4 91.51 1 24.40 2 60.51 0 0.00 7 48.55 Logan 2 95.74 0 0.00 0 0.00 0 0.00 2 29.70 McHenry 6 115.94 1 20.12 1 25.34 0 0.00 8 46.19 McIntosh 0 0.00 1 40.88 0 0.00 0 0.00 1 11.58 McKenzie 1 14.85 2 29.18 4 76.03 3 68.24 10 43.02 McLean 5 53.41 2 22.75 4 58.94 1 17.93 12 39.32 Mercer 0 0.00 4 40.62 0 0.00 4 56.83 8 24.28 Morton 9 45.27 6 30.00 4 23.58 8 53.29 27 37.57 Mountrail 3 50.29 2 33.54 4 81.04 4 90.76 13 61.12 Nelson 2 72.44 1 36.19 1 42.77 0 0.00 4 41.42 Oliver 0 0.00 1 46.49 0 0.00 0 0.00 1 13.32 Pembina 0 0.00 0 0.00 1 16.46 0 0.00 1 3.89 Pierce 0 0.00 1 27.39 1 35.63 0 0.00 2 15.70 Ramsey 0 0.00 3 32.88 1 11.98 3 41.65 7 21.01 Ransom 1 22.67 6 140.65 0 0.00 2 63.25 9 58.03 Renville 1 40.39 0 0.00 0 0.00 1 61.12 2 23.25 Richland 2 16.30 5 37.61 3 24.64 1 9.38 11 22.73 Rolette 3 25.21 8 60.70 5 39.54 3 22.63 19 37.27 Sargent 3 76.45 1 28.86 1 36.50 1 42.88 6 48.15 Sheridan 1 58.41 1 63.73 0 0.00 0 0.00 2 36.98 Sioux 4 100.48 11 254.87 2 45.35 3 65.49 20 115.69 Slope 0 0.00 0 0.00 0 0.00 0 0.00 0 0.00 Stark 6 30.48 8 39.31 3 17.55 2 13.63 19 26.46 Steele 1 49.95 1 54.32 1 68.07 0 0.00 3 45.86 Stutsman 9 55.88 3 18.50 2 14.40 2 17.45 16 27.74 Towner 0 0.00 0 0.00 0 0.00 0 0.00 0 0.00 Traill 2 33.13 1 16.36 1 18.57 0 0.00 4 18.00 Walsh 5 49.32 9 85.42 4 42.31 3 36.41 21 54.73 Ward 14 29.55 16 32.69 10 23.99 10 26.63 50 28.48 Wells 3 68.56 1 23.56 2 59.99 2 76.89 8 54.96 Williams 7 37.51 6 29.66 6 37.20 3 21.97 22 32.03 North Dakota 168 35.38 180 36.26 128 29.19 104 26.77 580 32.25
Source: Centers for Disease Control and Prevention, National Center for Health Statistics

97
Table 19: Child Deaths and Rates – Unintentional Injury – Ages 1 – 9
1979-1983 1984-1988 1989-1993 1994-1998 1979-1998 County Number Rate Number Rate Number Rate Number Rate Number Rate Adams 0 0.00 1 42.83 0 0.00 0 0.00 1 12.42 Barnes 0 0.00 5 58.71 2 27.26 0 0.00 7 22.71 Benson 7 102.91 5 68.01 0 0.00 0 0.00 12 44.99 Billings 0 0.00 0 0.00 0 0.00 0 0.00 0 0.00 Bottineau 0 0.00 0 0.00 0 0.00 0 0.00 0 0.00 Bowman 2 61.58 1 33.19 0 0.00 1 58.45 4 39.32 Burke 0 0.00 1 46.77 2 131.06 0 0.00 3 42.46 Burleigh 4 9.70 7 15.52 3 6.98 4 9.99 18 10.63 Cass 8 13.47 5 7.38 3 4.45 3 4.63 19 7.33 Cavalier 0 0.00 1 21.91 0 0.00 0 0.00 1 6.27 Dickey 1 20.55 0 0.00 0 0.00 0 0.00 1 6.25 Divide 1 49.68 0 0.00 1 64.35 0 0.00 2 29.93 Dunn 3 83.68 2 53.81 3 97.06 3 116.60 11 84.84 Eddy 0 0.00 0 0.00 0 0.00 0 0.00 0 0.00 Emmons 0 0.00 0 0.00 0 0.00 1 46.04 1 8.11 Foster 0 0.00 0 0.00 2 73.21 0 0.00 2 17.17 Golden Valley 0 0.00 0 0.00 0 0.00 0 0.00 0 0.00 Grand Forks 8 16.12 5 9.38 1 2.02 2 4.59 16 8.16 Grant 0 0.00 0 0.00 0 0.00 0 0.00 0 0.00 Griggs 1 43.31 0 0.00 0 0.00 1 62.77 2 24.33 Hettinger 0 0.00 1 39.09 0 0.00 1 62.70 2 22.54 Kidder 1 36.21 1 39.02 0 0.00 0 0.00 2 22.44 LaMoure 3 68.63 1 24.40 1 30.26 0 0.00 5 34.68 Logan 2 95.74 0 0.00 0 0.00 0 0.00 2 29.70 McHenry 2 38.65 1 20.12 0 0.00 0 0.00 3 17.32 McIntosh 0 0.00 1 40.88 0 0.00 0 0.00 1 11.58 McKenzie 0 0.00 2 29.18 2 38.02 3 68.24 7 30.11 McLean 3 32.05 0 0.00 2 29.47 1 17.93 6 19.66 Mercer 0 0.00 1 10.15 0 0.00 0 0.00 1 3.03 Morton 3 15.09 2 10.00 2 11.79 8 53.29 15 20.87 Mountrail 1 16.76 2 33.54 0 0.00 2 45.38 5 23.51 Nelson 0 0.00 0 0.00 0 0.00 0 0.00 0 0.00 Oliver 0 0.00 0 0.00 0 0.00 0 0.00 0 0.00 Pembina 0 0.00 0 0.00 0 0.00 0 0.00 0 0.00 Pierce 0 0.00 1 27.39 1 35.63 0 0.00 2 15.70 Ramsey 0 0.00 1 10.96 0 0.00 2 27.77 3 9.00 Ransom 0 0.00 4 93.76 0 0.00 1 31.63 5 32.24 Renville 0 0.00 0 0.00 0 0.00 1 61.12 1 11.62 Richland 1 8.15 1 7.52 0 0.00 0 0.00 2 4.13 Rolette 3 25.21 6 45.53 3 23.73 1 7.54 13 25.50 Sargent 1 25.48 0 0.00 1 36.50 0 0.00 2 16.05 Sheridan 1 58.41 0 0.00 0 0.00 0 0.00 1 18.49 Sioux 2 50.24 7 162.19 1 22.68 2 43.66 12 69.41 Slope 0 0.00 0 0.00 0 0.00 0 0.00 0 0.00 Stark 3 15.24 5 24.57 1 5.85 1 6.81 10 13.93 Steele 1 49.95 1 54.32 0 0.00 0 0.00 2 30.58 Stutsman 4 24.84 0 0.00 0 0.00 1 8.72 5 8.67 Towner 0 0.00 0 0.00 0 0.00 0 0.00 0 0.00 Traill 1 16.57 0 0.00 1 18.57 0 0.00 2 9.00 Walsh 0 0.00 3 28.47 0 0.00 0 0.00 3 7.82 Ward 6 12.66 7 14.30 5 11.99 5 13.31 23 13.10 Wells 2 45.70 1 23.56 2 59.99 1 38.45 6 41.22 Williams 4 21.44 1 4.94 1 6.20 2 14.65 8 11.65 North Dakota 79 16.64 83 16.72 40 9.12 47 12.10 249 13.85
Source: Centers for Disease Control and Prevention, National Center for Health Statistics

98
Table 20: Child Deaths and Rates – Motor Vehicles – Ages 1 - 9
1979-1983 1984-1988 1989-1993 1994-1998 1979-1998 County Number Rate Number Rate Number Rate Number Rate Number Rate Adams 0 0.00 1 42.83 0 0.00 0 0.00 1 12.42 Barnes 0 0.00 5 58.71 0 0.00 0 0.00 5 16.22 Benson 3 44.10 1 13.60 0 0.00 0 0.00 4 15.00 Billings 0 0.00 0 0.00 0 0.00 0 0.00 0 0.00 Bottineau 0 0.00 0 0.00 0 0.00 0 0.00 0 0.00 Bowman 0 0.00 0 0.00 0 0.00 0 0.00 0 0.00 Burke 0 0.00 0 0.00 0 0.00 0 0.00 0 0.00 Burleigh 2 4.85 1 2.22 3 6.98 1 2.50 7 4.13 Cass 3 5.05 3 4.43 1 1.48 1 1.54 8 3.08 Cavalier 0 0.00 1 21.91 0 0.00 0 0.00 1 6.27 Dickey 0 0.00 0 0.00 0 0.00 0 0.00 0 0.00 Divide 0 0.00 0 0.00 1 64.35 0 0.00 1 14.82 Dunn 1 27.89 1 26.90 2 64.70 2 77.73 6 46.05 Eddy 0 0.00 0 0.00 0 0.00 0 0.00 0 0.00 Emmons 0 0.00 0 0.00 0 0.00 0 0.00 0 0.00 Foster 0 0.00 0 0.00 0 0.00 0 0.00 0 0.00 Golden Valley 0 0.00 0 0.00 0 0.00 0 0.00 0 0.00 Grand Forks 4 8.06 3 5.63 1 2.02 0 0.00 8 4.08 Grant 0 0.00 0 0.00 0 0.00 0 0.00 0 0.00 Griggs 0 0.00 0 0.00 0 0.00 0 0.00 0 0.00 Hettinger 0 0.00 0 0.00 0 0.00 0 0.00 0 0.00 Kidder 0 0.00 0 0.00 0 0.00 0 0.00 0 0.00 LaMoure 3 68.63 1 24.40 0 0.00 0 0.00 4 27.74 Logan 0 0.00 0 0.00 0 0.00 0 0.00 0 0.00 McHenry 0 0.00 0 0.00 0 0.00 0 0.00 0 0.00 McIntosh 0 0.00 0 0.00 0 0.00 0 0.00 0 0.00 McKenzie 0 0.00 2 29.18 1 19.01 0 0.00 3 12.89 McLean 1 10.68 0 0.00 1 14.73 1 17.93 3 9.83 Mercer 0 0.00 1 10.15 0 0.00 0 0.00 1 3.03 Morton 1 5.03 1 5.00 0 0.00 1 6.66 3 4.17 Mountrail 1 16.76 0 0.00 0 0.00 0 0.00 1 4.70 Nelson 0 0.00 0 0.00 0 0.00 0 0.00 0 0.00 Oliver 0 0.00 0 0.00 0 0.00 0 0.00 0 0.00 Pembina 0 0.00 0 0.00 0 0.00 0 0.00 0 0.00 Pierce 0 0.00 1 27.39 0 0.00 0 0.00 1 7.85 Ramsey 0 0.00 1 10.96 0 0.00 0 0.00 1 3.00 Ransom 0 0.00 1 23.44 0 0.00 0 0.00 1 6.45 Renville 0 0.00 0 0.00 0 0.00 1 61.12 1 11.62 Richland 1 8.15 1 7.52 0 0.00 0 0.00 2 4.13 Rolette 2 16.81 2 15.18 1 7.91 0 0.00 5 9.81 Sargent 1 25.48 0 0.00 0 0.00 0 0.00 1 8.03 Sheridan 0 0.00 0 0.00 0 0.00 0 0.00 0 0.00 Sioux 1 25.12 3 69.51 0 0.00 2 43.66 6 34.71 Slope 0 0.00 0 0.00 0 0.00 0 0.00 0 0.00 Stark 2 10.16 1 4.91 0 0.00 1 6.81 4 5.57 Steele 0 0.00 0 0.00 0 0.00 0 0.00 0 0.00 Stutsman 3 18.63 0 0.00 0 0.00 0 0.00 3 5.20 Towner 0 0.00 0 0.00 0 0.00 0 0.00 0 0.00 Traill 0 0.00 0 0.00 0 0.00 0 0.00 0 0.00 Walsh 0 0.00 2 18.98 0 0.00 0 0.00 2 5.21 Ward 3 6.33 3 6.13 1 2.40 3 7.99 10 5.70 Wells 0 0.00 0 0.00 2 59.99 0 0.00 2 13.68 Williams 0 0.00 0 0.00 0 0.00 1 7.32 1 1.46 North Dakota 32 6.74 36 7.25 14 3.19 14 3.60 96 5.34
Source: Centers for Disease Control and Prevention, National Center for Health Statistics

99
Table 21: Children Receiving Food Stamps by County
Source: Kids Count
1995 1996 1997 1998 1999 County Number Percent Number Percent Number Percent Number Percent Number Percent Adams 87 1.3% 75 11.4% 62 10.0% 55 8.9% 41 6.9% Barnes 468 16.0% 479 16.9% 490 17.7% 440 15.8% 413 15.1% Benson 1,242 51.7% 1,198 50.7% 1,092 47.8% 1,065 45.6% 1,084 46.2% Billings 12 3.5% 9 2.7% 9 2.8% 16 5.2% 19 6.3% Bottineau 317 16.4% 263 14.5% 262 14.8% 253 15.0% 244 14.5% Bowman 66 7.8% 52 6.3% 44 5.4% 51 6.5% 65 8.4% Burke 78 13.2% 72 13.2% 66 12.9% 57 12.0% 53 11.7% Burleigh 2,744 15.8% 2,464 14.2% 2,465 14.2% 2,391 14.1% 2,464 14.5% Cass 3,902 14.2% 3,746 13.5% 3,585 13.0% 3,569 12.7% 3,697 13.1% Cavalier 118 8.3% 119 9.4% 124 10.3% 133 11.5% 145 13.4% Dickey 297 20.7% 237 17.8% 217 16.7% 220 16.7% 209 16.0% Divide 80 13.9% 67 12.6% 51 10.3% 61 12.7% 44 9.7% Dunn 122 10.8% 114 10.6% 111 10.8% 119 12.0% 113 11.9% Eddy 104 15.5% 100 15.4% 84 13.2% 82 12.5% 70 11.1% Emmons 91 8.2% 67 6.5% 64 6.4% 62 6.6% 44 4.8% Foster 130 13.0% 145 15.1% 161 17.6% 120 13.0% 112 12.4% Golden Valley 53 9.5% 51 9.6% 58 11.1% 70 14.2% 59 12.4% Grand Forks 2,976 15.4% 2,790 14.7% 2,582 14.2% 2,733 15.7% 2,810 16.8% Grant 100 12.6% 100 13.5% 95 13.5% 102 15.2% 87 13.7% Griggs 121 16.4% 110 16.0% 91 14.2% 81 12.5% 82 13.2% Hettinger 115 15.5% 100 14.3% 90 13.3% 61 9.5% 41 6.6% Kidder 79 9.9% 66 8.8% 64 8.9% 56 8.3% 43 6.6% LaMoure 128 9.9% 130 10.8% 118 10.1% 89 7.9% 80 7.3% Logan 53 9.1% 49 9.2% 45 8.6% 54 10.7% 42 8.9% McHenry 249 16.0% 254 17.1% 231 15.9% 240 17.0% 230 16.6% McIntosh 94 12.8% 71 10.2% 80 11.9% 84 14.1% 65 11.1% McKenzie 604 32.5% 615 34.2% 619 35.3% 532 31.0% 582 35.0% McLean 377 14.0% 329 12.6% 294 11.7% 322 13.1% 344 14.2% Mercer 200 7.0% 204 7.2% 210 7.6% 202 7.4% 204 7.7% Morton 1,147 16.5% 1,145 16.9% 1,135 17.0% 1,191 18.2% 1,182 18.3% Mountrail 491 25.3% 442 23.0% 434 23.4% 441 23.8% 510 28.2% Nelson 89 10.0% 68 8.3% 75 9.6% 61 8.3% 54 75.2% Oliver 43 6.2% 45 6.7% 47 7.1% 54 8.4% 52 83.2% Pembina 490 21.2% 432 19.5% 386 17.9% 354 16.8% 289 14.2% Pierce 198 18.0% 161 14.9% 157 15.2% 154 15.0% 168 16.6% Ramsey 803 24.7% 781 25.1% 726 23.9% 685 23.7% 743 25.7% Ransom 136 9.7% 124 9.2% 113 8.5% 81 6.1% 86 6.5% Renville 76 10.2% 59 8.3% 60 8.6% 65 9.5% 80 11.9% Richland 807 15.8% 807 16.4% 702 14.5% 703 14.3% 667 14.0% Rolette 3,117 60.2% 2,979 55.6% 2,950 55.5% 2,887 53.6% 2,825 52.4% Sargent 133 11.8% 135 12.4% 137 12.9% 112 10.5% 109 10.7% Sheridan 87 20.1% 82 20.9% 70 18.8% 67 19.8% 60 17.9% Sioux 1,063 61.0% 1,024 58.7% 974 56.4% 1,047 58.8% 1,058 59.5% Slope 24 9.9% 6 2.7% 10 4.4% 10 4.4% 14 6.3% Stark 1,161 17.6% 1,124 17.8% 1,032 16.6% 974 16.0% 989 16.6% Steele 78 14.0% 79 14.6% 75 14.5% 61 11.9% 80 16.1% Stutsman 909 16.7% 792 15.2% 713 14.1% 745 15.2% 722 14.8% Towner 117 14.1% 112 14.1% 101 13.6% 110 15.1% 94 13.2% Traill 462 21.5% 413 19.5% 398 19.5% 347 16.8% 366 17.7% Walsh 872 25.9% 861 26.6% 782 22.8% 770 22.7% 721 21.7% Ward 2,594 16.1% 2,579 16.0% 2,456 15.7% 2,430 15.8% 2,493 16.3% Wells 174 14.4% 166 14.6% 158 41.2% 149 13.8% 103 9.9% Williams 1,160 19.7% 1,056 18.4% 956 17.1% 954 17.6% 993 18.9% North Dakota 31,238 18.2% 29,548 17.5% 28,111 17.0% 27,772 17.1% 27,944 17.4%

100
1995 1996 1997 1998 1999 County Number Percent Number Percent Number Percent Number Percent Number Percent Adams 160 29.1 182 34.9 178 33.5% 167 31.5% 153 32.4% Barnes 606 29.1 578 28.2 597 29.5% 569 28.0% 568 29.6% Benson 889 28.3 1,020 64.7 1,106 68.5% 1,043 65.8% 1,050 70.5% Billings 48 41.7 42 36.8 35 32.1% 39 36.1% 36 38.3% Bottineau 380 28.1 378 28.3 378 27.9% 391 29.9% 416 34.4% Bowman 210 27.3 193 24.6 192 23.9% 191 23.9% 212 28.0% Burke 150 30.4 132 29.5 119 27.6% 127 31.3% 122 32.5% Burleigh 2,122 17.7 2,156 18.0 2,182 18.5% 2,175 18.2% 2,105 17.5% Cass 3,394 18.1 3,451 18.3 3,459 18.9% 3,337 17.8% 3,437 17.4% Cavalier 308 29.4 305 29.5 316 31.0% 309 30.4% 296 31.9% Dickey 282 29.5 296 30.3 279 29.0% 276 30.4% 299 30.7% Divide 124 26.4 111 24.7 123 29.9% 145 35.5% 149 42.0% Dunn 209 31.6 241 36.2 239 37.0% 235 37.1% 243 40.1% Eddy 209 33.8 209 34.4 198 33.5% 193 32.6% 194 34.2% Emmons 346 42.0 345 43.1 357 43.8% 350 42.9% 365 45.5% Foster 147 21.2 145 19.9 154 21.0% 138 18.7% 135 18.1% Golden Valley 358 64.3 343 62.1 337 58.2% 332 54.9% 306 58.7% Grand Forks 3,214 26.1 3,233 25.9 3,016 24.6% 2,847 24.5% 2,834 25.5% Grant 325 59.4 332 65.9 346 67.7% 336 67.3% 338 72.1% Griggs 227 32.5 235 35.0 214 31.7% 229 35.7% 208 34.2% Hettinger 327 44.3 328 45.4 303 44.0% 300 44.6% 263 43.4% Kidder 245 39.3 258 42.0 238 40.2% 228 41.1% 220 43.6% LaMoure 422 36.4 424 35.9 432 39.2% 385 35.3% 409 39.3% Logan 183 34.3 188 36.7 198 39.9% 192 38.8% 176 38.7% McHenry 446 34.3 427 33.9 423 34.5% 385 32.8% 400 34.6% McIntosh 295 45.2 276 41.2 247 41.5% 229 39.2% 227 40.8% McKenzie 445 37.5 392 32.2 493 41.5% 327 27.7% 451 40.7% McLean 626 27.0 616 26.9 622 27.8% 583 27.2% 598 29.4% Mercer 296 13.2 279 12.5 260 11.3% 234 10.8% 248 12.0% Morton 1,631 30.4 1,645 31.1 1,631 31.3% 1,583 29.9% 1,565 30.8% Mountrail 844 50.8 851 51.8 923 56.3% 881 53.7% 917 58.1% Nelson 311 34.1 324 40.2 269 35.3% 291 40.5% 245 34.9% Oliver 73 17.7 66 16.0 69 18.9% 65 18.6% 48 15.0% Pembina 427 21.2 439 21.5 427 22.3% 426 22.6% 426 24.7% Pierce 281 27.9 282 28.3 287 30.2% 254 26.9% 277 30.4% Ramsey 988 36.2 973 36.7 954 36.0% 866 33.6% 889 34.8% Ransom 207 16.4 222 17.7 188 14.4% 210 17.3% 212 18.4% Renville 211 25.6 214 26.2 194 24.3% 259 35.0% 287 38.2% Richland 896 24.0 909 24.7 1,032 28.2% 918 26.4% 879 26.1% Rolette 2,507 61.3 2,506 63.2 2,466 60.2% 2,406 61.5% 2,570 66.9% Sargent 165 20.0 149 17.9 163 19.0% 162 18.6% 158 18.7% Sheridan 89 36.2 93 38.6 114 47.3% 105 45.5% 104 50.7% Sioux 1,042 78.4 1,072 77.3 1,048 78.9% 981 71.7% 1,043 80.4% Slope 0 0.0 0 0.0 0 0.0% 0 0.0% 0 0.0% Stark 1,583 31.3 1,596 31.8 1,505 30.7% 1,486 31.4% 1,450 30.7% Steele 108 27.1 97 25.5 117 32.7% 127 35.5% 121 35.5% Stutsman 1,004 26.1 1,008 26.9 1,084 29.9% 1,013 28.9% 975 27.5% Towner 220 33.8 231 36.4 229 39.0% 251 44.7% 206 40.1% Traill 354 19.1 382 20.8 354 19.6% 350 19.5% 443 25.1% Walsh 732 28.7 727 29.1 779 30.9% 786 32.0% 723 31.1% Ward 3,142 29.8 3,074 28.9 3,066 29.6% 2,900 28.3% 3,098 29.2% Wells 336 31.4 327 30.3 333 30.9% 269 24.6% 275 27.9% Williams 1,177 26.5 1,149 26.1 1,079 25.1% 1,043 25.2% 1,050 27.3% North Dakota 35,321 28.3 35,451 28.6 35,352 29.0% 33,924 28.2% 34,419 29.1%
Table 22: Children Receiving Free and Reduced-Price School Lunch
Source: Kids Count

101
Table 23: Children Enrolled in WIC by County
Source: Kids Count
1995 1996 1997 1998 1999 2000 County Num Pct* Num Pct* Num Pct* Num Pct* Num Pct* Num Pct*
Adams 104 23.9% 118 27.1% 101 23.2% 105 24.1% 78 17.9% 77 17.7% Barnes 385 16.3% 411 17.4% 395 16.7% 422 17.9% 350 14.8% 356 15.1% Benson 88 5.6% 71 4.6% 648 41.5% 685 43.9% 506 32.4% 578 37.1% Billings 1 0.6% 0 0.0% 0 0.0% 0 0.0% 0 0.0% 0 0.0% Bottineau 140 12.0% 133 11.4% 140 12.0% 149 12.8% 144 12.4% 140 12.0% Bowman 127 21.9% 136 23.5% 135 23.3% 142 24.5% 134 23.1% 128 22.1% Burke 46 14.1% 38 11.6% 40 12.2% 42 12.8% 22 6.7% 41 12.5% Burleigh 1,824 10.8% 1,906 11.2% 1,955 11.5% 2,122 12.5% 1,913 11.3% 1,806 10.7% Cass 3,408 10.0% 3,278 9.6% 3,415 10.0% 3,688 10.8% 3,441 10.1% 3,493 10.3% Cavalier 207 28.0% 189 25.6% 187 25.3% 199 26.9% 185 25.0% 165 22.3% Dickey 192 16.3% 151 12.8% 133 11.3% 139 11.8% 120 10.2% 119 10.1% Divide 30 9.9% 29 9.6% 33 10.9% 36 11.9% 35 11.6% 27 8.9% Dunn 49 7.3% 65 9.6% 71 10.5% 77 11.4% 65 9.6% 48 7.1% Eddy 91 18.5% 87 17.7% 74 15.0% 77 15.7% 85 17.3% 74 15.0% Emmons 215 29.4% 206 28.1% 207 28.3% 220 30.1% 232 31.7% 226 30.9% Foster 268 36.5% 252 34.3% 245 33.4% 261 35.6% 238 32.4% 218 29.7% Golden Valley 89 24.6% 81 22.4% 85 23.5% 92 25.4% 87 24.0% 90 24.9% Grand Forks 3,443 19.5% 3,394 19.2% 3,542 20.1% 3,798 21.5% 3,292 18.6% 3,104 17.6% Grant 79 18.6% 68 16.0% 84 19.8% 90 21.2% 89 21.0% 90 21.2% Griggs 111 25.6% 136 31.4% 125 28.9% 132 30.5% 116 26.8% 116 26.8% Hettinger 135 32.5% 110 26.5% 107 25.8% 114 27.5% 91 21.9% 90 21.7% Kidder 107 22.7% 97 20.6% 110 23.4% 119 25.3% 112 23.8% 111 23.6% LaMoure 154 19.7% 142 18.2% 127 16.2% 134 17.1% 101 12.9% 88 11.3% Logan 67 17.9% 79 21.1% 79 21.1% 84 22.5% 87 23.3% 83 22.2% McHenry 156 14.7% 134 12.6% 159 15.0% 172 16.2% 184 17.3% 185 17.4% McIntosh 109 22.1% 79 16.0% 111 22.5% 121 24.5% 123 24.9% 109 22.1% McKenzie 89 7.9% 92 8.1% 101 8.9% 108 9.5% 101 8.9% 114 10.1% McLean 258 15.8% 222 13.6% 257 15.7% 276 16.9% 263 16.1% 248 15.2% Mercer 178 10.6% 246 14.6% 170 10.1% 180 10.7% 130 7.7% 108 6.4% Morton 838 14.4% 841 14.4% 863 14.8% 926 15.9% 860 14.8% 830 14.2% Mountrail 87 6.5% 116 8.7% 117 8.7% 127 9.5% 97 7.2% 107 8.0% Nelson 116 21.3% 67 12.3% 104 19.1% 113 20.7% 108 19.8% 99 18.2% Oliver 0 0.0% 2 0.6% 1 0.3% 1 0.3% 0 0.0% 0 0.0% Pembina 297 18.9% 356 22.6% 349 22.2% 379 24.1% 375 23.8% 365 23.2% Pierce 140 16.5% 149 17.6% 155 18.3% 167 19.7% 169 19.9% 152 17.9% Ramsey 689 27.5% 659 26.3% 644 25.7% 686 27.4% 609 24.3% 622 24.8% Ransom 192 16.4% 169 14.5% 190 16.3% 203 17.4% 225 19.2% 191 16.3% Renville 65 14.5% 51 11.4% 53 11.8% 56 12.5% 65 14.5% 64 14.3% Richland 527 13.7% 486 12.6% 413 10.7% 430 11.2% 450 11.7% 410 10.7% Rolette 1,851 52.9% 1,827 52.3% 1,956 55.9% 2,084 59.6% 1,923 55.0% 1,918 54.9% Sargent 167 20.5% 164 20.1% 144 17.7% 153 18.8% 129 15.8% 107 13.1% Sheridan 63 26.1% 67 27.8% 70 29.0% 74 30.7% 66 27.4% 60 24.9% Sioux 41 3.7% 14 1.3% 12 1.1% 12 1.1% 4 0.4% 4 0.4% Slope 0 0.0% 0 0.0% 0 0.0% 0 0.0% 0 0.0% 0 0.0% Stark 1,141 22.1% 1,133 22.0% 1,155 22.4% 1,235 24.0% 1,176 22.8% 1,132 22.0% Steele 77 19.2% 68 16.9% 50 12.4% 87 21.6% 87 21.6% 82 20.4% Stutsman 848 18.1% 885 18.9% 869 18.6% 928 19.8% 835 17.9% 946 20.2% Towner 83 16.7% 76 15.3% 74 14.9% 79 15.9% 74 14.9% 54 10.8% Traill 283 16.2% 261 14.9% 281 16.1% 300 17.2% 280 16.0% 322 18.4% Walsh 755 30.8% 725 29.6% 735 30.0% 786 32.1% 728 29.7% 790 32.2% Ward 2,884 18.7% 3,069 20.0% 3,170 20.6% 3,431 22.3% 3,296 21.4% 3,165 20.6% Wells 123 14.4% 147 17.2% 127 14.9% 133 15.6% 107 12.5% 126 14.8% Williams 907 21.9% 905 21.8% 885 21.4% 941 22.7% 845 20.4% 922 22.3% North Dakota 24,296 16.3% 24,187 16.2% 25,283 17.0% 27,115 18.2% 24,832 16.7% 24,500 16.5%
*Percentage of females age 20 to 44 and children younger than 5, from 2000 U.S. Census

102
Table 24: Children Enrolled in Medicaid by County
Source: Kids Count
1994 1995 1996 1997 1998 1999 County Enroll Pct Enroll Pct. Enroll Pct. Enroll Pct Enroll Pct Enroll Pct Adams 116 15.1% 101 13.4% 114 15.0% 86 11.6% 88 12.3% 74 11.2% Barnes 571 16.4% 536 15.4% 619 18.0% 650 19.0% 582 17.3% 558 16.8% Benson 1,384 51.9% 1,318 49.1% 1,369 52.3% 1,277 48.6% 1,251 46.9% 1,266 45.5% Billings 23 5.9% 29 7.4% 25 6.5% 23 6.2% 32 9.0% 28 11.6% Bottineau 387 17.5% 401 18.3% 327 15.7% 327 15.8% 320 16.0% 310 15.7% Bowman 90 9.5% 83 8.9% 80 8.8% 72 7.8% 85 9.4% 92 10.6% Burke 87 13.3% 87 13.8% 91 15.1% 74 13.0% 65 11.9% 73 14.1% Burleigh 3,377 16.9% 3,320 16.4% 3,065 15.3% 3,159 15.7% 3,050 15.2% 3,131 14.9% Cass 5,139 15.5% 4,860 14.5% 4,733 14.1% 4,668 13.8% 4,845 14.1% 5,088 13.9% Cavalier 149 9.6% 137 9.2% 153 10.8% 149 10.9% 148 11.2% 171 13.3% Dickey 338 20.0% 316 19.1% 276 17.1% 294 18.4% 278 17.5% 265 16.0% Divide 85 13.7% 91 15.0% 76 13.1% 70 12.5% 65 12.0% 53 10.4% Dunn 130 10.6% 134 11.0% 152 12.9% 142 12.4% 133 11.9% 147 13.4% Eddy 132 17.9% 140 19.1% 142 18.9% 108 14.5% 133 17.9% 117 16.0% Emmons 85 6.9% 103 8.4% 99 8.6% 89 7.9% 79 7.2% 51 4.4% Foster 135 12.1% 169 15.1% 173 15.7% 171 16.1% 151 14.2% 145 13.3% G Valley 80 13.0% 73 11.9% 83 13.8% 95 16.1% 109 19.1% 75 12.6% G Forks 3,270 13.6% 3,029 12.7% 2,974 12.8% 2,839 12.5% 3,105 14.2% 3,212 14.9% Grant 126 14.1% 100 11.4% 88 10.6% 100 12.5% 90 11.6% 96 13.2% Griggs 143 17.4% 148 18.4% 139 17.9% 121 16.2% 100 13.5% 103 14.6% Hettinger 150 18.1% 134 16.6% 122 15.7% 110 14.4% 95 12.9% 52 7.5% Kidder 102 11.4% 92 10.5% 93 11.0% 81 10.0% 76 9.7% 76 10.7% Lamoure 133 9.3% 149 10.7% 162 11.7% 167 12.4% 116 8.9% 106 8.3% Logan 80 12.2% 60 9.6% 68 11.1% 55 9.1% 54 9.2% 44 7.8% McHenry 325 18.7% 282 16.3% 312 18.5% 296 17.8% 309 19.0% 282 17.5% McIntosh 101 12.3% 105 13.1% 98 13.1% 90 12.5% 100 14.8% 92 12.2% McKenzie 651 31.9% 595 29.7% 641 32.2% 637 32.5% 624 32.1% 645 33.3% McLean 478 16.0% 475 16.0% 451 15.7% 452 15.9% 430 15.3% 425 17.2% Mercer 286 9.2% 278 8.9% 288 9.2% 274 8.8% 260 8.5% 263 9.6% Morton 1,511 19.4% 1,379 17.6% 1,422 18.6% 1,413 18.6% 1,514 19.9% 1,469 18.9% Mountrail 605 27.4% 554 24.9% 538 24.7% 551 25.7% 524 24.6% 632 30.5% Nelson 96 9.8% 98 10.2% 93 10.3% 93 10.6% 81 9.7% 72 8.1% Oliver 42 5.4% 54 7.1% 63 8.4% 56 7.6% 53 7.2% 63 10.0% Pembina 429 16.7% 353 13.9% 360 14.2% 356 14.3% 287 11.9% 228 9.4% Pierce 226 17.8% 218 17.1% 200 16.0% 203 16.8% 232 19.4% 240 19.2% Ramsey 925 25.0% 866 23.6% 899 25.1% 860 24.3% 851 24.6% 899 25.3% Ransom 196 12.5% 194 12.5% 148 9.4% 135 8.6% 132 8.5% 121 7.4% Renville 71 8.4% 70 8.5% 83 10.1% 79 9.7% 83 10.4% 91 13.4% Richland 790 12.9% 783 12.8% 812 13.5% 787 13.1% 810 13.5% 779 12.8% Rolette 3,364 58.1% 3,269 54.7% 3,204 53.4% 3,260 54.0% 3,234 53.0% 3,096 54.7% Sargent 134 10.5% 168 13.0% 173 13.9% 165 13.3% 146 11.8% 141 11.3% Sheridan 93 19.2% 86 18.3% 81 18.8% 64 15.9% 89 23.1% 75 18.5% Sioux 1,233 65.1% 1,240 64.4% 1,208 61.3% 1,095 55.8% 1,192 59.4% 1,164 63.1% Slope 18 6.7% 28 10.6% 13 5.0% 14 5.3% 24 9.0% 20 9.4% Stark 1,397 18.7% 1,342 18.3% 1,384 19.2% 1,334 18.6% 1,338 18.7% 1,349 18.9% Steele 90 14.3% 80 13.0% 90 14.7% 100 16.6% 78 13.2% 75 11.1% Stutsman 1,188 18.7% 1,078 17.3% 1,019 17.2% 955 16.3% 1,007 17.4% 1,032 16.7% Towner 179 19.3% 143 15.5% 135 15.1% 141 16.5% 143 17.2% 113 14.7% Traill 450 17.6% 429 16.6% 373 14.7% 368 14.7% 359 14.5% 380 14.9% Walsh 763 20.4% 744 20.0% 732 18.4% 678 17.1% 713 18.4% 753 21.6% Ward 2,829 15.2% 2,701 14.3% 2,865 15.0% 2,866 15.3% 2,928 15.9% 3,073 16.4% Wells 226 16.6% 210 15.8% 208 16.1% 189 14.9% 190 15.2% 151 11.8% Williams 1,253 19.0% 1,228 18.8% 1,211 19.0% 1,136 18.1% 1,167 18.8% 1,179 19.5% Total 36,274 18.2% 34,560 17.4% 34,327 17.4% 33,574 17.2% 33,948 17.5% 34,235 17.5%

103
Table 25: Child Abuse and Neglect by County
Source: Kids Count
1996 1997 1998 1999 County Number Percent Number Percent Number Percent Number Percent
Adams 13 2.0% 17 2.7% 15 2.4% 17 2.9% Barnes 81 2.9% 108 3.9% 101 3.6% 110 4.0% Benson 9 0.4% 16 0.7% 42 1.8% 16 0.7% Billings 10 3.0% 4 1.3% 2 0.7% 2 0.7% Bottineau 53 3.0% 55 3.1% 65 3.9% 37 2.2% Bowman 21 2.6% 14 1.7% 16 2.0% 7 0.9% Burke 9 1.7% 14 2.8% 15 3.2% 18 40.0% Burleigh 712 4.1% 721 4.2% 736 4.4% 778 4.6% Cass 1,501 5.5% 1,472 5.3% 1,566 5.6% 1622 5.8% Cavalier 44 3.5% 34 2.8% 24 2.1% 15 1.4% Dickey 37 2.8% 27 2.1% 40 3.0% 30 2.3% Divide 17 3.3% 12 2.4% 19 4.0% 16 3.5% Dunn 29 2.8% 18 1.8% 28 2.8% 37 3.9% Eddy 10 1.6% 32 5.0% 19 2.9% 4 0.6% Emmons 18 1.8% 20 2.0% 11 1.2% 34 3.7% Foster 25 2.7% 20 2.2% 32 3.5% 10 1.1% Golden Valley 121 2.3% 21 4.0% 7 1.4% 11 2.3% Grand Forks 982 5.3% 1,044 5.7% 1,251 7.2% 1145 6.8% Grant 14 1.9% 15 2.1% 7 1.0% 15 2.4% Griggs 26 3.9% 24 3.8% 19 2.9% 23 3.7% Hettinger 14 2.0% 19 2.8% 12 1.9% 8 1.3% Kidder 13 1.8% 15 2.1% 31 4.6% 23 3.5% LaMoure 16 1.3% 7 0.6% 13 1.2% 15 1.4% Logan 5 1.0% 6 1.2% 5 1.0% 1 0.2% McHenry 46 3.1% 83 5.7% 49 3.5% 47 3.4% McIntosh 5 0.7% 10 1.5% 8 1.3% 3 0.5% McKenzie 46 2.6% 32 1.8% 66 3.9% 31 1.9% McLean 49 1.9% 43 1.7% 29 1.2% 37 1.5% Mercer 41 1.5% 30 1.1% 36 1.3% 42 1.6% Morton 250 3.7% 317 4.8% 390 6.0% 346 5.4% Mountrail 22 1.2% 38 2.1% 31 1.7% 41 2.3% Nelson 15 1.9% 44 5.7% 30 4.1% 43 6.0% Oliver 7 1.1% 21 3.2% 17 2.6% 16 2.6% Pembina 69 3.1% 93 4.3% 86 4.1% 74 3.6% Pierce 17 1.6% 28 2.7% 20 1.9% 29 2.9% Ramsey 183 5.9% 174 5.7% 199 6.7% 194 6.7% Ransom 55 4.1% 37 2.8% 10 0.8% 17 1.3% Renville 12 1.7% 6 0.9% 6 0.9% 9 1.3% Richland 209 4.3% 187 3.9% 235 4.8% 159 3.3% Rolette 105 2.0% 96 1.8% 88 1.6% 107 2.0% Sargent 18 1.7% 20 1.9% 23 2.2% 32 3.1% Sheridan 3 0.8% 6 1.6% 8 2.4% 4 1.2% Sioux 0 0.0% 4 0.2% 3 0.2% 1 0.1% Slope 1 0.5% 0 0.0% 4 1.7% 8 3.6% Stark 343 5.5% 396 6.4% 275 4.5% 274 4.6% Steele 14 2.7% 11 2.1% 11 2.2% 18 3.6% Stutsman 166 3.3% 173 3.4% 179 3.7% 194 4.0% Towner 27 3.5% 33 4.4% 42 5.8% 23 3.2% Traill 69 3.3% 70 3.4% 66 3.2% 47 2.3% Walsh 210 6.1% 253 7.4% 163 4.8% 145 4.4% Ward 799 5.0% 782 5.0% 929 6.0% 921 6.0% Wells 21 1.9% 21 1.9% 25 2.3% 13 1.3% Williams 251 4.5% 223 4.0% 234 4.3% 205 3.9% North Dakota 6,724 4.0% 6,966 4.2% 7,341 4.5% 7,074 4.4%

104
Table 26: Congenital Anomalies by County, 1994 - 2000
Source: NDDoH, Division of Vital Records
Total Congenital Anomalies Births With Congenital Anomalies County Births Total CAs Rate/1000 Births w/CAs Rate/1000 Adams 157 7 44.6 6 38.2 Barnes 848 26 30.7 25 29.5 Benson 850 33 38.8 32 37.6 Billings 55 0 0.0 0 0.0 Bottineau 388 18 46.4 14 36.1 Bowman 212 9 42.5 9 42.5 Burke 120 2 16.7 2 16.7 Burleigh 6,004 114 19.0 88 14.7 Cass 11,287 160 14.2 139 12.3 Cavalier 287 6 20.9 6 20.9 Dickey 434 14 32.3 14 32.3 Divide 95 1 10.5 1 10.5 Dunn 240 0 0.0 1 4.2 Eddy 193 6 31.1 6 31.1 Emmons 315 8 25.4 7 22.2 Foster 287 6 20.9 6 20.9 Golden Valley 140 3 21.4 3 21.4 Grand Forks 7,086 82 11.6 74 10.4 Grant 172 7 40.7 6 34.9 Griggs 173 3 17.3 3 17.3 Hettinger 168 8 47.6 8 47.6 Kidder 173 2 11.6 1 5.8 LaMoure 288 9 31.3 8 27.8 Logan 167 2 12.0 2 12.0 McHenry 400 8 20.0 7 17.5 McIntosh 221 3 13.6 3 13.6 McKenzie 494 16 32.4 10 20.2 McLean 596 9 15.1 6 10.1 Mercer 588 7 11.9 7 11.9 Morton 2,115 45 21.3 32 15.1 Mountrail 653 13 19.9 12 18.4 Nelson 201 5 24.9 4 19.9 Oliver 202 0 0.0 0 0.0 Pembina 821 19 23.1 17 20.7 Pierce 386 7 18.1 7 18.1 Ramsey 662 37 55.9 35 52.9 Ransom 890 9 10.1 8 9.0 Renville 967 1 1.0 1 1.0 Richland 880 27 30.7 22 25.0 Rolette 1,384 74 53.5 60 43.4 Sargent 341 5 14.7 4 11.7 Sheridan 84 5 59.5 4 47.6 Sioux 638 14 21.9 14 21.9 Slope 57 2 35.1 2 35.1 Stark 1,933 39 20.2 33 17.1 Steele 151 8 53.0 8 53.0 Stutsman 1,559 18 11.5 17 10.9 Towner 182 7 38.5 7 38.5 Traill 641 10 15.6 6 9.4 Walsh 1,040 33 31.7 28 26.9 Ward 6,773 164 24.2 144 21.3 Wells 302 6 19.9 5 16.6 Williams 1,709 31 18.1 27 15.8 North Dakota 57,009 1,148 20.1 990 17.4
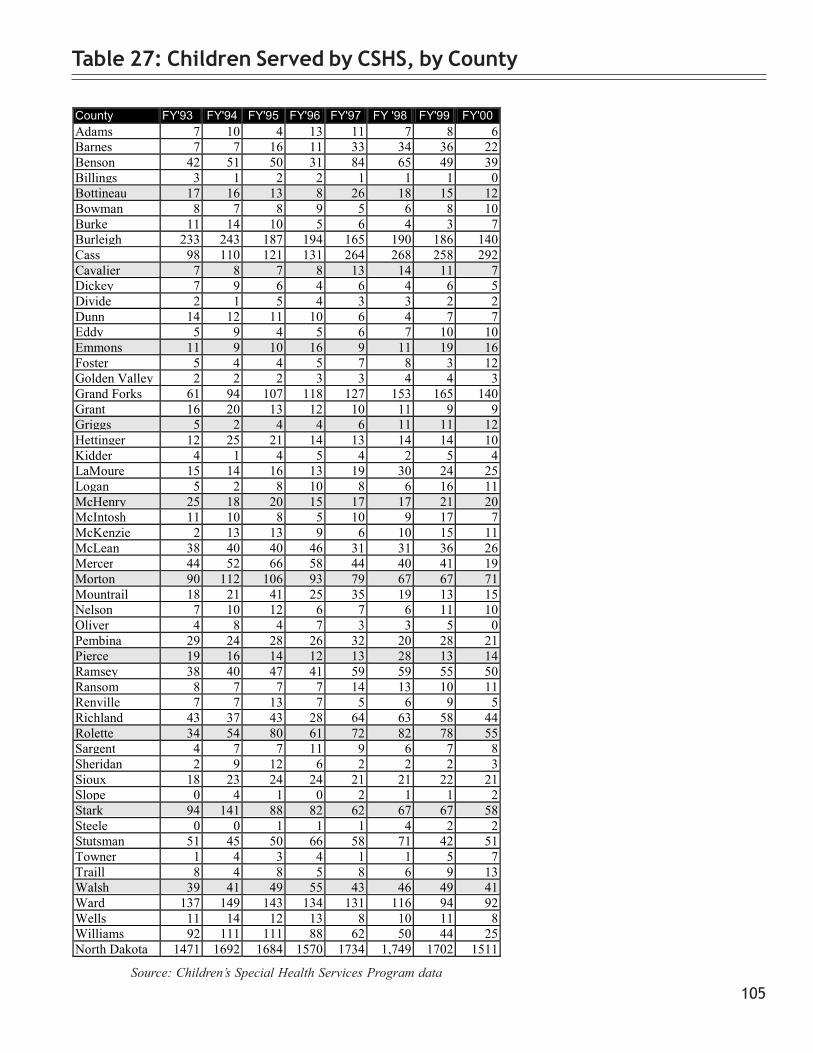
105
County FY'93 FY'94 FY'95 FY'96 FY'97 FY '98 FY'99 FY'00 Adams 7 10 4 13 11 7 8 6 Barnes 7 7 16 11 33 34 36 22 Benson 42 51 50 31 84 65 49 39 Billings 3 1 2 2 1 1 1 0 Bottineau 17 16 13 8 26 18 15 12 Bowman 8 7 8 9 5 6 8 10 Burke 11 14 10 5 6 4 3 7 Burleigh 233 243 187 194 165 190 186 140 Cass 98 110 121 131 264 268 258 292 Cavalier 7 8 7 8 13 14 11 7 Dickey 7 9 6 4 6 4 6 5 Divide 2 1 5 4 3 3 2 2 Dunn 14 12 11 10 6 4 7 7 Eddy 5 9 4 5 6 7 10 10 Emmons 11 9 10 16 9 11 19 16 Foster 5 4 4 5 7 8 3 12 Golden Valley 2 2 2 3 3 4 4 3 Grand Forks 61 94 107 118 127 153 165 140 Grant 16 20 13 12 10 11 9 9 Griggs 5 2 4 4 6 11 11 12 Hettinger 12 25 21 14 13 14 14 10 Kidder 4 1 4 5 4 2 5 4 LaMoure 15 14 16 13 19 30 24 25 Logan 5 2 8 10 8 6 16 11 McHenry 25 18 20 15 17 17 21 20 McIntosh 11 10 8 5 10 9 17 7 McKenzie 2 13 13 9 6 10 15 11 McLean 38 40 40 46 31 31 36 26 Mercer 44 52 66 58 44 40 41 19 Morton 90 112 106 93 79 67 67 71 Mountrail 18 21 41 25 35 19 13 15 Nelson 7 10 12 6 7 6 11 10 Oliver 4 8 4 7 3 3 5 0 Pembina 29 24 28 26 32 20 28 21 Pierce 19 16 14 12 13 28 13 14 Ramsey 38 40 47 41 59 59 55 50 Ransom 8 7 7 7 14 13 10 11 Renville 7 7 13 7 5 6 9 5 Richland 43 37 43 28 64 63 58 44 Rolette 34 54 80 61 72 82 78 55 Sargent 4 7 7 11 9 6 7 8 Sheridan 2 9 12 6 2 2 2 3 Sioux 18 23 24 24 21 21 22 21 Slope 0 4 1 0 2 1 1 2 Stark 94 141 88 82 62 67 67 58 Steele 0 0 1 1 1 4 2 2 Stutsman 51 45 50 66 58 71 42 51 Towner 1 4 3 4 1 1 5 7 Traill 8 4 8 5 8 6 9 13 Walsh 39 41 49 55 43 46 49 41 Ward 137 149 143 134 131 116 94 92 Wells 11 14 12 13 8 10 11 8 Williams 92 111 111 88 62 50 44 25 North Dakota 1471 1692 1684 1570 1734 1,749 1702 1511
Table 27: Children Served by CSHS, by County
Source: Children’s Special Health Services Program data

106
Table 28: Special Education Enrollment by County, 1995 – 1999
Source: Kids Count
County 1995 1996 1997 1998 1999 County Num Pct Num Pct Num Pct Num Pct Num Pct Adams 53 10.1% 54 10.3% 43 8.4% 43 8.9% 46 9.7% Barnes 222 10.5% 224 10.8% 243 11.9% 255 13.0% 257 13.6% Benson 155 14.2% 163 15.4% 179 16.4% 172 16.6% 210 19.9% Billings 16 13.7% 16 14.3% 15 14.2% 13 12.2% 14 15.1% Bottineau 197 14.7% 198 15.0% 188 14.4% 197 15.6% 186 15.3% Bowman 59 7.8% 64 8.4% 67 8.6% 69 8.8% 68 9.0% Burke 56 11.5% 54 12.1% 50 11.9% 52 13.3% 55 14.7% Burleigh 1,113 9.9% 1,159 10.3% 1,142 10.3% 1,183 10.9% 1,302 11.8% Cass 1,753 9.5% 1,849 9.9% 1,871 9.8% 2,022 10.8% 2,097 10.9% Cavalier 89 9.6% 97 10.5% 88 9.3% 88 10.3% 92 11.0% Dickey 113 11.2% 104 10.4% 101 10.1% 98 10.1% 102 10.2% Divide 23 5.0% 22 4.9% 24 5.9% 25 9.4% 19 5.2% Dunn 52 7.9% 59 9.0% 57 9.2% 57 9.4% 59 9.8% Eddy 81 13.3% 73 12.4% 78 13.1% 68 11.7% 61 10.6% Emmons 111 13.8% 110 13.5% 105 12.9% 109 13.2% 100 12.5% Foster 64 9.1% 74 9.9% 69 9.0% 67 8.7% 64 8.5% Golden Valley 33 6.8% 30 6.4% 29 6.0% 23 5.2% 35 8.1% Grand Forks 1,343 11.0% 1,412 11.8% 1,327 11.5% 1,313 12.4% 1,420 13.1% Grant 31 6.6% 31 6.8% 39 8.6% 38 9.0% 47 11.2% Griggs 45 6.5% 51 7.6% 48 7.2% 45 7.1% 47 7.7% Hettinger 66 9.9% 74 11.6% 71 10.8% 64 10.2% 65 10.6% Kidder 41 6.7% 42 7.1% 51 8.9% 50 9.4% 50 9.8% Lamoure 72 6.1% 83 7.3% 90 8.1% 97 9.2% 104 10.0% Logan 53 10.1% 64 12.4% 68 13.7% 64 13.4% 65 14.0% McHenry 131 10.0% 128 10.1% 132 10.7% 141 11.8% 162 13.7% McIntosh 48 7.1% 45 7.1% 41 6.9% 42 7.4% 49 8.9% McKenzie 133 11.1% 142 11.8% 137 11.6% 152 13.1% 156 13.9% McLean 228 9.7% 233 10.1% 245 10.8% 232 10.8% 229 11.2% Mercer 255 11.2% 258 11.2% 256 11.3% 244 11.7% 258 12.3% Morton 616 12.0% 644 12.9% 613 12.2% 650 13.3% 646 13.4% Mountrail 227 13.4% 228 13.8% 246 14.8% 251 15.8% 257 16.2% Nelson 100 11.5% 79 9.7% 72 9.3% 72 9.9% 76 10.5% Oliver 50 12.1% 54 13.8% 47 12.9% 35 10.5% 38 11.8% Pembina 193 9.5% 211 10.6% 211 11.0% 220 11.9% 226 12.5% Pierce 97 11.2% 88 10.5% 92 11.0% 98 12.3% 102 12.5% Ramsey 288 11.6% 286 11.9% 287 12.1% 316 13.9% 341 14.7% Ransom 137 10.7% 131 10.2% 130 10.5% 118 10.0% 147 12.6% Renville 126 16.3% 128 16.6% 118 15.7% 136 17.6% 135 18.1% Richland 384 11.6% 312 9.5% 320 9.9% 327 10.8% 350 11.5% Rolette 272 8.6% 286 8.7% 280 8.4% 281 11.9% 304 9.2% Sargent 93 10.6% 95 10.9% 93 10.5% 96 11.1% 108 12.4% Sheridan 34 14.2% 35 14.1% 31 13.1% 33 14.8% 37 18.1% Sioux 166 27.6% 178 31.6% 171 30.7% 142 26.6% 153 31.4% Slope 3 7.9% 2 4.3% 2 4.4% 1 2.4% 3 10.0% Stark 390 9.6% 422 10.3% 426 10.5% 418 10.8% 459 11.5% Steele 28 7.2% 29 7.9% 26 7.2% 32 9.6% 36 10.6% Stutsman 473 13.4% 480 13.8% 485 13.9% 541 16.1% 562 16.9% Towner 60 9.4% 62 10.2% 62 10.7% 63 11.1% 61 11.6% Traill 108 5.9% 107 5.8% 107 5.9% 116 6.6% 137 7.7% Walsh 285 11.4% 305 12.3% 283 11.5% 287 12.2% 302 13.0% Ward 1,241 11.8% 1,337 12.7% 1,357 12.9% 1,325 13.2% 1,420 14.0% Wells 108 9.9% 104 9.6% 114 10.7% 107 10.4% 109 11.0% Williams 463 10.7% 469 11.0% 474 11.6% 492 12.7% 487 13.0% North Dakota 12,578 10.6% 12,985 11.0% 12,902 11.1% 13,181 11.8% 13,934 12.4%
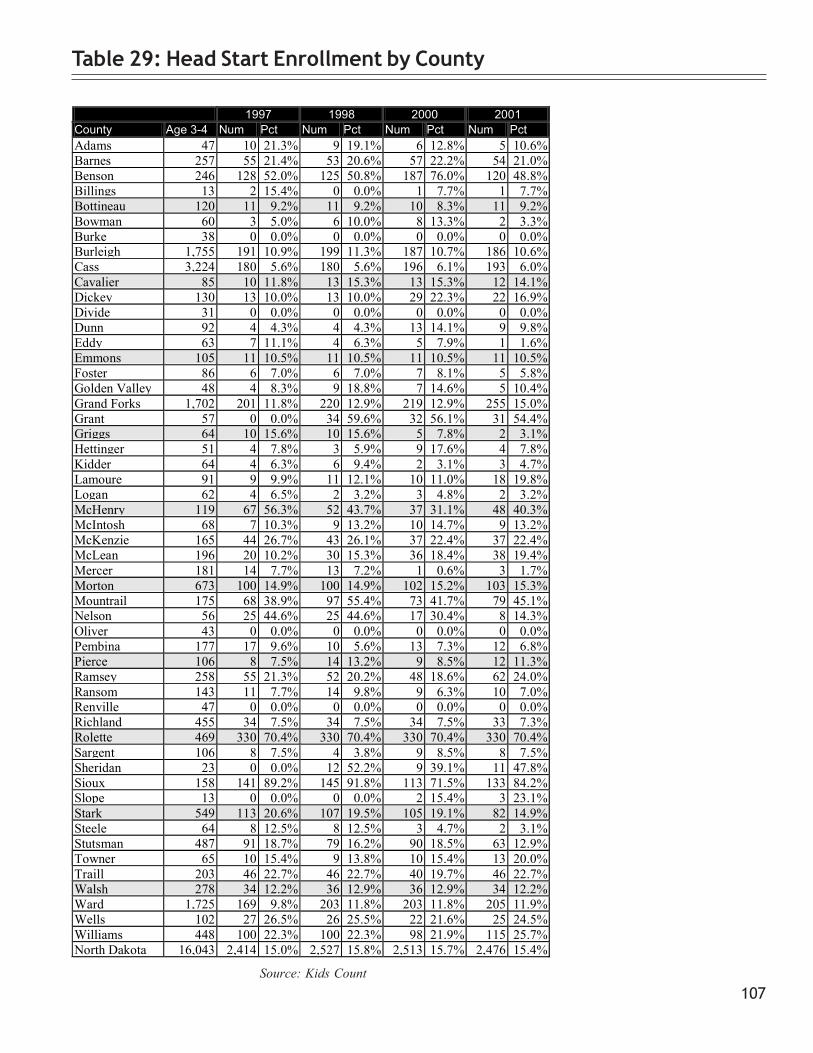
107
1997 1998 2000 2001 County Age 3-4 Num Pct Num Pct Num Pct Num Pct Adams 47 10 21.3% 9 19.1% 6 12.8% 5 10.6% Barnes 257 55 21.4% 53 20.6% 57 22.2% 54 21.0% Benson 246 128 52.0% 125 50.8% 187 76.0% 120 48.8% Billings 13 2 15.4% 0 0.0% 1 7.7% 1 7.7% Bottineau 120 11 9.2% 11 9.2% 10 8.3% 11 9.2% Bowman 60 3 5.0% 6 10.0% 8 13.3% 2 3.3% Burke 38 0 0.0% 0 0.0% 0 0.0% 0 0.0% Burleigh 1,755 191 10.9% 199 11.3% 187 10.7% 186 10.6% Cass 3,224 180 5.6% 180 5.6% 196 6.1% 193 6.0% Cavalier 85 10 11.8% 13 15.3% 13 15.3% 12 14.1% Dickey 130 13 10.0% 13 10.0% 29 22.3% 22 16.9% Divide 31 0 0.0% 0 0.0% 0 0.0% 0 0.0% Dunn 92 4 4.3% 4 4.3% 13 14.1% 9 9.8% Eddy 63 7 11.1% 4 6.3% 5 7.9% 1 1.6% Emmons 105 11 10.5% 11 10.5% 11 10.5% 11 10.5% Foster 86 6 7.0% 6 7.0% 7 8.1% 5 5.8% Golden Valley 48 4 8.3% 9 18.8% 7 14.6% 5 10.4% Grand Forks 1,702 201 11.8% 220 12.9% 219 12.9% 255 15.0% Grant 57 0 0.0% 34 59.6% 32 56.1% 31 54.4% Griggs 64 10 15.6% 10 15.6% 5 7.8% 2 3.1% Hettinger 51 4 7.8% 3 5.9% 9 17.6% 4 7.8% Kidder 64 4 6.3% 6 9.4% 2 3.1% 3 4.7% Lamoure 91 9 9.9% 11 12.1% 10 11.0% 18 19.8% Logan 62 4 6.5% 2 3.2% 3 4.8% 2 3.2% McHenry 119 67 56.3% 52 43.7% 37 31.1% 48 40.3% McIntosh 68 7 10.3% 9 13.2% 10 14.7% 9 13.2% McKenzie 165 44 26.7% 43 26.1% 37 22.4% 37 22.4% McLean 196 20 10.2% 30 15.3% 36 18.4% 38 19.4% Mercer 181 14 7.7% 13 7.2% 1 0.6% 3 1.7% Morton 673 100 14.9% 100 14.9% 102 15.2% 103 15.3% Mountrail 175 68 38.9% 97 55.4% 73 41.7% 79 45.1% Nelson 56 25 44.6% 25 44.6% 17 30.4% 8 14.3% Oliver 43 0 0.0% 0 0.0% 0 0.0% 0 0.0% Pembina 177 17 9.6% 10 5.6% 13 7.3% 12 6.8% Pierce 106 8 7.5% 14 13.2% 9 8.5% 12 11.3% Ramsey 258 55 21.3% 52 20.2% 48 18.6% 62 24.0% Ransom 143 11 7.7% 14 9.8% 9 6.3% 10 7.0% Renville 47 0 0.0% 0 0.0% 0 0.0% 0 0.0% Richland 455 34 7.5% 34 7.5% 34 7.5% 33 7.3% Rolette 469 330 70.4% 330 70.4% 330 70.4% 330 70.4% Sargent 106 8 7.5% 4 3.8% 9 8.5% 8 7.5% Sheridan 23 0 0.0% 12 52.2% 9 39.1% 11 47.8% Sioux 158 141 89.2% 145 91.8% 113 71.5% 133 84.2% Slope 13 0 0.0% 0 0.0% 2 15.4% 3 23.1% Stark 549 113 20.6% 107 19.5% 105 19.1% 82 14.9% Steele 64 8 12.5% 8 12.5% 3 4.7% 2 3.1% Stutsman 487 91 18.7% 79 16.2% 90 18.5% 63 12.9% Towner 65 10 15.4% 9 13.8% 10 15.4% 13 20.0% Traill 203 46 22.7% 46 22.7% 40 19.7% 46 22.7% Walsh 278 34 12.2% 36 12.9% 36 12.9% 34 12.2% Ward 1,725 169 9.8% 203 11.8% 203 11.8% 205 11.9% Wells 102 27 26.5% 26 25.5% 22 21.6% 25 24.5% Williams 448 100 22.3% 100 22.3% 98 21.9% 115 25.7% North Dakota 16,043 2,414 15.0% 2,527 15.8% 2,513 15.7% 2,476 15.4%
Table 29: Head Start Enrollment by County
Source: Kids Count

108
1979-1983 1984-1988 1989-1993 1994-1998 1979-1998 County Num Rate Num Rate Num Rate Num Rate Num Rate Adams 1 35.83 1 41.53 1 46.40 2 96.99 5 53.10 Barnes 6 52.20 2 20.65 2 21.55 5 52.59 15 37.53 Benson 14 185.87 6 90.05 4 67.26 10 161.79 34 129.16 Billings 0 0.00 0 0.00 0 0.00 1 96.62 1 23.82 Bottineau 3 37.80 6 86.74 1 15.88 0 0.00 10 36.73 Bowman 3 80.78 2 64.29 2 75.16 2 78.37 9 74.76 Burke 1 32.92 3 117.46 1 48.59 3 168.35 8 84.82 Burleigh 28 59.25 23 51.76 24 51.57 27 51.87 102 53.60 Cass 27 38.48 17 25.14 31 41.99 25 29.71 100 33.81 Cavalier 4 59.80 3 60.11 1 23.75 1 26.16 9 45.65 Dickey 9 156.85 1 19.64 1 21.34 3 64.38 14 69.39 Divide 2 76.89 3 149.48 0 0.00 2 130.21 7 89.37 Dunn 8 184.67 2 55.99 0 0.00 1 33.93 11 79.38 Eddy 2 72.02 1 44.56 0 0.00 1 47.46 4 43.70 Emmons 3 50.35 3 69.00 1 29.33 2 62.00 9 53.12 Foster 1 25.81 2 63.15 2 72.02 4 139.47 9 70.94 Golden Valley 3 133.75 1 50.68 0 0.00 3 176.89 7 91.70 Grand Forks 22 39.08 27 51.64 18 33.57 13 22.96 80 36.56 Grant 2 53.43 1 32.95 0 0.00 1 43.38 4 34.50 Griggs 0 0.00 1 43.23 2 89.69 2 94.03 5 53.99 Hettinger 5 131.93 0 0.00 1 44.54 0 0.00 6 54.83 Kidder 2 63.07 1 36.54 2 78.03 4 165.63 9 82.67 LaMoure 3 58.90 1 23.14 2 49.94 5 128.47 11 63.54 Logan 0 0.00 0 0.00 0 0.00 1 56.95 1 11.06 McHenry 12 182.45 3 54.69 0 0.00 1 21.11 16 74.11 McIntosh 3 83.92 3 116.46 2 101.52 0 0.00 8 80.56 McKenzie 10 147.21 4 66.15 5 98.83 5 101.96 24 105.25 McLean 8 81.47 6 67.98 7 85.28 4 49.24 25 71.48 Mercer 4 51.74 6 72.77 4 53.66 7 91.53 21 67.57 Morton 14 61.26 12 58.50 7 35.75 15 72.08 48 57.31 Mountrail 9 137.91 3 49.48 8 139.66 10 171.26 30 124.19 Nelson 2 51.95 2 63.15 0 0.00 2 78.46 6 48.68 Oliver 4 174.14 1 45.98 1 47.39 1 47.92 7 80.75 Pembina 8 99.43 3 42.08 3 43.87 3 44.07 17 58.98 Pierce 2 34.25 1 22.40 1 27.74 0 0.00 4 22.92 Ramsey 7 60.62 6 62.01 6 66.05 6 64.26 25 63.06 Ransom 4 78.88 5 116.88 3 73.57 3 70.51 15 84.83 Renville 2 64.21 0 0.00 1 43.23 1 43.98 4 38.61 Richland 8 42.60 4 24.54 6 38.95 11 65.03 29 43.03 Rolette 19 139.15 12 94.88 11 88.68 8 56.17 50 94.43 Sargent 7 156.35 2 53.95 1 28.83 4 111.20 14 91.80 Sheridan 3 136.80 0 0.00 2 158.98 1 88.03 6 96.90 Sioux 2 47.90 3 78.58 5 126.29 6 134.11 16 97.41 Slope 0 0.00 0 0.00 0 0.00 0 0.00 0 0.00 Stark 17 72.65 9 44.74 6 33.36 6 32.08 38 47.38 Steele 4 163.93 1 51.49 0 0.00 1 59.38 6 77.45 Stutsman 6 31.48 6 35.75 9 55.68 7 43.38 28 41.09 Towner 5 154.94 2 71.00 1 39.95 1 42.79 9 82.69 Traill 3 38.83 2 29.46 3 45.21 2 28.71 10 35.56 Walsh 12 96.70 5 47.53 4 40.05 9 86.99 30 69.34 Ward 22 44.67 31 68.81 18 41.55 24 52.12 95 51.72 Wells 4 70.71 4 89.11 0 0.00 1 28.60 9 51.95 Williams 22 107.61 10 53.42 4 24.94 9 55.74 45 63.07 North Dakota 372 66.59 253 50.68 214 44.47 266 52.45 1,105 54.00
Table 30: Adolescent Deaths and Rates by County – Ages 10 – 19
Source: Centers for Disease Control and Prevention, National Center for Health Statistics
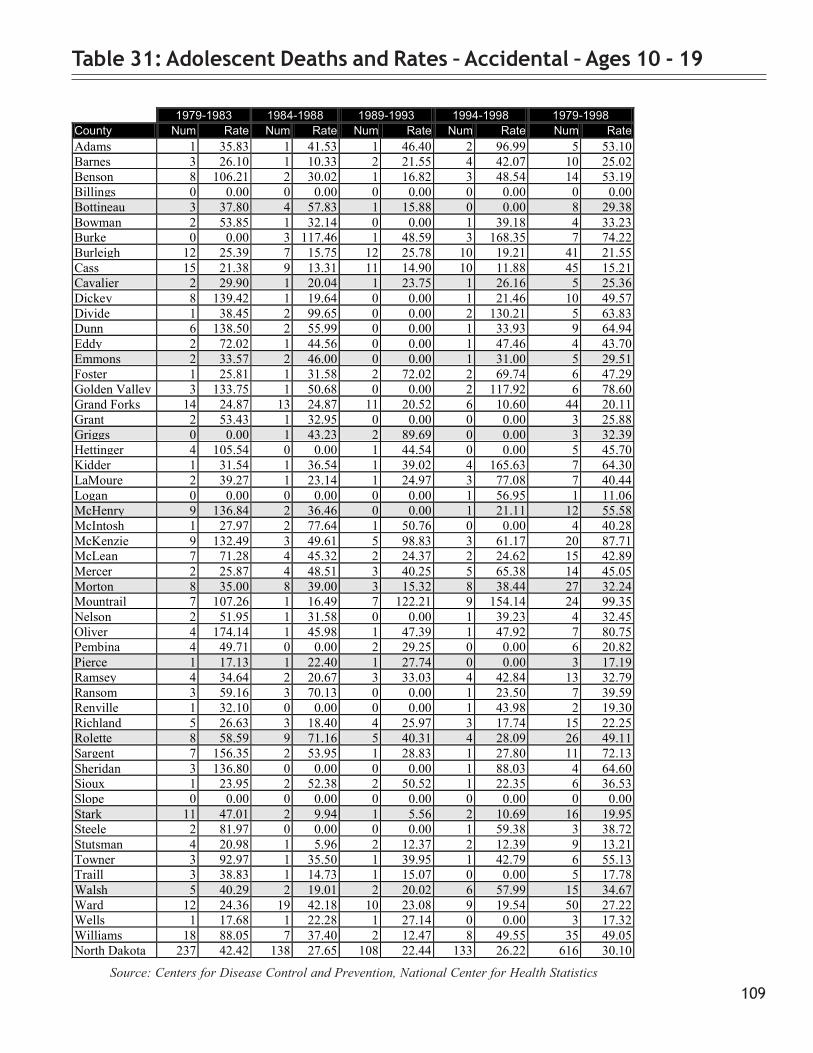
109
Table 31: Adolescent Deaths and Rates – Accidental – Ages 10 - 19
Source: Centers for Disease Control and Prevention, National Center for Health Statistics
1979-1983 1984-1988 1989-1993 1994-1998 1979-1998 County Num Rate Num Rate Num Rate Num Rate Num Rate Adams 1 35.83 1 41.53 1 46.40 2 96.99 5 53.10 Barnes 3 26.10 1 10.33 2 21.55 4 42.07 10 25.02 Benson 8 106.21 2 30.02 1 16.82 3 48.54 14 53.19 Billings 0 0.00 0 0.00 0 0.00 0 0.00 0 0.00 Bottineau 3 37.80 4 57.83 1 15.88 0 0.00 8 29.38 Bowman 2 53.85 1 32.14 0 0.00 1 39.18 4 33.23 Burke 0 0.00 3 117.46 1 48.59 3 168.35 7 74.22 Burleigh 12 25.39 7 15.75 12 25.78 10 19.21 41 21.55 Cass 15 21.38 9 13.31 11 14.90 10 11.88 45 15.21 Cavalier 2 29.90 1 20.04 1 23.75 1 26.16 5 25.36 Dickey 8 139.42 1 19.64 0 0.00 1 21.46 10 49.57 Divide 1 38.45 2 99.65 0 0.00 2 130.21 5 63.83 Dunn 6 138.50 2 55.99 0 0.00 1 33.93 9 64.94 Eddy 2 72.02 1 44.56 0 0.00 1 47.46 4 43.70 Emmons 2 33.57 2 46.00 0 0.00 1 31.00 5 29.51 Foster 1 25.81 1 31.58 2 72.02 2 69.74 6 47.29 Golden Valley 3 133.75 1 50.68 0 0.00 2 117.92 6 78.60 Grand Forks 14 24.87 13 24.87 11 20.52 6 10.60 44 20.11 Grant 2 53.43 1 32.95 0 0.00 0 0.00 3 25.88 Griggs 0 0.00 1 43.23 2 89.69 0 0.00 3 32.39 Hettinger 4 105.54 0 0.00 1 44.54 0 0.00 5 45.70 Kidder 1 31.54 1 36.54 1 39.02 4 165.63 7 64.30 LaMoure 2 39.27 1 23.14 1 24.97 3 77.08 7 40.44 Logan 0 0.00 0 0.00 0 0.00 1 56.95 1 11.06 McHenry 9 136.84 2 36.46 0 0.00 1 21.11 12 55.58 McIntosh 1 27.97 2 77.64 1 50.76 0 0.00 4 40.28 McKenzie 9 132.49 3 49.61 5 98.83 3 61.17 20 87.71 McLean 7 71.28 4 45.32 2 24.37 2 24.62 15 42.89 Mercer 2 25.87 4 48.51 3 40.25 5 65.38 14 45.05 Morton 8 35.00 8 39.00 3 15.32 8 38.44 27 32.24 Mountrail 7 107.26 1 16.49 7 122.21 9 154.14 24 99.35 Nelson 2 51.95 1 31.58 0 0.00 1 39.23 4 32.45 Oliver 4 174.14 1 45.98 1 47.39 1 47.92 7 80.75 Pembina 4 49.71 0 0.00 2 29.25 0 0.00 6 20.82 Pierce 1 17.13 1 22.40 1 27.74 0 0.00 3 17.19 Ramsey 4 34.64 2 20.67 3 33.03 4 42.84 13 32.79 Ransom 3 59.16 3 70.13 0 0.00 1 23.50 7 39.59 Renville 1 32.10 0 0.00 0 0.00 1 43.98 2 19.30 Richland 5 26.63 3 18.40 4 25.97 3 17.74 15 22.25 Rolette 8 58.59 9 71.16 5 40.31 4 28.09 26 49.11 Sargent 7 156.35 2 53.95 1 28.83 1 27.80 11 72.13 Sheridan 3 136.80 0 0.00 0 0.00 1 88.03 4 64.60 Sioux 1 23.95 2 52.38 2 50.52 1 22.35 6 36.53 Slope 0 0.00 0 0.00 0 0.00 0 0.00 0 0.00 Stark 11 47.01 2 9.94 1 5.56 2 10.69 16 19.95 Steele 2 81.97 0 0.00 0 0.00 1 59.38 3 38.72 Stutsman 4 20.98 1 5.96 2 12.37 2 12.39 9 13.21 Towner 3 92.97 1 35.50 1 39.95 1 42.79 6 55.13 Traill 3 38.83 1 14.73 1 15.07 0 0.00 5 17.78 Walsh 5 40.29 2 19.01 2 20.02 6 57.99 15 34.67 Ward 12 24.36 19 42.18 10 23.08 9 19.54 50 27.22 Wells 1 17.68 1 22.28 1 27.14 0 0.00 3 17.32 Williams 18 88.05 7 37.40 2 12.47 8 49.55 35 49.05 North Dakota 237 42.42 138 27.65 108 22.44 133 26.22 616 30.10
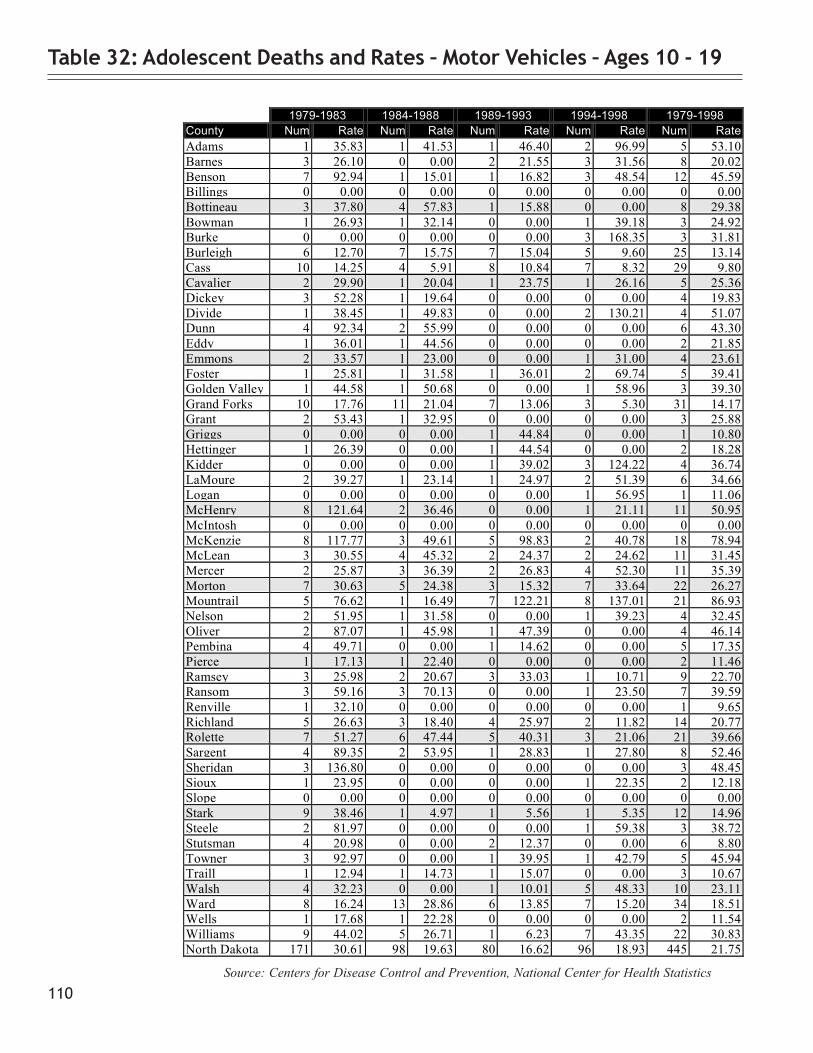
110
Table 32: Adolescent Deaths and Rates – Motor Vehicles – Ages 10 - 19
Source: Centers for Disease Control and Prevention, National Center for Health Statistics
1979-1983 1984-1988 1989-1993 1994-1998 1979-1998 County Num Rate Num Rate Num Rate Num Rate Num Rate Adams 1 35.83 1 41.53 1 46.40 2 96.99 5 53.10 Barnes 3 26.10 0 0.00 2 21.55 3 31.56 8 20.02 Benson 7 92.94 1 15.01 1 16.82 3 48.54 12 45.59 Billings 0 0.00 0 0.00 0 0.00 0 0.00 0 0.00 Bottineau 3 37.80 4 57.83 1 15.88 0 0.00 8 29.38 Bowman 1 26.93 1 32.14 0 0.00 1 39.18 3 24.92 Burke 0 0.00 0 0.00 0 0.00 3 168.35 3 31.81 Burleigh 6 12.70 7 15.75 7 15.04 5 9.60 25 13.14 Cass 10 14.25 4 5.91 8 10.84 7 8.32 29 9.80 Cavalier 2 29.90 1 20.04 1 23.75 1 26.16 5 25.36 Dickey 3 52.28 1 19.64 0 0.00 0 0.00 4 19.83 Divide 1 38.45 1 49.83 0 0.00 2 130.21 4 51.07 Dunn 4 92.34 2 55.99 0 0.00 0 0.00 6 43.30 Eddy 1 36.01 1 44.56 0 0.00 0 0.00 2 21.85 Emmons 2 33.57 1 23.00 0 0.00 1 31.00 4 23.61 Foster 1 25.81 1 31.58 1 36.01 2 69.74 5 39.41 Golden Valley 1 44.58 1 50.68 0 0.00 1 58.96 3 39.30 Grand Forks 10 17.76 11 21.04 7 13.06 3 5.30 31 14.17 Grant 2 53.43 1 32.95 0 0.00 0 0.00 3 25.88 Griggs 0 0.00 0 0.00 1 44.84 0 0.00 1 10.80 Hettinger 1 26.39 0 0.00 1 44.54 0 0.00 2 18.28 Kidder 0 0.00 0 0.00 1 39.02 3 124.22 4 36.74 LaMoure 2 39.27 1 23.14 1 24.97 2 51.39 6 34.66 Logan 0 0.00 0 0.00 0 0.00 1 56.95 1 11.06 McHenry 8 121.64 2 36.46 0 0.00 1 21.11 11 50.95 McIntosh 0 0.00 0 0.00 0 0.00 0 0.00 0 0.00 McKenzie 8 117.77 3 49.61 5 98.83 2 40.78 18 78.94 McLean 3 30.55 4 45.32 2 24.37 2 24.62 11 31.45 Mercer 2 25.87 3 36.39 2 26.83 4 52.30 11 35.39 Morton 7 30.63 5 24.38 3 15.32 7 33.64 22 26.27 Mountrail 5 76.62 1 16.49 7 122.21 8 137.01 21 86.93 Nelson 2 51.95 1 31.58 0 0.00 1 39.23 4 32.45 Oliver 2 87.07 1 45.98 1 47.39 0 0.00 4 46.14 Pembina 4 49.71 0 0.00 1 14.62 0 0.00 5 17.35 Pierce 1 17.13 1 22.40 0 0.00 0 0.00 2 11.46 Ramsey 3 25.98 2 20.67 3 33.03 1 10.71 9 22.70 Ransom 3 59.16 3 70.13 0 0.00 1 23.50 7 39.59 Renville 1 32.10 0 0.00 0 0.00 0 0.00 1 9.65 Richland 5 26.63 3 18.40 4 25.97 2 11.82 14 20.77 Rolette 7 51.27 6 47.44 5 40.31 3 21.06 21 39.66 Sargent 4 89.35 2 53.95 1 28.83 1 27.80 8 52.46 Sheridan 3 136.80 0 0.00 0 0.00 0 0.00 3 48.45 Sioux 1 23.95 0 0.00 0 0.00 1 22.35 2 12.18 Slope 0 0.00 0 0.00 0 0.00 0 0.00 0 0.00 Stark 9 38.46 1 4.97 1 5.56 1 5.35 12 14.96 Steele 2 81.97 0 0.00 0 0.00 1 59.38 3 38.72 Stutsman 4 20.98 0 0.00 2 12.37 0 0.00 6 8.80 Towner 3 92.97 0 0.00 1 39.95 1 42.79 5 45.94 Traill 1 12.94 1 14.73 1 15.07 0 0.00 3 10.67 Walsh 4 32.23 0 0.00 1 10.01 5 48.33 10 23.11 Ward 8 16.24 13 28.86 6 13.85 7 15.20 34 18.51 Wells 1 17.68 1 22.28 0 0.00 0 0.00 2 11.54 Williams 9 44.02 5 26.71 1 6.23 7 43.35 22 30.83 North Dakota 171 30.61 98 19.63 80 16.62 96 18.93 445 21.75

111
Table 33: Adolescent Deaths and Rates – Suicide – Ages 10 – 14
Source: Centers for Disease Control and Prevention, National Center for Health Statistics
1979-1983 1984-1988 1989-1993 1994-1998 1979-1998 County Num Rate Num Rate Num Rate Num Rate Num Rate Adams 0 0.00 0 0.00 0 0.00 0 0.00 0 0.00 Barnes 0 0.00 0 0.00 0 0.00 0 0.00 0 0.00 Benson 0 0.00 1 27.89 0 0.00 2 58.91 3 21.13 Billings 0 0.00 0 0.00 0 0.00 0 0.00 0 0.00 Bottineau 0 0.00 0 0.00 0 0.00 0 0.00 0 0.00 Bowman 0 0.00 0 0.00 0 0.00 0 0.00 0 0.00 Burke 0 0.00 0 0.00 0 0.00 0 0.00 0 0.00 Burleigh 0 0.00 2 9.24 0 0.00 2 7.82 4 4.30 Cass 1 3.32 0 0.00 2 5.65 4 10.24 7 5.18 Cavalier 0 0.00 0 0.00 0 0.00 0 0.00 0 0.00 Dickey 0 0.00 0 0.00 0 0.00 0 0.00 0 0.00 Divide 0 0.00 0 0.00 0 0.00 0 0.00 0 0.00 Dunn 0 0.00 0 0.00 0 0.00 0 0.00 0 0.00 Eddy 0 0.00 0 0.00 0 0.00 0 0.00 0 0.00 Emmons 0 0.00 0 0.00 0 0.00 0 0.00 0 0.00 Foster 0 0.00 1 62.34 0 0.00 0 0.00 1 15.54 Golden Valley 0 0.00 0 0.00 0 0.00 0 0.00 0 0.00 Grand Forks 0 0.00 0 0.00 1 4.22 0 0.00 1 1.09 Grant 0 0.00 0 0.00 0 0.00 0 0.00 0 0.00 Griggs 0 0.00 0 0.00 0 0.00 0 0.00 0 0.00 Hettinger 0 0.00 0 0.00 0 0.00 0 0.00 0 0.00 Kidder 0 0.00 0 0.00 0 0.00 0 0.00 0 0.00 LaMoure 1 39.22 0 0.00 0 0.00 0 0.00 1 10.81 Logan 0 0.00 0 0.00 0 0.00 0 0.00 0 0.00 McHenry 0 0.00 0 0.00 0 0.00 0 0.00 0 0.00 McIntosh 0 0.00 0 0.00 0 0.00 0 0.00 0 0.00 McKenzie 0 0.00 0 0.00 0 0.00 0 0.00 0 0.00 McLean 0 0.00 0 0.00 0 0.00 1 22.16 1 5.23 Mercer 0 0.00 0 0.00 0 0.00 0 0.00 0 0.00 Morton 0 0.00 0 0.00 0 0.00 2 18.52 2 4.66 Mountrail 0 0.00 0 0.00 0 0.00 0 0.00 0 0.00 Nelson 0 0.00 0 0.00 0 0.00 0 0.00 0 0.00 Oliver 0 0.00 0 0.00 0 0.00 0 0.00 0 0.00 Pembina 0 0.00 1 26.60 0 0.00 0 0.00 1 6.58 Pierce 0 0.00 0 0.00 0 0.00 0 0.00 0 0.00 Ramsey 0 0.00 0 0.00 1 20.85 0 0.00 1 5.20 Ransom 0 0.00 0 0.00 1 44.39 0 0.00 1 10.90 Renville 0 0.00 0 0.00 0 0.00 0 0.00 0 0.00 Richland 0 0.00 0 0.00 0 0.00 0 0.00 0 0.00 Rolette 0 0.00 0 0.00 0 0.00 0 0.00 0 0.00 Sargent 0 0.00 0 0.00 0 0.00 0 0.00 0 0.00 Sheridan 0 0.00 0 0.00 1 143.68 0 0.00 1 30.86 Sioux 0 0.00 0 0.00 0 0.00 1 40.26 1 11.18 Slope 0 0.00 0 0.00 0 0.00 0 0.00 0 0.00 Stark 0 0.00 0 0.00 1 10.60 0 0.00 1 2.57 Steele 0 0.00 0 0.00 0 0.00 0 0.00 0 0.00 Stutsman 0 0.00 0 0.00 0 0.00 0 0.00 0 0.00 Towner 0 0.00 0 0.00 0 0.00 0 0.00 0 0.00 Traill 0 0.00 0 0.00 0 0.00 1 29.73 1 7.60 Walsh 0 0.00 0 0.00 0 0.00 0 0.00 0 0.00 Ward 1 4.47 0 0.00 0 0.00 0 0.00 1 1.13 Wells 0 0.00 0 0.00 0 0.00 0 0.00 0 0.00 Williams 0 0.00 0 0.00 1 11.34 0 0.00 1 2.77 North Dakota 3 1.18 5 2.07 8 3.23 13 5.18 29 2.91

112
Table 34: Adolescent Deaths and Rates – Suicide – Ages 15 – 19
Source: Centers for Disease Control and Prevention, National Center for Health Statistics
1979-1983 1984-1988 1989-1993 1994-1998 1979-1998 County Num Rate Num Rate Num Rate Num Rate Num Rate Adams 0 0.00 0 0.00 0 0.00 0 0.00 0 0.00 Barnes 0 0.00 0 0.00 0 0.00 1 19.63 1 4.55 Benson 5 137.85 2 65.00 1 37.95 4 143.58 12 98.97 Billings 0 0.00 0 0.00 0 0.00 0 0.00 0 0.00 Bottineau 0 0.00 2 55.13 0 0.00 0 0.00 2 14.04 Bowman 0 0.00 0 0.00 2 168.63 0 0.00 2 34.81 Burke 0 0.00 0 0.00 0 0.00 0 0.00 0 0.00 Burleigh 6 23.61 4 17.55 2 8.85 5 18.89 17 17.48 Cass 2 4.99 1 2.70 6 15.62 5 11.09 14 8.71 Cavalier 2 56.40 1 40.65 0 0.00 0 0.00 3 31.03 Dickey 0 0.00 0 0.00 1 42.09 0 0.00 1 9.61 Divide 0 0.00 1 109.41 0 0.00 0 0.00 1 28.29 Dunn 0 0.00 0 0.00 0 0.00 0 0.00 0 0.00 Eddy 0 0.00 0 0.00 0 0.00 0 0.00 0 0.00 Emmons 0 0.00 1 46.90 0 0.00 0 0.00 1 12.07 Foster 0 0.00 0 0.00 0 0.00 2 141.14 2 31.98 Golden Valley 0 0.00 0 0.00 0 0.00 0 0.00 0 0.00 Grand Forks 0 0.00 4 13.04 4 13.37 2 6.13 10 7.86 Grant 0 0.00 0 0.00 0 0.00 0 0.00 0 0.00 Griggs 0 0.00 0 0.00 0 0.00 1 104.49 1 23.68 Hettinger 0 0.00 0 0.00 0 0.00 0 0.00 0 0.00 Kidder 0 0.00 0 0.00 0 0.00 0 0.00 0 0.00 LaMoure 0 0.00 0 0.00 1 57.90 0 0.00 1 12.40 Logan 0 0.00 0 0.00 0 0.00 0 0.00 0 0.00 McHenry 1 30.38 0 0.00 0 0.00 0 0.00 1 9.94 McIntosh 1 53.45 1 79.30 0 0.00 0 0.00 2 41.30 McKenzie 0 0.00 1 35.25 0 0.00 1 44.52 2 18.70 McLean 0 0.00 0 0.00 2 57.77 0 0.00 2 12.62 Mercer 1 26.83 0 0.00 1 32.91 1 30.33 3 21.87 Morton 0 0.00 1 9.94 3 33.23 4 39.96 8 19.59 Mountrail 1 30.40 0 0.00 1 37.74 0 0.00 2 17.14 Nelson 0 0.00 0 0.00 0 0.00 0 0.00 0 0.00 Oliver 0 0.00 0 0.00 0 0.00 0 0.00 0 0.00 Pembina 1 24.70 0 0.00 0 0.00 2 63.01 3 22.03 Pierce 1 33.51 0 0.00 0 0.00 0 0.00 1 11.97 Ramsey 1 15.36 1 19.89 0 0.00 0 0.00 2 9.79 Ransom 0 0.00 0 0.00 0 0.00 0 0.00 0 0.00 Renville 0 0.00 0 0.00 0 0.00 0 0.00 0 0.00 Richland 1 8.00 0 0.00 1 12.41 5 52.73 7 17.64 Rolette 1 14.52 0 0.00 2 37.86 1 16.39 4 16.61 Sargent 0 0.00 0 0.00 0 0.00 1 59.45 1 13.94 Sheridan 0 0.00 0 0.00 1 177.94 0 0.00 1 33.88 Sioux 1 49.95 1 57.64 1 56.98 3 150.75 6 80.19 Slope 0 0.00 0 0.00 0 0.00 0 0.00 0 0.00 Stark 2 15.35 3 28.71 3 35.10 1 10.72 9 21.76 Steele 1 78.74 0 0.00 0 0.00 0 0.00 1 26.33 Stutsman 2 19.97 1 11.90 0 0.00 3 36.96 6 17.51 Towner 1 60.79 1 75.76 0 0.00 0 0.00 2 39.53 Traill 0 0.00 0 0.00 0 0.00 0 0.00 0 0.00 Walsh 1 15.76 0 0.00 0 0.00 0 0.00 1 4.93 Ward 3 11.17 2 8.46 5 23.21 5 21.27 15 15.70 Wells 2 69.83 1 45.27 0 0.00 1 57.74 4 46.88 Williams 2 17.98 2 21.45 1 13.84 0 0.00 5 14.18 North Dakota 39 12.85 31 12.05 38 16.29 48 18.73 156 14.86

113
1979-1983 1984-1988 1989-1993 1994-1998 1979-1998 County Num Rate Num Rate Num Rate Num Rate Num Rate Adams 0 0.00 0 0.00 0 0.00 0 0.00 0 0.00 Barnes 0 0.00 0 0.00 0 0.00 1 10.52 1 2.50 Benson 5 66.38 3 45.02 1 16.82 6 97.07 15 56.98 Billings 0 0.00 0 0.00 0 0.00 0 0.00 0 0.00 Bottineau 0 0.00 2 28.91 0 0.00 0 0.00 2 7.35 Bowman 0 0.00 0 0.00 2 75.16 0 0.00 2 16.61 Burke 0 0.00 0 0.00 0 0.00 0 0.00 0 0.00 Burleigh 6 12.70 6 13.50 2 4.30 7 13.45 21 11.04 Cass 3 4.28 1 1.48 8 10.84 9 10.70 21 7.10 Cavalier 2 29.90 1 20.04 0 0.00 0 0.00 3 15.22 Dickey 0 0.00 0 0.00 1 21.34 0 0.00 1 4.96 Divide 0 0.00 1 49.83 0 0.00 0 0.00 1 12.77 Dunn 0 0.00 0 0.00 0 0.00 0 0.00 0 0.00 Eddy 0 0.00 0 0.00 0 0.00 0 0.00 0 0.00 Emmons 0 0.00 1 23.00 0 0.00 0 0.00 1 5.90 Foster 0 0.00 1 31.58 0 0.00 2 69.74 3 23.65 Golden Valley 0 0.00 0 0.00 0 0.00 0 0.00 0 0.00 Grand Forks 0 0.00 4 7.65 5 9.33 2 3.53 11 5.03 Grant 0 0.00 0 0.00 0 0.00 0 0.00 0 0.00 Griggs 0 0.00 0 0.00 0 0.00 1 47.01 1 10.80 Hettinger 0 0.00 0 0.00 0 0.00 0 0.00 0 0.00 Kidder 0 0.00 0 0.00 0 0.00 0 0.00 0 0.00 LaMoure 1 19.63 0 0.00 1 24.97 0 0.00 2 11.55 Logan 0 0.00 0 0.00 0 0.00 0 0.00 0 0.00 McHenry 1 15.20 0 0.00 0 0.00 0 0.00 1 4.63 McIntosh 1 27.97 1 38.82 0 0.00 0 0.00 2 20.14 McKenzie 0 0.00 1 16.54 0 0.00 1 20.39 2 8.77 McLean 0 0.00 0 0.00 2 24.37 1 12.31 3 8.58 Mercer 1 12.93 0 0.00 1 13.42 1 13.08 3 9.65 Morton 0 0.00 1 4.88 3 15.32 6 28.83 10 11.94 Mountrail 1 15.32 0 0.00 1 17.46 0 0.00 2 8.28 Nelson 0 0.00 0 0.00 0 0.00 0 0.00 0 0.00 Oliver 0 0.00 0 0.00 0 0.00 0 0.00 0 0.00 Pembina 1 12.43 1 14.03 0 0.00 2 29.38 4 13.88 Pierce 1 17.13 0 0.00 0 0.00 0 0.00 1 5.73 Ramsey 1 8.66 1 10.33 1 11.01 0 0.00 3 7.57 Ransom 0 0.00 0 0.00 1 24.52 0 0.00 1 5.66 Renville 0 0.00 0 0.00 0 0.00 0 0.00 0 0.00 Richland 1 5.33 0 0.00 1 6.49 5 29.56 7 10.39 Rolette 1 7.32 0 0.00 2 16.12 1 7.02 4 7.55 Sargent 0 0.00 0 0.00 0 0.00 1 27.80 1 6.56 Sheridan 0 0.00 0 0.00 2 158.98 0 0.00 2 32.30 Sioux 1 23.95 1 26.19 1 25.26 4 89.41 7 42.62 Slope 0 0.00 0 0.00 0 0.00 0 0.00 0 0.00 Stark 2 8.55 3 14.91 4 22.24 1 5.35 10 12.47 Steele 1 40.98 0 0.00 0 0.00 0 0.00 1 12.91 Stutsman 2 10.49 1 5.96 0 0.00 3 18.59 6 8.80 Towner 1 30.99 1 35.50 0 0.00 0 0.00 2 18.38 Traill 0 0.00 0 0.00 0 0.00 1 14.35 1 3.56 Walsh 1 8.06 0 0.00 0 0.00 0 0.00 1 2.31 Ward 4 8.12 2 4.44 5 11.54 5 10.86 16 8.71 Wells 2 35.35 1 22.28 0 0.00 1 28.60 4 23.09 Williams 2 9.78 2 10.68 2 12.47 0 0.00 6 8.41 North Dakota 42 7.52 36 7.21 46 9.56 61 12.03 185 9.04
Table 35: Adolescent Deaths and Rates – Suicide – Ages 10 – 19
Source: Centers for Disease Control and Prevention, National Center for Health Statistics

114
Table 36: Teen Pregnancies by County
Source: NDDoH, Division of Vital Records
County 1991 1992 1993 1994 1995 1996 1997 1998 1999 2000 Adams 6 6 1 1 0 1 0 0 3 3 Barnes 14 14 8 14 13 22 13 12 16 8 Benson 43 24 33 25 27 27 24 26 30 33 Billings 1 1 0 0 2 1 0 1 1 3 Bottineau 7 5 5 3 5 5 5 4 8 10 Bowman 4 2 3 4 0 4 3 0 1 3 Burke 1 3 0 2 1 0 1 1 0 1 Burleigh 114 105 94 103 100 98 107 83 66 82 Cass 155 157 168 142 140 140 125 175 168 138 Cavalier 7 6 1 3 2 3 6 0 2 1 Dickey 7 5 4 7 4 2 3 6 4 7 Divide 1 1 2 1 2 3 1 2 0 0 Dunn 2 4 7 4 5 5 1 2 0 2 Eddy 0 2 1 2 4 3 2 3 4 0 Emmons 3 3 2 3 7 5 1 3 2 1 Foster 6 8 10 4 10 3 7 3 4 1 Golden Valley 0 6 4 3 2 2 2 2 2 1 Grand Forks 124 118 116 123 130 108 115 93 100 119 Grant 3 3 1 1 2 4 2 2 0 4 Griggs 4 5 4 2 5 3 1 2 2 1 Hettinger 3 4 1 3 2 1 1 1 3 0 Kidder 0 5 4 3 0 2 5 3 3 3 LaMoure 5 5 4 1 4 7 0 5 0 0 Logan 1 1 3 1 8 1 3 3 1 1 McHenry 8 6 3 4 5 5 9 5 4 3 McIntosh 2 4 3 2 8 2 1 3 1 1 McKenzie 10 19 12 7 8 12 12 9 16 8 McLean 12 16 11 19 14 16 10 13 12 10 Mercer 9 6 11 11 11 14 10 4 9 8 Morton 32 40 46 39 33 29 33 39 29 34 Mountrail 18 16 13 16 16 16 15 22 13 19 Nelson 4 5 6 3 4 1 4 2 1 1 Oliver 1 0 0 1 4 3 1 0 3 2 Pembina 8 13 7 14 10 5 8 12 9 15 Pierce 5 2 4 3 9 5 3 4 7 4 Ramsey 22 32 27 25 29 33 33 30 21 22 Ransom 7 9 6 13 5 5 3 5 6 5 Renville 1 1 2 2 3 1 2 1 2 1 Richland 21 24 26 19 29 23 26 29 25 17 Rolette 77 78 75 75 73 72 79 73 59 62 Sargent 2 5 7 3 5 6 3 7 2 7 Sheridan 0 1 2 0 3 1 2 1 4 0 Sioux 22 24 26 19 31 17 19 21 22 23 Slope 0 0 0 0 0 0 0 1 0 0 Stark 32 28 26 43 35 32 39 30 27 26 Steele 0 2 2 2 3 3 1 2 0 1 Stutsman 35 43 47 32 35 30 28 25 32 23 Towner 6 6 1 4 2 3 1 2 1 3 Traill 7 10 10 9 8 8 7 5 9 6 Walsh 14 13 22 19 25 26 16 12 25 20 Ward 111 134 128 132 122 129 118 135 96 105 Wells 4 2 2 6 6 7 1 2 2 6 Williams 32 40 55 48 37 45 34 37 40 28 North Dakota 1,013 1,072 1,056 1,025 1,048 999 946 963 897 877

115
County 1991 1992 1993 1994 1995 1996 1997 1998 1999 2000 Adams 63.16 63.16 10.53 10.53 0.00 10.53 0.00 0.00 31.58 33.33 Barnes 29.79 29.79 17.02 29.79 27.66 46.81 27.66 25.53 34.04 16.56 Benson 161.65 90.23 124.06 93.98 101.50 101.50 90.23 97.74 112.78 107.49 Billings 24.39 24.39 0.00 0.00 48.78 24.39 0.00 24.39 24.39 76.92 Bottineau 24.14 17.24 17.24 10.34 17.24 17.24 17.24 13.79 27.59 35.84 Bowman 32.26 16.13 24.19 32.26 0.00 32.26 24.19 0.00 8.06 24.19 Burke 11.24 33.71 0.00 22.47 11.24 0.00 11.24 11.24 0.00 12.99 Burleigh 50.18 46.21 41.37 45.33 44.01 43.13 47.10 36.53 29.05 29.07 Cass 45.36 45.95 49.17 41.56 40.97 40.97 36.58 51.21 49.17 29.25 Cavalier 42.68 36.59 6.10 18.29 12.20 18.29 36.59 0.00 12.20 6.13 Dickey 31.11 22.22 17.78 31.11 17.78 8.89 13.33 26.67 17.78 31.96 Divide 14.71 14.71 29.41 14.71 29.41 44.12 14.71 29.41 0.00 0.00 Dunn 15.38 30.77 53.85 30.77 38.46 38.46 7.69 15.38 0.00 13.33 Eddy 0.00 27.78 13.89 27.78 55.56 41.67 27.78 41.67 55.56 0.00 Emmons 18.87 18.87 12.58 18.87 44.03 31.45 6.29 18.87 12.58 7.69 Foster 51.28 68.38 85.47 34.19 85.47 25.64 59.83 25.64 34.19 7.52 Golden Valley 0.00 86.96 57.97 43.48 28.99 28.99 28.99 28.99 28.99 11.63 Grand Forks 43.36 41.26 40.56 43.01 45.45 37.76 40.21 32.52 34.97 37.85 Grant 28.30 28.30 9.43 9.43 18.87 37.74 18.87 18.87 0.00 40.40 Griggs 42.55 53.19 42.55 21.28 53.19 31.91 10.64 21.28 21.28 9.71 Hettinger 28.85 38.46 9.62 28.85 19.23 9.62 9.62 9.62 28.85 0.00 Kidder 0.00 53.76 43.01 32.26 0.00 21.51 53.76 32.26 32.26 32.61 LaMoure 30.12 30.12 24.10 6.02 24.10 42.17 0.00 30.12 0.00 0.00 Logan 12.05 12.05 36.14 12.05 96.39 12.05 36.14 36.14 12.05 13.70 McHenry 40.20 30.15 15.08 20.10 25.13 25.13 45.23 25.13 20.10 14.15 McIntosh 24.69 49.38 37.04 24.69 98.77 24.69 12.35 37.04 12.35 8.33 McKenzie 44.25 84.07 53.10 30.97 35.40 53.10 53.10 39.82 70.80 33.90 McLean 36.59 48.78 33.54 57.93 42.68 48.78 30.49 39.63 36.59 29.50 Mercer 29.32 19.54 35.83 35.83 35.83 45.60 32.57 13.03 29.32 21.11 Morton 36.78 45.98 52.87 44.83 37.93 33.33 37.93 44.83 33.33 34.38 Mountrail 71.15 63.24 51.38 63.24 63.24 63.24 59.29 86.96 51.38 70.11 Nelson 34.19 42.74 51.28 25.64 34.19 8.55 34.19 17.09 8.55 7.75 Oliver 12.99 0.00 0.00 12.99 51.95 38.96 12.99 0.00 38.96 23.26 Pembina 25.72 41.80 22.51 45.02 32.15 16.08 25.72 38.59 28.94 43.60 Pierce 34.01 13.61 27.21 20.41 61.22 34.01 20.41 27.21 47.62 24.39 Ramsey 53.66 78.05 65.85 60.98 70.73 80.49 80.49 73.17 51.22 46.22 Ransom 44.87 57.69 38.46 83.33 32.05 32.05 19.23 32.05 38.46 26.74 Renville 9.17 9.17 18.35 18.35 27.52 9.17 18.35 9.17 18.35 10.87 Richland 32.86 37.56 40.69 29.73 45.38 35.99 40.69 45.38 39.12 20.81 Rolette 149.22 151.16 145.35 145.35 141.47 139.53 153.10 141.47 114.34 93.37 Sargent 13.16 32.89 46.05 19.74 32.89 39.47 19.74 46.05 13.16 52.63 Sheridan 0.00 17.86 35.71 0.00 53.57 17.86 35.71 17.86 71.43 0.00 Sioux 134.97 147.24 159.51 116.56 190.18 104.29 116.56 128.83 134.97 113.30 Slope 0.00 0.00 0.00 0.00 0.00 0.00 0.00 27.78 0.00 0.00 Stark 38.98 34.10 31.67 52.38 42.63 38.98 47.50 36.54 32.90 26.78 Steele 0.00 29.85 29.85 29.85 44.78 44.78 14.93 29.85 0.00 11.63 Stutsman 48.08 59.07 64.56 43.96 48.08 41.21 38.46 34.34 43.96 26.14 Towner 51.72 51.72 8.62 34.48 17.24 25.86 8.62 17.24 8.62 37.97 Traill 21.28 30.40 30.40 27.36 24.32 24.32 21.28 15.20 27.36 17.60 Walsh 32.86 30.52 51.64 44.60 58.69 61.03 37.56 28.17 58.69 44.05 Ward 50.41 60.85 58.13 59.95 55.40 58.58 53.59 61.31 43.60 45.69 Wells 25.48 12.74 12.74 38.22 38.22 44.59 6.37 12.74 12.74 34.88 Williams 44.02 55.02 75.65 66.02 50.89 61.90 46.77 50.89 55.02 31.18 North Dakota 45.43 48.07 47.35 45.96 47.00 44.80 42.42 43.18 40.22 33.92
Table 37: Teen Pregnancy Rates by County
Source: NDDoH, Division of Vital Records

116
Table 38: Teen Births by County
Source: NDDoH, Division of Vital Records
County 1991 1992 1993 1994 1995 1996 1997 1998 1999 2000 Adams 6 5 1 1 0 1 0 0 3 2 Barnes 9 11 7 11 8 18 9 9 14 8 Benson 42 23 31 23 24 26 22 23 27 31 Billings 1 0 0 0 1 1 0 1 1 2 Bottineau 5 2 3 2 3 4 3 3 8 7 Bowman 3 2 2 4 0 4 3 0 1 3 Burke 1 2 0 1 1 0 1 1 0 0 Burleigh 86 71 70 67 69 73 77 66 44 68 Cass 96 98 113 92 93 89 95 131 113 90 Cavalier 6 4 0 2 1 2 4 0 2 0 Dickey 4 4 4 7 3 1 2 5 4 6 Divide 0 0 2 0 1 3 1 2 0 0 Dunn 2 4 7 2 3 3 1 2 0 2 Eddy 0 0 1 1 3 3 2 3 4 0 Emmons 3 2 2 2 6 4 1 3 2 1 Foster 5 7 8 2 9 1 7 3 4 0 Golden Valley 0 6 4 3 2 2 2 2 2 1 Grand Forks 80 75 79 86 92 80 86 69 72 92 Grant 3 3 1 1 2 4 2 2 0 3 Griggs 4 5 4 1 5 3 1 2 1 0 Hettinger 3 4 1 3 1 1 0 1 3 0 Kidder 0 5 4 3 0 2 4 3 3 3 LaMoure 5 2 1 1 3 7 0 4 0 0 Logan 1 0 2 0 5 1 2 3 0 1 McHenry 8 5 2 4 4 5 8 3 4 3 McIntosh 2 2 3 1 7 2 1 3 1 1 McKenzie 10 17 12 7 8 12 12 9 16 7 McLean 11 15 9 17 12 11 10 12 9 9 Mercer 7 5 10 9 6 10 9 2 8 8 Morton 23 34 37 32 29 27 26 36 23 25 Mountrail 14 15 12 12 15 14 12 18 10 17 Nelson 3 4 4 2 2 0 4 2 1 1 Oliver 1 0 0 1 3 2 1 0 3 2 Pembina 8 12 5 12 8 5 8 9 5 13 Pierce 4 2 4 3 8 4 2 1 5 3 Ramsey 17 25 24 20 25 24 28 21 19 20 Ransom 5 6 4 11 4 3 1 5 4 2 Renville 1 1 0 2 2 1 1 1 2 0 Richland 13 16 19 12 25 17 17 20 17 15 Rolette 72 75 73 70 68 71 75 68 54 58 Sargent 1 4 6 3 4 6 2 7 2 5 Sheridan 0 1 1 0 3 0 2 1 2 0 Sioux 22 22 25 19 30 16 18 21 22 22 Slope 0 0 0 0 0 0 0 1 0 0 Stark 26 22 21 37 28 23 30 26 21 23 Steele 0 1 2 1 2 2 1 1 0 0 Stutsman 27 32 37 25 26 26 24 17 25 16 Towner 5 4 1 3 1 3 1 1 1 2 Traill 4 9 6 5 5 5 6 4 8 4 Walsh 7 10 18 16 20 23 10 9 24 16 Ward 90 107 95 106 93 105 96 110 79 83 Wells 3 1 2 6 4 7 0 1 2 5 Williams 27 36 52 45 33 41 29 34 36 27 North Dakota 776 818 831 796 810 798 759 781 711 707

117
County 1991 1992 1993 1994 1995 1996 1997 1998 1999 2000 Adams 63.16 52.63 10.53 10.53 0.00 10.53 0.00 0.00 31.58 22.22 Barnes 19.15 23.40 14.89 23.40 17.02 38.30 19.15 19.15 29.79 16.56 Benson 157.89 86.47 116.54 86.47 90.23 97.74 82.71 86.47 101.50 100.98 Billings 24.39 0.00 0.00 0.00 24.39 24.39 0.00 24.39 24.39 51.28 Bottineau 17.24 6.90 10.34 6.90 10.34 13.79 10.34 10.34 27.59 25.09 Bowman 24.19 16.13 16.13 32.26 0.00 32.26 24.19 0.00 8.06 24.19 Burke 11.24 22.47 0.00 11.24 11.24 0.00 11.24 11.24 0.00 0.00 Burleigh 37.85 31.25 30.81 29.49 30.37 32.13 33.89 29.05 19.37 24.10 Cass 28.09 28.68 33.07 26.92 27.22 26.05 27.80 38.34 33.07 19.08 Cavalier 36.59 24.39 0.00 12.20 6.10 12.20 24.39 0.00 12.20 0.00 Dickey 17.78 17.78 17.78 31.11 13.33 4.44 8.89 22.22 17.78 27.40 Divide 0.00 0.00 29.41 0.00 14.71 44.12 14.71 29.41 0.00 0.00 Dunn 15.38 30.77 53.85 15.38 23.08 23.08 7.69 15.38 0.00 13.33 Eddy 0.00 0.00 13.89 13.89 41.67 41.67 27.78 41.67 55.56 0.00 Emmons 18.87 12.58 12.58 12.58 37.74 25.16 6.29 18.87 12.58 7.69 Foster 42.74 59.83 68.38 17.09 76.92 8.55 59.83 25.64 34.19 0.00 Golden Valley 0.00 86.96 57.97 43.48 28.99 28.99 28.99 28.99 28.99 11.63 Grand Forks 27.97 26.22 27.62 30.07 32.17 27.97 30.07 24.13 25.17 29.26 Grant 28.30 28.30 9.43 9.43 18.87 37.74 18.87 18.87 0.00 30.30 Griggs 42.55 53.19 42.55 10.64 53.19 31.91 10.64 21.28 10.64 0.00 Hettinger 28.85 38.46 9.62 28.85 9.62 9.62 0.00 9.62 28.85 0.00 Kidder 0.00 53.76 43.01 32.26 0.00 21.51 43.01 32.26 32.26 32.61 LaMoure 30.12 12.05 6.02 6.02 18.07 42.17 0.00 24.10 0.00 0.00 Logan 12.05 0.00 24.10 0.00 60.24 12.05 24.10 36.14 0.00 13.70 McHenry 40.20 25.13 10.05 20.10 20.10 25.13 40.20 15.08 20.10 14.15 McIntosh 24.69 24.69 37.04 12.35 86.42 24.69 12.35 37.04 12.35 8.33 McKenzie 44.25 75.22 53.10 30.97 35.40 53.10 53.10 39.82 70.80 29.66 McLean 33.54 45.73 27.44 51.83 36.59 33.54 30.49 36.59 27.44 26.55 Mercer 22.80 16.29 32.57 29.32 19.54 32.57 29.32 6.51 26.06 21.11 Morton 26.44 39.08 42.53 36.78 33.33 31.03 29.89 41.38 26.44 25.28 Mountrail 55.34 59.29 47.43 47.43 59.29 55.34 47.43 71.15 39.53 62.73 Nelson 25.64 34.19 34.19 17.09 17.09 0.00 34.19 17.09 8.55 7.75 Oliver 12.99 0.00 0.00 12.99 38.96 25.97 12.99 0.00 38.96 23.26 Pembina 25.72 38.59 16.08 38.59 25.72 16.08 25.72 28.94 16.08 37.79 Pierce 27.21 13.61 27.21 20.41 54.42 27.21 13.61 6.80 34.01 18.29 Ramsey 41.46 60.98 58.54 48.78 60.98 58.54 68.29 51.22 46.34 42.02 Ransom 32.05 38.46 25.64 70.51 25.64 19.23 6.41 32.05 25.64 10.70 Renville 9.17 9.17 0.00 18.35 18.35 9.17 9.17 9.17 18.35 0.00 Richland 20.34 25.04 29.73 18.78 39.12 26.60 26.60 31.30 26.60 18.36 Rolette 139.53 145.35 141.47 135.66 131.78 137.60 145.35 131.78 104.65 87.35 Sargent 6.58 26.32 39.47 19.74 26.32 39.47 13.16 46.05 13.16 37.59 Sheridan 0.00 17.86 17.86 0.00 53.57 0.00 35.71 17.86 35.71 0.00 Sioux 134.97 134.97 153.37 116.56 184.05 98.16 110.43 128.83 134.97 108.37 Slope 0.00 0.00 0.00 0.00 0.00 0.00 0.00 27.78 0.00 0.00 Stark 31.67 26.80 25.58 45.07 34.10 28.01 36.54 31.67 25.58 23.69 Steele 0.00 14.93 29.85 14.93 29.85 29.85 14.93 14.93 0.00 0.00 Stutsman 37.09 43.96 50.82 34.34 35.71 35.71 32.97 23.35 34.34 18.18 Towner 43.10 34.48 8.62 25.86 8.62 25.86 8.62 8.62 8.62 25.32 Traill 12.16 27.36 18.24 15.20 15.20 15.20 18.24 12.16 24.32 11.37 Walsh 16.43 23.47 42.25 37.56 46.95 53.99 23.47 21.13 56.34 35.24 Ward 40.87 48.59 43.14 48.14 42.23 47.68 43.60 49.95 35.88 36.12 Wells 19.11 6.37 12.74 38.22 25.48 44.59 0.00 6.37 12.74 29.07 Williams 37.14 49.52 71.53 61.90 45.39 56.40 39.89 46.77 49.52 30.07 North Dakota 34.80 36.68 37.26 35.70 36.32 35.78 34.04 35.02 31.88 27.34
Table 39: Teen Birth Rates by County
Source: NDDoH, Division of Vital Records
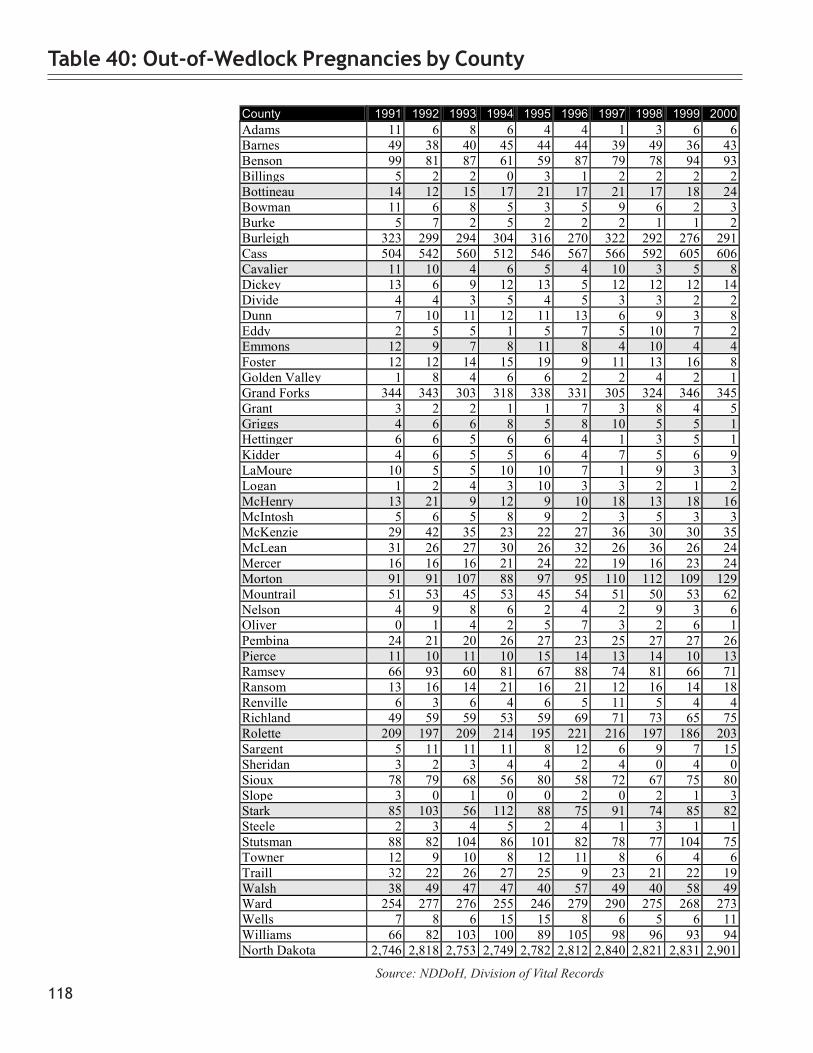
118
Table 40: Out-of-Wedlock Pregnancies by County
Source: NDDoH, Division of Vital Records
County 1991 1992 1993 1994 1995 1996 1997 1998 1999 2000 Adams 11 6 8 6 4 4 1 3 6 6 Barnes 49 38 40 45 44 44 39 49 36 43 Benson 99 81 87 61 59 87 79 78 94 93 Billings 5 2 2 0 3 1 2 2 2 2 Bottineau 14 12 15 17 21 17 21 17 18 24 Bowman 11 6 8 5 3 5 9 6 2 3 Burke 5 7 2 5 2 2 2 1 1 2 Burleigh 323 299 294 304 316 270 322 292 276 291 Cass 504 542 560 512 546 567 566 592 605 606 Cavalier 11 10 4 6 5 4 10 3 5 8 Dickey 13 6 9 12 13 5 12 12 12 14 Divide 4 4 3 5 4 5 3 3 2 2 Dunn 7 10 11 12 11 13 6 9 3 8 Eddy 2 5 5 1 5 7 5 10 7 2 Emmons 12 9 7 8 11 8 4 10 4 4 Foster 12 12 14 15 19 9 11 13 16 8 Golden Valley 1 8 4 6 6 2 2 4 2 1 Grand Forks 344 343 303 318 338 331 305 324 346 345 Grant 3 2 2 1 1 7 3 8 4 5 Griggs 4 6 6 8 5 8 10 5 5 1 Hettinger 6 6 5 6 6 4 1 3 5 1 Kidder 4 6 5 5 6 4 7 5 6 9 LaMoure 10 5 5 10 10 7 1 9 3 3 Logan 1 2 4 3 10 3 3 2 1 2 McHenry 13 21 9 12 9 10 18 13 18 16 McIntosh 5 6 5 8 9 2 3 5 3 3 McKenzie 29 42 35 23 22 27 36 30 30 35 McLean 31 26 27 30 26 32 26 36 26 24 Mercer 16 16 16 21 24 22 19 16 23 24 Morton 91 91 107 88 97 95 110 112 109 129 Mountrail 51 53 45 53 45 54 51 50 53 62 Nelson 4 9 8 6 2 4 2 9 3 6 Oliver 0 1 4 2 5 7 3 2 6 1 Pembina 24 21 20 26 27 23 25 27 27 26 Pierce 11 10 11 10 15 14 13 14 10 13 Ramsey 66 93 60 81 67 88 74 81 66 71 Ransom 13 16 14 21 16 21 12 16 14 18 Renville 6 3 6 4 6 5 11 5 4 4 Richland 49 59 59 53 59 69 71 73 65 75 Rolette 209 197 209 214 195 221 216 197 186 203 Sargent 5 11 11 11 8 12 6 9 7 15 Sheridan 3 2 3 4 4 2 4 0 4 0 Sioux 78 79 68 56 80 58 72 67 75 80 Slope 3 0 1 0 0 2 0 2 1 3 Stark 85 103 56 112 88 75 91 74 85 82 Steele 2 3 4 5 2 4 1 3 1 1 Stutsman 88 82 104 86 101 82 78 77 104 75 Towner 12 9 10 8 12 11 8 6 4 6 Traill 32 22 26 27 25 9 23 21 22 19 Walsh 38 49 47 47 40 57 49 40 58 49 Ward 254 277 276 255 246 279 290 275 268 273 Wells 7 8 6 15 15 8 6 5 6 11 Williams 66 82 103 100 89 105 98 96 93 94 North Dakota 2,746 2,818 2,753 2,749 2,782 2,812 2,840 2,821 2,831 2,901

119
County 1991 1992 1993 1994 1995 1996 1997 1998 1999 2000 Adams 275.00 193.55 210.53 260.87 153.85 160.00 38.46 157.89 352.94 230.77 Barnes 310.13 238.99 258.06 330.88 312.06 303.45 300.00 324.50 297.52 352.46 Benson 668.92 566.43 664.12 516.95 578.43 659.09 593.98 609.38 671.43 664.29 Billings 217.39 111.11 200.00 0.00 230.77 125.00 200.00 285.71 333.33 285.71 Bottineau 155.56 173.91 187.50 246.38 304.35 369.57 269.23 314.81 310.34 421.05 Bowman 229.17 193.55 210.53 156.25 107.14 138.89 250.00 176.47 111.11 90.91 Burke 172.41 333.33 74.07 238.10 83.33 117.65 117.65 100.00 58.82 111.11 Burleigh 320.44 296.92 312.10 300.40 321.14 284.21 325.25 314.32 296.14 303.76 Cass 283.78 287.99 302.21 278.87 292.92 294.55 301.92 319.83 314.78 318.78 Cavalier 137.50 142.86 66.67 98.36 108.70 111.11 188.68 69.77 161.29 210.53 Dickey 136.84 71.43 121.62 176.47 175.68 83.33 203.39 196.72 187.50 179.49 Divide 148.15 153.85 142.86 312.50 285.71 227.27 200.00 272.73 142.86 181.82 Dunn 142.86 217.39 200.00 235.29 305.56 302.33 166.67 346.15 96.77 342.42 Eddy 62.50 185.19 161.29 34.48 166.67 218.75 238.10 294.12 250.00 76.92 Emmons 171.43 160.71 114.75 135.59 174.60 163.27 83.33 222.22 129.03 137.93 Foster 181.82 250.00 304.35 277.78 339.29 243.24 268.29 250.00 340.43 250.00 Golden Valley 47.62 307.69 121.21 285.71 181.82 100.00 95.24 235.29 133.33 66.67 Grand Forks 253.87 257.70 228.16 244.43 263.04 261.04 268.96 286.73 355.24 338.90 Grant 111.11 58.82 55.56 45.45 25.64 233.33 115.38 320.00 210.53 263.16 Griggs 129.03 200.00 171.43 242.42 151.52 266.67 312.50 227.27 238.10 45.45 Hettinger 171.43 260.87 166.67 214.29 171.43 173.91 45.45 136.36 178.57 55.56 Kidder 111.11 193.55 156.25 185.19 230.77 153.85 233.33 263.16 222.22 333.33 LaMoure 175.44 108.70 96.15 227.27 163.93 179.49 23.81 180.00 120.00 71.43 Logan 45.45 95.24 129.03 107.14 322.58 90.91 125.00 71.43 55.56 117.65 McHenry 228.07 318.18 147.54 196.72 173.08 153.85 276.92 185.71 315.79 266.67 McIntosh 192.31 162.16 192.31 186.05 225.00 68.97 93.75 200.00 107.14 90.91 McKenzie 325.84 375.00 368.42 323.94 275.00 435.48 423.53 434.78 422.54 486.11 McLean 254.10 247.62 254.72 326.09 309.52 347.83 282.61 378.95 247.52 289.16 Mercer 118.52 130.08 140.35 218.75 203.39 241.76 226.19 188.24 310.81 324.32 Morton 297.39 263.01 330.25 268.29 286.14 295.95 323.53 331.36 327.33 398.15 Mountrail 443.48 486.24 409.09 514.56 428.57 439.02 485.71 588.24 514.56 632.65 Nelson 105.26 169.81 200.00 150.00 76.92 166.67 51.28 281.25 130.43 162.16 Oliver 0.00 58.82 266.67 133.33 312.50 411.76 166.67 133.33 333.33 71.43 Pembina 240.00 189.19 200.00 252.43 219.51 237.11 247.52 337.50 313.95 265.31 Pierce 200.00 172.41 203.70 208.33 294.12 250.00 213.11 264.15 217.39 295.45 Ramsey 340.21 415.18 309.28 433.16 370.17 517.65 435.29 452.51 442.95 446.54 Ransom 183.10 195.12 215.38 308.82 228.57 291.67 187.50 213.33 225.81 281.25 Renville 181.82 142.86 230.77 129.03 214.29 208.33 343.75 192.31 200.00 266.67 Richland 205.02 238.87 251.06 215.45 246.86 293.62 282.87 323.01 282.61 353.77 Rolette 633.33 609.91 659.31 658.46 663.27 708.33 701.30 693.66 715.38 681.21 Sargent 102.04 171.88 177.42 186.44 150.94 230.77 120.00 176.47 152.17 294.12 Sheridan 142.86 117.65 214.29 266.67 285.71 166.67 266.67 0.00 444.44 0.00 Sioux 735.85 699.12 800.00 727.27 761.90 734.18 672.90 614.68 721.15 747.66 Slope 250.00 0.00 83.33 0.00 0.00 285.71 0.00 200.00 142.86 428.57 Stark 230.98 311.18 201.44 332.34 275.86 253.38 309.52 268.12 299.30 308.27 Steele 86.96 120.00 121.21 185.19 68.97 133.33 50.00 136.36 47.62 76.92 Stutsman 304.50 294.96 329.11 306.05 371.32 344.54 305.88 354.84 379.56 339.37 Towner 352.94 264.71 250.00 228.57 333.33 305.56 250.00 260.87 235.29 352.94 Traill 283.19 203.70 270.83 241.07 252.53 108.43 191.67 212.12 217.82 220.93 Walsh 201.06 286.55 281.44 276.47 246.91 351.85 331.08 239.52 347.31 310.13 Ward 224.58 247.76 244.90 223.10 222.02 249.33 255.06 262.66 278.59 284.97 Wells 129.63 150.94 120.00 263.16 300.00 190.48 146.34 131.58 130.43 234.04 Williams 231.58 298.18 350.34 338.98 341.00 386.03 395.16 380.95 366.14 406.93 North Dakota 276.70 285.08 285.14 287.31 293.65 304.00 307.87 319.62 330.84 339.74
Table 41: Out-of-Wedlock Pregnancy Rates by County
Source: NDDoH, Division of Vital Records

120
County 1991 1992 1993 1994 1995 1996 1997 1998 1999 2000 Adams 10 5 7 6 3 4 1 3 5 5 Barnes 29 25 29 29 34 35 28 40 31 31 Benson 95 74 82 54 54 84 77 73 89 85 Billings 2 1 1 0 1 1 2 2 2 1 Bottineau 10 7 13 14 13 12 16 12 15 18 Bowman 9 6 7 3 2 5 9 6 2 3 Burke 5 5 2 4 2 2 2 1 1 1 Burleigh 226 212 203 207 218 189 230 209 179 224 Cass 269 304 330 287 324 342 387 402 372 375 Cavalier 10 8 3 2 4 3 7 3 4 6 Dickey 7 4 7 12 9 2 7 7 8 12 Divide 2 3 3 3 2 4 3 3 1 2 Dunn 5 8 11 9 9 10 6 8 3 7 Eddy 2 3 5 0 4 5 5 8 6 2 Emmons 9 6 5 6 10 7 4 8 4 4 Foster 10 11 11 12 17 6 10 10 9 6 Golden Valley 1 8 4 6 6 2 2 3 2 1 Grand Forks 201 197 177 195 200 221 218 205 235 239 Grant 3 2 1 1 1 6 3 8 4 4 Griggs 4 5 5 4 5 6 7 4 4 0 Hettinger 6 5 4 4 4 4 0 3 5 1 Kidder 1 6 4 4 3 4 6 5 6 9 LaMoure 9 1 1 9 7 7 1 5 2 2 Logan 1 1 2 2 6 3 2 2 0 2 McHenry 13 18 5 10 6 9 14 8 15 13 McIntosh 4 3 5 7 7 2 3 4 3 2 McKenzie 29 40 33 23 20 26 35 27 27 33 McLean 26 23 20 27 20 23 26 30 20 20 Mercer 11 12 14 17 17 17 16 12 19 24 Morton 70 70 80 68 75 73 86 93 84 101 Mountrail 43 42 40 45 37 43 45 42 45 54 Nelson 2 6 6 5 0 3 2 7 3 6 Oliver 0 1 3 2 4 6 2 0 5 0 Pembina 21 17 15 18 24 20 21 21 21 20 Pierce 8 8 9 8 11 10 10 10 9 8 Ramsey 49 76 47 61 57 69 62 61 52 58 Ransom 8 12 9 19 13 15 8 13 8 9 Renville 5 2 4 2 3 2 5 5 2 3 Richland 32 41 45 38 43 50 54 57 49 59 Rolette 196 184 196 197 178 211 200 182 173 183 Sargent 3 7 10 10 7 11 4 8 5 12 Sheridan 2 2 2 4 4 1 4 0 4 0 Sioux 74 76 63 53 72 50 66 64 69 72 Slope 2 0 1 0 0 2 0 2 1 3 Stark 64 76 47 95 69 60 67 63 72 67 Steele 2 1 4 3 1 3 1 2 1 0 Stutsman 64 62 79 61 79 62 60 59 74 52 Towner 9 7 9 6 11 11 8 4 2 3 Traill 23 13 19 12 13 6 19 14 19 12 Walsh 26 33 32 33 32 45 34 33 49 40 Ward 176 181 184 170 170 205 198 202 199 188 Wells 6 5 5 13 10 8 3 3 6 9 Williams 56 69 97 90 76 90 86 86 77 83 North Dakota 1,950 1,994 2,000 1,970 1,997 2,097 2,172 2,142 2,102 2,174
Table 42: Out-of-Wedlock Births by County
Source: NDDoH, Division of Vital Records
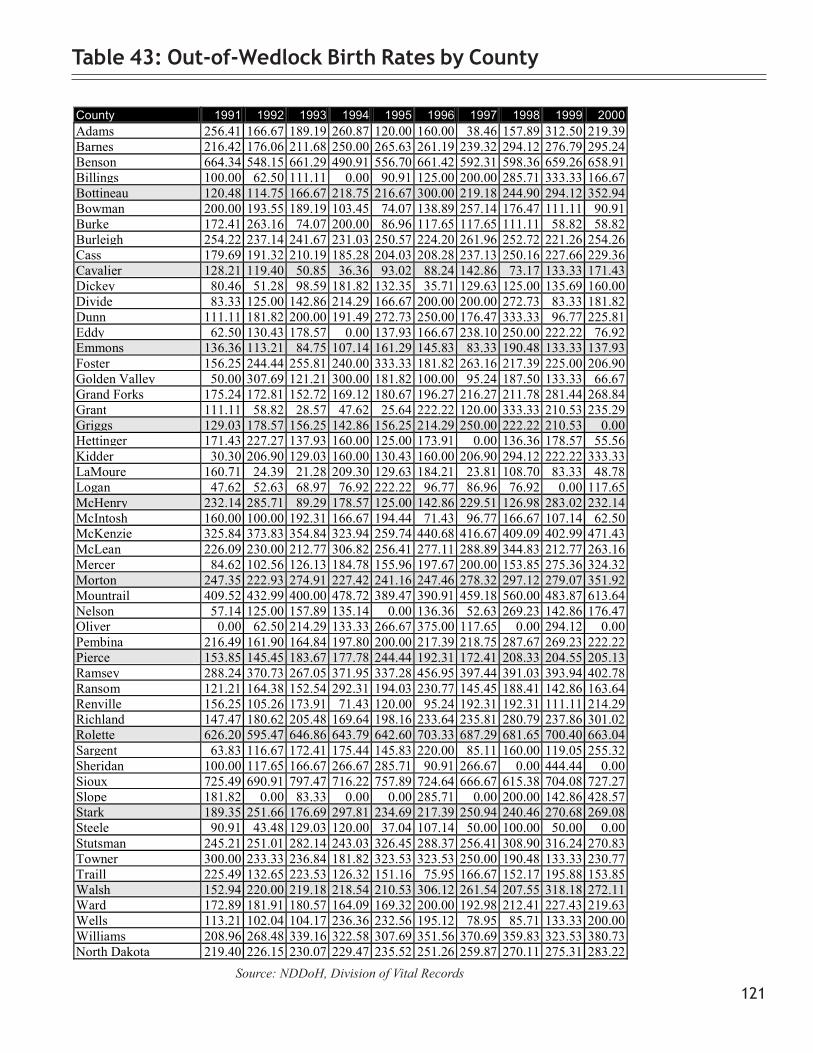
121
Table 43: Out-of-Wedlock Birth Rates by County
County 1991 1992 1993 1994 1995 1996 1997 1998 1999 2000 Adams 256.41 166.67 189.19 260.87 120.00 160.00 38.46 157.89 312.50 219.39 Barnes 216.42 176.06 211.68 250.00 265.63 261.19 239.32 294.12 276.79 295.24 Benson 664.34 548.15 661.29 490.91 556.70 661.42 592.31 598.36 659.26 658.91 Billings 100.00 62.50 111.11 0.00 90.91 125.00 200.00 285.71 333.33 166.67 Bottineau 120.48 114.75 166.67 218.75 216.67 300.00 219.18 244.90 294.12 352.94 Bowman 200.00 193.55 189.19 103.45 74.07 138.89 257.14 176.47 111.11 90.91 Burke 172.41 263.16 74.07 200.00 86.96 117.65 117.65 111.11 58.82 58.82 Burleigh 254.22 237.14 241.67 231.03 250.57 224.20 261.96 252.72 221.26 254.26 Cass 179.69 191.32 210.19 185.28 204.03 208.28 237.13 250.16 227.66 229.36 Cavalier 128.21 119.40 50.85 36.36 93.02 88.24 142.86 73.17 133.33 171.43 Dickey 80.46 51.28 98.59 181.82 132.35 35.71 129.63 125.00 135.69 160.00 Divide 83.33 125.00 142.86 214.29 166.67 200.00 200.00 272.73 83.33 181.82 Dunn 111.11 181.82 200.00 191.49 272.73 250.00 176.47 333.33 96.77 225.81 Eddy 62.50 130.43 178.57 0.00 137.93 166.67 238.10 250.00 222.22 76.92 Emmons 136.36 113.21 84.75 107.14 161.29 145.83 83.33 190.48 133.33 137.93 Foster 156.25 244.44 255.81 240.00 333.33 181.82 263.16 217.39 225.00 206.90 Golden Valley 50.00 307.69 121.21 300.00 181.82 100.00 95.24 187.50 133.33 66.67 Grand Forks 175.24 172.81 152.72 169.12 180.67 196.27 216.27 211.78 281.44 268.84 Grant 111.11 58.82 28.57 47.62 25.64 222.22 120.00 333.33 210.53 235.29 Griggs 129.03 178.57 156.25 142.86 156.25 214.29 250.00 222.22 210.53 0.00 Hettinger 171.43 227.27 137.93 160.00 125.00 173.91 0.00 136.36 178.57 55.56 Kidder 30.30 206.90 129.03 160.00 130.43 160.00 206.90 294.12 222.22 333.33 LaMoure 160.71 24.39 21.28 209.30 129.63 184.21 23.81 108.70 83.33 48.78 Logan 47.62 52.63 68.97 76.92 222.22 96.77 86.96 76.92 0.00 117.65 McHenry 232.14 285.71 89.29 178.57 125.00 142.86 229.51 126.98 283.02 232.14 McIntosh 160.00 100.00 192.31 166.67 194.44 71.43 96.77 166.67 107.14 62.50 McKenzie 325.84 373.83 354.84 323.94 259.74 440.68 416.67 409.09 402.99 471.43 McLean 226.09 230.00 212.77 306.82 256.41 277.11 288.89 344.83 212.77 263.16 Mercer 84.62 102.56 126.13 184.78 155.96 197.67 200.00 153.85 275.36 324.32 Morton 247.35 222.93 274.91 227.42 241.16 247.46 278.32 297.12 279.07 351.92 Mountrail 409.52 432.99 400.00 478.72 389.47 390.91 459.18 560.00 483.87 613.64 Nelson 57.14 125.00 157.89 135.14 0.00 136.36 52.63 269.23 142.86 176.47 Oliver 0.00 62.50 214.29 133.33 266.67 375.00 117.65 0.00 294.12 0.00 Pembina 216.49 161.90 164.84 197.80 200.00 217.39 218.75 287.67 269.23 222.22 Pierce 153.85 145.45 183.67 177.78 244.44 192.31 172.41 208.33 204.55 205.13 Ramsey 288.24 370.73 267.05 371.95 337.28 456.95 397.44 391.03 393.94 402.78 Ransom 121.21 164.38 152.54 292.31 194.03 230.77 145.45 188.41 142.86 163.64 Renville 156.25 105.26 173.91 71.43 120.00 95.24 192.31 192.31 111.11 214.29 Richland 147.47 180.62 205.48 169.64 198.16 233.64 235.81 280.79 237.86 301.02 Rolette 626.20 595.47 646.86 643.79 642.60 703.33 687.29 681.65 700.40 663.04 Sargent 63.83 116.67 172.41 175.44 145.83 220.00 85.11 160.00 119.05 255.32 Sheridan 100.00 117.65 166.67 266.67 285.71 90.91 266.67 0.00 444.44 0.00 Sioux 725.49 690.91 797.47 716.22 757.89 724.64 666.67 615.38 704.08 727.27 Slope 181.82 0.00 83.33 0.00 0.00 285.71 0.00 200.00 142.86 428.57 Stark 189.35 251.66 176.69 297.81 234.69 217.39 250.94 240.46 270.68 269.08 Steele 90.91 43.48 129.03 120.00 37.04 107.14 50.00 100.00 50.00 0.00 Stutsman 245.21 251.01 282.14 243.03 326.45 288.37 256.41 308.90 316.24 270.83 Towner 300.00 233.33 236.84 181.82 323.53 323.53 250.00 190.48 133.33 230.77 Traill 225.49 132.65 223.53 126.32 151.16 75.95 166.67 152.17 195.88 153.85 Walsh 152.94 220.00 219.18 218.54 210.53 306.12 261.54 207.55 318.18 272.11 Ward 172.89 181.91 180.57 164.09 169.32 200.00 192.98 212.41 227.43 219.63 Wells 113.21 102.04 104.17 236.36 232.56 195.12 78.95 85.71 133.33 200.00 Williams 208.96 268.48 339.16 322.58 307.69 351.56 370.69 359.83 323.53 380.73 North Dakota 219.40 226.15 230.07 229.47 235.52 251.26 259.87 270.11 275.31 283.22 Source: NDDoH, Division of Vital Records

122
Number of Domestic Violence Incidents County 1995 1996 1997 1998 1995-98 Rate/100,000 Adams 2 2 2 1 7 63.3 Barnes 20 22 19 24 85 175.2 Benson 1 3 2 0 6 21.5 Billings 0 4 0 0 4 88.3 Bottineau 6 4 3 10 23 74.8 Bowman 4 1 2 0 7 53.5 Burke 0 2 0 0 2 19.8 Burleigh 214 215 222 174 825 318.2 Cass 164 167 146 147 624 140.3 Cavalier 0 0 4 0 4 18.0 Dickey 1 6 7 3 17 72.8 Divide 3 1 2 1 7 68.1 Dunn 0 0 2 0 2 13.4 Eddy 1 2 5 2 10 87.1 Emmons 2 1 3 4 10 55.2 Foster 0 0 0 0 - 0.0 Golden Valley 1 1 4 0 6 77.4 Grand Forks 209 225 220 217 871 307.4 Grant 1 0 2 2 5 39.1 Griggs 0 0 3 2 5 41.9 Hettinger 0 2 0 0 2 16.4 Kidder 6 3 4 6 19 155.6 LaMoure 1 2 2 0 5 25.7 Logan 2 2 2 1 7 68.9 McHenry 6 15 5 7 33 132.4 McIntosh 0 1 2 1 4 23.7 McKenzie 3 1 7 3 14 59.9 McLean 8 9 16 6 39 98.2 Mercer 27 34 11 19 91 242.5 Morton 94 106 124 117 441 452.7 Mountrail 1 2 3 6 12 44.5 Nelson 2 0 6 2 10 62.0 Oliver 1 0 1 2 4 45.0 Pembina 16 16 24 17 73 208.0 Pierce 5 8 0 4 17 91.4 Ramsey 65 36 82 69 252 498.1 Ransom 6 13 7 8 34 144.7 Renville 4 2 4 4 14 119.9 Richland 42 40 26 37 145 197.3 Rolette 2 0 6 20 28 51.0 Sargent 2 5 5 2 14 78.5 Sheridan 0 0 0 0 - 0.0 Sioux 5 9 5 5 24 147.8 Slope 1 0 0 0 1 29.4 Stark 68 74 60 54 256 278.9 Steele 0 0 1 0 1 11.0 Stutsman 75 88 91 116 370 428.4 Towner 0 6 4 11 21 163.6 Traill 8 8 3 5 24 69.5 Walsh 29 29 29 35 122 232.5 Ward 212 233 194 246 885 379.4 Wells 1 5 7 7 20 93.5 Williams 75 66 71 53 265 323.1 Total 1,396 1,471 1,450 1,450 5,767 225.1
Table 44: Domestic Violence Incidence by County
Source: Office of Attorney General, Domestic Violence in North Dakota