maternal employment and children’s nutrition
TRANSCRIPT

Economic Research Service
Electronic Publications from the Food Assistance & Nutrition Research Program
Maternal Employment andChildren’s Nutrition
Volume I, Diet Quality and the Role of the CACFP
By Mary Kay Crepinsek and Nancy R. Burstein, Abt Associates Inc.
ERS project representative: Linda M. Ghelfi, 202-694-5437, [email protected].
Abstract
Compared with children of nonworking mothers, children of full-time working mothers havelower overall HEI (Healthy Eating Index) scores, lower intake of iron and fiber, and higherintake of soda and fried potatoes, even after taking into account differences in maternal andother family characteristics. Nutritional differences between children of part-time workingmothers and children of nonworking mothers were more sensitive to maternal and familycharacteristics, with no clear pattern of nutritional differences emerging. This study analyzeddifferences in nutrition outcomes among children whose mothers work full time, part time,and not at all, and the role USDA's Child and Adult Care Food Program (CACFP) plays inmeeting the nutrition needs of participating children, especially those whose mothers work.
Acknowledgments
Linda Truitt and Ellie Lee, Abt Associates Inc., contributed to this report.
E-FAN-04-006-1
June 2004
This report was prepared by Abt Associates Inc. under a researchagreement from the Economic Research Service. The views expressedare those of the authors and not necessarily those of ERS or USDA.

Contents
Executive Summary ............................................................................................................................. 1 Children’s Diet Quality ............................................................................................................... 1 Multivariate Analyses of Child Nutrition Outcomes................................................................... 2 Other Nutrition-Related Outcomes.............................................................................................. 3 Role of the Child and Adult Care Food Program ........................................................................ 4
Contribution of CACFP to Children’s Diets ..................................................................... 4 Comparison of Diet Quality: CACFP Children of Working Mothers and Not-in-Care Children of Nonworking Mothers................................................................. 5
Chapter 1: Introduction ..................................................................................................................... 7 Conceptual Framework ............................................................................................................... 7
Expected Negative Effects of Maternal Employment....................................................... 9 Expected Positive Effects of Maternal Employment ........................................................ 9 Unclear Effects of Maternal Employment ........................................................................ 9
Review of Literature.................................................................................................................. 10 Nutrient Adequacy and Over-Consumption.................................................................... 10 Other Outcomes .............................................................................................................. 12
Data Sources.............................................................................................................................. 12 Continuing Survey of Food Intakes by Individuals ........................................................ 12 Early Childhood and Child Care Study........................................................................... 13
Analytic Approach..................................................................................................................... 14 Research Question #1...................................................................................................... 14 Research Question #2...................................................................................................... 16 Research Question #3...................................................................................................... 18 Research Question #4...................................................................................................... 18
Overview of the Report ............................................................................................................. 19
Chapter 2: Children's Nutrition Outcomes .................................................................................... 21 Healthy Eating Index Score....................................................................................................... 23 Heathy Eating Index Diet Rating............................................................................................... 28 Intake of Total Food Energy Intake and Selected Nutrients...................................................... 30
Food Energy.................................................................................................................... 31 Iron and Zinc................................................................................................................... 34 Dietary Fiber ................................................................................................................... 37
Consumption of Soft Drinks, Added Sugar, and Fried Potatoes ............................................... 40 Soda and Other Soft Drinks ............................................................................................ 40 Added Sugar.................................................................................................................... 45 Fried Potatoes.................................................................................................................. 47
Summary ................................................................................................................................... 49
ii Contents Abt Associates Inc.
Chapter 3: Multivariate Analyses of Mothers' Work and Children's Nutrition Outcomes....... 51 Child, Household, and Maternal Characteristics........................................................................ 51
Characteristics of Sample Children................................................................................. 52 Characteristics of Households ......................................................................................... 53 Demographic Characteristics of Mothers ........................................................................ 55 Maternal Nutrition Knowledge and Attitudes ................................................................. 56
Healthy Eating Index and Component Scores ........................................................................... 58 Healthy Eating Index Diet Rating.............................................................................................. 61 Food Energy Intake.................................................................................................................... 62 Iron and Zine Intake................................................................................................................... 64 Dietary Fiber Intake ................................................................................................................... 65 Soda Consumption ..................................................................................................................... 66 Other Soft Drink Consumption .................................................................................................. 67 Added Sugar Intake.................................................................................................................... 69 Consumption of Fried Potatoes and Other Vegetables .............................................................. 70 Summary .................................................................................................................................... 70
Chapter 4: Role of the Child and Adult Care Food Program in Children's Diets ......................75 Contribution of CACFP Meals to Children's Dietary Intake ..................................................... 76
Characteristics of CACFP Sample Children and Their Households ............................... 77 Children's 24-Hours DIetary Intake and the Role of CACFP Meals and Snacks............ 80
Comparison of Diet Quality Between CACFP Children of Working Mothers and Not-in-Child-Care Children of Nonworking Mothers ............................................................... 89
Characteristics of Sample Children and Their Families .................................................. 90 Comparisons of Diet Quality: Healthy Eating Index...................................................... 92 Comparisons of Diet Quality: Food Energy and Selected Nutrients .............................. 95 Comparisons of Diet Quality: Soft Drinks, Added Sugar, and Fried Potatoes............... 99
Summary ................................................................................................................................. 104
References .........................................................................................................................................106
Appendix A: Determination of Child-Maternal Female Dyads in the CSFII ............................ 112
Appendix B: Sample Weights.........................................................................................................114 CSFII Sample Weights ............................................................................................................ 114 ECCCS Sample Weights.......................................................................................................... 115
Appendix C: Characteristics of CSFII Sample Children, Households, and Mothers ............... 117 Demographic Characteristics of Sample Children................................................................... 118 Household Composition, Income, and Location...................................................................... 119
Household Size and Composition.................................................................................. 119 Household Income......................................................................................................... 121 Geographic Location ..................................................................................................... 121
Demographic Characteristics of Maternal Females ................................................................. 121 Mother’s Nutrition Knowledge and Attitudes.......................................................................... 122
Nutrition Knowledge ..................................................................................................... 123 Attitudes ........................................................................................................................ 132
Abt Associates Inc. Contents iii

Appendix D: Early Childhood and Child Care Study Non-Response Analysis ........................ 141 Respondent and Non-Respondent Sponsors............................................................................ 141 Respondent and Non-Respondent Providers ........................................................................... 141 Observed and Non-Observed Children.................................................................................... 143 Observed Children With and Without 24-Hour Recall Data................................................... 143 Summary ................................................................................................................................. 146
Appendix E: Standard Errors for Selected Exhibits in Chapter 4 ............................................ 147
iv Contents Abt Associates Inc.

Executive Summary
Labor force participation among women in the United States has increased dramatically over the past three decades. A majority of women with children are now employed outside the home. At the same time, there is evidence from national surveys that children’s diets are less healthful than they should be, and that children are becoming increasingly overweight. Economic theory suggests that families in which mothers work outside the home must trade off the advantages of greater income against the disadvantages of less time for home food production and supervision of children’s activities. This tradeoff may result in positive, negative, or no net impacts on children’s nutritional well-being. Although considerable research has been done on the relationship between maternal employment and breastfeeding, few studies to date have investigated the relationships between mother’s work status and other child nutrition outcomes. Using extant data from nationally representative samples of children and their mothers in the mid-1990s, this study was conducted to explore the relationships between maternal employment and direct measures of children’s nutrition, such as diet quality and weight status. It also considered the potential mediating effects of participation in USDA’s food assistance programs, particularly the Child and Adult Care Food Program (CACFP), and other nutri-tion-related outcomes (e.g., meal skipping, household food expenditures, and food sufficiency). Direct measures of children's nutrition are discussed in this volume. Other nutrition-related outcomes are discussed in Volume II. The study objectives concerned differences in nutrition outcomes among children age 0 to 17 years whose mothers work full-time, part-time, and not at all, and the role the CACFP serves in meeting the nutrition needs of participating children, especially those whose mothers are working. This report presents what has been learned with regard to these issues and discusses some implications for policy decisions. The project was carried out in cooperation with the U.S. Department of Agriculture (USDA), Economic Research Service. Children’s Diet Quality
Previous studies of the association between maternal employment and children’s nutrient intake did not find negative effects, although they were limited to preschoolers age 2 to 5 years (Johnson et al., 1992a and 1992b). For this study, no a priori hypotheses were formed with regard to mother’s work status and children’s diet quality. The loss of home production time and the gain in income were expected to work in opposite directions, with the net effect unknown. Although it is naturally of interest to determine whether maternal employment causes children’s nutrition outcomes to be better or worse, it is also important for policymakers to know whether children of working mothers have better or worse nutrition outcomes, regardless of the cause. For example, a greater percentage of black women than Hispanic women work. Some child nutrition outcomes may be affected by cultural factors associated with ethnicity. If families with working mothers tend to fare worse on some outcomes for whatever reason, policymakers will want to ensure that they have appropriate access to food assistance programs and nutrition education. This study found evidence of a negative association between mother’s employment status and children’s diet quality. The analysis compared children whose mothers work (both full- and part-time) to children with homemaker mothers, overall and for subgroups based on child age, family
Abt Associates Inc. Executive Summary 1

income, and the presence of other adults in the household. Measures of diet quality included the Healthy Eating Index (HEI) (total and component scores), intake of food energy, iron, zinc, and dietary fiber, and consumption of soft drinks, added sugars, and fried potatoes. Key findings are that:
• Children of full-time working mothers have lower overall HEI scores (poorer diet quality) than children whose mothers are homemakers. This appears to be the net outcome of strong negative results for 5- to 8-year-olds, and weaker positive results for preschoolers (ages 2 to 4) and children in single-adult households. Differences in HEI scores across employment groups do not significantly affect the relative proportions of children with “good” or “poor” HEI diet ratings.
• On some individual components of the HEI, children of full-time working mothers score lower by eating less grain, fruit, and variety of foods than homemakers' children eat. On other components, they score higher than children of homemakers by eating more vegetables and less total and saturated fat.
• Infants and children up to age 5 consume significantly more food energy relative to requirements if their mothers work full-time versus not at all. This raises the question of whether the higher HEI scores among this group of children are the result of excess food intake overall, putting them at greater risk for overweight.
• School-age children of full-time working mothers have lower iron and dietary fiber intakes, on average, than their counterparts with homemaker mothers. The only group for which this is particularly worrisome is teenage girls, whose intakes fall below recom-mended levels, and for whom maternal employment has substantial negative effects.
• Soda consumption in excess of 8 ounces per day is seen more frequently among children with working mothers than children whose mothers do not work. The differences are greatest for 5- to 8-year-olds and children in single-adult households. Children of full-time working mothers are also the least likely to avoid drinking soda altogether.
• A significant association between maternal full-time employment and children’s fried potato consumption was observed, but the differences amount to only one- to two-tenths of a serving.
Multivariate Analysis of Child Nutrition Outcomes
Children of working mothers differ in many ways from children of homemaker mothers: with regard to race/ethnicity, mother’s age and education, household resources, and other factors. The observed differences in child nutrition outcomes reported above might be due in part or in whole to these factors. Although this study is unable to attribute causation, we conclude that it is plausible to relate most of the differences in children’s diet quality to maternal employment status per se, at least in the case of full-time employment. A regression analysis that controlled for differences in household circumstances, including maternal demographics and employment and occupation of other adult household members, did not substantially alter the pattern of differences among the employment groups. Furthermore, supplementary analyses on a limited sample for which data were available on maternal nutrition knowledge and attitudes found that consideration of these characteristics also did not change the results. Thus, the great majority of the striking differences seen in child nutrition
2 Executive Summary Abt Associates Inc.

outcomes by maternal employment status appears to be due to employment per se, rather than being explained by differences in the households. These differences include, for children of full-time working mothers, lower overall HEI scores, especially among children age 5 to 8; lower intake of iron, especially among children age 5 to 12 and teenage girls; lower intake of fiber, especially among children age 5 to 12; higher intake of soda, especially among children age 5 to 8; and higher intake of fried potatoes, especially among children age 2 to 8. Evidence of negative differences for children of part-time working mothers was scattered and frag-mentary. There were no negative differences in the bivariate analyses for all ages combined, and the only significant regression-adjusted difference for all ages combined was increased consumption of fried potatoes. The results for particular age groups associated with part-time maternal employment were more likely to gain or lose statistical significance between the bivariate and multivariate analyses, indicating that the differences in composition were more important for part-time working versus homemaker mothers than for full-time working versus homemaker mothers. (Examples of such differences are that full-time working mothers are relatively more likely to be black, whereas homemaker mothers are relatively more likely to be Hispanic; that of the three groups, part-time working mothers tend to have the most and homemaker mothers the least formal education; and that estimated earnings from other household members are greatest on average among households with part-time working mothers and least among households with homemaker mothers.) Other Nutrition-Related Outcomes1
Income relative to poverty tends to be higher in households with working mothers. Consequently these households are less likely to participate in the means-tested food assistance programs, the Special Supplemental Nutrition Program for Women, Infants and Children, the Food Stamp Program (WIC), and the School Breakfast Program (SBP). (Although SBP is in principle available to children of all incomes, in practice it predominantly serves low-income children.) National School Lunch Program participation, in contrast, is higher among children of working mothers. The effects of greater income among households of working mothers is also seen in their greater expenditures on food per adult male equivalent; and their higher levels of food sufficiency. The effects of time pressures are seen in working mothers’ reduced participation in meal planning, shopping, and food preparation; in the increased prevalence of morning meal skipping by teenage girls; and the heavier reliance on away-from-home food sources. This study also found that children of full-time working mothers spend more time watching TV and videos than children of homemakers. The frequency of engaging in vigorous exercise, however, does not differ across employment groups. Among 12- to 14-year olds, children with full-time working mothers are at significantly greater risk of overweight (Body Mass Index above the 85th percentile) than children whose mothers are homemakers. Unfortunately, available data on exercise level were self-reported and obtained only from older chil-dren (12 to 17 years). In addition, reliable data on weight status were not available for children under
1 Results of analyses exploring the relationships between mothers’ work and children’s eating patterns, household food
acquisition and sufficiency, participation in food assistance programs, and children’s physical activity and weight status can be found in Volume II of this report.
Abt Associates Inc. Executive Summary 3

12 years old. The possibility that maternal employment is related to the physical activity level and risk of overweight for younger children cannot be ruled out. Role of the Child and Adult Care Food Program
The great majority of working mothers at all income levels relies on non-parental child care, espe-cially for infants and young children (Tout et al., 2001). The CACFP is a federal program, adminis-tered by the USDA, that subsidizes nutritious meals and snacks served to children in participating child care facilities. It is thus the food assistance program most directly targeted to children of working mothers. The ability of CACFP to mediate any negative effects of maternal employment on children’s diets is related to the quality of the meals and snacks actually consumed, and their relative contribution to participants’ nutritional needs for the full day. This study marks the first analysis of both the in-care and out-of-care components of CACFP participants’ 24-hour dietary intake using a national sample. However, the sample response rate for the 24-hour recall was low, 41 percent. Although a comparison of respondents and nonrespondents did not suggest that the results are invalid, the possibility of bias remains.2 The USDA Food and Nutrition Service therefore recommends that analysis of these data should not be considered as representative of CACFP participants or of the impact of the program. Contribution of CACFP to Children’s Diets
This analysis was intended to be descriptive, providing estimates of children’s average consumption of food energy and key nutrients over 24 hours and from CACFP meals and snacks. Results are reported for all CACFP children age 1 to 10 and by type of child care facility (e.g., family child care homes, Head Start, child care centers). CACFP appears to make an important and positive contribu-tion to participating children’s intake of key nutrients. Continued efforts to educate providers and provide tools to assist them in serving lower fat, lower sodium meals and snacks seem warranted. Findings suggest that:
• CACFP participants’ daily levels of food energy, protein, vitamins A and C, calcium, iron, and zinc meet or exceed Recommended Dietary Allowances. The one exception is 6- to 10-year-old children in child care centers, whose average daily food energy intake falls below the recommended level (87 percent of 1989 Recommended Energy Allowance (REA)).
• Meals and snacks consumed in CACFP care make a substantial and positive contribution to the daily food energy and nutrient requirements of toddlers and preschool children (36 to 47 percent for food energy and 45 to more than 100 percent for the other nutrients). This does not vary appreciably with the type of CACFP care.
• School-age children consume a smaller share of their daily nutrition needs from CACFP than younger children. This is consistent with the relatively few hours they spend in child care (typically 3 hours per day). For some nutrients (e.g., food energy and iron), the CACFP contribution for 6- to 10-year-olds is less if they are cared for in child care
2 Percentages of food energy consumed by the 24-hour recall children and other children observed while eating in
CACFP facilities were very similar (see Appendix D). It is, however, possible that nonrespondents have systematically different out-of-CACFP-care dietary-intake patterns than respondents.
4 Executive Summary Abt Associates Inc.

centers versus family child care homes. This can be explained by the higher likelihood that 6- to 10-year-olds are offered breakfast and lunch in homes than in centers, where they are more likely to receive snacks (Fox et al., 1997).
• CACFP participants age 3 to 10, like other children their age (USDA/ARS, 1999), fall short of meeting the Dietary Guidelines recommendations for fat and saturated fat, and consume more sodium and less carbohydrate than the National Research Council’s Diet and Health recommendations. Regardless of the type of care, the diets of both preschool and school-age participants meet daily recommendations for cholesterol and dietary fiber.
• CACFP meals and snacks do not contribute disproportionately to participants’ daily intake of fat, saturated fat, or sodium, relative to total food energy. They do, however, provide more than the recommended level of saturated fat (about 13 percent of food energy).
Comparison of Diet Quality: CACFP Children of Working Mothers and Not-in-Care Children of Nonworking Mothers
To look more closely at the role of CACFP for 1-to-5 year-old children with working mothers, nutrition outcomes were compared to those of not-in-care children of nonworking mothers. This analysis suggests that the CACFP is making a positive contribution to the diets of preschool children with working mothers. Participants are estimated to have better diets than children cared for by their own mothers who do not work outside the home. In addition, the detrimental relationships between mother’s full-time work and preschool children’s overconsumption of soda and added sugars seem to be ameliorated for those in CACFP care. CACFP participation alone, however, does not appear to lessen the negative relationship between maternal employment and excess food energy and sodium intake. Findings suggest:
• Both part-day (4 or less hours) and full-day (more than 4 hours) CACFP participants with working mothers have higher quality diets, based on the HEI, than not-in-care children of homemakers. This result persists after controlling for demographic characteristics of the children and their households. Differences in overall diet quality are due mainly to greater fruit and milk consumption, and lower total fat intake among CACFP participants.
• A larger share of CACFP participants with working mothers consumes “good” diets and fewer have “poor” diets relative to not-in-care children of homemakers.
• CACFP children in full-day care are more likely to consume in excess of 110 percent of the 1989 REA than not-in-care children of homemakers (mean of 105 percent). Regardless of hours in care, however, CACFP participants are also less likely to have food energy intakes below recommended levels than other children.
• Not surprisingly, given CACFP meal pattern requirements, CACFP participants with working mothers consume less soda and other soft drinks than not-in-care children of homemakers. They also consume less added sugar from this source, and if in care more than 4 hours per day, less added sugar from all sources.
• Although there were no differences in fried potato consumption, CACFP participation was associated with greater consumption of vegetables other than fried potatoes.
Abt Associates Inc. Executive Summary 5

Differences between groups are generally larger for children in CACFP more hours per day and among children in low-income households, suggesting the target population in particular is benefiting from the program. Note that this study does not prove that CACFP is what makes the difference in children’s diets. Although an analysis controlling for compositional differences between the samples of children and their families confirmed the findings of better diet quality among CACFP participants, the possibilities of selection effects or low survey response bias cannot be ruled out. Nevertheless, the findings are interesting and worth pursuing further, ideally with a prospective, experimental design.
6 Executive Summary Abt Associates Inc.

Chapter 1 Introduction
The fraction of women in the United States who participate in the labor force has increased drama-tically over the last few decades. According to the U.S. Bureau of Labor Statistics, employment among all women rose from 43 percent to 60 percent between 1970 and 2001. Currently as many as 78 percent of married women with school-age children (age 6 to 17), and 63 percent of married women with infants and preschoolers (under age 6), are employed outside the home (U.S. Census Bureau, 2002). Employment rates are even higher for single mothers. This high level of labor force participation raises questions about how households with working mothers cope with increased time constraints—in particular, changes they may make in the provision of food or supervision of children, how food and nutrition assistance programs figure in their lives, and the subsequent effects on children’s health and well-being. This report presents findings from a study to explore issues pertaining to mothers’ employment and children’s nutrition. The study uses data from two extant sources to address the following research questions:
1. How do key nutrition outcomes differ among children whose mothers work full-time, part-time, and not at all?
2. How much of this difference remains when underlying differences among the groups of households are taken into account?
3. What role does the Child and Adult Care Food Program (CACFP) serve in meeting the nutritional needs of children in child care?
4. How do nutrition outcomes compare between children of working mothers in CACFP and children of non-working mothers who are not in care?
The conceptual framework for the research, data sources, and analysis approach are described below. A brief review of the empirical literature on the topic is also included in this chapter. Conceptual Framework
Mothers’ employment status has potential implications for virtually all aspects of children’s growth and development, and nutrition outcomes are no exception. The quality of children’s diets and their subsequent physical health may depend significantly on whether and how much their mothers work outside the home. On the one hand, employed mothers may have less time available to supervise their children’s activities and to prepare their meals. On the other hand, the additional income they bring into the household may help to ensure a stable supply of high quality food. The net effects on children’s well being are likely to vary depending on the presence of other adults in the household, the household’s income net of the mother’s earnings, and the age of the child. Use of child care and participation in the U.S. Department of Agriculture’s (USDA) food assistance programs may mediate the effects of maternal employment on children’s health and nutrition.
Abt Associates Inc. Chapter 1: Introduction 7

The exploration of relationships between maternal employment and children’s nutrition outcomes is based on time allocation theory. A vast literature exists on this topic, stemming from Gary Becker’s seminal article (1965). The essence of the theory is that within a household, adult members allocate their time among market work, home production, and leisure (non-work time) so as to maximize household well-being. This well-being depends on the goods that can be obtained by combining the income from market work with the labor from home production, as well as on leisure. An implication is that, inasmuch as husbands typically have higher earning potential than their wives, couples in which both partners do not work full-time will usually choose to have the wife rather than the husband stay home with the children or work part-time, even if men’s and women’s personal preferences for market work versus home production are the same. “Household well-being” is clearly an abstraction from the well-being of the individuals, and more sophisticated models consider the balance of power within the household that determines the resources (including leisure) ultimately going to each member.3
A recent literature review by Olmstead and Weathers (2001) notes that individuals can respond to time constraints by four general strategies: domestic outsourcing (e.g., purchasing prepared meals, hiring a cleaning service); time-deepening (multi-tasking, speeding up non-market work); time-pooling (trading off tasks with other adults within or outside the household); and doing without (sleeping less, allowing the house to become untidy). Each of these strategies has clear advantages and drawbacks. The availability of household services on the market has acquired central importance as a modifica-tion to the classic Becker model. Oppenheimer (1997) notes that specialization within a nuclear family is a risky strategy because of the possibility of job loss or illness. Each partner engaging in both household work and market employment offers flexible protection against these risks. House-holds can reach a higher material standard of living if both partners work and home production is largely outsourced. In this study, the maternal employment decision is taken as given, rather than examining how it is determined by husbands’ and wives’ earnings potentials and preferences. The theory provides the insight that working mothers trade off the advantages of greater income against the disadvantages of less time for home production (including food purchasing, food preparation, and supervision of children’s activities) and less free time. Although families may be presumed to have made the choices that best suit them overall (including perhaps the mother’s desire to work outside the home), these choices may have positive or negative impacts on particular aspects of children’s well-being. Direct measures of children’s nutritional status (e.g., food and nutrient intake), as well as other nutrition-related outcomes (e.g., food assistance program participation, risk of overweight, food
3 Another variation on the model is to distinguish between maintenance activities (eating, sleeping) and leisure per se.
Although this distinction focuses attention on the valid point that a minimum of non-work time is required for survival, it does not add further to our understanding of time pressures, because adults are typically free to allocate their free time between these two areas without implications for other family members. Reducing market or non-market work time, in contrast, may require intrafamilial negotiation.
8 Chapter 1: Introduction Abt Associates Inc.

sufficiency) are included in the analysis of the relationship of mothers’ work with child nutrition outcomes.4 For some child nutrition outcomes, hypotheses about the causal effects of maternal employment are unambiguous, other things equal. For other outcomes, the loss of home production time and the gain in income work in opposite directions, with the net effect unknown. These hypotheses are discussed below. Expected Negative Effects of Maternal Employment
On the assumption that no caretaker would be more motivated than the child’s mother to supervise the child’s activities, we anticipate that children in non-parental care or self-care might snack more, perhaps on less healthful foods, watch more television, and be less physically active than their counterparts, other things equal. The income/time trade-off made by working mothers would be expected to lead to increased reliance on prepared foods (e.g., frozen entrées) and carry-out items, which are typically higher in fat and sodium, and possibly lower in fiber, than meals cooked at home. In addition, the means-tested Food and Nutrition Assistance Programs (FNAPs) dampen the effects of maternal earnings on nutrition outcomes, both because households may lose eligibility (or may be eligible for reduced benefits), and because participation may be less convenient for working mothers. Thus, to the extent that participation in the Special Supplemental Nutrition Program for Women, Infants and Children (WIC) and the Food Stamp Program (FSP) improve children’s nutrition, the advantages will be less available to children of working mothers.5
Expected Positive Effects of Maternal Employment
The higher income of families with working mothers should lead to increased food expenditures and a higher-quality diet in those dimensions that might be constrained by lack of income. Food security can also be expected to improve. Furthermore, participation in CACFP may dampen any negative effects of maternal employment on children’s food intake in the mother’s absence. In addition, maternal employment might increase children’s participation in the School Breakfast Program (SBP) and the National School Lunch Program (NSLP)6⎯not for the advantage of free or reduced-price meals, but for the convenience. If the meals offered are of high nutritional quality, then like CACFP these programs may also dampen some negative effects of maternal employment on child nutrition. Unclear Effects of Maternal Employment
The overall effect of maternal employment on children’s dietary patterns and diet quality is hard to predict. Although some aspects of diet quality related to income might be improved (e.g., more fresh fruits and vegetables), other aspects related to the caregiver’s time availability might be worsened (greater use of prepared foods and carry-out). Diet patterns such as skipping meals and frequency of
4 It should be noted that the nutritional implications of mother’s employment do not end with children’s food intake,
energy balance, and food sufficiency. More distal outcomes include dental caries, biochemical indicators of nutritional status, cognitive development, and physical growth. Outcomes like these are not discussed in this report because they were not measured in the available data sets.
5 An additional domain in which maternal employment is likely to have negative consequences is breastfeeding initiation and duration. This study does not include breastfeeding among the child nutrition outcomes examined, because a vast literature already exists on the topic.
6 Data necessary to examine the relationship between maternal employment and participation in the Summer Food Service Program (SFSP) were not available for this project.
Abt Associates Inc. Chapter 1: Introduction 9

meals and snacks could also be either improved or worsened, because of increased financial resources on the one hand and reduced supervision on the other. Risk of overweight likewise might be affected either way. Although higher quality food and stable household food supplies could help control children’s weight, lack of maternal supervision of meals and snacks and of physical activities, combined with more convenience foods and carry-out, might make overweight and obesity more likely. Review of Literature
Although considerable research has been done on the relationship between maternal employment and breastfeeding, only a small number of studies have explored the effects of maternal employment on other child nutrition outcomes. These studies have primarily examined children’s nutrient intake. Overweight and maternal attitudes toward child nutrition have been studied as well. A literature review conducted by Johnson et al. in 1993 concluded that although the study of the field is limited, maternal employment does not have negative consequences for preschool children’s dietary intakes. Recent work by Anderson and colleagues (2002), however, suggests that mothers who worked full-time since their children’s birth are more likely to have overweight children. The findings of studies published within the last decade or so are summarized below and in Exhibit 1.1. Nutrient Adequacy and Over-Consumption
Johnson and colleagues (1992a) looked at measures of nutrient adequacy and nutrient over-consump-tion in a sample of 2- to 5-year-old children from the 1985 Continuing Survey of Food Intakes of Individuals (CSFII). Using both bivariate and multivariate analysis techniques, they found that maternal employment status was not correlated with any of the diet quality measures examined. The authors conclude that maternal employment has no detrimental effect on young children’s diets. They also note several limitations of the study, including non-response, attrition, and lack of employment data at all but the initial point of dietary data collection. Addressing the same issues using the 1987 to 1988 Nationwide Food Consumption Survey (NFCS), Johnson et al. (1992b) similarly found that maternal employment did not affect the diet quality of 2- to 5-year-old children. Further, this study found no evidence of relationships between maternal employment and diet quality for different levels/values of mothers’ education, age, presence of male head of household, race, number of children under 5 years old, age of child, or number of meals eaten away from home. This study did find that children of full-time and part-time working mothers ate more meals at schools and child care centers than children whose mothers were not employed. Non-response was substantial for the NFCS. Horton and Campbell (1991) used data from the 1984 Family Food Expenditure Survey (urban house-holds in Canada) to find that maternal employment is associated with higher rates of restaurant-food consumption and higher costs per calorie of home-prepared food. The authors also find that full-time maternal employment is negatively associated with household nutrient availability (which combines expenditure and nutrient variables), with no evidence showing that increased income from maternal employment was being related to increased expenditures on basic needs. The authors concede, however, the limitations of their use of food expenditures rather than complete information on specific foods eaten.
10 Chapter 1: Introduction Abt Associates Inc.

Exhibit 1.1 Summary of Studies of Maternal Employment and Child Nutrition Outcomes
Study Measures Sample Data Collection Method Godwin and McIntosh (1997) • Children’s body fat percentages
• Intake of vitamin B12 Pilot study of Texas 14-15 year-olds (n=54)
Venipuncture, step test, anthropometrics, 24-hour diet and activity recalls, two-day diet and activity records
Johnson/JADA (1992a) • •
Nutrient adequacy Nutrient over-consumption
1985 Continuing Survey of Food Intakes of Individuals (n=216)
Four nonconsecutive days of 24-hour diet recalls during a one-year period
Johnson/Pediatrics (1992b) • •
Nutrient adequacy Nutrient over-consumption
1987-88 National Food Consumption Survey (n=442)
Three-day average of one 24-hour recall and two days of food records
Horton and Campbell (1991) • •
Nutrient availability Costs per calorie
1984 Family Food Expenditure Surveys (urban households in Canada) (n=5,188)
Household survey of two weeks of family eating habits
Gillespie and Achterburg (1989) • Mothers’ attitudes about the importance of nutrition
Families in upstate New York (n=520)
Mail questionnaire (returned by 74%)
Anderson, Butcher and Levine (2002)
•
• •
Children’s body mass index (BMI) Television viewing Food energy, nutrient, and food consumption
National Longitudinal Survey of Youth, 1986 to 1996 (n=6,894), supplemented with 1988 to 1994 (NHANES III) (n=4,073) and 1994 to 96, 1998 CSFII (n=7,388)
Height and weight measurements, and 24-hour diet recalls
Abt A
ssociates Inc.
Chapter 1: Introduction
11

Other Outcomes
A recent study by Anderson, Butcher, and Levine (2002) examined the relationship between maternal employment and childhood overweight. Mother-child data from three sources were used: the National Longitudinal Survey of Youth, the Third National Health and Nutrition Examination Survey (NHANES III), and the 1994 to 1996 and 1998 CSFII. Descriptive findings indicate that fast food consumption is higher among children whose mothers work, but no differences were seen in energy intake, TV viewing, or levels of overweight. Based on econometric models, the authors report a positive relationship between the intensity of maternal employment and child overweight. The effect was most notable for white children in more economically advantaged families. Godwin and McIntosh (1997) relate parental employment to adolescents’ various physical and nutri-tional outcomes using data from a pilot study in Texas. The authors found that daughters’ body fat percentages and intake of vitamin B12 was predicted by both the work history and the “work preoccupation” of mothers. Specifically, mothers who showed greater desire to work weekends or bring work home were more likely to have daughters with high body fat and low intake of vitamin B12. The studies also showed sons’ food energy, carbohydrate, and fat—particularly saturated fat—intake, to be predicted by their mothers’ “work schedule irregularity and commitment.” Gillespie and Achterburg (1989) examined how maternal employment related to parental attitudes about the importance of nutrition. Using responses to a questionnaire mailed to families in upstate New York, the authors found that families in which the mother was employed part-time placed the higher importance on nutrition than those in which the mother was employed full-time or not at all. Data Sources
The main sources of data for this study were two national surveys conducted in the mid-1990s: (1) the Continuing Survey of Food Intakes by Individuals, including the Diet and Health Knowledge Survey, and (2) the Early Childhood and Child Care Study. Each of these data sets is described below. Continuing Survey of Food Intakes by Individuals
The CSFII and the Diet and Health Knowledge Survey (DHKS) are conducted by the Agricultural Research Service (ARS) of USDA. The CSFII was conducted over three years (1994 to 1996) and again in 1998. During 1994 to 1996, all household members were eligible for selection as a sample person. In 1998, sample persons were restricted to household members aged 0 to 9 (the CSFII Supplemental Children’s Survey). Low-income individuals (income at or below 130 percent of the federal poverty guideline) were oversampled in all survey years. CSFII data provide summary information for the household, demographic information for each house-hold member (collected from the reference person), employment information, and detailed dietary intake information for sample persons (a random sample of household members). Two nonconsecu-tive days of dietary intake data were collected for almost all sample persons using in-person 24-hour recalls.7 Thus, information is available on a variety of aspects of children’s nutrition, including eating
7 For infants and children under 6 years of age, a parent or knowledgeable caregiver is asked to provide the information,
and for children 6 to 12 years, the child is interviewed with adult assistance.
12 Chapter 1: Introduction Abt Associates Inc.

patterns, food and nutrient intake, and diet quality. Other related variables available from the CSFII include measures of:
• Physical activity level • Overweight and obesity8 • Participation in food assistance programs • Responsibility for meal planning, food purchasing, and food preparation • Food expenditures • Food sufficiency.
The CSFII includes individual participation in WIC, the NSLP, and the SBP as well as household participation in the FSP. The DHKS was administered, primarily by telephone, to a random subsample of sample persons aged 20 years or older who completed the CSFII (only one person per household was selected). The survey (42 questions and 140 potential variables) asked about the respondents’ nutrition knowledge, attitudes, and behaviors. A main focus was concepts related to the Dietary Guidelines for Americans (USDA/DHHS, 1995) and USDA’s Food Guide Pyramid (USDA, 1992). Information was also captured on awareness and beliefs in the relationship between diet and health, self-assessment of diet quality, use of food labels, and food-related behaviors (e.g., whether skin is removed from chicken). Early Childhood and Child Care Study
The Early Childhood and Child Care Study (ECCCS) was a study of the CACFP sponsored by the Food and Nutrition Service of USDA (Glantz et al., 1997; Fox et al., 1997). It described the institutions and children that participate in CACFP. The study was also designed to:
• Examine the nutrient content of meals offered to children while in care; • Examine the nutrient content of meals consumed by children while in care; and • Assess the contribution to the total diet of foods consumed while in care.
Information was collected from nationally representative samples of sponsoring agencies, participating child care sites (child care centers; Head Start centers; and family child care homes), and children and their parents. The data were collected between January and June 1995, a time period roughly comparable to the 1994 to 1996 CSFII. At that time, the USDA Food and Nutrition Service (FNS) elected not to analyze the information on out-of-care consumption due to the low, 41-percent response rate on this portion of the study. FNS recommends that analyses of these data should not be considered as representative of the population of CACFP participants or of the impact of the program. It appears to us, however, that this information could make a significant contribution to our understanding of the role of the CACFP—one source of food eaten away from home upon which working mothers rely. An analysis of non-response was conducted as part of this study and results are presented in Appendix D. 8 Although obesity is a topic of much concern, parent-reported heights and weights for children younger than 12 are
notably unreliable, with height too often reported at 6-inch intervals, such as 18, 24, 30, and 36 inches. With the analysis aiming to include all children 0 to 17 years old, obesity was not among the nutrition outcomes we could measure for all children. Results for children age 12 to 17 are provided in volume II of this report.
Abt Associates Inc. Chapter 1: Introduction 13

In the ECCCS, each participating child care provider was assigned a target week during the field period. Three interrelated data collection activities took place during the target week: (1) a menu survey, (2) meal observations, and (3) dietary recall interviews. The menu survey, completed by providers for the target week, collected detailed information on the foods offered to children while in care. To gather information on what the children consumed in the child care setting, meal observa-tions were conducted on two nonconsecutive days by trained data collectors.9 To obtain information on food consumed by children outside of the child care setting (on the observation days), dietary recalls were conducted with parents by telephone. A household interview was also conducted with the parents of participating children at this or a later time. Two days of complete dietary recall data are available for just under one half of respondent children; the remaining children's parents completed only the first recall. The information collected is similar to that provided in the CSFII, although meal times were not captured making it difficult to define eating occasions consistently across the data sets. Nutrients and the availability of USDA food codes allow for the construction of a number of diet quality variables, including Food Guide Pyramid servings and Healthy Eating Index (HEI) scores. Information on mothers’ employment is also available, allowing the distinction to be made between homemakers and mothers’ who are employed or in school. Analytic Approach
Research Question #1: How do nutrition outcomes differ among children whose mothers work full-time, part-time, and not at all?
Children of working mothers may have better or worse nutrition outcomes than their counterparts either because their mothers work, or because working mothers differ in other ways from non-working mothers (e.g., they may tend to have more formal education, may be more likely to be single parents, or may have varying nutrition knowledge or attitudes). The analysis sample for addressing this research question comprises children living in households that participated in the CSFII whose mothers (or mother-equivalents) were either employed or homemakers. A child is a household member aged 0 to 17 years, excluding reference persons (heads of household), their spouses, and their partners. A mother/mother equivalent, or “maternal female”, is a female member of the child’s household, aged 15 to 59 years and at least five years older than the child, who has the closest familial relationship to the child. In the great majority of cases, this person is the child’s biological mother. In some cases she may, however, be the child’s stepmother, foster mother, older sister, aunt, or grandmother, or the unmarried partner of the child’s father.10 Although the term “mother” is used for brevity, this should be understood as synonymous with the more precise term “maternal female.”
9 Prior to each meal and snack, observers weighed or measured reference portions of each food to be offered. During
meal time, observers recorded the amount of food each child received and the amount of food left on the child’s plate. Food consumed was then calculated as the difference.
10 It is not always possible to tell the exact relationship between the child and the “mother”, because the CSFII reports only household members’ relationship to the reference person (RP), not their relationships to each other. Thus if the RP is male, a child of the RP may either be the biological child or stepchild of the RP’s spouse. Appendix A details the procedures used to determine child-maternal female dyads in the CSFII.
14 Chapter 1: Introduction Abt Associates Inc.

The final sample comprises 15,344 child-maternal female dyads in 7,190 households. In these dyads:
• 10,116 children were randomly selected as CSFII sample persons for collection of dietary intake data (including children only up to age 9 in the Supplemental Children’s Survey); and
• 1,517 children’s mothers were randomly selected to participate in the DHKS. Within the dyads, mothers were classified as full-time employed, part-time employed, or homemaker. The distinction between the first two categories is determined based on reported hours per week “usually” worked, or if necessary, by hours worked last week: 1 to 34 (part-time) versus 35 or more (full-time). Women who did not work because they were keeping house are considered homemakers. Because the focus of this analysis is comparing the nutrition outcomes of children of working versus nonworking mothers, children whose mothers were unemployed or in school were dropped from the sample. Nearly half (48 percent) of the sample children’s mothers worked full time, over a quarter (30 percent) were homemakers, and the remainder (22 percent) worked part time (Exhibit 1.2). Exhibit 1.2 Employment Status of Sample Children’s Mothers
48%
Full-Time
22%
Part-Time
30%
Homemaker
Child nutrition outcomes such as food and nutrient intake were analyzed for mother-child dyads in which children were sample persons in the CSFII. Household nutrition outcomes (including FSP participation and food sufficiency) were analyzed (in volume II) for all dyads, regardless of sample person status. Maternal nutrition knowledge and attitudes were analyzed for those dyads in which the mother was a sample person and was administered the DHKS.
Abt Associates Inc. Chapter 1: Introduction 15

Outcomes for children of mothers who work full-time and part-time were compared with outcomes for children of nonworking mothers (homemakers), and the differences were tested for statistical significance. In addition to comparisons for the entire analysis sample, comparisons were also performed for subgroups, as appropriate for the particular outcomes, based on the following characteristics:
• Age of child • Household income relative to federal poverty level • Presence of another adult in the household.
Because younger children’s mothers are less likely to work, all tabulations were age-weighted. Thus, when comparing outcomes among maternal employment categories, the distribution of children’s age is held constant. Research Question #2: How do dietary outcomes differ among children whose mothers work full-time, part-time, and not at all, after taking account of underlying differences in the popula-tions?
Further analysis is conducted of the relationship between maternal employment and selected nutrition outcomes, namely, direct measures of children’s dietary intake. These measures include the HEI and its components, food energy, intake of iron, zinc, and dietary fiber, and several foods of special interest (soda, added sugar, fried potatoes). Although it is not possible to establish causation,11 it is at least possible to use multivariate analysis (logistic and least squares regression) to determine the relationship net of the influences of some basic characteristics that may vary with maternal employ-ment, namely:
• mother’s age • mother’s race/ethnicity • mother’s education • household size/composition • mother’s nutritional knowledge • mother’s nutritional attitudes • other adult household members’ earnings • region of country • urban versus rural residence
Maternal nutrition knowledge and attitudes are included on the above list because they are particu-larly interesting as potential determinants of children’s dietary outcomes. They are assumed neither to cause nor to be caused by maternal employment. They may however be correlated with maternal employment because of common antecedents—some of which (education, race/ethnicity) are included in the analysis, and others of which (general attitudes, temperament) are not. A design feature of the CSFII is that information was collected on maternal nutrition knowledge and attitudes for only a small fraction of children for whom dietary data are available (around 15 percent). In
11 Causal inferences cannot be drawn because there may be unmeasured characteristics that affect both maternal
employment and children’s nutrition outcomes, such as the mother’s attitudes toward women’s appropriate roles.
16 Chapter 1: Introduction Abt Associates Inc.
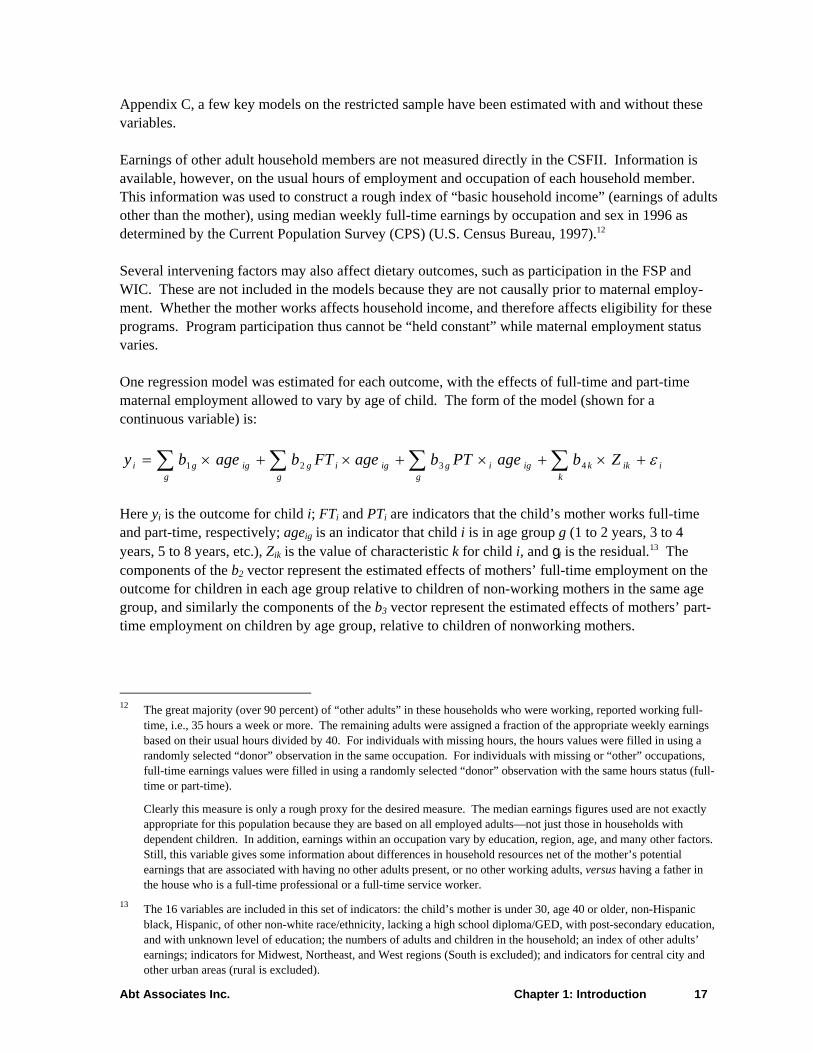
Appendix C, a few key models on the restricted sample have been estimated with and without these variables. Earnings of other adult household members are not measured directly in the CSFII. Information is available, however, on the usual hours of employment and occupation of each household member. This information was used to construct a rough index of “basic household income” (earnings of adults other than the mother), using median weekly full-time earnings by occupation and sex in 1996 as determined by the Current Population Survey (CPS) (U.S. Census Bureau, 1997).12
Several intervening factors may also affect dietary outcomes, such as participation in the FSP and WIC. These are not included in the models because they are not causally prior to maternal employ-ment. Whether the mother works affects household income, and therefore affects eligibility for these programs. Program participation thus cannot be “held constant” while maternal employment status varies. One regression model was estimated for each outcome, with the effects of full-time and part-time maternal employment allowed to vary by age of child. The form of the model (shown for a continuous variable) is:
iikk
kigig
gigig
gigg
gi ZbagePTbageFTbageby ε+×+×+×+×= ∑∑∑∑ 4321
Here yi is the outcome for child i; FTi and PTi are indicators that the child’s mother works full-timand part-time, respectively; age
e
thers’ part-me employment on children by age group, relative to children of nonworking mothers.
ig is an indicator that child i is in age group g (1 to 2 years, 3 to 4 years, 5 to 8 years, etc.), Zik is the value of characteristic k for child i, and gi is the residual.13 The components of the b2 vector represent the estimated effects of mothers’ full-time employment on the outcome for children in each age group relative to children of non-working mothers in the same age group, and similarly the components of the b3 vector represent the estimated effects of moti
12 The great majority (over 90 percent) of “other adults” in these households who were working, reported working full-
time, i.e., 35 hours a week or more. The remaining adults were assigned a fraction of the appropriate weekly earnings based on their usual hours divided by 40. For individuals with missing hours, the hours values were filled in using a randomly selected “donor” observation in the same occupation. For individuals with missing or “other” occupations, full-time earnings values were filled in using a randomly selected “donor” observation with the same hours status (full-time or part-time).
Clearly this measure is only a rough proxy for the desired measure. The median earnings figures used are not exactly appropriate for this population because they are based on all employed adults—not just those in households with dependent children. In addition, earnings within an occupation vary by education, region, age, and many other factors. Still, this variable gives some information about differences in household resources net of the mother’s potential earnings that are associated with having no other adults present, or no other working adults, versus having a father in the house who is a full-time professional or a full-time service worker.
13 The 16 variables are included in this set of indicators: the child’s mother is under 30, age 40 or older, non-Hispanic black, Hispanic, of other non-white race/ethnicity, lacking a high school diploma/GED, with post-secondary education, and with unknown level of education; the numbers of adults and children in the household; an index of other adults’ earnings; indicators for Midwest, Northeast, and West regions (South is excluded); and indicators for central city and other urban areas (rural is excluded).
Abt Associates Inc. Chapter 1: Introduction 17

Research Question #3: What role does the CACFP appear to serve in meeting the nutritional needs of children in child care?
Not all children of working mothers are in child care, and not all children in child care have working mothers. Nonetheless, the correlation is strong. According to the 1997 National Survey of America’s Families (NSAF), among children aged 0 to 5 whose “responding parent” (the person most knowl-edgeable about the child) was employed, 78 percent of those in lower income households and 85 percent in higher income households are in non-parental care. The corresponding proportions for children whose responding parent was not employed are 44 and 57 percent (Tout et al., 2001).14 The child component of CACFP, which subsidizes qualifying meals and snacks for children in child care, is thus the nutrition assistance program most directly focused on children of working mothers. Two major studies funded by USDA, the ECCCS and, more recently, the Family Child Care Homes Legislative Changes Study, have assessed the dietary quality of CACFP meals and snacks. Although no quantitative nutrition standards exist for the CACFP, both studies compared meals offered by CACFP providers to benchmarks established for the school meal programs. The earlier study also did the same comparisons for meals and snacks actually consumed by children in CACFP care. Findings from these and other studies of the CACFP raise the possibility that CACFP meals contribute more than their share of fat, saturated fat, and sodium and a less-than-adequate proportion of total carbohy-drate relative to food energy intake (Crepinsek et al., 2002a; Fox et al., 1997; Briley et al., 1993). On the other hand, they offer a substantial proportion of children’s Recommended Daily Allowance (RDA) for food energy and key vitamins and minerals (Fox et al., 1997, Crepinsek et al., 2002a). No national studies to date have evaluated the impact of the CACFP on children’s dietary intake over a full 24-hour period (Glantz, 2003). Using hitherto unexamined data from the ECCCS, this study assesses the food energy and nutrient intake by children in CACFP settings in the context of their consumption during the rest of the day. Because the focus of this research question is CACFP as a whole, all child participants are included, regardless of maternal employment. To examine the role the CACFP plays in meeting the nutritional needs of children in child care, ECCCS meal observation data for meals consumed in CACFP care were linked with dietary recall interview data on non-CACFP care intake for the same days. The analysis sample was CACFP children age 1 to 10 for whom information was available on meals consumed in both contexts. Tabulations place the food energy and nutrient intake from CACFP meals in the context of intake for the whole day. Although meal requirements for children are the same regardless of type of CACFP care setting, demographic characteristics differ. Findings are therefore presented separately for children in family child care homes, Head Start centers, and other types of child care centers. Research Question #4: How do nutrition outcomes compare between CACFP-participating children of working mothers and not-in-care children of non-working mothers?
The CACFP may be deemed successful if it feeds children who need to be in care at least as well as children who do not need to be in care are fed by their own mothers. Diet quality, therefore, was
14 Lower income families are those under 200 percent of the federal poverty guideline.
18 Chapter 1: Introduction Abt Associates Inc.

compared between children in CACFP care whose mothers are working or in school and not-in-care children whose mothers are full-time homemakers.15
The sample of children in CACFP was drawn from the ECCCS. The comparison group was children not in child care in the 1994 to 1996 CSFII data set whose mothers did not work (referred to from here on as 'not-in-care children of nonworking mothers'). The samples of children for this analysis were limited to children 1 to 5 years of age, the group for which CACFP and maternal employment were expected to have the most impact. For the CSFII sample, only data collected on weekdays were included (76 percent of the 1994 to 1996 interviews) to enhance comparability with the ECCCS. Diet quality measures were tabulated for CACFP participants by hours per day in child care, and for both the CACFP and CSFII samples by subgroups based on income and number of adults in the household. Differences in outcomes for participants with working mothers and not-in-care children of nonworking mothers were tested for statistical significance. Differences between groups are reported in the text as statistically significant if they have a less than 5 percent probability of arising by chance. Some disciplines conventionally consider differences to be significant if their probability of arising by chance is less than 10 percent. Accordingly, differences that would be significant at the 10 percent level but not the 5 percent level are noted, but indicated as p < 0.10. Differences that are significant at the 5 percent level or better are simply reported as “statistically significant”. Overview of Report
The next two chapters of this report address Research Questions 1 and 2. Chapter 2 describes the simple relationships between mothers’ work status and direct measures of children’s nutrition (HEI scores and food and nutrient intake). Results of further analyses of the relationship between maternal employment and children’s nutrition using multivariate techniques are discussed in Chapter 3. Chapter 4 presents findings from analyses of the contribution of CACFP to children’s diets (Research Question 3). It begins with a descriptive analysis of children’s food energy and nutrient intake from CACFP meals and snacks in the context of total intake over 24 hours. This is followed by results of comparisons of selected measures of diet quality between CACFP participants with working mothers and not-in-care children of nonworking mothers (Research Question 4). Appendices A through C include information on the identification of maternal-child dyads in the CSFII, sampling weights, and detailed findings on the association of sample characteristics (including maternal nutrition knowledge and attitudes) with maternal employment status. A nonresponse analysis for the ECCCS 24-hour recalls is described in Appendix D, and Appendix E provides standard errors for selected analyses of these data.
15 For these analyses, children in CACFP care were excluded when their mothers were not working or in school. The
reason for doing so is that CACFP care is not substituting for mothers’ care for these children; mothers’ care is in fact available. Conversely, excluded from the comparison group were children whose mothers worked or were in school, even if the children were not in care. Although mothers of school-aged children can forego nonparental care if they work or go to school part time, they are clearly under more time pressure than stay-at-home mothers. The most appro-priate comparison appears to be between children who need to be in nonparental care and are served by CACFP with children who do not need to be (and are not) in nonparental care.
Abt Associates Inc. Chapter 1: Introduction 19

Volume II of this report presents results of additional analyses of the relationships between mothers’ work status and children’s other nutrition-related outcomes. That volume's four chapters examine children’s eating patterns, household food acquisition and food sufficiency, participation in food assistance programs, and children’s physical activity and weight status.
20 Chapter 1: Introduction Abt Associates Inc.
Chapter 2 Children’s Nutrition Outcomes
The quality of children’s diets can have consequences for physical growth, cognitive development, and health. Problems of both over- and under-consumption can increase children’s risk for diet-related diseases later in life. One particularly worrisome trend is the increase in childhood over-weight. Research shows that many children’s diets fall short of meeting recommended dietary standards. Specifically, children fail to consume enough fruit and vegetables, but they consume too much fat, saturated fat, and sodium. Low intakes of vitamins and minerals are a particular problem among teenage girls. In addition, a substantial number of children consume large amounts of soda and fruit-flavored drinks that are high in added sugar (Gleason and Suitor, 2001). The link between maternal employment and the nutritional quality of children’s diets is difficult to predict. While some aspects of diet quality related to income might be improved (e.g., more fresh fruit and variety), other aspects related to the mother’s time availability might be worsened (e.g., greater reliance on restaurant meals and prepared food). National dietary recommendations such as the Dietary Guidelines for Americans and USDA’s Food Guide Pyramid provide guidance to help prevent nutritional problems in both children’s and adults’ diets. To the extent that maternal employment plays a role, additional or more targeted initiatives may be needed to improve the diet quality of this group of children. This chapter describes relationships between mothers’ employment and direct measures of children’s nutrition. The HEI was selected as the primary measure of overall diet quality (Bowman et al., 1998). Several additional measures were included in order to address more specifically the dietary compo-nents that might be affected by maternal employment. The full set of outcomes measures used in the analysis is listed in Exhibit 2.1, and individual measures are further described in the sections that follow. All nutrition outcomes were examined for children age 2 to 17, the age range for which most dietary recommendations apply. In addition, infants and children 1 year of age are included in tabulations of food energy, iron, and zinc. Unless otherwise noted, two-day intake values were averaged before computing means and proportions across groups. All data were weighted to achieve national representation (see Appendix B). The analyses show a pattern across most, but not all, indicators of diet quality whereby children whose mothers work full-time have less positive nutrition outcomes than children of nonworking mothers. Although statistically significant, differences for only some of these measures are nutri-tionally meaningful and only for some subgroups of children. Associations between maternal employment and children’s nutrition outcomes include the following:
Abt Associates Inc. Chapter 2: Children's Nutrition Outcomes 21

Exhibit 2.1 Measures Used in Comparisons of Children’s Nutrition Outcomes Outcome Measure HEI–overall Score of 0-100
Components: Grain consumption Score of 0-10 Vegetable consumption Score of 0-10 Fruit consumption Score of 0-10 Milk consumption Score of 0-10 Meat consumption Score of 0-10 Total fat intake as percent of energy intake Score of 0-10 Saturated fat intake as percent of energy intake Score of 0-10 Cholesterol intake Score of 0-10 Sodium intake Score of 0-10 Variety Score of 0-10
Diet Quality Rating:a
Good diet Needs improvement Poor diet
Score above 80 Score between 51 and 80 Score of 50 or below
Total food energy intake Percent of 1989 REA
Percent above 110 percent REAb
Percent below 90 percent REAb
Iron intake Percent of 2001 RDA Zinc intake Percent of 2001 RDA Dietary fiber intake Percent of “age plus 5” grams/dayc
Soda consumption (includes diet) Ounces per day Other soft drink consumption (includes diet):
Fruit drinks (not juice) Tea
Ounces per day
Added sugar intake: From soda and other soft drinks From all sources
Teaspoons per day
Vegetable consumption: Vegetables other than fried potatoes Fried potatoes
Servings per day
REA=Recommended Energy Allowance RDA=Recommended Dietary Allowance
For groups, the 1989 REA represents the average energy requirements for individuals. In contrast, RDAs for other nutrients are high enough to meet the requirements of 97 to 98 percent of healthy individuals (NRC, 1989a).
a Developed by Kennedy et al., 1995.
b Arbitrary cutoff values used for group comparisons; not intended as a measure of adequacy of energy intake.
c American Health Foundation recommendation for adequate dietary fiber intake in children (Williams, 1995).
22 Chapter 2: Children's Nutrition Outcomes Abt Associates Inc.

• With regard to overall diet quality, children of full-time working mothers have slightly lower HEI scores overall than children of homemakers. However, preschool-age children and children in single-adult households whose mothers work have higher HEI scores and are more likely to have a “good” diet than children of nonworking mothers.
• Poorer diet quality among children whose mothers work full-time tends to be associated with lower scores for consumption of grains and fruit, and for dietary variety. Where diet quality is better for children of working mothers, it is related to higher scores for vegetable consumption, and lower intake of total and saturated fat.
• Food energy intake is higher among infants and preschool children if their mother works full-time versus not at all. This is troublesome given the high levels of energy intake relative to the 1989 Recommended Energy Allowance (REA) for infants and young children overall (114 to 119 percent).
• Children of full-time working mothers have lower intakes of iron relative to children of nonworking mothers; they still, however, consume amounts that greatly exceed recommended levels (mean of 143 percent of 2001 RDA).
• Among teenage girls, maternal full-time work is related to intakes of iron, zinc, and dietary fiber below recommended daily levels. Parenthetically, the finding that almost half of teenage girls are consuming somewhat lower than the average requirement for food energy is also of concern.
• Dietary fiber intake is lower for school-age children whose mothers have full-time employment. Reduced consumption of fruit and grains and less dietary variety, as measured by components of the HEI, may be factors along with the greater frequency of eating out.
• Children of full-time working mothers are more likely to consume larger quantities of soda, especially in single adult households. They also consume more servings of fried potatoes, but the differences are too small to be nutritionally important.
Healthy Eating Index Score
The HEI provides a summary measure of diet quality by assessing how well an individual’s diet meets the recommendations of USDA’s Food Guide Pyramid (USDA, 1992) and the Dietary Guidelines for Americans (USDA/USDHHS, 1995). The HEI score is the sum of scores on 10 components, each of which relates to different aspects of a healthful diet. Component scores are based on consumption of the recommended number of servings of each of the five major Food Guide Pyramid food groups; intake of total fat, saturated fat, cholesterol and sodium; and a measure of dietary variety. An overall HEI score above 80 implies a “good” diet, an HEI score between 51 and 80 implies a diet that “needs improvement,” and an HEI score less than 51 implies a “poor” diet (Kennedy et al., 1995). HEI component scores are computed proportionately to the recommended number of servings or amounts consumed. High HEI component scores indicate intakes close to recommended ranges or amounts; low component scores indicate less compliance with recommended ranges or amounts (Bowman et al., 1998).
Abt Associates Inc. Chapter 2: Children's Nutrition Outcomes 23

The mean HEI score for all children in the CSFII sample is 66 out of 100 (Exhibit 2.2)16. Average scores are highest among preschool children, age 2 to 4 years (72), and lowest among teenage boys and girls, 13 to 17 years of age (61 to 62). With regard to individual components of the HEI, children tend to do best on scores for cholesterol and total fat intake, grain consumption, and dietary variety (7.3 to 8.5, out of 10). Preschool and younger schoolchildren (age 5 to 8 years) also score relatively well for milk and sodium (7.5 to 8.6). The lowest mean component score overall is for fruit consumption (4.6), which is especially low among teenage boys and girls (3.0 to 3.5). There is a trend toward improved HEI scores for fruit, total fat, saturated fat, and cholesterol with increasing household income, while scores for meat consumption are lowest among children with higher family incomes (over 185 percent of poverty). Maternal employment is negatively associated with children’s HEI score overall, but the direction of the association is reversed among preschoolers and those in single-adult households. Children of mothers working full-time have a slightly, but significantly lower mean HEI score than children of nonworking mothers (65 versus 67 percent; Exhibit 2.2). The lower score for children with full-time working mothers can be attributed to statistically lower component scores for fruit and grain consumption, and dietary variety. HEI scores are similar for children of part-time and homemaker mothers. These relationships are replicated for children age 5 to 12, those with family incomes over 185 percent of poverty, and those in multiple adult households. It does not appear that the higher income and education levels of full-time working mothers relative to homemakers (see Chapter 3), or the presence of other adults in the household, outweigh the effects time constraints may have on school-age children’s dietary quality. On the other hand, children 2 to 4 years of age with mothers who work (especially part-time) have slightly, but significantly higher HEI scores compared with children of homemakers (72 to 73 versus 71, p < 0.10 for full-time). Differences for children of part-time working mothers result from higher component scores for fruit consumption, and total fat, saturated fat, and cholesterol intake relative to children whose mothers do not work. Children whose mothers work full-time do notably better on scores for vegetable, saturated fat, and sodium intake. The higher total HEI scores for children of working mothers in single-adult households, relative to children of homemakers, are related to better scores for vegetable consumption, and fat, saturated fat, and cholesterol intake.
16 HEI scores for the CSFII sample were obtained online from the Center for Nutrition Policy and Promotion
(www.cnpp.usda.gov/hei9496data). Scores were only available separately for each day of dietary intake data. Therefore, overall and component scores were calculated as the average of Day 1 and Day 2 scores.
24 Chapter 2: Children's Nutrition Outcomes Abt Associates Inc.
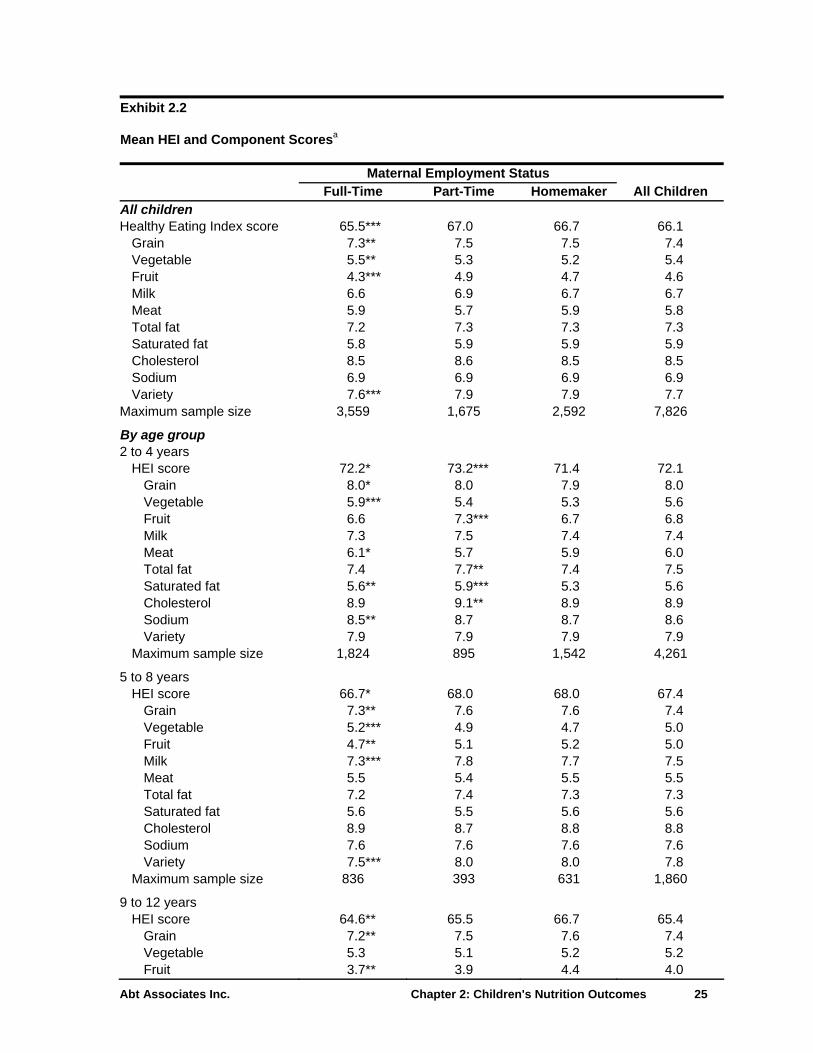
Exhibit 2.2 Mean HEI and Component Scoresa
Maternal Employment Status Full-Time Part-Time Homemaker All Children All children Healthy Eating Index score 65.5*** 67.0 66.7 66.1
Grain 7.3** 7.5 7.5 7.4 Vegetable 5.5** 5.3 5.2 5.4 Fruit 4.3*** 4.9 4.7 4.6 Milk 6.6 6.9 6.7 6.7 Meat 5.9 5.7 5.9 5.8 Total fat 7.2 7.3 7.3 7.3 Saturated fat 5.8 5.9 5.9 5.9 Cholesterol 8.5 8.6 8.5 8.5 Sodium 6.9 6.9 6.9 6.9 Variety 7.6*** 7.9 7.9 7.7
Maximum sample size 3,559 1,675 2,592 7,826
By age group 2 to 4 years
HEI score 72.2* 73.2*** 71.4 72.1 Grain 8.0* 8.0 7.9 8.0 Vegetable 5.9*** 5.4 5.3 5.6 Fruit 6.6 7.3*** 6.7 6.8 Milk 7.3 7.5 7.4 7.4 Meat 6.1* 5.7 5.9 6.0 Total fat 7.4 7.7** 7.4 7.5 Saturated fat 5.6** 5.9*** 5.3 5.6 Cholesterol 8.9 9.1** 8.9 8.9 Sodium 8.5** 8.7 8.7 8.6 Variety 7.9 7.9 7.9 7.9
Maximum sample size 1,824 895 1,542 4,261
5 to 8 years HEI score 66.7* 68.0 68.0 67.4
Grain 7.3** 7.6 7.6 7.4 Vegetable 5.2*** 4.9 4.7 5.0 Fruit 4.7** 5.1 5.2 5.0 Milk 7.3*** 7.8 7.7 7.5 Meat 5.5 5.4 5.5 5.5 Total fat 7.2 7.4 7.3 7.3 Saturated fat 5.6 5.5 5.6 5.6 Cholesterol 8.9 8.7 8.8 8.8 Sodium 7.6 7.6 7.6 7.6 Variety 7.5*** 8.0 8.0 7.8
Maximum sample size 836 393 631 1,860
9 to 12 years HEI score 64.6** 65.5 66.7 65.4
Grain 7.2** 7.5 7.6 7.4 Vegetable 5.3 5.1 5.2 5.2 Fruit 3.7** 3.9 4.4 4.0
Abt Associates Inc. Chapter 2: Children's Nutrition Outcomes 25

Exhibit 2.2 Mean HEI and Component Scoresa
Maternal Employment Status Full-Time Part-Time Homemaker All Children
Milk 6.7 7.0 6.8 6.8 Meat 5.8 5.7 5.8 5.8 Total fat 7.1** 7.2* 7.6 7.3 Saturated fat 5.8 6.0 6.1 5.9 Cholesterol 8.6 8.6 8.5 8.6 Sodium 6.4 6.2 6.3 6.3 Variety 7.9** 8.1 8.3 8.1
Maximum sample size 428 206 238 872
13 to 17 years, male HEI score 60.5 63.2 62.1 61.4
Grain 7.3 7.7 7.3 7.4 Vegetable 5.7 5.8 5.7 5.7 Fruit 2.6 3.4 3.3 3.0 Milk 6.3 6.6 5.9 6.3 Meat 6.8 6.4 6.6 6.7 Total fat 6.8 7.2 7.0 6.9 Saturated fat 5.9* 6.1 6.5 6.1 Cholesterol 7.0 7.6 7.6 7.3 Sodium 4.4 4.3 4.6 4.4 Variety 7.5 8.2 7.6 7.6
Maximum sample size 232 86 99 417
13 to 17 years, female HEI score 61.1 63.2 62.5 61.9
Grain 6.2 6.6 6.7 6.4 Vegetable 5.3 5.7 5.6 5.5 Fruit 3.3 4.2 3.3 3.5 Milk 4.4 4.7 4.9 4.5 Meat 5.3* 5.3 5.9 5.4 Total fat 7.4 7.3 7.0 7.3 Saturated fat 6.5 6.4 6.3 6.5 Cholesterol 8.8 8.8 8.5 8.8 Sodium 7.3 7.0 6.9 7.2 Variety 6.6** 7.3 7.3 6.9
Maximum sample size 239 95 82 416
By income category Under 130% of poverty
HEI score 64.4 64.8 64.6 64.6 Grain 7.1 7.2 7.3 7.2 Vegetable 5.7** 5.5 5.3 5.5 Fruit 4.1 4.6 4.3 4.3 Milk 6.3 6.6 6.6 6.5 Meat 6.5 6.3 6.5 6.4 Total fat 6.9 6.6 6.8 6.8 Saturated fat 5.5 5.2 5.4 5.4 Cholesterol 7.9 8.2 7.9 8.0
26 Chapter 2: Children's Nutrition Outcomes Abt Associates Inc.

Exhibit 2.2 Mean HEI and Component Scoresa
Maternal Employment Status Full-Time Part-Time Homemaker All Children
Sodium 7.0 6.8 6.9 6.9 Variety 7.5 7.7 7.6 7.6
Maximum sample size 822 431 1,051 2,304
130 to 185% of poverty HEI score 63.6 65.2 64.8 64.4
Grain 7.2 7.2 7.3 7.2 Vegetable 5.6** 5.3 5.0 5.4 Fruit 3.8* 4.3 4.3 4.1 Milk 6.5 6.5 6.4 6.5 Meat 6.2* 5.8 5.8 6.0 Total fat 6.7** 7.2 7.2 7.0 Saturated fat 5.3*** 5.7 6.1 5.6 Cholesterol 8.2 8.1 8.3 8.3 Sodium 6.8 7.2 6.9 6.9 Variety 7.3 7.7 7.5 7.5
Maximum sample size 470 242 396 1,108
Over 185% of poverty HEI score 66.1*** 68.1 68.6 67.1
Grain 7.3*** 7.8 7.7 7.5 Vegetable 5.4 5.2 5.2 5.3 Fruit 4.5*** 5.1 5.2 4.8 Milk 6.6** 7.1 7.0 6.8 Meat 5.6 5.4 5.5 5.5 Total fat 7.4** 7.6 7.7 7.5 Saturated fat 6.0 6.2 6.2 6.1 Cholesterol 8.7** 8.8 9.0 8.8 Sodium 6.9 6.8 7.0 6.9 Variety 7.6*** 8.1 8.2 7.8
Maximum sample size 2,267 1,002 1,145 4,414
By number of adults One
HEI score 65.3*** 65.1** 62.5 64.7 Grain 7.2 7.3 7.4 7.2 Vegetable 5.8** 5.8* 5.1 5.7 Fruit 4.0 4.5 4.3 4.1 Milk 6.4 6.5 6.6 6.4 Meat 6.3 6.1 6.3 6.3 Total fat 7.1*** 6.7 6.3 6.9 Saturated fat 5.8*** 5.4* 4.7 5.5 Cholesterol 8.4 8.7** 8.0 8.4 Sodium 6.6 6.5 6.3 6.6 Variety 7.7 7.6 7.5 7.6
Maximum sample size 571 184 244 999
Abt Associates Inc. Chapter 2: Children's Nutrition Outcomes 27

Exhibit 2.2 Mean HEI and Component Scoresa
Maternal Employment Status Full-Time Part-Time Homemaker All Children Multiple
HEI score 65.6*** 67.2 67.1 66.4 Grain 7.3** 7.6 7.5 7.4 Vegetable 5.4 5.2 5.2 5.3 Fruit 4.4*** 4.9 4.8 4.6 Milk 6.6 7.0* 6.7 6.7 Meat 5.8 5.6 5.8 5.7 Total fat 7.2* 7.4 7.4 7.3 Saturated fat 5.8 6.0 6.1 5.9 Cholesterol 8.5 8.6 8.6 8.6 Sodium 7.0 6.9 7.0 7.0 Variety 7.5*** 8.0 8.0 7.7
Maximum sample size 2,988 1,491 2,348 6,827 a Range of scores for the HEI is 0 to 100; ranges for each component of the HEI are 0 to 10. The overall HEI score is the
simple sum of the scores for each of the 10 components.
*** Statistically significant difference from children whose mothers are homemakers at the 1 percent level ** Statistically significant difference from children whose mothers are homemakers at the 5 percent level * Statistically significant difference from children whose mothers are homemakers at the 10 percent level
Healthy Eating Index Diet Rating
Based on average total HEI scores, the diet quality of most children (83 percent) fell in the “needs improvement” range (Exhibit 2.3).17 No more than 10 percent of children overall have either a “good diet” or “poor diet” rating, but this varies considerably by age group. Among 2- to-4-year-olds, a fairly substantial proportion of children have a good diet (25 percent), whereas very few teenagers do (less than 3 percent). Conversely, the share of children with a “poor diet” rating increases steadily with age; boys age 13 to 17 years are the most likely to have a poor diet (16 percent). Higher household income (over 185 percent of poverty) and the presence of multiple adults reduces the likelihood that children receive “poor” diet ratings. No statistically significant differences in diet quality ratings were found among children with working and nonworking mothers overall. Among subgroups, however, a significantly larger share of children of full-time working mothers have poor diets if they are age 9 to 12 years, or in higher income or multiple adult households. These results reflect the patterns of lower HEI scores for these groups reported previously. The positive relationships between maternal employment and HEI scores among preschool children and children in single adult households are maintained in results of the analysis of HEI diet quality ratings. As shown in Exhibit 2.3, preschool children of working mothers are more likely to have good diets and less likely to have a diet that needs improvement than children whose mothers are homemakers. 17 HEI scores were averaged over the two days of dietary data before assigning a diet quality rating.
28 Chapter 2: Children's Nutrition Outcomes Abt Associates Inc.

Exhibit 2.3 HEI Diet Ratinga
Maternal Employment Status Full-Time Part-Time Homemaker All Children All children Poor diet 8.7% 6.6% 7.2% 7.8% Diet needs improvement 82.8 82.8 83.0 82.9 Good diet 8.5 10.5 9.8 9.3 Maximum sample size 3,559 1,675 2,592 7,826
By age group 2 to 4 years
Poor diet 3.1% 2.3% 3.2% 2.9% Diet needs improvement 70.9** 70.8* 74.4 72.1 Good diet 26.0** 26.9** 22.4 24.9 Maximum sample size 1,824 895 1,542 4,261
5 to 8 years Poor diet 5.7% 2.6%* 5.2% 4.9% Diet needs improvement 88.5 87.4 86.4 87.6 Good diet 5.8 10.1 8.4 7.5 Maximum sample size 836 393 631 1,860
9 to 12 years Poor diet 7.4%*** 10.4%** 3.0% 6.9% Diet needs improvement 87.8 83.2 87.3 86.6 Good diet 4.7 6.5 9.8 6.5 Maximum sample size 428 206 238 872
13 to 17 years, male Poor diet 17.6% 11.0% 16.2% 15.9% Diet needs improvement 79.8 86.5 82.6 81.8 Good diet 2.6 2.5 1.2 2.3 Maximum sample size 232 86 99 417
13 to 17 years, female Poor diet 14.2% 8.8% 13.8% 12.9% Diet needs improvement 84.0 87.2 82.2 84.4 Good diet 1.8 4.1 4.1 2.7 Maximum sample size 239 95 82 416
By income category Under 130% of poverty
Poor diet 12.7% 11.0% 10.4% 11.4% Diet needs improvement 79.6 80.4 82.8 81.1 Good diet 7.7 8.6 6.9 7.5 Maximum sample size 822 431 1,051 2,304
130 to 185% of poverty Poor diet 13.4% 5.2%** 11.1% 10.8% Diet needs improvement 79.2 87.2* 80.6 81.3 Good diet 7.3 7.6 8.3 8.0 Maximum sample size 470 242 396 1,108
Abt Associates Inc. Chapter 2: Children's Nutrition Outcomes 29

Exhibit 2.3 HEI Diet Ratinga
Maternal Employment Status Full-Time Part-Time Homemaker All Children Over 185% of poverty
Poor diet 6.9%** 5.4% 3.9% 5.9% Diet needs improvement 84.3 82.9 83.9 83.9 Good diet 8.8** 11.7 12.2 10.2 Maximum sample size 2,267 1,002 1,145 4,414
By number of adults One
Poor diet 9.9%** 9.0%** 16.9% 10.5% Diet needs improvement 80.9 81.9 78.3 81.2 Good diet 9.2*** 9.1* 4.8 8.4 Maximum sample size 571 184 244 999
Multiple Poor diet 8.4%* 6.6% 6.3% 7.4% Diet needs improvement 83.2 82.9 83.4 83.2 Good diet 8.4* 10.5 10.3 9.4 Maximum sample size 2,988 1,491 2,348 6,827
a An HEI score over 80 implies a “good diet,” an HEI score between 51 and 80 implies a diet that “needs improvement,” and an HEI score less than 51 implies a “poor diet.”
*** Statistically significant difference from children whose mothers are homemakers at the 1 percent level ** Statistically significant difference from children whose mothers are homemakers at the 5 percent level * Statistically significant difference from children whose mothers are homemakers at the 10 percent level
Intake of Total Food Energy Intake and Selected Nutrients
It is possible for an individual to achieve a “good” HEI diet rating yet be consuming excessive levels of food energy, putting him or her at increased risk for overweight or obesity. This is because HEI scores for energy-bearing components are not adjusted in any way for intakes above the recom-mended levels. It was therefore important to examine separately the relationship between maternal employment and children’s food energy intake. In bivariate analyses of children’s eating patterns (see Volume II, Appendix F), maternal employment was shown to be associated with increased reliance on restaurant meals. Large portions and the high fat content of many of these meals may contribute to excessive energy intake in children. On the other hand, these analyses also show that children whose mothers work are more likely to skip breakfast, which could result in less than adequate food energy consumption. To determine the relationship between maternal employment and children’s energy intake, food energy, measured as a percent of the 1989 REA, is compared between children of working and nonworking mothers. Early research on the HEI showed that correlations of HEI scores with individual nutrients are not particularly high for two of the nutrients critical to the diets of young children: iron and zinc (Kennedy et al., 1995). Both iron and zinc are considered important for growth and learning and
30 Chapter 2: Children's Nutrition Outcomes Abt Associates Inc.

have been reported to be under-consumed by many children. For example, iron intake has been reported to fall below the 1989 RDA for many children under age 5 (USDA/ARS, 1999)18, and among teenage girls who have the highest requirement (Gleason and Suitor, 2001). In addition, a substantial proportion of children of all ages may not consume enough zinc (USDA/ARS, 1999; Gleason and Suitor, 2001). For these reasons, iron and zinc intakes are examined here.19
Finally, the HEI may also under-represent dietary fiber intake since it does not reflect the higher fiber Food Guide Pyramid subgroups, such as whole grains and cooked dry beans and peas. Thus dietary fiber intakes are also assessed. Children of working and nonworking mothers’ consumption of dietary fiber are compared in relation to the American Health Foundation’s recommendation for “age plus five” grams per day (Williams, 1995). Food Energy
Mean food energy intake exceeds the 1989 REA for all children combined at 109 percent (Exhibit 2.4). Only one fourth of children overall have energy intakes that fall within 10 percent of the average daily requirement, and a large proportion may be consuming too much.20 Food energy intake relative to the REA is highest among (non-breastfed) infants, preschool children (ages 1 to 4), and teenage boys. Only teenage girls are consuming less food energy, on average, than their REA (mean of 96 percent). There is little variation in children’s food energy intake by income or number of adults in the household.
18 The analyses of CSFII data that this is based on did not adjust for day-to-day variability in children’s intakes and were
based on the 1989 RDA rather than the Estimated Average Requirement (EAR), which was not available at the time. Both of these factors could have resulted in an overestimation of the proportion of children with inadequate iron intakes.
19 Iron and zinc were examined for infants 7 to 11 months old and children 1 to 17 years old. Values are expressed in relation to the most recently available RDA values for these nutrients (Dietary Reference Intakes; IOM/FNB, 2001). There is currently no iron or zinc RDA for infants from birth through 6 months. Adequate Intake (AI) values have been established, but they are based on the average intake of these nutrients among breastfed infants. Because dietary intake data for the CSFII sample are only available for non-breastfed infants, the AI was not felt to be an appropriate reference standard, and infants age 0 to 6 months were excluded from the comparisons.
20 Note that an assessment of the adequacy of children’s food energy intake can only be made if day-to-day variability is removed and the distribution of usual intake is then compared to the average energy requirement; this analysis, however, was beyond the scope of this study. The expected effect of this type of adjustment would be to reduce the proportions of children with high or low energy intakes. New reference values for food energy have recently become available, i.e., Estimated Energy Requirements (EERs), but their application depends on knowing individuals’ physical activity levels (IOM/FNB, 2002).
Abt Associates Inc. Chapter 2: Children's Nutrition Outcomes 31

Exhibit 2.4 Food Energy Intake Relative to 1989 REA Maternal Employment Status Full-Time Part-Time Homemaker All Children All children Mean percent of REA 109.0% 110.7% 109.3% 109.4% Percent above 110% REA 42.2 43.4 41.8 42.3 Percent below 90% REA 34.0 27.7** 32.1 32.2 Maximum sample size 4,258 2,049 3,400 9,707
By age group 0 to 11 months
Mean percent of REA 121.4%** 120.9% 115.5% 119.1% Percent above 110% REA 54.1 58.1 50.4 53.5 Percent below 90% REA 17.0 15.0 21.3 18.2 Maximum sample size 365 202 402 969
1 to 2 years Mean percent of REA 117.3%** 110.8% 112.3% 114.0% Percent above 110% REA 42.4 43.2 48.1 48.8 Percent below 90% REA 24.7 26.3 28.3 26.5 Maximum sample size 716 355 803 1,874
3 to 4 years Mean percent of REA 118.3%* 118.8% 115.2% 117.4% Percent above 110% REA 53.2 51.9 50.0 51.9 Percent below 90% REA 25.3 23.7 26.2 25.2 Maximum sample size 1,442 712 1,145 3,299
5 to 8 years Mean percent of REA 106.6% 106.8% 107.6% 106.9% Percent above 110% REA 40.1 37.5 40.2 39.6 Percent below 90% REA 32.3 27.5 29.3 30.3 Maximum sample size 836 393 631 1,860
9 to 12 years Mean percent of REA 106.0% 111.9% 110.8% 108.8% Percent above 110% REA 38.5 42.4 42.1 40.4 Percent below 90% REA 34.7 32.1 29.7 32.7 Maximum sample size 428 206 238 872
13 to 17 years, male Mean percent of REA 113.7% 115.3% 112.2% 113.7% Percent above 110% REA 42.7 52.1 41.2 44.3 Percent below 90% REA 39.0 16.8*** 40.0 34.6 Maximum sample size 232 86 99 417
13 to 17 years, female Mean percent of REA 93.9% 99.8% 96.6% 95.7% Percent above 110% REA 29.1 34.4 29.3 30.3 Percent below 90% REA 52.3 40.6 44.7 48.2 Maximum sample size 239 95 82 416
32 Chapter 2: Children's Nutrition Outcomes Abt Associates Inc.
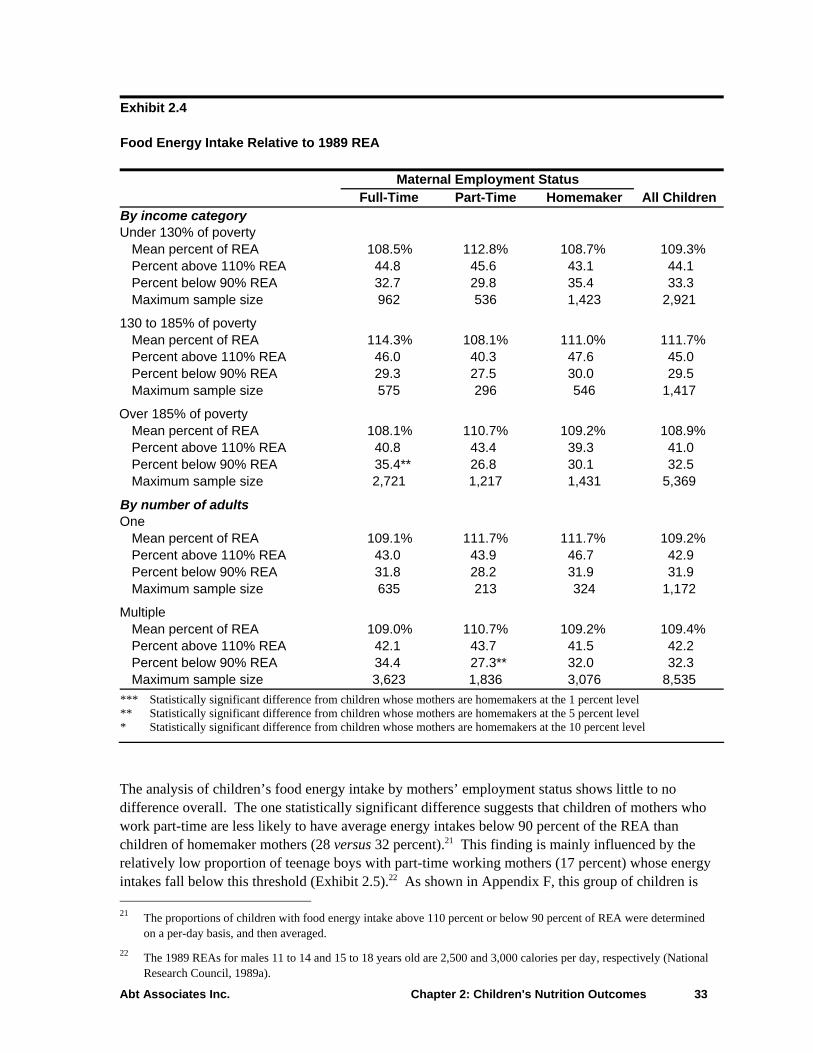
Exhibit 2.4 Food Energy Intake Relative to 1989 REA Maternal Employment Status Full-Time Part-Time Homemaker All Children By income category Under 130% of poverty
Mean percent of REA 108.5% 112.8% 108.7% 109.3% Percent above 110% REA 44.8 45.6 43.1 44.1 Percent below 90% REA 32.7 29.8 35.4 33.3 Maximum sample size 962 536 1,423 2,921
130 to 185% of poverty Mean percent of REA 114.3% 108.1% 111.0% 111.7% Percent above 110% REA 46.0 40.3 47.6 45.0 Percent below 90% REA 29.3 27.5 30.0 29.5 Maximum sample size 575 296 546 1,417
Over 185% of poverty Mean percent of REA 108.1% 110.7% 109.2% 108.9% Percent above 110% REA 40.8 43.4 39.3 41.0 Percent below 90% REA 35.4** 26.8 30.1 32.5 Maximum sample size 2,721 1,217 1,431 5,369
By number of adults One
Mean percent of REA 109.1% 111.7% 111.7% 109.2% Percent above 110% REA 43.0 43.9 46.7 42.9 Percent below 90% REA 31.8 28.2 31.9 31.9 Maximum sample size 635 213 324 1,172
Multiple Mean percent of REA 109.0% 110.7% 109.2% 109.4% Percent above 110% REA 42.1 43.7 41.5 42.2 Percent below 90% REA 34.4 27.3** 32.0 32.3 Maximum sample size 3,623 1,836 3,076 8,535
*** Statistically significant difference from children whose mothers are homemakers at the 1 percent level ** Statistically significant difference from children whose mothers are homemakers at the 5 percent level * Statistically significant difference from children whose mothers are homemakers at the 10 percent level
The analysis of children’s food energy intake by mothers’ employment status shows little to no difference overall. The one statistically significant difference suggests that children of mothers who work part-time are less likely to have average energy intakes below 90 percent of the REA than children of homemaker mothers (28 versus 32 percent).21 This finding is mainly influenced by the relatively low proportion of teenage boys with part-time working mothers (17 percent) whose energy intakes fall below this threshold (Exhibit 2.5).22 As shown in Appendix F, this group of children is 21 The proportions of children with food energy intake above 110 percent or below 90 percent of REA were determined
on a per-day basis, and then averaged. 22 The 1989 REAs for males 11 to 14 and 15 to 18 years old are 2,500 and 3,000 calories per day, respectively (National
Research Council, 1989a).
Abt Associates Inc. Chapter 2: Children's Nutrition Outcomes 33

not as likely to skip midday and evening meals as other 13- to 17-year old boys, but the reason for this pattern is not clear. Children in multiple adult households are also significantly less likely to consume below 90 percent of the REA if their mothers work part-time versus not at all (28 versus 32 percent). There were no differences in total food energy intake across the three income groups. Exhibit 2.5 Proportion of All Children and Teenagers With Mean Food Energy Intake Below 90 Percent of the 1989 REA, by Maternal Employment Status
0
10
20
30
40
50
60
All Children Males Age 13 to 17 Females Age 13 to 17
Perc
ent Full-time
Part-timeHomemaker
The analysis also finds that, among infants and preschool children, those with mothers who work full-time consume significantly higher levels of food energy than children of homemakers (117 to 121 percent versus 112 to 116 percent of REA). The differences due to employment status are not as great, however, as the disparity between mean energy intake and daily requirements among all infants and preschool children. One explanation for this finding is that food intake may have been over-reported by mothers who were proxy respondents for these age groups. Although maternal employment does not seem to play a consistent role in children’s food energy intake, the fact that almost half of teenage girls are consuming less than 90 percent of the REA and an even larger share of infants and young children are consuming in excess of 110 percent of the REA is troubling. Iron and Zinc
As shown in Exhibit 2.6, children’s mean intakes of iron and zinc overall exceed the 2001 RDA by a large margin (150 and 166 percent of RDA, respectively). Although the group mean does not sufficiently reflect the proportion of individual children that have intakes below the average requirements, with values this high it seems reasonable to conclude that a substantial number of
34 Chapter 2: Children's Nutrition Outcomes Abt Associates Inc.

children have adequate iron and zinc intakes.23 The one exception might be 13- to 17-year old girls, where the group mean intake is much closer to the RDA, at 104 percent of RDA for iron and 105 percent of RDA for zinc. Children’s intakes of iron and zinc, on average, do not vary much by household income or number of adults. Exhibit 2.6 Mean Iron and Zinc Intake as a Percent of 2001 RDA Maternal Employment Status Full-Time Part-Time Homemaker All Children All children Iron 142.8%*** 156.6% 156.4% 149.2% Zinc 164.1 170.3 168.0 166.5 Maximum sample size 4,337 2,069 3,284 9,690
By age group 7 to 11 months
Iron 155.5% 167.9% 148.4% 146.0% Zinc 227.9 218.5 222.8 223.9 Maximum sample size 205 127 204 536
1 to 2 years Iron 151.7% 149.2% 151.2% 151.0% Zinc 242.6 229.8** 244.1 240.8 Maximum sample size 716 355 803 1,874
3 to 4 years Iron 146.7% 157.4% 151.8% 150.8% Zinc 224.1 233.5 225.5 226.6 Maximum sample size 1,442 712 1,145 3,299
5 to 8 years Iron 131.6%*** 139.9% 141.8% 136.7% Zinc 188.1 195.0 196.7 192.4 Maximum sample size 836 393 631 1,860
9 to 12 years Iron 166.2%** 181.7% 190.4% 176.5% Zinc 181.9* 192.0 197.5 188.6 Maximum sample size 428 206 238 872
13 to 17 years, male Iron 179.6% 193.5% 169.3% 180.1% Zinc 166.3 167.2 141.9 160.9 Maximum sample size 232 86 99 417
23 Ideally, the usual intake distribution for these nutrients would be compared with EARs to determine the proportion of
individuals with adequate or inadequate intakes. As noted previously, this analysis was beyond the scope of the project. The EARs are designed to meet the average nutrient requirements of half the individuals in a particular life stage (age-gender) group. In contrast, RDAs are set much higher. Even after adjusting for interindividual variability, the proportion of children with iron and zinc intakes above the EAR would likely be substantial.
Abt Associates Inc. Chapter 2: Children's Nutrition Outcomes 35
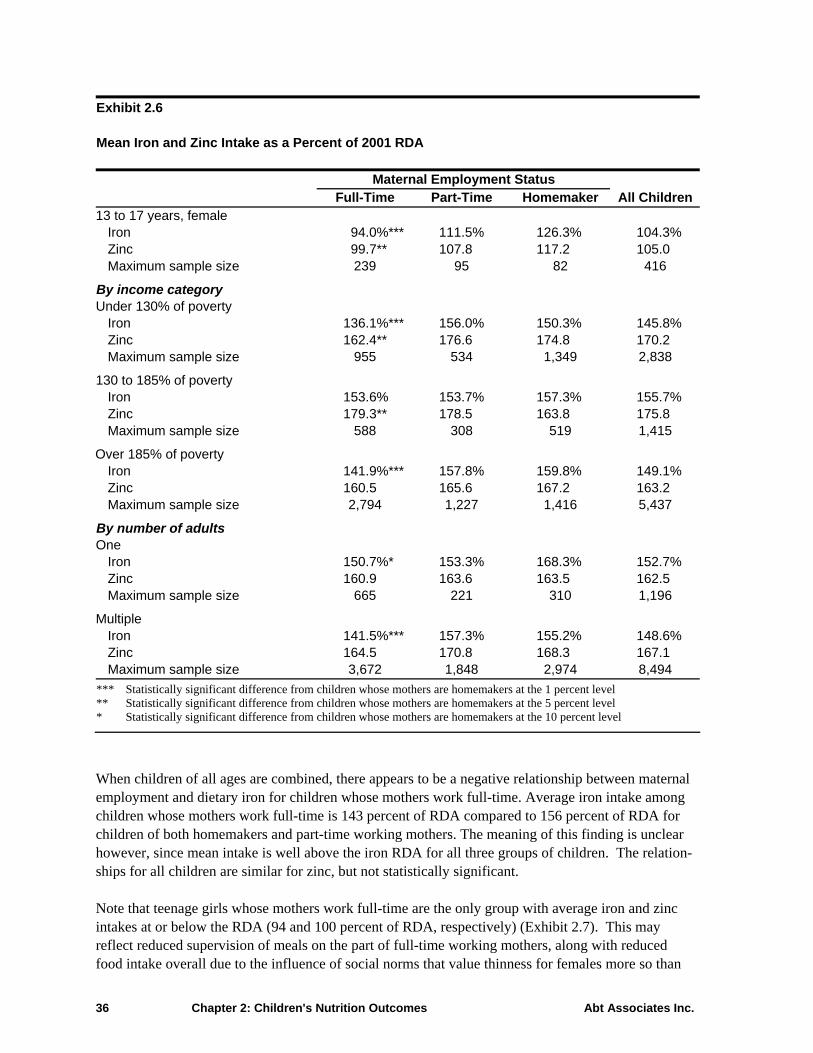
Exhibit 2.6 Mean Iron and Zinc Intake as a Percent of 2001 RDA Maternal Employment Status Full-Time Part-Time Homemaker All Children 13 to 17 years, female
Iron 94.0%*** 111.5% 126.3% 104.3% Zinc 99.7** 107.8 117.2 105.0 Maximum sample size 239 95 82 416
By income category Under 130% of poverty
Iron 136.1%*** 156.0% 150.3% 145.8% Zinc 162.4** 176.6 174.8 170.2 Maximum sample size 955 534 1,349 2,838
130 to 185% of poverty Iron 153.6% 153.7% 157.3% 155.7% Zinc 179.3** 178.5 163.8 175.8 Maximum sample size 588 308 519 1,415
Over 185% of poverty Iron 141.9%*** 157.8% 159.8% 149.1% Zinc 160.5 165.6 167.2 163.2 Maximum sample size 2,794 1,227 1,416 5,437
By number of adults One
Iron 150.7%* 153.3% 168.3% 152.7% Zinc 160.9 163.6 163.5 162.5 Maximum sample size 665 221 310 1,196
Multiple Iron 141.5%*** 157.3% 155.2% 148.6% Zinc 164.5 170.8 168.3 167.1 Maximum sample size 3,672 1,848 2,974 8,494
*** Statistically significant difference from children whose mothers are homemakers at the 1 percent level ** Statistically significant difference from children whose mothers are homemakers at the 5 percent level * Statistically significant difference from children whose mothers are homemakers at the 10 percent level
When children of all ages are combined, there appears to be a negative relationship between maternal employment and dietary iron for children whose mothers work full-time. Average iron intake among children whose mothers work full-time is 143 percent of RDA compared to 156 percent of RDA for children of both homemakers and part-time working mothers. The meaning of this finding is unclear however, since mean intake is well above the iron RDA for all three groups of children. The relation-ships for all children are similar for zinc, but not statistically significant. Note that teenage girls whose mothers work full-time are the only group with average iron and zinc intakes at or below the RDA (94 and 100 percent of RDA, respectively) (Exhibit 2.7). This may reflect reduced supervision of meals on the part of full-time working mothers, along with reduced food intake overall due to the influence of social norms that value thinness for females more so than
36 Chapter 2: Children's Nutrition Outcomes Abt Associates Inc.

for males. In addition, the increased reliance on eating away from home (Vol II, Chap. 1) may contribute to lower iron intake for this group since the iron density of foods away from home is lower than for foods obtained at home (Lin et al., 1999). Exhibit 2.7 Mean Iron and Zinc Intake, Overall and Among Teenage Girls, by Maternal Employment Status
0
25
50
75
100
125
150
175
200
Iron Zinc Iron Zinc
Perc
ent o
f RD
A
Full-timePart-timeHomemaker
All Children Females Age 13 to 17
The relationship between maternal full-time employment and children’s intake of iron and zinc is similar to findings overall across income groups and regardless of the number of adults in the house-hold. Dietary Fiber
Exhibit 2.8 shows that children’s mean intake of dietary fiber almost meets the age-plus-5 grams per day recommendation (97 percent overall).24 Average dietary fiber intake varies substantially, however, by age group. The pattern of reduced fiber intake with increasing age is similar to that for total food energy, although it varies disproportionately relative to recommended amounts. Among preschool children (age 2 to 4 years), average fiber intake greatly exceeds recommended levels (129 percent), but it falls short of recommendations for children age 9 to 17 (63 percent for teenage girls). 24 New Dietary Reference Intake (DRI) values have been released for total fiber, which is defined as dietary fiber plus
functional fiber. (Functional fiber consists of isolated or extracted nondigestible carbohydrates that have beneficial physiological effects, e.g., pectins and gums.) The AI values for children 2 to 17 years of age range from 19 to 38 grams total fiber per day (IOM/FNB, 2002). These values are substantially higher than previous fiber recommenda-tions for children. The new reference values could not be applied to this analysis because total fiber was not assessed in the CSFII. Because functional fibers contribute a minor amount to the total fiber content of foods, however, the relationships between maternal employment and dietary fiber intake would not be expected to be altered.
Abt Associates Inc. Chapter 2: Children's Nutrition Outcomes 37

There is little difference in children’s dietary fiber intake across household composition and income subgroups. Exhibit 2.8 Mean Dietary Fiber Intake as a Percent of Recommended Levelsa
Maternal Employment Status Full-Time Part-Time Homemaker All Children All children Dietary fiber 94.9%*** 97.9% 100.9% 97.2% Maximum sample size 3,559 1,675 2,592 7,826
By age group 2 to 4 years
Dietary fiber 130.3% 129.3% 127.9% 129.2% Maximum sample size 1,824 895 1,542 4,261
5 to 8 years Dietary fiber 102.9%*** 106.3% 110.4% 106.1% Maximum sample size 836 393 631 1,860
9 to 12 years Dietary fiber 85.4%*** 88.9%* 97.4% 89.5% Maximum sample size 428 206 238 872
13 to 17 years, male Dietary fiber 86.1% 86.1% 85.3% 85.9% Maximum sample size 232 86 99 417
13 to 17 years, female **
come category U poverty
102.2% 100.6% m sample size 822 431 1,051 2,304
13 poverty * *** 1
MaOver
96.5% 4,414
ne
level * Statistically significant difference from children whose mothers are homemakers at the 5 percent level
* Statistically significant difference from children whose mothers are homemakers at the 10 percent level
Dietary fiber
Maximum sample size 58.1%239
68.1%95
69.8% 82
62.6%416
By in nder 130% of Dietary fiber 96.3%* 99.1%Maximu0 to 185% of Dietary fiber 96.7% 88.6% 02.2% 96.9%
ximum sample size 470 242 396 1,108 185% of poverty
Dietary fiber 93.7%*** 98.8% 101.5% Maximum sample size 2,267 1,002 1,145
By number of adults O
Dietary fiber 93.9% 95.2% 92.8% 93.5% Maximum sample size 571 184 244 999
Multiple Dietary fiber 95.1%*** 98.3% 101.8% 97.8%Maximum sample size 2,988 1,491 2,348 6,827
a Based on American Health Foundation recommendations for adequate dietary fiber intake in children of “age plus 5” grams per day (Williams, 1995).
*** Statistically significant difference from children whose mothers are homemakers at the 1 percent *
38 Chapter 2: Children's Nutrition Outcomes Abt Associates Inc.

Maternal full-time employment is associated with significantly lower dietary fiber intake overall (95 versus 101 percent of recommended level). Dietary fiber intake is slightly lower for children of part-time working mothers, but not significantly so. These relationships are fairly consistent across the ge and income groups examined. The most important differences in dietary fiber intake are seen mong children age 9 to 12 and teenage girls. Children of full-time working mothers in these groups onsume significantly less fiber than children of homemakers (Exhibit 2.9), and dietary fiber intakes re considerably lower than recommended levels (85 and 58 percent, respectively).
lthough mothers’ employment status seems to make no difference for teenage boys, they also have wer than recommended intakes of dietary fiber (86 percent overall). These findings suggest a role r education on food sources rich in dietary fiber directed at school-age children as well as working others.
Exhibit 2.9 Dietary Fiber Intake, by Age Group and Maternal Employment Status
aaca Alofom
40
80
100
120
140
ecom
men
ded
Leve
l
Full-timePart-time
0
20
All Children Age 2 to 4 Age 5 to 8 Age 9 to 12 Males Age 13to 17
Females Age13 to 17
Per
60
cent
of R
Homemaker
Abt Associates Inc. Chapter 2: Children's Nutrition Outcomes 39

Consumption of Soft Drinks, Added Sugar, and Fried Potatoes
Children’s consumption of soda and fruit-flavored drinks is high, especially older children’s. Thbeverages are typically low in essential nutrients and are felt to contribute to the large proportion of food energy that children obtain from added sugar (
ese
Gleason and Suitor, 2001).25 Furthermore, these spects of children’s diet quality may be affected by maternal employment. Reduced maternal
,
their children’s food intake, their children may not be any more apt to consume rge quantities of these foods than other children.
ense ve ta e intake of French fries may be associated with fast food, it was useful to compare children’s in potatoes and vegetables other than potatoes by maternal employ n
or
bout one fifth of all children consume more than one serving of soda per day, on average (Exhibit 2.10). This varies to a large extent by age, ranging from less than 10 percent of preschoolers to the high of 70 percent of teenage boys consuming this much soda per day. The frequency of consump-tion of other soft drinks (primarily fruit drinks) is similar (23 percent), but does not vary as widely with age as soda consumption (Exhibit 2.11). There is little difference in soda and other soft drink consumption by income or number of adults in the child’s household.
asupervision might lead to greater consumption of high sugar foods and beverages, as could increasedreliance on fast food. On the other hand, USDA’s child care (CACFP) and school meal programs (SBP/NSLP) typically provide milk and 100 percent fruit juice rather than soda, fruit-flavored drinksor other sweetened beverages. To the extent that working mothers rely on these programs for a substantial portion ofla A question has also been raised as to whether the HEI score for the Food Guide Pyramid vegetable
roup may reflect a high intake of fried potatoes rather than a variety of lower fat, more nutrient-gd ge bles. Becaus
take of both fried me t status.
Soda and Other Soft Drinks
Three categories were used to examine children’s average daily intake of soda and other soft drinks:26
• None • Up to 8 fluid ounces • More than 8 fluid ounces
The serving size cut-point of 8 fluid ounces was selected to differentiate between moderate and highintakes of these beverages. It was based on the Food and Drug Administration (FDA) serving size fnutrition labeling (the amount customarily consumed by people age 4 and above) of soda and fruit drinks, and has been used in other studies. A
25 Added sugars include sugar and sweeteners eaten separately or used as ingredients in processed or prepared foods.
They do not include naturally occurring sugars such as the lactose in milk or the fructose in fruit (USDA, 1992). 26 Includes regular and diet soda, sweetened carbonated water, and sugar- and artificially sweetened fruit drinks (not 100
percent fruit juice) and iced tea.
40 Chapter 2: Children's Nutrition Outcomes Abt Associates Inc.

Exhibit 2.10 Daily Soda Consumption Maternal Employment Status Full-Time Part-Time Homemaker All Children All children None 41.2%** 45.9% 46.1% 43.9% Up to 8 ounces 36.3 34.8 34.9 35.4 More than 8 ounces 22.5** 19.3 19.0 20.7 Maximum sample size 3,559 1,675 2,592 7,826
By age group 2 to 4 years
None 47.4%** 54.7% 54.2% 51.5% Up to 8 ounces 41.0 38.4 36.5 38.8 More than 8 ounces 11.6 6.9* 9.3 9.7 Maximum sample size 1,824 895 1,542 4,261
5 to 8 years None 39.9% 48.1% 42.7% 42.7% Up to 8 ounces 38.9 36.8 40.5 39.0 More than 8 ounces 21.2* 15.1 16.8 18.3 Maximum sample size 836 393 631 1,860
9 to 12 years None 36.0% 28.4%* 36.0% 34.1% Up to 8 ounces 23.9 30.8 30.1 27.2 More than 8 ounces 40.2 40.8 33.8 38.7 Maximum sample size 428 206 238 827
13 to 17 years, male None 17.7% 8.9%*** 23.8% 16.9% Up to 8 ounces 12.8 17.5 9.9 13.3 More than 8 ounces 69.5 73.6 66.3 69.8 Maximum sample size 232 86 99 417
13 to 17 years, female None 18.7% 21.1% 24.2% 20.4% Up to 8 ounces 26.3 15.1* 28.3 24.1 More than 8 ounces 55.0 63.8 47.4 55.5 Maximum sample size 239 95 82 416
By income category Under 130% of poverty
None 43.8% 45.4% 47.7% 45.8% Up to 8 ounces 34.7 40.8 35.5 36.3 More than 8 ounces 21.5** 13.7 16.8 17.9 Maximum sample size 822 431 1,051 2,304
130 to 185% of poverty None 40.6% 43.0% 42.4% 41.7% Up to 8 ounces 38.9 36.3 34.0 37.0 More than 8 ounces 20.5 20.7 23.6 21.3 Maximum sample size 470 242 396 1,108
Abt Associates Inc. Chapter 2: Children's Nutrition Outcomes 41

Exhibit 2.10 Daily Soda Consumption Maternal Employment Status Full-Time Part-Time Homemaker All Children Over 185% of poverty
None 40.3%** 46.4% 46.2% 43.4% Up to 8 ounces 36.0 31.8 34.8 34.5 More than 8 ounces 23.7** 21.8 19.0 22.1 Maximum sample size 2,267 1,002 1,145 4,414
By number of adults One
None 39.5%*** 41.6%** 58.4% 44.5% Up to 8 ounces 34.2* 40.0** 25.8 33.0 More than 8 ounces 26.3*** 18.4 15.8 22.4 Maximum sample size 571 184 244 999
Multiple None 41.5% 46.4% 44.9% 43.8% Up to 8 ounces 36.7 34.1 35.8 35.7 More than 8 ounces 21.8 19.5 19.3 20.5 Maximum sample size 2,988 1,491 2,348 6,827
*** Statistically significant difference from children whose mothers are homemakers at the 1 percent level ** Statistically significant difference from children whose mothers are homemakers at the 5 percent level * Statistically significant difference from children whose mothers are homemakers at the 10 percent level
With respect to maternal employment, there is a small but significant increase in the proportion of children consuming more than one serving of soda per day if the mother is working full-time versus not at all (22 versus 19 percent). There are also fewer children of full-time working mothers compared with homemakers who do not consume soda at all (41 versus 46 percent). Children with part-time working mothers resemble those with mothers who are homemakers with regard to soda consumption. Similar trends are evident among some but not all age and income groups. The strongest relationship between maternal employment and soda consumption is seen among children in single adult house-holds. Exhibit 2.12 illustrates that more children of single, working mothers consume both moderate (up to 8 ounces) and higher amounts (more than 8 ounces) of soda than children of single, non-working mothers. In addition, children with single homemaker mothers are significantly more likely not to consume soda at all than children whose mothers work either part-time or full-time (58 versus 40 to 42 percent).
42 Chapter 2: Children's Nutrition Outcomes Abt Associates Inc.

Exhibit 2.11 Daily Consumption of Soft Drinks Other Than Sodaa
Maternal Employment Status Full-Time Part-Time Homemaker All Children All children None 39.4% 44.0% 41.0% 41.0% Up to 8 ounces 37.3 33.9 35.5 35.9 More than 8 ounces 23.3 22.0 23.4 23.1 Maximum sample size 3,559 1,675 2,592 7,826
By age group 2 to 4 years
None 38.0% 49.7%** 42.3% 42.1% Up to 8 ounces 40.7 33.0* 37.3 37.8 More than 8 ounces 21.3 17.3 20.4 20.1 Maximum sample size 1,824 895 1,542 4,261
5 to 8 years None 38.9% 38.4% 37.4% 38.2% Up to 8 ounces 36.6 40.3 36.2 37.2 More than 8 ounces 24.5 21.3 26.4 24.5 Maximum sample size 836 393 631 1,860
9 to 12 years None 42.0% 32.1% 40.6% 39.2% Up to 8 ounces 34.9 33.3 35.3 34.6 More than 8 ounces 23.0 34.7** 24.1 26.2 Maximum sample size 428 206 238 827
13 to 17 years, male None 48.3% 48.9% 47.1% 48.2% Up to 8 ounces 25.0 13.4 19.0 21.1 More than 8 ounces 26.8 37.7 33.9 30.7 Maximum sample size 232 86 99 417
13 to 17 years, female None 40.5% 32.9% 39.3% 38.5% Up to 8 ounces 24.0 36.5 32.4 28.6 More than 8 ounces 35.5 30.6 28.3 32.9 Maximum sample size 239 95 82 416
By income category Under 130% of poverty
None 29.6%*** 41.7% 42.9% 37.9% Up to 8 ounces 41.8** 34.6 33.7 36.7 More than 8 ounces 28.6* 23.6 23.3 25.4 Maximum sample size 822 431 1,051 2,304
130 to 185% of poverty None 38.3% 37.5% 41.7% 39.2% Up to 8 ounces 32.3 36.6 38.0 35.1 More than 8 ounces 29.5** 25.9 20.3 25.6 Maximum sample size 470 242 396 1,108
Abt Associates Inc. Chapter 2: Children's Nutrition Outcomes 43

Exhibit 2.11 Daily Consumption of Soft Drinks Other Than Sodaa
Maternal Employment Status Full-Time Part-Time Homemaker All Children Over 185% of poverty
None 43.4% 46.5%** 39.1% 43.1% Up to 8 ounces 36.6 33.2 36.6 35.7 More than 8 ounces 20.1* 20.3 24.3 21.2 Maximum sample size 2,267 1,002 1,145 4,414
By Number of Adults One
None 32.9% 48.6%*** 30.0% 36.2% Up to 8 ounces 39.7 32.2 39.8 38.0 More than 8 ounces 27.4 19.2** 30.2 25.8 Maximum sample size 571 184 244 999
Multiple None 40.7% 43.5% 42.1% 41.7% Up to 8 ounces 36.9 34.1 35.1 35.6 More than 8 ounces 22.5 22.5 22.9 22.7 Maximum sample size 2,988 1,491 2,348 6,827
a Includes fruit drinks (not juice), iced tea, lemonade.
*** Statistically significant difference from children whose mothers are homemakers at the 1 percent level ** Statistically significant difference from children whose mothers are homemakers at the 5 percent level * Statistically significant difference from children whose mothers are homemakers at the 10 percent level
The analysis of children’s consumption of other soft drinks provides little evidence of a relationship with maternal employment. The only consistent and statistically significant finding is a tendency for low-income (at or below 185 percent of poverty) children of full-time working mothers to consume more soft drinks (other than soda) than children of nonworking mothers (Exhibit 2.11).
44 Chapter 2: Children's Nutrition Outcomes Abt Associates Inc.

Exhibit 2.12 Soda Consumption Among Children in Single-Adult Households, by Maternal Employment Status
0%
100%
120%
20%
40%
60%
80%
Perc
ent o
f Chi
ldre
n
More than 8 oz8 oz or lessNone
Full-time Part-time Homemaker
Added Sugar
The CSFII Pyramid servings data include information on added sugar intake. Most of the added ugars in the typical American diet come from foods in the Pyramid tip—soft drinks, candy, jams s, llies, syrups, and table sugar added to foods like coffee or cereal. Added sugars in the food groups me from foods such as ice cream, sweetened yogurt, chocolate milk, canned or frozen fruit with
heavy syrup, and sweetened bakery products like cakes and cookies. Quantities of added sugar are expressed in terms of teaspoons. For reference, USDA’s Food Guide Pyramid provides recommended maximum amounts of added sugars at three different levels of total food energy intake. They range from 6 teaspoons a day for a diet of 1,600 calories to 18 teaspoons a day for intakes of 2,800 calories per day. Results here are presented separately for total added sugars and added sugars from all soft drinks combined. Children’s mean intake of total added sugars is 23 teaspoons, which exceeds the recommended maximum of 18 teaspoons for individuals with the highest calorie requirements (Exhibit 2.13).27 Almost half of children’s sugar consumption comes from soda and other soft drinks (10 teaspoons). Added sugar consumption from all sources generally increases as children get older, although intakes are quite different between teenage boys and girls (35 and 24 teaspoons, respectively). This may reflect the lower average food energy intakes of teenage girls. Added sugar intake also seems to increase with household income, although not the contribution from soda and other soft drinks.
jeco
27 Since the analysis was completed, the DRI Committee made a recommendation that added sugars not provide more
than 25 percent of total energy intake (IOM/FNB, 2002). For a 1,600-calorie diet this would amount to no more than 400 calories, or about 25 teaspoons of added sugar per day—considerably more than the USDA recommendation.
Abt Associates Inc. Chapter 2: Children's Nutrition Outcomes 45

Exhibit 2.13 Mean Added Sugar Intake (teaspoons per day) Maternal Employment Status Full-Time Part-Time Homemaker All Children All children Added sugar from all sources 23.1 23.1 22.4 22.9 Added sugar from soda and other soft drinks
10.4 9.6 9.8 10.1
Maximum sample size 3,559 1,675 2,592 7,826
By age group 2 to 4 years
Added sugar from all sources 15.1** 14.1 14.0 14.5 Added sugar from soda and other soft drinks
5.5** 4.4 4.9 5.1
Maximum sample size 1,824 895 1,542 4,261
5 to 8 years Added sugar from all sources 20.3** 19.4 18.8 19.6 Added sugar from soda and other soft drinks
7.4** 6.1 6.4 6.8
Maximum sample size 836 393 631 1,860
9 to 12 years Added sugar from all sources 24.3 26.5 25.1 25.1 Added sugar from soda and other soft drinks
9.8 11.0 9.8 10.1
Maximum sample size 428 206 238 827
13 to 17 years, male Added sugar from all sources 35.5 34.3 34.6 35.1 Added sugar from soda and other soft drinks
20.2 17.5 19.7 19.5
Maximum sample size 232 86 99 417
13 to 17 years, female Added sugar from all sources 24.2 24.4 22.6 23.9 Added sugar from soda and other soft drinks
13.1 12.1 11.8 12.6
Maximum sample size 239 95 82 416
By income category Under 130% of poverty
Added sugar from all sources 21.0 20.3 19.7 20.3 Added sugar from soda and other soft drinks
10.0 9.1 9.6 9.6
Maximum sample size 822 431 1,051 2,304
46 Chapter 2: Children's Nutrition Outcomes Abt Associates Inc.

Exhibit 2.13 Mean Added Sugar Intake (teaspoons per day) Maternal Employment Status Full-Time Part-Time Homemaker All Children 130 to 185% of poverty
Added sugar from all sources 22.0 23.7 23.3 22.7 Added sugar from soda and other soft drinks
9.9 10.3 10.3 10.1
Maximum sample size 470 242 396 1,108
Over 185% of poverty Added sugar from all sources 24.0 24.0 23.6 23.9 Added sugar from soda and other soft drinks
10.6* 9.6 9.5 10.2
Maximum sample size 2,267 1,002 1,145 4,414
By number of adults One
Added sugar from all sources 23.0** 22.1 20.8 22.3 Added sugar from soda and other soft drinks
10.3 10.1 9.7 10.0
Maximum sample size 571 184 244 999
Multiple Added sugar from all sources 23.1 23.4 22.5 23.0 Added sugar from soda and other soft drinks
10.4 9.6 9.8 10.1
Maximum sample size 2,988 1,491 2,348 6,827 *** Statistically significant difference from children whose mothers are homemakers at the 1 percent level ** Statistically significant difference from children whose mothers are homemakers at the 5 percent level * Statistically significant difference from children whose mothers are homemakers at the 10 percent level
There are no discernable differences overall in children’s intake of added sugars by maternal employ-ment status. The data do suggest a somewhat higher intake of added sugars among two groups of children whose mothers work full-time compared with their homemaker mother counterparts: younger children (2 to 8 years old) and children in single-adult households. Differences are signifi-cant and of the magnitude of 1 to 2 teaspoons of added sugar per day. Fried Potatoes
As noted above, the number of servings of vegetables a child consumes may include a significant share of fried potatoes, which are typically high in fat content. Pyramid servings data and USDA food codes that identify fried potatoes (French fries, home fries, tater tots, and hash browns) were used to separately examine children’s intake of fried potatoes and vegetables, excluding fried potatoes. Vegetable servings are defined in the Pyramid database as 1 cup of raw leafy vegetables; ½ cup of other vegetables, cooked (includes fried potatoes) or chopped raw; or ¾ cup of vegetable juice. Serving sizes for very young children, 2 to 3 years old are two-thirds the size (USDA/ARS, 2000; USDA/CNPP, 1999). The recommended number of vegetable group servings ranges from 3 to 5, depending on total food energy intake (Bowman et al., 1998; USDA, 1992). Abt Associates Inc. Chapter 2: Children's Nutrition Outcomes 47

Children’s consumption of all vegetables is 2.6 servings per day overall (Exhibit 2.14). This amount falls short of even the lower bound of the recommended number of servings to consume in a day. (Low levels of vegetable consumption are also reflected in the HEI vegetable score of 5.4 discussed earlier in this chapter.) Fried potatoes contribute a little more than one fourth of the daily servings of total vegetables for all children combined (0.7 servings). Teenage boys have the highest intake of fried potatoes at 1.0 serving per day, on average. Neither fried potato nor other vegetable consump-tion vary with household income or the number of adults. Maternal employment is associated with a slightly, but statistically higher intake of fried potatoes among children whose mothers work full-time compared with children of homemakers (0.7 versus 0.6 servings). Results are generally consistent across income groups and regardless of the number of adults in the household. Whereas the youngest children’s (2 to 4 years old) diets follow this pattern for fried potatoes, however, they also consume more non-fried potato vegetables if their mothers work full-time. The importance of these findings is unclear, however, as the differences only amount to one or two tenths of a vegetable serving. Exhibit 2.14 Consumption of Fried Potatoes and Other Vegetables (servings per day) a
Maternal Employment Status Full-Time Part-Time Homemaker All Children All children Fried potatoes 0.7*** 0.7 0.6 0.7 Vegetables other than fried potatoes 1.9 1.9 2.0 1.9 Maximum sample size 3,559 1,675 2,592 7,826
By age group 2 to 4 years
Fried potatoes 0.6*** 0.5 0.5 0.5 Vegetables other than fried potatoes 1.8*** 1.6 1.7 1.7 Maximum sample size 1,824 895 1,542 4,261
5 to 8 years Fried potatoes 0.6*** 0.4 0.4 0.5 Vegetables other than fried potatoes 1.6 1.6 1.6 1.6 Maximum sample size 836 393 631 1,860
9 to 12 years Fried potatoes 0.7 0.6 0.6 0.7 Vegetables other than fried potatoes 1.9 1.9 2.0 1.9 Maximum sample size 428 206 238 827
13 to 17 years, male Fried potatoes 1.1 1.2 0.8 1.0 Vegetables other than fried potatoes 2.8 2.3 2.8 2.7 Maximum sample size 232 86 99 417
13 to 17 years, female Fried potatoes 0.7 0.8 0.7 0.7 Vegetables other than fried potatoes 2.0 2.1 2.3 2.1 Maximum sample size 239 95 82 416
48 Chapter 2: Children's Nutrition Outcomes Abt Associates Inc.

Exhibit 2.14 Consumption of Fried Potatoes and Other Vegetables (servings per day) a
Maternal Employment Status Full-Time Part-Time Homemaker All Children By income category Under 130% of poverty
Fried potatoes 0.8** 0.7 0.6 0.7 Vegetables other than fried potatoes 2.0 2.1 2.1 2.0 Maximum sample size 822 431 1,051 2,304
130 to 185% of poverty Fried potatoes 0.6 0.7* 0.5 0.6 Vegetables other than fried potatoes 2.1 1.7* 1.9 2.0 Maximum sample size 470 242 396 1,108
Over 185% of poverty Fried potatoes 0.7** 0.6 0.6 0.7 Vegetables other than fried potatoes 1.9 1.8 1.9 1.9 Maximum sample size 2,267 1,002 1,145 4,414
By number of adults One
Fried potatoes 0.7** 0.7** 0.5 0.7 Vegetables other than fried potatoes 2.2 2.1 1.9 2.1 Maximum sample size 571 184 244 999
Multiple Fried potatoes 0.7** 0.6 0.6 0.6 Vegetables other than fried potatoes 1.9 1.8** 2.0 1.9 Maximum sample size 2,988 1,491 2,348 6,827
a A serving of vegetables is defined in the Food Guide Pyramid as 1 cup of raw leafy vegetables; ½ cup of other vegetables, cooked or chopped raw; or ¾ cup of vegetable juice.
*** Statistically significant difference from children whose mothers are homemakers at the 1 percent level ** Statistically significant difference from children whose mothers are homemakers at the 5 percent level * Statistically significant difference from children whose mothers are homemakers at the 10 percent level
Summary
The analysis reported here provides evidence of a net negative association of mother’s employment on children’s nutrition. The findings are especially notable among children whose mothers work full-time compared to children with homemaker mothers. Poorer diet quality overall, measured by the HEI, was determined to be the net outcome of strong negative results for 5- to 8-year-olds (fewer daily servings of grains and fruit, and less variety overall) and weaker positive results for preschoolers (more vegetables and less saturated fat). Although preschool children of full-time working mothers have higher HEI scores than children of homemakers, they consume significantly more food energy, perhaps putting them at higher risk for overweight. Other nutrition outcomes for which significantly poorer outcomes for children of working mothers were found include lower mean iron and dietary fiber intake among 5- to 12-year-olds, lower iron Abt Associates Inc. Chapter 2: Children's Nutrition Outcomes 49
intake for teenage girls, greater soda consumption, and greater consumption of fried potatoes. Of particular concern is the association between maternal employment and lower iron intake among teenage girls. This group has the highest requirements and the lowest relative mean intake of iron (94 percent of RDA); teenage girls are also at greater risk for underconsumption of food energy and dietary fiber, with more than half consuming less than 90 percent of the 1989 REA and less than 60 percent meeting daily recommendations for fiber. These differences do not necessarily indicate causation. They could perhaps be accounted for by other differences among the groups that are correlated with maternal employment status. This possibility is explored in the next chapter. Nonetheless, they are of interest in their own right, as they identify areas of potential concern for policymakers in a well-defined population.
50 Chapter 2: Children's Nutrition Outcomes Abt Associates Inc.

Chapter 3 Multivariate Analyses of Mother’s Work and Children’s Nutrition Outcomes
In Chapter 2, it was shown that children whose mothers work full-time tend to have less positive nutrition outcomes than children of nonworking mothers. Areas in which significant differences were seen included overall diet quality (Healthy Eating Index score); food energy intake for infants and preschool children; mean intake of iron, zinc, and dietary fiber among teenage girls; dietary fiber intake for school-age children; and consumption of soda. It is plausible that these differences could be caused by maternal employment, because working mothers have less time to supervise their children’s diets. These differences, however, could also be attributable in part to other characteristics that are correlated with maternal employment. Conversely, if other household circumstances are more favorable for children of working mothers, the bivariate differences could be underestimates of the effects of maternal employment. In fact, as shown below, children of working mothers are relatively advantaged in some important ways: their households have more income, and the mothers have more education and are more knowledgeable about nutrition. On the other hand, resources available excluding the mother’s earnings are greater among households with homemaker mothers than among those with full-time working mothers (but higher still among households with part-time working mothers). In a sense, the full-time working mothers “have to” work. Other factors could cause nutrition outcome differences in either direction: race and ethnicity (full-time working mothers are more likely to be black, and nonworking mothers are more likely to be Hispanic), mother’s age (working mothers tend to be older), region and urbanicity, and household size. In this chapter, after documenting the other differences in household circumstances, estimates are presented of differences in selected children’s nutrition outcomes controlling for these factors. The qualitative findings for this set of outcomes remain unchanged. Virtually all differences that were previously found to be statistically significant remain so after regression adjustment. A few additional differences for particular age groups attain statistical significance. This supports the hypothesis that full-time maternal employment causes the observed differences in child nutrition outcomes. Child, Household, and Maternal Characteristics
Marked demographic and socioeconomic differences can be seen between children of working and nonworking mothers, and, to a lesser extent, between the children of mothers who work full-time versus part-time. Children of homemaker mothers are more likely to be preschoolers, Hispanic, poor, and from large households than children of working mothers; and homemaker mothers themselves are younger and less well educated than working mothers. Children of part-time working mothers are disproportionately non-Hispanic white, and their mothers tend to be better educated than full-time
Abt Associates Inc. Chapter 3: Multivariate Analyses…Children's Nutrition Outcomes 51

working mothers. In addition, working mothers, both full- and part-time, are more knowledgeable about nutrition than homemakers, although nutrition attitudes are similar across the three groups. Characteristics of Sample Children
The CSFII sample children range in age from infancy to 17 years. Younger children are naturally concentrated among nonworking mothers, reflecting considerations of child development and need for child care. Nearly two fifths of children of nonworking mothers are under age five, versus only a quarter of children of working mothers (Exhibit 3.1). (Note that all analyses presented in this report are age-adjusted.) Exhibit 3.1 Age of Children, by Maternal Employment Status
0%
20%
40%
60%
80%
100%
Full-time Part-time Homemaker
Perc
ent o
f Chi
ldre
n
13 to 17 years9 to 12 years5 to 8 years0 to 4 years
Racial/ethnic background also varies markedly across the three groups. Three quarters of children whose mothers work part-time are white, in contrast to fewer than two thirds in the other two groups (Exhibit 3.2). Hispanic children are heavily concentrated among nonworking mothers, whereas black children are especially likely to have full-time working mothers.
52 Chapter 3: Multivariate Analyses…Children's Nutrition Outcomes Abt Associates Inc.

Exhibit 3.2 Race/Ethnicity of Children, by Maternal Employment Status
0%
20%
40%
60%
100%
80%
Full-time Part-time Homemaker
Perc
ent o
f Chi
ldre
n
OtherHispanicBlackWhite
Characteristics of Households
Households with homemaker mothers are somewhat larger on average than households with full-time or part-time working mothers. Although the number of adults is the same on average (2.1), house-holds with homemaker mothers tend to include more children (2.2 versus 1.8 to 2.0). They are also substantially poorer (Exhibit 3.3) and more likely to be receiving public assistance (14 percent versus 2 to 4 percent). Barely half of households with homemaker mothers have incomes over 185 percent of the federal poverty level, compared with two thirds to three quarters of households with mothers who work part-time and full-time (52 percent versus 67 and 73 percent).
Abt Associates Inc. Chapter 3: Multivariate Analyses…Children's Nutrition Outcomes 53

Exhibit 3.3 Household Income as Percent of Poverty, by Maternal Employment Status
0%
20%
40%
60%
80%
100%
Full-time Part-time Homemaker
Perc
ent o
f Chi
ldre
n
Over 185%130-185%Under 130%
This analysis of relative household income may be seriously misleading, however, with regard to the resources and choices available to mothers. The higher income of households with full-time working mothers is in fact explained by those mothers’ very decision to work. To understand the relative well-being of these groups of households, we need to consider how well off they would be based on other household income if none of the mothers chose to work. Although it is not possible to deter-mine this exactly based on available data, an approximate answer can be obtained by examining the occupations and hours worked by other adults in these households. It may reasonably be assumed that a mother’s decision to work is generally an effect rather than a cause of the employment and earnings of other household members (e.g., her husband). It appears that mothers who work part-time are initially better off than homemaker mothers, and that mother who work full-time are initially worse off. The mean number of full-time equivalent workers other than the mother herself is 0.90 for homemaker mothers, versus 0.93 for part-time working mothers and 0.87 for full-time working mothers. Furthermore, part-time working mothers are more likely to have an earner in the household who is professional/technical or managerial, whereas full-time working mothers are more likely to have an earner who is a clerical, sales, or service worker (Exhibit 3.4).
54 Chapter 3: Multivariate Analyses…Children's Nutrition Outcomes Abt Associates Inc.

Abt Associates Inc. Chapter 3: Multivariate Ana
Exhibit 3.4 FTE Earners in Mothers’ Households, by Occupation and Maternal Employment Status
0
0.05
0.1
0.15
0.2
0.25
0.3
Prof/tech Manager Farmer al/ Craftsman Operative Service
Num
ber o
f FTE
Ear
ners
Full-time Part-tim
FTE = Full Time Equivalent
This information can be used to construct a crude indnumbers of full-time equivalent workers in each occuaverage weekly earnings of men and women in those value of this index is $587 for homemakers, versus $5mothers—i.e., 7 percent higher for part-time workinglower for full-time working mothers than for homemaadults in mothers’ households thus strengthens the paand number of other earners. Demographic Characteristics of Mothers
A quarter of homemaker mothers are under age 30, comothers (25 percent versus 19 percent). Homemaker full-time, and especially part-time, working mothers (
Clericsales
lyses…Children's Nutrition Outcomes 55
e Homemaker
ex of “other earnings” in households. The pation, male and female, are multiplied by the occupations in 1996, based on the CPS. The 58 for full-time and $626 for part-time working
mothers than for homemakers, and 5 percent kers. The occupational distribution of other ttern seen with regard simply to the presence
mpared with less than a fifth of working mothers have substantially less education than Exhibit 3.5).

Exhibit 3.5 Mothers’ Education, by Employment Status
0%
20%
40%
60%
80%
100%
Full-time Part-time Homemaker
Perc
ent o
f Chi
ldre
n
>HS/GEDHS/GED< HS/GED
Maternal Nutrition Knowledge and Attitudes
The extent to which working mothers differ from nonworking mothers in their nutrition knowledge, and awareness of and attitudes towards dietary recommendations and diet-disease relationships, may also help to explain differences in child outcomes. A subset of mothers who responded to CSFII was queried about their nutrition knowledge and attitudes in the DHKS. Their responses were summa-rized into two indices. Nutrition knowledge is represented as a respondent’s score (percent correct) across three batteries of items: a group of five items pertaining to recommended numbers of servings from the main Food Guide Pyramid food groups; a group of four items pertaining to practical knowledge about dietary fat, saturated fat, cholesterol, and nutrient amounts in foods; and a group of seven items pertaining to relationships between diet and disease. A score was calculated for each battery, and was then averaged over the three. Working mothers have significantly higher nutrition knowledge scores than nonworking mothers: 66 to 67 percent versus 62 percent (p < 0.05 for both). The scores are strongly related to household income; controlling for income group, the differences by maternal employment nearly vanish (Exhibit 3.6).
56 Chapter 3: Multivariate Analyses…Children's Nutrition Outcomes Abt Associates Inc.

Exhibit 3.6 Mothers’ Nutrition Knowledge Score, by Employment Status and Household Income Relative to Poverty
0
20
40
60
80
All children Up to 185% Over 185%
Perc
ent o
f Mot
hers
Full-timePart-timeHomemaker
Nutrition attitudes were similarly measured by averaging the mother’s scores over three sets of questions. The batteries pertained to perceived importance of dietary guidelines (11 items), importance of safety and nutrition in food purchasing decisions (two items), and beliefs about the relationship between diet and health (three items). The mean attitude scores were similar among the three groups of mothers (63 to 66 percent). Among mothers in higher-income households, however, homemaker mothers had significantly higher attitude scores than full-time working mothers (p < 0.01; Exhibit 3.7). Exhibit 3.7 Mothers’ Nutrition Attitude Score, by Employment Status and Household Income Relative to Poverty
0
20
40
60
80
All children Up to 185% Over 185%
Perc
ent o
f Mot
hers
Full-timePart-timeHomemaker
Abt Associates Inc. Chapter 3: Multivariate Analyses…Children's Nutrition Outcomes 57

The remainder of this chapter presents results from multivariate models of child nutrition outcomes. Covariates include measures of characteristics of the children, their households, and their mothers. Because the DHKS was administered to mothers of only about 15 percent of the sample of children for whom dietary recall data were available, nutrition knowledge and attitude measures are not included in the models. A supplementary analysis, however, restricted to those dyads for which DHKS data were available, found that the estimated regression-adjusted differences were virtually identical when nutrition knowledge and attitude measures were added to the models. Healthy Eating Index and Component Scores
It was found in Chapter 2 that children of full-time working mothers had significantly lower mean HEI scores than their counterparts with homemaker mothers. This was attributable to lower scores for grains, fruit, and variety, despite higher scores for vegetables. These significant results for all ages combined were repeated for 5- to 8-year-olds. Similar results were seen for 9- to 12-year-olds, with the difference that the total fat component was also significantly worse, and the vegetable score was not significantly better. For 2- to 4-year-olds, in contrast, the overall HEI score was significantly higher among children of working mothers, due to higher scores on grains, vegetables, meat, and saturated fat, and despite lower scores on sodium. Few significant differences were found between children of part-time working mothers and homemakers—none for all ages combined, and positive effects for 2- to 4-year-olds, attributable to higher scores for fruit, total fat, saturated fat, and cholesterol. A negative effect was seen with regard to saturated fat for 9- to 12-year-olds. After taking account of children’s age (and teenagers’ sex), mother’s age, race/ethnicity, and educa-tion, the number of adults and children in the household, an index of earnings from other adults, region of the country, and urbanicity, quite similar results are obtained. Mothers’ full-time employ-ment is associated with a general decrease of 0.6 points in children’s HEI (p < 0.10), attributable to lower scores on grains, fruit, and variety (Exhibit 3.8). The countervailing positive effect for vege-tables loses statistical significance. As in the bivariate analyses, the overall effect is essentially the net effect of strong negative results for 5- to 8-year-olds, and weaker positive results for preschoolers (age 2 to 4). The overall negative difference for 9- to 12-year-old children of full-time working mothers is no longer statistically significant—but it missed statistical significance at the 10 percent level by only a small margin. Regression-adjusted differences for older children (age 9 to 12 and teenagers) are small, with a few scattered marginally significant effects. The regression-adjusted results for 5- to 8-year-olds look like those for all children, only stronger: significant negative differences for grains, fruit, and variety as well as overall (and a positive differ-ence for vegetables). For preschoolers (age 2 to 4), in contrast, full-time employment is associated with better outcomes overall, due to superior scores on grains, vegetables, and meat (and despite inferior scores on sodium). Again, as in the bivariate analyses, much weaker patterns are seen for part-time employment. For all children combined the differences are virtually zero in total HEI score and for each component. A significant positive overall difference is seen for preschoolers, due to fruit and saturated fat, and a significant negative overall difference for 9- to 12-year-olds, due to fruit and total fat.
58 Chapter 3: Multivariate Analyses…Children's Nutrition Outcomes Abt Associates Inc.
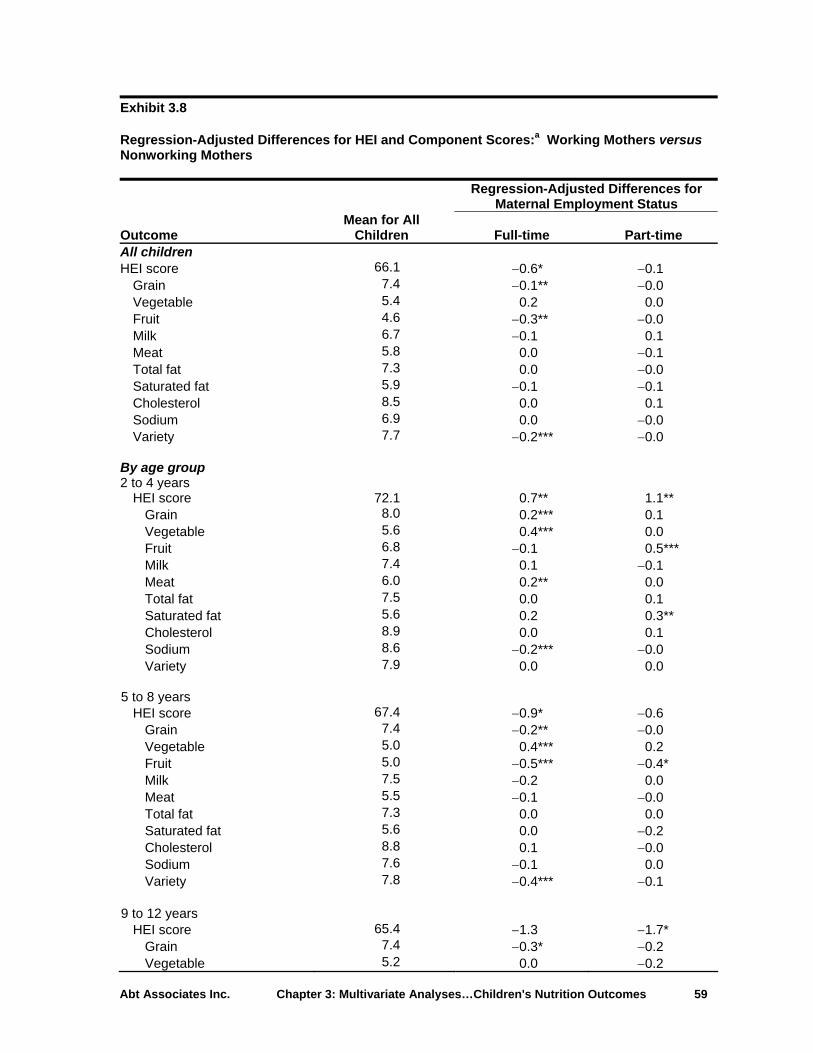
Exhibit 3.8 Regression-Adjusted Differences for HEI and Component Scores:a Working Mothers versus Nonworking Mothers
Regression-Adjusted Differences for
Maternal Employment Status
Outcome Mean for All
Children Full-time Part-time All children HEI score 66.1 −0.6* −0.1
Grain 7.4 −0.1** −0.0 Vegetable 5.4 0.2 0.0 Fruit 4.6 −0.3** −0.0 Milk 6.7 −0.1 0.1 Meat 5.8 0.0 −0.1 Total fat 7.3 0.0 −0.0 Saturated fat 5.9 −0.1 −0.1 Cholesterol 8.5 0.0 0.1 Sodium 6.9 0.0 −0.0 Variety 7.7 −0.2*** −0.0
By age group 2 to 4 years
HEI score 72.1 0.7** 1.1** Grain 8.0 0.2*** 0.1 Vegetable 5.6 0.4*** 0.0 Fruit 6.8 −0.1 0.5*** Milk 7.4 0.1 −0.1 Meat 6.0 0.2** 0.0 Total fat 7.5 0.0 0.1 Saturated fat 5.6 0.2 0.3** Cholesterol 8.9 0.0 0.1 Sodium 8.6 −0.2*** −0.0 Variety 7.9 0.0 0.0
5 to 8 years
HEI score 67.4 −0.9* −0.6 Grain 7.4 −0.2** −0.0 Vegetable 5.0 0.4*** 0.2 Fruit 5.0 −0.5*** −0.4* Milk 7.5 −0.2 0.0 Meat 5.5 −0.1 −0.0 Total fat 7.3 0.0 0.0 Saturated fat 5.6 0.0 −0.2 Cholesterol 8.8 0.1 −0.0 Sodium 7.6 −0.1 0.0 Variety 7.8 −0.4*** −0.1
9 to 12 years
HEI score 65.4 −1.3 −1.7* Grain 7.4 −0.3* −0.2 Vegetable 5.2 0.0 −0.2
Abt Associates Inc. Chapter 3: Multivariate Analyses…Children's Nutrition Outcomes 59

Exhibit 3.8 Regression-Adjusted Differences for HEI and Component Scores:a Working Mothers versus Nonworking Mothers
Regression-Adjusted Differences for
Maternal Employment Status
Outcome Mean for All
Children Full-time Part-time Fruit 4.0 −0.5* −0.6* Milk 6.8 0.1 0.2 Meat 5.8 0.0 0.2 Total fat 7.3 −0.2 −0.5** Saturated fat 5.9 −0.3 −0.3 Cholesterol 8.6 0.1 0.1 Sodium 6.3 0.1 −0.0 Variety 8.1 −0.3 −0.3
13 to 17 years, male
HEI score 61.4 −1.2 0.9 Grain 7.4 0.0 0.4 Vegetable 5.7 0.1 0.3 Fruit 3.0 −0.4 0.1 Milk 6.3 .1 0
Saturated fat − .4 −0.4
− .5* −0.0 −
5 0.3 0.8* −0.1
Meat −0.4 −0.4 To 0.6* 0.3 Sa 0.4 0.1 Chol 0.4 0.3
percent level. * Statistically significant difference at the 5 percent level. Statistically significant difference at the 10 percent level.
ing covariates: indicators for children’s age groups (including male and female under 30, over 40; indicators for maternal race/ethnicity black, Hispanic, other
nonwhite; indicators for maternal education less than high school diploma, greater than high school diploma, unknown;
0 .5Meat 6.7 0.3 −0.2 Total fat 6.9 −0.1 0.1
6.1 0Cholesterol 7.3 0Sodium 4.4 −0.1 0.2 Variety 7.6 −0.2 0.4
13 to 17 years, female
HEI score 61.9 0.1 0.8 Grain 6.4 −0.4 −0.2 Vegetable 5.5 −0.3 −0.1 Fruit 3.Milk 4.5 −0.4
5.4 tal fat 7.3 turated fat 6.5
esterol 8.8 Sodium 7.2 0.3 0.1 Variety 6.9 −0.4 −0.0
a Range of scores for the HEI is 0 to 100; ranges for each component of the HEI are 0 to 10.
*** Statistically significant difference at the 1**
Multivariate models include the followteenagers); indicators for maternal age
number of adults and number of children in household; index for earnings from other adult household members; and indicators for region of country and urbanicity.
60 Chapter 3: Multivariate Analyses…Children's Nutrition Outcomes Abt Associates Inc.

The major results, that HEI scores of preschool children of full-time and part-time working mothers are significantly higher than those of their counterparts with homemaker mothers, and that the scores
f 5- to 8-year-old children with full-time working mothers are notably lower than those of their
he results for children’s diet rating are also qualitatively similar. It was found in Chapter 2 that
or
ant difference is no longer significant—the effect on the likelihood of poor diet for 5- to 8-year-old hildren of part-time working mothers).
r t (p < 0.01); marginally significant effect
ment are seen for both the likelihood of a good diet (3.7 perca poor diet (4.7 percentage points more; oth).
Exhibit 3.9 Regression-Adjusted Differences for HEI Diet Rating: Working Mothers versus Nonworking Mothersa,b
ocounterparts with homemaker mothers, remain unchanged after regression adjustment. Healthy Eating Index Diet Rating
Tthere were no statistically significant differences for all age groups combined, but a marked higher likelihood that 9- to 12-year-old children of working mothers versus homemaker mothers have podiets. Likewise, in the multivariate analysis, neither full-time nor part-time maternal employment is associated with a significant difference for all children in the proportion that have either good or poor diets (the middle category, “needs improvement”, was omitted; Exhibit 3.9). One marginally signifi-cc For 9- to 12-year-olds, part-time employment is associated with an 8.5 percentage point greatelikelihood of a poor die s associated with full-time employ-
entage points less) and the likelihood of p < 0.10 for b
Regression-Adjusted Outcomes for
Maternal Employment Status
Outcome Mean for All
Children Full-time Part-time All children Good diet 9.3% −0.9% 0.0% Poor diet 7.8 1.2 0.2 By age group 2 to 4 years
Good diet 24.9% 2.4% 1.3% Poor diet 2.9 −0.4 −0.8
5 to 8 years
Good diet 7.5% −1.5% 0.9% Poor diet 4.9 0.4 −0.8
9 to 12 years
Good diet 6.5% −3.7%* −2.6% Poor diet 6.9 4.7* 8.5***
13 to 17 years, male
Good diet 2.3% 1.5% 1.3% Poor diet 15.9 0.7 −5.7
Abt Associates Inc. Chapter 3: Multivariate Analyses…Children's Nutrition Outcomes 61

Exhibit 3.9 Regression-Adjusted
a,bDifferences for HEI Diet Rating: Working Mothers versus Nonworking
Mothers
Regression-Adjusted Outcomes for
Maternal Employment Status
Outcome Mean for All
Children Full-time Part-time 13 to 17 years, female
Good diet 2.7% −2.1% −0.7% Poor diet 12.9 −0.9 −4.8
a An HEI score over 80 implies a “good diet,” an HEI score between 51 and 80 implies a diet that “needs improvement,” and an HEI score less than 51 implies a “poor diet.”
b Differences for dichotomous outcomes are expressed as percentage points at the mean.
*** Statistically significant difference at the 1 percent level. ** Statistically significant difference at the 5 percent level. * Statistically significant difference at the 10 percent level.
Multivariate models include the following covariates: indicators for children’s age groups (including male and female teenagers); indicators for maternal age under 30, over 40; indicators for maternal race/ethnicity black, Hispanic, other nonwhite; indicators for maternal education less than high school diploma, greater than high school diploma, unknown; number of adults and number of children in household; index for earnings from other adult household members; and indicators for region of country and urbanicity.
Food Energy Intake
Bivariate comparisons showed no significant differences for all children combined in mean percent of the 1989 REA or percent of children with food energy intake above 110 percent of REA; but children of part-time working mothers were significantly less likely to be consuming less than 90 percent of the REA. Among age groups, infants and children age 1 to 2 and 3 to 4 with full-time working mothers consumed significantly more food energy relative to the REA than corresponding children of home-maker mothers; and the consumption of less than 90 percent of the REA by children of part-time working mothers was attributable to teenage males. These results are all replicated in the multivariate analysis (Exhibit 3.10). Several other differences in specific age groups attain statistical significance: higher mean energy intake by 3- to 4-year-old children of part-time working mothers; and, for the probability of energy intake less than 90 percent of REA, lower for infants and 1- to 2-year-old children of full-time working mothers, higher for 5- to 8-year-old children of full-time working mothers, and lower for infants of part-time working mothers.
62 Chapter 3: Multivariate Analyses…Children's Nutrition Outcomes Abt Associates Inc.

Exhibit 3.10 Regression-Adjusted Differences for Intake of Food Energy: Working Mothers versus Nonworking Mothers
Regression-Adjusted Differences for
Maternal Employment Status
Outcome Mean for All
Children Full-time Part-time All children Mean percent of REA 109.4% 0.5% 1.4% Percent above 110% REAa 42.3 0.6 2.1 Percent below 90% REAa 32.2 1.2 −5.4*
By age group 0 to 11 months
Mean percent of REA 119.1% 5.6%** 3.6% Percent above 110% REA 53.5 5.3 7.0 Percent below 90% REA 18.2 −4.6* −6.5*
1 to 2 years Mean percent of REA 114.0% 5.6%*** 0.5% Percent above 110% REA 48.8 4.6* −3.1 Percent below 90% REA 26.5 −4.2* −2.3
3 to 4 years Mean percent of REA 117.4% 3.3%** 3.2%* Percent above 110% REA 51.9 2.7 1.6 Percent below 90% REA 25.2 −1.1 −1.3
5 to 8 years Mean percent of REA 106.9% −1.7% −2.4% Percent above 110% REA 39.6 −0.6 −3.2 Percent below 90% REA 30.3 5.2** 0.7
9 to 12 years Mean percent of REA 108.8% −3.9% 0.9% Percent above 110% REA 40.4 −2.0 1.3 Percent below 90% REA 32.7 2.3 −1.6
13 to 17 years, male Mean percent of REA 113.7% 3.2% 3.6% Percent above 110% REA 44.3 1.0 11.4 Percent below 90% REA 34.6 −1.9 −27.0***
13 to 17 years, female Mean percent of REA 95.7% 0.1% 5.0% Percent above 110% REA 30.3 −0.2 6.4 Percent below 90% REA 48.2 4.2 −6.4
a Differences for dichotomous outcomes are expressed as percentage points at the mean.
*** Statistically significant difference at the 1 percent level. ** Statistically significant difference at the 5 percent level. * Statistically significant difference at the 10 percent level.
Multivariate models include the following covariates: indicators for children’s age groups (including male and female teenagers); indicators for maternal age under 30, over 40; indicators for maternal race/ethnicity black, Hispanic, other nonwhite; indicators for maternal education less than high school diploma, greater than high school diploma, unknown; number of adults and number of children in household; index for earnings from other adult household members; and indicators for region of country and urbanicity.
Abt Associates Inc. Chapter 3: Multivariate Analyses…Children's Nutrition Outcomes 63

Iron and Zinc Intake
The bivariate analyses showed that children of full-time working mothers consumed significantly less iron (as a percent of 2001 RDA) than their counterparts with homemaker mothers, especially 5- to 8-year-olds, 9- to 12-year-olds, and teenage girls. The latter two age groups also consumed less zinc (relative to 2001 RDA) than their counterparts. Among children of part-time working mothers, 1- to 2-year-olds consumed less zinc than their counterparts. The multivariate results repeat the results for iron, but find in addition significantly positive differ-ences for iron among infant children of full-time and part-time working mothers, and among teenage males with part-time working mothers (Exhibit 3.11). The negative results for zinc are no longer seen for 9- to 12-year-old children and teenage daughters of full-time working mothers, nor for children age 1 to 2 of part-time working mothers. Thus, it can be inferred that the zinc intake differences for those subgroups are attributable to other differences rather than to maternal employment per se. Additional positive differences for zinc are found for male teenage children with both full-time and part-time working mothers. As noted in Chapter 2, with most subgroups consuming far in excess of the 2001 RDA for iron and for zinc, differences due to maternal employment may not be important nutritionally. Exhibit 3.11 Regression-Adjusted Differences for Intake of Iron and Zinc: Working Mothers versus Nonworking Mothers Regression-Adjusted Differences for
Maternal Employment Status Mean for All
Children Full-time Part-time All children Mean percent of iron RDA 149.2% −5.5%** 1.2% Mean percent of zinc RDA 166.5 −1.0 0.6 By age group 7 to 11 months
Mean percent of iron RDA 146.0% 17.9%** 15.6%* Mean percent of zinc RDA 223.9 5.0 −4.4
1 to 2 years
Mean percent of iron RDA 151.0% 4.6% 0.8% Mean percent of zinc RDA 240.8 3.8 −6.3
3 to 4 years
Mean percent of iron RDA 150.8% −3.1% 4.0% Mean percent of zinc RDA 226.6 −1.0 6.9
5 to 8 years
Mean percent of iron RDA 136.7% −7.6%** −2.1% Mean percent of zinc RDA 192.4 −5.9 −3.0
9 to 12 years
Mean percent of iron RDA 176.5% −13.4%** −5.8% Mean percent of zinc RDA 188.6 −10.6 −7.7
64 Chapter 3: Multivariate Analyses…Children's Nutrition Outcomes Abt Associates Inc.

Exhibit 3.11 Regression-Adjusted Differences for Intake of Iron and Zinc: Working Mothers versus Nonworking Mothers Regression-Adjusted Differences for
Maternal Employment Status Mean for All
Children Full-time Part-time 13 to 17 years, male
Mean percent of iron RDA 180.1% 13.4% 27.0%** Mean percent of zinc RDA 160.9 28.0** 29.7**
13 to 17 years, female
Mean percent of iron RDA 104.3% −22.4%** −12.7% Mean percent of zinc RDA 105.0 −11.4 −8.6
*** Statistically significant difference at the 1 percent level. ** Statistically significant difference at the 5 percent level. * Statistically significant difference at the 10 percent level.
Multivariate models include the following covariates: indicators for children’s age groups (including male and female teenagers); indicators for maternal age under 30, over 40; indicators for maternal race/ethnicity black, Hispanic, other nonwhite; indicators for maternal education less than high school diploma, greater than high school diploma, unknown; number of adults and number of children in household; index for earnings from other adult household members; and indicators for region of country and urbanicity.
Dietary Fiber Intake
It was shown in Chapter 2 that children of full-time working mothers consumed significantly less dietary fiber than children of homemaker mothers, especially 9- to 12- year-olds and teenage females. Fiber consumption was also significantly lower among 9- to 12-year-old children of part-time working mothers than among their counterparts with homemaker mothers. These results are repeated in the multivariate analysis (Exhibit 3.12), with an additional significant negative difference for 5- to 8-year-old children of part-time working mothers. Exhibit 3.12 Regression-Adjusted Differences for Intake of Dietary Fiber: Working Mothers versus Nonworking Mothers Regression-Adjusted
Differences for Maternal Employment Status
Mean for All Children Full-time Part-time
All children Mean percent of dietary fiber recommendationa 97.2% −4.8%** −4.1%
By age group 2 to 4 years
Mean percent of dietary fiber recommendation 129.2% 2.5% 1.8%
Abt Associates Inc. Chapter 3: Multivariate Analyses…Children's Nutrition Outcomes 65

Exhibit 3.12 Regression-Adjusted Differences for Intake of Dietary Fiber: Working Mothers versus Nonworking Mothers Regression-Adjusted
Differences for Maternal Employment Status
Mean for All Children Full-time Part-time
5 to 8 years Mean percent of dietary fiber recommendation 106.1% −7.8%*** −6.9%**
9 to 12 years
Mean percent of dietary fiber recommendation 89.5% −10.2%** −9.8%**
13 to 17 years, male Mean percent of dietary fiber recommendation 85.9% 1.4% 0.2%
13 to 17 years, female
Mean percent of dietary fiber recommendation 62.6% −7.05 −2.0% a Based on American Health Foundation recommendation of “age plus 5” grams dietary fiber per day for children age 2
and above (Williams, 1995).
*** Statistically significant difference at the 1 percent level. ** Statistically significant difference at the 5 percent level. * Statistically significant difference at the 10 percent level.
Multivariate models include the following covariates: indicators for children’s age groups (including male and female teenagers); indicators for maternal age under 30, over 40; indicators for maternal race/ethnicity black, Hispanic, other nonwhite; indicators for maternal education less than high school diploma, greater than high school diploma, unknown;
r of children in household; index for earnings from othe dult household members; and try and urbanicity.
number of adults and numbeindicators for region of coun
r a
others were significantly more likely , 8-
difference for teenage males (less likely to drink no soda).
he multivariate analysis finds the same patterns (Exhibit 3.13). In addition, the large positive differ-unces of soda a day, seen for teenage daughters of terparts with homemaker mothers, achieves statistical
Soda Consumption
It was previously shown that children of full-time working mthan children of homemaker mothers to drink more than 8 ounces of soda per day (and converselyless likely to drink no soda). The differences were concentrated among 2- to 4-year-olds and 5- to year-olds. Although there were no significant overall differences for children of part-time working mothers, there appeared to be a positive Tence in the likelihood of drinking more than 8 opart-time working mothers relative to their counsignificance.
66 Chapter 3: Multivariate Analyses…Children's Nutrition Outcomes Abt Associates Inc.

Exhibit 3.13 Regression-Adjusted Differences for Daily Consumption of Soda: Working Mothers versus Nonworking Mothersa
Regression-Adjusted Differences for
Maternal Employment Status Mean for All
Children Full-time Part-time All children None 43.9% −3.7%* −3.5%
e 51.5% n 8 ounces
**
34 % 1.3% −3.9% n 8 ounces 38.7 0.8 5.6
13 to 17 years, male
None 16.9% −3.5% −10.2%* More than 8 ounces 69.8 6.0 6.6
13 to 17 years, female
None 20.4% −0.6% −5.7% More than 8 ounces 55.5 4.6 20.9***
a Differences for dichotomous outcomes are expressed as percentage points at the mean.
*** Statistically significant difference at the 1 percent level. ** Statistically significant difference at the 5 percent level. * Statistically significant difference at the 10 percent level.
Multivariate models include the following covariates: indicators for children’s age groups (including male and female teenagers); indicators for maternal age under 30, over 40; indicators for maternal race/ethnicity black, Hispanic, other nonwhite; indicators for maternal education less than high school diploma, greater than high school diploma, unknown; number of adults and number of children in household; index for earnings from other adult household members; and indicators for region of country and urbanicity.
More than 8 ounces 20.7 3.6** 5.4 y age group B
2 to 4 years −5.7%*** 0.6% 0.5 −2.1
NonMore tha
9.7
5 to 8 years e
Non 42.7% −8.8%*
** −1.2%
More than 8 ounces 18.3 6.7* 1.6
9 to 12 years None More tha
.1
Other Soft Drink Consumption
No significant differences were seen in Chapter 2 with regard to consumption of other soft drinks for all ages combined. Scattered significant effects were seen for children of part-time working mothers: 2- to 4-year-old children were significantly more likely to drink none, and 9- to 12-year-old children were significantly more likely to drink over 8 ounces, than their counterparts with homemaker mothers.
Abt Associates Inc. Chapter 3: Multivariate Analyses…Children's Nutrition Outcomes 67

The overall lack of significant differences was repeated in the multivariate analyses, as was the age-specific result for 9- to 12-year-olds (Exhibit 3.14). A few additional differences achieved statistical significance: for children of part-time working mothers, 5- to 8-year-olds were less likely to drink no other soft drinks, and more likely to drink over 8 ounces, than their counterparts with homemaker mothers, and teenage sons of part-time working mothers were more likely to drink over 8 ounces than their counterparts with homemaker mothers. Exhibit 3.14 Regression-Adjusted Differences in Daily Consumption of Other Soft Drinks: Working Mothers versus Nonworking Mothersa,b
Regression-Adjusted Differences for
Maternal Employment Status Mean for All
Children Full-time Part-time All children None 41.0% −0.8% −3.3% More than 8 ounces 23.1 −0.2 1.2
By age group 2 to 4 years
None 42.1% −4.0%** 2.9% More than 8 ounces 20.1 1.0 −2.6
5 to 8 years
None 38.2% 1.1% 1.9% More than 8 ounces 24.5 −2.9 −7.0**
9 to 12 years
None 39.2% −0.2% −9.1%* More than 8 ounces 26.2 1.0 8.8**
13 to 17 years, male
None 48.2% 2.1% −8.1% More than 8 ounces 30.7 −3.0 11.3*
13 to 17 years, female
None 38.5% −3.9% −5.6% More than 8 ounces 32.9 3.8 −2.8
a Includes fruit drinks (not juice), iced tea, lemonade.
b Differences for dichotomous outcomes are expressed as percentage points at the mean.
*** Statistically significant difference at the 1 percent level. ** Statistically significant difference at the 5 percent level. * Statistically significant difference at the 10 percent level.
Multivariate models include the following covariates: indicators for children’s age groups (including male and female teenagers); indicators for maternal age under 30, over 40; indicators for maternal race/ethnicity black, Hispanic, other nonwhite; indicators for maternal education less than high school diploma, greater than high school diploma, unknown; number of adults and number of children in household; index for earnings from other adult household members; and indicators for region of country and urbanicity.
68 Chapter 3: Multivariate Analyses…Children's Nutrition Outcomes Abt Associates Inc.

Added Sugar Intake
No significant differences were seen for all age groups combined for added sugar intake in Chapter 2. For children age 2 to 4 and 5 to 8 of full-time working mothers, however, intake of added sugar from all sources, and in particular intake of added sugar from soda and other soft drinks, was significantly greater than among their counterparts with homemaker mothers. Similarly, the multivariate analyses find no significant differences for all age groups combined (Exhibit 3.15). The patterns of significant differences for age groups are a little different, however. Among children of full-time working mothers, only the difference for all sources of added sugar for 5- to 8-year-olds remains statistically significant; and two differences in added sugar from soda and other soft drinks achieve statistical significance for children of part-time working mothers relative to their counterparts with homemaker mothers: a positive difference for 9- to 12-year-olds, and a negative difference for teenage males. It appears that other differences, rather than maternal employment per se, explain the greater intake of added sugars by 2- to 4-year-old children of full-time working mothers. Exhibit 3.15 Regression-Adjusted Differences for Intake of Added Sugars (teaspoons per day): Working Mothers versus Nonworking Mothers Regression-Adjusted
Differences for Maternal Employment Status
Mean for All Children Full-time Part-time
All children Added sugar from all sources 22.9 0.4 0.5 Added sugar from soda and other soft drinks 10.1 0.4 −0.0 By age group 2 to 4 years
Added sugar from all sources 14.5 0.6 −0.3 Added sugar from soda and other soft drinks 5.1 0.4 −0.3
5 to 8 years
Added sugar from all sources 19.6 1.0* −0.1 Added sugar from soda and other soft drinks 6.8 0.7 −0.3
9 to 12 years
Added sugar from all sources 25.1 −0.5 1.5 Added sugar from soda and other soft drinks 10.1 −0.0 1.2*
13 to 17 years, male
Added sugar from all sources 35.1 −0.1 −1.0 Added sugar from soda and other soft drinks 19.5 −0.1 −2.3**
Abt Associates Inc. Chapter 3: Multivariate Analyses…Children's Nutrition Outcomes 69

Exhibit 3.15 Regression-Adjusted Differences for Intake of Added Sugars (teaspoons per day): Working Mothers versus Nonworking Mothers 13 to 17 years, female
Added sugar from all sources 23.9 1.4 2.6 Added sugar from soda and other soft drinks 12.6 1.2 1.0
*** Statistically significant difference at the 1 percent level. ** Statistically significant difference at the 5 percent level. * Statistically significant difference at the 10 percent level.
Multivariate models include the following covariates: indicators for children’s age groups (including male and female teenagers); indicators for maternal age under 30, over 40; indicators for maternal race/ethnicity black, Hispanic, other nonwhite; indicators for maternal education less than high school diploma, greater than high school diploma, unknown; number of adults and number of children in household; index for earnings from other adult household members; and indicators for region of country and urbanicity.
Consumption of Fried Potatoes and Other Vegetables
Finally, children of full-time working mothers were previously found to consume significantly more fried potatoes than children of homemaker mothers, especially children age 2 to 4 and 5 to 8. In addition, children age 2 to 4 consumed more of other vegetables if their mothers were working full-time. These results are all repeated in the multivariate analysis (Exhibit 3.16). Several other differences achieved significance: greater consumption of fried potatoes by teenage sons of both full-time and part-time working mothers relative to their counterparts with homemaker mothers, and lesser consumption of other vegetables by teenage daughters of full-time working mothers and teenage sons of part-time working mothers. Summary
The results presented in Chapter 2 were simple comparisons of means and proportions among groups of children that differed by maternal employment status, adjusted only for differences in the age distributions. It might be expected that conclusions based on these comparisons would need to be modified when other differences among the groups were taken into account. In fact, the three groups of children differ in some important ways. Children of homemaker mothers are more likely to be Hispanic or non-Hispanic white, poor, and from large households than children of working mothers. The homemaker mothers themselves tend to be younger, less well-educated, and less knowledgeable about nutrition than working mothers. Resources available from other earners are greatest, on average, in households with part-time working mothers, and lowest in households with full-time working mothers. Controlling for these factors does not, however, substantively alter the conclusions drawn in Chapter 2. The analysis still finds that children whose mothers work full-time tend to have less positive nutri-tion outcomes than children of nonworking mothers.
70 Chapter 3: Multivariate Analyses…Children's Nutrition Outcomes Abt Associates Inc.

Exhibit 3.16 Regression-Adjusted Differences for Consumption of Fried Potatoes and Other Vegetables (servings per day): Working Mothers versus Nonworking Mothers Regression-Adjusted Differences
for Maternal Employment Status Mean for All
Children Full-time Part-time All children Fried potatoes 0.7 0.1*** 0.1* Vegetables other than fried potatoes 1.9 −0.1 −0.1 By age group 2 to 4 years
Fried potatoes 0.5 0.1** 0.1 Vegetables other than fried potatoes 1.7 0.1** −0.0
5 to 8 years
Fried potatoes 0.5 0.2*** 0.1 Vegetables other than fried potatoes 1.6 −0.0 0.0
9 to 12 years
Fried potatoes 0.7 0.1 −0.0 Vegetables other than fried potatoes 1.9 −0.2 −0.1
13 to 17 years, male
Fried potatoes 1.0 0.3*** 0.5*** Vegetables other than fried potatoes 2.7 −0.0 −0.5**
13 to 17 years, female
Fried potatoes 0.7 −0.0 0.1 Vegetables other than fried potatoes 2.1 −0.3* −0.3
*** Statistically significant difference at the 1 percent level. ** Statistically significant difference at the 5 percent level. * Statistically significant difference at the 10 percent level.
Multivariate models include the following covariates: indicators for children’s age groups (including male and female teenagers); indicators for maternal age under 30, over 40; indicators for maternal race/ethnicity black, Hispanic, other nonwhite; indicators for maternal education less than high school diploma, greater than high school diploma, unknown; number of adults and number of children in household; index for earnings from other adult household members; and indicators for region of country and urbanicity.
The multivariate and bivariate results are contrasted in Exhibit 3.17. The bolded entries represent differences that were significant in the bivariate analyses only. It can be seen that these are relatively few in number, and generally pertain to specific age groups. The only result for all age groups combined that lost significance was the positive effect for the vegetable component of the HEI for children of full-time mothers. Thus, this analysis is consistent with the hypothesis that for most child nutrition outcomes, the differences between children of full-time working and homemaker mothers are related to maternal employment per se, rather than the result of other differences between the groups.
Abt Associates Inc. Chapter 3: Multivariate Analyses…Children's Nutrition Outcomes 71

Exhibit 3.17 Summary of Significant Differences in Bivariate and Multivariate Analyses Full-time versus Homemaker Part-time versus Homemaker Significant
Differences (bivariate)
Significant Differences
(multivariate)
Significant Differences (bivariate)
Significant Differences
(multivariate) Total HEI All children (–)
Age 2-4 (+) Age 5-8 (–) Age 9-12 (–)
All children (–) Age 2-4 (+) Age 5-8 (–)
Age 2-4 (+) Age 2-4 (+) Age 9-12 (–)
Grain All children (–) Age 2-4 (+) Age 5-8(–) Age 9-12 (–)
All children (–) Age 2-4 (+) Age 5-8(–) Age 9-12 (–)
Vegetable All children (+) Age 2-4 (+) Age 5-8 (+)
Age 2-4 (+) Age 5-8 (+)
Fruit All children (–) Age 5-8 (–) Age 9-12 (–)
ge 2-4 (+)
Age 9-12 (–) ge 13-17F (+)
All children (–) Age 5-8 (–) Age 9-12 (–)
Age 2-4 (+) AAge 5-8 (–)
AMilk Age 5-8 (–) Meat Age 2-4 (+)
Age 13-17F (–)
Age 2-4 (+)
Total fat Age 9-12 (–) Age 13-17F (+) Age 9-12 (–) Age 2-4 (+)
Age 9-12 (–) Saturated fat Age 2-4 (+)
Age 13-17M (–) ge 2-4 (+) ge 2-4 (+) A A
Cholesterol Age 13-17M (–) ge 2-4 (+) A Sodium Age 2-4 (–) Age 2-4 (–) Variety All children (–)
Age 5-8 (–) Age 9-12 (–) Age 13-17F (–)
All children (–) Age 5-8 (–)
Good diet Age 2-4 (+)
Age 9-12 (–)
Age 2-4 (+)
Poor diet Age 9-12 (+)
Age 9-12 (+)
Age 5-8 (–) Age 9-12 (+)
Age 9-12 (+)
Food energy: mean percent of REA
Age 0-11m (+) Age 1-2 (+) Age 3-4 (+)
Age 0-11m (+) Age 1-2 (+) Age 3-4 (+)
Age 3-4 (+)
Food energy: above 110% REA
Age 1-2 (+)
Food energy: below 90% REA
Age 0-11m (–) Age 1-2 (–) Age 5-8 (+)
All children (–) Age 13-17M (–)
All children (–) Age 0-11m (–) Age 13-17M (–)
72 Chapter 3: Multivariate Analyses…Children's Nutrition Outcomes Abt Associates Inc.

Exhibit 3.17 Summary of Significant Differences in Bivariate and Multivariate Analyses Full-time versus Homemaker Part-time versus Homemaker Significant
Differences (bivariate)
Significant Differences
(multivariate)
Significant Differences (bivariate)
Significant Differences
(multivariate) Iron All children (–)
Age 5-8 (–) Age 9-12 (–) Age 13-17F (–)
All children (–) Age 7-11m (+) Age 5-8 (–) Age 9-12 (–) Age 13-17F (–)
Age 7-11m (+) Age 13-17M (+)
Zinc Age 9-12 (–) Age 13-17F (–)
Age 13-17M (+) Age 1-2 (–) Age 13-17M (+)
Fiber All children (–) Age 5-8 (–) Age 9-12 (–) Age 13-17F (–)
All children (–) Age 5-8 (–) Age 9-12 (–)
Age 9-12 (–)
Age 5-8 (–) Age 9-12 (–)
Soda: None All children (–) Age 2-4 (–)
All children (–) Age 2-4 (–) Age 5-8 (–)
Age 9-12 (–) Age 13-17M (–)
Age 13-17M (–)
Soda: more than 8 ounces
All children (+) Age 5-8 (+)
All children (+) Age 5-8 (+)
Age 2-4 (–) Age 13-17F (+)
Other soft drinks: None
Age 2-4 (–) Age 2-4 (+) Age 9-12 (–)
Other soft drinks: more than 8 ounces
Age 9-12 (+)
Age 5-8 (–) Age 9-12 (+) Age 13-17 (+)
Added sugar from all sources
Age 2-4 (+) Age 5-8 (+)
Age 5-8 (+)
Added sugar from soda and other soft drinks
Age 2-4 (+) Age 5-8 (+)
Age 9-12 (+) Age 13-17M (–)
Fried potatoes All children (+) Age 2-4 (+) Age 5-8 (+)
All children (+) Age 2-4 (+) Age 5-8 (+) Age 13-17M (+)
All children (+) Age 13-17M (+)
Vegetables other than fried potatoes
Age 2-4 (+) Age 2-4 (+) Age 13-17F (–)
Age 13-17M (–)
Bolded results are significant in bivariate analyses only. Italicized results are significant in multivariate analyses only
Among the key results repeated in the multivariate analysis for all ages combined, comparing children of full-time working mothers to children of homemaker mothers, are that the total HEI score is lower, as well as the scores for the grain, fruit, and variety components; iron intake is lower; and intake of soda and fried potatoes is higher. For children of part-time working mothers, the finding for all ages combined of a lower likelihood of energy intake below 90 percent of the REA is replicated.
Abt Associates Inc. Chapter 3: Multivariate Analyses…Children's Nutrition Outcomes 73

Age-specific differences for children of full-time working mothers that remain significant are:
• For preschoolers, higher total HEI scores, higher scores for the vegetable and meat components, and lower scores for the sodium component.
• Also for preschoolers, higher intake of food energy, a greater likelihood of consuming some soda, and higher consumption of both fried potatoes and other vegetables.
• For school-age children (children age 5 to 8 and/or age 9 to 12), lower total HEI scores, lower scores for the grain, fruit, and variety components, but higher scores for the vegetable component.
• Also for school-age children, lower intake of iron, zinc, and fiber, greater likelihood of consuming over 8 ounces of soda, and higher consumption of fried potatoes.
• For teenage girls, lower intake of iron. The results for teenage girls with regard to zinc and fiber did not retain statistical significance. These two differences thus appear to be due to other differences between the groups. Comparing children of part-time working mothers with children of homemaker mothers within age groups, differences that remain significant in the multivariate analysis include:
• For preschoolers, higher total HEI scores, higher scores on the fruit and saturated fats components, and lower likelihood of drinking more than 8 ounces of soda.
• For school-age children, higher scores on the total fat component of HEI, lower intake of fiber, and greater likelihood of drinking more than 8 ounces of soft drinks other than soda.
• For teenage boys, lower likelihood of food energy intake under 90 percent of the REA, and higher likelihood of drinking at least some soda.
Other differences that lost significance include lower intake of zinc for 1-to-2-year-olds, greater likelihood of consuming at least some soda for 9-to-12-year-olds, and lower likelihood of consuming other soft drinks for 2-to-4-year-olds.
74 Chapter 3: Multivariate Analyses…Children's Nutrition Outcomes Abt Associates Inc.

Chapter 4 Role of the Child and Adult Care Food Program in Children’s Diets
The CACFP provides federal funds for qualifying meals served to children in nonresidential day care cilities.28 These include some child care centers, after-school-hours child care centers, family and
The goal of the CACFP is to provide nutritious meals and snacks to children attending child care programs. To this end, USDA has established minimum requirements for meals and snacks served in participating centers and child care homes. These requirements were modeled on the school meal programs meal patterns and were designed to ensure that meals and snacks served in the CACFP provide the types and amounts of food required to help meet participants’ daily energy and nutrient needs. The meal patterns specify categories of foods (meal components) to be offered at each meal and snack, as well as minimum portion sizes. Minimum portion sizes for children vary by age group.32 Currently, CACFP meals and snacks are not required to meet specific nutrient-based standards such as those used in the NSLP and SBP. Although the CACFP has been in existence for almost 35 years, research on the impact of the program on children’s nutrition has been limited. To date there have been only a few studies docu-
enting the relative contribution of CACFP meals and snacks to children’s total diet, and none used
e
fagroup child care homes, and Head Start programs.29 Since 1999, the program also includes reimbursement for meals served to preschool children in homeless shelters. Care providers are reimbursed at various rates for up to two meals and one snack per day served to eligible children,30 and in some cases, they receive USDA commodities. Eligibility for the child component of the CACFP is limited to children age 12 and under.31
mnational samples of children (Glantz, 2003). Although some research has been published on the nutrient content of meals offered (Briley et al., 1993; Fox et al., 1997; Crepinsek et al., 2002a), the nutrient profile of meals and snacks actually consumed by participating children may differ from thmeals and snacks offered by providers.33 Thus, to gain a full understanding of the contribution
28 The CACFP also operates in adult day care centers. This discussion is limited to the component of the program that
serves children in child care centers and homes.
mbursement rates apply to meals and snacks served by low-income providers in low-income neigh-borhoods, or served to low-income children.
31 An exception is made for children of migrant workers and children with disabilities, who may participate through ages 15 and 18, respectively.
32 The age groups are: 1 to 2, 3 to 5, and 6 to 12 years. There is a separate meal pattern for infants. 33 For example, children may decline one or more of the foods offered; children may select portions that differ from that
of the average portion; or children may waste (not consume) some of the food they take.
29 Note that Head Start is a preschool program for low-income children and does not provide child care per se. All Head Start centers are required to participate in the CACFP.
30 During the period the Early Childhood and Child Care Study was conducted, child care centers could receive reim-bursement for an additional meal or snack for children in care eight or more hours per day. The regulations changed as a result of the Personal Responsibility and Work Opportunity Reconciliation Act of 1996 (PRWORA) (P.L. 104-193). PRWORA also changed the reimbursement structure for family child care homes to more closely resemble that for centers. Higher rei
Abt Associates Inc. Chapter 4: Role of the CACFP in Children's Diets 75

CACFP meals and snacks actually make to children’s total energy and nutrient needs, it is necessary to examine CACFP meals and snacks as consumed by children. The first part of this chapter is devoted to results of just such an analysis, using data from the 1995 ECCCS. It is hoped that findings from this part of the study might assist program staff by possibly serving as the basis for developing nutrient-based standards or otherwise updating or revising menu planning guidance, nutrition education requirements for child care providers, and reimbursement policies, and to inform future CACFP research.
As discussed in Chapter 1, one measure of a successful outcome of the CACFP may be its ability to provide children of working mothers with a diet that is nutritionally comparable to that provided by mothers who are full-time homemakers. The CACFP also has the potential to dampen any negative effects of maternal employment on children’s diets. The second part of this chapter is devoted to comparisons of nutrition outcomes between CACFP-participating children of working mothers and not-in-care children of nonworking mothers. Contribution of CACFP Meals to Children’s Dietary Intake
As noted above, CACFP regulations and guidance materials provide only broad standards for meals and snacks offered under the program. In the absence of specific nutrient-based standards, prior studies have used the recommendations of the American Dietetic Association (ADA) (1994 and 1999) s a benchmark for assessing the adequacy of the meals and snacks consumed by CACFP partici-
mmends that children in care for eight or more hours per day receive food that provides at least one-half to two-thirds of their daily nutrition needs (based on age-appropriate RDAs). The recommendation for children in part-day programs (four to seven hours per day) is for one-third of their daily needs. In addition, the ADA recommends that meals and snacks be consistent with the Dietary Guidelines for Americans. This section describes participating children’s average consumption of food energy and nutrients over 24 hours, and the relative contribution of CACFP meals and snacks to total intakes. It begins with a description of the sample children and their households, overall and for the three types of CACFP care (i.e., family child care homes, Head Start centers, and child care centers). Because there are some important differences in the characteristics of participants and their families, dietary data are also presented by type of CACFP care.
t
apants. The ADA reco
The analyses suggest that, on average, total daily intakes of children participating in the CACFP meerecommendations for food energy and most dietary components. They also suggest that CACFP meals and snacks make a positive contribution to total dietary intake, but may benefit from changes to lower the fat, especially saturated fat, and sodium in foods offered and served to children. School-agechildren in CACFP centers tend to receive less of their daily nutrition needs from CACFP than their counterparts in homes, but this does not appear to detract from their total intakes which are adequate for most nutrients.
76 Chapter 4: Role of the CACFP in Children's Diets Abt Associates Inc.

Characteristics of CACFP Sample Children and Their Households
The ECCCS obtained complete information on 24-hour dietary intake for 948 children, age 1 to years old.
10 llection methods used are summarized in Chapter 1 and described in detail in
e final study report (Fox et al., 1997). About 42 percent of the sample children received CACFP eals and snacks in Head Start centers, one-third (33 percent) in other child care centers, and nearly
one-quarter (24 percent) in family child care homes.
Exhibit 4.1 presents the available demographic information on the ECCCS sample children and their households. Sampling weights were applied to reflect the national number of children in CACFP (see Appendix B for a description of the weighting methodo ene g patterns, as well as differences by child care type, are important to consider in interpreting findings the CACFP in children’s diets. A quarters of all children in the CACFP are preschoolers 3 to 5 f age, witrem y split between toddlers (1 to 2 years) and school-age children (6 to 10 years). Participants are a little more likely to be white than minority ( versus 46 pe ent), and blackdren are more heavily represented than other minority grou rsus 15 . A subnu children spend 8 or more hours per day in CAC e (48 perc nother 36 t
e in care from 4 to 8 hours daily. The relatively small proportion of participants in care less than 4 probably children who also attend school.
T of CACFP children consists of two and two c n, althougth en live in single-adult households. Most mo ith children ACFP hav e
beyond high school and are employed. As of 1995, approximately ortio families with incomes above and below 185 percent of poverty.
Differences between children in CACFP family child care nd child ead Star ild ca re especially notable. Children in Head Start centers are all pre olers age 3years, and so are nearly three-quarters of children in child care centers. In contrast, fewer than half of children in child care homes are preschoolers, and over one-third are toddlers age 1 to 2. Furt r-
k (83 percent) of children in child care hom s are white, and only 7 percent are black. Whites comprise only 38 and 49 percent of children Start an care cenrespectively whereas blacks comprise 45 and 36 percent of these children.
hildren in child care centers are more disadvantaged than children in famil ld care hom d rt are even more so. Head Start program egulations require that no more than 10
can have family incomes above the federal pov el. Child r below 185 percent of poverty are eligible for reduced-price s in Head Start and other child care centers; since PRWORA, this is also the threshold below which children’s meals in homes qualify for reimbursements at the higher (Tier I) rate. Only 18 percent of children in h fall under t-of percent of children in child care centers and 88 percent of children in Head Start c rs do
34 The data cothm
logy). The g ral underlyinon the role of
lmost three ainder about equall
years o h the
54 rc chil-ps 31 ve percent) stantial
mber of FP car ent); a percenarhours a day are
he average household adults hildre h one ird of childr thers w in C e som
edchildren were from
ucation equal prop ns of
homes a ren in H t and chre centers a scho to 5
hemore, the great bul e
in Head d child ters, ,
C y hic es an,children in Head Stapercent of enrolled children
rerty lev ren at o
meal
omes this cuf, but 49 ente
34 Infants were excluded from this analysis for several reasons: (1) the number of infants in the ECCCS sample was too
small to draw conclusions; (2) very little of the food consumed by infants in CACFP care is supplied by the provider (parents often supply infant formula and other baby food); and (3) infant feeding patterns are unique, i.e., they do not consume discreet meals and snacks. Eleven- to 12-year-olds were excluded because they were not adequately repre-sented in the ECCCS sample⎯only two children over age 10 had complete data.
Abt Associates Inc. Chapter 4: Role of the CACFP in Children's Diets 77

so. Similarly, the proportions living in single-adult households are 24 percent for children in homes, ut 34 percent and 41 percent for children in child care and Head Start centers, respectively. The
households of children in both family child care homes and child care centers, however, tend to include fewer children.
Characteristics of CACFP Sample Children and Their Families
b
Exhibit 4.1
Family Child Care Homes
HeCe
Child Care Cen All CA
ad Start CFP ters nters
Age a
1-2 years 3-5 years
34.9% -- 11.4% 14.1% 46.9 100.0%b 70.7 73.0 18.3
42.7% 49.4% 48.9% 47.5% 57.3 5
R
7.2 44.8 35.8 31.0
o FP care
19.4% 76.3
8 2 9.2 7.2 47.5 Mean 7.2 5.2 7.2 6.6
1 24.5% 40.7% 34.2% 33.5% 2 69.2 50.6 52.6 56.3 3 or more 6.3 8.7 13.2 10.2
2 43.5 31.0 44.2 40.4 3 15.3 25.4 15.1 18.0
6-10 years -- 17.8 12.8
Genderc Male Female 50.6 1.1 52.5
ace/Ethnicity Non-Hispanic White
82.6%
38.2% 48.8% 54.5%
Non-Hispanic Black Hispanic 7.3 10.4 6.6 7.8 Other 2.9 6.5 8.8 6.7
H urs in CAC
Less than 44 to 8
14.5% 15.7%20.7
16.3%36.3 19.4
or more 61.
Number of adults
Mean 1.8 1.7 1.8 1.8 Number of children
1 35.3% 20.0% 27.9% 27.6%
4 or more 5.9 23.6 12.8 14.1 Mean 1.9 2.7 1.8 2.3
78 Chapter 4: Role of the CACFP in Children's Diets Abt Associates Inc.

Exhibit 4.1 Characteristics of CACFP Sample Children and Their Families
Family Child Care Homes
Head Start Centers
Child Care Centers All CACFP
Number of household members 2 8.0% 8.8% 8.7% 8.6% 3 35.9 22.7 27.0 28.0 4 36.8 26.3 35.5 33.3 5 12.5 21.1 19.3 18.1 6 or more 6.9 21.1 9.5 12.1 Mean 3.8 4.4 4.0 4.1
Household income as percent of poverty
Mother’s employment status
Homemarker 5.4% 44.6% 10.8% 18.8 In school 8.4 8.0 9.8 8.9 Working 86.2 47.5 79.4 72.2
Sample size 231 402 315 948 a Infants and 11- to 12-year-olds (n=2) are excluded.
b Head Start specifically targets preschoolers. Two Head Start children in the 6- to 10-year age group were dropped from the sample as anomalous.
c Children for whom gender was missing (n=3) are excluded.
Data were missing on race/ethnicity, household size and income, and mother’s employment status for 2 percent of children in child care centers, 4 percent in family child care homes, and up to 7 percent in Head Start centers.
Note: The low 41 percent response rate to the 24-hour recall portion of the ECCCS on which these estimates are based raises concerns of potential bias. In-CACFP-care energy intake does not significantly differ between respondents and nonrespondents (see Appendix D), but whether their out-of-care energy intake systematically differs cannot be determined. Due to this uncertainty, we recommend that these data be interpreted with caution.
At or below 185% 18.1% 87.7% 48.6% 51.8% Over 185% 81.9 12.3 51.4 48.2
Mother’s education
Less than high school/GED 3.2% 20.9% 8.6% 10.8% High school/GED 31.2 44.7 24.2 31.8 More than high school/GED 65.5 34.4 67.1 57.4
Finally, the mothers of children in family child care homes and child care centers are considerably more highly educated than mothers of children in Head Start centers (66 to 67 percent versus 34 percent with more than a high school degree or GED). These mothers are also overwhelmingly likely to be working (86 percent and 79 percent, respectively). Fewer than half (47 percent) of mothers of Head Start children are working; as noted previously, these are not child care programs, but rather enrichment programs.
Abt Associates Inc. Chapter 4: Role of the CACFP in Children's Diets 79
8
Note that althoughincome above 185
0 Chapter 4: Role of the CACFP in Children's Diets Abt Associates Inc.
most of the children in CACFP homes in 1995 were in families with household percent of poverty, since tiering, the share of low-income children has increased.35
Likewise, although mothers of children in child care centers and family care child homes were substantially more likely to be employed in 1995 than mothers wit Head Start, this also have changed with PRWORA. Children’s 24-Hour Dietary Intake and the Role of CACFP Meals and Snacks
Children’s intakes of total food energy and 12 nutrients and other d components were calculated for the full 24-hour period and, separately, for the contribution from meals and snacks. The unit of analysis was the “child-day,” representing children’s dietary intake over the course of a typical day in CACFP child care. Dietary intake findings, tabulated overall and by type of CACFP care and age group,36 are discussed below. The standard errors for all mean nutrient values are tabulated in Appendix E. Note that results for the 6-to-10-year age group are based on fewer than 100 child days. The response rate to the dietary recall interview in the ECCCS was low, 41 percent. The nonresponse analysis in Appendix D did not find evidence of substantial bias when 24-hour recall respondents' energy intake during CACFP care was compared with that of other observed children. There is still the possibility that nonrespondents' out-of-CACFP-care dietary inta systematicallyfrom that of respondents, which would bias our results. USDA's Fo nd Nutrition Servi efore recommends that these analyses should not be considered as representative of CACFP participants or of the impact of the program. Food Energy and Key Nutrients Exhibit 4.2 shows results of the analysis of children’s intake of foo ergy, protein, and amins and minerals. The nutrients selected for analysis are those for which standards have been estfor the school meal programs (NSLP and SBP). Intakes of food energy and key nutrients are expressed as a percent of the RDA.37 The most recently published RDAs at the time of analysis were used (NRC, 1989a; IOM, 1997, 2000, and 2001).38 Calcium intake is shown relative to both 1989 RDA and the Adequate Intake (AI) level released as part of the 1997 Dietary Reference Intake(DRIs), because a new calcium RDA could not be established.
h children in may
ietary CACFP
ke was od a
diffce t
erent her
d en key vitablished
thes
35 The Family Child Care Homes Legislative Changes Study found about twice as man with household inco
at or below 185 percent of ty in CACFP homes in 1999 than in 1995 (39 vs. 21%; Crepinsek et al., 2002b). 36 Sample sizes precluded ication, for example, by hours in CACFP care or common meal and snack
combinations. Fo age is a reasonable proxy for full-day (toddlers and preschool children) and par care (school-age c
37 The RDAs for children age 6 to 10 were calculated as weighted averages of the corresponding 1989 RDAs for children age 4 to 6 and children age 7 to 10. Because life stage (age/gender) groups for the newer RDAs (i.e., those developed to replace the 1989 RDAs; IOM/FNB, 1997, 2000, and 2001) differ from the age the 1989 RDAs, the RDAs used for children age 3 to 5 are the weighted average of new RDAs for children age 1 to 3 and 4 to 8. new RDAs for children age 6 to 10 are the weighted averages for children age 4 to 8 and the separate RDAs for m s and females age 9 to 13.
38 In addition to new reference values for food energy (EERs), DRIs were recently rel r the macronutrients protein, carbohydrate, fat, and fiber (IOM/FNB, 2002). As noted in Chapter 2, EERs for children vary by age, gender,
hysical activity level. Because data on physical activity were not collected in CCCS, it is not possible tot what the effect of applying EERs to the analysis would be. For protein, new RDAs are somewhat loweren age 1 to 5 (13 to 19 grams per day), and somewhat higher for the 6 to 10 age group (19 to 34 grams),
alues for children age 1 to 10 (16 to 28 grams). Applying the new p RDAs would not meaning alter the results presented here.
y children me pover
further stratifr the most part, hildren).
t-day
groups used in Theale
eased fo
the E
rotein
and ppredicchildrto 1989 RDA vfully
r
-
forelative

Abt A
ssociates Inc. C
hapter 4: Role of the C
AC
FP in Children’s D
iets 81
Exhibit 4.2 Average Food Energy and Key Nutrients Consumed in CACFP Care and Over 24 Hours, by Age of Childa
Family Child Care Homes Head Start Centers Child Care Centers All CACFP
% Daily Recom-
mendation in 24 Hours
% Daily Recom-
mendation in 24 Hours
% Daily Recom-
mendation from CACFP
% Daily Recom-
mendation in 24 Hours
% Daily Recom-
mendation from CACFP
% DailRecom-
mendation in 24 Hours
aily Recom-
mendation from CACFP
% Daily Recom-
mendation from CACFP
y % D
Food energy (1989 REA)
1-2 years 108% 47% -- -- 102% 43% 45% 100% 101 39 --
A)
148% - 324% 134% 333% 143% 294 140 117% 319 120 122 s -- 48
DA)
101% -- -- 109% s 219 42 -- 174 34
Vitamin C (2000 RDA)
1-2 years 636% 201% -- -- 638% 272% 637% 224% 3-5 years 443 195 572% 181% 549 203 540 193 6-10 years 422 91 -- -- 386 106 399 100
Calcium (1997 AI)
1-2 years 200% 99% -- -- 158% 79% 186% 92% 3-5 years 156 86 138% 66% 147 71 145 72 6-10 years 148 38 -- -- 108 26 122 30
106%3-5 years 97 45 36% 104 40
87 14 6-10 years
102 25
-- 93 18
Protein (1989 RD1-2 years
-
337% --
3-5 years6-10 year
318% 314300 66 -- 233
38 257
Vitamin A (1989 R1-2 years
206% 183% 85% 199% 95%
963-5 years6-10 year
193 98 234%
207 85 215-- 149
30

Exhibit 4.2 Average Food Energy and Ke s Consumed in CACFP Care and Over 24 Hou ilda
y Nutrient rs, by Age of Ch
Family Ch mes Head Start Centers C All CACFP ild Care Ho hild Care Centers
% Daily Recom-
mendation in 24 Hours
aily m-
ation ACFP
% Daily Recom-
mendation in 24 Hours
% Daily Recom-
mendation from CACFP
% DailRecom
mendatiin 24 Ho
ly m-tion CFP
% Daily Recom-
mendation in 24 Hours
% Daily Recom-
mendation from CACFP
% DReco
mendfrom C
y -on urs
% DaiReco
mendafrom CA
Calcium (1989 RDA) 1-2 years -- -- 116% 58% 3-5 years 128% 61% 126 63 6-10 years -- -- 133 32
Iron (2001 RDA)
1-2 years -- -- 149% 60% 3-5 years 140% 45% 138 47 6-10 years -- -- 144 22
Zinc (2001 RDA)
1-2 years -- -- 234% 95% 3-5 years 218% 74% 212 79 6-10 years -- -- 203 30
Number of child days
1-2 years 128 -- -- 73 201 201 3-5 years 574 574 1,087 1,087 6-10 years 59 -- -- 41 100 100
a All means are expressed as a perce ghted RDAs. Calcium intake is also presented as a percent of th value.
Note: The low 41 percent response rat ur recall portion of the ECCCS on which these estimates are bas s of potential bias. In-CACFP-care energy intake does not significantly differ ondents and nonrespondents (see Appendix D), but whether the rgy intake systematically differs cannot be determined. Due to this uncertainty end that these data be interpreted with caution.
99% 49% 124 60 118 27
134% 58% 135 47 126 14
221% 92% 212 82 188 24
73352 352
41e DRI-based AI
ed raises concernir out-of-care ene
125% 62% 128 72 158 41
156% 61% 138 55 175 35
241% 97% 196 87 229 40
128161 161
59nt of age-wei
e to the 24-ho between resp, we recomm
82 C
hapter 4: Role of the C
AC
FP in Children’s D
iets A
bt Associates Inc.

Estimated total food energy intake among CACFP participants falls within 8 percent of the 1989 REAfor all age groups, in almost all types of CACFP care. The one exception is 6- to 10-year old children in child care centers, whose average daily food energy intake falls below the REA. This value is lower than the mean percent of REA for 6- to 10-year olds in family child care homes (87 versupercent; p < 0.10). Mean energy intakes below the REA are not particularly concerning, given thehigh prevalence of overweight among all U.S. children.
s 102
tribute an average of 45 and 39 percent of the REA for toddlers nd preschool children (1-2 and 3-5 age groups). For 1- to 5-year olds in care at least 8 hours per day
(in homes and centers), the CACFP contribution to energy intake falls just below the ADA recom-mendation that children receive food that provides at least one-half of their daily nutrition needs. The share of total food energy from CACFP for children in part-day care, including Head Start, is in line with the one-third-daily-needs recommendation. For children age 6 to 10, the CACFP contribution to total food energy intake is about half as much as for younger children (18 percent), falling below the ADA recommendation for part-day care. This reflects the relatively few hours per day school-age children spend in child care (median of 3 hours per day) and differences in patterns of consumption of CACFP meals and snacks (Glantz et al., 1997; Fox et al., 1997). With regard to 24-hour intake of protein, vitamins A and C, calcium, iron, and zinc, children in CACFP care are consuming, on average, considerably more than the RDA. These results do not seem to vary with child age or the type of CACFP child care (Exhibit 4.2). Although mean 24-hour intakes are higher than recommended levels, there is still some proportion of children whose usual intake is below the RDA for one or more of these nutrients. This cannot be determined from group means, which are based on only one day’s food intake. Nevertheless, given the magnitude of most point estimates, the share of children with inadequate intakes is likely to be small.40
CACFP meals and snacks alone provide more than 100 percent of the RDA for protein and vitamin C, and close to 100 percent of the vitamin A RDA, for both toddlers and preschool children ages 1 to 5. The CACFP contribution to calcium, iron, and zinc requirements is also substantial for these groups, ranging from means of 47 percent of the iron RDA for 3- to 5-year olds to 95 percent of the zinc RDA for 1- to 2-year olds. CACFP meals and snacks consumed by children age 1 to 5 meet the full-day-care ADA recommendations for all of these key nutrients, regardless of type of CACFP care.41
As with energy intake, CACFP contributes a smaller share of school-age children’s nutrient require-ments compared with younger children age 1 to 5. Overall, children age 6 to 10 consume 100 percent of the RDA for vitamin C in CACFP care, and from approximately one quarter to one half the RDA
39
CACFP meals and snacks overall cona
39 The possibility of underreporting of food energy intake cannot be ruled out. As described in Chapter 1, dietary data on
meals and snacks consumed in CACFP were collected by trained observers, but for the remaining part of the day, dietary recalls were conducted with parents by telephone. The problem is more likely to be concentrated among the 6- to 10-year old children for whom fewer meals and snacks were directly observed, and because parents may not be aware of all foods and beverages consumed while at school.
40 As noted in Chapter 2, the type of analysis required to determine the share of children with inadequate nutrient intakes was beyond the scope of this project.
41 The 95 percent confidence interval for the percent of RDA for iron among 3- to 5-year old children in centers is 37 to 57 percent.
Abt Associates Inc. Chapter 4: Role of the CACFP in Children’s Diets 83

8
for the other care of the nutrien
4 Chapter 4: Role of the CACFP in Children’s Diets Abt Associates Inc.
nutrients examined. With the exception of iron, school-age children’s intake in CACFP meets or approximates the ADA part-day recommendation of one-third daily requirements for all
ts exam to iron e is due to 6-to 10-year old dren in centers. These children consume significantly their RDA for iron in CACFP than their counterparts in fam (14 ve planation for the disparity may re to the ECCCS finding that few older children were receiving breakfast in center care—ready-to-eat (presumably iron-fortified) cereals were a major source of iron in CACFP breakfasts overall (Fox Fat, Saturated Fat, and CaChildren’s intakes of total fat, saturated fat, and carbohydrate, expressed as a percent of total food energy, were compared to Dietary Guidelines and the National Research Council’s (NRC) recom-mendations for these macronutrients. Results are shown in Exhi 4.3 for ren 3 to 6 to 10 years of age.42 Current Dietary Guidelines reco d tha ren ove no more than 30 percent of food energy from total fat and less than 10 percent from saturated fat (USDHHS and USDA, 2000). The NRC’s Diet and Health report calls for consumption of more than 55 percent of total food energy from mmenda-tions are intended to apply to total daily intake, it is useful to cmeals and snacks may enhance or detract from meeting these benchmarks over the full 24-hour period. The analysis suggests that CACFP children consume diets that approach, but do not quite meet daily dietary recommendations for the three macronutrients exam t ean total fat and saturated fat intakes exceed Dietary Guidelines ommendations, and total carbohydrate intake falls slightly below the NRC-recommended level. There is virtually no variation between the preschool and school-age groups, or across the three types of CACFP care. Point estimates for 3- to year old children in CACFP are ap ately 32 percent of t tal food energy from y from saturated fat, and 54 from arbohydrate. These findings are com able to estimates of fat, saturated fat, and carbohydrate intake among U.S. children of similar ages, as measured in the 1994 to 1996 and
ined. The lower contribution lesrsus
intak chil
5 and
5-
par
s of 35 percent of RDA). One exily child care homes
late
et al., 1997).
rbohydrate
bithild
cr 2 y
hildears of age consumemmen t c
total carbohydrate (NRC, 1989b). Although these recoonsider the extent to which CACFP
ined.43 Tha is, m rec
proximpercent of energy
o fat, 13 percent of energ c
1998 CSFII (USDA/ARS, 1999).
42 Dietary Guidelines and NRC recommend s for dail e apply to children age 2 and abo e. e
relevant nutrients/dietary components, res are presen nly for the CACFP age groups for which rtions fully apply.
43 Acceptable Macronutrient Distribution Ranges (AMDRs) have been set for tot at and carbohy (IOM/FNB, 2002). The AMDR for fat is 30 to 40 per or re e 1 to 3 and 25
ren age 4 to 18; the AMDR for carboh rate is 45 per t ranges we sis, conclusions about participants’ d and woul That is, th cent of
y from total fat and from carboh te with the icipants all e, both over 24 hours an m nd k
ationults
y intakted o
only v
drateto 35 percent for
re use mean
of a
For thecommenda-
ed in this per
ll ages, in
al fn agy. If
d danges, fors alone.
cent ofyd
iets ydra
d fro
total food
the CACFP contribution fallm CACFP
energto 65
in
y fcent of
accepeals a
child energ
table r snac
childanalyfood energtypes of CACFP car
heseiffer.
part

Exhibit 4.3 Average Intake of Selected Macronutrients in CACFP Care and Over 24 Hours, by Ag hild
e of C
Family Child Care Home Head Start Centers hild Care Centers C All CACFP
Daily Recom-
mendation (% food energy)
% Total Food
Energy in 24 Hours
% Total Food
Energy from
CACFP
% Total Food
Energy in 24 Hours
% Total Food
Energy from
CACFP
Total ood rgy in
Hours
% Total Food
Energy from
CACFP
% TotaFood
Energy24 Hou
%F
Ene24
l
in rs
% Total Food
Energy from
CACFP Total fat
3-5 years ≤ 30%a 31.7% 30.4% 31.8% 30.2% 1.7% 29.8% 31.76-10 years ≤ 30 30.7 30.2 -- -- 2.7 23.5 32.0
Saturated fat
3-5 years < 10%a 13.2% 13.2% 12.9% 13.5% 12.6% 12.7% 12.86-10 years < 10 12.4 12.2 -- -- 13.7 10.3 13.2
Carbohydrate
3-5 years > 55%b 54.2% 55.6% 53.0% 54.0% 53.9% 56.6% 53.66-10 years > 55 54.6 57.8 -- -- 54.5 70.8 54.5
Number of child days
3-5 years 161 161 574 574 352 352 1,0876-10 years 59 59 -- -- 41 39 100
a Dietary Guidelines recommendations (USDHHS/USDA, 2000).
b NRC recommendation (NRC, 1989b).
Dietary Guidelines and NRC recommendations are only applicable to children age 2 and older. This analysis was limited to children age 3 to 5 and 6 to 10, thgroups for which the recommendations fully apply.
Note: The low 41 percent response rate to the 24-hour recall portion of the ECCCS on which these estimates are based raises concerns of potential bias. In-CAintake does not significantly differ between respondents and nonrespondents (see Appendix D), but whether their out-of-care energy intake systematically diffdetermined. Due to this uncertainty, we recommend that these data be interpreted with caution.
3 3
Abt A
ssociates Inc. C
hapter 4: Role of the C
AC
FP in Children’s D
iets 85
% 30.1% 26.0
% 13.1% 11.0
% 55.4% 65.9
1,086 98
e only CACFP age
CFP-care energy ers cannot be
8
Meals and snacks consuthat are consistent with
6 Chapter 4: Role of the CACFP in Children’s Diets Abt Associates Inc.
med by children in CACFP care provide levels of total fat and carbohydrate Dietary Guidelines and NRC recommendations, respectively. For children in
the 3- to 5-year age rage, approximately 30 percent of food energy as fat and 55 per on topercent of food energy n ons for group, but not disproportionately so relative to other food sourc It ap rs that pres ool children consuming about the same share of energy from saturated f . Again, there are virtually no differences by type of care. Findings for the contribution of CACFP to the macronutrient intakes of 6- to 10-year-old children are similar to that for unger children, when com y recommendations. For this group, some differences are seen, however, by type of care. Compared with ool-a hildren in homes, children in centers consume somewhat less energy from total fat (24 versus 30 percent; p < 0.10), and considerably more energy from carbohydrate (71 versus 58 percent; p < 0.05). Differences in the types of meals con 6 to 10 in care (more breakfasts/lunches in homes and more high-carbohydrate snacks i differences in m onutr intake from CACFP between centers Cholesterol, Sodium, and Dietary Fiber Children’s dietary intake was also examined re recommendations for cholesterol and sodium (1989b) and the American Health Foundation’s recommendation for dietary fiber intake in children over age 2 (Williams, 1995). These recommendations call for daily intakes of no more than 300 mg di te n ore than 00 mg s m, and between 8 and 15 grams of dietary fiber per day ve r chi age 3 to 10). Exhibit 4.4 presents the p n of daily recommen in CACFP for each of these dietary components. The contribution fralso expressed as a ra e e to CACFP contribution for total food energy. The diets of both preschool e P pa ts m mmen average, for daily levels of cho er nd d ry fiber. Cholesterol intakes are 66 and 60 percent of the 300 mg maximum, and dietary fiber intakes, 130 and 107 percent of the recommended minimFindings are qualitatively similar for children in all three types of C care. In contrast, CACFP children’s mean sodium intake exceeds the 2,400 mg daily maximum, by approximately(216 mg) for 3- to 5-year-olds and 20 pe 480 mg) for children age 6 to 10. Preschool children in Head Start are more likel su th their rpart CAC omes and centers (p < 0.001 and p ely).
group, CACFP contributes, on avent as carbohydrate. The CACFP co
) exceeds recommees. pea
ce
yo
ntribthis
uti age
daily intake of saturated fat (13 dati
ch areat in CACFP care and out of care
pared to dietarsch ge c
sumed by children agen centers) may explai
and homes.n the acr ient
44
lative to the NRC’s dietary
etary choles rol, (based on “age-plus-fi
roportio
o m 2,4 gra
odiuayms per d ” fo ldren
ded levels consumed over 24 hours and om CACFP meals and snacks is
tio r lativ the
and school-aglest ol a ieta
CACF rticipan eet reco dations, on
ums.
9 percent
FP h
ACFP
rcent (y to con me excess
< 0.10, respectivsodium an counte s in
44 Data from the ECCCS suggest that children 6 to 10 family child care homes are substantially ely to
receive breakfast and lunch than 6- to-10-ye ds ild e c (Gl z et al., 1997) addition, although children in centers are somewhat more likel eceiv ldren mes (99 7 , snacks tend to be lower in energy content than eithe akfasts or hes (Fox 7).
age ar-oly to rr bre
in in ch
e sna
more lik
0 perc carcks tha lunc
entersn chi
ant in ho
et al., 199
. In versus ent)

Exhibit 4.4a Average Cholesterol, Sodium, and Dietary Fiber C i FP Car d r 24 Ho , ge of Child
onsumed n CAC e an Ove urs by A
Family Child e d rt Center e Centers Care Hom s Hea Sta s Child Car
Daily Recom-
mendation
% Daily Recom-menda-tion in
24 Hours
% DaiRecommenda
tion from
CACF
teretger
% Daily Recom-menda-tion in
24 Hours
aily Recom-menda-
tion from
CACFP
% Total from Meals
in Care Relative to
% ToEner
from Min Ca
% Daily Recom-m a-
% Daily Recom-me -
% Tfrom
in CRelati
% TEne
from C
ly --
P
% Tofrom M
in CaRelativ
% ToEner
from Min Ca
al als e to
al y als e
% D
tal gy eals re
endtion in
24 Hours
ndation from
CACFP
otal Meals are ve to otal rgy
Meals are in
Cholesterol
Abt A
ssociates Inc. C
hapter 4: Role of the C
AC
FP in Children's D
iets 87
3-5 years ≤ 300 mga 59% 27 7 76% 28% 1.05 66% 0.97 6-10 years ≤ 300 mg 81 25 9 -- -- 8
Sodium
3-5 years ≤ 2,400 mga 99% 46 8 116% 40% 0.98 0.96 6-10 years ≤ 2,400 mg 123 26 8 -- -- --
Dietary fiber
3-5 years > 8-10 gb 122% 56 9 133% 50% 1.11 131% 1.12 6-10 years > 11-15 gb 104 25 1 -- -- -- 108 1.47
Number of child days 3-5 years 161 161 574 574 574 35 526-10 years 59 59 -- -- -- 41
a NRC recommendation (NRC, 1989b). b Based on American Health Foundation recommendation (WilliaNRC and American Health Foundation recommendations are only a age 2 and old This a was li childr to , the onlyCACFP age groups for which the recommendations fully apply. Note: The low 41 percent response rate to the 24-hour recall portion hich e b of poten as. re energintake does not significantly differ between respondents and nonresp e dix D), but whether their out-of-care energy intake systematical ot be determined. Due to this uncertainty, we recommend that these data b terpreted aution.
% 0.9 1.0
% 0.9 0.7
% 0.9 0.9
161 59
ms, 1995). pplicable to
of the ECCondents (se in
children
CS on we Appen with c
24%-- 60 0.52
0.47
41
y
41%119 14
108%
55%19
35241
2 3
er. naly
a
sis
sed raises
mite
conce
d to
rns
en a
ti
ge 3
al bi
5 and 6 to 10
In-CACFP-caly differs cann
these estimates ar

Exhibit 4.4b Average Cholesterol, Sodium, and Dietary Fiber Consumed in CACFP Care and Over 24 Hours, by Age of Child, All CACFP All CACFP
Daily Recom-
mendation
% Daily Recom-mendation in 24
Hours
% Daily Recom-mendation from
CACFP
% Total from Meals in Care Relative to
% Total Energy from Meals in Care
Cholesterol 3-5 years ≤ 300 mga 68% 26% 1.00 6-10 years ≤ 300 mg 68 14 0.74
Sodium
3-5 years ≤ 2,400 mga 109% 41% 0.97 6-10 years ≤ 2,400 mg 120 18 0.59
Dietary fiber
3-5 years > 8-10 gb 130% 53% 1.10 6-10 years > 11-15 gb 107 21 1.25
Number of child days
3-5 years 1,087 1,087 1,087 6-10 years 100 100 100
a NRC recommendation (NRC, 1989b).
b Based on American Health Foundation recommendations (Williams, 1995).
NRC and American Health Foundation recommendations are only applicable to children age 2 and older. This analysis was limited to children age 3 to 5 and 6 to 10, the only CACFP age groups for which the recommendations fully apply.
Note: The low 41 percent response rate to the 24-hour recall portion of the ECCCS on which these estimates are based raises concerns of potential bias. In-CACFP-care energy intake does not significantly differ between respondents and
onrespondents (see Appendix D), but whether their out-of-care energy intake systematically differs cannot be determined. nDue to this uncertainty, we recommend that these data be interpreted with caution.
The contribution from CACFP to 3- to 5-year-old participants’ dietary fiber intake is sizeable (53 percent of the recommended level). It meets the ADA recommendation for full-day care,45 and surpasses the CACFP contribution to total food energy intake (ratio of 1.10). CACFP provides preschool children with about one quarter the daily maximum for dietary cholesterol, and 41 percent of the recommended limit for sodium. Although total sodium intake is somewhat high for this group of children, the amount from CACFP meals and snacks is not disproportionately high relative to its contribution to total food energy (ratio of 0.97). No differences by type of child care were found.
45 As noted in Chapter 2, new DRI values (AIs) for total fiber are substantially higher than previous fiber recommenda-
tions for children. Reference values for children 1 to 10 years of age range from 19 to 31 grams per day (IOM/FNB, 2002). The effect of applying the new reference values to this analysis would be to reduce the mean percent of refer-ence levels of dietary fiber overall and from CACFP meals and snacks; the contribution from CACFP would likely fall below the ADA recommendation for full-day care.
88 Chapter 4: Role of the CACFP in Children's Diets Abt Associates Inc.

CACFP meals and snacks supply significantly less cholesterol, sodium, and dietary fiber for children 6 to 10 years of age compared with preschoolers (8 to 19 percent of recommended levels; p < 0.001 to p < 0.05). This is consistent with findings for total food energy, and the fewer meals and snacks they receive in care. As for the younger children, participants age 6 to 10 consume a high ratio of their dietary fiber to food energy requirements in CACFP care (ratio of 1.47). Finally, there is some evidence that school-age children in CACFP homes receive more cholesterol and sodium in care than those in centers; differences in point estimates for dietary fiber are not statistically significant. Comparison of Diet Quality Between CACFP Children of Working
s.
children’s
ting samples from the ECCCS and the CSFII were 633 and 954 children, spectively.
FII
8 hours of the bserva ’s intake. In the CSFII, 24-hour recall
data for il he parent or other caregiver.
Mothers and Not-in-Care Children of Nonworking Mothers
As shown in Chapter 2, children of working mothers tend to have worse dietary outcomes than children of nonworking mothers. CACFP participation might, however, ameliorate these differenceThe purpose of the analysis discussed here was to determine whether children in CACFP care whose mothers work or are in school do as well as other children in terms of the nutritional quality of their diets. Outcome measures selected for this comparison include the Healthy Eating Index (HEI) scores, total food energy intake, and intake of other foods and nutrients important to the quality of diets. The analysis was limited to children 1 to 5 years of age, the group for whom CACFP and maternal employment were expected to have the most impact. The samples of children were drawn from the 1995 ECCCS and the 1994-1996 CSFII46 data sets. The ECCCS sample excluded children in CACFP whose mothers were neither working nor in school.47 For the CSFII sample, children who consumed any meals or snacks from a child care center, family child care home, or in school on the days covered by the dietary recalls were excluded. Thus, the comparison was between children for whom the CACFP was likely substituting for mothers’ care, and children not in child care for whom mothers’ care was available.48 Because ECCCS data were collected only on weekdays, dietary recalls for weekend days in the CSFII were discarded. The resulre
It is important to recognize that the methods used to collect dietary data in the ECCCS and the CSwere not identical. As described in Chapter 1, direct observation in conjunction with a menu survey of providers was used to obtain information on children’s consumption of meals while in CACFP are; in addition, a telephone interview with the child’s parent was conducted within 4c
o tion day to obtain information on the rest of the day ch dren age 1 to 5 were collected in-person from t
46 To d m f diet quality were compared between children from the 1994-1996 and 1998 samples. This analysis suggested there had been some shifts in the composition of children’s diets that could potentially bias the comparison with data from the 1995 ECCCS. Therefore, obse ti
47 This was th tart prog . and those in househ e were multiple related adult females with mixed employment statuses (n=3).
48 This group may have included some children who attended child care on days other than those for which dietary intake data were collected. For the purposes of this analysis, it was assumed that children’s food consumption would only be influenced by meals received in child care on the days they actually consumed those meals and would not be affected by long-term patterns of child care participation.
eter ine whether data from the 1998 CSFII could be used, selected measures o
rva ons from the 1998 CSFII were excluded.
e main excluded group, about three quarters of whom were 3- to 5-year-old children attending a Head Sram Also excluded from the ECCCS sample were children in households with no female adults (n=17)
olds where ther
Abt Associates Inc. Chapter 4: Role of the CACFP in Children's Diets 89

The sections that follow present descriptive information on the sample children and their households,
CCCS sample, intake data were available for two days, whereas for the other half data were available for only . Many of the outcomes of interest are non-linear functions of intake s based on numbers of servings in various food groups. es for a child over two
ays gives a different result than calculating the outcomes based on a two-day average of the child’s intake.49 To ensure that the constructed outcomes were mparable for children with one and two da ta, the approach was to calculate all outcomes on a chil basis, and then to split to the ch ple weight between the two observations when both available. T data were available for all children in the CSFII sa The outcomes frointake data were also calculated from the individual child-day records rather than from
of intake amounts. Sampling weights were then applied to reflect the national number of ACFP and the U.S. population (see Appendix B). Children under 2 years of age are not
included in tabulations or the discussion of results for dietary m where reference value do not ply. This was the case for all nutrition outcomes other than food energy, iron, and zinc.
T CACFP participants with working mothers are consuming diets r quality overall than children of homemakers not in child care. B on the HEI, more en in CACFP received a “good” diet rating, and fewer had “poor” diets relative to those not in care. In
e less soft drinks and added sugar. As for all children age 1 to 5 ACFP participants in care over four hours per day are more likely to exceed
food energy than their not-in are cou ts with omemakOther the other hand, they are also less likely to have average eB of children consume diets high in iron, zinc, and dietary fiber. They also do t differ in their intake of fried potatoes, but consume substantially less than the recommended three servings of
egetables per day.
Characteristics of Sample Children and Their Families
E presents descriptive information on the ECCCS and CSFII sample children and their households. Several differences between the two groups emerged. In particular, compared with not-
maker mothers, CACFP children with working mothers are:
• Older (more preschoolers and fewer toddlers)
• More likely to be black and less likely to be Hispanic
be low-income or receiving public assistance
olds
• More likely to be located in the midwest or south and less likely to be located in the west
• More likely to have mothers with education beyond a ol degree or the equivalent.
and the comparisons of children’s diets. For about half the children in the E a single day
mponent rating, such as HEI coAveraging such outcom
d co
ys of da d-dayild’s sam were
wo days of mple. m these two-day
averageschildren in C
easures sap
he analysis finds that of higheased childr
addition, CACFP participants consumwhose mothers work, Crecommendations for total -c nterpar h er mothers.
nergy intakes below the desired levels. oth groups no
v
xhibit 4.5
in-care children of home
• Less likely to
• Living in smaller househ
high scho
9 For example, a child who ate no fruit on Day 1 and ample fruit on Day 2 would have HEI fruit component scores of 0
and 10 for the two days, averaging to a 5; but a score that was based on the two-day average of fruit intake might be 10. 4
90 Chapter 4: Role of the CACFP in Children's Diets Abt Associates Inc.

Exhibit 4.5 Characteristics of Sample Children Age 1 to 5 and Their Households
CACFP Participants with Working
Mothers
Not-in-Care Children with Nonworking
Mothers Age
1 year 28.3
4 years 29.6 11.7 17.5
Female 52.2 Race/Eth
Non-Hispanic White 55.0% 60.1% Non-Hispanic Black 30.0 11.2 Hispanic 7.6 21.5 Other 7.4 7.3
Hours in CACFP care
Less than 4 5.9% -- 4 to 8 30.5 -- 8 or more 63.6 -- Mean 7.6 --
Household income as percent of poverty
At or below 185% 47.1% 56.7% Over 185% 52.9 43.3 Median 202.9 160
Public assistance
Receiving assistance 9.7% 20.1% Not receiving assistance 90.3 79.9
Household size/composition
Mean number of household members 3.9% 4.7% Mean number of adults 1.8 2.1 Mean number of employed adults 1.6 0.9 Mean number of children 2.1 2.6
on
Northeast 18.8% 19.9% Midwest 28.7 19.4 South 36.9 31.1 West 15.6 29.6
6.6% 30.4% 2 years 12.0 3 years 25.9 12.3
5 years 25.8 Gender
Male 47.8% 52.1% 47.9
nicity
Regi
Abt Associates Inc. Chapter 4: Role of the CACFP in Children's Diets 91

Exhibit 4.5 Characteristics of Sample Children Age 1 to 5 and Their Households
CACFP Participantsw ing
Not-in-Care
s
Children with Nonworking
Motherith WorkMothers
Mother’s educationa Less than high s
l/GED chool/GED 8.1% %
25.2 D 4
Sample size 4
thers’ education were available for 85 percent of CACFP sam
t response rate to the 24-hou ortion of the ECCC h these estima e based s of potential bias. In-CACF e energy intake d ignificantly differ between
and nonrespondents (see App ), but whether t-of-care energy intak cannot be determined. Due to this u , we recomm these data be interpr
caution.
25.6High schoo 28.5 More than high school/GE 63. 39.2
633 95
a Data on mo ple.
Note: The low 41 percenraises concern
r recall p S on whicoes not s
tes arP-car
respondents endix D their ou e systematicallydiffers ncertainty end that eted with
milar to those seen between children of working and nonworking mothers in general, as documented in Chapter 2 (and Appendix C). To or the disparities in fam ome and ho composition, the diet quality me ined here are tabulated separ r subgroup d by income relative to 185 percent of the federal poverty level and the of adults in the household. Note that some subgroups contain less than 100 observations. Sample sizes w small to stratify her ch child age, race/ethnicity, region, or mo s education. Co iet Quality: Healthy Eating Index
The HEI, as described in Chapter 2 of this report, provides an assessment of the degree to which an mmendations of the USDA Food Guide Py mid and the Dietary
ll HEI scores and all ten component scores were compared between the CACFP and CSFII groups,50 and the results are shown in Exhi . Note that here, and throughout the chapter, results for the FP children are presented separately for those in ch four hours per day and fewer hou ay. Although theCACFP participants age 1 to 5 years are in care for a significant portion of the day, it was expected tha nal effects of the programs would be less pron n part ld care.
These differences are si
control partially f ily inc useholdasures exam ately fo s define
number ere too by ot
aracteristics, such as ther’
mparisons of D
individual’s diet meets the recoGu era
raidelines. Both ov
bit 4.6 remainder of this
than CAC
ild care more four or rs per d majority of
t any nutritio ounced for those i -day chi
were available on-line from USDA (www. ei9496d
April 2002). Scores for the ECCCS sample were computed bas on USDA food codes and nutrients, and documentation provided in Bowman et al., 1998.
50 HEI scores for the CSFII sample cnpp.usda.gov/h ata.htm, accessed ed
92 Chapter 4: Role of the CACFP in Children's Diets Abt Associates Inc.

Exhibit 4.6 Mean Healthy Eating Index Scoresa
CACFP Participants with
Working Mothers
≤ 4 hr in
CACFP Care > 4 hr in
CACFP Care
Not-in-care Children with Nonworking
Mothers All children age 2 to 5 HEI – total score 73.7*** 73.8*** 69.7 GrVegetable score Fru ** ** MiMeTo * * Saturated fat score ChSo ** Va ** ** Ma size By income category
% of poverty
Grain score *
Milk score
75
Ov 71.5
Grain score 7.5 7.2** 7.8 5.1
Fruit score 8.4*** 8.1*** 6.8
Saturated fat score 7.0* 4.6*** 5.9 Cholesterol score 9.1 9.4 9.3 Sodium score 8.3 8.5* 8.9 Variety score 8.4 9.2*** 7.7 Maximum sample size 32 220 296
ain score 7.4 7.2** 7.6 4.9 5.3 5.0
it score 7.9* 8.1* 6.2 lk score 8.0** 8.8*** 7.0 at score 5.4 5.3 5.8 tal fat score 8.0* 7.8* 7.2
5.6 4.6*** 5.4 olesterol score 9.2 9.3* 9.0 dium score 8.4 8.3* 8.8 riety score 8.8* 9.3* 7.7 ximum sample 107 479 696
Up to 185
HEI – total score 73.4*** 74.5*** 68.2 7.3 7.1 7.5
Vegetable score 4.9 5.8* 5.0 Fruit score 7.7*** 8.1*** 5.8
8.4*** 8.6*** 6.9 Meat score 6.1 6.1 6.2 Total fat score 7.5 7.6** 6.9 Saturated fat score 4.8 4.6 5.1 Cholesterol score 9.3** 9.1* 8.7 Sodium score 8.4 8.0** 8.6 Variety score 9.1*** 9.3*** 7.6 Maximum sample size 259 400
er 185% of poverty HEI – total score 74.1 73.3*
Vegetable score 4.9 4.8
Milk score 7.3 8.9*** 7.2 Meat score 4.3 4.6* 5.3 Total fat score 8.9*** 7.9 7.7
Abt Associates Inc. Chapter 4: Role of the CACFP in Children's Diets 93

Exhibit 4.6 Mean Healthy Eating Index Scoresa
CACFP Participants with
Working Mothers ≤ 4 hr in > 4 hr in
Not-in-care Children with Nonworking
Mothers CACFP Care CACFP Care By number of adults One
HEI – total score 73.6*** 74.3*** 65.1 Grain score 7.1 7.2 7.3 Vegetable score 4.3 5.4 4.8 Fruit score 8.1*** 8.1*** 5.2 Milk score 7.6 8.8*** 7.5 Meat score 5.1 6.3 6.4 Total fat score 8.4*** 7.4*** 6.0 Saturated fat score 6.1*** 4.7* 3.7 Cholesterol score 9.6*** 8.9 8.4 Sodium score 8.7 8.1 8.2 Variety score 8.6 9.5*** 7.6 Maximum sample size 45 157 74
Multiple
HEI – total score 73.8** 73.6*** 70.3 Grain score 7.6 7.2** 7.7 Vegetable score 5.4 5.2 5.1 Fruit score 7.8*** 8.1*** 6.4 Milk score 8.4*** 8.8*** 7.0 Meat score 5.7 4.9** 5.7 Total fat score 7.6 7.9** 7.4 Saturated fat score 5.2 4.6*** 5.7 Cholesterol score 8.9 9.5** 9.0 Sodium score 8.1* 8.4*** 8.8 Variety score 9.0*** 9.1*** 7.7 Maximum sample size 62 322 622
a Range of scores for the HEI is 0 to 100; ranges for each component of the HEI are 0 to 10. The overall HEI score is the simple sum of the scores for each of the 10 components.
** Statistically significant difference from children of nonworking mothers at the 1 percent level * Statistically significant difference from children of nonworking mothers at the 5 percent level Statistically significant difference from children of nonworking mothers at the 10 percent level
Note: The low 41 percent response rate to the 24-hour recall portion of the ECCCS on which these estimates are based
raises concerns of potential bias. In-CACFP-care energy intake does not significantly differ between respondents and nonrespondents (see Appendix D), but whether their out-of-care energy intake systematically differs cannot be determined. Due to this uncertainty, we recommend that these data be interpreted with caution.
***
94 Chapter 4: Role of the CACFP in Children's Diets Abt Associates Inc.

Both part- and full-day CACFP participants with working mothers have significantly higher mean overall HEI scores than not-in-care children of nonworking mothers (74.3 and 73.9 versus 69.7).51
milar for most subgroups, although differences are greatest for children in low-come and single-adult households. Mean HEI scores for CACFP participants are 6 to 9 points
higher relative to not-in-care children of homemakers and suggest a positive influence of the program for these more disadvantaged groups of chi The analysis of HEI components finds that overall of some variability
tion of differences between childre ual com cores. Overa CACFP thers score signific igher for fr ilk, total fat, and y variety
than the not-in-care group with nonworking m s. This fin independent of urs spent same time, CACFP children have significantly lower scores for grain, meat,
turated fat, and sodium when in care more than four hours per day. The higher HEI c ponent hildren seem to ersist despite differences in family income and the number ld. The lower component st exclusively ncen-
tr children with incomes over 185 povert ultiple-adult households. The differences in overall HEI scores between CFP participants with working mo nd not-in-
re children of homemakers are reflect in some, but not all, of the HEI diet ratings. As shown in ers of children in oth groups consume diets that “need improvement.” With
respect to a “good diet” rating, the proportion is significantly larger when CACFP participants in care more than four hours per day are compared with children not in care (25 versus 20 percent; p<0.10). The magnitude of this difference is similar for children who sp ss time in care and across all u ot statistically significant. In contrast, the finding that fewer CACFP
pared with children not in care was highly significant (0 to 0.2 versus 7 across all income and household composition subg ups.
C ity: Food Energy and N
C food energy, iron, z and dietary f ere assessed because of their n tive developm ne may not reveal
c levels of these dietary com for the prior analyses, children’s food energy and nutrient intakes are expressed as percentages o e recommended daily values (Exhibit 4.8).52 F tions of the propo of children takes exceeding rcent ab percent below the 1989 REA are also provided.53
Findings were siin
ldren.
scores represent the net effectin the direc n’s individ ponent s ll, the children with working mo antly h uit, m dietar
other ding is the hoin CACFP care. At the sa omscores among CACFP cof adults in the househo
p scores, however, are alm
percent ofo co
ated among y and in m
CA thers aca edExhibit 4.7, three-quart b
end lesch
bgroups, but generally nildren had “poor diets” com
nt) and consistentperce
ro
omparisons of Diet Qual Selected utrients
hildren’s intakes of totalks to physical and cogni
inc, overall health. HEI scores alo
iber wli ent and problemati ponents. As
f availablor food energy, approxima rtion with in 10 peove and 10
51 To find out if these positive findings were simply a reflection of differences in characteristics of the samples, total HEI
score was also estimated in a multivariate model that included measures of hours in CACFP care, child age, gender, race/ethnicity, household income, receipt of public assistance, number of adults and number of children in the house-hold, mother’s education, and region. The estimated regression-adjusted differences in HEI score were quite compar-able (4.3 for children in care 4 or fewer hours per day, and 4.0 for children in care more than 4 hours per day; p < 0.0001 for both).
As discussed earlier in this chapter, new reference values for food energy and total fiber have been released, but were not available at the time these analyses were completed.
53 These are arbitrary cutoff values, and are not intended as a measure of adequacy of energy intake.
52
Abt Associates Inc. Chapter 4: Role of the CACFP in Children's Diets 95

Exhibit 4.7 HEI Diet Ratinga
CACFP Participants with
Working Mothers
≤ 4 hr in
CACFP Care
Not-in-care Children of Nonworking Mothers
> 4 hr inCACFP Care
All children age 2 to 5 Poor diet 0.0%*** 0.2%*** 6.7% Diet needs improvement 75.4 74.6 73.7 Good diet 24.6 25.1* 19.6 Maximum sample size 107 479 696 By income category Up to 185% of poverty
Poor diet 0.0%*** 0.4%*** 8.7% Diet needs improvement 81.9 76.6 72.2 Good diet 18.1 23.0 19.1 Maximum sample size 75 259 400
0.0%*** 0.2%*** 4.3% D 64.4 75.5 Good diet .6 26.8 20.2 M 2
By number of adults One
Poor diet .0%*** 0.0%*** Diet needs improvement 77.6 74.8 67.5
.4 17.5 Maximum sample size 45 157 74
Multiple
Poor diet 0.0%*** ** D 74.6 G .5 19.9
62 22 622 a EI score over 80 implies a “good diet, score betwee implies a diet that “needs improve-
ment,” and an HEI score less than 51 implies a “poor diet.”
*** Statistically significant difference from children of nonworking mothers at the 1 percent level ** Statistically significant difference from children of nonworking mothers at the 5 percent level * ifference from childre onworking mothers at the 10 percent level
se rate to th 4-hour recall portion of the ECCCS on whic these estimates are based ias. In-CACFP-care energy intake oes not significantly differ between respondents and
respondents (see Appendix D), but whether their out-of-care energy intake systematically differs cannot be determined. Due to this uncertainty, we recomme that these data be interpreted with caution.
Over 185% of poverty
Poor diet iet needs improvement 73.0
35aximum sample size 3 220 296
0 15.0%
Good diet 22 25.2
0.5%* 5.6% iet needs improvement 73.5 74.5 ood diet 26 25.1
Maximum sample size 3An H ” an HEI n 51 and 80
Statistically significant d n of n
Note: The low 41 percent responraises concerns of potential b
e 2 h d
nonnd
96 Chapter 4: Role of the CACFP in Children's Diets Abt Associates Inc.
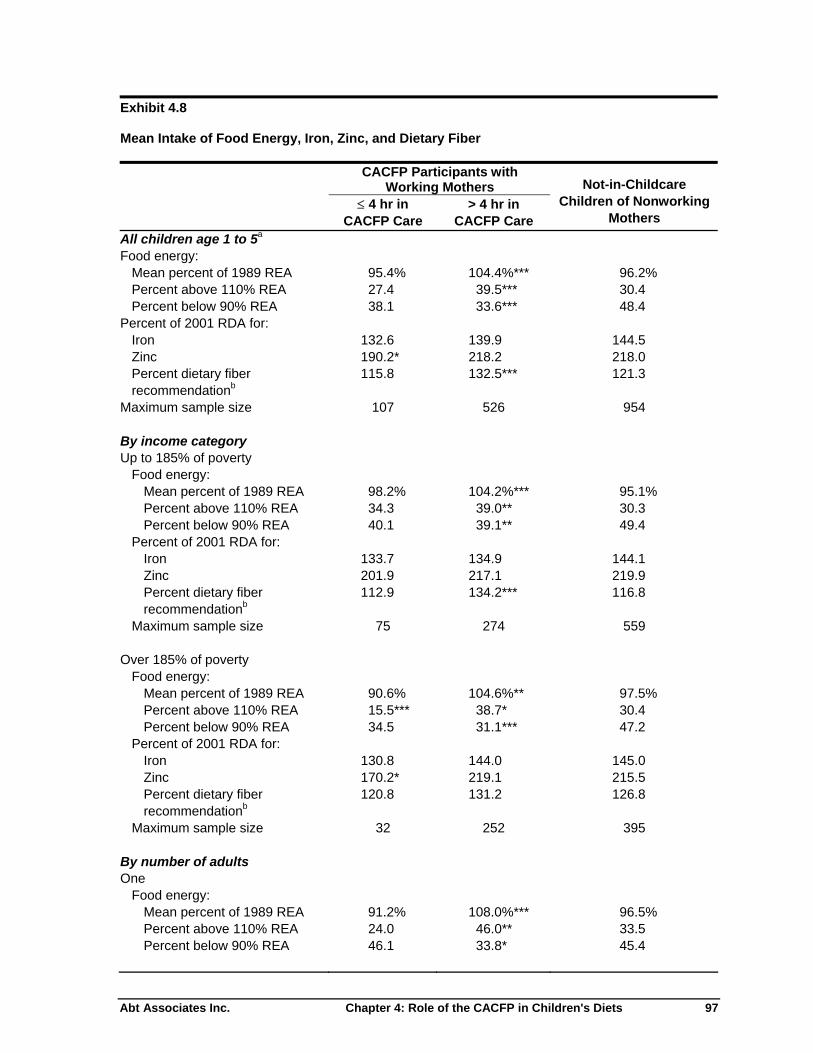
Exhibit 4.8 Mean Intake of Food Energy, Iron, Zinc, and Dietary Fiber
CACFP Participants with
Working Mothers
≤ 4 hr in
CACFP Care
Not-in-Childcare Children of Nonworking
Mothers > 4 hr in
CACFP Care All children age 1 to 5a
Food energy: Mean percent of 1989 REA 95.4% *** Percent above 110% REA 39.5*** Percent below 90% REA 38.1 33.6*** 48.4
P Iron 132.6 139.9 144.5
190.2* 218.2 218.0 Percent dietary fiber recommendationb
115.8 132.5*** 121.3
Ma 526 B Up to 185% of poverty
Food energy: Mean percent of 1989 REA 98.2% ** 95.1% Percent above 110% REA 34.3 39.0** 30.3 Percent below 90% REA 40.1 39.1**
Pe Iron 133.7 ZPrecommendationb
116.8
M 559
OvF
97.5% Percent above 110% REA 15.5*** 38.7* 30.4 Percent below 90% REA 34.5 31.1*** 47.2
Percent of 2001 RDA for: Iron 130.8 144.0 145.0 Zinc 170.2* 219.1 215.5 Percent dietary fiber recommendationb
120.8 131.2 126.8
Maximum sample size 32 252 395 By number of adults One
Food energy: Mean percent of 1989 REA 91.2% 108.0%*** 96.5% Percent above 110% REA 24.0 46.0** 33.5 Percent below 90% REA 46.1 33.8* 45.4
104.4% 96.2%
27.4 30.4
ercent of 2001 RDA for:
Zinc
ximum sample size 107 954
y income category
104.2%*
49.4 rcent of 2001 RDA for:
134.9 144.1 inc 201.9 217.1 219.9 ercent dietary fiber 112.9 134.2***
aximum sample size 75 274
er 185% of poverty ood energy: Mean percent of 1989 REA 90.6% 104.6%**
Abt Associates Inc. Chapter 4: Role of the CACFP in Children's Diets 97

Exhibit 4.8 Mean Intake of Food Energy, Iron, Zinc, and Dietary Fiber
CACFP Participants with
Working Mothers
CACFP Care 4 hr in
CACFP Care Children of Nonworking
Mothers ≤ 4 hr in >
Not-in-Childcare
Percent of 2001 RDA for: Iron 134.0 131.8 146.7 Zinc 171.5* 219.8 223.1 Percent dietary fiber recommendationb
102.8 128.8* 103.0
Maximum sample size 45 168 96
Multiple Food energy:
Mean percent of 1989 REA 99.2% 102.9%** 96.1% Percent above 110% REA 30.4 35.9* 30.0 Percent below 90% REA 30.9*** 35.2*** 48.8
Percent of 2001 RDA for: Iron 131.3 143.4 144.2 Zinc 207.0 217.6 217.3
recommendation123.9
Maximum sample size 62 358 858 a For dietary fiber, only children 2 to 5 years of age are included.
b Based on American Health Foundation recommendation of “age-plus-five” grams per day (Williams, 1995).
*** Statistically significant difference from children of nonworking mothers at the 1 percent level ** Statistically significant difference from children of nonworking mothers at the 5 percent level * Statistically significant difference from children of nonworking mothers at the 10 percent level
Note: The low 41 percent response rate to the 24-hour recall portion of the ECCCS on which these estimates are based raises concerns of potential bias. In-CACFP-care energy intake does not significantly differ between respondents and nonrespondents (see Appendix D), but whether their out-of-care energy intake systematically differs cannot be determined. Due to this uncertainty, we recommend that these data be interpreted with caution.
Percent dietary fiber b
127.5 134.2**
Food Energy Average food energy intake is greater for children with working mothers in CACFP care compared with not-in-care children of nonworking mothers. The difference was significant for children in care over four hours per day (104 versus 96 percent of 1989 REA).54 In addition, a significantly greater share (40 percent) of CACFP children consume in excess of 110 percent of their recommended energy levels than children not in care (30 percent). Results were similar for all children regardless of income or the number of adults in the household. These findings suggest that CACFP participation alone is not sufficient to ameliorate the association between maternal employment and higher levels of energy intake among all preschool children, as discussed in Chapters 2 and 3.
54 The 1989 REA for children age 1 to 3 is 1,300 calories per day, and for children age 4 and 5, 1800 calories.
98 Chapter 4: Role of the CACFP in Children's Diets Abt Associates Inc.

The analysis of children’s food energy intake also found that significantly fewer CACFP participants had food energy intakes below 90 percent of the REA compared with not-in-care children of nonworking mothers. The difference was significant for full-day CACFP participants (34 percent versus 48 percent). Again, the pattern observed persists across subgroups. Whether or not this is indicative of a positive association between CACFP participation and food energy intake is difficult to say in light of the growing problem of childhood obesity. ron and Zinc he analyses of mean iron and zinc intakes (Exhibit 4.8) did not reveal any differences between ACFP children whose mothers work and not-in-care children of nonworking mothers. Both groups
g, on average, about 40 percent more than the RDA for iron and over twice the RDA for zinc. These high levels of nutrient intake were maintained in spite of differences in income and household composition.
Dietary Fiber Along with iron and zinc, intake of dieta th grrecommended levels. Mean dietary fib ign among CACFP participants in care more than four hours a day com versus 121 percent of the
ended value).55 Results were replicated for subgroups except among child n in higher income households, where dietary fiber intake did not differ between groups. C iet Quality: Soft Drinks, Added Sugar, and Fried Potatoes
Overconsumption of soda, fruit-flavored dr nd other sw beverages by children is cause fo s noted in Chapter 2, these s contribu desirable levels of sugar intake and are low in nutrients. Excessive consumption of added sugars has been linked to
ay contribute to childhood obesity. It was therefore of interest diet quality among CACFP participants with working mothers and other
though vegetable consumption is generally considered health-promoting, the y distinguish ried potatoes and
ot of vegetables. For this reason, consum also assessed. Given that the CACFP meal patterns do not allow soft drinks and, instead, require milk, fruit or juice, and veg likely that participants be consum ller quantities less h ined here compared with other children. Sod rinks Exh e proportions of childr onsume soda and other soft drink e
daily quantities: none, up to 8 fluid ounces, and mo n 8 fluid ounces.56 FP others are significantly less likely to consume any soda than not-in-care
children with nonworking mothers (6 to 75 versus 61 percent did not consume soda). They
ITCare consumin
ry fiber amer intakes are spared with children not i
ong children in boificantly higher
n care (132
oups also exceeds
recomm re
omparisons of D
inks, a eetenedr concern. A oft drinks te to higher than
increases in food energy intake, and mto examine these aspects ofchildren. In addition, alFood Guide Pyramid (and HEI) does not currentl between high-fat f
her types fried potato ption was
etables, it seemed would ing sma of the ealthful foods exam
a and Soft Dibit 4.9 shows th en who c s in th
following participants with working m
re tha CAC
8 percent
55 If dietary fiber intake was expressed in relation ew, higher refe es (AIs), mean intake would probably
es. The differences between CACFP participants and nonparticipants, however, would remain. 56 Soft drinks excluding soda are fruit-flavored beverages other than 100 percent fruit juice (e.g., lemonade, fruit punch,
sports drinks) and iced tea, including artificially sweetened beverages.
to the n rence valunot exceed these valu
Abt Associates Inc. Chapter 4: Role of the CACFP in Children's Diets 99

are also significantly less likely to consume more than 8 ounces of soda per day (3 percent versus 11 percent). When subgroups were examined, differences in the likelihood of consuming any soda are
ong children in low-income and multiple adult households. CACFP participants, owever, are less likely to consume larger quantities of income
or number of adults in the household. Exhibit 4.9 Consumption of Soda and Other Soft Drinksa
significant only amh soda than other children regardless of
CACFP Participants with
Working Mothers
≤ 4 hr in
CACFP Care > 4 hr in
CACFP Care
Not-in-Childcare Children of Nonworking
Mothers All children age 2 to 5 Soda
None 74.6%** 68.0%* 61.1% Up to 8 oz 22.5 29.2 27.6 More than 8 oz 2.8*** 2.8*** 11.3
Other soft drinks None 51.9 60.1* 48.5 Up to 8 oz 32.8 28.8 30.7 More than 8 oz 15.3 11.1*** 20.8
Maximum sample size 107 479 696 By income category Up to 185% of poverty
Soda None 76.9%*** 73.0%*** 57.2% Up to 8 oz 19.1* 22.0** 30.1 More than 8 oz 4.0*** 5.1*** 12.7
Other soft drinks None 46.0 54.9 48.8 Up to 8 oz 41.9* 31.6 28.2 More than 8 oz 12.1*** 13.5** 23.1
Maximum sample size 75 259 400 Over 185% of poverty
Soda None 70.8% 63.9% 66.0% Up to 8 oz 28.4 35.1** 24.5 More than 8 oz 0.9*** 1.0*** 9.5
Other soft drinks None 61.9 64.3** 48.1 Up to 8 oz 17.2** 26.6 33.8 More than 8 oz 20.9 9.1** 18.1
Maximum sample size 32 220 296
100 Chapter 4: Role of the CACFP in Children's Diets Abt Associates Inc.

Exhibit 4.9 Consumption of Soda and Other Soft Drinksa
CACFP Participants with
Working Mothers
≤ 4 hr in
CACFP Care > 4 hr in
CACFP Care
Not-in-Childcare Children of Nonworking
Mothers By number of adults One
Soda None 81.0% 72.6% 68.1% Up to 8 oz 14.2 25.4 18.2 More than 8 oz 4.9* 2.0*** 13.7
Other soft drinks
None 56.8 51.7 49.5 Up to 8 oz 33.0 30.3 30.9 More than 8 oz 10.2 18.1 19.6
Maximum sample size 45 157 74 Multiple
Soda 69.0% 65.9% 60.2%
Up to 8 oz 30.0 30.9 28.9 More than 8 oz 1.0*** 3.2*** 11.0
47.5 63.8** 48.3
Up to 8 oz 32.6 28.2 30.7 More than 8 oz 19.9 8.0*** 21.0
Maximum sample size 62 322 622 a Includes fruit drinks (not juice), iced tea, lemonade.
*** Statistically significant difference from children of nonworking mothers at the 1 percent level ** Statistically significant difference from children of nonworking mothers at the 5 percent level * Statistically significant difference from children of nonworking mothers at the 10 percent level
Note: The low 41 percent response rate to the 24-hour recall portion of the ECCCS on which these estimates are based raises concerns of potential bias. In-CACFP-care energy intake does not significantly differ between respondents and nonrespondents (see Appendix D), but whether their out-of-care energy intake systematically differs cannot be determined. Due to this uncertainty, we recommend that these data be interpreted with caution.
None
Other soft drinks None
T drinks (o n soda) differ from those for soda irespects. First, more children age 2 to 5 in bo roups drink th verages than they oda (50
others who parti-cipate more than four hours per day are less likely to consume soft drinks than not-in-care children of
s a difference in
CACA
he patterns of consumption for soft ther tha n three th g ese be do s
versus 37 percent; data not shown). Second, only CACFP children with working m
homemakers (60 versus 48 percent; p<0.10). The amount of time in care also makethe share of children who consume in excess of 8 ounces of these beverages a day: 11 percent of
CFP participants versus 21 percent of not-in-care children of nonworking mothers. Finally, CFP participants in higher income (but not low-income) households are significantly less likely to
Abt Associates Inc. Chapter 4: Role of the CACFP in Children's Diets 101
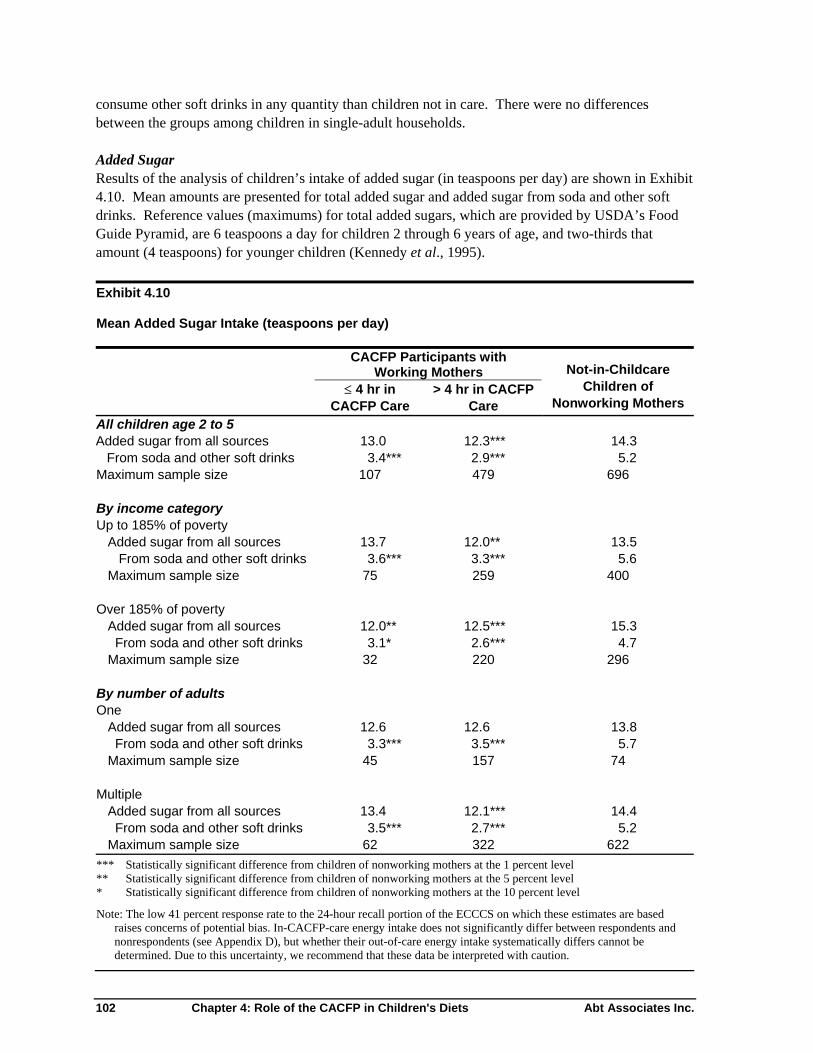
consume other soft drinks in any quantity than children not in care. There were no differences between the groups among children in single-adult households. Added Sugar Results of the analysis of children’s intake of added sugar (in teaspoons per day) are shown in Exhibit
.10. Mean amounts are presented for total added sugar and added sugar from soda and other soft drinks. Reference values (maximums) for total added sugars, which are provided by USDA’s Food
ean Added Sugar Intake (teaspoons per day)
4
Guide Pyramid, are 6 teaspoons a day for children 2 through 6 years of age, and two-thirds that amount (4 teaspoons) for younger children (Kennedy et al., 1995). Exhibit 4.10 M
CACFP Participants with
Working Mothers
CACFP CACFP
Not-in-Childcare Children of
Nonworking Mothers ≤ 4 hr in
are > 4 hr in C
Care All children age 2 to 5 Added sugar from all sources
d other s13.0 12.3*** 14.3
oft drinks 3.4*** *** size 6
Added sugar from all sources 13.7 12.0** 13.5 From soda and other soft drinks 3.6*** ***
size 259 0
urces 0** 12.5*** 15.3
From soda and other soft drinks *** 220
Added sugar from all sources 6 .8 From soda and other soft drinks 3.3*** *** 5.7
45 7 74 Multiple
Added sugar from all sources 13.4 12.1*** .4 From soda and other soft drinks 3.5*** *** .2 Maximum sa
** mothers at the 5 percent level l
Note: The low 41 percent response rate to the 24-hour recall portion of the ECCCS on which these estimates are based raises concerns of potential bias. In-CACFP-care energy intake does not significantly differ between respondents and nonrespondents (see Appendix D), but whether their out-of-care energy intake systematically differs cannot be determined. Due to this uncertainty, we recommend that these data be interpreted with caution.
From soda an 2.9479
5.2 Maximum sample 107 69
By income category
Up to 185% of poverty
3.3 5.6 Maximum sample 75 40
Over 185% of poverty Added sugar from all so
12.3.1* 2.6 4.7
Maximum sample size 32 296
By number of adults One
12. 12.6 133.5
Maximum sample size 15
142.7 5
mple size 62 322 622 *** Statistically significant difference from children of nonworking mothers at the 1 percent level
Statistically significant difference from children of nonworking * Statistically significant difference from children of nonworking mothers at the 10 percent leve
102 Chapter 4: Role of the CACFP in Children's Diets Abt Associates Inc.

For those in care for more than four hours a day, CACFP participants with working mothers consume significantly less total added sugar than not-in-care children with nonworking mothers (12 versus 14
2 and 3 years, a serving is two-irds of this amount. Exhibit 4.11 shows the results for fried potato consumption in the context of
of other (non-fried potato) vegetable servings consumed.
teaspoons per day). The added sugar contribution from soda and other soft drinks is significantlysmaller for CACFP children regardless of time spent in care (3 versus 5 teaspoons). These patterns were consistent across all income and household composition subgroups. Fried Potatoes Children’s consumption of fried potatoes, including French fries, tater tots, and hash browns, was measured in “servings,” as defined by the Food Guide Pyramid. A serving of fried potatoes (and other cooked vegetables) is the equivalent of ½ cup; for children age ththe total number Exhibit 4.11 Consumption of Fried Potatoes and Other Vegetables (servings per day)
CACFP Participants with
Working Mothers
≤ 4 hr in
CACFP Care > 4 hr in
CACFP Care Not-in-care Children with
Nonworking Mothers All children age 2 to 5 Fried potatoes 0.3 0.4 0.4 Other vegetables 1.6 1.9*** 1.6 Maximum sample size 107 479 696
By income category Up to 185% of poverty
Fried potatoes 0.3 0.3 0.4 Other vegetables 1.6 2.2*** 1.6 Maximum sample size 75 259 400
Over 185% of poverty Fried potatoes 0.3 0.4 0.4 Other vegetables 1.6 1.7 1.5 Maximum sample size 32 220 296
By number of adults One
Fried potatoes 0.2 0.3 0.4 Other vegetables 1.4 2.0 1.6
ege-getable juice.
** Statistically significant difference from children of nonworking mothers at the 1 percent level
Maximum sample size 45 157 74
Multiple Fried potatoes 0.4 0.4 0.4 Other vegetables 1.9 1.9** 1.6 Maximum sample size 62 322 622
a A serving of vegetables is defined in the Food Guide Pyramid as 1 cup of raw leafy vegetables; ½ cup of other vtables, cooked or chopped raw; or ¾ cup of ve
*** Statistically significant difference from children of nonworking mothers at the 5 percent level * Statistically significant difference from children of nonworking mothers at the 10 percent level Note: The low 41 percent response rate to the 24-hour recall portion of the ECCCS on which these estimates are based
raises concerns of potential bias. In-CACFP-care energy intake does not significantly differ between respondents and nonrespondents (see Appendix D), but whether their out-of-care energy intake systematically differs cannot bedetermined. Due to this uncertainty, we recommend that these data be interpreted with caution.
Abt Associates Inc. Chapter 4: Role of the CACFP in Children's Diets 103

There is no difference in consumption of fried potatoes between CACFP children with working mothers and not-in-care children with nonworking mothers. Both groups consume, on average, less than one-half serving of fried potatoes per day. Mean intake of vegetables other than fried potatoes among CACFP participants in care more than four hours is significantly greater than for children not in child care (1.9 versus 1.6 servings). Although this represents an increase of less than one-half serving overall, the difference among low-income children is somewhat more substantial (about 0.6 servings). Fried potatoes comprise a larger share of total vegetable intake among not-in-care children
f nonworking mothers than CACFP children whose mothers work. Summary
The results presented in this chapter suggest that CACFP participants’ diets, on average, meet daily recommendations for food energy, protein, vitamins A and C, iron, zinc, calcium, cholesterol, and dietary fiber. They also show that meals and snacks consumed in CACFP care make a substantial and positive contribution to these children’s total dietary intake. The contribution of the CACFP to parti-ipants’ diets does not vary much by type of care (Head Start, child care centers, or family child care
ted
-13
ssist them in erving lower fat and lower sodium meals and snacks seem warranted. In addition, USDA may want
to consider periodic nutrient analysis of providers’ menus to help target menu planning guidance appropriately. The analyses suggest that preschool children (age 2 to 5) in CACFP whose mothers work or are in school have better diets than children cared for by their own mothers who do not work outside the home. An association was found between program participation and better overall diet quality (more fruit, milk, and variety, and less total fat); reduced likelihood of food energy consumption below 90 percent of the average requirement; and lower levels of soda, other soft drinks, and added sugars.
he differences especially favor children in low-income households, suggesting that the target population is benefiting from the CACFP. This study was also interested in the extent to which CACFP might dampen any negative effects of maternal employment on children’s nutrition. In Chapters 2 and 3, it was found that preschool children (age 2 to 4) with full-time working mothers tended to have diets of higher quality overall than their counterparts with homemaker mothers. These children did worse than children of
o
chomes), except among school-age children. Six-to-10-year-olds consume a smaller share of their food energy and iron needs from CACFP meals and snacks if cared for in child care centers versus family child care homes. This can be explained by the higher likelihood that children in homes are offered breakfast and lunch compared with centers, where they are more likely to be offered snacks (Fox et al., 1997). Regardless of type of care, however, CACFP participants age 6 to 10 consume diets that meet recommendations for most nutrients. CACFP participants age 3 to 10, like other children of the same age (USDA/ARS, 1999), consume, on average, somewhat more than the Dietary Guidelines’ recommended levels of total and saturafat, and more sodium and less carbohydrate than the NRC-recommended amounts. CACFP meals and snacks do not contribute disproportionately to their daily intake of any of these dietary components, although they do provide more than the recommended level of saturated fat (mean of about percent of food energy). Continued efforts to educate providers and provide tools to as
T
104 Chapter 4: Role of the CACFP in Children's Diets Abt Associates Inc.

homemaker mothers on overconsumption of food energy, sodium, soda, and added sugars. Results in this chapter suggest that CACFP care tends to moderate the effects of mother’s work on preschool children’s overconsumption of soda and added sugars, but does not moderate the effects on food energy and sodium intake. Other potentially positive effects of CACFP care for preschool children of full-time working mothers include greater fruit and milk consumption, lower total fat intake, lower
kelihood of “poor” diet rating, and, for full-day care only (more than 4 hours), higher likelihood of “good diet” rating and greater consumption of vegetables excluding fried potatoes. These were outcomes for which CACFP preschoolers did significantly better than not-in-care children, but there were no differences for all preschoolers by maternal employment. These analyses suggest that the CACFP is making a substantial and positive contribution to the diets of preschool children with working mothers. This study cannot prove, however, that CACFP is what makes the difference in their diets. An alternative explanation is that the differences in nutrition outcomes are due to compositional differences between the samples of children (Exhibit 4.5). To investigate this possibility, a regression analysis controlling for all of the measured characteristics of the children and their families was conducted. Results of this analysis confirmed the findings of
etter diet quality among CACFP participants.
or measured characteristics hild age, gender, race/ethnicity, hours in care, household income and composition, mother’s educa-
on outcomes. For example, it may be that, in consideration of the difficulties in combining work and family responsibilities, only the most energetic and focused women who are mothers of
reschoolers choose to work.
a porting of food intake would have been limited to out-of-care
onsumption for the CACFP sample, because data for meals consumed in care were collected by -
s noted in the executive summary, in the data sources, and throughout the CACFP tables, only 41 percent of the 24-hour recall sample of CACFP children, on which results in this chapter are based, responded to the survey. Although energy intake patterns of the respondent children and other hildren observed while eating in CACFP facilities were very similar (see Appendix D), it is possible
analyses of these ata should not be considered as representative of CACFP participants or of the impact of the
he potential limitations, these findings are interesting and worth pursuing further, eally with a prospective, experimental design.
li
b Nonetheless, selection effects cannot be ruled out. Although controlling f(ction, and region) did not alter the results, it may be that families of preschoolers that use CACFP carehave other advantages over families of preschoolers not in care that are associated with better nutri-ti
p Another possible factor is the difference in data collection methodologies between the two datsources. It seems likely that underrecdirect observation. On the other hand, with both the child and parent present for the dietary interview, underreporting may not have been a significant problem for the CSFII sample. A
cthat nonrespondents could have systematically different out-of-CACFP-care dietary intake patterns than respondents. USDA Food and Nutrition Service therefore recommends that dprogram. Regardless of tid
Abt Associates Inc. Chapter 4: Role of the CACFP in Children's Diets 105

References
American Dietetic Association. Position of the American Dietetic Association: Nutrition Standards for Child Care Programs. Journal of the American Dietetic Association 99:981-988, 1999. American Dietetic Association. Position of the American Dietetic Association: Nutrition Standards for Child Care Programs. Journal of the American Dietetic Association 94:323-328, 1994. Andersen, R.E., Crespo, C.J., Bartlett, S.J., Cheskin, L.J., and Pratt, M. Relationship of Physical Activity and Television Watching with Body Weight and Level of Fatness Among Children: Results from the Third National Health and Nutrition Examination Survey. Journal of the American Medical Association 279(12):938-942, 1998.
nderson, P.M., Butcher, K.F., and Levine, P.B. Maternal Employment and Overweight Children.
icipant and Program Characteristics 1998. Cambridge, MA: Abt Associates Inc., May 2000. Bartlett, S., N. Burstein, G. Silverstein, and D. Rosenbaum. The Food Stamp Application Process: Office Operations and Client Experience. Cambridge, MA: Abt Associates Inc., April 1992. Becker, G.S. A Theory of the Allocation of Time. Economic Journal 75:493-508, 1965. Blaylock, J.R., J.N. Variyam, and B-H. Lin. Maternal Nutrition Knowledge and Children’s Diet Quality and Nutrient Intakes, FANRP-1. Washington, DC: U.S. Department of Agriculture, Economic Research Service, 1999.
re, Center for Nutrition Policy and promotion, CNPP-5. www.cnpp.usda.gov/hei949bdata.htm, 1998. Briley, M.E., C.R. Roberts-Gray, and S. Rowe. What Can Children Learn from the Menu at the Child Care Center? Journal of Community Health 18(6):363-73, 1993. Burstein, N., M.K. Fox, J.B. Hiller, R. Kornfeld, K. Lam, C. Price, and D.T. Rodda. Profile of WIC Children. Cambridge, MA: Abt Associates Inc., November 1999. Burstein, N., J.I. Layzer, and K. Cahill. National Study of Child Care for Low-Income Families: Patterns of Child Care Use Among Low-Income Families. Cambridge, MA: Abt Associates Inc., August 2001. Burstein, N., C. Price, and P. Rossi. The Food Stamp Program. In Fox, M.K. and Hamilton, W.L. (eds.), Nutrition and Health Outcomes Study: Review of the Literature. Cambridge, MA: Abt Associates Inc., 2003 (in preparation).
ADartmouth College Department of Economics, January 2002. Bartlett, S., M. Brown, D. Moore, and A. Estacion. Study of WIC Part
Bowman, S.A., M. Lino, S.A. Gerrior, and P.P. Basiotis. The Healthy Eating Index: 1994-96. Alexandria, VA: U.S. Department of Agricultu
106 References Abt Associates Inc.

Capps, O., Jr., J.R. Tedford, and J.Havlicek, Jr. Household Demand for Convenience and Nonconvenience Foods. Journal of Agricultural Economics 67:862-869, 1985. Centers for Disease Control and Prevention, National Center for Chronic Disease Prevention and Health Promotion. Body Mass Index-for-Age (Children). Online at http://www.cdc.gov/nccdphp/dnpa/bmi/bmi-for-age.htm, 2001. Centers for Disease Control and Prevention, National Center for Chronic Disease Prevention and Health Promotion. Body Mass Index-For Age (Children). Online at http://www.cdc.gov/nccdphp/dnpa/bmi/bmi-for-age.htm, 2002. Centers for Disease Control and Prevention, National Center for Health Statistics. Prevalence of Overweight Among Children and Adolescents: United States, 1999-2000. Online at http://www.cdc.gov/nchs/products/pubs/pubd/hestats/overwght99.htm, 2002. Colavito, E.A., J.E. Guthrie, A.A. Hertzler, and R.E. Webb. Relationship of Diet-Health Attitudes and Nutrition Knowledge of Household Meal Planners to the Fat and Fiber Intakes of Meal Planners and Preschoolers. Journal of Nutrition Education 28:321-328, 1996. Crepinsek, M.K., N.R. Burstein, E.B. Lee, S.D. Kennedy, and W.L. Hamilton. Meals Offered by CACFP Tier 2 Family Child Care Providers: Effects of Lower Meal Reimbursements. Washington, DC: U.S. Department of Agriculture, Economic Research Service, EFAN 02006, 2002a. Online at http://www.ers.usda.gov/publications/efan02006/. Crepinsek, M.K., L.M. Ghelfi, and W.L. Hamilton. Households with Children in CACFP Child Care Homes: Effects of Meal Reimbursement Tiering. Washington, DC: U.S. Department of Agriculture, Economic Research Service, E-FAN-02-005, 2002b. Online at http://www.ers.usda.gov/publications/efan02005/. Devaney, B. and E. Stuart. Eating Breakfast: Effects of the School Breakfast Program. Princeton, NJ: Mathematica Policy Research, Inc., 1998. Fletcher, G.F., Balady, G., Blair, S.M., J Blumental, C. Caspersen, B. Chaitman, S. Epstein, E.S. Froelicher, V.F. Froelicher, I.L. Pina, and M.L. Pollock. Statement on Exercise: Benefits and Recommendations for Physical Activity Programs for All Americans; A Statement for Health Professionals by the Committee on Exercise and Cardiac Rehabilitation of the Council on Clinical Cardiology, American Heart Association. Circulation 94:857-862, 1996. Fox, M.K., M.K. Crepinsek, P. Connor, and M. Battaglia. School Nutrition Dietary Assessment Study-II: Final Report. Alexandria, VA: U.S. Department of Agriculture, Food and Nutrition Service, Special Nutrition Programs Report No. CN-01-SNDAIIFR, April 2001. Fox, M.K., F.B. Glantz, L. Geitz, and N. Burstein. Early Childhood and Child Care Study: Nutritional Assessment of the CACFP. Volume II. Final Report. Alexandria, VA: U.S. Department of Agriculture, Food and Consumer Service, 1997.
Abt Associates Inc. References 107

Gabor, V., B.L. Hardison, and C. Botsko. A Study of Program Access and Declining Food Stamp Participation: Interim Report on the National Survey of Local Office Policies and Practices. Washington, D.C.: Health Systems Research, Inc., May 2002. Gillespie, A.H. and C.L. Achterberg. Comparison of Family Interaction Patterns Related to Food and Nutrition. Journal of the American Dietetic Association 89(4):509-512, 1989. Glantz, F.B. The Child and Adult Care Food Program. In Fox, M.K. and Hamilton, W.L. (eds.), Nutrition and Health Outcomes Study: Review of the Literature. Cambridge, MA: Abt Associates Inc., 2003(in preparation). Glantz, F.B., R. Berb, D. Porcari, E. Sackoff, and S. Pazer. School Lunch Eligible Non-Participants Study: Final Report. Alexandria, VA: U.S. Department of Agriculture, Food and Nutrition Service, 1994. Glantz, F.B., D.T. Rodda, M.J. Cutler, W. Rhodes, and M. Wrobel. Early Childhood and Child Care Study: Profile of Participants. Vol. 1: Final Report. Alexandria, VA: U.S. Department of Agriculture, Food and Consumer Service, 1997. Gleason, P., A. Rangarjan, and C. Olsen. Dietary Intake and Dietary Attitudes Among Food Stamp Participants and Other Low-Income Individuals. Alexandria, VA: U.S. Department of Agriculture, Food and Nutrition Service, September 2000. Gleason, P. and C. Suitor. Children’s Diets in the Mid-1990s: Dietary Intake and Its Relationship with School Meal Participation, CN-01-CD1. Alexandria, VA: U.S. Department of Agriculture, Food and Nutrition Service, 2001. Godwin, A.L., W.A. McIntosh, and K.S. Kubena. The Relationship Between Parental Labor Force Participation and Adolescents’ Dietary Intake and Risks to Cardiovascular Health. Thesis, Texas A&M University, May 1997. Guo, S.S., A.F. Roche, W.C. Chumlea, J.D. Gardner, and R.M. Siervogel. The Predictive Value of Childhood Body Mass Index Values for Overweight at Age 35 Years. American Journal of Clinical Nutrition 59:810-819, 1994. Guthrie, J.F., B.M. Derby, and A.S. Levy. What People Know and Do Not Know About Nutrition. In Frazao, E. (ed.), American’s Eating Habits: Changes and Consequences. Washington, DC: U.S. Department of Agriculture, Economic Research Service, AIB No. 750, April 1999. Horton, S. and C. Campbell. Wife’s Employment, Food Expenditures, and Apparent Nutrient Intake: Evidence from Canada. American Journal of Agricultural Economics 73:784-794, 1991. Institute of Medicine, Food and Nutrition Board. Dietary Reference Intakes: Calcium, Phosphorus, Magnesium, Vitamin D, and Fluoride. Washington, DC: National Academy Press, 1997. Institute of Medicine, Food and Nutrition Board. Dietary Reference Intakes: Vitamin C, Vitamin E, Selenium, and Carotenoids. Washington, DC: National Academy Press, 2001.
108 References Abt Associates Inc.
Institute of Medicine, Food and Nutrition Board. Dietary Reference Intakes for Energy, Carbohydrate, Fiber, Fat, Fatty Acids, Cholesterol, Protein, and Amino Acids (Macronutrients). Washington, DC: National Academy Press, 2002. Johnson, R.K., A.C. Crouter, and H. Smiciklas-Wright. Effects of Maternal Employment on Family Food Consumption Patterns and Children’s Diets. Journal of Nutrition Education 25(3):130-133, 1993. Johnson, R.K., H. Smiciklas-Wright, and A.C. Crouter. Effect of Maternal Employment on the Quality of Young Children’s Diets: The CSFII Experience. Journal of the American Dietetic Association 92:213-214, 1992a. Johnson, R.K., H. Smiciklas-Wright, A.C. Crouter, and F.K. Willits. Maternal Employment and the Quality of Young Children’s Diets: Empirical Evidence Based on the 1987-1988 Nationwide Food Consumption Survey. Pediatrics 90:245-249, 1992b. Kennedy, E.T., J. Ohls, S. Carlson, and K. Fleming. The Healthy Eating Index: Design and Applications. Journal of the American Dietetic Association 95(1):1103-1108, 1995. Lin, B-H., J. Guthrie; and J.R. Blaylock. The Diets of America’s Children: Influence of Dining Out,
nt
Lin, B-H., J. Guthrie, and E. Frazao. Nutrient Contribution of Food Away From Home. In Frazao, E. (ed.), American’s Eating Habits: Changes and Consequences. Washington, DC: U.S. Department of Agriculture, Economic Research Service, AIB No. 750, April 1999.
cLaughlin, J.E., L.S. Bernstein, M.K. Crepinsek, L.M. Daft, and J.M. Murphy. Evaluation of the School Breakfast Program Pilot Project: Findings from the First Year of Implementation. Alexandria, VA: U.S. Department of Agriculture, Food and Nutrition Service, Special Nutrition
rograms Report No. CN-02-SBP, October 2002.
onal y Press, 1989a.
Nord, M. and G. Bickel. Measuring Children’s Food Security in U.S. Households, 1995-99. Washington, DC: U.S. Department of Agriculture, Economic Research Service, FANRR No. 25, 2002. Olmstead, J. and G. Weathers. Reformed but Time Poor: Toward A Discussion of Welfare Reform and Mothers’ Time. Occidental College Department of Economics, November 1, 2001. Oppenheimer, V.K. Women’s Employment and the Gain to Marriage: The Specialization and Trading Model. Annual Review of Sociology 23:431-51, 1997.
Household Characteristics, and Nutrition Knowledge, AER-746. Washington, DC: U.S. Departmeof Agriculture, Economic Research Service, 1996.
M
P National Research Council. Recommended Dietary Allowances, 10th ed. Washington, DC: NatiAcadem National Research Council. Diet and Health: Implications for Reducing Chronic Disease Risk. Washington, DC: National Academy Press, 1989b.
Abt Associates Inc. References 109

Peterson, K., M. Davison, K. Wahlstrom, J. Himes, L. Hjelseth, J. Ross, and M. Tucker. Fast Break to Learning School Breakfast Program: A Report of the First Year Results, 1999-2000. Minneapolis,
N: University of Minnesota, 2001. Pollitt, E. and R. Matthews. Breastfast and Cognition: An Integrative Summary. American Journal of Clinical Nutrition 67(suppl.):804S-813S, 1998. Redman, B.J. The Impact of Women’s Time Allocation on Expenditure for Meals Away from Home and Prepared Foods. Journal of Agricultural Economics 62:234-237, 1980.
Regan. The Weight and Fitness Status of United States Children. utrition Reviews 52:11-17, 1994.
Strauss, R.S. and H.A. Pollack. Epidemic Increase in Childhood Overweight, 1986-1998. Journal of the American Medical Association 286(22):2845-2848, 2001. Tout, K., M. Zaslow, A. Romano Papillo, and S. Vandivere. Early Care and Education: Work Support for Families and Developmental Opportunities for Young Children. The Urban Institute, September 2001. U.S. Bureau of the Census. Statistical Abstract of the United States: 1997 (117th edition). Table 671: Full Time Wage and Salary Workers—Number and Earnings, 1985 to 1996. U.S. Bureau of the Census. Statistical Abstract of the United States: 2002. Tables 562: Employment Status of the Civilian Population, and 570: Employment Status of Women by Marital Status and Presence and Age of Children, 1979 to 2001. Online at http://www.census.gov/prod/2003pubs/02statab/labor.pdf. U.S. Department of Agriculture. The Food Guide Pyramid. USDA Home and Garden Bulletin 252, 1992. U.S. Department of Agriculture, Agricultural Research Service. Continuing Survey of Food Intakes by Individuals 1994-96, 1998 (CD-ROM). Washington, DC: U.S. Government Printing Office, 2000. U.S. Department of Agriculture, Agricultural Research Service. Documentation: Pyramid Servings Database for USDA Survey Food Codes, October 2000. Online at http:/www.barc.usda.gov/bhnrc/cnrg. U.S. Department of Agriculture, Agricultural Research Service. Food and Nutrient Intakes by Children 1994-96, 1998. Table No. 4: Nutrient Intakes: Mean Percentages of Food Energy From Protein, Total Fat, Fatty Acids, Carbohydrate, and Alcohol, by Sex and Age, 1999. Online at http://www.barc.usda.gov/bhnrc/cnrg. U.S. Department of Agriculture, Center for Nutrition Policy and Promotion. Tips for Using the Food Guide Pyramid for Young Children Booklet, Program Aid No.1647, March 1999. Online at http://www.cnpp.usda.gov/KidsPyra/PyrBook.pdf.
M
Schlicker, S.A., S.T. Borra, and C.N
110 References Abt Associates Inc.

U.S. Department of Agr2002. http://www.fns.usda.gov/cnd/breakfast. U.S. Departments of Health and Human Services and Agriculture. Nutrition and Your Health: Dietary Guidelines
iculture, Food and Nutrition Service. School Breakfast Program—Fact Sheet,
for Americans, 4th ed. Washington, DC: U.S. Government Printing Office, 1995. U.S. Departments of Health and Human Services and Agriculture. Nutrition and Your Health: Dietary Guidelines for Americans, 5th ed. Washington, DC: U.S. Government Printing Office, 2000. Williams, C.L. Importance of Dietary Fiber in Childhood. Journal of the American Dietetic Association 95:1140-1149, 1995.
Abt Associates Inc. References 111

Appendix A Determination of Child-Maternal Female Dyads in the CSFII
he analysis sample of child-mother dyads for this report was constructed from the Continuing Survey of Food Intakes by Individuals (CSFII) data for survey years 1994-1996 and 1998. The first step was to identify every potential dependent child. These are persons aged 0 to 17 years who were not labeled as reference persons (RPs), their spouses, or their partners. Also excluded were boarders, employees, or guests age 15 to 17 years. There were altogether 17,486 dependent children available for dyads. The second step was to identify and rank the pool of potential mothers or maternal females for each
ependent child. This included all females in the household who were age 15 years or older, and at least five years older than the child. Information was not available on the direct relationships between all household members (e.g., between the child and every household member), so each potential mother was rated according to her relationship to the RP. This resulted in a hierarchy of ratings (1 is best) specific to each relationship scenario (Exhibit A.1). For example, if the sample child was the child of the RP—a category accounting for nearly 90 percent of children in the CSFII—then optimal candidates for the child’s mother were the RP (ranked 1), or the RP’s spouse or partner (ranked 2 and 3, respectively). If the RP was male and no spouse or partner was listed, then the next best candidate would be the child’s grandmother or aunt (ranked 4 and 5, respectively). Absent these household members, potential maternal females were other relatives (e.g., the RP’s mother-in-law or aunt) or the child’s (sufficiently older) sister. Exhibit A.1 Rank Ordering of Potential Mothers in Household by Relationship to Reference Person (RP)
T
d
Child’s Relationship to RP Maternal Female’s Relationship to RP Foster child/Child 1 = RP, 2 = Spouse, 3 = Partner, 4 = Parent, 5 = Sibling,
6 = Other relative, 7 = Child, 8 = Foster child Grandchild 1 = Child, 2 = RP, 3 = Spouse, 4 = Partner, 5 = Sibling,
6 = Other relative, 7 = Grandchild
Other relative 1 = Sibling, 2 = Other relative, 3 = RP, 4 = Spouse, 5 = Partner, 6 = Parent, 7 = Child; 8 = Grandchild
Sibling 1 = Parent, 2 = RP, 3 = Spouse, 4 = Partner, 5 = Sibling, 6 = Other relative
Guest/Unrelated/Boarder 1 = Guest, 2 = Other unrelated, 3 = Boarder, 4 = Partner, 5 = RP, 6 = Spouse, 7 = Parent, 8 = Sibling, 9 = Other relative, 10 = Child, 11 = Grandchild
The third step was to select one maternal female who completed a dyad with each child. The majority of dyads include a maternal female who was probably the child’s mother; 95 percent of the females
112 Appendix A Abt Associates Inc.

selected were either a biological, foster, or step mother. If multiple females obtained the same rating for a given child, the dyad was incomplete because the most likely mother could not be determined, and the child was consequently excluded from the analysis sample. This accounted for just over 1 percent of the potential dyads. Most commonly, the sample child was the RP’s grandchild, and the
After each dependent child was associated with a maternal female, two exclusionary criteria were applied. Although grandmothers were permissible as maternal females, dyads involving maternal females aged 60 years or older were dropped because those women would not be considered to be choosing between homemaking and working outside the home. They accounted for less than 1 percent of the potential dyads. Similarly, only homemakers and females whose employment status could be categorized as working full- or part-time were appropriate for analyses, which excluded about 9 percent of the dyads. The final analysis sample comprised 15,344 child-mother dyads.
household included two or more women who were daughters of the RP and age 15 or more years lder than the grandchild⎯either one of whom might thus be the child’s biological mother. o
Abt Associates Inc. Appendix A 113

Appendix B Sample Weights
This appendix describes the sample weights that were used in analyses of the CSFII and ECCCS data. CSFII Sample Weights
The CSFII sampling weights compensate for the variable probabilities of selection, differential response rates, and possible sampling frame deficiencies, for both household- and person-level data. The paragraphs below describe how person-level data were weighted to achieve national representa-tiveness, taking into account nonresponse and noncoverage. A composite estimation approach was used to combine the CSFII 1994 to 1996 and 1998 samples, covering four years in total. Although the 1998 supplement to the CSFII comprised children aged 0 to 9 only, the sample was designed to allow these data to be combined with the CSFII/DHKS data for 1994 to 1996, using appropriate weights provided by USDA. These four-year sampling weights were therefore used on the combined dataset. Base weights equal to the reciprocal of the probability of selection were assigned to each sample person. The probability of selection is the product of the probabilities of selecting: (1) the primary sampling unit (PSU); (2) the segment within the PSU; (3) the household within the segment; and (4) the eligible sample person within the household. The base weights were adjusted for nonresponse on two factors: screening nonresponse, and person nonresponse. Screening nonresponse adjustments were made within four classes: census region, MSA status, minority status, and quarter of the year of field operations. The base weight of each eligible sample person was increased by a factor corresponding to the screener nonresponse rate within each class. Screener nonresponse-adjusted weights were then adjusted further to account for person nonresponse on classes defined by income level, age, sex, census region, MSA status, quarter of the year of field operations, and minority status of the segment. This produced nonresponse-adjusted base weights for sample persons who responded. Finally, to compensate for variation in sample counts and possible undercoverage of certain groups, the nonresponse-adjusted weights were ratio adjusted to population estimates from the March Current Population Survey (CPS) for each year of data collection (i.e., 1994-1996 and 1998). Nonresponse rates were calibrated using an iterative process of raking ratio or multiplicative weighting so that the sum of the final weights corresponded to CPS subpopulations defined according to sex, age, home ownership, and several other household and segment characteristics. In other words, the target percentage established by the CPS is the weighted percentage for the sample using the final calibrated weights. Jackknife replicate weights for variance estimation are also provided for each set of sampling weights. The jackknife replication method was designed to reflect the stratification and clustering used in the CSFII/DHKS sample design, and to capture the effects of the raking ratio adjustments described above. The replicate weights provided for the combined four-year sample (1994 to 1996 and 1998) were used.
114 Appendix B Abt Associates Inc.

ECCCS Sample Weights
The construction of weights for the ECCCS was conceptually similar to that for the CSFII.57 Base weights were assigned as the inverse of the sampling probabilities, adjusted for for various special conditions. (For example, Massachusetts was used for the pretest, and this required adjusting the sampling probability somewhat.) Nonresponse adjustments were then made to these sampling probabilities. This was done by stratifying respondents and nonrespondents into homogenous cells and then inflating the inverse of the conditional sampling probabilities for respondents within each cell to account for missing observations from nonrespondents within that same cell. When the resulting weight was unreasonably large, the inflation factor was truncated and a proportional spreading procedure was used. Sampling for this study followed a multistage, multiphase design. Six weights were constructed for the data analysis, corresponding to CACFP sponsors, child care providers, provider menus, on-site meal consumption, households, and 24-hour recall data. It is the last of these six weights that is used in the current study. States were the primary sampling units. Eight states were selected with certainty, and another 12 states were selected with probability proportional to size. Within states, sponsors were stratified by type of provider sponsored (family child care homes (FCCH), child care centers, and Head Start centers), and sponsors were then selected with probability proportional to size. When selecting the sponsor sample, independent child care centers (ICCCs) were treated as sponsors. This was necessary because the state lists of sponsors did not distinguish between “true” sponsors and ICCCs, but in fact ICCCs are child care providers, not sponsors. They entered the provider sample, where they were assigned appropriate weights. From the sponsor sample, child care providers were sampled (the full provider sample) and asked to answer a provider survey. Providers were also asked to complete a menu survey and a food-preparer interview. A subset of the full provider sample was selected for the on-site observations (the on-site provider sample). From that subset, children were selected and their CACFP meal consumption was observed. The children’s parents were interviewed about their meal consumption while not in child care and to obtain information on household characteristics such as income and maternal employment. The selection of children into the sample was based on logistic considerations. Although children in FCCHs are usually fed together, children in centers tend to be fed in small groups whose composition is homogenous with respect to age. To allow the observers at centers to watch the food consumption of the sampled children, a group of noninfant children was first chosen and then six children were selected from that group. (If the center served infants, one infant and five children from the chosen non-infant group were selected instead.) In FCCHs, the selected sample simply comprised six non-infant children (if the number of eligible children was as many as six), or five noninfants and one infant (if any eligible infants were enrolled). Children ineligible to be sampled included infants who were exclusively breastfed, children who were not enrolled for both of the scheduled observation
57 For a full description of the construction of the ECCCS weights, see Fox et al., 1997, Appendix E.
Abt Associates Inc. Appendix B 115

days, and siblings of sample members. The first two groups were deemed outside of scope. The siblings were represented by other children enrolled with the same provider, i.e., by increasing the child weights of the other children in the same group proportionally. The analysis of meals consumed in care is intended to describe children in care on a typical day—not all children enrolled in care. Hence, children who were selected into the sample but absent on one or both observation days were not nonrespondents for purposes of constructing the corresponding weights, but rather outside of scope. The overall response rate for the 24-hour recall sample was quite low, including as it did attrition at all of the intermediate stages. Nonetheless, the resulting sample of children is in principle nationally representative. The assigned weights take account of both sampling probabilities and nonresponse rates to the extent possible.
116 Appendix B Abt Associates Inc.

Appendix C Characteristics of CSFII Sample Children, Households, and Mothers
This appendix presents descriptive information on the characteristics of the CSFII sample of children,
demographics, compared with children of working mothers, children of homemaker
• Younger;
ompared to working mothers, the homemaker mothers themselves:
he most notable difference between children o t wor part e r are more likely to e non-Hispanic black and the latter are more likely to be non-Hispanic
white. In addition, the households of full-time wo others have somewhat higher i and are a little less likely to receiv ic assistance t households o -time workinTh other selves tend to ess formal education than their part-time co
B king mothers tend to have more form tion than ho rs, it seemthey will differ in their nutrition knowledge, incl awareness of dietary recommendations, and
y practices. F rthermore, through working, women ex cultural influences, which e further effects on their attitudes toward diet and its relationship to hea other’s nutrit wledge and attitudes are expected to affect the foods they purchase, prepa serve to their children.
presented here pr ome evidenc orking mot e more nutknowledge than homemakers, but not consistently so. In particular, they can more accurately identify
their households, and their mothers, whose nutrition outcomes are tabulated in this report. Data are stratified by maternal employment status and have been weighted to achieve national repre-sentativeness. The broad underlying patterns are important to bear in mind in interpreting the differ-ences in nutrition outcomes (Chapters 2 and 3) and related factors (reported in Volume II). The moststriking patterns are generally differences between all working and nonworking mothers rather than between full-time and part-time working mothers. With regard tomothers are:
• Less likely to be black and more likely to be Hispanic; • Poorer and more likely to be receiving public assistance; and • In households with more children.
These patterns are expected, given the developmental and financial reasons for mothers to stay at home with younger children, and the well-established employment patterns of working mothers by race/ethnicity (Burstein et al., 2001). C
• Are younger; and • Have less formal education.
T f mothers tha k full-time and -time is that thforme b
rking m ncomes e publ han the f part g mothers.
e full-time working m s them have lunterparts.
ecause wor al educa memake s likely that
uding their attitudes towards healthful dietar u may be
posed to a variety of may havlth. M ion knore, and
The analyses ovide s e that w hers hav rition
Abt Associates Inc. Appendix C 117

food sources of dietary fat and interpret nutrient composition information on food labels. In addition, a slightly larger share of working mothers can correctly report the Food Guide Pyramid serving recommendations for each of the five major food groups. On the other hand, working and nonworking mothers are equally capable of identifying foods that contain saturated fat and answeringquestions about fats and oils, and differences in mothers’ awareness of diet-disease relationships are minimal.
In contrast to the trends for nutrition knowledge, attitudes toward the importance of nutrition among working mothers tend to be less favorable than among homemakers. Although greater nutrition knowledge among working mothers might mediate the effects of time constraints on their children’s diets, this could be outweighed by their perceptions of the importance of dietary recommendations. Working mothers are especially less likely to feel that moderating salt/sodium intake or choosing a diet low in saturated fat and adequate in fiber are very important than nonworking mothers. In addi-tion, part-time working mothers are the least likely to consider nutrition a very important factor when buying food.
7
of children of working mothers (Exhibit C.1). At the other end of the spectrum, teenagers comprise a greater proportion of children of mothers who work full-time (29 percent) or part-time (25 percent) than of mothers who do not work (18 percent). Exhibit C.1 Demographic Characteristics of Sample Children
Demographic Characteristics of Sample Children
As noted in Chapter 1, the CSFII sample children range in age from infancy to 17 years. Younger children (preschoolers) are naturally concentrated among nonworking mothers, reflecting considera-tions of child development and the need for child care (i.e., logistics and costs). Nearly two-fifths (3percent) of children of nonworking mothers are under age 5, versus only a quarter (25 to 27 percent)
Maternal Employment Status Full-Time Part-Time Homemaker All Children Age
0-4 years 24.8% 27.4% 37.4% 29.1% 5-8 years 22.8 24.7 24.3 23.6 9-12 years 23.3 23.4 20.3 22.4 13-17 years 29.1 24.6 18.0 24.8
ender Male 50.9% 49.5% 52.0% 50.9% Female 49.1 50.5 48.0 49.1
Race/Ethnicity Non-Hispanic white 64.4% 74.9% 62.9% 66.3% Non-Hispanic black 17.0 10.8 9.8 13.5 Hispanic 13.4 10.7 20.7 15.0 Other 5.2 3.6 6.6 5.3
Sample size 7,365 3,376 4,603 15,344
G
118 Appendix C Abt Associates Inc.

Although there is practically no association between child’s gender and maternal employment status, cial/ethnic background does vary markedly. Three-quarters (75 percent) of the children whose
mothers work part-time are white, in contrast to less than two-thirds (63 to 64 percent) in the other o groups. Hispanic children are heavily concentrated among nonworking mothers, comprising 21
ercent of this subgroup, versus on f working mothers. Black children likely to e work
Co position, I come, a d Lo tion
CSFII data describe the households in terms of size, composition, annual income, recei f pubas eographic region, and urbanicity of residence. These characteristics are tabulated below in rcen s of children households. Both vantage points are of interest because nutrition outcomes and factors affecting children’s nutrition may be either child lev inta r household xpenditures, food security).58
The two sets of distributi o C.2) ly to the extent that households with m re he weig i the child-level tabulations) differ in their characteristicfro ith fewer children. For example, mean household size is smaller when calculated
vel th n at the c ild level. or the former calculation, each household is counted ess of size; for the latter calculation, households with multiple children count as many
re chil he patterns o ho acter ross maternal employmstatus, howe r, are q ve ilar, whether viewed at the household-level or at the child-level. Ho d Size and C ositio
In rnal e an d ho ris d number of household membera to 16. On average, households with homemaker mothers are somewhat larger (4.4 m se with full-tim (3 pa e (4 ) ing rs T ragnu hold is the same (2.1 adults) regardless of maternal employment status;
ted, the number of e ed ad lts i lower in homemaker householhouseholds with mothers who work full im ) or m it mm lso include more children on average (2.2) than househ ith ing mothers (1.8 to 2. is same pattern holds for childr five s old; on averag seh ld
r mothers have more yo ng children (0.8 children) than ouseholds with who work full-tim me (0.6). This is to e , h c e c re orking m ith umber of childr din e.
ra
twp ly 11 to 13 percent of children oare especially
have full-tim ing mothers.
Household m n n ca
pt o lic sistance, g two ways: as pe tage and as percentages of
el (e.g., nutrient ke) o level (e.g., food e
ons shown bel w (Exhibit differ onore children (mom households w
avily hted n s
at the household leonce, regardltim
a h F
es as there ave
dren. Tti
f house ld char istics ac ent ualita ly sim
usehol omp n
cluding the matenges from 2
femal d chil w comp e a dya , the rs
embers) than houmber of adults
holds e .8) or rt-tim .1 work mothe . he ave e 59 per house
as expec mploy u s ds (0.9) than in e-t e (1.9 part-ti e (2.0). Households w h hom aker
others a olds w work 0). Th en under year e, hou o s with
homemake u do he (0.4) or part-ti be xpected given t at hild car costs in ur d by w
others increase w the n en nee g car
58 A small number of households include multiple maternal females. Those households in which these females vary in
employment status have been excluded from the household-level tabulations, leaving a sample of 7,115 households. About half (75) of the 144 households that have two maternal females were excluded due to employment status variation. The child-level tabulations are based on the entire sample of 15,344 children (see Appendix A).
59 Adults include household members aged 18 years or older, and members labeled as CSFII reference persons, their spouses, and their partners.
Abt Associates Inc. Appendix C 119

Exhibit C.2 Household Composition, Income, and Location Maternal Employment Status Full-Time Part-Time Homemaker All House-
hold Child House-
hold Child House-
hold Child House-
hold Child Household size/ composition
Mean number of household members
3.8 4.3 4.1 4.6 4.4 5.0 4.0 4.6
Mean number of adults
2.1 2.1 2.1 2.1 2.1 2.1 2.1 2.1
Mean number of employed adults
1.9 1.9 2.0 2.0 0.9 0.9 1.7 1.6
Mean number of children
1.8 2.2 2.0 2.5 2.2 2.8 1.9 2.5
Mean number of 0.4
children under 5 0.5 0.6 0.6 0.8 1.0 0.6 0.7
Household income as percent of poverty
Under 130% 14.4% 18.2% 19.1% 21.6% 31.3% 36.3% 19.8% 24.3% 130-185% 12.4 13.7 14.1 15.4 16.8 16.5 13.9 14.9 Over 185% 73.2 68.1 66.8 63.0 51.9 47.2 66.3 60.8 Median 300 273 194 271
Public assistance Receiving public assistance
2.2% 3.1% 4.3% 5.1% 14.4% 17.1% 5.8% 7.7%
Not receiving public assistance
97.8 97.0 95.7 94.9 85.6 82.9 94.2 92.3
Region Northeast 16.1% 15.4% 21.6% 21.9% 20.8% 20.7% 18.5% 18.4% Midwest 23.5 24.5 26.7 28.7 18.7 18.4 22.9 23.6 South 39.9 39.2 28.8 26.6 34.8 33.4 36.2 34.7 West 20.5 20.8 22.9 22.8 25.7 27.5 22.4 23.3
Urbanicity MSA, central city 27.8% 27.7% 30.0% 29.3% 29.9% 30.2% 28.8% 28.8% MSA, not central city
50.2 49.6 51.8 52.4 51.7 51.3 50.9 50.7
Non-MSA 22.0 22.7 18.3 18.3 18.4 18.5 20.3 20.4
Sample size 7,365 3,376 4,603 7,115 15,344
SA = Metropolitan statistical area M
In many of the analyses of child nutrition and related outcomes in this report, the distinction is made between children in one-adult versus multiple-adult households. It seems likely that the time constraints of working mothers would be more binding if other adults were not available to share household tasks. It should be borne in mind, however, that one-adult households are financially less well off. Nearly half of these households (46 percent) have incomes under 130 percent of the federal poverty guideline, compared with only one-sixth (16 percent) of households with more than one adult (not shown).
120 Appendix C Abt Associates Inc.

Household composition figures at the child-level reflect the same patterns reported above at the ousehold-level: more household members, more children, and more preschool children in the
households of homemaker mothers than in the households of working mothers.
Household Income
annual income (before taxes) is expressed as a percentage of the federal poverty guideline, capped at 300 percent of poverty. The median inco he sample is rcent of pov d two-thirds of the households have income equivalent to more than 185 percent of povertymarkedly higher proportion of holds with ho ker mothers ( cent) live at o w 185 percent of poverty, than do households with full-ti percent) or part-time (33 percent) working mothers. Overall, about 6 percent of the households receive public assist AFDC and TANF, but excludes benefits fro the FSP or pared to households in which mfemales work full- or part-tim y hig ortion of ho s with hom s receive public assistance (14 percent versus 2 to 4 t). Similar income and public a ce patterns are seen at the child level, i.e., lower inco more public for child hose mothers are homemakers. Geographic Location
A plurality of the households cent) are loca the south. Co d to househo ith full-time working mothers (the largest group), hou s with part-ti rking motherelatively less concentrated in the south and more in the northeast, whereas households with homemaker mothers are relativ re concentrat e northeast and west. Urbanic
easured by MSA status. Half of the households are located in MSAs that are not central cities, 29 ercent are in central city MSAs, and 20 percent are in non-MSAs. Urbanicity does not vary
for the distribution of children as for the distribution of households.
s. More of the mothers
who work are in their forties, than among homemakers (26 to 27 percent versus 20 percent). Similar to their children, mothers who work full-time, part-time, and not at all are disproportionately likely to be non-Hispanic black, non-Hispanic white, and Hispanic, respectively. Finally, homemakers are substantially more likely than working mothers to have less than a high school education or GED (26 percent versus 10 to 11 percent). Among working mothers, post-secondary education is more prevalent among part-time than full-time workers (58 percent versus 53 percent).
h
Totalme in t 271 pe erty, an
. A r belo house mema 48 per
me (27ance, which includes
me, a substantiall
W Comher prop
IC. aternal emakerusehold
percenm
ssistanre and assistance en w
(36 per ted insehold
mpareme wo
lds wrs are
ely mo ed in th ity is mpnoticeably by maternal employment status. Similar patterns are seen
Demographic Characteristics of Maternal Females
Mothers range in age from 16 to 59 years (Exhibit C.3).60 Approximately half of the children arecared for by mothers who are in their thirties, regardless of employment statu
60 Because the usual unit of analysis is the child-maternal female dyad, characteristics of maternal females have been
tabulated here based on the sample of 15,344 dyads, rather than on the smaller number of unique maternal females in these dyads.
Abt Associates Inc. Appendix C 121

Exhibit Demog
C.3
raphic Characteristics of Maternal Females
Maternal Employment Status Full-Time -Time Homemaker All Children PartAge
16-21 2.5% 22-29 ars 21.2 18.5 30-39 ars 40-49 years 25.5 26.7 19.7 24.1 50-59 years 3.6 2.1 4.5 3.6
school/GED 10.6% 26.3% 15.1%
37.0 32.0 33.5 34.9 More than high 52.6 57.5 40.2 50.0
Sample size 7,365 3,376 4,603 15,344
years 1.5% 2.7% 3.9% ye 17.9 16.1 ye 51.4 52.5 50.8 51.5
Race/Ethnicity Non-Hispanic white 66.4% 75.5% 63.9% 67.7% Non-Hispanic black 16.4 11.1 9.5 13.2 Hispanic 12.5 10.2 20.5 14.4 Other 4.7 3.2 6.1 4.8
Education Less than high 10.4%
High school/GED
school/GED
Mother’s Nutrition Knowledge and Attitudes
A mother’s specific nutrition knowledge, as well as her beliefs and attitudes toward healthful eating, can be expected to influence the diet and health of her children. Research is mixed, but has shown that this is more likely for preschool than older children (Blaylock et al., 1999). Differences in
ng and nonworking mothers may help in under-tanding
he 199 HKS) provided information on nutrition and
lyses comparing the nutrition knowledge and attitudes of working and nonworking mothers.62
Responses to survey items were used to develop measures of nutrition knowledge and attitudes in the following seven areas:
nutrition knowledge and attitudes between workis and interpreting differences in their children’s nutrition outcomes.
4 to 1996 Diet and Health Knowledge Survey (DThealth knowledge and attitudes for a subset of adults aged 20 or older who also participated in the CSFII.61 Among all 15,344 mother-child dyads identified in the CSFII, there were 1,517 mothers (about 10 percent) who completed the DHKS. These mothers comprise the sample for ana
61 The DHKS also collected information on the respondent’s own dietary behaviors, self-assessment of her diet, and use
of food labels. These items were not examined here because they cannot reasonably be linked to children’s diets. 62 The sample size did not allow for reliable estimates of outcomes by number of adults in the household, income below
130 percent of poverty, or further stratification by age of sample child.
122 Appendix C Abt Associates Inc.

Nutrition knowledge: • Knowledge of Food Guide Pyramid recommendations • Knowledge about dietary fat, saturated fat, and cholesterol • Knowledge about nutrient information on food labels • Awareness of diet-disease relationships
des:
• Attitudes toward importance of dietary guidelines • Attitude towards importance of nutrition and other food purchasing considerations • Beliefs about relationship
For some of the topics, responses to individual survey sented. For others, sumeasures were constructed, generally ming the n f correct responses to a set of related questions or, for ordinal scales, computing the proportion of respondents who provided a positive response (e.g., agree or somewhat ag he methodologies used to gro vey items asummarize responses draw upon prev Colavit l. (1996), B k et al. (1999), Guthrie et al. (1999), and n et al. (2000). Results for each nutrition knowledge and attitude domain are separately presented below. Nutrition Knowledge
Knowledge of Food Guide Pyramid endationsThe Food Guide Pyramid is an educa designed to assist people in putting the DietGuidelines for Americans into practice. It is intended to ote balance ration and v in one’s diet. Recommendations for th er of daily servings from each of five main food s are commonly presented as ranges, f ple, “2 to 4 servings of fruit p ”. For adults, the specific number of servings recomme depends main their energy irements. For chil-dren, the number of servings recommend nds on age (USDA, 1992). It was expected that a mother’s understanding of the appro ber of servings for herself frowould carry over into appropriate me ing for her children. The qu the DHK the Food Guide Pyramid recommendations was:
How many servings from the (FOOD GROUP ld you say a n of your agand sex should eat each day for good health?
Because the recommended ranges are s much more widely publicized than the specific values by age and calorie level, any response within the recommended range was considered “correct”. As shown in Exhibit C.4, mothers’ kn ge of Food Guide Pyramid rec ndations va y food group. Almost three quarters (7 ent) of mothers’ correctly report the recommendnumber of servings for the fruit group (two to three servings), whereas onlybread, cereal, rice and pasta group (si 1 servings).63 gh there a e differenc owl-edge of recommendations follows a similar pattern for m f both you years old) and older children (9 to 17 years). The m table differences in mothers’ kn dge of Foo mid recommendations relate to income level. Low-income mothers (household income below 185 percent
Attitu
between diet and health
items are pre mmary by sum umber o
ree). T up sur nd ious work with the DHKS by o et a laylocGleaso
Recomm tional tool ary
prom , mode arietyeor exam numb group
er daynded
ed also depely on requ
p te numnn
ria m each food group inal pla estion S about
) wou perso e
o
owled omme ries b2 perc ed
12 percent do so for the x to 1 Althou re som es, kn
others o nger (0 to 8owleost no d Pyra
63 Virtually all of the mothers who did not answer correctly underestimated the recommendation for the bread group.
Abt Associates Inc. Appendix C 123

of poverty) are less likely to identify the number of servings recommended for all but the fruit group when compared with mothers whose income is higher (over 185 percent of poverty). For example, almost 20 percent fewer low-income mothers report the correct recommendation for the vegetable
hree to five servings) and bread groups than higher-income mothers.
Exhibit C.4 Mothers’ Knowledge of Food Guid mid Recommendations, by Food Groupa
(t
e Pyra
aternal Em ent StatusM ploym Fu e Part-Time Hom ker All Children ll-Tim emaAll children Fruits 73.5% 72.9% 70.5% Vegetables 61.9 64.2 55.5 59.7 Milk, yogurt, cheese 60.0 61.3 57.8 59.7 Bread, cereal, rice, pasta 11.6 14.5 9.7 11.6
62.9
1,511
y age group 0 to 8 years
%
8.7 62.3 61.4
Bread, cereal, rice, pasta 5.9 8.2 6.8 6.7 Meat, poultry, fish, dry beans, eggs, nuts
61.5 70.8*** 49.7 57.7
Maximum sample size 268 153 286 707
72.2%
Meat, poultry, fish, dry 65.5 65.9 59.1 beans, eggs, nuts Maximum sample size 721 318 472
B
Fruits 76.0% 75.1% 69.7% 73.3Vegetables 70.4** 67.7 56.8 64.5 Milk, yogurt, cheese 55.1 57.6 55.1 55.5 Bread, cereal, rice, pasta 14.2 16.8 13.0 14.2 Meat, poultry, fish, dry beans, eggs, nuts
70.2** 67.9 56.2 64.1
Maximum sample size 310 138 275 723
9 to 17 years Fruits 70.8% 70.4% 71.4% 70.9% Vegetables 52.5 60.4 53.9 54.5 Milk, yogurt, cheese 65.4 65.5 60.9 64.3 Bread, cereal, rice, pasta 8.8 11.9 6.0 Meat, poultry, fish, dry beans, eggs, nuts
60.2 63.6
Maximum sample size 411 180 197 788
By income category Up to 185% of poverty
Fruits 75.3% 74.6% 67.5% 71.1%Vegetables 55.2* 45.7 42.8 47.7 Milk, yogurt, cheese 42.0 60.6** 43.4 47.3
124 Appendix C Abt Associates Inc.

Exhibit C.4 Mothers’ Knowledge of Food Guide Pyramid Recommendations, by Food Groupa
Maternal Employment Status Full-Time Part-Time Homemaker All Children Over 185% of poverty
Fruits 72.9% 72.0% 73.7% 72.8% Vegetables 64.0 75.0 68.9 66.6 Milk, yogurt, cheese 66.2 61.2* 72.8 66.7 Bread, cereal, rice, pasta 13.5 18.4 12.7 14.4 Meat, poultry, fish, dry beans, eggs, nuts
66.7 62.7 68.6 65.8
Maximum sample size 453 165 186 804
a The recommended number of USDA Food Guide Pyramid servings per day varies by age and gender. The ranges for each food group are: fruits, 2-4 servings; vegetables, 3-5 servings; milk, yogurt, cheese, 2-3 servings; bread, cereal, rice, pasta, 6-11 servings; meat, poultry, fish, dry beans, eggs, nuts, 2-3 servings (Bowman et al., 1998).
*** Statistically significant difference from children whose mothers are homemakers at the 1 percent level ** Statistically significant difference from children whose mothers are homemakers at the 5 percent level * Statistically significant difference from children whose mothers are homemakers at the 10 percent level
Knowledge of Food Guide Pyramid recommendations does not differ significantly by maternal
w-income mothers who work part-time compared with low-income homemakers know the recom-mendatimeat su g mothers with children up to 8 years old, specially those who work full-time, are more likely to know the recommended number of servings
ide-mericans since 1980. Most people know that high levels of saturated fat and cholesterol
can increase blood cholesterol and risk for heart disease, and that high fat diets are linked to some types of cancer. They also need to know, however, how to make appropriate food choices with respect to these dietary components. The comparisons discussed below are based on three sets of questions that addressed this type of knowledge. For example, DHKS respondents were asked:
Based on your knowledge, which has more saturated fat: butter or margarine?
employment status, although greater proportions of working mothers correctly report the recommend-ations for each of the five food groups (Exhibit C.5). Among low-income mothers and those with younger children, maternal employment is positively and significantly related to knowledge of some, but not all, of the Food Guide Pyramid serving recommendations. For example, significantly more lo
ons for the milk, yogurt, and cheese (61 versus 43 percent) and the meat, poultry, fish, and bstitutes groups (71 versus 50 percent ). Workin
efor the vegetable and meat, poultry, fish, and meat substitutes (two to three servings) groups than homemakers (70 versus 56 to 57 percent reporting correctly for both food groups). Knowledge About Dietary Fat, Saturated Fat and Cholesterol Lowering dietary intake of fat, saturated fat and cholesterol has been a target of the Dietary Gulines for A
Abt Associates Inc. Appendix C 125

Exhibit C.5 Mother’s Knowledge of Food Guide Pyramid Recommendations, by Food Group and
mployment Status E
ercentage of correct re to four p general concepts about saturated fat, unsaturated fat, and cholesterol was co ed to represent principles related to dietary fat and cholesterol. An example of this type of question is:
o cholesterol is it also low in saturated fat, high in saturated fat, or ld it be either high or low in sa fat?
O able to correctly answer 71 percent of the questions d sou to the questions about saturated fat.
C.6) hildren, but varies by income level. me
The average percentages of correct responses were computed for four such items about saturated fat, and six similar items about total fat. In addition, the p sponses items
ertaining to the mput
If a food has n : cou turated
n average, mothers are about foo rces oftal fat and two thirds of They know the correct response to less
than half (41 percent) of the questions on general principles related to fats and cholesterol (Exhibit . The pattern is similar for mothers with younger and older c
Scores on all three measures are lower for low-income mothers compared with higher incomothers.
0
20
40
60
80
100
Fruit Vegetables Bread/ MeatDairy grains
Perc
ent o
f Mot
hers
Full-timePart-timeHomemaker
126 Appendix C Abt Associates Inc.

Exhibit C.6 Mothers’ Knowledge about Sources of Dietary Fat and Cholesterola
Maternal Employment Status Full-Time Part-Time Homemaker All Children All children Total fat 73.2%*** 76.1%*** 65.7% 71.2% Saturated fat 67.7 69.8 65.5 67.6 Fats and cholesterol 42.0 42.0 39.3 41.4 Maximum sample size 726 318 473 1,517
By age group 0 to 8 years
Total fat 72.0%** 74.1%*** 63.5% 68.9% Saturated fat 67.4 68.2 67.3 67.5 Fats and cholesterol 40.4 38.2 40.4 40.0 Maximum sample size 312 138 276 726
9 to 17 years Total fat 74.5%** 78.4%*** 68.3% 73.8%
68.1 71.6* 63.4 67.7 d cholesterol 43.8* 46.2* 37.9 42.9
Maximum sample size 414 180 197 791
y income category
36.1 32.4 34.3 287 708
Over 18 Total 76.2% Satura 71.2 Fats a 45.3 Maxim 458 165 186 809
** Statistically significant difference from children whose mothers are homemakers at the 1 percent level
Saturated fatFats an
BUp to 185% of poverty
Total fat 66.3%*** 69.7%*** 56.8% 62.4% Saturated fat 62.3 64.6 57.6 61.3 Fats and cholesterol 35.1 Maximum sample size 268 153
5% of poverty fat 75.5% 80.5%* 74.9% ted fat 69.6* 72.7 73.8 nd cholesterol 44.4 46.1 46.5 um sample size
a Based on the average percent of correct responses to four questions about saturated fat, six questions about total fat, and four questions about principles related to dietary fat and cholesterol.
*** Statistically significant difference from children whose mothers are homemakers at the 5 percent level * Statistically significant difference from children whose mothers are homemakers at the 10 percent level
With regard to maternal employment, the only difference found in mothers’ knowledge of dietary fat, saturated fat, and cholesterol overall is for total fat scores (Exhibit C.7). Working mothers have a significantly higher percent of correct responses when identifying food sources of total fat than homemakers (73 to 76 percent versus 66 percent). Results are consistent across both age groups examined, but are less pronounced among mothers with incomes over 185 percent of poverty.
Abt Associates Inc. Appendix C 127

Exhibit C.7 Mothers Knowledge About Fat and Cholesterol and Nutrient Information on Food Labels, by
mployment Status E
0
1
2
Kno
wle
3
t Total fat Fat/cholesterol Nu ient
dge
4or
5
e
6
Saturated fa tramounts
Sc Full-time
Part-timeHomemaker
Knowledge About Nutrient Information on Food Labels
tion ts section of food labels is one source of
Now think about the section of the food label that tells the amount of calories, protein, and fat in a serving of the food. If it showed that one serving of the food contained (AMOUNT OF NUTRIENT), would you consider that to be a low amount or a high amount?
The question was asked about five nutrients: fat, saturated fat, cholesterol, sodium, and dietary fiber. A summary score was computed based on the percent of correct responses. Results show that mothers of both younger and older children are able to discern between high and low amounts in a food for an average of 41 percent of the nutrients examined (Exhibit C.8). Consis-tent with other measures of maternal nutrition knowledge, low-income mothers do more poorly in this area tha i 2 versus 46 percent correct). There is a significant positive relationship between employment status and mothers’ ability to inter-pret nutrient information on food labels. Both full- and part-time working mothers have higher scores on this measure than homemakers (42 and 48 versus 35 percent correct). Mothers who work part-time correctly answer the most nutrient composition questions for all age and income groups consid-ered (Ex b is consistent with the fact that part-time working mothers have higher le l compared with both homemakers and mothers who work full-time.
Another type of knowledge that may influence food choices is the ability to interpret label informa-on the nutrient composition of foods. The Nutrition Fac
this information. A question on the DHKS asked:
n h gher income mothers (3
hi it C.8). This findingve s of formal education
128 Appendix C Abt Associates Inc.

Exhibit C.8
others’ Knowledge about Nutrient Information on Food Labelsa M Maternal Employment Status Full-Time Part-Time Homemaker All Children All children Nutrient amounts 42.4%*** 47.9%*** 35.2% 41.0% Maximum sample size 726 318 473 1,517
y age group
Nutrient amounts 43.5%** 47.7%*** 35.3% 41.0% 726
to 17 years Nutrient amounts 34.9% 41.1% Maximum sample size 414
29.8% 0%*** % %
.6% 4%* % %
e size 8 5
ercent of correct responses to questions a mounts (high versus low) per serving of five nutrients: fat, saturated fat, cholesterol, sodium, and dietary fiber.
*** Statistically significant difference from children whose mothers are homemakers at the 1 percent level ** Statistically significant difference from children whose mothers are homemakers at the 5 percent level * ence from children whose mothers are homemakers at the 10 percent level
B0 to 8 years
Maximum sample size 312 138 276
9 41.1% 48.2%***
180 197 791
By income category
Up to 185% of poverty
Nutrient amounts 43. 27.6 31.9Maximum sample size 268 153 287 708
Over 185% of poverty Nutrient amounts 46 50. 43.1 46.2Maximum sampl 45 16 186 809
a Based on the average p bout a
Statistically significant differ
Awareness of Diet-Disease Relationships The final aspect of nutrition knowledge considered here reflects an individual’s awareness that certain health problems are related to dietary practices. This type of knowledge may motivate a person to learn more about nutrition and adopt healthy eating behaviors. A mother who is aware that a parti-cular eating behavior has health implications will presumably try to influence the corresponding as m was:
t any health problems cau
ch fat? • not eating enough fiber?
ch salt or sod • not eating enough calcium? • eating too much cholesterol? • eating too much sugar? • being overweight?
pect of her child’s diet. The relevant DHKS ite
Have you heard abou sed by:
• eating too mu
• eating too mu ium?
Abt Associates Inc. Appendix C 129

The proportion of mothers with a “yes” response to each part of the question was calculated and mpared across employment categories.64
Overall, most mothers are aware of a causal relationship between each dietary behavior queried and
ealth problems (Exhibit C.9). Awareness is highest for “being overweight” (95 percent) and owest r “not eating enough fiber” (68 percent). This pattern is qualitatively the same regardless of age of
y. Diet-disease awareness is lower among low-income mothers (54 to 91 higher income m s (77 to 97 percent).
E M se onships, b ary Practi
co
h lfochild or income categorpercent) compared with other
xhibit C.9
others’ Awareness of Diet-Disea Relati y Diet ce
aternal Em ent Status M ploym Full- ime Part-Time Homemaker All Children TAll children E 89.9% Not eating enough fiber 68.5 70.2 68.0 68.8 E 89.9 N * 87.2 E 91.1 E 81.8 Being overweight 96.6 94.3 93.5 94.9 Maximum sample size 714 315 466 1,495
Eating too much fat 86.8% 87.3% 90.0% 88.2% Not eating enough fiber 65.7 63.6 65.7 65.3 Eating too much salt/sodium 92.0 79.1 86.0 87.3
273 719
to 17 years Eating too much fat 90.6% 94.5% 91.9% 91.8% Not eating enough fiber 71.7 77.6 70.5 72.7 Eating too much salt/sodium 93.8 90.7 92.8 92.9 Not eating enough calcium 89.5* 92.9** 80.6 88.0 Eating too much cholesterol 93.4 90.9 90.5 92.1 Eating too much sugar 82.9 77.2 85.4 82.3 Being overweight 96.2 98.1 97.3 96.9 Maximum sample size 404 179 193 776
ating too much fat 88.6% 90.7% 90.9%
ating too much salt/sodium 92.8 84.6 89.2 ot eating enough calcium 90.7** 90.3** 80.4 ating too much cholesterol
ar 93.5 89.3 88.9
ating too much sug 82.4 77.0 84.1
By age group 0 to 8 years
Not eating enough calcium 91.8** 88.0 80.3 86.5 Eating too much cholesterol 93.7 87.9 87.5 90.2 Eating too much sugar 82.0 76.8 82.9 81.4 Being overweight 97.0 90.9 90.0 93.1 Maximum sample size 310 136
9
Although some researchers have defined diet-health awareness based on the respondent being able to correctly identify
specific dietary practice-health problem links (e.g., sodium consumption and hypertension), it is felt that the “percep-tion” of a relationship alone can affect dietary behavior (communication with Linda Cleveland, USDA Food Surveys Research Group).
64
130 Appendix C Abt Associates Inc.

Exhibit C.9 Mothers’ Awareness of Diet-Disease Relationships, by Dietary Practice Maternal Employment Status Full-Time Part-Time Homemaker All Children By income category Up to 185% of poverty
Eating too much fat 76.8%* 82.2% 86.4% 83.0% Not eating enough fiber 50.6 57.7 53.1 54.1 Eating too much salt/sodium 83.2 76.3 85.7 83.4 Not eating enough calcium 79.2* 80.5* 68.6 74.8 Eating too much cholesterol 82.5 76.5 83.1 81.7 Eating too much sugar 77.9 75.4 84.4 80.1 Being overweight 95.3 91.4 88.6 91.0 Maximum sample size 260 150 280 690
Over 185% of poverty Eating too much fat 92.6% 95.4% 95.6% 93.7% Not eating enough fiber 74.6* 77.4 83.2 77.0 Eating too much salt/sodium 96.1 89.1 92.8 93.5 Not eating enough calcium 94.6 96.0 92.5 94.1 Eating too much cholesterol 97.3 97.0 94.8 96.3 Eating too much sugar 84.0 78.3 83.7 82.8 Being overweight 97.1 96.0 98.2 97.1 Maximum sample size 454 165 186 805
ally significant difference from children whose mothers are homemakers at the 1 percent level cally significant difference from children whose mothers are homemakers at the 5 percent level
re homemakers at the 10 percent level
*** Statistic** Statisti* Statistically significant difference from children whose mothers a
There is little to no difference in the diet-disease awareness of working mothers compared with home-makers. The only significant difference overall is a ten-percentage-point increase in the share of working mothers aware of a relationship between not eating enough calcium compared with home-
akers. Results do not vary by age of child or income, but the difference for calcium is smaller and non-sig
mnificant among higher income mothers (Exhibit C.10).
Abt Associates Inc. Appendix C 131

Exhibit C.10 Mothers’ Awareness of a Relationship Between Not Eating Enough Calcium and Health Problems, by Household Income Relative to Poverty and Employment Status
and important influences on dietary behavior. The seriousness with which m s guidelines may be reflected in the corresponding aspects of their children s diets,
for example, the components of the Heal ng Index. The DHKS asked mothers how important 11 positive dietary practices were to the fically:
you personally, is it very im t, somewha tant, not portant, ornot at all important to:
Use salt or sodium only in moderation? Choose a diet low in saturated fat?
oose a diet with plenty o nd veget modera
• Choose a diet with adequat ? • Eat a variety of foods? • Maintain a healthy weight? • Choose a diet low in fat? • Choose a diet low in cholesterol? • Choose a diet with plenty of breads, cereals, rice and pasta? • Eat at least two servings of dairy products daily?
0
20
40
80
100
All children % 185%
60
Perc
ent o
f Mot
hers
0 to 185 Over
Full-timePart-timeHomemaker
Attitudes
Attitudes Toward the Importance of Dietary Guidelines Although knowledge and awareness of dietary recommendations may play a role, favorable attitudes are also necessaryview various dietary
other’
thy Eatiim, spec
To portan t impor too im
• • • Ch f fruits a ables?• Use sugars only in tion?
e fiber
132 Appendix C Abt Associates Inc.

The proportions of mothers who felt the behavior was “very important” were compared across ployment groups. At least half of all mothers feel that eight of the 11 guidelines are very important
to them (Exhibit C.11). The guideline considered very important to the most mothers involves maintaining a healthy weight (79 percent); close to one-third of mothers feel that choosing a diet with plenty of breads and grains is very important (35 percent). Mothers’ attitudes follow a similar pattern across child age and household incom interesting exception is the finding that 14 percent more low-income than higher income el that eating at least two servings of dairy products daily is very important.
Exhibit C.11 Mothers’ Attitudes Toward Dietary Guidelines: Percent Reporting Positive Behavior Is Very Important to Them
em
e groups. An mothers fe
Maternal Employment Status Full-Time Part-Time Homemaker All Children All children Salt/Sodium 47.7% 40.9%** 54.6% 48.6% Saturated fat 50.9** 52.9 62.2 55.3 Fruits and vegetables 67.4 76.1 72.5 70.8 Sugars 47.7 48.3 53.1 50.1 Fiber 46.3** 53.5 56.9 51.3 Variety 56.7 55.4 61.2 58.3 Weight 76.7 77.8 80.8 78.7 Fat 59.9 56.9 64.1 61.3 Cholesterol 53.8 53.2 62.1 56.8 Breads, cereals, rice, pasta 32.1 36.0 39.5 35.4 Dairy products 43.0 43.4 51.3 45.9 Maximum sample size 720 306 451 1,477
By age group 0 to 8 years
Salt/Sodium 46.4% 34.1%** 52.3% 46.6% Saturated fat 47.7* 40.4** 60.8 51.6 Fruits and vegetables 69.5 71.6 73.4 71.4
34.8** r 41.7 54.1 47.6
Variety 51.4 44.2 59.1 53.2 Weight 74.0* 73.8 84.1 Fat 55.0** 59.5 Cholesterol 48.5** 47.0 61.9 53.6 Breads, cereals, rice, pasta 31.7 30.6 40.3 35.0 Dairy products 46.0 43.2 54.9 49.0 Maximum sample size 309 130 263 702
9 to 17 years Salt/Sodium 49.0% 48.5% 57.1% 50.8% Saturated fat 54.4 66.7 63.7 59.2 Fruits and vegetables 65.0 81.1 71.6 70.0 Sugars 49.6 63.2 51.0 52.8 Fiber 49.1 66.4 60.1 55.4 Variety 62.6 67.8 63.5 64.0
Sugars 46.0 55.0 47.6 Fibe 43.9
78.0 53.1 67.2
Abt Associates Inc. Appendix C 133

Exhibit C.11 Mothers’ Attitudes Toward Dietary Guidelines: Percent Reporting Positive Behavior Is Very Important to Them Maternal Employment Status Full-Time Part-Time Homemaker All Children
(cont.)Weight 79.6 82.2 77.2 79.6 Fat 65.3 61.1 60.7 63.3 Cholesterol 59.5 60.1 62.3 60.3 Breads, cereals, rice, pasta 32.4 41.9 38.5 35.9 Dairy products 39.8 43.6 47.3 42.4 Maximum sample size 411 176 188 775
By income category Up to 185% of poverty
Salt/Sodium 49.4% 44.1% 52.9% 50.7% Saturated fat 53.5 49.9 55.2 54.1 Fruits and vegetables 71.2 71.3 69.6 71.3 Sugars 53.1 46.8 51.2 51.7 Fiber 53.3 49.1 52.8 52.5 Variety 51.6 57.6 50.9 53.4 Weight 78.3 82.0 81.1 81.0 Fat 57.4 55.4 60.8 59.5 Cholesterol 55.2 50.7 54.0 54.1 Breads, cereals, rice, pasta 34.0 28.9 35.6 33.3 Dairy products 55.4 52.8 54.0 54.8 Maximum sample size 268 149 269 686
Over 185% of poverty Salt/Sodium 47.0% 38.9%** 56.3% 47.5% Saturated fat 50.1*** 55.4* 69.1 55.9 Fruits and vegetables 66.0 79.3 75.7 70.5 Sugars 45.9 49.4 54.9 49.2 Fiber 44.0** 56.1 61.0 50.6 Variety 58.6** 53.2** 71.2 61.0 Weight 76.2 75.0 80.6 77.5 Fat 60.9 57.7 67.7 62.4 Cholesterol 53.4*** 54.6* 70.1 58.3 Breads, cereals, rice, pasta 31.4 41.3 43.3 36.5 Dairy products 38.8 37.4 49.0 40.9 Maximum sample size 452 157 182 791
*** Statistically significant difference from children whose mothers are homemakers at the 1 percent level ** Statistically significant difference from children whose mothers are homemakers at the 5 percent level * Statistically significant difference from children whose mothers are homemakers at the 10 percent level
In contrast to the trends reported above for nutrition knowledge, working mothers tend to have less favorable attitudes towards the importance of all 11 dietary guidelines than homemakers (Exhibit C.12). Differences in the proportions of working and nonworking mothers who feel the practices are very important are statistically significant for only three of guidelines examined: fewer part-time working mothers find the use of salt/sodium in moderation to be very important compared with
134 Appendix C Abt Associates Inc.

Abt Associates Inc. Appendix C 135
homemakers (41 versus 55 percent), and full-time working mothers are the least likely to feel that choosing a diet low in saturated fat or adequate in fiber is very important (a difference of about ten percentage points between working and nonworking mothers for both guidelines). Maternal employ-ment status is more strongly associated with attitudes towards dietary guidelines among mothers with children age 0 to 8 years old and in higher income households (over 185 percent of poverty). Exhibit C.12 Mothers’ Attitude Towards Importance of Dietary Guidelines, by Employment Status
Attitude Toward Importance of Nutrition and Other Food Purchasing Considerations It was expected that when purchasing food, work
reparation aning mothers would put relatively more emphasis on
ea d perhaps how w food keep inimize shopping trips), whereas n elatively more asis on pric e importance of these considerations
us money pressures may spill over for either group into putting less utrition. To explore these issues, responses of “very importan to the following
D were tabulated:
When you buy food, how important is (FACTOR)—very i ant, somew portant, no t at all importan
How safe the food is to eat?• Nutrition? • Price? • How well the food keeps? • How easy the food is to prepare? • Taste?
se of p ell theh
s (to monworking mothers put r
e vers emp e. Th
associated with timemphasis on n t”
HKS item
mport hat imt too important, or no t?
•
0
20
40
60
80
100
Salt/s
Saturat Fru
it/veg
Sugars Fiber
VaFat
Choleste
Brea
Dairy
Perc
ent o
f Mot
hers
odiumed
fat
rWeiet
yight ro
lins
ds/gra
Full-time
Part-time
Homemaker

Taste has been shown to be the most important factor in food selection in studies conducted over the last decade (Guthrie et al., 1999), and remains important here. Approximately 88 percent of all mothers rate taste as very important when buying food (Exhibit C.13). In contrast to past studies, food safety is rated just as high (88 percent).65 Nutrition, which is rated very important by two-thirds of all mothers, has received slightly higher ratings in other studies (74 to 78 percent), but is typically considered more important than price and other attributes. The exception in this sample is among low-income mothers where nutrition, price and how the food keeps are considered very important by equal proportions of mothers. Not surprisingly, price is much less important am ng higher income mothers. Exhibit C.13 M ’ Attitudes Toward Nutrition a er Factors in Buying Food: Percent RepoF t to Them
o
others nd Oth rting actor Is Very Importan
Maternal Employment Status Full-Time Part-Time Homemaker All Children All children S 85.8% 87.7% Nutrition 67.9 55.7** 69.5 66.7 Price 42.7*** * 63.0 H 58.9 58.3 Ease of prep 34.5 40.4 41.0 Taste 88.3 87.9 84.9 87.5 Maximum sample size 722 315 473 1,510
By age group 0 to 8 years
Safety 88.3% 87.4% 86.7% 87.5% Nutrition 64.4 46.3*** 72.4 64.4 Price 44.2*** 32.6*** 62.3 49.4 How well food keeps 59.6 50.7 61.1 58.6 Ease of preparation 43.7 34.2 37.7 39.6 Taste 85.9 84.6 86.9 86.1 Maximum sample size 312 137 276 725
9 to 17 years Safety 88.3% 90.6% 84.7% 87.9% Nutrition 71.8 66.2 66.3 69.2 Price 40.9*** 45.0** 63.7 47.5 How well food keeps 59.5 56.1 56.4 58.0 Ease of preparation 45.3 34.9 43.4 42.6 Taste 91.1* 91.7* 82.6 89.1 Maximum sample size 410 178 197 785
afety 88.3% 88.9%
38.5**53.3
48.5 ow well food keeps
aration 59.6 44.5
65 Because food safety in a literal sense is virtually a non-issue in the United States, respondents who emphasize this
factor are presumably thinking about such considerations as absence of pesticides, lack of irradiation, and freshness.
136 Appendix C Abt Associates Inc.

Exhibit C.13 Mothers’ Attitudes Toward Nutrition and Other Factors in Buying Food: Percent Reporting Factor Is Very Important to Them Maternal Employment Status Full-Time Part-Time Homemaker All Children By income category Up to 185% of poverty
Safety 85.1% 84.8% 83.9% 84.8% Nutrition 63.4 64.2 69.2 67.0 Price 68.7 53.8*** 76.3 69.7 How well food keeps 76.3 69.6 67.4 70.9 Ease of preparation 51.9 32.6 44.0 44.3 Taste 93.3** 93.1* 82.0 88.3 Maximum sample size 267 150 287 704
Over 185% of poverty Safety 89.4% 90.4% 87.6% 89.3% Nutrition 69.5 51.2*** 70.0 66.5 Price 33.7** 28.2*** 48.9 36.5 How well food keeps 53.9 42.6 49.8 51.2 Ease of preparation 42.0 35.0 36.5 39.2 Taste 86.7 84.7 87.9 87.0 Maximum sample size 455 165 186 806
*** Statistically significant difference from children whose mothers are homemakers at the 1 percent level ** Statistically significant difference from children whose mothers are homemakers at the 5 percent level * Statistically significant difference from children whose mothers are homemakers at the 10 percent level
As predicted, homemakers are more likely to report price as a very important factor in buying food than either full-time or part-time working mothers (63 percent versus 43 and 38 percent, respect-ively). This is illustrated in Exhibit C.14 and probably reflects the lower average household income for this group compared with working mothers. The differences in attitudes toward price are signifi-cant across most child age and income groups, but are smaller in magnitude for low-income mothers. Surprisingly, there were no significant differences in the importance of ease of preparation or how well the food keeps between working and nonworking mothers. Oddly, part-time working mothers are significantly less likely to report nutrition as very important than homemakers (56 versus 68 percent). This difference tends to be concentrated among mothers of young children and with higher family incomes.
Abt Associates Inc. Appendix C 137

138 Appendix C Abt Associates Inc.
Exhibit C.14 Importance of Nutrition and Other Factors to Mothers in Buying Food, by Employment Status
0
20
40
60
80
100
Safety Taste Nutrition Storability Price Ease ofpreparation
Perc
ent o
f Mot
hers
Full-timePart-timeHomemaker
t Relationship Between Diet and Health opinion about the benefits and the barriers associated with a particular dietary practice
may influence the quality of her child’s diet. Three items from the DHKS in particular can be thought of as representing barriers or facilitators to healthy eating. These items are:
(1) Some people are born to be fat and some thin; there is not much you can do to
recommendations about healthy ways to eat, it’s hard to
can make a big difference in your ce of getti isease, likheart disease or cancer.
T ng that they “somewhat atements 1 and 2 ab ee” (statement 3) were used to compare be f working and no T rity of mothers overall (92 percent) agree with statement 3, suggesting they believe in the relationship between diet and disease risk. This belief should, theoretically, enhance the adoption of healthful eating behaviors among their children. Mothers in higher income households are some-what more likely to hold this belief than those in low-income households, but age of child makes no difference (Exhibit C.15). Most mothers (63 percent) disagree with the statement (1) inferring that a person’s weight is unrelated to diet (or other factors, e.g., e ), but a fa on believe this to be true. Only one-fifth of all mothers disagree that it is difficult to know which, among many mmendations to believe (statement 2). These beliefs may represent a barradopting healthful dietar practices. Based on their responses to statements 2 and 3, a larger share of lo beliefs that are considered barriers to healthy eating compared with higher income mothers.
Beliefs AbouA mother’s
change this.
(2) There are so many know what to believe.
(3) What you eat chan ng a d e
he proportions of mothers indicati /strongly disagree” (stove) or “somewhat/strongly agrnworking mothers.
liefs o
he vast majo
xercise irly large proporti
, dietary reco ier to y
w-income mothers hold

Maternal employment does not seem to be associated with the diet- and health-related beliefs examined here. There are no significant differences in the responses of working and nonworking mothers overall. Low-income working mothers are significantly less likely to feel that it is difficult to know which dietary recommendations to believe than homemakers in the same income category (10 versus 18 percent disagreed with statement 2). In addition, among higher income mothers, more of
63 versuspe . E M liefs in Diet and Health Relationship
those working than not working believe a person’s weight can be affected byrcent disagreed with statement 1)
diet (62 to 78
xhibit C.15
others’ Be
Maternal Employment Status Full-Time Part-Time Homemaker All Children All children Born to be fat/thin, can’t change (% disagree)
61.2% 60.0% 67.2% 62.6%
Don’t know what recommendations to believe (% disagree)
20.0 23.8 24.3 22.1
Diet can affect risk for disease (% agree)
94.2 88.0 90.2 91.8
Maximum sample size 726 317 473 1,516
By age group 0 to 8 years
Born to be fat/thin, can’t change (% disagree)
62.5% 57.2% 64.1% 62.2%
Don’t know what recommenda-tions to believe (% disagree)
19.9 30.0 25.0 23.7
Diet can affect risk for disease (% agree)
93.5 87.4 91.6 91.7
Maximum sample size 312 138 276 726
9 to 17 years Born to be fat/thin, can’t change (% disagree)
59.8% 63.1% 70.6% 63.2%
Don’t know what recommenda-tions to believe (% disagree)
20.1 17.0 23.4 20.3
Diet can affect risk for disease (% agree)
94.9 88.7 88.7 92.0
Maximum sample size 414 179 197 790
Up to 185% of poverty Born to be fat/thin, can’t change (% disagree)
57.8% 54.4% 56.0% 56.4%
Don’t know what recommenda-tions to believe (% disagree)
10.3** 10.3* 18.2 13.9
Diet can affect risk for disease (% agree)
88.5 76.6 85.9 85.1
Maximum sample size 268 153 287 708
Abt Associates Inc. Appendix C 139

Exhibit C.15 Mothers’ Beliefs in Diet and Health Relationship Maternal Employment Status Full-Time Part-Time Homemaker All Children Over 185% of poverty
Born to be fat/thin, can’t change (% disagree)
62.3%** 62.7%* 78.2% 66.1%
Don’t know what recommenda-tions to believe (% disagree)
23.3 31.4 30.5 26.8
Diet can affect risk for disease (% agree)
96.1 95.3 94.9 95.6
Maximum sample size 458 165 186 809
*** Statistically significant difference from children whose mothers are homemakers at the 1 percent level ** Statistically significant difference from children whose mothers are homemakers at the 5 percent level * Statistically significant difference from children whose mothers are homemakers at the 10 percent level
140 Appendix C Abt Associates Inc.

The Early Childhood and Child Care Study u ulti-stage sam esign, comprising (1) a
representative ple of sponsors within these states; ers within each spo ng agency; an representative s e of
ildren within each provider. All selected states participated. Sponsors nd providers were sof child care (Head Start centers, other child care centers, and family child care home ).66
ipating provider was assigned a target week during the field period, during whic ervations of meals consumed in child car y recall interviews with parents all
. In addition, a household interview wa ucted with the parents of participating chil-dren during this week or at a later time. Although sponse rates a stages of sample selec-tion were reasonable, the cumulative response rate only 41 percent overall for the 24- call
any family child care homes declined to participate in the meal observations.
ortunately, some information on non-respondents is available. Basic characteristics of sponsors d in the process of constructing the sample, and some information was obtained from
are available for soresponse bias at the various stages of the samchildren with and without 24-hour recall data are done using unwei becau
on-respondents.
Respondent Sponsors
sponded by su plying lists of ch providers u ir ponsor similar numbers of providers as all sponsors if
were selected into the family child care homes or He d Start center strata (Exhibit D.1). If th y were selected into the “other” (non-Head Start) center s however, th d to sponsor smaller
centers. Respondent sponsors were distributed among regions similarly to all rs.
ondent and Non-Respondent Provide s
sed a m pling drepresentative sample of states; (2) a sam (3) a representative sample of provid nsori d (4) a amplch a tratified by mode sEach partic h a menusurvey, obs e, and dietar
s condtook place the re t most was hour re
interviews (Glantz et al., 1997). This resulted mainly from an inability to reach parents during the two days following the meal observations, rather than parents’ refusing to complete the interview. In addition, m Fwere obtainemost non-respondent providers. Furthermore, both household interview and observational data
me children who were observed in care. These data permit an analysis of non-ple. All comparisons except those between observed
ghted data, se weights werenot calculated for n Respondent and Non-
Of the 1,190 sponsors selected, 990 regis. Respondent sponsors tended to s
p ild care nder thethey ae
a etratum, ey tende
numbers of sponso
Resp r
Of the 456 providers selected from the sponsors’ lists for meal observations, 336 were cared-for children who were ultimately observed. Respondents were similar to all providers with regard to
Although agencies can sponsor multiple types of providers, they were selected into the sample based on a particular
provider type.
ppendix D hildhood and Child Care Study Non-
AEarly CResponse Analysis
66
Abt Associates Inc. Appendix D 141

mean enrollment and percent self-sponsoring (Exhibit D.2).providers to be located in the West.
They were somewhat less likely than all
ted)
Exhibit D.1
haracteristics of Respondent and Non-Respondent Sponsors (unweighC
Respondent
Sponsors Non-Respondent
Sponsors All Sponsors Mean number of providers FF
or sponsors of family child care homes 497.6 378.0 480.0 or sponsors of Head Start centers 9.9
sors of other centers 3.4
14.7%
31.3
20.9
onsors 990 200 1,190 prises eligible sponsors selected from state list dent sponsors hat supplied lists of
11.7 19.1
10.2 5.5
For spon Region
7.0%Northeast 16.3% Southeast 34.7 25.0 Midwest 32.2 27.0 33.0West 16.9
41.0
Number of spUniverse comproviders.
s. Respon are those t
xhibit D.2 E Characteristics of Respondent and Non-Respondent Child Care Providers (unweighted)
Respondent
Providers Non-Respondent
Providers All Providers Mean enrollment Homes 9.7 8.6 9.2 Head Start centers 73.6 81.6 74.6
17.1
Other centers 80.7 83.2 81.3 Percent of self-sponsoring providers 14.9% 16.7% 15.4% Region Northeast 18.2% 28.3% 20.8% Southeast 34.8 27.5 32.9 Midwest 32.4 20.0 29.2 West 14.6 14.6 Number of providers 336 120 456 Universe comprises eligible providers selected for meal observations. Respondent providers are those in which children were observed.
142 Appendix D Abt Associates Inc.

Observed and Non-Observed Children
ristics for all selected children (Exhibit D.3).
Exhibit D.3
haracteristics for Observed and Non-Obser hildren (unweighted
Of the 2,354 children selected from provider lists to be observed at meal and snack time, 1,359 were observed eating meals and snacks in care. Provider characteristics for children who were observed
ere similar to provider charactew
Provider C ved C )
Observed Children
Non-Observed Children
All Selected hildren C
Provider’s mean enrollment Homes 10.3 11.2 .6 Head Start centers 70.9 86.6 77.9 Other centers 77.5 84.5 80.7
soring providers 15.4% 15.3% .3%
egion
19.1% 14.5% % outheast 36.6 43.8 39.6
Midwest 33.4 24.1 29.5 West 11.0 17.6
f providers 1,359 995 2,354
e comprises children selected for meal observations. Observed n were observed eating at l e meal or ack in care.
10
Percent of self-spon 15 RNortheast 17.1S
13.8 Number oUnivers childre east onsn
Observed Children With and Without 24-Hour Recall Data
inally, 24-hour recall data were obtained for 954 of the 1,359 children who were observed eating eals and snacks in care. Although respondents were similar to non-respondents with regard to age
distribution, provider enrollment, percent of self-sponsoring providers, and region, there were large differences in household income (Exhibit D.4). Observed children without 24-hour recall data were substantially more likely to reside in households with incomes at or below 185 percent of the federal poverty level. This is undoubtedly due to the greater time stresses experienced by low-income working families with children, which, as shown elsewhere in this report, are substantially more likely than higher-income working families to include only one adult. On the other hand, respondent and non-respondent children were quite similar with regard to the meals and snacks they were observed to eat in care. Meal patterns and food energy consumption at each eating occasion differed little between the two groups (Exhibit D.5).
Fm
Abt Associates Inc. Appendix D 143

Exhibit D.4 Characteristics of Observed Children with 24-Hour Recall Data and with Observation Data
nly (weighted) O
and Obser tion Data Observation Data Only Children with Recall
vaChildren with
Child’s age at last birthday 1-2 years 14.2%
s
At or below 185% of poverty 59.9% 80.1% ver 185% of poverty 40.1 19.9
Provider’s mean enrollment
omes 10.4 10.0 centers 70.2 72.2
O s Percent of self-sponsoring providers Region Northeast 20.8% 15.1% S 34.7 Midwest 33.9 West 10.7 Number of children (unweighted) 954 405 Universe comprises children who were observed eating meals and snacks Respondent children are those with at least one 24-hour recall.
12.8%3-5 years 78.3 79.8 6-12 year 7.6 7.4 Household income
O
HHead Start
ther center 79.1 73.7
15.6% 14.8%
outheast 41.0 32.4 11.6
in care.
144 Appendix D Abt Associates Inc.

Exhibit D.5 Meal Patterns and Percent of REA for Food Energy Consumed by Observed Children with Hour Recall Data and with Observation Data (weighted)
24-
Children with Recall
and Observation Data Children with
Observation Data Only Meal combinations consumed in carea 2 meals and 1 snack 34.3% 36.0%
EA for food energy consumed in CACFP meals and snacks
Breakfast:
Ages 1-2 16.2% 12.7% Ages 3-5 14.3 14.6 Ages 6-10 17.9 13.7 All ages 14.9 14.2
Lunch:
Ages 1-2 23.5% 21.6% Ages 3-5 22.8 22.5 Ages 6-10 24.4 27.9 All ages 23.0 22.6
Morning snack:
Ages 1-2 12.0% 9.6% Ages 3-5 9.8 11.3 Ages 6-10b 14.8 4.8 All ages 10.4 10.6
Afternoon snack:
Ages 1-2 11.2% 10.9% Ages 3-5 10.2 10.9 Ages 6-10b 12.0 10.1 All ages 10.7 10.7
Number of childrenc (unweighted) 943 400 Universe comprises children who were observed eating meals and snacks in care. Respondent children are those with at least one 24-hour recall.
2 snacks or 1 snack and 1 meal 17.5 17.3 1 snack 14.2 15.7 2 meals 10.7 11.8 2 meals and 2 snacks or more 10.6 8.8 1 meal and 2 snacks 7.8 5.1 1 meal 4.9 5.3 Percent of 1989 R
a Meals include breakfast, lunch, and dinner/supper. Evening snacks were rare and are excluded from this analysis.
b Sample sizes are very small for both groups (n<6).
c Some children were missing information on the specific meals and snacks consumed in care (five with recalls and three with observations only). In addition, two children over age 10 in each group, and four Head Start children with recall data whose ages were over 5, were excluded.
Abt Associates Inc. Appendix D 145

Summary
The ECCCS was designed to be nationally representative of children in CACFP care. Sampling weights were adjusted at each stage to correct for non-response based on selected observed character-
rate raises concern about the validity of generalization from t the CACFP population as a whole, particularly if there is reason to believe that non-respondents differ systematically from respondents.
he two most striking aspects of the comparisons above are that sponsors and providers from the e relatively less likely to participate, and that families with income
overty whose children were obs ca e w lik ovi e 2Weights have been used to correct for these discrepa the ossible ilatwo key outcome measures between groups of observed children for whom 24-h ll dand are not available suggests that the description of t ram resp on
reatly distorted.
istics. Nonetheless, a high non-responsehe sample to
TWest werp
s up to 185 percent of derved in child r ere less
ncies to
he prog
ely to pr extent p
based on
4-hour r. The simour reca
ondents al
ecall data. rity in ata are e is not
g
146 Appendix D Abt Associates Inc.

Appendix E Standard Errors for Selected Exhibits in Chapter 4
Exhibit E.1 Standard Errors for Estimates of Average Food Energy and Nutrients Consumed in CACFP Care and Over 24 Hours in Exhibit 4.2a
Family Child Care
Homes Head Star Centers Child Care Centers t
24 Hours
y -
m -tion from CACFP
aily Recomtion in 4 Hours
% D ily Rm -
tion from CACFP
% D y -
tion in 24 Hours
y -
tion from CACFP
% Daily Recom-menda-tion in
% DailRecom
enda
% Dm-
enda-
2
acom-e
enda
ailecomR
menda-
% DailRecommenda-
Food energy (1989 REA) 1-2 years 6 - 4.36 4.62
3.59 2.78 3.4 2.38 - 7.46 4.98
Pro 9 RDA) 1-2 years 31.22 16.67 -- -- 15.17 14.55 3-5 years 15.38 10.79 10.31 6.91 19.66 14.19 6-10 years 11.33 9.40 -- -- 26.48 18.28
15.58 15.91 16.22 13.79
6-10 years 25.26 7.33 -- -- 13.93 6.33
itamin C (2000 RDA) 1-2 years -- -- 68 33-5 years 6.78 .41 30.09 20.99 6-10 years -- -- 69. 3
(1997 AI) rs 14.64 --
4 4.50 4.45 -- .5 1
RDA)
1-2 years 9.15 -- .19 4.02 3.78
6-10 years 6.99 5.03 -- -- 0 12.11 Iron (2001 RDA)
3 8.87 -- 3-5 years 13.14 4.32 4.49 3.41 5.19
9.11 4.94 -- --
.69 4.45 - -- 3-5 years 2.37 1.90 4.37 4.30 6-10 years 6 - --
tein (198
Vitamin A (1989 RDA)
1-2 years 18.39 13.16 -- -- 15.14 10.573-5 years 14.06 10.12
V
53.9830.15 29.61
21.56 18.7115.70
2
.01
13
8.96
2.67 13
Calcium
1-2 yea 14.67 6.17
--
8.28 9.03 3-5 years 6-10 years
9.77.76
8.51 8.62 4.61 -- 21 3 2.71
Calcium (1989
9.17 -- 5 7 5.64 3-5 years 6.1 5.89 5.45 6.94
15.4
1-2 years 15.3 -- 4.58 5.53
8.47 6-10 years 7.38 4.50
Abt Associates Inc. Appendix E 147
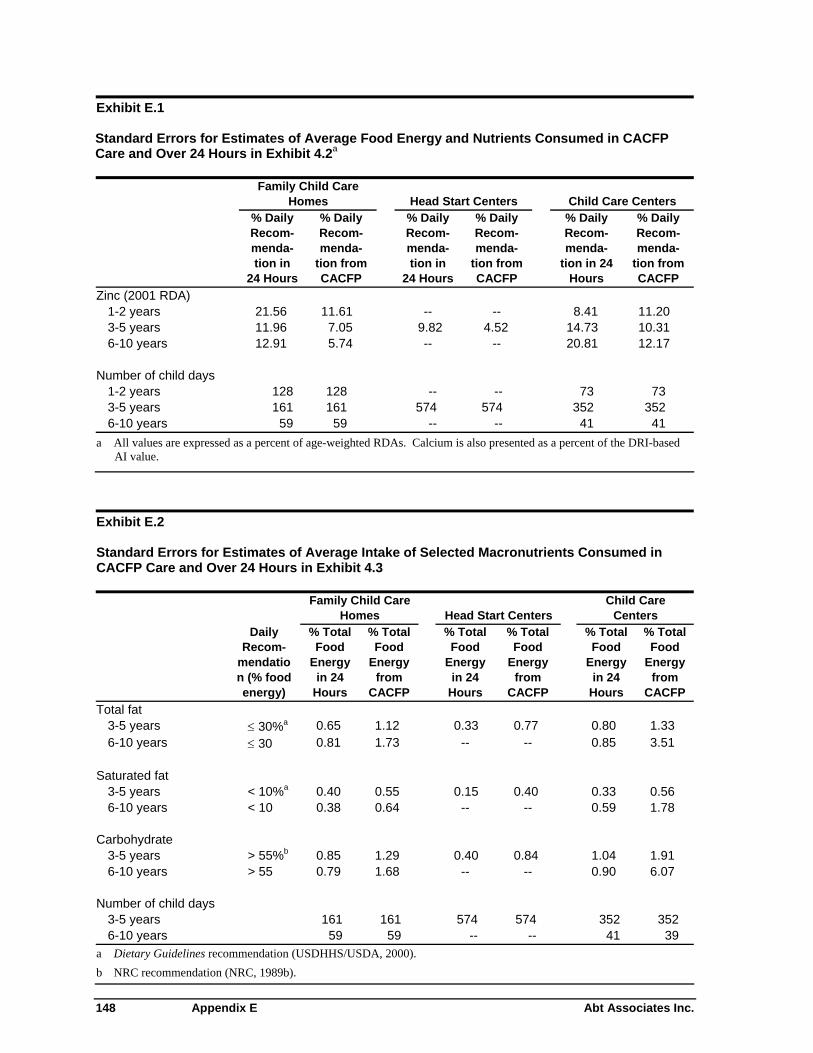
Exhibit E.1 Standard Errors for Estimates of Average Food Energy and Nutrients Consumed in CACFP Care and Over 24 Hours in Exhibit 4.2a
Family Child Care
Homes Head Start Centers Child Care Centers
% Daily Recom-menda-tion in
24 Hours
% Daily Recom-menda-
tion from CACFP
% Daily Recom-menda-tion in
24 Hours
% Daily Recom-menda-
tion from CACFP
% Daily Recom-menda-
tion in 24 Hours
% Daily Recom-menda-
tion from CACFP
Zinc (2001 RDA) 1-2 years 21.56 11.61 -- -- 8.41 11.20 3-5 years 11.96 7.05 9.82 4.52 14.73 10.31 6-10 years 12.91 5.74 -- -- 20.81 12.17
Number of child days
1-2 years 128 128 -- -- 73 73 3-5 years 161 161 574 574 352 352 6-10 years 59 59 -- -- 41 41
a All values are expressed as a percent of age-weighted RDAs. Calcium is also presented as a percent of the DRI-based AI value.
Exhibit E.2 Standard Errors for Estimates of Average Intake of Selected Macronutrients Consumed in CACFP Care and Over 24 Hours in Exhibit 4.3
Family Child Care
Homes Head Start Centers Child Care
Centers
Daily Recom-
mendation (% food energy)
% Total Food
Energy in 24
Hours
% Total Food
Energy from
CACFP
% Total Food
Energy in 24
Hours
% Total Food
Energy from
CACFP
% Total Food
Energy in 24
Hours
% Total Food
Energy from
CACFP Total fat
3-5 years ≤ 30%a 0.65 1.12 0.33 0.77 0.80 1.33 6-10 years ≤ 30 0.81 1.73 -- -- 0.85 3.51
Saturated fat
3-5 years < 10%a 0.40 0.55 0.15 0.40 0.33 0.56 6-10 years < 10 0.38 0.64 -- -- 0.59 1.78
Carbohydrate
3-5 years > 55%b 0.85 1.29 0.40 0.84 1.04 1.91 6-10 years > 55 0.79 1.68 -- -- 0.90 6.07
Number of child days
3-5 years 161 161 574 574 352 352 6-10 years 59 59 -- -- 41 39
a Dietary Guidelines recommendation (USDHHS/USDA, 2000). b NRC recommendation (NRC, 1989b).
148 Appendix E Abt Associates Inc.

Abt A
ssociates Inc. A
ppendix E 149
Exhibit E.3 Standard Errors for Estimates of Average Cholesterol, Sodium, and Dietary Fiber Consumed in CACFP Care and Over 24 Hours in Exhibit 4.4a
Family Child Care Homes Head Start Centers Child Care Centers
Daily Recom-
mendation
% Daily Recom-menda-tion in
24 Hours
% Total from Meals
in Care Relative to
% Total Energy
from Meals in Care
% Daily Recom-menda-
tion from
CACFP
% Total from Meals
in Care Relative to
% Total Energy
from Meals in Care
% Daily Recom-menda-tion in
24 Hours
% Daily Recom-menda-
tion from
CACFP
% Daily Recom-menda-tion in
24 Hours
% Daily Recom-menda-
tion from
CACFP
% Total from Meals
in Care Relative to
% Total Energy
from Meals in Care
Cholesterol 3-5 years 300 mga
rs ≤ 2,400 mga 4.37 3.51 0.02 2.35 1.93 0.02 4.05 4.50 0.05
6-10 years ≤ 2,400 mg 3.92 3.50 0.04 -- -- -- 9.12 6.40 0.08 Dietary fiber
3-5 years > 8-10 gb 0.04 4.05 0.03 5.01 5.28 0.05 6-10 years > 11-15 gb 12.69 7.97 0.23
3-5 years 161 161 574 574 41
≤ 3.37 3.20 0.03 2.52
2.03 0.03 3.66 2.80 0.046-10 years
≤ 300 mg
5.72
6.38
0.12
-- -- -- 6.27
3.33
0.12
Sodium3-5 yea
7.63 5.32 3.23
--
4.26 3.46
0.07
--
--
Number of child days
161 574 352 352 3526-10 years 59 59 59 0 0 0 41 41
a NRC recommendation (NRC, 1989b).
b Based on American Health Foundation recommendation of “age-plus-five” grams per day (Williams, 1995).