maternal region of birth and stillbirth in victoria ... fileconclusion maternal region of birth is...
TRANSCRIPT

RESEARCH ARTICLE
Maternal region of birth and stillbirth in
Victoria, Australia 2000–2011: A retrospective
cohort study of Victorian perinatal data
Miranda L. Davies-Tuck1*, Mary-Ann Davey2, Euan M. Wallace1,2
1 The Ritchie Centre, Hudson Institute of Medical Research, Clayton, Melbourne, Victoria, Australia,
2 Department of Obstetrics and Gynaecology, School of Clinical Sciences, Monash University, Clayton,
Melbourne, Victoria, Australia
Abstract
Background
There is growing evidence from high-income countries that maternal country of birth is a risk
factor for stillbirth. We aimed to examine the association between maternal region of birth
and stillbirth between 2000 and 2011 inclusive in Victoria, Australia.
Methods
Retrospective population based cohort study of all singleton births at 24 or more weeks ges-
tational age from 2000–2011 in Victoria, Australia. Stillbirths due to termination of preg-
nancy, babies with congenital anomalies and Indigenous mothers were excluded. Main
Outcome Measure: Stillbirth.
Results
Over the 12-year period there were 685,869 singleton births and 2299 stillbirths, giving an
overall stillbirth rate of 3�4 per 1000 births. After adjustment for risk factors, compared to
women born in Australia/New Zealand, women born in South Asia (aOR 1.27, 95% CI 1.01–
1.53, p = 0.01), were more likely to have a stillbirth whereas women born in South East and
East Asia were (aOR 0.60, (95% CI 0.49–0.72, p<0.001) less likely to have a stillbirth. Addi-
tionally, the increasing rate of stillbirth as gestation length progressed began to rise earlier
and more steeply in the South Asian compared to Australian/New Zealand born women.
The following risk factors were also significantly associated with an increased odds of still-
birth in multivariate analyses: maternal age <20 and 35 years and more, nulliparity, low
socio-economic status, previous stillbirth, no ultrasound reported in 1st trimester, pre-exist-
ing hypertension, antepartum haemorrhage and failure to detect growth restriction
antenatally.
PLOS ONE | https://doi.org/10.1371/journal.pone.0178727 June 6, 2017 1 / 14
a1111111111
a1111111111
a1111111111
a1111111111
a1111111111
OPENACCESS
Citation: Davies-Tuck ML, Davey M-A, Wallace EM
(2017) Maternal region of birth and stillbirth in
Victoria, Australia 2000–2011: A retrospective
cohort study of Victorian perinatal data. PLoS ONE
12(6): e0178727. https://doi.org/10.1371/journal.
pone.0178727
Editor: Kelli K Ryckman, Univesity of Iowa, UNITED
STATES
Received: January 24, 2017
Accepted: May 17, 2017
Published: June 6, 2017
Copyright: © 2017 Davies-Tuck et al. This is an
open access article distributed under the terms of
the Creative Commons Attribution License, which
permits unrestricted use, distribution, and
reproduction in any medium, provided the original
author and source are credited.
Data Availability Statement: The data used in this
manuscript was obtained from a third party and as
such we do not own it. The data was provided by
the Clinical Councils Unit at the Victorian
Department of Health and Human Services. It is a
population-based surveillance system that collects
and analyses comprehensive information on the
health of mothers and babies, in order to contribute
to improvements in their health in Victoria. The
data can be requested by contacting: Clinical
Councils Unit, Department of Health & Human
Services Email: [email protected]

Conclusion
Maternal region of birth is an independent risk factor for stillbirth. Improvements in the rate
of stillbirth, particularly late pregnancy stillbirth, are likely to be gained in high-income set-
tings where clinical care is informed by maternal region of birth.
Introduction
There is still much to do in reducing the many preventable stillbirths that continue to occur in
both high and low income countries[1–3]. Central to any effort in reducing the rate of stillbirth
is a firm understanding of the key causes. Globally, the risk factors for stillbirth with the high-
est population attributable risks are advanced maternal age, maternal infections, non-commu-
nicable diseases, obesity, and prolonged pregnancy[3]. That many of these are increasing in
prevalence [4] may explain, at least in part, why the rate of stillbirth is not decreasing despite
advances in maternity care.
One risk factor for stillbirth in high-income countries (HIC), for which there is growing
evidence is maternal country of birth. It is widely appreciated that stillbirths are relatively
more common among women of certain ethnic groups. However, this apparently increased
risk has been mostly discussed in the context of migration and social disadvantage rather than
ethnicity per se [3, 5]. While both migration, particularly for humanitarian reasons[6], and
social disadvantage are risk factors for stillbirth we believe that they may have obscured the
influence of maternal region of birth itself. Maternal region of birth has been shown to be an
independent risk factor for stillbirth in many high-income countries including the UK[7, 8],
the Netherlands[9], Sweden[10], Singapore[11], and, Australia[12, 13]. Compared to locally
born women, women of South Asian or African birth have a significantly higher rate of still-
birth while women of South East/East Asian birth have a significantly lower rate. The differ-
ences are not trivial. In an urban Australian population South Asian born women were nearly
two and a half times more likely to have a late pregnancy stillbirth than their Australian born
counterparts accessing the same public maternity services[13]. Similarly, in the UK African,
Indian and, Pakistani women were more than twice as likely to have a stillbirth than white
women[7]. For two consecutive years the UK Perinatal MBRRACE reports have shown that
the rate of stillbirth is significantly higher among black and Asian women than among others
[14, 15]. However, only the American Congress of Obstetricians and Gynecologists (ACOG)
clinical guidelines recognise “black women” as being at increased risk of stillbirth. While clini-
cal guidelines from other leading authorities, such as the Royal College of Obstetricians and
Gynaecologists, the National Institute of Clinical Excellence, and the Royal Australian and
New Zealand College of Obstetricians and Gynaecologists recognise maternal characteristics
such as obesity, advanced maternal age, and, nulliparity as risk factors for stillbirth they are
silent on maternal region of birth. With increasing migration to HIC the impact of maternal
region of birth on overall rates of stillbirth is increasing. We believe that for the recent “re-call
to action”3 to be successful an improved understanding of how maternal region of birth
increases stillbirth risk will be needed. In this study we aimed to determine the rates of still-
birth in Victoria, Australia by maternal region of birth, exploring differences between different
region of birth groups.
Maternal region of birth and stillbirth
PLOS ONE | https://doi.org/10.1371/journal.pone.0178727 June 6, 2017 2 / 14
Location: 50 Lonsdale Street, Melbourne, 3000
Victoria, Australia.
Funding: MDT received support from the Stillbirth
Foundation of Australia to undertake this project.
MDT also receives support from the National
Health and Medical Research Council of Australia
Fellowship program. EW receives funding from the
Victorian Governments’ Operational Infrastructure
Support Program. The funders had no role in study
design, data collection and analysis, decision to
publish, or preparation of the manuscript.
Competing interests: MDT has a secondment 1
day per week to CCOPMM. MAD is a part time
employee of Clinical Councils Unit which manages
the VPDC data and EW is a CEO of Safer Care
Victoria, Department of health. These conflicts do
not alter adherence to the PLOS ONE policies.

Methods
We undertook a retrospective cohort study using data that are routinely reported on all births
in Victoria, Australia to the government’s Victorian Perinatal Data Collection (VPDC)
between 2000 to 2011. The authors had full access to the data. For every birth� 20 weeks ges-
tation (or�400g birth weight if gestation not known), regardless of place of birth the VPDC
receives a standardised report detailing over 100 items regarding maternal characteristics,
obstetric conditions, procedures and outcomes, perinatal mortality and morbidity and, birth
defects. Validation of the accuracy of the dataset has been reported for two of the years
included in this study– 2003 and 2011[16, 17]. The most recent validation assessed 93 variables
in the dataset with 17 variables having 99% accuracy and 46 having 95% accuracy. Accuracy
was below 80% for 9 items introduced in 2009. Agreement between medical records and the
VPDC data ranged from 48% to 100%. In regards to the specific variables we used: maternal
country of birth was 94% and stillbirth was 100% accurate. For all other variables assessed the
accuracy ranged between 91% and 98% with the exception of maternal BMI (64%, smoking
77% and antenatal care provider (87%)[17]. There were no missing data for the outcome of
stillbirth. For country of birth, 0.1% of data were missing. For the covariates, data were missing
for 3.1% of the Index of Relative Socio-economic Disadvantage (IRSD–one of the area-level
measures of socio-economic status derived from Australian 2011 census data), 0.002% for par-
ity, 0.02% for maternal age, and 1.5% of previous caesarean section. Missing data were case-
wise excluded. Where data were missing for ‘discipline of antenatal care provider’, ‘1st trimes-
ter ultrasound’, ‘prior stillbirth’, ‘public/private admission status’, ‘smoking’ and, BMI a ‘not
reported’ variable coding was created within the variable.
De-identified data for all singleton births�24 weeks gestational age in Victoria from 2000–
2011 were extracted from the VPDC. Stillbirths due to termination of pregnancy, babies with
congenital anomalies and Indigenous mothers were excluded. Indigenous mothers were
excluded as it is well known, and widely published, that Indigenous women have significantly
higher rates of stillbirth compared to non-Indigenous Australian born women. Accordingly, it
was important that we specifically excluded them from the Australian/NZ born group to pre-
vent bias.
The primary outcome was stillbirth, defined here as a fetal death at or after 24 weeks
gestation.
Maternal ethnicity is not reported to the VPDC. Maternal region of birth was used for these
analyses. Countries of birth were classified into regional groups, as defined by the United
Nations[18], as a surrogate measure of ethnicity, according to an individual’s self-reported
country of birth. Women were defined as being born in Australia or New Zealand (AUS/NZ),
South Asia (SA) (India, Pakistan, Sri Lanka, Afghanistan and Bangladesh), South East and East
Asia (SE-EA) (Vietnam, Malaysia, Indonesia, China, Japan), the Middle-east (ME) (Iraq,
Israel, Joron, Turkey, Yemen, Cyprus), Africa, Europe or, ‘other’.
We also extracted relevant risk factors for stillbirth from the VPDC to allow adjusted analy-
ses. Maternal medical conditions were identified by searching for the relevant ICD-10 AM
codes. The following covariates were examined for all years: maternal age, parity (nulliparous
or parous), IRSD quintiles, prior stillbirth (no prior birth, yes, no, not recorded), previous cae-
sarean (previous caesarean, no previous caesarean, no prior birth), first trimester ultrasound
as a marker of early engagement in antenatal care (yes, no, not recorded), private or public
admission for the birth, pre-existing hypertension, pre-existing diabetes, pre-existing thyroid
disease, gestational hypertension, gestational diabetes, preeclampsia/eclampsia/HELLP
(Hemolysis (H), elevated liver enzymes (EL), and low platelet count (LP) occurring in preg-
nancy), antepartum haemorrhage, gestational age at birth (preterm (24 to 36+6 weeks), term
Maternal region of birth and stillbirth
PLOS ONE | https://doi.org/10.1371/journal.pone.0178727 June 6, 2017 3 / 14

(37+0 to 41+6 weeks) and post term (42 weeks plus)), baby sex, birth weight and, suspected
growth restriction. Birth weights were plotted on a population based birth chart [19] and
babies were defined as small for gestational age (SGA) if the birth weight was less than the 10th
centile for gestation and sex[20]. Previous work has reported differing stillbirth rates by
whether fetal growth restriction was detected in pregnancy or not[7]. Therefore, we searched
maternal medical conditions, obstetric complications and, indications for induction or opera-
tive delivery to identify where growth restriction had been identified using ICD-10-AM codes.
We then computed a variable ‘detection of SGA’ where babies who were not SGA were com-
pared to those who were SGA where growth restriction was detected and those who SGA
where the growth restriction was not detected. From 2009 onwards the following additional
variables were also available: body mass index (BMI) (<18.5, 18.5–24.99, 25–29.99,30–34.99,
�35), smoking (non-smoker, quit by 20 weeks gestation, smoking at 20 weeks gestation and
beyond or not recorded) and, lead antenatal care provider (obstetrician, midwife, general prac-
titioner, none/not recorded).
Statistical methods
Continuous variables were categorised as outlined above. Descriptive statistics were tabu-
lated for each region of birth group. Cells within tables with fewer than 5 cases are reported
as ‘<5’ as per VPDC standard rules. The rates of stillbirth per 1000 births for each region of
birth group and by each gestational week were determined. The overall rate of stillbirth was
calculated as the number of stillbirths divided by the total number of births after 24 weeks.
The rate of stillbirth per week was calculated as the number of stillbirths in that gestational
week divided by the total number of births from that week onwards[21]. The rate of still-
birth per 1000 births for each of the covariates was also determined. The distributions of
gestation at birth for spontaneous labours (excluding labours that were induced and pre-
labour caesarean sections) were graphed and the median gestation at onset of labour by
region of birth compared using the Wilcoxon Rank Sum test. Logistic regression was per-
formed to determine the association between maternal region of birth, risk factors for
stillbirth and stillbirth. Co-variates were selected a priori. All variables significant at the uni-
variate level (p<0.05) were included in the final regression model. Backward stepwise
regression was performed. The likelihood ratio was used to determine the final model.
Potential interactions between covariates and maternal country of birth on stillbirth were
assessed by including interaction terms in the model. The rates of stillbirth differed signifi-
cantly by gestational group therefore an analysis was also performed stratified by gestation.
Because women could have had more than one birth during the period of the study, the
resulting non-independence in the dataset was explored by also running all analyses in nul-
liparous women only. This did not alter the association between maternal region of birth
and stillbirth. Due to the rare nature of the outcome we present the results for all women to
allow multivariate analyses. A p-value<0.05 (two-tailed) was considered statistically signifi-
cant. All analyses were performed using the SPSS statistical package version 20 (IBM Corp.,
Armonk, New York, USA).
Ethics
This study was granted ethical approval by the Monash University Human Research Ethics
Committee (MUHREC) CF12/2748_2012001499 1st Nov 2012. The Consultative Council on
Obstetric and Paediatric Mortality and Morbidity (CCOPMM) approved access to and analysis
of the data.
Maternal region of birth and stillbirth
PLOS ONE | https://doi.org/10.1371/journal.pone.0178727 June 6, 2017 4 / 14

Data availability
The data used in this manuscript were obtained from a third party. The data were provided by
the Clinical Councils Unit at the Victorian Government Department of Health and Human
Services. Contact details for the owner of the data are: Email:[email protected]
Results
Between 2000–2011 there were 685 869 singleton births at 24 or more completed weeks of ges-
tation in Victoria, Australia. Seventy-four percent (n = 505 358) of the women giving birth
were themselves born in either Australia or New Zealand (AUS/NZ), 3.7% (n = 25 634) in
South Asia (SA), 8.0% (n = 54 714) in South-East or East Asia (SE-EA), 2.2% (n = 15 386) in
the Middle East (ME), 2.5% (n = 17 098) in Africa, 5.8% (n = 39 576) in Europe (Eu) and, the
remaining 4.0% (n = 28 103) were born elsewhere. The characteristics of the women are pre-
sented in Table 1.
Maternal region of birth and stillbirth
There were a total of 2299 stillbirths giving an overall stillbirth rate of 3.4 per 1000 births.
About 60% of those occurred before 37 weeks gestation. The rates of stillbirth differed by
maternal region of birth. Overall the rate of stillbirth in AUS/NZ born women was 3.3 per
1000 (n = 1669), compared to 5.1 per 1000 in SA (n = 131), 2.4 per 1000 in SE-EA (n = 133),
4.4 per 1000 in ME (n = 67) and African (n = 76), 3.5 per 1000 in Eu women (n = 138) and, 3.0
per 1000 in ‘other’ born women (n = 85). After adjustment for risk factors significant at the
univariate level, compared to women born in AUS/NZ those born in SA were 27% (95% CI
1.01 to 1.53, p = 0.01) more likely to have a stillbirth while women born in SE-EA were 40%
(95% CI 0.49 to 0.72, p<0.001) less likely to have a stillbirth (Table 2). There was a much
higher rate of stillbirth in preterm births (35.9 per 1000) compared to term (1.4 per 1000) and
post term (1.0 per 1000) births and there was evidence for an interaction between gestation
and maternal region of birth (p<0.001) on stillbirth. Therefore, we also stratified the analyses
by gestation (Table 2). South Asian region of birth was more strongly associated with a term/
post-term stillbirth than a preterm stillbirth. In contrast, SE-EA region of birth was most
strongly protective in the term/post-term period while ME region of birth was only signifi-
cantly associated with preterm stillbirths. Other risk factors for stillbirth from the univariate
and multivariate analyses are presented in S1 and S2 Tables respectively. Based on a report
from the UK7 we also examined whether being born below the 10th centile and antenatal suspi-
cion of growth restriction were associated with stillbirth in our population. We observed that
where SGA existed and had been detected there was a 2.3 fold increased odds (95% CI 1.82 to
3.04, p<0.001) of stillbirth. However, in those pregnancies where an SGA baby had not been
identified before birth the odds of stillbirth was increased 4.3-fold (95% CI 3.92 to 4.76;
p<0.001) (S2 Table).
The specific rate of stillbirth by region of birth and gestational week is presented in Fig 1
The rate of stillbirth for all groups remained fairly stable from 24–37 weeks gestation. After 37
weeks gestation the rate of stillbirth in SA and ME born women was higher than the rate in
AUZ/NZ born women. After 38 weeks gestation the stillbirth rate was also higher in African
born women than AUZ/NZ born women while the rate in SE-EA born women was similar to
that in AUS/NZ born women. The rate of stillbirth in SA and African born women at 39 weeks
was similar to that of AUS/NZ born women at 41 weeks. The specific relative rates of stillbirth
per 1000 on-going pregnancies by country of birth and gestation week from 37 weeks are pre-
sented in Table 3.
Maternal region of birth and stillbirth
PLOS ONE | https://doi.org/10.1371/journal.pone.0178727 June 6, 2017 5 / 14

Table 1. Characteristics of population (> = 24 weeks, singleton, non-Indigenous, no congenital anomaly and excluding terminations) by maternal
region of birth.
Australia
N = 505358
South Asia
N = 25634
South East-East
Asia N = 54714
Middle East
N = 15386
Africa
N = 17098
Europe
N = 39576
Other
N = 28103
2000–2011 n(%) n(%) n(%) n(%) n(%) n(%) n(%)
Maternal Age
Younger than 20yrs 16469(3) 179(0.7) 779(1) 543(4) 461(3) 530(1) 926(3)
20–34 yrs 365534(72) 19700(77) 38683(71) 11509(75) 12272(72) 25214(64) 19182(68)
35plus yrs 123250(24) 5746(22) 15248(28) 3333(22) 4361(26) 13828(35) 7990(28)
Primiparous 215393(43) 13604(53) 25628(49) 4628(30) 6023(35) 16512(42) 11079(62)
Australia
N = 505358
South Asia
N = 25634
South East-East
Asia N = 54714
Middle East
N = 15386
Africa
N = 17098
Europe
N = 39576
Other
N = 28103
IRSD quintiles
1-Most disadvantaged 79211(16) 7320(30) 16706(31) 7956(53) 5481(33) 5877(15) 5799(21)
2 100689(22) 4836(20) 9149(17) 2322(15) 3450(21) 5603(14) 5193(19)
3 103976(21) 4732(19) 9471(18) 2058(14) 2742(17) 8083(21) 5745(21)
4 104187(21) 3790(16) 7780(15) 1335(9) 2250(14) 8760(23) 5115(19)
5-Least disadvantaged 100946(22) 3695(15) 10447(20) 1319(9) 2740(16) 10491(27) 5536(20)
Previous stillbirth 5583(1) 376(2) 438(1) 314(2) 71(0.4) 452(1) 331(1)
Previous caesarean
delivery
71978(15) 3716(15) 6430(12) 1997(13) 2659(16) 5319(14) 3717(14)
Australia
N = 505358
South Asia
N = 25634
South East-East
Asia N = 54714
Middle East
N = 15386
Africa
N = 17098
Europe
N = 39576
Other
N = 28103
First trimester Ultrasound
No 129730(26) 9405(37) 23497(43) 9433(61) 8499(50) 11279(29) 10726(38)
Not recorded 12539(3) 354(1) 1715(3) 297(2) 513(3) 957(2) 726(3)
Private patient 177271(35) 3964(16) 11439(21) 1690(11) 3101(18) 13356(34) 6817(24)
Pre-existing
Hypertension
6677(1) 149(0.6) 305(0.6) 90(0.6) 139(1) 390(1) 305(1)
Pre-existing Diabetes 5961(1) 1327(5) 1606(3) 328(2.1) 386(2) 517(1) 458(2)
Pre-existing Thyroid
disease
4665(1) 409(2) 577(1) 138(1) 152(1) 435(1) 234(1)
Gestational
Hypertension
15759(3) 576(2) 888(2) 283(2) 368(2) 978(3) 780(3)
Australia
N = 505358
South Asia
N = 25634
South East-East
Asia N = 54714
Middle East
N = 15386
Africa
N = 17098
Europe
N = 39576
Other
N = 28103
Gestational Diabetes 18385(4) 2990(12) 5973(11) 1125(7) 1063(6) 2014(5) 1424(5)
Pre eclampsia/HELLP 14784(3) 537(2) 949(2) 268(2) 400(2) 1028(3) 758(3)
APH 16624(3) 670(3) 2300(4) 425(3) 399(2) 1210(3) 839(3)
Suspected FGR 11892(2) 967(4) 1200(2) 397(3) 383(2) 767(2) 548(2)
Gestational age
(completed weeks)
24–36 weeks 28534(6) 1436(6) 2930(5) 728(5) 907(5) 2075(5) 1547(6)
37–41 weeks 470004(93) 23948(93) 51377(93) 14469(94) 15743(92) 37001(94) 24564(89)
42weeks+ 6820(1) 250(1) 407(0.7) 189(1) 448(3) 500(1) 444(2)
Australia
N = 505358
South Asia
N = 25634
South East-East
Asia N = 54714
Middle East
N = 15386
Africa
N = 17098
Europe
N = 39576
Other
N = 28103
Birthweight
Under 10th Centile 40531(8) 4612(18) 6811(12) 1505(10) 1839(11) 2975(8) 2140(8)
Under 3rd Centile 11640(2) 1480(6) 1695(3) 393(3) 517(3) 823(2) 597(2)
Baby sex(Male) 257367(51) 13127(51) 27967(51) 7832(51) 8709(51) 20245(51) 14430(51)
2009–2011 only N = 90812 N = 10209 N = 12534 N = 2965 N = 3934 N = 6587 N = 6452
(Continued )
Maternal region of birth and stillbirth
PLOS ONE | https://doi.org/10.1371/journal.pone.0178727 June 6, 2017 6 / 14
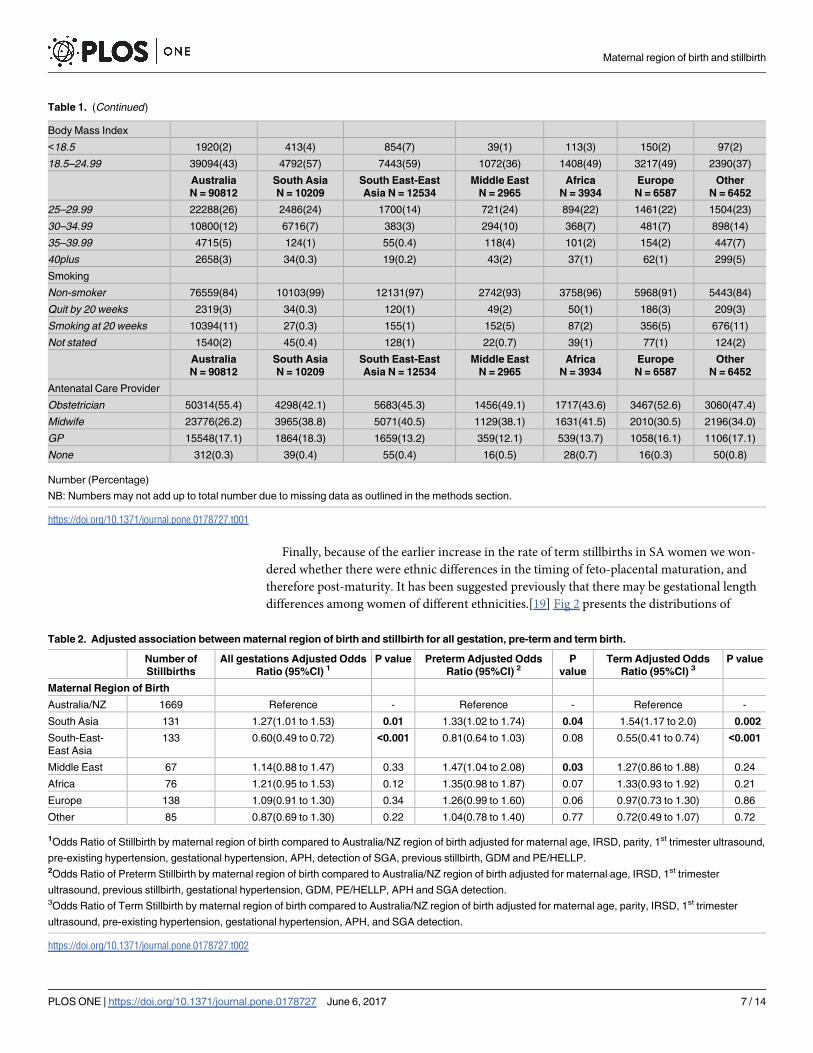
Finally, because of the earlier increase in the rate of term stillbirths in SA women we won-
dered whether there were ethnic differences in the timing of feto-placental maturation, and
therefore post-maturity. It has been suggested previously that there may be gestational length
differences among women of different ethnicities.[19] Fig 2 presents the distributions of
Table 1. (Continued)
Body Mass Index
<18.5 1920(2) 413(4) 854(7) 39(1) 113(3) 150(2) 97(2)
18.5–24.99 39094(43) 4792(57) 7443(59) 1072(36) 1408(49) 3217(49) 2390(37)
Australia
N = 90812
South Asia
N = 10209
South East-East
Asia N = 12534
Middle East
N = 2965
Africa
N = 3934
Europe
N = 6587
Other
N = 6452
25–29.99 22288(26) 2486(24) 1700(14) 721(24) 894(22) 1461(22) 1504(23)
30–34.99 10800(12) 6716(7) 383(3) 294(10) 368(7) 481(7) 898(14)
35–39.99 4715(5) 124(1) 55(0.4) 118(4) 101(2) 154(2) 447(7)
40plus 2658(3) 34(0.3) 19(0.2) 43(2) 37(1) 62(1) 299(5)
Smoking
Non-smoker 76559(84) 10103(99) 12131(97) 2742(93) 3758(96) 5968(91) 5443(84)
Quit by 20 weeks 2319(3) 34(0.3) 120(1) 49(2) 50(1) 186(3) 209(3)
Smoking at 20 weeks 10394(11) 27(0.3) 155(1) 152(5) 87(2) 356(5) 676(11)
Not stated 1540(2) 45(0.4) 128(1) 22(0.7) 39(1) 77(1) 124(2)
Australia
N = 90812
South Asia
N = 10209
South East-East
Asia N = 12534
Middle East
N = 2965
Africa
N = 3934
Europe
N = 6587
Other
N = 6452
Antenatal Care Provider
Obstetrician 50314(55.4) 4298(42.1) 5683(45.3) 1456(49.1) 1717(43.6) 3467(52.6) 3060(47.4)
Midwife 23776(26.2) 3965(38.8) 5071(40.5) 1129(38.1) 1631(41.5) 2010(30.5) 2196(34.0)
GP 15548(17.1) 1864(18.3) 1659(13.2) 359(12.1) 539(13.7) 1058(16.1) 1106(17.1)
None 312(0.3) 39(0.4) 55(0.4) 16(0.5) 28(0.7) 16(0.3) 50(0.8)
Number (Percentage)
NB: Numbers may not add up to total number due to missing data as outlined in the methods section.
https://doi.org/10.1371/journal.pone.0178727.t001
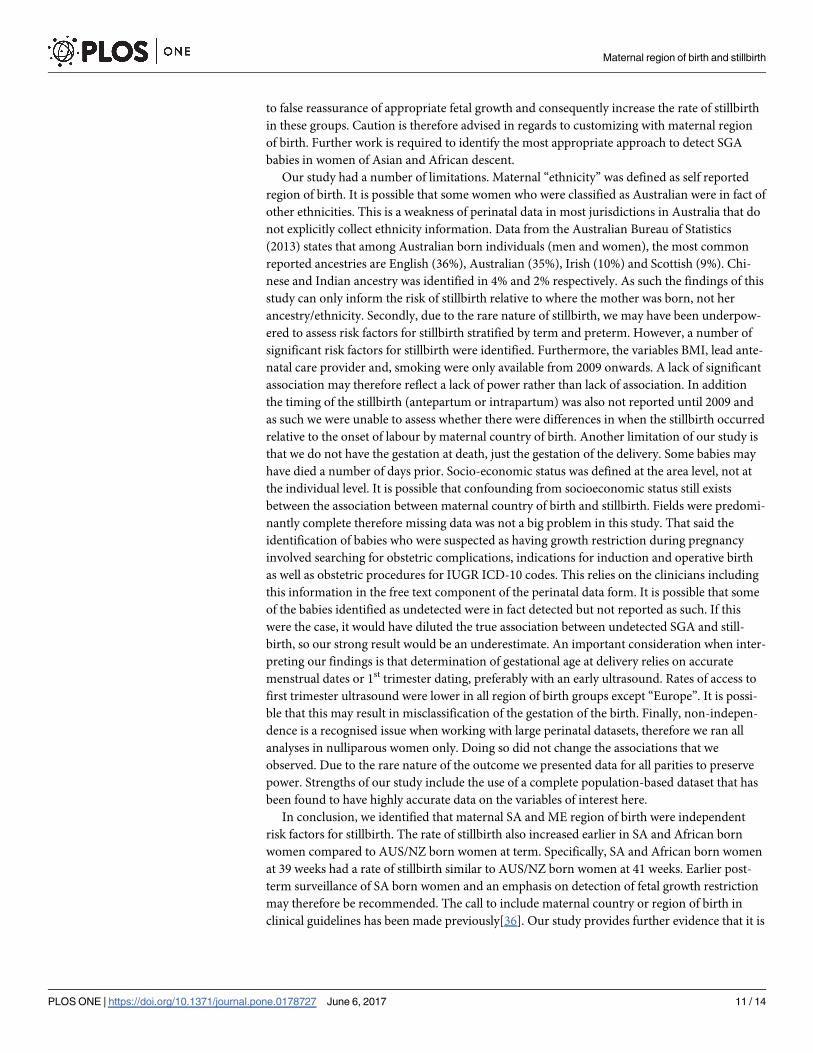
Table 2. Adjusted association between maternal region of birth and stillbirth for all gestation, pre-term and term birth.
Number of
Stillbirths
All gestations Adjusted Odds
Ratio (95%CI) 1P value Preterm Adjusted Odds
Ratio (95%CI) 2P
value
Term Adjusted Odds
Ratio (95%CI) 3P value
Maternal Region of Birth
Australia/NZ 1669 Reference - Reference - Reference -
South Asia 131 1.27(1.01 to 1.53) 0.01 1.33(1.02 to 1.74) 0.04 1.54(1.17 to 2.0) 0.002
South-East-
East Asia
133 0.60(0.49 to 0.72) <0.001 0.81(0.64 to 1.03) 0.08 0.55(0.41 to 0.74) <0.001
Middle East 67 1.14(0.88 to 1.47) 0.33 1.47(1.04 to 2.08) 0.03 1.27(0.86 to 1.88) 0.24
Africa 76 1.21(0.95 to 1.53) 0.12 1.35(0.98 to 1.87) 0.07 1.33(0.93 to 1.92) 0.21
Europe 138 1.09(0.91 to 1.30) 0.34 1.26(0.99 to 1.60) 0.06 0.97(0.73 to 1.30) 0.86
Other 85 0.87(0.69 to 1.30) 0.22 1.04(0.78 to 1.40) 0.77 0.72(0.49 to 1.07) 0.72
1Odds Ratio of Stillbirth by maternal region of birth compared to Australia/NZ region of birth adjusted for maternal age, IRSD, parity, 1st trimester ultrasound,
pre-existing hypertension, gestational hypertension, APH, detection of SGA, previous stillbirth, GDM and PE/HELLP.2Odds Ratio of Preterm Stillbirth by maternal region of birth compared to Australia/NZ region of birth adjusted for maternal age, IRSD, 1st trimester
ultrasound, previous stillbirth, gestational hypertension, GDM, PE/HELLP, APH and SGA detection.3Odds Ratio of Term Stillbirth by maternal region of birth compared to Australia/NZ region of birth adjusted for maternal age, parity, IRSD, 1st trimester
ultrasound, pre-existing hypertension, gestational hypertension, APH, and SGA detection.
https://doi.org/10.1371/journal.pone.0178727.t002
Maternal region of birth and stillbirth
PLOS ONE | https://doi.org/10.1371/journal.pone.0178727 June 6, 2017 7 / 14

spontaneous onset of labour by maternal country of birth. Overall the median onset of labour
for AUS/NZ born women was 40 weeks, for SA born women it was 39 weeks, for SE-EA born
women it was 39 weeks, for African born women it was 40 weeks and, for ME born women it
was 40 weeks (p<0.001).
Discussion
We have confirmed other reports that there is an association between maternal region of birth
and stillbirth. Compared to AUS/NZ born women, women born in SA, Africa and the ME
have higher rates of stillbirth while women born in SE-EA had a lower rate. There was also evi-
dence for an interaction between maternal region of birth and the gestation at which stillbirths
occur. Women born in SA had a stronger odds of term compared to preterm stillbirth whereas
women born in the ME had an increased odds of preterm stillbirth only. Regarding late preg-
nancy stillbirths, the rate of stillbirth increased earlier in pregnancy, and rose more rapidly in
SA and African born women compared to AUS/NZ born women. These observations have
direct implications for the care of women during pregnancy and approaches to reduce the bur-
den of stillbirth.
Disparities in the rates of stillbirth among migrant women have been previously reported in
several high-income countries [7, 9, 13, 22]. However, this increased risk has usually been dis-
cussed in relation to factors related to migration such as social deprivation, lack of education,
Fig 1. The rate of stillbirth per 1000 births for each gestational week by region of birth.
https://doi.org/10.1371/journal.pone.0178727.g001
Table 3. Relative Rate of stillbirth per 1000 ongoing pregnancies per week compared to AUS/NZ women from 37 weeks gestation.
South Asia South-East-East Asia Middle East Africa
37 weeks 1.03 0.21 1.46 0.66
38 weeks 1.39 1.23 1.79 0.81
39 weeks 2.17 0.72 1.47 2.08
40 weeks 3.19 0.93 1.51 1.30
41 weeks and beyond 2.16 0.84 0.43 2.07
https://doi.org/10.1371/journal.pone.0178727.t003
Maternal region of birth and stillbirth
PLOS ONE | https://doi.org/10.1371/journal.pone.0178727 June 6, 2017 8 / 14

troubles communicating and understanding advice and poor access to care[3]. These are cer-
tainly important. In the current study we have confirmed disparities in social deprivation and
access to pregnancy care by maternal region of birth. However, that the odds of stillbirth after
adjustment for these confounding factors remained higher among SA, African, and, ME born
women and lower in SE-EA born women suggests that maternal region of birth is, in itself, an
important risk factor. In particular, the odds ratio for term stillbirth in SA born women, at 1.5,
is broadly the same as that for smoking, preeclampsia or obesity[3]. That maternal region of
birth itself is an independent risk factor is particularly supported by our observation that
SE-EA born women, who despite having increased prevalence of social disadvantage, poor
access to 1st trimester ultrasound, pre-existing diabetes, GDM, APH and, small for gestation
babies had the lowest rates of stillbirth, with almost half the rate of term stillbirth than AUS/
NZ born women and a third of the rate of SA or African born women.
We also identified that the association between maternal region of birth and stillbirth dif-
fered significantly by gestation. ME region of birth was only associated with preterm stillbirths.
The explanation for this is not immediately apparent but it may reflect a higher rate of consan-
guinity [23] in this group which has been shown to be associated with preterm birth[24]. In
contrast, SA region of birth was more strongly associated with late pregnancy stillbirth and the
rate of stillbirth increased more steeply and at an earlier gestation in south Asian and African
born women. These findings are consistent with other studies that determined maternal region
of birth specific differences in perinatal mortality at different gestational ages[9, 25].
We also found, consistent with others[26, 27], that the median gestation at which spontane-
ous labour onset occurred was significantly earlier in SA born women. It is generally agreed
that at term and beyond the placenta is progressively unable to meet the increasing metabolic
Fig 2. Frequency distributions of spontaneous onset of labour by region of birth.
https://doi.org/10.1371/journal.pone.0178727.g002
Maternal region of birth and stillbirth
PLOS ONE | https://doi.org/10.1371/journal.pone.0178727 June 6, 2017 9 / 14

needs of the fetus, leading to falling fetal oxygenation[28] and this explains the increased risk
of stillbirth in the post term period. Our findings suggest that there may be maternal region of
birth differences in the rate of “placental aging”. Supporting this, Indian women have signifi-
cantly smaller placental surface area, weight and volume than Malaysian and Chinese women
after correction for gestation of baby and maternal size[29]. Differences in other aspects of pla-
cental function may therefore also exist that explain the shorter average duration of pregnancy
and the higher stillbirth rates in late pregnancy. Finally there is emerging evidence to suggest
that telomeres and the enzyme that controls their length, telomerase differ by ethnicity and
are associated with stillbirth and intra-uterine growth restriction[28]. Intriguingly, we also
observed that SE-EA born women also had shorter pregnancies than AUS/NZ and Eu women
and yet they had the lowest stillbirth rates of all women. Further research aimed at understand-
ing why this group of women have the lowest rates of stillbirth is needed. Other factors that
may explain the increased rate of stillbirth in these region of birth groups that were not able to
be assessed in this study include time spent in Australia, cultural practices and language barri-
ers. Further work aimed at understanding all of these mechanisms is needed. Nonetheless, as
highlighted in the most recent Lancet Stillbirth series 14% of stillbirths worldwide are attrib-
uted to a prolonged pregnancy[3]. Whatever the mechanism(s), our findings, and those of oth-
ers [9, 25, 30], suggest that the optimum gestation for birth may differ by a mother’s region of
birth. Of course, what defines optimal birth gestation for women of different backgrounds is
unclear. A population based study in the Netherlands aimed to answer this very question[31].
Although though not statistically significant, otherwise healthy African women tended to have
a lower risk of adverse outcomes from 38 weeks gestation with an induced earlier birth rather
than expectant management. Not surprisingly, the numbers of induced births needed to pre-
vent one stillbirth were very large [31] suggesting that routine induction of labour is unlikely
to be a suitable approach. In our current study, at 39 weeks gestation SA and African born
women had a rate of stillbirth similar to AUS/NZ born women at 41 weeks. Clinical care
guidelines (NICE guidelines, Royal Australia and New Zealand College of Obstetricians and,
Gynaecologists Guidelines (RANZCOG)) recommend routine ultrasound assessment and/or
induction of pregnancies that are post-term. A more pragmatic approach to reduce the rates of
stillbirth in these groups may be to suggest that post-term surveillance in south Asian and Afri-
can born women begins at 39 weeks[9, 25, 30].
Being small for gestational age is the largest single risk factor for stillbirth with over half of
all “unexplained” stillbirths being SGA[7]. If this is true for our population then undetected
fetal growth restriction could explain up to 1/3 of all Victorian stillbirths. We would echo the
call of others [32, 33] that the better detection of the growth restricted fetus should be a focus
of improvements in clinical care provision. Indeed, regardless of maternal region of birth, we
found that where growth restriction remained undetected there was a 4.3 fold increased odds
of stillbirth. This is consistent with a recent UK study that reported a 6.5 fold increased risk of
stillbirth where growth restriction was undetected[7]. However, antenatal detection of the
growth restricted fetus, particularly at term, remains challenging[34]. In our study only 29% of
babies born to AUS/NZ born mothers who were born SGA were detected antenatally. In
babies born to SA and African born mothers it was only 21%. This is particularly relevant as
the frequencies of SGA babies are higher in Asian and African born women. While improving
detection is an obvious target, how best to achieve this is less clear[34]. There is growing inter-
est in the application of antenatal growth charts customized for maternal height, weight, parity,
ethnicity and, fetal sex to improve the detection of SGA babies[32]. Critics of customization
however argue that the influence of these factors, in particular maternal ethnicity cannot be
considered a physiological driver of baby size[35]. SA and African immigrant women have
both higher rates of SGA infants and stillbirth, so customizing for maternal ethnicity may lead
Maternal region of birth and stillbirth
PLOS ONE | https://doi.org/10.1371/journal.pone.0178727 June 6, 2017 10 / 14
to false reassurance of appropriate fetal growth and consequently increase the rate of stillbirth
in these groups. Caution is therefore advised in regards to customizing with maternal region
of birth. Further work is required to identify the most appropriate approach to detect SGA
babies in women of Asian and African descent.
Our study had a number of limitations. Maternal “ethnicity” was defined as self reported
region of birth. It is possible that some women who were classified as Australian were in fact of
other ethnicities. This is a weakness of perinatal data in most jurisdictions in Australia that do
not explicitly collect ethnicity information. Data from the Australian Bureau of Statistics
(2013) states that among Australian born individuals (men and women), the most common
reported ancestries are English (36%), Australian (35%), Irish (10%) and Scottish (9%). Chi-
nese and Indian ancestry was identified in 4% and 2% respectively. As such the findings of this
study can only inform the risk of stillbirth relative to where the mother was born, not her
ancestry/ethnicity. Secondly, due to the rare nature of stillbirth, we may have been underpow-
ered to assess risk factors for stillbirth stratified by term and preterm. However, a number of
significant risk factors for stillbirth were identified. Furthermore, the variables BMI, lead ante-
natal care provider and, smoking were only available from 2009 onwards. A lack of significant
association may therefore reflect a lack of power rather than lack of association. In addition
the timing of the stillbirth (antepartum or intrapartum) was also not reported until 2009 and
as such we were unable to assess whether there were differences in when the stillbirth occurred
relative to the onset of labour by maternal country of birth. Another limitation of our study is
that we do not have the gestation at death, just the gestation of the delivery. Some babies may
have died a number of days prior. Socio-economic status was defined at the area level, not at
the individual level. It is possible that confounding from socioeconomic status still exists
between the association between maternal country of birth and stillbirth. Fields were predomi-
nantly complete therefore missing data was not a big problem in this study. That said the
identification of babies who were suspected as having growth restriction during pregnancy
involved searching for obstetric complications, indications for induction and operative birth
as well as obstetric procedures for IUGR ICD-10 codes. This relies on the clinicians including
this information in the free text component of the perinatal data form. It is possible that some
of the babies identified as undetected were in fact detected but not reported as such. If this
were the case, it would have diluted the true association between undetected SGA and still-
birth, so our strong result would be an underestimate. An important consideration when inter-
preting our findings is that determination of gestational age at delivery relies on accurate
menstrual dates or 1st trimester dating, preferably with an early ultrasound. Rates of access to
first trimester ultrasound were lower in all region of birth groups except “Europe”. It is possi-
ble that this may result in misclassification of the gestation of the birth. Finally, non-indepen-
dence is a recognised issue when working with large perinatal datasets, therefore we ran all
analyses in nulliparous women only. Doing so did not change the associations that we
observed. Due to the rare nature of the outcome we presented data for all parities to preserve
power. Strengths of our study include the use of a complete population-based dataset that has
been found to have highly accurate data on the variables of interest here.
In conclusion, we identified that maternal SA and ME region of birth were independent
risk factors for stillbirth. The rate of stillbirth also increased earlier in SA and African born
women compared to AUS/NZ born women at term. Specifically, SA and African born women
at 39 weeks had a rate of stillbirth similar to AUS/NZ born women at 41 weeks. Earlier post-
term surveillance of SA born women and an emphasis on detection of fetal growth restriction
may therefore be recommended. The call to include maternal country or region of birth in
clinical guidelines has been made previously[36]. Our study provides further evidence that it is
Maternal region of birth and stillbirth
PLOS ONE | https://doi.org/10.1371/journal.pone.0178727 June 6, 2017 11 / 14

now time for all clinical guidelines to recognize maternal region of birth as a risk factor for
stillbirth in its own right.
Supporting information
S1 Table. Crude association between maternal region of birth, covariates and stillbirth.
(DOCX)
S2 Table. Adjusted associations between covariates and stillbirth.
(DOCX)
Acknowledgments
We wish acknowledge that the source of the data in this study was the Consultative Council on
Obstetric and Paediatric Mortality and Morbidity. We would also like to thank the Stillbirth
Subcommittee of the Consultative Council on Obstetric and Paediatric Mortality and Morbid-
ity (CCOPMM) and Gemma Wills for collating and providing the PSANZ-Perinatal Death
Classification data.
Author Contributions
Conceptualization: MDT MAD EW.
Data curation: MDT MAD EW.
Formal analysis: MDT MAD.
Funding acquisition: MDT.
Investigation: MDT MAD.
Methodology: MDT MAD EW.
Project administration: MDT MAD EW.
Resources: EW.
Supervision: EW.
Validation: MDT MAD EW.
Visualization: MDT MAD EW.
Writing – original draft: MDT MAD EW.
Writing – review & editing: MDT MAD EW.
References1. de Bernis L, Kinney MV, Stones W, Ten Hoope-Bender P, Vivio D, Leisher SH, et al. Stillbirths: ending
preventable deaths by 2030. Lancet. 2016; 387(11019):703–16.
2. Flenady V, Wojcieszek AM, Middleton P, Ellwood D, Erwich JJ, Coory M, et al. Stillbirths: recall to action
in high-income countries. Lancet 2016; 387(10019):691–702. https://doi.org/10.1016/S0140-6736(15)
01020-X PMID: 26794070
3. Lawn JE, Blencowe H, Waiswa P, Amouzou A, Mathers C, Hogan D, et al. Stillbirths: rates, risk factors,
and acceleration towards 2030. Lancet 2016; 387(10018):587–603. https://doi.org/10.1016/S0140-
6736(15)00837-5 PMID: 26794078
4. Smith GCS, Fretts RC. Stillbirth. Lancet. 2007; 370:1715. https://doi.org/10.1016/S0140-6736(07)
61723-1 PMID: 18022035
Maternal region of birth and stillbirth
PLOS ONE | https://doi.org/10.1371/journal.pone.0178727 June 6, 2017 12 / 14

5. Flenady V, Koopmans L, Middleton P, Frøen JF, Smith GC, Gibbons K, et al. Major risk factors for still-
birth in high-income countries: a systematic review and meta-analysis. Lancet. 2011; 377:1331–40.
https://doi.org/10.1016/S0140-6736(10)62233-7 PMID: 21496916
6. Gibson-Helm M, Teede H, Block A, Knight M, East C, Wallace EM, et al. Maternal health and pregnancy
outcomes among women of refugee background from African countries: a retrospective, observational
study in Australia. BMC Pregnancy Childbirth 2014; 14(392).
7. Gardosi J, Madurasinghe V, Williams M, Malik A, Francis A. Maternal and fetal risk factors for stillbirth:
population based study. BMJ. 2013; 346(f108).
8. Raleigh VS, Botting B, Balarajan R. Perinatal and postneonatal mortality in England and Wales among
immigrants from the Indian subcontinent. Indian J Pediatr. 1990; 57:551–62. PMID: 2286408
9. Ravelli ACJ, Tromp M, Eskes M, Droog JC, van der Post JA, Jager KJ, et al. Ethnic differences in still-
birth and early neonatal mortality in The Netherlands. J Epidemiol Community Health. 2011; 64(8):696–
701.
10. Ekeus C, Cnattingius S, Essen B, Hjern A. Stillbirth among foreign-born women in Sweden. Eur J Public
Health. 2011; 21(6):788–92. https://doi.org/10.1093/eurpub/ckq200 PMID: 21224278
11. Viegas OA, Leong WP, Chia YT, Yeoh SC, Ratnam SS. Ethnicity and obstetric performance in Singa-
pore. J Biosoc Sci. 1995; 27(2):151–62. PMID: 7738078
12. de Graaff EC, Wijs LA, Leemaqz S, Dekker GA. Risk Factors for Stillbirth in a Socio-Economically Dis-
advantaged Urban Australian Population. J Matern Fetal Neonatal Med. 2016; 9:1–15.
13. Drysdale H, Ranasinha S, Kendell A, Knight M, Wallace E. Ethnicity and the risk of late-pregnancy still-
birth. MJA. 2012; 197:278–81. PMID: 22938125
14. Manktelow BM, Smith LK, Evans TA, Hyman-Taylor P, Kurinczuk JJ, Field DJ, et al. MBRRACE-UK
Perinatal Mortality Surveillance Report UK Perinatal Death for Births from January to December 2013.
In: The Infant Mortality and Morbidity Studies Group DoHS, University of Leicester., editor.
Leicester2015.
15. Manktelow BN, Smith LK, Seaton SE, Hyman-Taylor P, Kurinczuk JJ, Field DJ, et al. MBRRACE-UK
Perinatal Mortality Surveillance Report, UK Perinatal Deaths for Births from January to December
2014. In: The Infant Mortality and Morbidity Studies DoHS, University of Leicester., editor.
Leicester2016.
16. Davey M-A, Sloan M-L, Palma S, Riley M, King J. Methodological processes in validating and analysing
the quality of population-based data: a case study using the Victorian Perinatal Data Collection. Health
Information Management. 2013; 42(3):12–9. PMID: 24067237
17. Flood MM, McDonald SJ, Pollock WE, Davey M-A. Data Accuracy in the Victorian Perinatal Data Col-
lection: Results of a validation study of 2011 data. Health Information Management Journal. 2017;Arti-
cle in Press.
18. United Nations. Composition of macrogeographical(continental) regions, geographic sub-regions, and
selected economic and other groupings 2011 [Accessed May, 2015.].
19. Roberts CL, Lancaster PA. Australian national birthweight percentiles by gestational age. Med J Aust.
1999; 179(3).
20. Dobbins T, Sullivan E, Roberts C, Simpson J. Australian national birthweight percentiles by sex and
gestational age, 1998–2007. Medical Journal of Australia. 2012; 197(5):291. PMID: 22938128
21. Joseph KS. The fetuses-at-risk approach: clarification of semantic and conceptual misapprehension.
BMC Pregnancy Childbirth. 2008; 8(11).
22. Dahlen HG, Schmied V, Dennis CL, Thornton C. Rates of obstetric intervention during birth and
selected maternal and perinatal outcomes for low risk women born in Australia compared to those born
overseas. BMC Pregnancy Childbirth 2013; 13(100).
23. Barbour B, Salameh P. Consanguinity in Lebanon: prevalence, distribution and determinants. J Biosoc
Sci. 2009; 14(4):505–17.
24. Maghsoudlou S, Cnattingius S, Aarabi M, Montgomery SM, Semnani S, Stephansson O, et al. Consan-
guineous marriage, prepregnancy maternal characteristics and stillbirth risk: a population-based case-
control study. Acta Obstet Gynecol Scand. 2015; 94(10):1095–101. https://doi.org/10.1111/aogs.12699
PMID: 26085011
25. Balchin I, Whittaker JC, Patel R, Lamont RF, Steer PJ. Racial variation in the association between ges-
tational age and perintal mortality: prospective study. BMJ. 2007; 334(833).
26. Patel RR, Steer P, Doyle P, Little MP, Elliott P. Does gestation vary by ethnic group? A London-based
study of over 122 000 pregnancies with spontaneous onset of labour. Int J Epidemiol 2004; 33:107–13.
https://doi.org/10.1093/ije/dyg238 PMID: 15075154
Maternal region of birth and stillbirth
PLOS ONE | https://doi.org/10.1371/journal.pone.0178727 June 6, 2017 13 / 14

27. McFadyen IR, Campbell-Brown M, Abraham R, North WR, Haines AP. Factors affecting birthweights in
Hindus, Moslems and Europeans. Br J Obstet Gynaecol 1984; 91:968–72. PMID: 6487570
28. Smith M, Maiti K, Aitken RJ. Unexplained antepartum stillbirth: a consequence of placental aging? Pla-
centa. 2013; 34(4):310–3. https://doi.org/10.1016/j.placenta.2013.01.015 PMID: 23452441
29. Sivarao S, Vidyadaran MK, Jammal AB, Zainab S, Goh YM, Ramesh KN. Weight, volume and surface
area of placenta of normal pregnant women and their relation to maternal and neonatal parameters in
Malay, Chinese and Indian ethnic groups. Placenta 2002; 23(8–9):691–6. PMID: 12361688
30. Balchin I, Whittaker JC, Lamont RF, Steer PJ. Maternal and fetal characteristics associated with meco-
nium-stained amniotic fluid. Obstet Gynecol 2011; 117(4):828–35. https://doi.org/10.1097/AOG.
0b013e3182117a26 PMID: 21383642
31. Kazemier BM, Ravelli AC, de Groot CJ, Mol BW. Optimal timing of near-term delivery in different ethnic-
ities: a national cohort study. BJOG. 2014; 121(10):1274–82. https://doi.org/10.1111/1471-0528.12938
PMID: 24989894
32. Gardosi J, Giddings S, Buller S, Southam M, Williams M. Preventing stillbirths through improved ante-
natal recognition of pregnancies at risk due to fetal growth restriction. Public Health. 2014; 128(8):698–
702. https://doi.org/10.1016/j.puhe.2014.06.022 PMID: 25151298
33. Sovio U, White IR, Dacey A, Pasupathy D, Smith GC. Screening for fetal growth restriction with univer-
sal third trimester ultrasonography in nulliparous women in the Pregnancy Outcome Prediction (POP)
study: a prospective cohort study. Lancet. 2015; 386(10008):2989–97.
34. MacDonald T, McCarthy EA, Walker SP. Shining light in dark corners: Diagnosis and management of
late-onset fetal growth restriction. ANZJOG. 2015; 55:3–10. https://doi.org/10.1111/ajo.12264 PMID:
25557743
35. Carberry AE, Gordon A, Bond DM, Hyett J, Raynes-Greenow CH, Jeffery HE. Customised versus popu-
lation-based growth charts as a screening tool for detecting small for gestational age infants in low-risk
pregnant women. Cochrane Database Syst Rev. 2014; 16(5).
36. Steer PJ. Race and ethnicity in biomedical publications. BJOG. 2015; 122(4):464–7. https://doi.org/10.
1111/1471-0528.13170 PMID: 25413938
Maternal region of birth and stillbirth
PLOS ONE | https://doi.org/10.1371/journal.pone.0178727 June 6, 2017 14 / 14