math 1 0 5 cal cu l ator s for stati sti cs
TRANSCRIPT

STATISTICS CALCULATORS FOR MATH 105

Statistics Calculators for Math 105

This text is disseminated via the Open Education Resource (OER) LibreTexts Project (https://LibreTexts.org) and like the hundredsof other texts available within this powerful platform, it is freely available for reading, printing and "consuming." Most, but not all,pages in the library have licenses that may allow individuals to make changes, save, and print this book. Carefullyconsult the applicable license(s) before pursuing such effects.
Instructors can adopt existing LibreTexts texts or Remix them to quickly build course-specific resources to meet the needs of theirstudents. Unlike traditional textbooks, LibreTexts’ web based origins allow powerful integration of advanced features and newtechnologies to support learning.
The LibreTexts mission is to unite students, faculty and scholars in a cooperative effort to develop an easy-to-use online platformfor the construction, customization, and dissemination of OER content to reduce the burdens of unreasonable textbook costs to ourstudents and society. The LibreTexts project is a multi-institutional collaborative venture to develop the next generation of open-access texts to improve postsecondary education at all levels of higher learning by developing an Open Access Resourceenvironment. The project currently consists of 14 independently operating and interconnected libraries that are constantly beingoptimized by students, faculty, and outside experts to supplant conventional paper-based books. These free textbook alternatives areorganized within a central environment that is both vertically (from advance to basic level) and horizontally (across different fields)integrated.
The LibreTexts libraries are Powered by MindTouch and are supported by the Department of Education Open Textbook PilotProject, the UC Davis Office of the Provost, the UC Davis Library, the California State University Affordable Learning SolutionsProgram, and Merlot. This material is based upon work supported by the National Science Foundation under Grant No. 1246120,1525057, and 1413739. Unless otherwise noted, LibreTexts content is licensed by CC BY-NC-SA 3.0.
Any opinions, findings, and conclusions or recommendations expressed in this material are those of the author(s) and do notnecessarily reflect the views of the National Science Foundation nor the US Department of Education.
Have questions or comments? For information about adoptions or adaptions contact [email protected]. More information on ouractivities can be found via Facebook (https://facebook.com/Libretexts), Twitter (https://twitter.com/libretexts), or our blog(http://Blog.Libretexts.org).
This text was compiled on 03/11/2022
®
1 3/11/2022
TABLE OF CONTENTSHere is a list of calculators to be used in Professor Jessica Kuang's online Statistics course. The contents were derived from the StatisticsCalculators created by Dr. Larry Green from Lake Tahoe Community College, and the user interface was designed with Dr. Nigie Shi fromBakersfield College. Please report errors to Dr. Jessica Kuang at jkuangATvcccd.edu.
1: SCIENTIFIC CALCULATOR POWERED BY DESMOS
2: ONE VARIABLE STATISTICSThis calculator computes the mean, standard deviation and 5-number summary from a one variable data set.
3: MEAN AND STANDARD DEVIATION FROM A FREQUENCY TABLEThis calculator computes mean, standard deviation, and 5-number summary from a frequency or probability distribution table.
4: BINOMIAL PROBABILITY DISTRIBUTIONThis calculator computes P(a ≤≤\leq x ≤≤\leq b), where x is a binomial random variable, and a and b are the lower bound and the upperbound for x respectively.
5: NORMAL PROBABILITY DISTRIBUTIONThis calculator computes P(a < x < b), where x is a normal random variable, and a and b are the lower bound and upper bound for x.
6: LINEAR CORRELATION AND REGRESSIONThis calculator conducts linear regression analysis.
7: CONFIDENCE INTERVAL FOR A POPULATION PROPORTIONThis calculator computes the confidence interval for a population proportion.
8: SAMPLE SIZE TO ESTIMATE A POPULATION PROPORTIONThe student enters in the error, confidence level, and estimate for the population proportion (if known). The computer then calculates thesample size needed.
9: CONFIDENCE INTERVAL FOR A POPULATION MEAN GIVEN STATISTICSThis calculator computes the confidence interval for a population mean given statistics.
10: CONFIDENCE INTERVAL FOR A POPULATION MEAN GIVEN DATAThis calculator computes the confidence interval for a population mean given data.
11: SAMPLE SIZE TO ESTIMATE A POPULATION MEANThe student enters in the population standard deviation, the error, and the confidence level and the computer calculates the needed samplesize.
12: HYPOTHESIS TEST FOR A POPULATION PROPORTIONThe student enters the sample size, number of successes, hypothesized proportion, and the tail type. The calculator then computes the teststatistic and p-value.
13: HYPOTHESIS TEST FOR A POPULATION MEAN GIVEN STATISTICSThis calculator conducts hypothesis test for a population mean given statistics.

2 3/11/2022
14: HYPOTHESIS TEST FOR A POPULATION MEAN GIVEN DATAThe student enters in the data, population standard deviation (if known), tail type, and hypothesized population mean. The computer thencalculates the sample mean, test statistic and p-value.
15: TWO INDEPENDENT PROPORTIONS COMPARISONThe student enters the sample sizes, the number of successes for each, the tail type, and the confidence level. Then the computer presents thetest statistic, the p-value, and the confidence interval for the difference between the population proportions.
16: TWO INDEPENDENT SAMPLE MEANS COMPARISON GIVEN STATISTICSThe student enters the sample sizes, sample means, sample standard deviations, tail type, and confidence level. Then the computer calculatesthe test statistic, p-value, and confidence interval.
17: TWO INDEPENDENT SAMPLE MEANS COMPARISON GIVEN DATAThe student enters in the data, tail type and confidence level. The computer then calculates the test statistic, p-value and confidence interval.
18: TWO DEPENDENT SAMPLE MEANS COMPARISON GIVEN DATAThe student enters in the data for two dependent samples and then enters the tail type and confidence level. The computer then produces thetest statistic, p-value, and confidence interval for the difference between the two dependent sample means.
19: CHI-SQUARE TEST FOR GOODNESS OF FITThe student enters in the observed and expected values. Then the computer calculates the test statistic and p-value using the chi-squaregoodness of fit test.
20: CHI-SQUARE TEST FOR INDEPENDENCEThe student fills in the table of observed counts. Then the computer computes the test statistic and p-value using the chi square test forindependence.
21: ONE-WAY ANOVAThe student enters in the data sets and the computer calculates the test statistic an p-value for the ANOVA hypothesis test.
22: GRAVEYARD22.1: BINOMIAL DISTRIBUTION CALCULATOR22.2: ONE VARIABLE STATISTICS CALCULATOR22.3: NORMAL PROBABILITY CALCULATOR22.4: HYPOTHESIS TEST FOR A POPULATION MEAN WITH DATA CALCULATOR22.5: HYPOTHESIS TEST AND CONFIDENCE INTERVAL CALCULATOR FOR TWO DEPENDENT SAMPLES22.6: FULL REGRESSION ANALYSIS CALCULATOR22.7: SAMPLE SIZE FOR A MEAN CALCULATOR22.8: NEEDED SAMPLE SIZE FOR A CONFIDENCE INTERVAL FOR A POPULATION PROPORTION CALCULATOR22.9: TWO INDEPENDENT SAMPLES WITH DATA HYPOTHESIS TEST AND CONFIDENCE INTERVAL CALCULATOR22.10: HYPOTHESIS TEST AND CONFIDENCE INTERVAL CALCULATOR FOR TWO DEPENDENT SAMPLES22.11: CHI-SQUARE GOODNESS OF FIT TEST CALCULATOR22.12: CHI-SQUARE TEST FOR HOMOGENEITY CALCULATOR22.13: CHI-SQUARE TEST FOR INDEPENDENCE CALCULATOR22.14: ANOVA CALCULATOR22.15: INDEX22.16: GLOSSARY
1.1 3/11/2022 https://stats.libretexts.org/@go/page/19734
1: Scientific Calculator powered by DESMOS
This is a scientific calculator powered by DESMOS, and the same calculator is also available at the bottom of each statisticscalculator. Please report error to Dr. Jessica Kuang at jkuangATvcccd.edu.
Log In Sign Math Tools Classroom Resources
Terms of Service | Privacy Policy | Help
Scientific Calculator powered by DESMOS

2.1 3/11/2022 https://stats.libretexts.org/@go/page/19735
2: One Variable Statistics
This calculator computes the mean, standard deviation, and 5-number summary from a one-variable data set. Please report theerror to Dr. Jessica Kuang at jkuangATvcccd.edu.
To learn how to use this calculator, please watch a short video here.
Input
Type in the values from the data set separated by commas (for example, 2,4,5,8,11,2), choose between population standarddeviation and sample standard deviation and click Calculate.
Population Standard Deviation Sample Standard Deviation
Calculate
Output
Mean:
Minimum:
Q1:
Median:
Q3:
Maximum:
Standard Deviation:
Variance:
Interquartile Range (IQR):
One Variable Statistics

2.2 3/11/2022 https://stats.libretexts.org/@go/page/19735
Sample Size:
Scienti�c Calculator

3.1 3/11/2022 https://stats.libretexts.org/@go/page/19736
3: Mean and Standard Deviation from a Frequency Table
This calculator computes mean, standard deviation, and 5-number summary from a frequency or probability distributiontable. Please report error to Dr. Jessica Kuang at jkuangATvcccd.edu.
To learn how to use this calculator, please watch a short video here.
Input
Type in the data values and frequencies below. Put the midpoints in increasing order and do not include any values with zerofrequency.
data value
frequency
Population Standard Deviation
Sample Standard Deviation
Calculate
Output
Mean:
Standard Deviation:
Five Point Summary:
Sample Size:
Scienti�c Calculator
Mean and Standard Deviation from a Frequency Table
4.1 3/11/2022 https://stats.libretexts.org/@go/page/19737
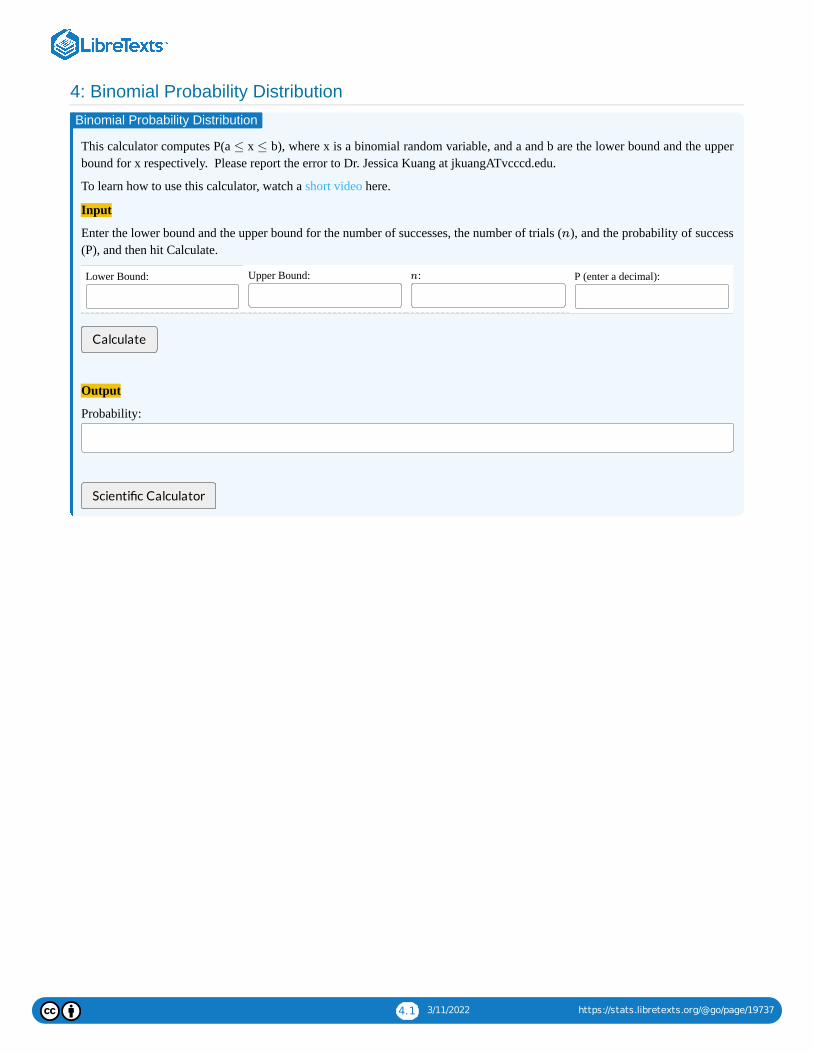
4: Binomial Probability Distribution
This calculator computes P(a x b), where x is a binomial random variable, and a and b are the lower bound and the upperbound for x respectively. Please report the error to Dr. Jessica Kuang at jkuangATvcccd.edu.
To learn how to use this calculator, watch a short video here.
Input
Enter the lower bound and the upper bound for the number of successes, the number of trials ( ), and the probability of success(P), and then hit Calculate.
Lower Bound: Upper Bound: : P (enter a decimal):
Calculate
Output
Probability:
Scienti�c Calculator
Binomial Probability Distribution
≤ ≤
n
n

5.1 3/11/2022 https://stats.libretexts.org/@go/page/19738
5: Normal Probability Distribution
This calculator computes P(a < x < b), where x is a normal random variable, and a and b are the lower bound and upper boundfor x. Please report the error to Dr. Jessica Kuang at jkuangATvcccd.edu.
To learn how to use this calculator, please watch a short video here.
Input
Mean: Standard Deviation:
Output
Enter 2 out of 3 values below to either calculate the probability or a boundary value (enter integers or decimals only)
Lower Bound: Upper Bound: Probability:
Calculate
Error Message:
Scienti�c Calculator
Normal Probability Distribution

6.1 3/11/2022 https://stats.libretexts.org/@go/page/19739
6: Linear Correlation and Regression
This calculator creates a scatter plot, the regression equation, and , and performs the hypothesis test for a nonzero correlation. Please report the error to Dr.Jessica Kuang at jkuangATvcccd.edu.
To learn how to use this calculator, please watch a short video here.
Input
Put the independent variable's data separated by commas in the first row and the dependent variable's data separated by commas in the second row, then click PlotPoints and Calculate.
Explanatory/Independent Variable (x):
Response/Dependent Variable (y):
Plot Points and Calculate Reset
Output
Regression Equation: : :
Hypothesis:
Hypothesis:
Hypothesis:
Test Statistic ( ):
-value:
Scienti�c Calculator
Linear Correlation and Regression
r r2
r
r2
: ρ = 0, : ρ ≠ 0H0 H1
: ρ = 0, : ρ < 0H0 H1
: ρ = 0, : ρ > 0H0 H1
t
p
7.1 3/11/2022 https://stats.libretexts.org/@go/page/19742
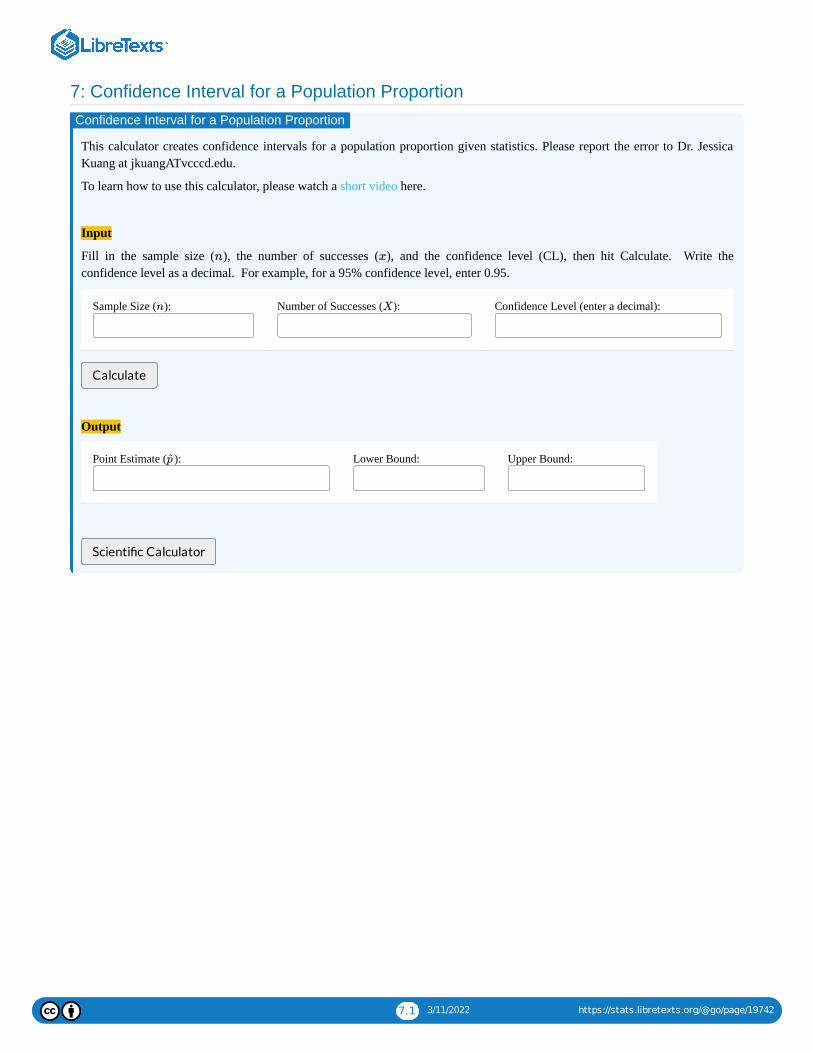
7: Confidence Interval for a Population Proportion
This calculator creates confidence intervals for a population proportion given statistics. Please report the error to Dr. JessicaKuang at jkuangATvcccd.edu.
To learn how to use this calculator, please watch a short video here.
Input
Fill in the sample size ( ), the number of successes ( ), and the confidence level (CL), then hit Calculate. Write theconfidence level as a decimal. For example, for a 95% confidence level, enter 0.95.
Sample Size ( ): Number of Successes ( ): Confidence Level (enter a decimal):
Calculate
Output
Point Estimate ( ): Lower Bound: Upper Bound:
Scienti�c Calculator
Confidence Interval for a Population Proportion
n x
n X
p̂
8.1 3/11/2022 https://stats.libretexts.org/@go/page/19751
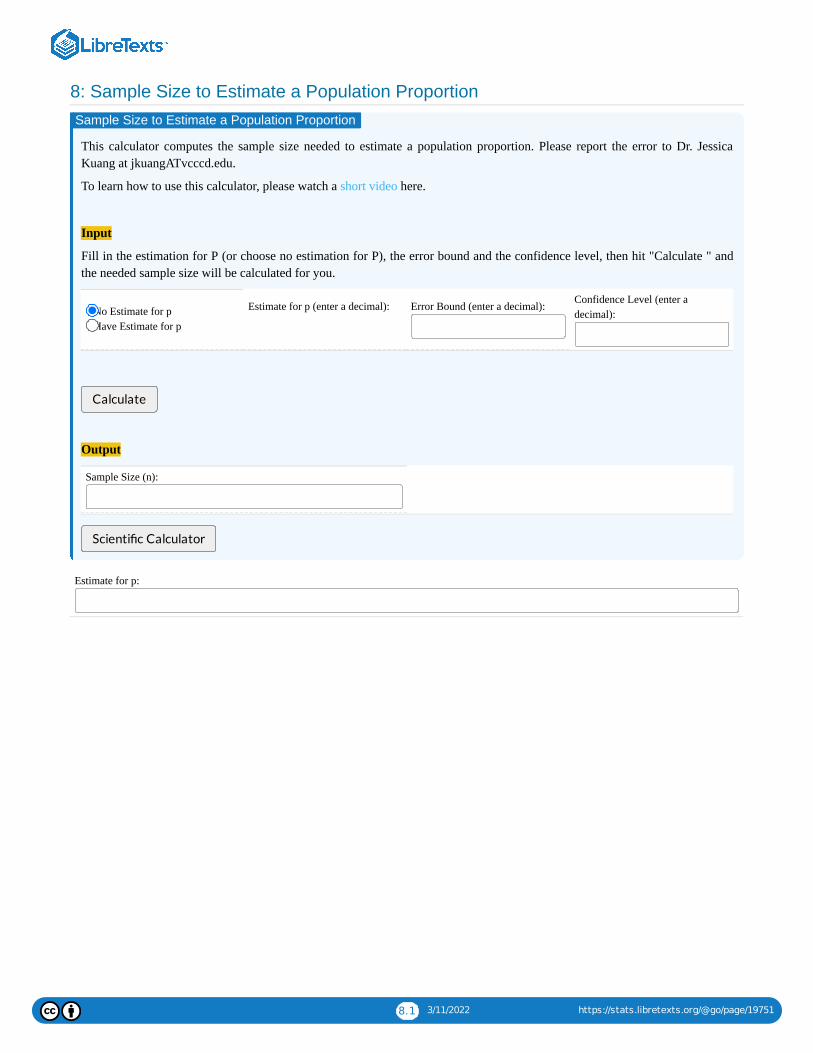
8: Sample Size to Estimate a Population Proportion
This calculator computes the sample size needed to estimate a population proportion. Please report the error to Dr. JessicaKuang at jkuangATvcccd.edu.
To learn how to use this calculator, please watch a short video here.
Input
Fill in the estimation for P (or choose no estimation for P), the error bound and the confidence level, then hit "Calculate " andthe needed sample size will be calculated for you.
No Estimate for p Have Estimate for p
Estimate for p (enter a decimal): Error Bound (enter a decimal): Confidence Level (enter adecimal):
Calculate
Output
Sample Size (n):
Scienti�c Calculator
Estimate for p:
Sample Size to Estimate a Population Proportion
9.1 3/11/2022 https://stats.libretexts.org/@go/page/19740
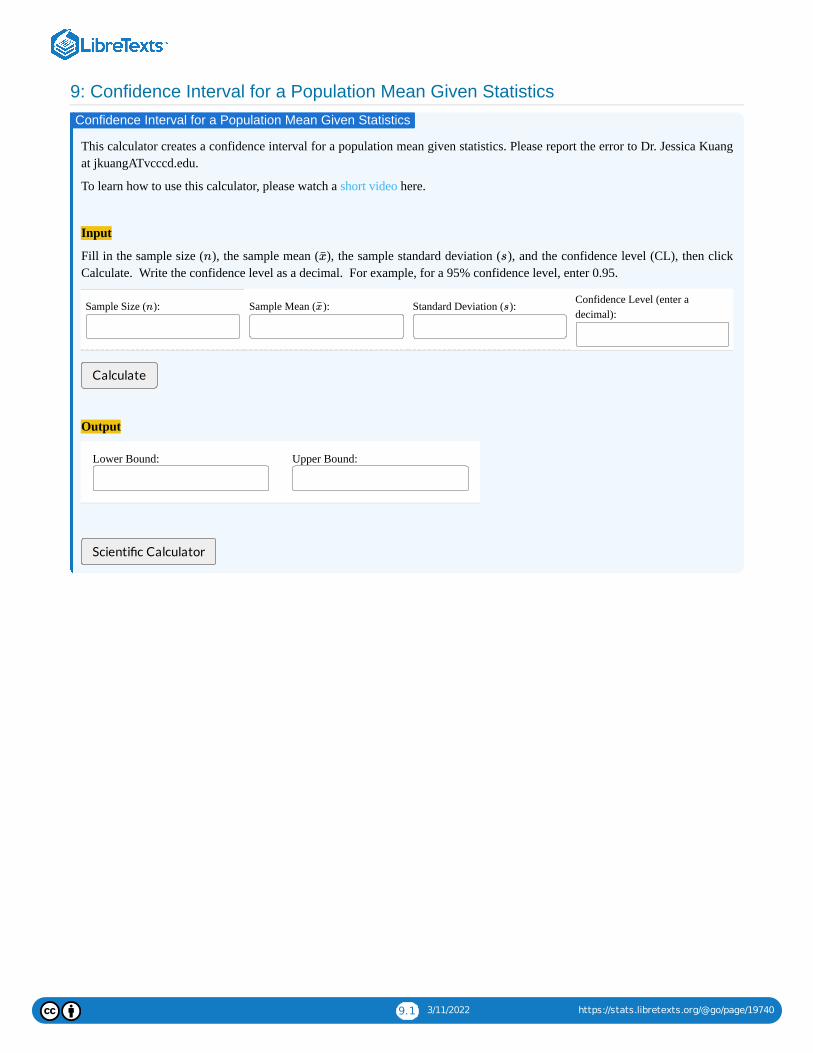
9: Confidence Interval for a Population Mean Given Statistics
This calculator creates a confidence interval for a population mean given statistics. Please report the error to Dr. Jessica Kuangat jkuangATvcccd.edu.
To learn how to use this calculator, please watch a short video here.
Input
Fill in the sample size ( ), the sample mean ( ), the sample standard deviation ( ), and the confidence level (CL), then clickCalculate. Write the confidence level as a decimal. For example, for a 95% confidence level, enter 0.95.
Sample Size ( ): Sample Mean ( ): Standard Deviation ( ): Confidence Level (enter adecimal):
Calculate
Output
Lower Bound: Upper Bound:
Scienti�c Calculator
Confidence Interval for a Population Mean Given Statistics
n x̄ s
n x̄ s

10.1 3/11/2022 https://stats.libretexts.org/@go/page/19741
10: Confidence Interval for a Population Mean Given Data
This calculator creates a confidence interval for a population mean given a set of data. Please report the error to Dr. JessicaKuang at jkuangATvcccd.edu.
To learn how to use this calculator, please watch a short video here.
Input
Type in the values from the data set separated by commas, for example, 2,4,5,8,11,2. Then type in the confidence level(CL) and hit Calculate. Write the confidence level as a decimal. For example, for a 95% confidence level, enter 0.95.
Data:
Confidence Level (enter a decimal):
Calculate
Output
Sample Mean ( ): Standard Deviation ( ): Lower Bound: Upper Bound:
Scienti�c Calculator
Confidence Interval for a Population Mean Given Data
x̄ s

11.1 3/11/2022 https://stats.libretexts.org/@go/page/19750
11: Sample Size to Estimate a Population Mean
This calculator calculates the sample size needed to estimate a population mean. Please report the error to Dr. Jessica Kuang atjkuangATvcccd.edu.
To learn how to use this calculator, please watch a short video here.
Input
Fill in the population standard deviation ( ), the error bound (E), and the confidence level (CL). Write the confidence level asa decimal. For example, for a 95% confidence level, enter 0.95 for CL. Then hit Calculate and assuming the population isnormally distributed, the necessary sample size will be shown.
Standard Deviation ( ): Error Bound (E): Confidence Level (enter adecimal):
Output
Calculate
Sample Size (n):
Scienti�c Calculator
Sample Size to Estimate a Population Mean
σ
σ

12.1 3/11/2022 https://stats.libretexts.org/@go/page/19745
12: Hypothesis Test for a Population Proportion
This calculator performs the hypothesis test for a population proportion given statistics. Please report the error to Dr. JessicaKuang at jkuangATvcccd.edu.
To learn how to use this calculator, please watch a short video here.
Input
Fill in the sample size, n, the number of successes, x, the hypothesized population proportion , and indicate if the test is lefttailed, <, right tailed, >, or two tailed, . Then hit "Calculate" and the test statistic and p-Value will be calculated for you.
Sample Size (n): Number of Success (x):
Choose the test
Hypothesized Population Proportion ( ):
Calculate
Output
Test Statistics (z) p-value:
Scienti�c Calculator
Back to the Calculator Menu
Hypothesis Test for a Population Proportion
p0
≠
<
>
≠
p0

13.1 3/11/2022 https://stats.libretexts.org/@go/page/19743
13: Hypothesis Test for a Population Mean Given Statistics
This calculator performs the hypothesis test for a population mean given statistics. Please report the error to Dr. Jessica Kuangat jkuangATvcccd.edu.
To learn how to use this calculator, please watch a short video here.
Input
Select if the population standard deviation, , is known or unknown. Then fill in the sample size ( ), the sample mean ( ), the
standard deviation ( ), the hypothesized population mean , and indicate if the test is left tailed(<), right taile (>), or two tailed ( ), then click Calculate.Standard Deviation ( ): Sample Size ( ):
Sample Mean ( ): Choose the test
Hypothesized Population Mean ( ):
Calculate
Output
Test Statistic (t): p-value:
Scienti�c Calculator
Hypothesis Test for a Population Mean given Statistics
σ n x̄
s μ0
≠
s n
x̄ <
>
≠
μ0

14.1 3/11/2022 https://stats.libretexts.org/@go/page/19744
14: Hypothesis Test for a Population Mean Given Data
This calculator performs the hypothesis test for a population mean given statistics. Please report the error to Dr. Jessica Kuangat jkuangATvcccd.edu.
To learn how to use this calculator, please watch a short video here (coming up).
Input
Type in the values from the data set separated by commas, for example, 2,4,5,8,11,2. Then choose the left, right, or two-tailedtest and the hypothesized mean. Finally hit Calculate and the sample mean, then the test statistic and the p-value will beshown.
Data:
Choose the test
Hypothesized Population Mean ( ):
Calculate
Output
Sample Mean ( ): Standard Deviation ( ): Test Statistics (t): p-value:
Scienti�c Calculator
Hypothesis Test for a Population Mean With Data
<
>
≠
μ0
x̄ s

15.1 3/11/2022 https://stats.libretexts.org/@go/page/19749
15: Two Independent Proportions Comparison
This calculator performs the hypothesis test and also constructs a confidence interval for − given statistics. Please reportthe error to Dr. Jessica Kuang at jkuangATvcccd.edu.
To learn how to use this calculator, please watch a short video here.
Input
Enter the sample size and the number of successes for each sample, choose the test, and enter the confidence level then hitCalculate. The test statistic, p-value, and the boundaries of the confidence interval will be shown. Be sure to enter theconfidence level as a decimal, e.g., enter 95% as 0.95.
Sample Size (N) Number of Successes (X)
First Sample
choose a test
Second Sample
Confidence Level (enter a decimal):
.95
Calculate
Output
Test Statistics (z): p-value: Lower Bound: Upper Bound:
Scienti�c Calculator
Two Independent Proportions Comparison
p1 p2
<
>
≠
16.1 3/11/2022 https://stats.libretexts.org/@go/page/19747
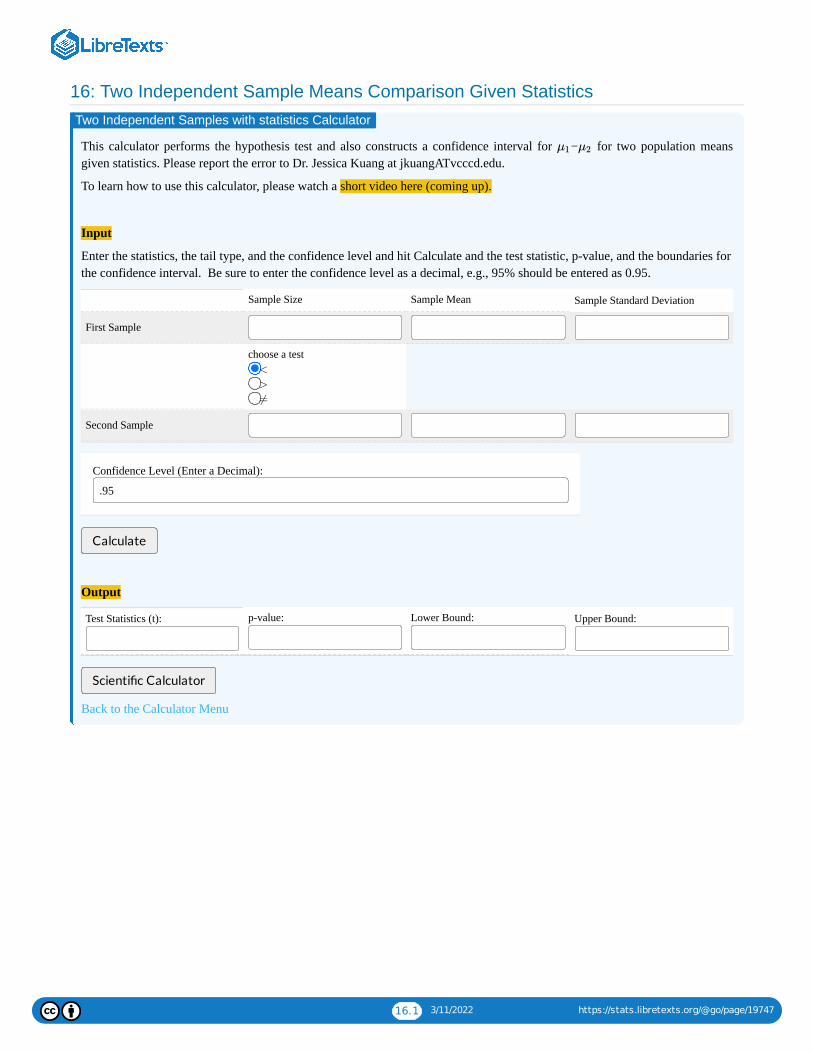
16: Two Independent Sample Means Comparison Given Statistics
This calculator performs the hypothesis test and also constructs a confidence interval for − for two population meansgiven statistics. Please report the error to Dr. Jessica Kuang at jkuangATvcccd.edu.
To learn how to use this calculator, please watch a short video here (coming up).
Input
Enter the statistics, the tail type, and the confidence level and hit Calculate and the test statistic, p-value, and the boundaries forthe confidence interval. Be sure to enter the confidence level as a decimal, e.g., 95% should be entered as 0.95.
Sample Size Sample Mean Sample Standard Deviation
First Sample
choose a test
Second Sample
Confidence Level (Enter a Decimal):
.95
Calculate
Output
Test Statistics (t): p-value: Lower Bound: Upper Bound:
Scienti�c Calculator
Back to the Calculator Menu
Two Independent Samples with statistics Calculator
μ1 μ2
<
>
≠

17.1 3/11/2022 https://stats.libretexts.org/@go/page/19748
17: Two Independent Sample Means Comparison Given Data
This calculator performs the hypothesis test and also constructs a confidence interval for − given data. Please report the error to Dr. Jessica Kuang at jkuangATvcccd.edu.
To learn how to use this calculator, please watch a short video here (coming up).
Input
Type in the values from the two data sets separated by commas, for example, 2,4,5,8,11,2. Enter the statistics, the tail type, and the confidence level then hit Calculate. The test statistic, p-value,and the boundaries for the confidence interval. Be sure to enter the confidence level as a decimal, e.g., 95% should be entered as 0.95.
Data
choose a test
Data
Confidence Level (enter a decimal):
0.95
Calculate
Output
Test Statistics (t): p-value Lower bound Upper Bound
Scienti�c Calculator
Two Independent Samples Means Comparison Given Data
μ1 μ2
<
>
≠

18.1 3/11/2022 https://stats.libretexts.org/@go/page/19746
18: Two Dependent Sample Means Comparison Given Data
This calculator performs a hypothesis test and creates a confidence interval for two dependent sample means given the data sets. Please report the error to Dr. Jessica Kuang atjkuangATvcccd.edu.
To learn how to use this calculator, please watch a short video here (coming up).
Input
Type in the values from the two data sets separated by commas, for example, 2,4,5,8,11,2. Then enter the tail type and the confidence level and hit Calculate and the test statistic, t, the p-value, p,the confidence interval's lower bound, LB, the upper bound, UB, and the data set of the differences will be shown. Be sure to enter the confidence level as a decimal, e.g., 95% has a CL of 0.95.
Data1:
choose a test
Data2:
Confidence Level (enter a decimal):
0.95
Calculate
Output
Test Statistics (t): p-value: Lower Bound: Upper Bound:
Scienti�c Calculator
Two dependent Samples Means Comparison Given data
<
>
≠

19.1 3/11/2022 https://stats.libretexts.org/@go/page/19752
19: Chi-Square Test for Goodness of Fit
This calculator performs the Chi-Square test for goodness of fit. Please report the error to Dr. Jessica Kuang atjkuangATvcccd.edu.
To learn how to use this calculator, please watch a short video here.
Input
Type in the values from the observed and expected sets separated by commas, for example, 2,4,5,8,11,2. Then hit Calculate,the test statistic and the p-value will be shown.
Observed:
Expected:
Output
Calculate
Test Statistics ( ): p-value:
Scienti�c Calculator
Chi-Square Test for Goodness of Fit
χ2

20.1 3/11/2022 https://stats.libretexts.org/@go/page/19753
20: Chi-Square Test for Independence
Enter in the observed values and hit Calculate and the test statistic and the p-value will be calculated for you. Leave blankthe last rows and columns that don't have data values.
A B C D
First
Second
Third
Fourth
Fifth
Sixth
Seventh
Eighth
Ninth
Tenth
Calculate
: p
Scienti�c Calculator
Back to the Calculator Menu
Under Reconstruction test for independence calculatorχ2
χ2
χ2
21.1 3/11/2022 https://stats.libretexts.org/@go/page/19754
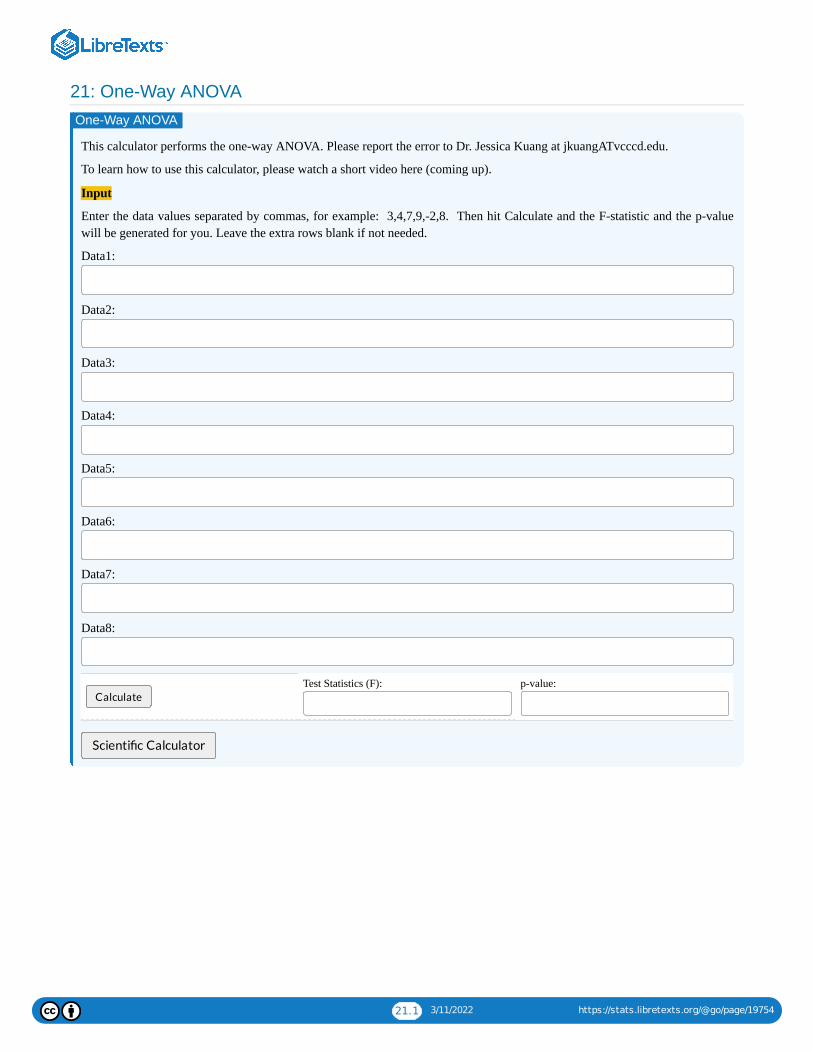
21: One-Way ANOVA
This calculator performs the one-way ANOVA. Please report the error to Dr. Jessica Kuang at jkuangATvcccd.edu.
To learn how to use this calculator, please watch a short video here (coming up).
Input
Enter the data values separated by commas, for example: 3,4,7,9,-2,8. Then hit Calculate and the F-statistic and the p-valuewill be generated for you. Leave the extra rows blank if not needed.
Data1:
Data2:
Data3:
Data4:
Data5:
Data6:
Data7:
Data8:
CalculateTest Statistics (F): p-value:
Scienti�c Calculator
One-Way ANOVA

1 3/11/2022
CHAPTER OVERVIEW22: GRAVEYARD
This is my graveyard, please don't use any calculators beyond this point. ~Jessica Kuang
22.1: BINOMIAL DISTRIBUTION CALCULATORThe student enters in the lower and upper bounds for the number of successes, the number of trials, and the probability of success for abinomial experiment and the calculator computes the probability.
22.2: ONE VARIABLE STATISTICS CALCULATOR22.3: NORMAL PROBABILITY CALCULATORThe student enters in all but one of the low, high, mean, standard deviation, and probability. The computer then finds the entry that wasleft blank
22.4: HYPOTHESIS TEST FOR A POPULATION MEAN WITH DATA CALCULATORThe student enters in the data, population standard deviation (if known), tail type, and hypothesized population mean. The computer thencalculates the sample mean, test statistic and p-value.
22.5: HYPOTHESIS TEST AND CONFIDENCE INTERVAL CALCULATOR FOR TWO DEPENDENT SAMPLESThe student enters in the data for two dependent samples and then enters the tail type and confidence level. The computer then producesthe test statistic, p-value, and confidence interval for the difference between the two dependent sample means.
22.6: FULL REGRESSION ANALYSIS CALCULATORThe student enters data points. The computer then displays the scatter plot, the equation of the regression line, r, r^2, and the test statistican p-value for the hypothesis test for a correlation.
22.7: SAMPLE SIZE FOR A MEAN CALCULATORThe student enters in the population standard deviation, the error, and the confidence level and the computer calculates the needed samplesize.
22.8: NEEDED SAMPLE SIZE FOR A CONFIDENCE INTERVAL FOR A POPULATION PROPORTION CALCULATORThe student enters in the error, confidence level and estimate for the population proportion (if known). The computer then calculates thesample size needed.
22.9: TWO INDEPENDENT SAMPLES WITH DATA HYPOTHESIS TEST AND CONFIDENCE INTERVAL CALCULATORThe student enters in the data, tail type and confidence level. The computer then calculates the test statistic, p-value and confidenceinterval.
22.10: HYPOTHESIS TEST AND CONFIDENCE INTERVAL CALCULATOR FOR TWO DEPENDENT SAMPLESThe student enters in the data for two dependent samples and then enters the tail type and confidence level. The computer then producesthe test statistic, p-value, and confidence interval for the difference between the two dependent sample means.
22.11: CHI-SQUARE GOODNESS OF FIT TEST CALCULATORThe student enters in the observed and expected values. Then the computer calculates the test statistic and p-value using the chi-squaregoodness of fit test.
22.12: CHI-SQUARE TEST FOR HOMOGENEITY CALCULATORThe student enters in the observed values for each of the two samples. The computer then displays the test statistic and p-value for the chi-square test for homogeneity.
22.13: CHI-SQUARE TEST FOR INDEPENDENCE CALCULATORThe student fills in the table of observed counts. Then the computer computes the test statistic and p-value using the chi square test forindependence.
22.14: ANOVA CALCULATORThe student enters in the data sets and the computer calculates the test statistic an p-value for the ANOVA hypothesis test.
22.15: INDEX22.16: GLOSSARY

Larry Green 22.1.1 3/11/2022 https://stats.libretexts.org/@go/page/19764
22.1: Binomial Distribution Calculator
Enter the lower bound for the number of successes (Low), the upper bound for the number of successes (High), the number oftrials (Trials), and the probability of success (P), and then hit Calculate.
Low: High: Trials: P:
Calculate
Scienti�c Calculator
Back to the Calculator Menu
Contributions and AttributionsThis page is licensed under a CC BY license and was authored, remixed, and/or curated by Larry Green. Page content has beenedited and updated to conform to the style and standards of the LibreTexts platform; a detailed versioning history of the edits tosource content is available upon request.
Binomial Distribution calculator

Larry Green 22.2.1 3/11/2022 https://stats.libretexts.org/@go/page/19900
22.2: One Variable Statistics Calculator
Type in the values from the data set separated by commas, for example, 2,4,5,8,11,2, and click Calculate.
Population Standard Deviation Sample Standard Deviation
Calculate
Mean
Minimum
Q1
Median
Q3
Maximum
Standard Deviation
Variance
IQR
Sample Size
Scienti�c Calculator
Back to the Calculator Menu
One Variable statistics Calculator

Larry Green 22.2.2 3/11/2022 https://stats.libretexts.org/@go/page/19900
Contributions and AttributionsThis page is licensed under a CC BY license and was authored, remixed, and/or curated by Larry Green. Page content has beenedited and updated to conform to the style and standards of the LibreTexts platform; a detailed versioning history of the edits tosource content is available upon request.

Larry Green 22.3.1 3/11/2022 https://stats.libretexts.org/@go/page/19898
22.3: Normal Probability Calculator
Fill in all of the values except one below and hit Calculate then the last value will be given to you.
Low: High: Mean: Std. Dev.: p=
Calculate
Scienti�c Calculator
Back to the Calculator Menu
Contributions and AttributionsThis page is licensed under a CC BY license and was authored, remixed, and/or curated by Larry Green. Page content has beenedited and updated to conform to the style and standards of the LibreTexts platform; a detailed versioning history of the edits tosource content is available upon request.
Online Normal Probability Calculator

Larry Green 22.4.1 3/11/2022 https://stats.libretexts.org/@go/page/20612
22.4: Hypothesis Test for a Population Mean With Data Calculator
Type in the values from the data set separated by commas, for example, 2,4,5,8,11,2. Then type in the population standarddeviation if it is known or leave it blank if it is not known. Then choose a left, right or two tailed test, and the hypothesizedmean. Finally hit Calculate and the sample mean, the test statistic and the p-value will be shown.
Data:
:
:Calculate
: :
torz:
p
Scienti�c Calculator
Back to the Calculator Menu
Contributions and AttributionsThis page is licensed under a CC BY license and was authored, remixed, and/or curated by Larry Green. Page content has beenedited and updated to conform to the style and standards of the LibreTexts platform; a detailed versioning history of the edits tosource content is available upon request.
Hypothesis Test for a Population Mean With Data Calculator
σ
σ
<
>
≠
μ0
x̄s

Larry Green 22.5.1 3/11/2022 https://stats.libretexts.org/@go/page/20613
22.5: Hypothesis Test and Confidence Interval Calculator for Two DependentSamples
Type in the values from the two data sets separated by commas, for example, 2,4,5,8,11,2. Then enter the tail type and theconfidence level and hit Calculate and the test statistic, t, the p-value, p, the confidence interval's lower bound, LB, the upperbound, UB, and the data set of the differences will be shown. Be sure to enter the confidence level as a decimal, e.g., 95% hasa CL of 0.95.
Data1:
Data2:
CL:Calculate
t: p LB UB
Scienti�c Calculator
Back to the Calculator Menu
Contributions and AttributionsThis page is licensed under a CC BY license and was authored, remixed, and/or curated by Larry Green. Page content has beenedited and updated to conform to the style and standards of the LibreTexts platform; a detailed versioning history of the edits tosource content is available upon request.
Two dependent Samples with data Calculator
<
>
≠

Larry Green 22.6.1 3/11/2022 https://stats.libretexts.org/@go/page/20638
22.6: Full Regression Analysis Calculator
Create a scatter plot, the regression equation, r and , and perform the hypothesis test for a nonzero correlation below by entering a point, click Plot Points andthen continue until you are done. You can also input all your data at once by putting the first variable's data separated by commas in the first row and the secondvariable's data separated by commas in the second row and then clicking on plot points.
( , ) Plot Points New Plot
x:
y:
Regression Equation: r: :
Hypothesis:
Hypothesis:
Hypothesis: t =
p-value=
Scienti�c Calculator
Back to the Calculator Menu
Contributions and AttributionsThis page is licensed under a CC BY license and was authored, remixed, and/or curated by Larry Green. Page content has been edited and updated to conform to thestyle and standards of the LibreTexts platform; a detailed versioning history of the edits to source content is available upon request.
Full regression analysis Calculator
r2
r2
: ρ = 0, : ρ ≠ 0H0 Ha
: ρ = 0, : ρ < 0H0 Ha
: ρ = 0, : ρ > 0H0 Ha

Larry Green 22.7.1 3/11/2022 https://stats.libretexts.org/@go/page/20790
22.7: Sample Size for a Mean Calculator
Fill in the population standard deviation ( ), the error bound (E), and the confidence level (CL). Write the confidence level asa decimal. For example, for a 95% confidence level, enter 0.95 for CL. Then hit Calculate and assuming the population isnormally distributed, the necessary sample size will be shown.
: E: CL: Calculate n
n:
Scienti�c Calculator
Back to the Calculator Menu
Contributions and Attributions
This page is licensed under a CC BY license and was authored, remixed, and/or curated by Larry Green. Page content has beenedited and updated to conform to the style and standards of the LibreTexts platform; a detailed versioning history of the edits tosource content is available upon request.
Sample size Calculator
σ
σ

Larry Green 22.8.1 3/11/2022 https://stats.libretexts.org/@go/page/20791
22.8: Needed Sample Size for a Confidence Interval for a Population ProportionCalculator
Fill in the error bound (E) and the confidence level (CL) written as a decimal, for example a 95% confidence level is 0.95. Ifthere is an estimate for the population proportion, check the "Have Estimate for p" radio button and then fill in the estimate inthe p box that appears. Then hit "Calculate n" and the needed sample size will be calculated for you.
No Estimate for pHave Estimate forp
Estimate for p: E: CL: Calculate n
n:
Scienti�c Calculator
Back to the Calculator Menu
Estimate for p:
Contributions and AttributionsThis page is licensed under a CC BY license and was authored, remixed, and/or curated by Larry Green. Page content has beenedited and updated to conform to the style and standards of the LibreTexts platform; a detailed versioning history of the edits tosource content is available upon request.
Sample Size Calculator

Larry Green 22.9.1 3/11/2022 https://stats.libretexts.org/@go/page/20798
22.9: Two Independent Samples With Data Hypothesis Test and Confidence IntervalCalculator
Type in the values from the two data sets separated by commas, for example, 2,4,5,8,11,2. Then enter the tail type and theconfidence level and hit Calculate and the test statistic, t, the p-value, p, the confidence interval's lower bound, LB, and theupper bound, UB will be shown. Be sure to enter the confidence level as a decimal, e.g., 95% has a CL of 0.95.
Data1:
Data2:
CL:Calculate
t: p LB UB
Scienti�c Calculator
Back to the Calculator Menu
Contributions and AttributionsThis page is licensed under a CC BY license and was authored, remixed, and/or curated by Larry Green. Page content has beenedited and updated to conform to the style and standards of the LibreTexts platform; a detailed versioning history of the edits tosource content is available upon request.
Two Independent Samples with data Calculator
<
>
≠

Larry Green 22.10.1 3/11/2022 https://stats.libretexts.org/@go/page/20799
22.10: Hypothesis Test and Confidence Interval Calculator for Two DependentSamples
Type in the values from the two data sets separated by commas, for example, 2,4,5,8,11,2. Then enter the tail type and theconfidence level and hit Calculate and the test statistic, t, the p-value, p, the confidence interval's lower bound, LB, the upperbound, UB, and the data set of the differences will be shown. Be sure to enter the confidence level as a decimal, e.g., 95% hasa CL of 0.95.
Data1:
Data2:
CL:Calculate
t: p LB UB
Scienti�c Calculator
Back to the Calculator Menu
Contributions and AttributionsThis page is licensed under a CC BY license and was authored, remixed, and/or curated by Larry Green. Page content has beenedited and updated to conform to the style and standards of the LibreTexts platform; a detailed versioning history of the edits tosource content is available upon request.
Two dependent Samples with data Calculator
<
>
≠

Larry Green 22.11.1 3/11/2022 https://stats.libretexts.org/@go/page/20800
22.11: Chi-Square Goodness of Fit Test Calculator
Type in the values from the observed and expected sets separated by commas, for example, 2,4,5,8,11,2. Then hit Calculateand the test statistic, , and the p-value, p, will be shown.
Observed:
Expected:
Calculate
: p
Scienti�c Calculator
Back to the Calculator Menu
Contributions and AttributionsThis page is licensed under a CC BY license and was authored, remixed, and/or curated by Larry Green. Page content has beenedited and updated to conform to the style and standards of the LibreTexts platform; a detailed versioning history of the edits tosource content is available upon request.
Goodness of fit Calculatorχ2
χ2
χ2

Larry Green 22.12.1 3/11/2022 https://stats.libretexts.org/@go/page/20801
22.12: Chi-Square Test For Homogeneity Calculator
Enter in the observed values for each of the two samples A and B and hit Calculate and the test statistic and the p-value willbe calculated for you. Leave blank the last rows that don't have data values.
A B
Calculate
: p
Scienti�c Calculator
Back to the Calculator Menu
Contributions and AttributionsThis page is licensed under a CC BY license and was authored, remixed, and/or curated by Larry Green. Page content has beenedited and updated to conform to the style and standards of the LibreTexts platform; a detailed versioning history of the edits tosource content is available upon request.
test for Homogeneity calculatorχ2
χ2
χ2
Larry Green 22.13.1 3/11/2022 https://stats.libretexts.org/@go/page/20802
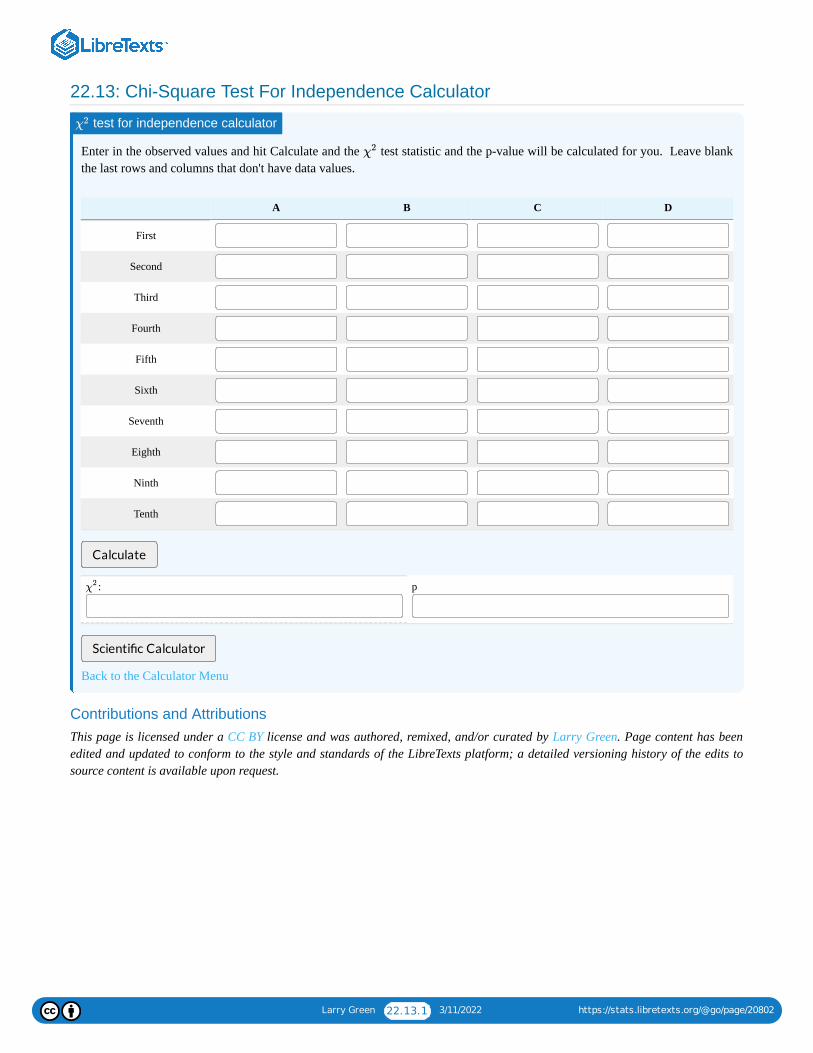
22.13: Chi-Square Test For Independence Calculator
Enter in the observed values and hit Calculate and the test statistic and the p-value will be calculated for you. Leave blankthe last rows and columns that don't have data values.
A B C D
First
Second
Third
Fourth
Fifth
Sixth
Seventh
Eighth
Ninth
Tenth
Calculate
: p
Scienti�c Calculator
Back to the Calculator Menu
Contributions and AttributionsThis page is licensed under a CC BY license and was authored, remixed, and/or curated by Larry Green. Page content has beenedited and updated to conform to the style and standards of the LibreTexts platform; a detailed versioning history of the edits tosource content is available upon request.
test for independence calculatorχ2
χ2
χ2

Larry Green 22.14.1 3/11/2022 https://stats.libretexts.org/@go/page/20803
22.14: ANOVA Calculator
Enter the data values separated by commas, for example: 3,4,7,9,-2,8. Then hit Calculate and the F-statistic and the p-valuewill be generated for you.
Data1:
Data2:
Data3:
Data4:
Data5:
Data6:
Data7:
Data8:
CalculateF: p
Scienti�c Calculator
Back to the Calculator Menu
Contributions and Attributions
This page is licensed under a CC BY license and was authored, remixed, and/or curated by Larry Green. Page content has beenedited and updated to conform to the style and standards of the LibreTexts platform; a detailed versioning history of the edits tosource content is available upon request.
ANOVA Calculator


22.16: GlossarySample Word 1 | Sample Definition 1

Larry Green 22.1.1 3/11/2022 https://stats.libretexts.org/@go/page/19764
22.1: Binomial Distribution Calculator
Enter the lower bound for the number of successes (Low), the upper bound for the number of successes (High), the number oftrials (Trials), and the probability of success (P), and then hit Calculate.
Low: High: Trials: P:
Calculate
Scienti�c Calculator
Back to the Calculator Menu
Contributions and AttributionsThis page is licensed under a CC BY license and was authored, remixed, and/or curated by Larry Green. Page content has beenedited and updated to conform to the style and standards of the LibreTexts platform; a detailed versioning history of the edits tosource content is available upon request.
Binomial Distribution calculator
Larry Green 22.2.1 3/11/2022 https://stats.libretexts.org/@go/page/19900
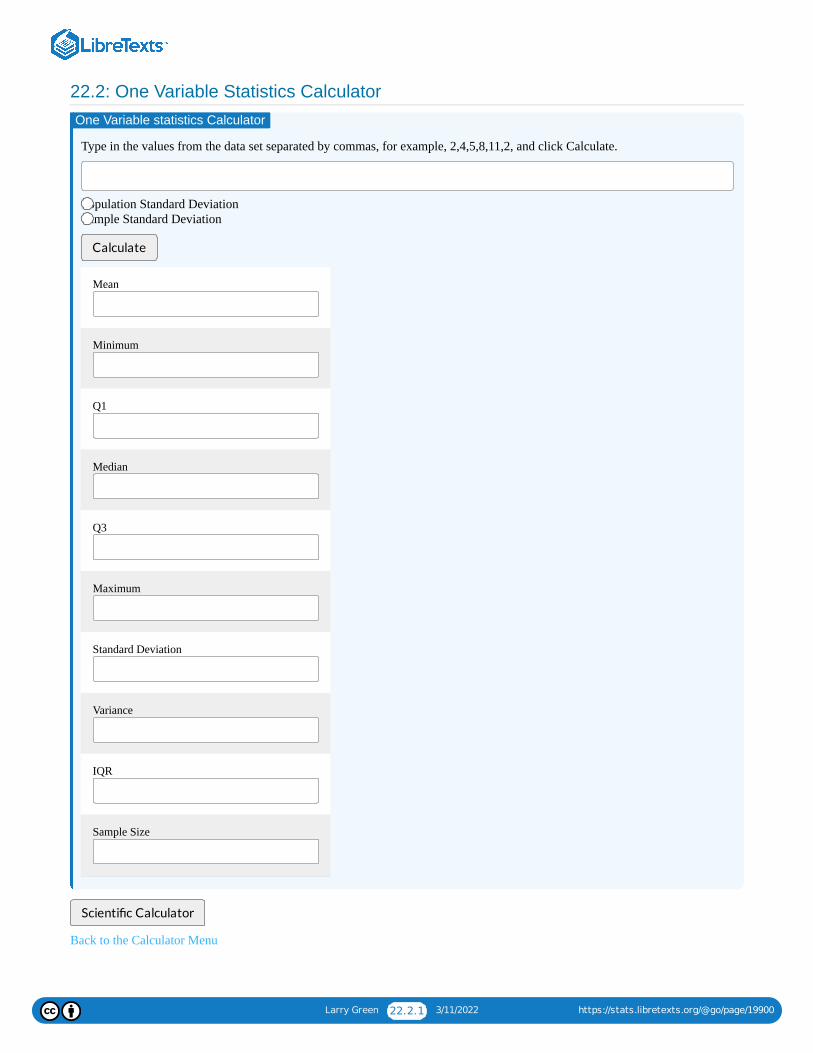
22.2: One Variable Statistics Calculator
Type in the values from the data set separated by commas, for example, 2,4,5,8,11,2, and click Calculate.
Population Standard Deviation Sample Standard Deviation
Calculate
Mean
Minimum
Q1
Median
Q3
Maximum
Standard Deviation
Variance
IQR
Sample Size
Scienti�c Calculator
Back to the Calculator Menu
One Variable statistics Calculator

Larry Green 22.2.2 3/11/2022 https://stats.libretexts.org/@go/page/19900
Contributions and AttributionsThis page is licensed under a CC BY license and was authored, remixed, and/or curated by Larry Green. Page content has beenedited and updated to conform to the style and standards of the LibreTexts platform; a detailed versioning history of the edits tosource content is available upon request.

Larry Green 22.3.1 3/11/2022 https://stats.libretexts.org/@go/page/19898
22.3: Normal Probability Calculator
Fill in all of the values except one below and hit Calculate then the last value will be given to you.
Low: High: Mean: Std. Dev.: p=
Calculate
Scienti�c Calculator
Back to the Calculator Menu
Contributions and AttributionsThis page is licensed under a CC BY license and was authored, remixed, and/or curated by Larry Green. Page content has beenedited and updated to conform to the style and standards of the LibreTexts platform; a detailed versioning history of the edits tosource content is available upon request.
Online Normal Probability Calculator

Larry Green 22.4.1 3/11/2022 https://stats.libretexts.org/@go/page/20612
22.4: Hypothesis Test for a Population Mean With Data Calculator
Type in the values from the data set separated by commas, for example, 2,4,5,8,11,2. Then type in the population standarddeviation if it is known or leave it blank if it is not known. Then choose a left, right or two tailed test, and the hypothesizedmean. Finally hit Calculate and the sample mean, the test statistic and the p-value will be shown.
Data:
:
:Calculate
: :
torz:
p
Scienti�c Calculator
Back to the Calculator Menu
Contributions and AttributionsThis page is licensed under a CC BY license and was authored, remixed, and/or curated by Larry Green. Page content has beenedited and updated to conform to the style and standards of the LibreTexts platform; a detailed versioning history of the edits tosource content is available upon request.
Hypothesis Test for a Population Mean With Data Calculator
σ
σ
<
>
≠
μ0
x̄s
Larry Green 22.5.1 3/11/2022 https://stats.libretexts.org/@go/page/20613
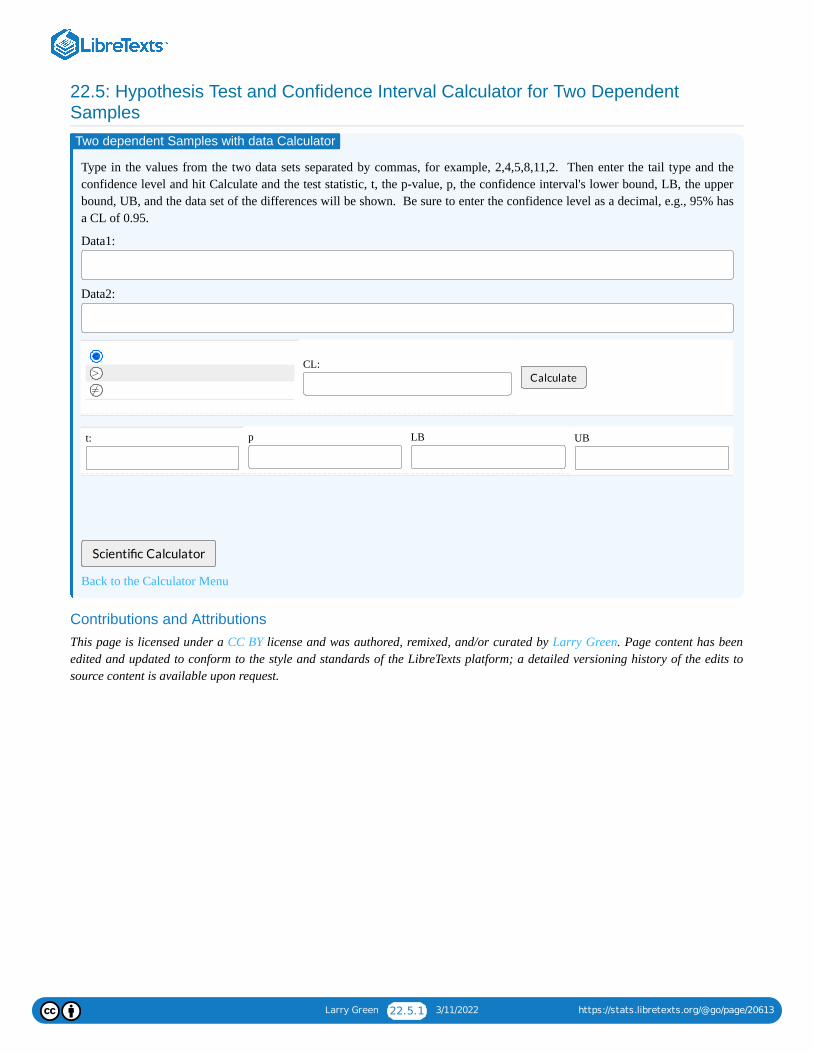
22.5: Hypothesis Test and Confidence Interval Calculator for Two DependentSamples
Type in the values from the two data sets separated by commas, for example, 2,4,5,8,11,2. Then enter the tail type and theconfidence level and hit Calculate and the test statistic, t, the p-value, p, the confidence interval's lower bound, LB, the upperbound, UB, and the data set of the differences will be shown. Be sure to enter the confidence level as a decimal, e.g., 95% hasa CL of 0.95.
Data1:
Data2:
CL:Calculate
t: p LB UB
Scienti�c Calculator
Back to the Calculator Menu
Contributions and AttributionsThis page is licensed under a CC BY license and was authored, remixed, and/or curated by Larry Green. Page content has beenedited and updated to conform to the style and standards of the LibreTexts platform; a detailed versioning history of the edits tosource content is available upon request.
Two dependent Samples with data Calculator
<
>
≠

Larry Green 22.6.1 3/11/2022 https://stats.libretexts.org/@go/page/20638
22.6: Full Regression Analysis Calculator
Create a scatter plot, the regression equation, r and , and perform the hypothesis test for a nonzero correlation below by entering a point, click Plot Points andthen continue until you are done. You can also input all your data at once by putting the first variable's data separated by commas in the first row and the secondvariable's data separated by commas in the second row and then clicking on plot points.
( , ) Plot Points New Plot
x:
y:
Regression Equation: r: :
Hypothesis:
Hypothesis:
Hypothesis: t =
p-value=
Scienti�c Calculator
Back to the Calculator Menu
Contributions and AttributionsThis page is licensed under a CC BY license and was authored, remixed, and/or curated by Larry Green. Page content has been edited and updated to conform to thestyle and standards of the LibreTexts platform; a detailed versioning history of the edits to source content is available upon request.
Full regression analysis Calculator
r2
r2
: ρ = 0, : ρ ≠ 0H0 Ha
: ρ = 0, : ρ < 0H0 Ha
: ρ = 0, : ρ > 0H0 Ha

Larry Green 22.7.1 3/11/2022 https://stats.libretexts.org/@go/page/20790
22.7: Sample Size for a Mean Calculator
Fill in the population standard deviation ( ), the error bound (E), and the confidence level (CL). Write the confidence level asa decimal. For example, for a 95% confidence level, enter 0.95 for CL. Then hit Calculate and assuming the population isnormally distributed, the necessary sample size will be shown.
: E: CL: Calculate n
n:
Scienti�c Calculator
Back to the Calculator Menu
Contributions and Attributions
This page is licensed under a CC BY license and was authored, remixed, and/or curated by Larry Green. Page content has beenedited and updated to conform to the style and standards of the LibreTexts platform; a detailed versioning history of the edits tosource content is available upon request.
Sample size Calculator
σ
σ

Larry Green 22.8.1 3/11/2022 https://stats.libretexts.org/@go/page/20791
22.8: Needed Sample Size for a Confidence Interval for a Population ProportionCalculator
Fill in the error bound (E) and the confidence level (CL) written as a decimal, for example a 95% confidence level is 0.95. Ifthere is an estimate for the population proportion, check the "Have Estimate for p" radio button and then fill in the estimate inthe p box that appears. Then hit "Calculate n" and the needed sample size will be calculated for you.
No Estimate for pHave Estimate forp
Estimate for p: E: CL: Calculate n
n:
Scienti�c Calculator
Back to the Calculator Menu
Estimate for p:
Contributions and AttributionsThis page is licensed under a CC BY license and was authored, remixed, and/or curated by Larry Green. Page content has beenedited and updated to conform to the style and standards of the LibreTexts platform; a detailed versioning history of the edits tosource content is available upon request.
Sample Size Calculator
Larry Green 22.9.1 3/11/2022 https://stats.libretexts.org/@go/page/20798
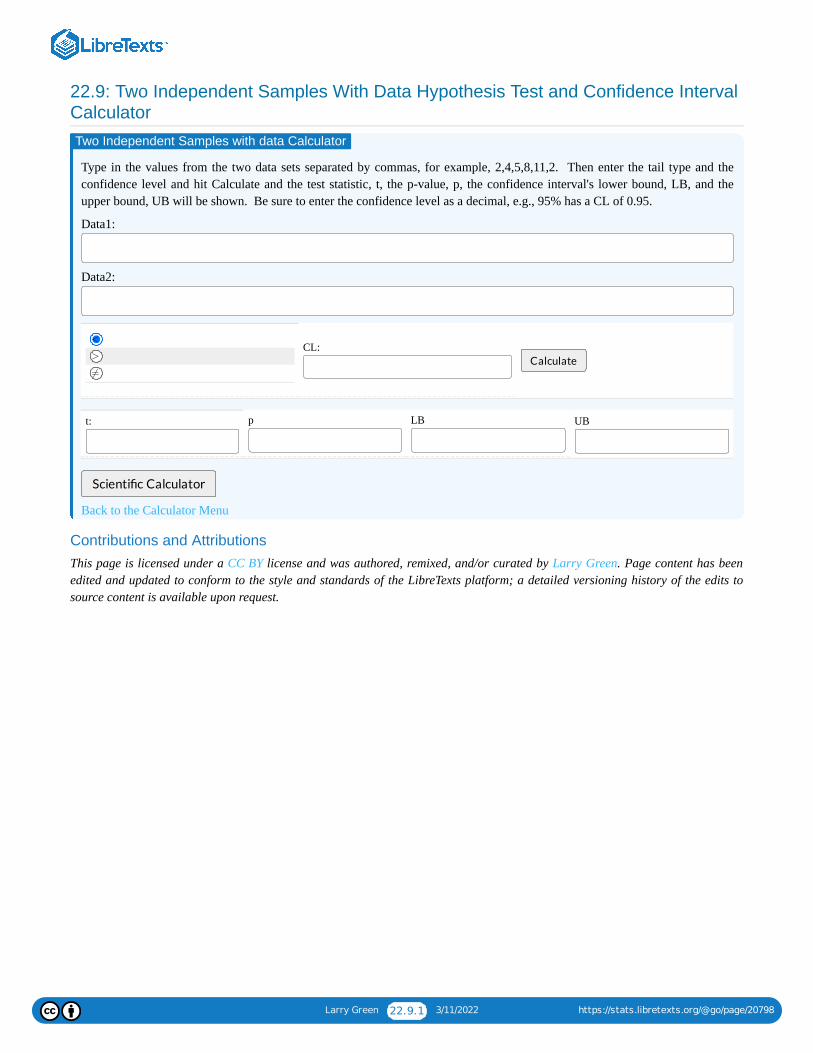
22.9: Two Independent Samples With Data Hypothesis Test and Confidence IntervalCalculator
Type in the values from the two data sets separated by commas, for example, 2,4,5,8,11,2. Then enter the tail type and theconfidence level and hit Calculate and the test statistic, t, the p-value, p, the confidence interval's lower bound, LB, and theupper bound, UB will be shown. Be sure to enter the confidence level as a decimal, e.g., 95% has a CL of 0.95.
Data1:
Data2:
CL:Calculate
t: p LB UB
Scienti�c Calculator
Back to the Calculator Menu
Contributions and AttributionsThis page is licensed under a CC BY license and was authored, remixed, and/or curated by Larry Green. Page content has beenedited and updated to conform to the style and standards of the LibreTexts platform; a detailed versioning history of the edits tosource content is available upon request.
Two Independent Samples with data Calculator
<
>
≠

Larry Green 22.10.1 3/11/2022 https://stats.libretexts.org/@go/page/20799
22.10: Hypothesis Test and Confidence Interval Calculator for Two DependentSamples
Type in the values from the two data sets separated by commas, for example, 2,4,5,8,11,2. Then enter the tail type and theconfidence level and hit Calculate and the test statistic, t, the p-value, p, the confidence interval's lower bound, LB, the upperbound, UB, and the data set of the differences will be shown. Be sure to enter the confidence level as a decimal, e.g., 95% hasa CL of 0.95.
Data1:
Data2:
CL:Calculate
t: p LB UB
Scienti�c Calculator
Back to the Calculator Menu
Contributions and AttributionsThis page is licensed under a CC BY license and was authored, remixed, and/or curated by Larry Green. Page content has beenedited and updated to conform to the style and standards of the LibreTexts platform; a detailed versioning history of the edits tosource content is available upon request.
Two dependent Samples with data Calculator
<
>
≠

Larry Green 22.11.1 3/11/2022 https://stats.libretexts.org/@go/page/20800
22.11: Chi-Square Goodness of Fit Test Calculator
Type in the values from the observed and expected sets separated by commas, for example, 2,4,5,8,11,2. Then hit Calculateand the test statistic, , and the p-value, p, will be shown.
Observed:
Expected:
Calculate
: p
Scienti�c Calculator
Back to the Calculator Menu
Contributions and AttributionsThis page is licensed under a CC BY license and was authored, remixed, and/or curated by Larry Green. Page content has beenedited and updated to conform to the style and standards of the LibreTexts platform; a detailed versioning history of the edits tosource content is available upon request.
Goodness of fit Calculatorχ2
χ2
χ2

Larry Green 22.12.1 3/11/2022 https://stats.libretexts.org/@go/page/20801
22.12: Chi-Square Test For Homogeneity Calculator
Enter in the observed values for each of the two samples A and B and hit Calculate and the test statistic and the p-value willbe calculated for you. Leave blank the last rows that don't have data values.
A B
Calculate
: p
Scienti�c Calculator
Back to the Calculator Menu
Contributions and AttributionsThis page is licensed under a CC BY license and was authored, remixed, and/or curated by Larry Green. Page content has beenedited and updated to conform to the style and standards of the LibreTexts platform; a detailed versioning history of the edits tosource content is available upon request.
test for Homogeneity calculatorχ2
χ2
χ2

Larry Green 22.13.1 3/11/2022 https://stats.libretexts.org/@go/page/20802
22.13: Chi-Square Test For Independence Calculator
Enter in the observed values and hit Calculate and the test statistic and the p-value will be calculated for you. Leave blankthe last rows and columns that don't have data values.
A B C D
First
Second
Third
Fourth
Fifth
Sixth
Seventh
Eighth
Ninth
Tenth
Calculate
: p
Scienti�c Calculator
Back to the Calculator Menu
Contributions and AttributionsThis page is licensed under a CC BY license and was authored, remixed, and/or curated by Larry Green. Page content has beenedited and updated to conform to the style and standards of the LibreTexts platform; a detailed versioning history of the edits tosource content is available upon request.
test for independence calculatorχ2
χ2
χ2

Larry Green 22.14.1 3/11/2022 https://stats.libretexts.org/@go/page/20803
22.14: ANOVA Calculator
Enter the data values separated by commas, for example: 3,4,7,9,-2,8. Then hit Calculate and the F-statistic and the p-valuewill be generated for you.
Data1:
Data2:
Data3:
Data4:
Data5:
Data6:
Data7:
Data8:
CalculateF: p
Scienti�c Calculator
Back to the Calculator Menu
Contributions and Attributions
This page is licensed under a CC BY license and was authored, remixed, and/or curated by Larry Green. Page content has beenedited and updated to conform to the style and standards of the LibreTexts platform; a detailed versioning history of the edits tosource content is available upon request.
ANOVA Calculator


22.16: GlossarySample Word 1 | Sample Definition 1