math 8 unit 6 interpreting graphs - mrs. leonardo's...
TRANSCRIPT

1
Math 8
Unit 6
Interpreting Graphs
Extra Help Schedule: Wednesday, December 12; 7:30am
Tuesday, December 18; 7:30am
2018-19
Name: _____________________
Date Lesson Topic Homework
F 12/7 1 Rate of Change Lesson 1 – Pages 6 and 7
M 12/10 2 Proportional Relationships Lesson 2 – Pages 12 and 13
T 12/11 3 Comparing Graphs Lesson 3 – Pages 17 and 18
W 12/12 4
Interpreting Graphs
Lesson 4 – Pages 22 and 23
T 12/13
Quiz
F 12/14 5
Construct Scatter Plot Lesson 5 – Pages 27 and 28
M 12/17 6 Trend Line (Line of Best Fit) Lesson 6 – Pages 33 and 34
T 12/18 Review Study!
W 12/19 Test
T 12/20 2-Way Frequency Tables
F 12/21 2-Way Relative Frequency Tables

2
Lesson 1 – Rate Of Change
Aim: I can determine rate of change.
Warm up:
1. What is true of the given graph? 2. Write the function rule
A) The slope is positive C) The slope equals zero
B) The slope is four D) The slope is undefined
Vocabulary:
Rate of change – A ratio that compares two quantities. On a linear graph, it is a comparison of the change in
y-values of the line to the corresponding change in x-values.
➢ The formula for rate of change is _______________.
➢ In a linear equation or a graph, the rate of change is represented by the ____________.
Review:
1) Find the rate of change: (1,1) and (3,7)
2) Find the rate of change: 3y = 2x + 21
3) Find the rate of change: 4) Find the rate of change
:
x y
5 8
7 12
9 16
x y
0 10
6 22
12 34
18 46

3
Guided Practice:
1) A locksmith charges a flat fee for each house call plus an hourly rate, as shown by the graph below.
a) What does the x-axis represent? ________________________
b) What does the y-axis represent? ________________________
c) What is the rate of change? ________________________
d) What does the rate of change represent? ____________________
_______________________________________________________
e) What is the flat fee that the locksmith initially charges? _________
f) What equation can we use to find how much a job of any amount
of hours is going to cost? ________________________________
g) How much would an 8 hour job cost? _____________________
2) The table shows how much money Tori has saved. Assume the relationship between the two quantities is
linear. Find and interpret the rate of change and the initial value.
Number of
Months, x
3 4 5 6
Money Saved,
y
110 130 150 170

4
3) Mr. Murphy graphs his weight throughout the years in 1960 he weighed 120 lbs. (1960, 120) in 1980 he
weighed 180 lbs. (1980, 180).
a) What is the rate of change of his weight throughout the years?
b) What is the slope of this data?
c) How much did he weigh in 2010 if his weight continues at this rate?
Independent Practice:
1) Fatima bought an airplane phone card that charges her a connection fee plus an additional rate for each
minute the call lasts. The graph below represents this situation.
What is the slope, and what does it represent?
________________________________________
________________________________________
What is the equation of the graph? _____________
2) Catherine has some photos in her album. Each week she plans to add 13 photos. Catherine had 120 photos
after 8 weeks. Assume the relationship is linear, find and interpret the rate of change and the initial value.

5
3) A machine salesperson earns a base salary of $40,000 plus a commission of $300 for every machine he sells.
a) Write an equation that shows the total amount of income the salesperson earns, if he sells x machines
in a year.
b) What does the slope represent?
c) What would be the salesperson’s income if he sold 150 machines?
4) Sirius Radio charges a yearly subscription fee plus a monthly fee. The total cost for different numbers of
months, including the yearly fee, is shown in the graph. Find and interpret the rate of change and the initial
value.

6
Lesson 1 Homework
1) A shoe store offers free points when you sign up for their rewards cards. Then, for each pair of shoes
purchased, you earn an additional number of points. The graph shows the total point earned for several pairs of
shoes
a) Find and interpret the rate of change and the initial value.
b) Write the equation used to represent the situation.
2) The graph shows John’s Saving Account balance.
a) What is his monthly RATE of savings?
b) How much money does he start off his account with?
c) At the same savings rate, how much will he have after 20
months?
d) What is the equation of the graph?
3) Mrs. Carrieri rides her bike at a steady rate away from her house.
Her distance from the house over time is shown below.
How fast is Mrs. Carrieri riding?

7
4) Disney World charges a rental fee plus $2 per hour for strollers. The total cost of 5 hours is $13.
Assume the relationship is linear. Find and interpret the rate of change and initial value.
5) A taxi company charges its customers according to the equation C = 1.2x + 1.5, where C is the cost of the
ride in dollars and x is the length of the ride in miles. How does the cost of a ride change with respect to
the length of the ride?
6) An airplane ascends from an altitude of 14,000 to an altitude of 20,000 feet in 15 minutes. Its altitude over
time is shown in the graph below. Calculate and interpret the rate of change of the plane’s altitude with respect
to time.
7) The population of Bay Village is 35,000 today. Every year the population of Bay Village increases by
750 people.
a) Write a linear model that represents the population of Bay Village x years from today.
b) In approximately how many years will the population of Bay Village exceed 50,000 people?

8
Lesson 2 – Proportional Relationships
Aim: I can identify and interpret proportional graphs and situations
Warm Up:
1. Elisa sells ice cream during the summer. She earns $12 for every 3 cones she sells. Write a proportional
equation to model this relationship
a) If she earned $48, how many cones did she sell?
b) If she sold 9 cones, how much money did she earn?
Vocabulary:
Proportion - An equation stating that two ratios are equal in value.
Direct Proportion - The ratio of two variables, such as y and x, is a constant, m. That means that for every
change in x, y changes by a constant factor, m. We can say that y is directly proportional to x.
A Proportional Relationship (Direct Proportion) can be represented in different ways.
Guided Practice:
1) Which equations represent direct proportions?
A) y = 3x + 6 B) y = ½ x – 3 C) y = 7x D) y = -2x – 4 E) y = 2
3 x
To determine if an EQUATION has direct proportion
____________________________________________________________________________________
____________________________________________________________________________________
2) Which graphs represent direct proportions?
A) B) C) D)
To determine if a GRAPH has direct proportion
____________________________________________________________________________________
____________________________________________________________________________________

9
3) Which tables represent direct proportions?
A) B) C) D)
To determine if a TABLE has direct proportion
____________________________________________________________________________________
____________________________________________________________________________________
4) Identify the direct proportion for each equation.
A) y = 4x B) y = 3
5 x C) y = x *D) y = 2x + 8
_________ _________ _________ _________
The DIRECT PROPORTION of an equation is the SAME as
____________________________________________________________________________________
*Remember that the y-intercept (b-value) must be 0.
Solving word problems:
Steps:
1 - Define x
2 - Write an equation
3 - Solve the equation
4 – Answer the question
5) A taxi charges $1.35 per mile traveled. If the total charge for one ride was $10.80, how many miles were
traveled? (Does this have direct proportion?)
10
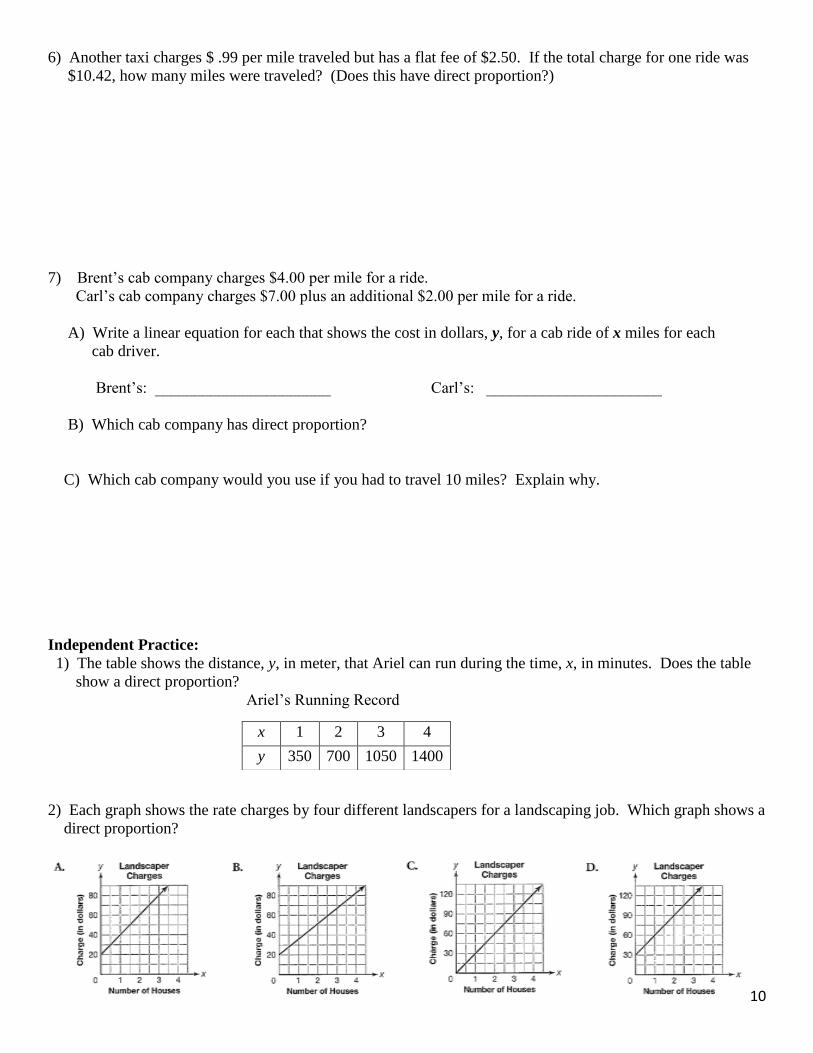
6) Another taxi charges $ .99 per mile traveled but has a flat fee of $2.50. If the total charge for one ride was
$10.42, how many miles were traveled? (Does this have direct proportion?)
7) Brent’s cab company charges $4.00 per mile for a ride.
Carl’s cab company charges $7.00 plus an additional $2.00 per mile for a ride.
A) Write a linear equation for each that shows the cost in dollars, y, for a cab ride of x miles for each
cab driver.
Brent’s: ______________________ Carl’s: ______________________
B) Which cab company has direct proportion?
C) Which cab company would you use if you had to travel 10 miles? Explain why.
Independent Practice:
1) The table shows the distance, y, in meter, that Ariel can run during the time, x, in minutes. Does the table
show a direct proportion?
Ariel’s Running Record
2) Each graph shows the rate charges by four different landscapers for a landscaping job. Which graph shows a
direct proportion?
x 1 2 3 4
y 350 700 1050 1400

11
3) The following table represents the conversion for quarts to liters.
a) What is the rate of change?
b) Write an equation to find the number of liters in any number of quarts.
c) How many liters are in 8 quarts?
d) Does this represent a direct proportion? Justify your answer.
4) A killer whale eats an average of 2 tons of plankton every day. The relationship between the number of days
and the number of tons of plankton eaten can be expressed in a table.
Number of
Days
x
Amount of Food
Eaten (in tons)
y
How would you express it in equation form? ___________________
Quarts
(q)
Liters
(l)
1 0.95
2 1.9
3 2.85
4 3.8
5 4.75

12
Lesson 2 Homework
1) Circle the equations that represent a direct proportion and justify your answer.
a) y = 3x + 4 b) y = x c) y = ½ x d) y = x2 e) y = -2x – 8 f) y = 1
3𝑥
__________________________________________________________________________________________
__________________________________________________________________________________________
__________________________________________________________________________________________
2) Circle which of the following graphs represent a proportional relationship?
A B C D
3) Write an equation whose direct proportion is 2
5 . _______________________
4) Use the graph to answer.
a) What is the rate of change ___________________
b) Write an equation to find the number of miles run y after any number of days x. ________________
c) How many miles will Marion run in the month of September? ____________________

13
5. Which is the equation of a line that intersects the y-axis at 2 and has a slope of -2?
A) y = 2x – 2 B) y = -2 + 2 C) 2y = -2x + 2 D) y = -2x + 2
6) What is the value of (23)-2?
A) 0 B) 1
16 C)
1
8 D)
1
64
7) The table shows the total number of text messages that Brad sent over 4 days.
a) Write an equation to find the total number of messages sent in any number of days. Describe the
relationship in words.
__________________________________________________________________________________________
__________________________________________________________________________________________
__________________________________________________________________________________________
b) Use the equation to find how many text messages Brad would send in 30 days.
8) a) What are the advantages of representing a function as an equation instead of a graph?
b) What are the disadvantages of representing a function as an equation instead of a graph?
9) The Grade 8 class is planning a party. The graph shows refreshments cost, y, based on the number of
students who will attend the party, x. What is the equation of the graph in slope-intercept form?
A) y = 0.4x + 10
B) y = 2.5x + 10
C) y = 3x + 10
D) y = 10x + 2.5
Number of Days, d 1 2 3 4
Total Messages, m 50 100 150 200
14
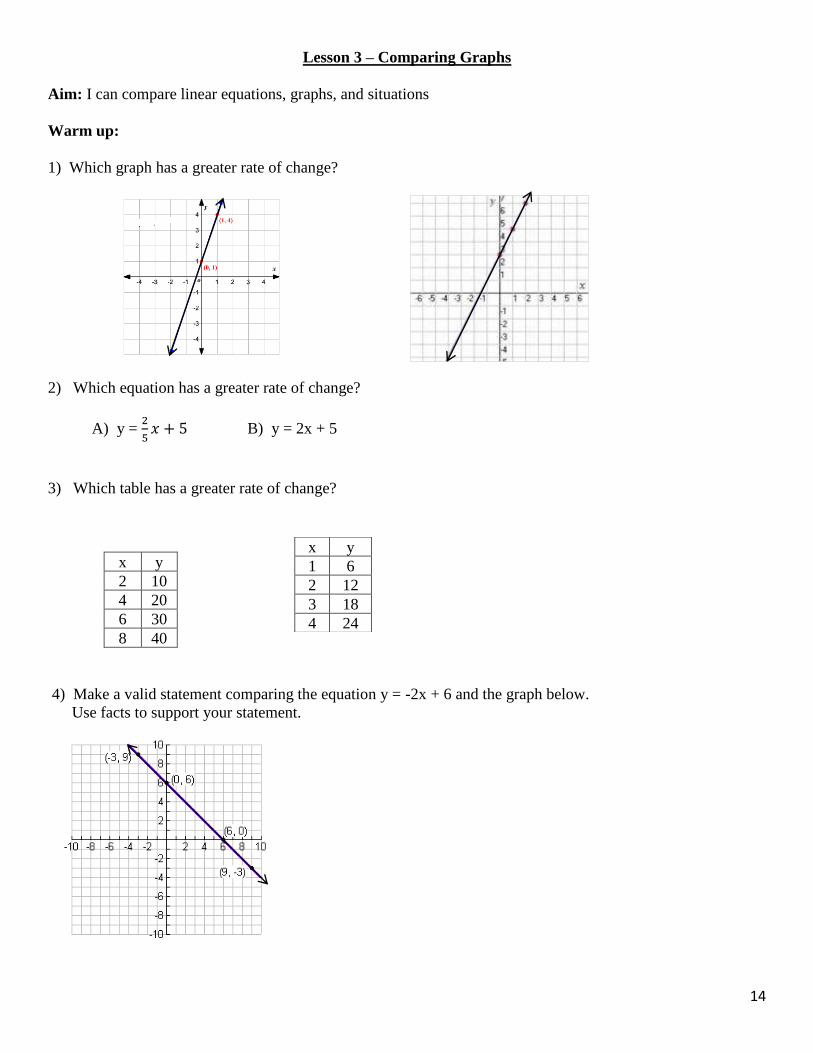
Lesson 3 – Comparing Graphs
Aim: I can compare linear equations, graphs, and situations
Warm up:
1) Which graph has a greater rate of change?
2) Which equation has a greater rate of change?
A) y = 2
5𝑥 + 5 B) y = 2x + 5
3) Which table has a greater rate of change?
x y
2 10
4 20
6 30
8 40
4) Make a valid statement comparing the equation y = -2x + 6 and the graph below.
Use facts to support your statement.
x y
1 6
2 12
3 18
4 24
15
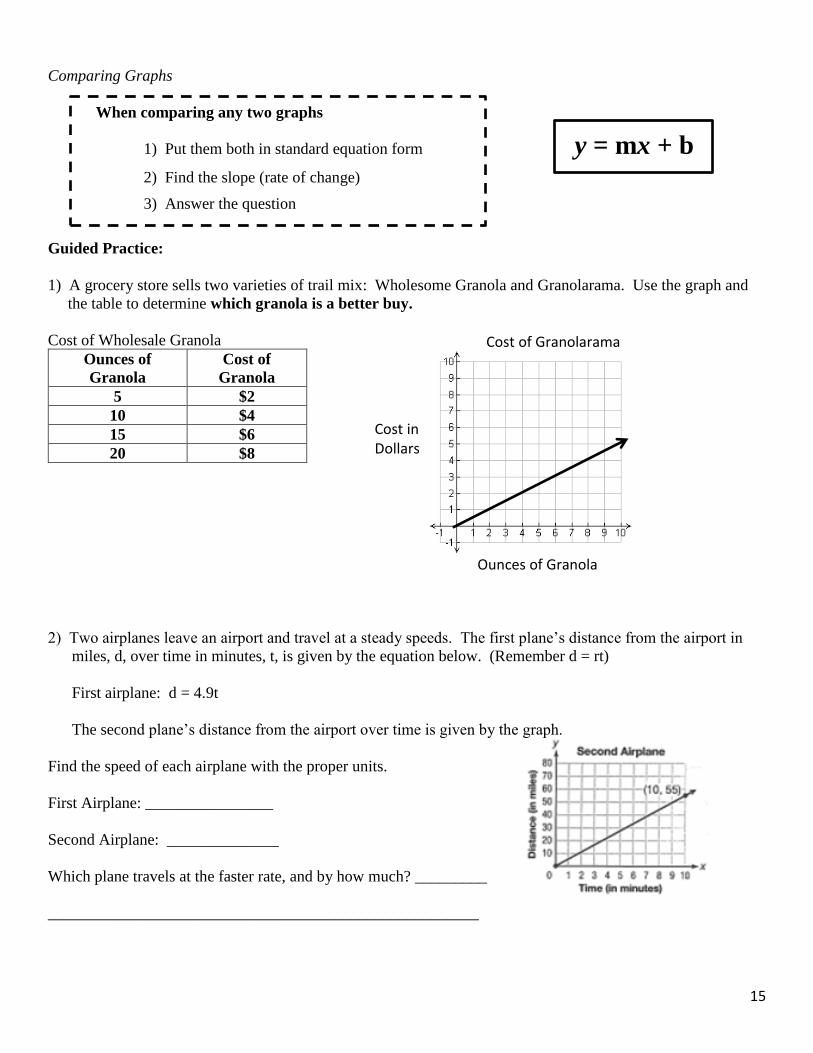
Comparing Graphs
When comparing any two graphs
1) Put them both in standard equation form y = mx + b
2) Find the slope (rate of change)
3) Answer the question
Guided Practice:
1) A grocery store sells two varieties of trail mix: Wholesome Granola and Granolarama. Use the graph and
the table to determine which granola is a better buy.
Cost of Wholesale Granola
Ounces of
Granola
Cost of
Granola
5 $2
10 $4
15 $6
20 $8
2) Two airplanes leave an airport and travel at a steady speeds. The first plane’s distance from the airport in
miles, d, over time in minutes, t, is given by the equation below. (Remember d = rt)
First airplane: d = 4.9t
The second plane’s distance from the airport over time is given by the graph.
Find the speed of each airplane with the proper units.
First Airplane: ________________
Second Airplane: ______________
Which plane travels at the faster rate, and by how much? _________
______________________________________________________
Cost of Granolarama
Ounces of Granola
Cost in Dollars

16
Independent Practice:
1) Tom and Eric are both house painters, and each charges an hourly rate for a painting job.
The equation y = 13x shows the total charge, y, in dollars, for hiring Tom to paint a house for x hours.
The table below shows the same information for Eric.
Eric’s Charges
Which statement is true?
A) Tom’s hourly rate is $1.00 cheaper.
B) Eric’s hourly rate is $1.00 cheaper.
C) Eric’s hourly rate is $13.00 cheaper.
D) Tom and Eric work for the same hourly rate.
2) The number of new movies a store receives can be represented by the function m = 7w + 2, where m
represents the number of movies and w represents the number of weeks. The number of games the same
store receives is shown in the table.
a) Compare the functions’ y-intercepts and rates of change.
____________________________________________________________________________________
____________________________________________________________________________________
____________________________________________________________________________________
b) How many new movies and games will the store have in 6 weeks?__________________
3) The population of two small towns change at a steady rate over a 10-year period. The population of
Holbrook is given by the equation below, where P is the population, and t is the number of years since the
year 2000. Population of Holbrook: P = -40t + 920
The population of Easton is shown in the graph.
Find the rate of change in each town’s population with the proper units
Holbrook: ________________
Easton: __________________
Make a valid comparison based on the given information.
x 2 4 6 8
y 26 52 78 104

17
Lesson 3 Homework
1) Sean and Ryan each have a membership to the gym. Sean’s membership is represents by the function
y = 3x + 29, where x represents the hours with a trainer, and y represents the cost. The cost of Ryan’s
membership is shown in the graph.
a) Compare the y-intercepts and rate of change.
b) What will be the total cost for Sean and Ryan if they each have
4 hours with a trainer?
2) Cassie has to buy several pounds of tomatoes at the farmer’s market. The graph shows the cost of buying
tomatoes at Farm Stand 1. The equation y = 4x gives the cost of buying x pounds of tomatoes at Farm
Stand 2. Which farm stand offers the better price?
3) Which equation represents a direct proportion?
A) y = x – 2 B) y = x + 2 C) y = 2
𝑥 D) y = 2x
4) What is true of the given graph?
A) The slope is positive
B) The slope is four
C) The slope equals zero
D) The slope is undefined

18
5) Solve for y: 10x + 2y = 18
6) A) Write the equation B) Make a table from the line
of the line
C) Create a situation to represent this graph
Solve for the variable and identify the type of solution.
7) 5x + 8 = 5(x + 3) 8) 9x = 8 + 5x 9) 6x + 12 = 6x + 12
Classify each polynomial as either a monomial, binomial, or trinomial.
10) 2x² + 3x - 1 11) 6xy 12) -7m5 13) 5y² - 2
______________ ______________ ______________ ______________
x y
19
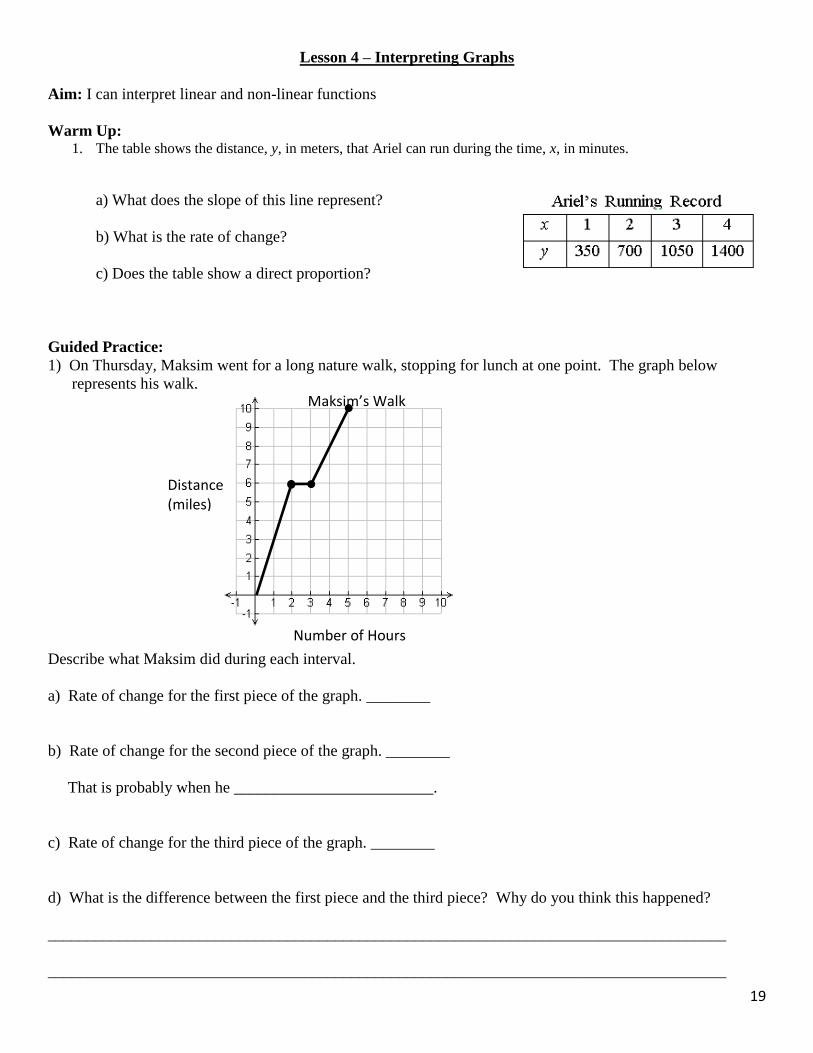
Lesson 4 – Interpreting Graphs
Aim: I can interpret linear and non-linear functions
Warm Up: 1. The table shows the distance, y, in meters, that Ariel can run during the time, x, in minutes.
a) What does the slope of this line represent?
b) What is the rate of change?
c) Does the table show a direct proportion?
Guided Practice:
1) On Thursday, Maksim went for a long nature walk, stopping for lunch at one point. The graph below
represents his walk.
Describe what Maksim did during each interval.
a) Rate of change for the first piece of the graph. ________
b) Rate of change for the second piece of the graph. ________
That is probably when he _________________________.
c) Rate of change for the third piece of the graph. ________
d) What is the difference between the first piece and the third piece? Why do you think this happened?
_____________________________________________________________________________________
_____________________________________________________________________________________
Maksim’s Walk
Number of Hours
Distance (miles)

20
2) The graph below represents the number of people in an outdoor stadium for a baseball game. Tell what the
x- and y-axes represent. Tell what happens during part A to E to the people at the game.
x: ___________________________________________________________________
y: ___________________________________________________________________
A: ___________________________________________________________________
B: ___________________________________________________________________
C: ___________________________________________________________________
D: ___________________________________________________________________
E: ___________________________________________________________________
How could a graph such as this be valuable to the owners of the baseball team? Explain.
__________________________________________________________________________________________
__________________________________________________________________________________________
__________________________________________________________________________________________
3) Explain a situation which the graph could represent:
______________________________________________________
_________________________________________________
_______________________________________________________
What is the equation of the line?
_______________________________________________________

21
Independent Practice:
1) What is the rate of change for interval A?
2) Explain what you think may have happened
during interval C.
3) If the rate of change for interval A had remained
constant throughout the whole marathon, how long
would it have taken Karen to finish 26 miles?
4) List the type of interval on the graph by writing the letters below the correct heading.
Increasing Constant Decreasing
_______________ ________________ ________________
a) What was the total change in income from the beginning of March through the
end of April? ______________________
b) What was the total change in income from the beginning of March through the
end of May? ____________________________
5) Enrique is taking a plane trip. The plane will take off and ascend for about 20 minutes, maintain a constant
altitude for about 50 minutes, and then descend for about 20 minutes before landing.
Which graph shows Enrique’s trip?

22
Lesson 4 Homework
1) Wendy draws the graph below to represent a situation. Which statement correctly interprets the graph? A) Wendy’s cup collection is decreasing over time.
B) Wendy’s cup collection is increasing at a rate of 10
cups per month
C) Wendy’s cup collection is increasing at a rate of 5
cups per month
D) Wendy’s cup collection is increasing at a rate of 1
cup every two months
2) John drew the graph below to represent a situation.
Which statement could describe the situation John
graphed?
A) The temperature of a TV dinner cooking in a microwave increases 100 degrees every minute. B) The temperature of a TV dinner cooking in a microwave increases 20 degrees each minute. C) The temperature of a TV dinner cooking in a microwave decreases 15 degrees each minute. D) The temperature of a TV dinner cooking in a microwave decreases 20 degrees each minute.
3) Write the letter of the graph that matches each description in a-c
a) A car starts from a complete stop and accelerates at a constant rate. Then it travels at a constant speed unit the driver sees a stop sign and gradually slows down to a stop. ______________ b) A car is traveling at a constant speed. It accelerates at a constant rate. Finally, it continues traveling at a constant speed. ______________ c) A car slows down at a constant speed as is approaches a red light. After a short time, the light changes and the car gradually accelerates. ________________
4) On the lines below, describe a situation that can represent the given graph.
__________________________________________ __________________________________________ ______________________________________________
__________________________________________ ______________________________________________
hich statement could describe the situation John
graphed?

23
5) Which situation is best represented by the graph below?
A) A student’s homework average if they do not do their homework.
B) The volume of a balloon as it is being filled with air.
C) The height of a tree as it grows.
D) The path a rocket follows as it is shot into the air.
6) Michelle and Adam pay their babysitter $2 an hour to babysit their child. Which graph correctly shows the
relationship between the number of hours the babysitter works, x, and the total cost in dollars, y?
7) Hibah walks one mile every two hours. On the grid below, create a graph that shows the situation and
the relationship between the number of miles she walks and the number of hours it takes her to walk.
Be sure to title your graph, label the axes, and graph all data
Review:
8) Solve: 2x + 8 = 2x - 5
9) Compare the given statement using <, >, =. 80 ______83
13
10) Which has a greater rate of change: y = 2x – 4 or 2y = -6x + 10

24
Lesson 5 – Construct a Scatter Plot
Aim: I can construct a scatter plot
Warm Up: Plot the points using the given (x, y) table.
Vocabulary
Scatter plot – A graph of paired data in which the data values are plotted as points in the (x, y) format.
Outlier – A data point with a value that is very different from the other data points in the set.
Steps:
1 - Make an (x, y) table
2 - Make a graph: Be sure to
• Title the graph
• Label the x and y axes
• Use a consistent and appropriate scale.
3 - Plot the points
1) The owner of a diner wanted to find out if outside temperature affects soup sales. Create a scatter plot from
the table below.
x Temperature (in F) 30 32 35 40 40 45 54 60 64 68
y Bowls of Soup Sold 8 50 42 42 38 28 22 15 16 5
After graphing a scatter plot, you must be able to determine if the association is linear or non-linear.

25
Guided Practice:
For each scatterplot, tell whether the association is linear or non-linear.
1) 2)
Also, you must be able to determine if the association is positive, negative, or no association (correlation).
For each scatterplot, tell whether the association is positive, negative, or no association.
3) 4) 5)
Lastly, you must be able to answer questions and make predictions from your graph.
6) What does the point (25,47) represent in the graph below?

26
Independent Practice:
1) The table below shows the number of minutes shoppers spent in a supermarket and the amounts each spent
during that shopping trip. Make a scatter plot from the table.
Time and Total Spent
2) Describe the association shown in your scatter plot, in as many ways as possible.
______________________________________________________________________________________
______________________________________________________________________________________
Are there any outliers in the data? If so, what are the ordered pairs of the points?__________________
3) Which best describes the trend show in the scatter plot?
A) positive trend C) negative trend
B) no trend D) positive and negative trend
Time
in Minutes
Total
in Money
10 $20
30 $80
50 $120
20 $40
60 $150
30 $60
40 $90
70 $180
60 $20
50 $140

27
Lesson 5 Homework
1) Christina works at the ice cream shop during summer vacation. She uses the following table to record the
highest temperature each day for two weeks and the number of ice cream cones she sold on each of those days.
Temperature
(F)
85 87 91 95 88 83 80 82 88 90 93 85 87 83
Cones Sold 76 77 70 60 91 79 67 73 78 87 92 95 85 68
a) Use the information from the table to create a scatter plot of the data.
b) What type of correlation does the graph represent?_________________________________
c) Are there any outliers in the data? If so, what are the ordered pairs of the points?______________________
2) Which relationship could be represented by the scatter plot below?
A) The relationship between length of hair and the length of fingernails
B) The relationship between inches of monthly snowfall and the number of sunny days
C) The relationship between a student’s distance from school and the time it takes her to get to school
D) The relationship between hours spent studying and the number of incorrect answers on a test

28
3) Which graph could represent the relationship between the time, in minutes, water in a pot is heating, x, and
the temperature of the water, y, if the beginning temperature of the water is 0 degrees and once the
temperature gets to 100 degrees it remains at that temperature?
4) A tiger in captivity is fed 13.5 pounds of food a day. The graph shows the pounds of food an elephant in
captivity eats per day. Compare the functions by comparing their rates of change.
5)
What is the slope of the line?
A) -4 B) 4 C) 1
4 D) −
1
4

29
Lesson 6 – Line of Best Fit (Trend Line)
Aim: I can find the Line of Best Fit (Trend Line)
Warm up: Read to understand the following information.
Trend line – A line that models the relationship between two variables in a scatter plot; also called a
Line of Best Fit.
If the data points on a scatter plot shows a linear association, you can draw a straight line that models the
general trend of the data. This line of best fit, or trend line, will probably not fit all the data points exactly.
However, if the line you draw is a good fit, it will be close to most of the data points.
Steps:
1 - Make an (x, y) table
2 - Make a graph: Be sure to
• Title the graph.
• Label the x and y axes.
• Use a consistent and appropriate scale.
3 - Plot the points
4 - Draw a Line of Best Fit (Trend Line): Be Sure to
• Intersect the y-axis at an exact point.
• Figure out a slope that intersects as many data points as possible.
5 - Write the equation of the line
Guided Practice:
1)
Savings vs. Years
Years
Savings in Bank
Account in
Thousand $
a) Draw a trend line for the data.
b) Does the trend line show a negative, positive,
or no correlation? ________________________
c) Does the trend line show a linear association
or a nonlinear association?
__________________
d) What information do we need in order to
determine the equation for the trend line?
________________________________
e) What is the equation of the line of best fit?
______________________________________
f) Name one outlier _________________

30
2) Joey kept track of the number of free throws that his team shot in a practice and the percentage that they
made in the next game. He displayed his findings in the scatter plot shown below.
a) Draw a trend line for Joey’s data.
b) Does the trend line show a negative, positive, or no correlation? ________________________
c) Does the trend line show a linear association or a nonlinear association? __________________
d) What information do we need in order to determine the equation for the trend line?
___________________________________________________________
e) What is the equation of the line of best fit? __________________________________________
f) A student takes 60 free throws during practice. Using the equation for the line of best fit, find the free throw
percentage that the student is likely to have during the next game. ___________________________
g) Identify three outliers. _______________________________________________________________
h) What is an outlier? ______________________________________________________
3) A) What is the equation of the trend line drawn?
______________________
B) Based on this trend, what is the cost of 60 lbs?
___________________________
B) If the cost is $40, what is the shipment weight?
___________________________

31
Independent Practice:
1) The graph shows a scatter plot of data in the x, y coordinate plane.
A) Sketch a line of best fit.
B) Which of the following best represents the equation of the line of best fit for the data in the graph?
(A) y = x + 2 (B) y = -x + 1
(C) y = 2x + 1 (D) y = x + 1
C) State the coordinates of one of the outliers. ________
D) What makes it an outlier?
__________________________________________________________________
2) For 10 days, Romero kept a record of the number of hours he spent listening to music. The information is
shown in the table below.
A) Which scatter plot shows Romero’s data graphically?
B) Which graph, if any, has a linear relationship?
___________________

32
3) There is a negative correlation between the number of hours a student watches television and his or her
social studies test score.
A) Which scatter plot below displays this correlation? ___________________________
B) Draw a line of best fit for answer choice 2. What is the equation of the line you drew?
___________________________
C) Draw a line of best fit for answer choice 1. What is the equation of the line you drew?
___________________________
(D) When comparing the lines of best fit in B) and C), which has a greater rate of change?
___________________________

33
Lesson 6 Homework
1) Below is a graph displaying the money earned by Susie from babysitting.
A) Which equation most closely represents the line of
best fit for the scatter plot?
B) What type of correlation is displayed by the data? ________________
C) Based on the equation found, how much would Susie earn if she worked for 10 hours? _______________
2) The number of hours spent on math homework each week and the final exam grades for twelve students in
Mr. Dylan’s algebra class are plotted below.
A) Based on a line of best fit, which exam grade is the best prediction for
a student who spends about 4 hours on math homework each week?
(1) 62 (2) 72 (3) 82 (4) 92
B) What is the equation of the line of best fit? ___________________
C) Is the data linear or nonlinear? ____________________
3) Which scatter plot shows the relationship between x and y if x represents a student score on a test and y
represents the number of incorrect answers a student received on the same test?
(A) (B) (C) (D)
4) In question #3, what type of slope does Choice (D) have? _____________________
5) In question #3, write the equation of the line created in Choice (D). ___________________
6) In question #3, which Choice would not have a linear relationship? _____________________
1. 𝑦 = 𝑥 2. 𝑦 = 2
3𝑥 + 1
3. 𝑦 = 3
2𝑥 + 4 4. 𝑦 =
3
2𝑥 + 1

34
7) Below is a graph that compares the height of people versus their savings.
A) Which statement best describes this situation?
(1) The taller someone is, the more money is saved.
(2) The taller someone is, the less money is saved.
(3) There is no correlation to height and savings
B) TRUE OR FALSE: If you are 160cm tall, that
means you must have $6,000 saved?
C) TRUE OR FALSE: This is a linear relationship.
8) The following is a graph of Study Time versus Grades achieved.
A) Draw a line of best fit (trend line)
B) What is the approximate rate of change of the line
drawn?
________________________
9) The scatter plot shows data for some of the largest major lakes in the world. Area and maximum depth
were graphed.
What conclusion about their relationship can be drawn
from the graph?
(1) As area increases, depth increases.
(2) As area decreases, depth decreases.
(3) As area increases, depth remains the same.
(4) There appears to be no relationship between area and
depth.

35
Unit 6 Review
5. The late fees for a School library are represented by the function c = 0.25d, where c is the total cost and d is
the number of days a book is late. The fees charged by a City library are shown in the table.
City Library a) Compare the functions’ y-intercepts and rates of change.
b) Shamar checks out one book at each library and returns both books 3 days late. What are the fees for each library?

36
6. Given the following graph, find the rate of change. Does the graph represent a direct relationship? Explain.
7. The maximum distance traveled by the space shuttle can be determined using the equation d = 4.8s, where d
is the distance, in miles, and s is the number of seconds. The table shows the distance traveled by the Apollo
10 astronauts returning from the moon.
Distance Traveled by Apollo 10
Number of Seconds Distance Traveled (in
miles)
5 23.5
10 47
15 70.5
20 94
Compare the slopes to determine which craft – the space shuttle or Apollo 10 – traveled at a greater speed
and explain the steps you took.
a) Describe the association. _________________ a) Describe the association. ___________________
b) Draw the trend. b) Draw the trend.
c) Write equation of the trend line. ___________ c) Write equation of the trend line. ____________
d) Identify any outlier(s) _____________________ d) Identify any outlier(s) _____________________

37
10. A store receives an average of 7 new movies per week.
a) Make a table to represent the number of movies rented each week
b) Graph the number of movies the store receives
11. The number of baskets a company produces each day is shown in the table.
a) Write an equation to find the total number of baskets crafted in any number of days. Describe the
relationship in words.
____________________________________________________________________________________
____________________________________________________________________________________
____________________________________________________________________________________
b) Use the equation to determine how many baskets the company makes in one non-leap year.
Weeks, w Movies, m
Number of Days,
d
Total Baskets, b
1 45
2 90
3 135
4 180
0 1 2 3 4 5 Weeks
40 30 20 10
Mo
vies

38
12. Cathy wanted to see if there was a relationship between students’ grade levels and school club participation.
She made this two-way table to show her results.
One or More Clubs Not in a Club Total
Grade 6 6 44 50
Grade 7 23 27 50
Grade8 40 10 50
Total 69 81 150
a) Find the relative frequencies for the table above. ____________________________________________
One or More Clubs Not in a Club Total
Grade 6
Grade 7
Grade8
Total
b) Draw and state two conclusions about the relationships between a student’s grade level and the
likelihood that he or she will participate in school clubs.
___________________________________________________________________________________
____________________________________________________________________________________
____________________________________________________________________________________
____________________________________________________________________________________
13.

39
Use the graph to answer the questions below.
The line graph shows temperatures over the year in Jamaica.
14) Which month had the highest temperature? ________________________________
15) Which month had the lowest temperature? ________________________________
16) What is the difference in temperature between February and May? ______________
17) How many months have a temperature higher than 30°C? ____________________
18) What is the range of temperatures in Jamaica over the year? ____________________
19) Would you expect the temperature range in the UK to be similar or different? Explain your answer.
__________________________________________________________________________________________
__________________________________________________________________________________________
__________________________________________________________________________________________
20) Which equations represent proportional relationships?
A) y = 3x B) y = ½ x – 3 C) y = 7x D) y = -2x E) y = 2
3 x F) y = x

40
Unit 1 and 2
Simplify each expression
21) 53 ∙ 67 ∙ 5-3 ∙ 6 22) 28392−3
310 23) 20 – 52 + 10 24) (5x8)0
Unit 3
Solve each equation
25) 3x + 7 = 3(x +7) 26) 4x + 5 – 4x = 4x + 5 27) 2
3𝑥 −
1
2=
5
6
Unit 4
28) Given the following line, complete the table and write the equation of the line.
29)
30) Given the points (3,4) and (7,9), find the slope. 31) Find the slope and y-intercept given 2x + y = 7
x y

41
Unit 5
Which of the following represents a function?
32) 33) 34) 35)
Determine the rate of change.
36) 3 – x = y 37) 38)
Determine the number of solutions. (one solution, no solution, or infinite solutions).
39) y = 2x + 8 40) y = -2x + 8 41) y = 2x + 3
y = 3x – 7 y = -2x – 4 5y = 10x + 15
Are the following Linear or Non-linear
42) 𝑦 = 𝑥2 + 2𝑥 43) 𝑦 =1
3𝑥 + 2 44) Getting paid $7.25 per hour 45)
x y
0 -1
2 7
4 15
6 23
8 31
Domain
Beth Sally Lucy Jen
Range
Dave Mike Ryan Dan
Domain
2 3 4 5
Range
1 2 3
x y
1 2
5 4
7 6
9 8