math 9 4.4 and 4.5 practice quiz - greater st. albert...
TRANSCRIPT
Name: ______________________ Class: _________________ Date: _________ ID: A
1
Math 9 4.4 and 4.5 Practice Quiz
Short Answer
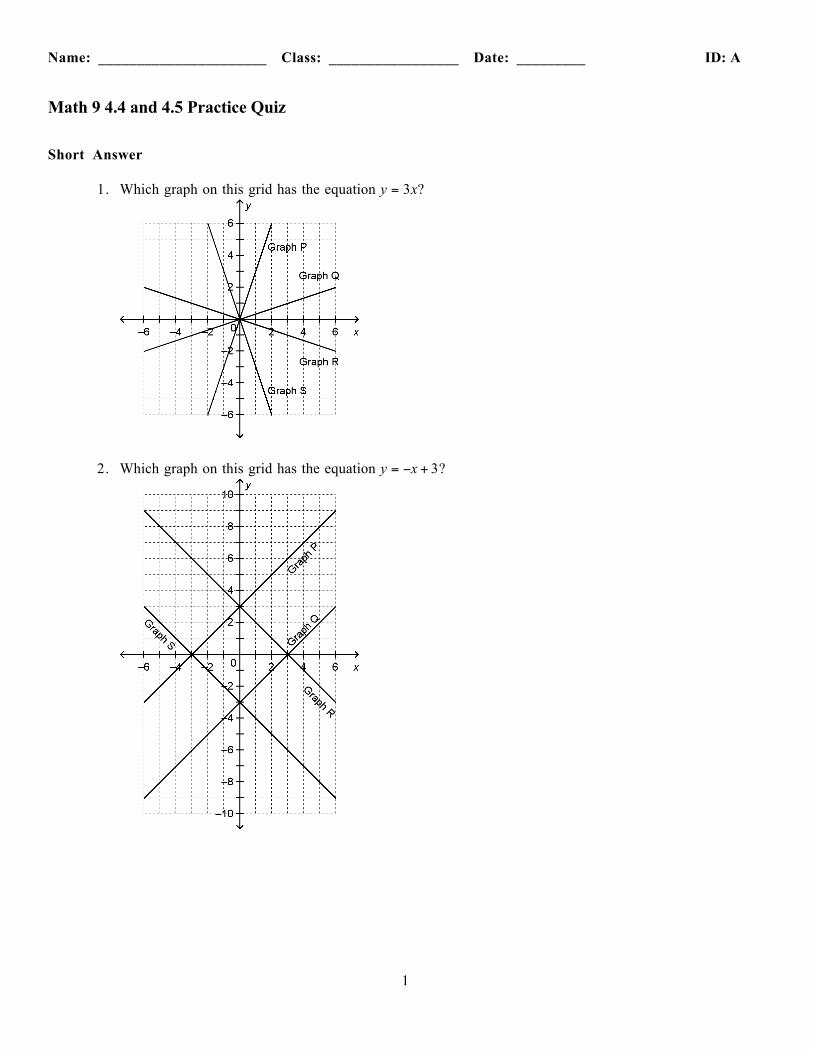
1. Which graph on this grid has the equation y = 3x?
2. Which graph on this grid has the equation y = −x + 3?

Name: ______________________ ID: A
2
3. Which equation describes the graph below?i) y = 4xii) y = 4x + 4iii) y = −x + 4iv) y = −4x + 4
4. This graph represents a linear relation. Determine the value of y when x = 5.

Name: ______________________ ID: A
3
5. This graph represents a linear relation. Determine the value of x when y = 2.
6. This graph represents a linear relation. Determine the value of x when y = 8.

Name: ______________________ ID: A
4
7. A car travels at a constant speed. The graph shows how the distance of the car changes with time. Estimate the time it takes to travel 330 km.
8. Match each equation with a graph on the grid below.i) y = 2x − 1ii) y = 2x + 2iii) y = 2x − 5

Name: ______________________ ID: A
5
9. Match each equation with a graph on the grid below.i) 2x = 5ii) 2y = −7iii) y = 2x
10. This graph represents a linear relation.a) Estimate the value of y when x = 3.b) Estimate the value of x when y = –4.
Name: ______________________ ID: A
6
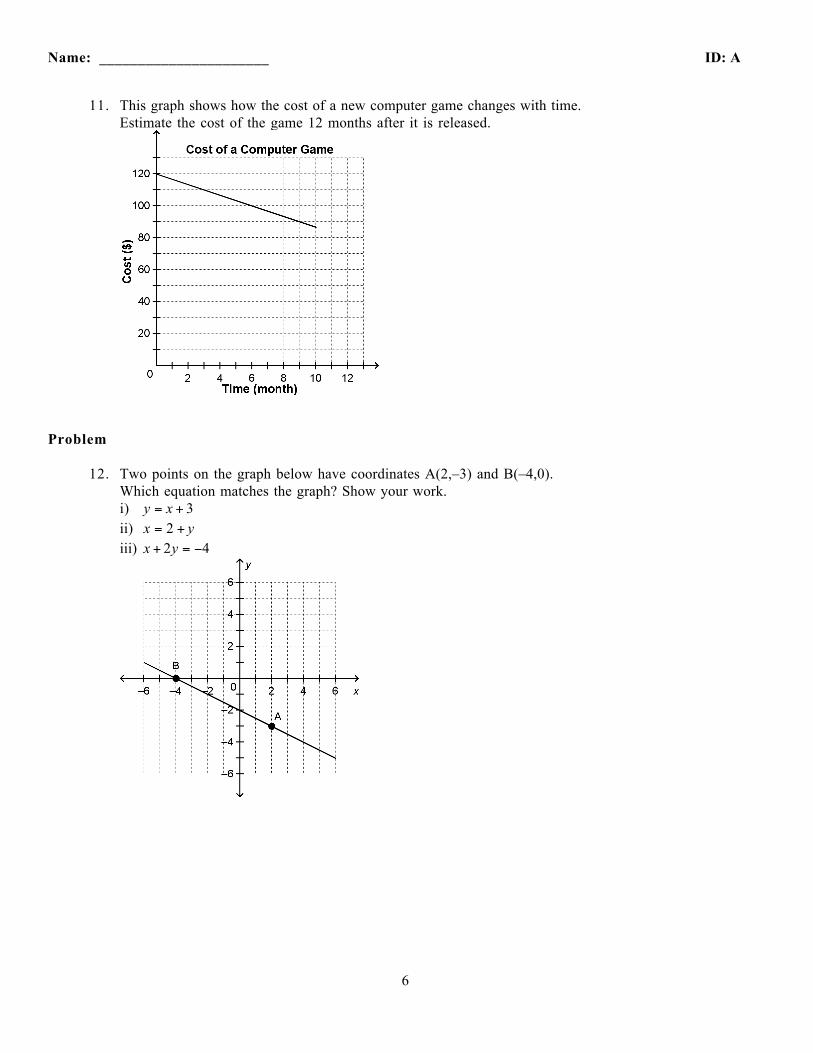
11. This graph shows how the cost of a new computer game changes with time.Estimate the cost of the game 12 months after it is released.
Problem
12. Two points on the graph below have coordinates A(2,–3) and B(–4,0).Which equation matches the graph? Show your work.i) y = x + 3 ii) x = 2 + yiii) x + 2y = −4
Name: ______________________ ID: A
7
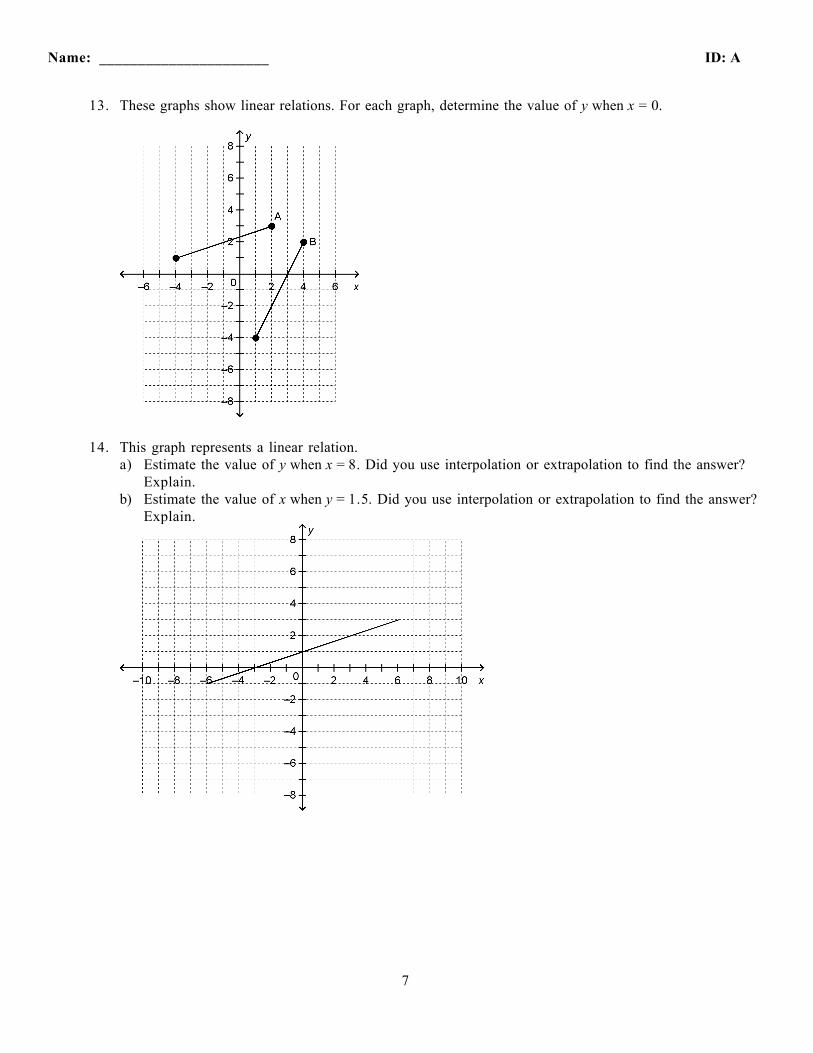
13. These graphs show linear relations. For each graph, determine the value of y when x = 0.
14. This graph represents a linear relation.a) Estimate the value of y when x = 8. Did you use interpolation or extrapolation to find the answer?
Explain.b) Estimate the value of x when y = 1.5. Did you use interpolation or extrapolation to find the answer?
Explain.
Name: ______________________ ID: A
8
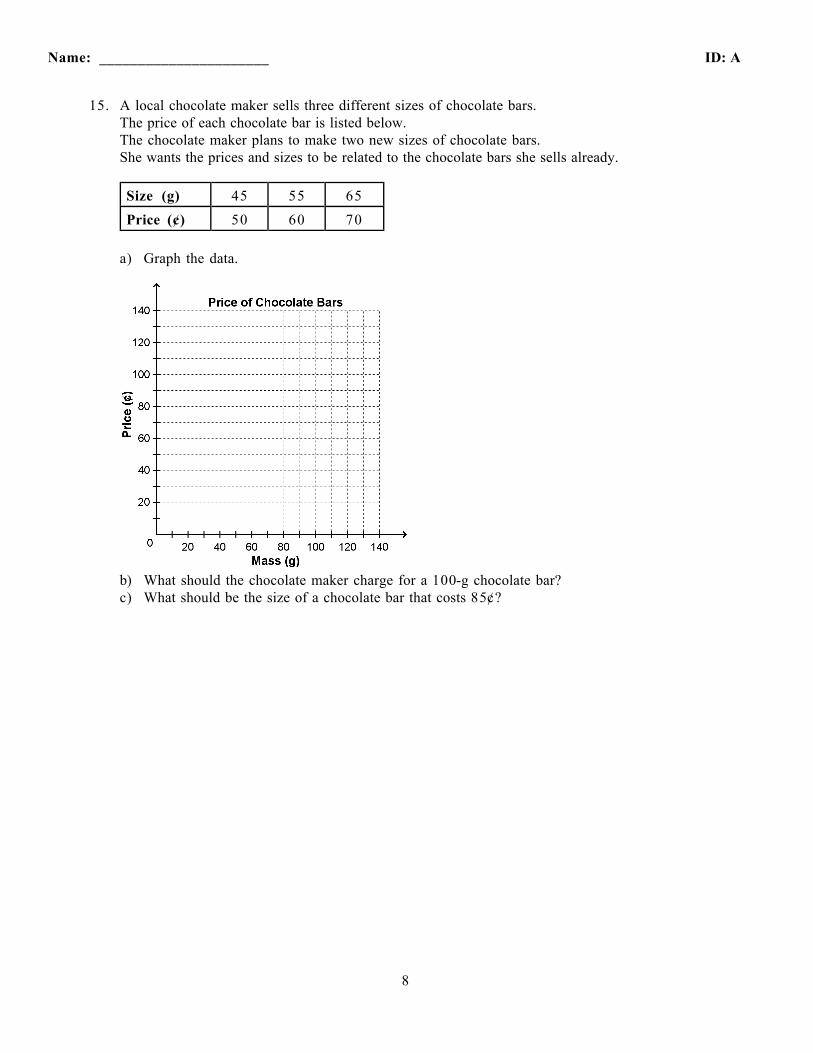
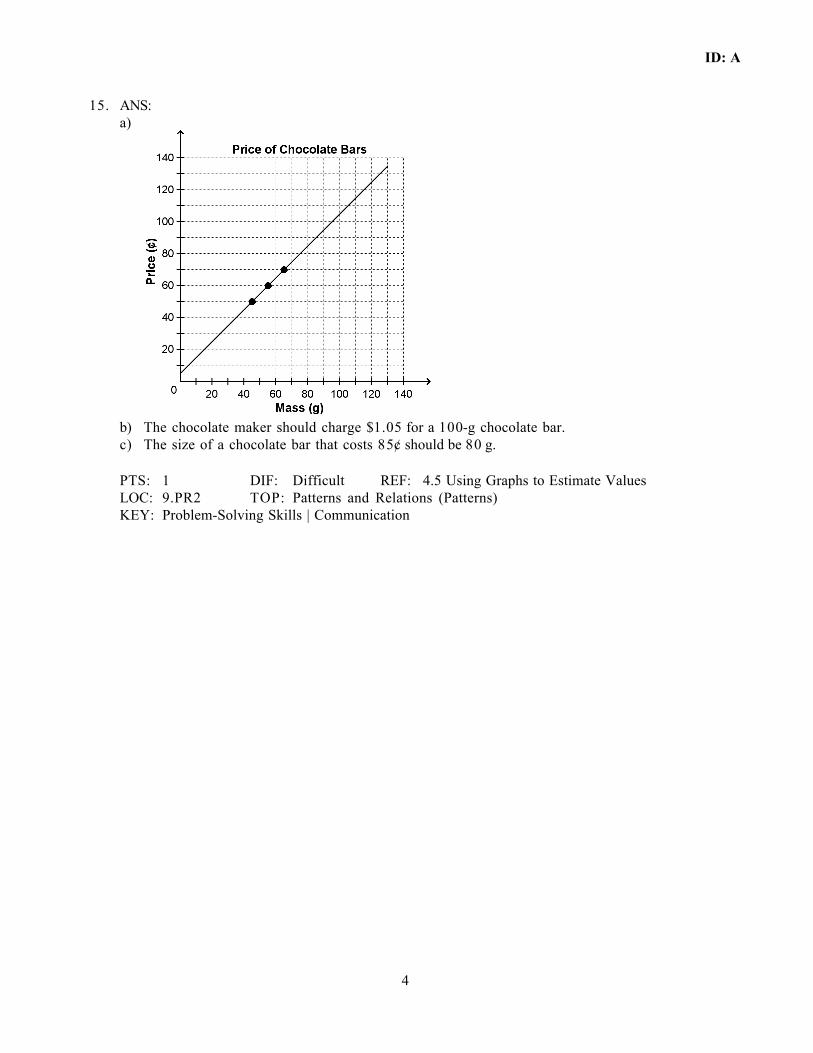
15. A local chocolate maker sells three different sizes of chocolate bars. The price of each chocolate bar is listed below. The chocolate maker plans to make two new sizes of chocolate bars. She wants the prices and sizes to be related to the chocolate bars she sells already.
Size (g) 45 55 65Price (¢) 50 60 70
a) Graph the data.
b) What should the chocolate maker charge for a 100-g chocolate bar?c) What should be the size of a chocolate bar that costs 85¢?

ID: A
1
Math 9 4.4 and 4.5 Practice QuizAnswer Section
SHORT ANSWER
1. ANS: Graph P
PTS: 1 DIF: Easy REF: 4.4 Matching Equations and GraphsLOC: 9.PR2 TOP: Patterns and Relations (Patterns) KEY: Procedural Knowledge
2. ANS: Graph R
PTS: 1 DIF: Easy REF: 4.4 Matching Equations and GraphsLOC: 9.PR2 TOP: Patterns and Relations (Patterns) KEY: Procedural Knowledge
3. ANS: iv
PTS: 1 DIF: Moderate REF: 4.4 Matching Equations and GraphsLOC: 9.PR2 TOP: Patterns and Relations (Patterns) KEY: Procedural Knowledge
4. ANS: 2
PTS: 1 DIF: Easy REF: 4.5 Using Graphs to Estimate ValuesLOC: 9.PR2 TOP: Patterns and Relations (Patterns) KEY: Procedural Knowledge
5. ANS: 0.5
PTS: 1 DIF: Easy REF: 4.5 Using Graphs to Estimate ValuesLOC: 9.PR2 TOP: Patterns and Relations (Patterns) KEY: Procedural Knowledge
6. ANS: 7
PTS: 1 DIF: Moderate REF: 4.5 Using Graphs to Estimate ValuesLOC: 9.PR2 TOP: Patterns and Relations (Patterns) KEY: Procedural Knowledge
7. ANS: 12 h
PTS: 1 DIF: Moderate REF: 4.5 Using Graphs to Estimate ValuesLOC: 9.PR2 TOP: Patterns and Relations (Patterns) KEY: Procedural Knowledge
ID: A
2
8. ANS: Graph A: y = 2x + 2Graph B: y = 2x − 1Graph C: y = 2x − 5
PTS: 1 DIF: Moderate REF: 4.4 Matching Equations and GraphsLOC: 9.PR2 TOP: Patterns and Relations (Patterns) KEY: Procedural Knowledge
9. ANS: Graph A: y = 2xGraph B: 2y = −7Graph C: 2x = 5
PTS: 1 DIF: Moderate REF: 4.4 Matching Equations and GraphsLOC: 9.PR2 TOP: Patterns and Relations (Patterns) KEY: Procedural Knowledge
10. ANS: a) y = 8b) x = –3
PTS: 1 DIF: Moderate REF: 4.5 Using Graphs to Estimate ValuesLOC: 9.PR2 TOP: Patterns and Relations (Patterns) KEY: Procedural Knowledge
11. ANS: $80
PTS: 1 DIF: Moderate REF: 4.5 Using Graphs to Estimate ValuesLOC: 9.PR2 TOP: Patterns and Relations (Patterns) KEY: Procedural Knowledge
ID: A
3
PROBLEM
12. ANS: Substitute x = 2 and y = −3 in y = x + 3.Left side: y = −3 Right side: x + 3 = 2 + 3
= 5The left side does not equal the right side.So, the coordinates do not satisfy the equation.
Substitute x = 2 and y = −3 in x = 2 + y.Left side: x = 2 Right side: 2 + y = 2 + (−3)
= −1The left side does not equal the right side.So, the coordinates do not satisfy the equation.
Substitute x = 2 and y = −3 in x + 2y = −4.Left side: x + 2y = 2 + 2(−3)
= 2 − 6= −4
Right side: −4
The left side does equal the right side, so the coordinates of A satisfy the equation.Substitute x = −4 and y = 0 in x + 2y = −4.Left side: x + 2y = −4 + 2(0)
= −4
Right side: −4
The left side does equal the right side, so the coordinates of B satisfy the equation.Since both pairs of coordinates satisfy the equation, the graph has equation x + 2y = −4.
PTS: 1 DIF: Difficult REF: 4.4 Matching Equations and GraphsLOC: 9.PR2 TOP: Patterns and Relations (Patterns) KEY: Problem-Solving Skills | Communication
13. ANS:
Graph A: y = 2 13
when x = 0.
Graph B: y = –6 when x = 0.
PTS: 1 DIF: Moderate REF: 4.5 Using Graphs to Estimate ValuesLOC: 9.PR2 TOP: Patterns and Relations (Patterns) KEY: Procedural Knowledge
14. ANS: a) y = 3.67 when x = 8. I used extrapolation because I had to extend the graph to find the answer.b) x = 1.5 when y = 1.5. I used interpolation because the answer is between two data points on the graph.
PTS: 1 DIF: Difficult REF: 4.5 Using Graphs to Estimate ValuesLOC: 9.PR2 TOP: Patterns and Relations (Patterns) KEY: Procedural Knowledge | Communication
ID: A
4
15. ANS: a)
b) The chocolate maker should charge $1.05 for a 100-g chocolate bar.c) The size of a chocolate bar that costs 85¢ should be 80 g.
PTS: 1 DIF: Difficult REF: 4.5 Using Graphs to Estimate ValuesLOC: 9.PR2 TOP: Patterns and Relations (Patterns) KEY: Problem-Solving Skills | Communication