mathematical analysis of peeling of …etd.lib.metu.edu.tr/upload/12606514/index.pdfmathematical...
TRANSCRIPT

MATHEMATICAL ANALYSISOF
PEELING OF CARROTS
A THESIS SUBMITTED TOTHE GRADUATE SCHOOL OF NATURAL AND APPLIED SCIENCES
OFMIDDLE EAST TECHNICAL UNIVERSITY
BY
ÖZLEM AYDIN
IN PARTIAL FULFILLMENT OF THE REQUIREMENTS FOR
THE DEGREE OF MASTER OF SCIENCEIN
FOOD ENGINEERING
AUGUST 2005
i

Approval of the Graduate School of Natural and Applied Sciences
Prof Dr Canan ÖZGEN
I certify that this thesis satisfies all the requirements as a thesis for the degree of Master of Science.
Prof Dr Levent BAYINDIRLIHead of the Department
This is to certify that we have read this thesis and that in our opinion it is fully adequate, in scope and quality, as a thesis for the degree of Master of Science.
Prof Dr Nevzat ARTIK Prof Dr Levent BAYINDIRLI Co-Supervisor Supervisor
Examining Committee Members
Assoc.Prof.Dr Gülüm ŞUMNU (METU,FDE)
Prof Dr Levent BAYINDIRLI (METU,FDE)
Prof.Dr.Nevzat ARTIK (Ankara University, FDE)
Assoc.Prof.Dr. Ender POYRAZOĞLU (Ankara University, FDE)
Inst.Dr. Deniz ÇEKMECELİOĞLU (METU,FDE)
ii

I hereby declare that all information in this document has been obtained and presented in accordance with academic rules and ethical conduct. I also declare that, as required by these rules and conduct, I have fully cited and referenced all material and results that are not original to this work.
Name, Last name : ÖZLEM AYDIN
Signature :
iii

ABSTRACT
MATHEMATICAL ANALYSIS
OF
PEELING OF CARROTS
Aydın, Özlem
M.S., Department of Food Engineering
Supervisor : Prof. Dr. Levent Bayındırlı
Co-Supervisor: Prof. Dr. Nevzat Artık
August 2005, 93 pages
In this study, carrots of Beypazarı variety, cultivated during 2004 season were
chemically and steam peeled. Effects of temperature, concentration of NaOH
solutions and immersion time on lye peeling of carrots were studied; optimum time-
temperature-concentration relations were analyzed mathematically. Then suitable
combinations of concentration, temperature and time were determined just by
considering degree of peeling. Increases in both temperature and concentration of lye
solution led to a decrease in peeling time. However it was observed that the
temperature of the lye solution was the main effect on the quality of carrots.
Treatment with 0.75 % NaOH at 77°C for 10.5 minutes was found to be optimum to
peel the carrots, mathematically. In steam peeling, the peeled surface area-time
relations were analyzed mathematically. Complete peeling was achieved at 8.5
minutes. Under complete peeling conditions, the effect of chemical and steam
peeling on quality of carrots were determined. Then the mathematical optimum value
for chemical peeling was evaluated for quality parameters. The optimum chemical
iv

peeling value was fitted to the peeling yield-pectin relations. The peeling yield of
steam peeled carrot was higher than the chemically peeled carrot. The color of the
chemically peeled carrot had the highest consumer acceptance compared to
conventional peeling. Finally, the two conditions were suitable for considering the
need of the plant design.
Keywords: carrot, chemical peeling, mathematical analysis, pectin, steam
peeling,
v

ÖZ
HAVUÇLARIN SOYULMASININ
MATEMATİKSEL ANALİZİ
Aydın, Özlem
Y.Lisans, Gıda Mühendisliği Bölümü
Tez Yöneticisi : Prof. Dr. Levent Bayındırlı
Ortak Tez Yöneticisi: Prof. Dr. Nevzat Artık
Ağustos 2005, 93 sayfa
Bu çalışmada Beypazarı havuçları kimyasal ve buhar yöntemleriyle
soyulmuştur. Havuçların kimyasal yöntemle soyulmasında sıcaklık, NaOH çözeltileri
konsantrasyonu ile daldırma sürelerinin etkileri çalışılmış ve optimum zaman-
sıcaklık-konsantrasyon ilgileri matematiksel olarak analiz edilmiştir. Uygun
konsantrasyon-sıcaklık-zaman bileşimi sadece soyulma derecesi göz önünde
bulundurularak seçilmiştir.Sıcaklık ve çözelti konsantrasyonun artışı soyulma
süresinin kısalmasını sağlar. Fakat, çözelti sıcaklığının havuç kalitesi için daha
önemli bir faktör olduğu anlaşılmıştır. Matematiksek olarak, %0,75 NaOH çözeltisi ,
77°C’de 10,5 dakika uygulanmasının optimum olduğu belirlenmiştir. Buharla
soymada soyulmuş alan-zaman ilgileri matematiksel olarak analiz edilmiştir. Tam
soyulmaya 8,5 dakikada ulaşılmıştır. Tam soyulma koşullarında kimyasal ve buharla
kabuk soyma yöntemlerinin havuçların kalitesine olan etkileri araştırılmıştır. Daha
sonra, kimyasal soyulmadaki matematiksel optimum değer kalite parametreleri için
değerlendirilmiştir. Kimyasal soyulma optimum değeri sadece soyulma verimi-
pektin ilgisine denk düşmektedir. Buharla kabuk soymada soyulma verimi kimyasal
vi

yöntemle soymadakinden yüksektir. Geleneksel yöntemle soyulmayla kıyaslayınca
kimyasal yöntemdeki renk değeri tüketici beğenisine daha uygundur. Sonuç olarak,
gelecek prosesin ihtiyacına göre iki yöntem de uygundur.
Anahtar sözcükler: buharla soyma, havuç, kimyasal soyma,matematiksel
analiz, pektin
vii

To My Parents
viii

ACKNOWLEDGEMENTS
I wish to express my deepest gratitude to my supervisor Prof. Dr. Levent
BAYINDIRLI and co-supervisor Prof. Dr. Nevzat ARTIK for their guidance, advice,
criticism, encouragements and insight throughout the research.
I’m grateful to Assoc. Prof. Dr. Ender POYRAZOĞLU for his suggestions and
comments for using HPLC instrument.
I would like to thank to Ms Elif DOĞAN for her help and ideas on performing the
experiments.
My special thanks are due to my mother and my father, for their great help, patience
and encouragement in performing this research.
I would also like to thank to all my friends, especially Semin Özge KESKİN, Saner
DEDE, Mecit ÖZTOP, Neslihan AKDENİZ, Gökhan DURUKSU, Gülden
KOÇLAR and Burçak GENCER for their help and encouragement during this
research.
This study was supported by the BAP 2004 07 02 00 51 and BAP 2005 07 02 00 42.
ix

TABLE OF CONTENTS
ABSTRACT ........................................................................................................ ivÖZ ........................................................................................................................ viACKNOWLEDGMENTS..................................................................................... ixTABLE OF CONTENTS...................................................................................... x
LIST OF TABLES................................................................................................ xii
LIST OF FIGURES............................................................................................... xiii
NOMENCLATURE…………………………………………………………….. xix
CHAPTER
1. INTRODUCTION ............................................................................... 1
1.1 Carrot........................................................................................ 11.2 Peeling Fruits and Vegetables..................................................... 3
1.2.1 Chemical Peeling.......................................................... 41.2.2 Steam Peeling................................................................ 11
1.3 Objectives of the Study…………………………………………. 16
2. MATERIALS AND METHODS ......................................................... 172.1 Raw Material.............................................................................. 172.2 Experimental................................................................................. 17
2.2.1 Chemical Peeling of Carrots……….............................. 17
2.2.2 Steam Peeling of Carrots............................................... 18
2.2.3 Quality Evaluations After Chemical Peeling………… 18
2.2.3.1 Color…………………………………………. 182.2.3.2 Unpeeled Skin Surface Area…………………. 19
2.2.3.3 Peeling Yield………......................................... 19
2.2.3.4 Total Soluble Solids......................................... 192.2.3.5 Depth of NaOH Penetration………………….. 192.2.3.6 Pectin Analysis………………………………. 192.2.3.7 Beta-Carotene Analysis……………………… 20
2.2.4 Quality Evaluations After Steam Peeling…………….. 21
x

2.2.4.1 Color…………………………………………. 21
2.2.4.2 Unpeeled Skin Surface Area………………… 222.2.4.3 Peeling Yield………....................................... 222.2.4.4 Total Soluble Solids....................................... 222.2.3.5 Pectin Analysis………………………………. 222.2.3.6 Beta-Carotene Analysis……………………… 22
2.3 Data Analysis…………………………………………………… 24
3. RESULTS AND DISCUSSION............................................................ 25
3.1 Chemical Peeling of Carrots………………………………….. 25
3.2 Steam Peeling of Carrots…………………………………….. 31
3.3 Effect of Chemical Peeling on Quality of Carrots……………. 33
3.4 Effect of Steam Peeling on Quality of Carrots……………….. 51
4. CONCLUSION AND RECOMMENDATIONS.................................. 58
5 REFERENCES...................................................................................... 60
6 APPENDICES...…............................................................................. 65APPENDIX A………………………………………………………… 65
APPENDIX B….................................................................................... 70
APPENDIX C……............................................................................... 72APPENDIX D………………………………………………………… 80APPENDIX E………………………………………………………… 81
APPENDIX F………………………………………………………… 84
xi

LIST OF TABLES
Table 1.1. The main analysis of key ingredients for an average carrot…..…... 2
Table 2.1. Degree of Peeling – Score Relation for Carrots………………….... 18
Table A1. Time-Temperature-Concentration-Score Relation for Chemical Peeling of Carrots……………………………………………………………... 65
Table A2. Operational Parameters & Constants for Time – Concentration Relations……………………………………………………………………… 66
Table A3. Operational Parameters & Constants for Time – Temperature Relations………………………………………………………………………. 66
Table A4. Time-Score Relation for Steam Peeling of Carrots.………………. 67
Table A5. Operational Parameters & Constants for Time – Peeled Surface Area Relations………………………………………………………………… 67
Table A6. Total Soluble Solids for Carrots (°Brix)……...…………………… 68
Table A7. Peeling Yield-Weight Loss-Pectin Relations………...……………. 69
Table E1. Full Nutritional Analysis…………………………………………... 81
xii

LIST OF FIGURES
Figure 3.1. Time-concentration relations for chemical peeling of carrots….. 26
Figure 3.2. Time-concentration relations for chemical peeling of carrots …. 27
Figure 3.3. Time-temperature relations for chemical peeling of carrots……. 28
Figure 3.4. Time-temperature relations for chemical peeling of carrots……. 29
Figure 3.5. Temperature-concentration-peeling time relations for chemical peeling of carrots………………………………………………….................... 30
Figure 3.6. Peeled surface area-time relations for steam peeling of carrots... 31
Figure 3.7. Peeled surface area-time relations for steam peeling of carrots... 32
Figure 3.8. Pectin-concentration relations for chemically peeled carrots…... 33
Figure 3.9. Pectin-temperature relations for chemically peeled carrots……. 34
Figure 3.10. Pectin-peeling yield relation at constant temperature………….. 35
Figure 3. 11. Pectin-peeling yield relation at constant concentration………. 36
xiii

Figure 3.12. Pectin-weight loss relation at constant temperature…………...... 38
Figure 3.13. Pectin-weight loss relation at constant concentration…………... 39
Figure 3.14. Penetration depth measurement……………………..................... 41
Figure3.15. Carrots after peeling…………………………………………...… 42
Figure 3.16. Chromatogram of mathematical optimum value of chemical peeling of carrots (77°C; 0.75%; 10.5 min)…………………………………… 43
Figure 3.17. Variation of total color difference (ΔE) of carrots by peeling concentrations at different temperatures of caustic solutions………………… 44
Figure 3.18. Variation of total color difference (ΔE) of carrots by peeling concentrations at different temperatures of caustic solutions with raw carrot .. 45
Figure 3.19. Variation of total color difference (ΔE) of carrots by peeling concentrations at different temperatures of caustic solutions with mechanically peeled carrot…………………………………………………… 45
Figure 3.20. Variation of lightness L* of carrots by peeling concentrations at different temperatures of caustic solutions……………………………………. 46
Figure 3.21. Variation of lightness L* of carrots by peeling temperatures at different concentrations of caustic solutions………………………………….. 47
xiv

Figure 3.22. Variation of lightness value L* comparison with C1 and C2 ….. 47
Figure 3.23. Variation of a* values of carrots by peeling concentrations at different temperatures of caustic solutions……………………………………. 48
Figure 3. 24. Variation of a* values of carrots by peeling temperatures at different concentrations of caustic solutions………………………………….. 49
Figure 3.25. Variation of b* values of carrots by peeling concentrations at different temperatures of caustic solutions……………………………………. 50
Figure 3.26. Peeling yield (%)-weight loss (%)-pectin(mg/g) relations of chemical, steam and mechanical peeling methods……………………………. 51
Figure 3.27. The comparison of the amount of pectin of raw carrot with steam, mechanical and chemical (77°C; 0.75%;10.5min.-optimum conditions) peeling methods…………………………………………………... 52
Figure 3.28. Variation of total color difference (ΔE) of carrots by peeling concentrations at different temperatures of caustic solutions with steam peeled carrot…………………………………………………………………… 54
Figure 3.29. Comparison of total color difference (ΔE) of peeling treatments with raw carrot………………………………………………………………… 54
Figure 3.30. Variation of lightness (L) of carrots by peeling concentrations at different temperatures of caustic solutions with steam peeled carrot…………. 55
xv

Figure 3.31. Comparison of lightness L* of peeling treatments with raw carrot………………………………………………………………………….. 55
Figure 3.32. Comparison of a* value of peeling treatments with raw carrot .. 56
Figure 3.33. Comparison of b* value of peeling treatments with raw carrot… 57
Figure B1. Chemically peeled carrot -Mathematical optimum value (77°C; 0.75%; 10.5min)………………………………………………………………. 70
Figure B2. Steam peeled carrot-107°C; 130.7kPa; 8.5 min………………….. 70
Figure B3. Carrots before and after peeling………………………………….. 71
Figure C1. Mechanically peeled carrot (control)…………………………….. 72
Figure C2. Beta-Carotene Standard Chromatogram (200 ppm)……………… 72
Figure C3. 57°C; 0.50%; 24min……………………………………………… 73
Figure C4. 57°C; 0.75%; 18.5min……………………………………………. 73
Figure C5. 57°C; 1.00%; 14.5min……………………………………………. 73
xvi

Figure C6. 67°C; 0.25%; 22min……………………………………………… 74
Figure C7. 67°C; 0.50%; 17.5 min…………………………………………… 74
Figure C8. 67°C; 0.75%; 15 min……………………………………………... 74
Figure C9. 67°C; 1.00%; 11.5 min………………………………………….... 75
Figure C10. 77°C; 0.25%; 18 min……………………………………………. 75
Figure C11.: 77°C; 0.50%; 14 min…………………………………………... 75
Figure C12. 77°C; 1.00%; 9 min……………………………………………... 76
Figure C13. 87°C; 0.25%; 17 min……………………………………………. 76
Figure C14. 87°C; 0.50%; 12 min……………………………………………. 76
Figure C15. 87°C; 0.75%; 10 min……………………………………………. 77
Figure C16. 87°C; 1.00%; 5 min……………………………………………... 77
Figure C17. 107°C; 130.7kPa; 8.5 min………………………………………. 78
xvii

Figure C18. β-Carotene Standard Chromatogram (1000 ppm)………………. 79
Figure C19. Absorption spectrum of β-Carotene…………………………….. 79
Figure D1. Variation of a* value comparison with chemical peeling,C1 ,C2 and steam peeling……………………………………………………………... 80
Figure D2. Variation of b* value comparison with chemical peeling,C1 ,C2 and steam peeling……………………………………………………………... 80
Figure E1. β-Carotene……………………………………………………….... 83
Figure E2. Vitamin A………………………………………………………… 83
Figure F1. Temperature-concentration-peeling time (fitted time for regression equation) relations for chemical peeling of carrots………………... 92
xviii

NOMENCLATURE
a* : Hunter a* value
b* : Hunter b* value
L* : Hunter L* value (Lightness)
C : Concentration of caustic solution (%, w/v))
T : Temperature of caustic solution (°C)
t : Peeling time (min)
ΔE : Color
P : Peeled surface area
PE : Pectin
PY : Peeling yield
TSS : Total soluble solids
γ : Constant
σ : Constant
λ : Constant
β : Constant
a : Constant
b : Constant
r2 :Correlation coefficient
C1 : Control carrot 1(raw)
C2 : Control carrot 2(mechanically peeled)
xix


CHAPTER 1
INTRODUCTION
1.1. Carrot (Daucus carota)
Health professionals have consistently advocated the daily consumption of
five portions of fruit and vegetables as a means of protecting against the pathogenesis
of degenerative diseases including coronary heart disease, cancers and other free
radical-mediated conditions. Fruit and vegetables contain a wide range of compounds
including antioxidant vitamins C and E, minerals, phenolics and carotenoids.
Carotenoids possess a range of important and well-documented biological
activities. They are potent antioxidants and free radical scavengers and can modulate
the pathogenesis of cancers and coronary heart disease. A number of carotenoids
including β-carotene and α-carotene have pro-vitamin A activity, since they are
converted to retinol by mammals. Dietary deficiency of vitamin A can lead to
blindness and premature childhood mortality (Surles et al., 2004; Burns et al., 2003).
There is no officially recommended dietary intake for carotenoids. The
recommended dietary intake for vitamin A is about 1mg/d retinol equivalent for the
German speaking countries (Anonymous, 2000) and the dietary reference intake for
vitamin A in North America is up to 3mg/d (Food and Nutrition Board, 2001). It is
generally considered that processing of vegetables improves the bioavailability of
carotenoids because it breaks down the cellulose structure of the plant cell (Murkovic
et al., 2002). Analysis of cooked vegetables has problems somewhat different from
those of raw samples. Cooking softens the cell walls and makes the extraction of
carotenoids easier (C.deSá and Rodriguez-Amaya, 2004). Cooked vegetables would
have variations in their carotenoid composition brought about by varying cooking
conditions (e.g. time and temperature), but also by compositional differences of the
raw material, due to such factors as stage of maturity, cultivar, part of the plant
utilized, climatic or seasonal effects, agricultural and post-harvest handling (C.deSá
and Rodriguez-Amaya, 2003).
1

The carrot belongs to the family Apiaceae (Umbelliferae) which is a
member of the parsley family. It includes about 2,500 species such as dill, caraway,
cumin, chervil, coriander, fennel, anise, parsley, parsnip, and celery. It also includes
poisonous species such a poison hemlock, water hemlock and fools parsley. The
cultivated carrot belongs to the genus Daucus L. which contains many wild forms.
The cultivated carrot hybridized from the wild carrot can be either an annual (mainly
in tropical areas) or a biennial (mainly in temperate areas). There are two main types
of cultivated carrots: 1. Eastern/Asiatic carrots - These are often called anthocyanin
carrots because of their purple roots, although some have yellow roots. 2. Western or
Carotene Carrots - These have orange, red or white roots. These carrots may have
originated in Turkey. In Turkey, Beypazarı variety is the most popular. Beypazarı
provides 60 % of carrot production of Turkey (www.carrotmuseum.com).
Table 1.1.The main analysis of key ingredients for an average carrot. For the full USDA nutritional analysis see Appendix A1.
Edible part 95%
Water 91.6g
Proteins 1.1g
Lipids 0g
Glucides 7.6g
Carbohydrates 10
Fibre 3.1g
Energy 33kcal
Vitamin A (mcg) 2813
Sodium 95mg
Potassium 220mg
Iron 0.7mg
Calcium 44mg
Phosphorus 37mg
Niacin 0.7mg
Vitamin C 4mg
Vitamin E (mg) 0.5
Zinc (mg) 0.2
Carrots are popular in variety of foods because of their pleasant flavor. The
increase in carrot consumption rates may be due to the introduction of prepackaged
and precut carrots, as well as the nutritional benefits that carrots provide. Recently
2

consumers have become interested in purchasing fruits and vegetables in edible
form. For carrots there is a minimum processing procedure which are peeling, rinsing
and sometimes cutting into sticks. The mature storage organ of carrot consists mainly
of vascular tissue with an outer epidermal skin for protection. Peeling is the most
important step in processing of carrots. Removing this skin increases respiration and
initiates production of a new protective layer. This is especially seen in abrasion
(mechanical) peeled carrots. These carrots quickly lose their bright orange color from
development of a white material on the surface. That limits consumer acceptability of
the product (Bolin and Huxsoll, 1991).
1.2.Peeling of Fruits and Vegetables
Peeling is one of the major operations in the processing of most fruits and
vegetables, meant for canning, freezing and dehydration. It is also a high-cost
operation in terms of labor, and when coupled with coring, it accounts for
approximately 60% of the total labor in processing (Gould, 1983). The selection of
the proper peeling method is of importance, as the quality of the finished product
depends, to a large extent, upon the method used. The amount of peel removed is
important to the processor not only because it is a total loss and reduces product
quantity, but also for the cost-intensive nature of peel disposal which, otherwise,
causes environmental pollution. Reduction in peel weight also leads to increased
product recovery and higher profits. The fruit and vegetable processing up to peeling
stage also involves considerable operating cost as the raw material along with the
peel gets cleaned, washed and processed for peeling. Hence a need exists for
judicious selection of the peeling method (Setty et. al., 1993).
In the beginning of the fruit processing industry, only hand peeling was
practised. Several methods, machinery and equipments have been developed, since
then. Effects of these methods on the raw material, in addition to peel removal, have
also been studied to some extent. It is worth mentioning that the peeling
requirements for different products vary. Hence, goals of good peeling operation are;
minimizing product losses, peeling to the extent dictated by the products (e.g. potato
products), minimizing heat ring formation (e.g. apple, potato), minimizing energy
and chemical usage and minimizing the pollution load (Setty et. al., 1993).
3

In food processing, there are several peeling methods used for different fruits
and vegetables. These methods are: 1. Chemical peeling (mostly lye peeling)
2. Steam peeling
3. Mechanical peeling(mainly abrasion peeling)
4. Freeze peeling(cryogenic peeling)
5. Enzymatic peeling
6. Other peeling methods(flame, vacuum, acid peeling, etc.)
Chemical peeling and steam peeling are more widespread methods than
others.
1.2.1. Chemical Peeling
It is, by far, the method of choice for removing peel of many fruits and
vegetables because of the ease of mechanization; continuous operation; and
uniformity, quality as well as high yield of the product. Among the different methods
applied by the processing industry, chemical peeling using NaOH (widely known as
lye peeling) is one of the most common and the oldest methods. The first commercial
use of lye for peeling was in the production of hominy, followed by that of peaches
(Cruess, 1958). The rubber disc peeler was used successfully to peel tomatoes in
1973 (Hart et al., 1974), producing peelings with a solids content similar to that of
the original tomato. Tomato pulp with acceptable flavor, color, and minimal defects
was recovered from caustic peelings of a commercial operation in 1974. Powers et al
(1977) reported that hand labor and peeling losses could be reduced by use of warm
caustic followed by steaming and washing. Today the use of lye for peeling fruits
and vegetables is widespread due to its economy, simplicity and labor-saving
advantages, but it continues to face many problems due to processing loss of edible
part.
In practice, chemical peeling of fruits and vegetables is a simple process. A
simple method of lye peeling is to dip the fruits into heated lye for a definite period
4

followed by through water washing of peeled fruit. Lye (sodium hydroxide solution)
dissolves the fruit and vegetable peels and the rate of dissolution depends on lye
concentration, temperature and period of immersion. The surface tissues of most
fruits consist of three layers, namely, epidermis, middle lamella and parenchyma.
The middle lamella is composed of pectinous substances that are highly soluble in
the lye. The parenchyma cells are large and more resistant to the lye. Hence,
epidermis layer is removed along with the middle lamella without affecting the
parenchyma cells in the normal lye peeling process (Setty et al., 1993).
Theoretically, however, it is a complex process involving diffusion and
chemical reactions. Once the caustic solution of NaOH comes in contact with the
surface of the fruit, it dissolves the epicuticular waxes, penetrates the epidermis, and
diffuses through the skin into the fruit (Floros et al., 1987). Inside the fruit, the
NaOH reacts with macromolecules and organic acids in the cytoplasm, middle
lamella and cell wall, and as a result, separation of skin takes place.
In chemical peeling, inside the tomato skin, as mentioned before, the NaOH
reacts with a variety of substances and macromolecules (polygalacturonic acid, other
organic acids, hemicellulosic polysaccharides, proteins, etc.). These reactions slowed
down the inward diffusion of NaOH and therefore at low NaOH concentration (1 M
NaOH), lower diffusivity values were observed. When the NaOH concentration was
sufficiently higher than a baseline needed for chemical reactions, however (2, 3 and
5M NaOH), a fast reaction rate was achieved. This is an instantaneous reaction and
the diffusivity is independent of concentration. For temperature dependence studies
of diffusivity (2M NaOH was used), diffusion of NaOH didn’t occur at 30°C. This
can be explained by the presence of epicuticular waxes on the surface of fruits and
vegetables, which have a phase transition temperature higher than 45°C. As long as
the waxes are in the solid state, they do not allow NaOH enter the fruit. At higher
temperatures (>50°C), the wax liquefies and NaOH readily diffuses inside the tissue
(Floros et al, 1987 and Floros and Chinnan, 1990).
The cell wall is primarily responsible for the structure, rigidity and the texture
of the plant tissue. Cell walls are composed of polysaccharides (primarily cellulose
and hemicelluloses) and glycoproteins. The substance which functions as a glue to
hold the cells together, the middle lamella, is located between cell walls and it
consists of pectic substances mainly polygalacturonic acid. A correlation between
5

pectic composition in cell walls and softening of cooked vegetables has been
reported. Vegetables easily softened by thermal maceration contained high methoxyl
pectin than low methoxyl pectin (Fuchigami et al., 1995 (a), (b)). Another structural
component of plants, the ‘cuticle’, which exists as a thin continuous extracellular
membrane, has a fundamental protective role as a barrier between the plant and its
environment. To simplify, epicuticular wax makes up the exterior part of the cuticle
and is composed of soluble waxes deposited on the surface. The cuticle proper lies
beneath the epicuticular wax, and is a region formed of cutin and cuticular waxes.
Below, the cuticle proper is the cuticular layer(s) which is(are) composed of cutins,
cuticular wax and incrustations of cellulosic wall material (Floros et al., 1987).
During processing, the action of lye probably involves dissolution of the
epicuticular and cuticular waxes leaving most of the cutin matrix and the cellulose
network unaltered. Cutins, which form the main structural component of plant
cuticles, are high molecular weight polyesters readily depolimerized by common
reagents used to cleave ester bonds. Epicuticular waxes and portions of the cuticle
proper (composed of cutin and waxes) may likely have been dissolved by the alkali
treatment (Floros et al., 1987)
As the lye penetrated the cuticle and moved further into the interior of the
fruit, disruption of epidermal and hypodermal cells took place. The penetration effect
of lye was uniform and a distinct boundary of disrupted cells was observed. The
boundary of disrupted cells moved deeper as the severity of lye treatment increased.
Movement of lye was due to diffusion. Other chemicals and ions have also
transferred from surface to the interior of the fruit via diffusion (Floros et al., 1987).
The degree of degradation and the loss of integrity of cell walls are
proportional to the severity of the applied lye treatment. Floros et al (1987) studied
that when fruits were treated with 1% lye for 1 min, the cell walls of the epidermal
and hypodermal cells of the exocarp were partly disrupted but their structure, shape
and overall appearance weren’t greatly affected. If time was 2 min, a total disruption
of cell walls observed. Application of higher concentrations of lye resulted in loss of
integrity of cell walls. The basic lye solution solubilizes the pectic and hemicellulosic
polysaccharides leaving the cellulose microfibrils with weak structure which in turn
results in cell collapsing. Finally, the weakening and dissolution of cell wall
6

constituents, as well as the solubilization of the middle lamella, eventually caused the
separation of the exocarp (skin) from the mesocarp (Floros et al., 1987)
Floros et al (1987) first suggested that NaOH penetrated the skin and moved
further into the fruit via diffusion. Based on this assumption, a double-stage peeling
process which reduced peeling losses and improved the overall efficiency of the
peeling operation was developed and optimized for pimiento peppers. Floros et al
(1988 (a)) were indicated that for pimiento peppers high processing temperature of
100°C caused pigment extraction during the peeling operation and resulted in color
loss and lower quality final product. It was possible to use low temperatures of about
80°C during processing. Such an application would probably improve the quality of
the final product in terms of color. The most widely used method of peeling
pimientos involves dipping the peppers into near boiling aqueous solution of NaOH
(lye) for a certain period of time and then washing away the loosened skin by
pressurized spray water. This ‘single-stage’ lye-peeling process was studied by
Floros and Chinnan (1987), who suggested that three factors (processing time, lye
concentration, and temperature) mainly affect the process. Time was found to be by
far the most important factor followed by lye concentration.
Application of severe treatments or processing of damaged peppers results in
major loss of edible tissue due to action of lye deep inside the flesh and dissolution
of several mesocarp cell layers. For an effective peeling, therefore, diffusion and
action of lye should be controlled and restricted to epidermal and hypodermal
regions of the skin. As a result, a ‘double-stage’ lye peeling process was
conceptualized, in an effort to minimize the effect of lye on the mesocarp cells by
employing milder treatments (Floros and Chinnan, 1988(a)).
Reeve (1976) discussed some changes in the structure of fruits and vegetables
as affected by lye peeling, Walter and Schadel (1982) considered changes caused in
sweet potato tissue due to heat mediation during lye peeling. Lye peeling at elevated
temperatures is widely used as a means of skin removal prior to canning of sweet
potatoes. This pre-canning treatment can cause discoloration. This discoloration
occurs when heat penetrates into the tissue causing a temperature increase sufficient
to inactivate the respiratory system but insufficient for the inactivation of
polyphenoloxidase (PPO). The PPO then reacts with o-dihydroxyphenols (DP) to
cause the discoloration. Discoloration can be prevented by presoaking the roots in a
7

75-80°C water bath immediately prior to lye peeling. This procedure raised the
internal temperature sufficiently high to inactivate the PPO, thus preventing the PPO-
DP reaction (Walter and Giesbrecht, 1982).
Major advantages of lye peeling include lower cost, rapid handling, reduced
loss of fruit as compared to hand peeling, amenability to large scale operation, and
suitability to all shapes, sizes and varieties (Cruess, 1958). Consequently, guava,
peaches, pears, apricot, orange segment, nuts, potatoes, sweet potatoes, apples, bets,
mandarins, tomatoes, papayas, yams, pimiento peppers, citrons are generally lye
peeled. After the lye treatment, the material requires thorough water wash to remove
not only the lye disintegrated peel, but also the residual lye on the surface of the
peeled material. This step forms a critical part of the lye peeling process. In some
cases, peeled and washed material is dipped in or sprayed with dilute citric acid
solution to ensure the neutralization of residual alkali.
Main advantage is the requirement of smaller floor space. On the contrary,
the main disadvantage is the pollution of large volumes of water (2600 gal/ton fruit
peeled). The other disadvantages are high peeling losses and loss of damaged fruits
(Woodroof and Luh, 1975).
Peeling is an important operation in the freezing or canning of white
asparagus. Garrote et al (1994) determined the process conditions for chemical
peeling of asparagus using Response Surface Methodology. The predicted models
developed for product yield and peeling quality were used for examination of the
system behavior and localization of the optimum conditions.
Economic and efficient peeling is very important in commercial processing of
fruit and vegetable products (Reeve, 1976). The selected method depends upon the
type and variety of products to be processed and the capacity of the industrial plant.
Potatoes are commercially peeled by abrasion, high pressure steam, conventional
caustic and dry caustic (Huxsoll et al., 1981). In food processing, potatoes are not
well adapted to mechanical peeling because of their irregular shapes and cavities. In
lye peeling, the peel is loosened because of starch gelatinization with the depth of the
loosened peel found out by the residence time of the potatoes within the NaOH
solution. The main problem of lye peeling potatoes is darkening after processing.
When lye peeling conditions were selected to maximize heat penetration in the
cambial area, no darkening was observed (Bayındırlı et al., 1997). The chemical
8

peeling of potatoes is a compromise between yield, peeling quality, NaOH
consumption and the ‘heat ring’ formed, with processing conditions empirically
adjusted according to specific requirements (Garrote et al., 1993). Processors
generally maintain the lye bath temperature as high as practicable while varying the
immersion time and lye concentration to obtain desired peeling effects. While large
processors use a high temperature lye process, the low temperature process has been
used to some extent in the pre-peeled potato industry where the presence of a ‘heat-
ring’ may be particularly objectionable (Huxsoll and Smith, 1975).
In apple processing, peeling is an essential step. Various techniques are used
for this purpose, such as mechanical, lye, high pressure steam and dry peeling (Setty
et al., 1993). Apples are not well adapted to mechanical peeling, due to their irregular
shape and cavities. Therefore, either lye peeling or steam peeling procedures is
applied. Success of peeling depends on the rapid transfer of heat to the tissues to be
peeled for a minimum duration, followed by cessation of heating and rapid cooling
(Bayındırlı et al., 1996(a)). A major problem in the peeling of apples by chemical
methods is the penetration of cutins (natural waxes) and the waxes which are
commonly added post-harvest to increase in gloss and improve appearance. These
waxes have an adverse effect on lye peeling. Surface active agents such as ethyl and
isopropyl alcohol and sodium alkyl sulfanate were used to remove the waxes and
enable faster penetration of lye. Bayındırlı et al. (1996(b)) conducted to determine a
relation between isopropyl alcohol temperature and peeling time. The effects of
alcohol dipping time on peeling time were determined. Moreover, the requirement
for dewaxing operation was investigated. Apples were pretreated with isopropyl
alcohol at different temperatures and dipping times before they were dipped in lye
solutions. As the time of dipping apples in isopropyl alcohol increased, peeling time
decreased. Also, Bayındırlı (1994) reported the time-temperature-concentration
relations and the effect of pretreatment with 1% (w/w) sorbic acid for lye peeling of
tomatoes.
Like fruits and vegetables, chemical peeling was tested at peanuts, walnuts
and hazelnuts. Peanuts are probably the most important oil bearing seed in the world
and are rapidly becoming a valuable source of plant protein (Cruess, 1958). Peanut of
Antep variety were peeled at four different temperatures and for each temperature
four different NaOH concentrations were selected and then minimum required times
9

for complete peeling was obtained. However, the physical properties were important
for the result. Color is the most significant physical property as the temperature of
the lye solution increases. The color darkens as the temperature increases and even it
gets a brownish color as the temperature reaches to 80-90°C. Also penetration depth
is important. As the concentration of the solution gets higher, there occurs more and
more small cavities on the peanuts and the surface of the peanut gets rougher.This
method results in decrease of some quality parameters color, odor and appearance of
the products that will be consumed as a whole (Bayındırlı et al, 2001). The kernels of
walnuts (belonging to Juglans regia Linn.) were peeled by using NaOH solutions.
The walnut includes 65-70% oil and 15-18% nitrogenous substances which makes it
quite important also from the nutritive standpoint. According to the observations on
the application of the walnuts during the experiment and after the peeling,
discoloration on the surface was seen. The color of walnut turned to be brown. The
odor was also subject to change, since the concentrations for complete peeling was
too high. Consequently, although the estimated mathematical model represented the
case well, it is not applicable in the present form due to discolorization and
disodorization of the walnuts at serious levels (Bayındırlı et al, 2002). Hazelnuts are
used as an ingredient in the production of snacks, chocolate, ice cream,
confectionery, cakes and biscuits. More than 50% of total production in Turkey is of
the ‘Tombul’ cultivar. Kaleoğlu et al (2004) peeled the ‘Tombul’ hazelnuts and
investigated the effects of NaOH solution, temperature and time on peeling and
quality. The quality parameters of peeled hazelnuts such as protein, oil, free fatty
acid, ash, peroxide number and L values showed no significant change if compared
with untreated control samples. However, moisture content of the lye peeled hazelnut
samples were altered significantly after the peeling process due to the absorption of
water. Exposure time of the samples played an important role in the quality change
of hazelnuts due to lye penetration. Beta-carotene and other carotenoid pigments are
present in high concentrations just beneath the skin and it is likely some were easily
removed during the peeling process. Thus loss of mesocarp and exposure of vascular
tissue might have resulted in a difference between redness of untreated hazelnuts and
peeled hazelnuts. When the samples were dipped in a 3% citric acid solution for 1
min after peeling the residual lye was completely neutralized and the neutralization
resulted in a desired color recovery. Although lye peeling of walnuts and peanuts
10

weren’t suitable, lye peeling can be an alternative for pellicle removal of hazelnuts.
1.2.2. Steam Peeling
Among the modern methods of peeling, the most popular is probably that of
steam peeling. Steam peeling has been used in Europe to peel tomatoes for several
years. Also in the United States various pressurized steam peeling machines are
available for peeling fruits and vegetables (Schlimme et al., 1984). Steam peeling is
widespread due to its high automation, precise control of temperature, pressure and
time by electronically to decrease peeling loss and environmental pollution as
compared to chemical peeling (Floros et al., 1988(b)). In a steam peeler, the fruits are
placed on a moving belt, one layer deep, and passed through a steam box equipped
with a series of spray heads, from which the steam is sprayed directly on the
material. Treatment period depends on the nature of the material. Loosened peel is
removed by soft brushes after cooling in cold water (Setty et al., 1993). Steam
peeling involves exposure of the fruit to high temperature-high pressure steam for a
certain period of time and then washing away the loosened skin by pressurized spray
water (Floros et al., 1988(b)).
Steam peeling may be explained by two phenomena. First, the building up of
internal pressure because of high temperature which causes mechanical failure of the
cell. Second, the effect of heat on the tissue which results in loss of rigidity and
reduces turgor pressure due to biochemical changes, melting and breakdown of
substances and general disturbance and disorganization of the structure of the cell.
As a result, several cell layers between exocarp and mesocarp will collapse, the skin
will become loosened, and it will be removed by the pressurized spray water action
which follows the steam process (Floros et al., 1988(b); Kertesz, 1951).
In high pressure steam peelers, the liquid beneath the skin gets vaporized,
when a vegetable is exposed to high pressure steam. No reaction takes place as long
as the surrounding pressure is same as the internal pressure. As soon as the chamber
pressure is released, the surrounding pressure becomes lower than the internal
pressure. The pressure differential causes forcing away the skin from the flesh (Setty
et al., 1993).
11

Depending upon the peeling method used and the nature of the fruit or
vegetable peeled, the material may undergo some changes in their color, appearance
and constituents. Major problem in steam peeling is the formation of brown ring
(heat ring) below the surface of the fruit due to the tissue damage and polyphenol
enzyme activity like hot lye-peeling (Setty et al., 1993). Smith et al (1981) found that
the width of heat ring was min (0.1 mm or less) in steam peeled apples as compared
to 1.4 and 2.3 mm for lye peeled and abrasive pre-wash peeled apples, respectively,
thereby indicating minimum damage to the tissues in steam peeled apples.
Color and appearance of steam peeled apples were rated excellent, as against
less brilliant, but still highly acceptable lye peeled products. Water uptake, which
resulted in lowering the total solids, was more in lye peeled apples than that in steam
peeled product (Setty et al., 1993).
During steam peeling of potatoes, the tissue layers proximate to the surface
are subjected to high temperatures for short times; as a consequence a more or less
intense cooking of the tissue results accordingly to the thermal heating front advance.
Breakdown during heating is usually due to cell separation and not to cell rupture.
The cell wall and the middle lamella constituents are important for both cell
separation and cell wall rupture. When potato tissue is heated in water, the pectin in
the middle lamella is altered at 60±10°C; pectin in the primary and secondary walls
change, causing the separation of the compact lamella into microfibrils. Also the
amount of pectin has a local decrease. Finally, cell walls become easily fractured.
Precooking of potato tissue at 65-80°C for 10-20 min causes partial cell separation
due to the partial hydrolysis of the constituents of the middle lamella. However, cell
rupture doesn’t take place (Garrote et al., 2000).
For several potato sizes, and different peeling times, experimental
penetrations of peeling front and the final potato radial coordinate after steam
peeling, as well as the theoretical temperature predicted and cooking value estimated
for that position. When peeling time increases, penetration of peeling front also
increases. If the peeling time is short, then minimum temperature for peeling to take
place is higher. During steam peeling due to the thermal treatment and pressure
effect in decompression, integrity of the potato tissue structure is sufficiently weaken
and peeling takes place (Garrote et al., 2000).
12

The cooking value which will thermally weaken the cellular structure and the
temperature which will let that the internal vapor pressure developed during the
peeling process be sufficient in the decompression stage to produce the mechanical
failure of the thermally weaken cells, then the skin and part of the potato pulp up to
where the peeling front advanced will be easily pulled off by the pressurized water
applied after peeling (Garrote et al., 2000).
Garrote et al (1997) suggested that multi-stage steam peeling may improve
efficiency and reduce peeling loss. During a multistage process, short consecutive
heat treatments will provide the amount of heat needed to breakdown the first one or
two layers of cells with minimum effect on the layers. They also studied the effect of
time and number of cycles used on yield and quality of steam peeled potatoes and
asparagus at 158°C. They assessed heat penetration of potatoes and peroxidase
activity retention in asparagus, in order to explore the feasibily, in the last case, of
combining the steam peeling process with the blanching operation necessary before
asparagus is frozen. Best peeling quality, acceptable heat penetration and a yield of
90% were achieved for potatoes with a peeling time of 36s and three cycles. For
asparagus, best peeling quality and an acceptable yield and peroxidase residual
activity were obtained with a peeling time of 20s and one cycle. Steam peeling of
asparagus followed by an adiabatic holding time after steam exhausting and before
water cooling might inactivate peroxidase sufficiently so that blanching prior to
freezing of asparagus won’t be necessary.
Reeve (1976) reported that the skin of the tomato is composed of a cutinized
epidermal layer and most of the cuticular wax is found in the cellulosic matrices of
the outer and radial cell walls. It was indicated that scalding or steaming increased
the ease of cell separation in the subepidermal tissue. Results of a study indicate that
recovery of high (7 atm) pressure, short exposure time, steam peeled tomatoes is
greater than for lye peeled tomatoes. However, the efficacy of peel and defect
removal by steam peeling was inferior to that attained with lye peeling for the
peeling variables employed. This is of major practical importance with regard to
industry objectives although recovery was greater for steam peeled than for lye
peeled fruit (Schlimme et al., 1984).
The high temperature of the steam resulted in melting and reorganization
(phase transition) of the cuticular waxes on the surface of the fruit. Heat transfer
13

increased the temperature inside the fruit, which in turn caused vaporization of the
cell fluids, increased internal pressure, occurrence of various biochemical reactions
(hydrolysis of carbohydrates, breakdown of pectin) and finally rupture of cell walls
and separation of the skin (Floros et al., 1988(b)).
Before the steam treatment, it isn’t possible to distinguish between cytoplasm,
cell wall and middle lamella as all three components, being close together, are
structurally unified. As the fruits are treated with steam, the initial changes observed
are in the cytoplasm. The high temperature probably causes denaturation of enzymes
and other proteins, hydrolysis of carbohydrates and changes in the configuration of
other macromolecules present in the cytoplasm. In severe treatments, the separation
is total, and the cytoplasm is eventually washed away. The next component to be
affected is the cell wall which is normally responsible for the structural rigidity of the
plant tissue. The extensive application of high temperature results in degradation of
the hemicellulosic polysaccharides present in the cell wall and breakdown of pectin
(polygalacturonic acid) in the middle lamella. This is evident by the separation of the
cell wall from the middle lamella. In more severe treatments, the rupture of cell walls
and the breakdown or ‘melting’ of the middle lamella are extensive, resulting in
mechanical failure and collapsing of cells. This total disorganization of the tissue is
responsible for the final separation and removal of the skin (Floros et al., 1988(b);
McNeil, 1984).
The mode of action associated with the effect of high temperature steam on
the fruit (during a steam peeling process) is a complex phenomenon and probably a
combination of physical as well as biochemical changes. The sudden increase in
temperature around the fruit causes a phase transition, melting and reorganization of
the waxy cuticle on the surface. Moreover, when the temperature rises inside the
fruit, hydrolysis and degradation of polysaccharides, enzyme and other protein
denaturation, as well as breakdown of pectic substances are likely to occur. When the
temperature exceeds the boiling point of the liquids inside the cell, an internal
pressure due to vaporization is created. If the external pressure (chamber pressure) is
high, equilibration of the two opposite forces doesn’t permit noticeable mechanical
damage. When the external pressure is reduced to atmospheric, a pressure differential
is created, and an enormous internal force acts on the cell walls resulting in physical
damage such as cracks, rupture, breakdown (Floros et al., 1988(b)).
14

Present commercial peeling of sweet potatoes is generally accomplished with
lye immersion followed by spray washing although some processors are using steam
peeling. Either method produces a satisfactory processing product; however peeling
depths are much greater than the optimum levels, and peeling and trimming losses
are correspondingly high. These losses vary with the duration the peeling treatment
and in the case of lye peeling with the concentration of the lye used. Prolonged
peeling treatments increase peeling losses but reduce trimming and result in a more
attractive product by decreasing oxidation darkening (Smith et al., 1980).
Steam peeling processes have been described in the literature for peeling
produce by Eidt and McArthur (1944) and by Huxsol and Smith (1975). Harris and
Barber (1957) showed that the depth and uniformity of the peel depends upon the
steam pressure used and the rapidity of diffusion of steam among the produce being
peeled (Smith et al., 1981). Smith et al (1980) also reported that rapid heating to
peeling temperature and flash cooling by injection of cold water into the peeling
chamber resulted in improved yields and quality of peeled sweet potatoes.
Commercial methodology for removal of peel from processing tomatoes
destined for production of whole pack has undergone considerable change in the last
few decades. Tomatoes are blanched in ambient pressure steam or in boiling water
for 30 to 60 seconds. Peel loosening is achieved by cold water immersion or spray to
crack the skin and thereby facilitate hand removal of peel. Light scalding treatments
are often used to avoid excessive softening of pulp and flesh. However such
treatments often necessitated the use of peeling knives for peel removal and therefore
resulted in high labor cost and low throughput. More efficient peel removal is later
achieved by immersion for different time intervals at high temperature solutions of
NaOH containing various peeling aids. Currently, there is a trend back to the use of
steam for peel removal from tomatoes for whole pack production as well as for other
fruits and vegetables. In contrast to earlier methods involving ambient pressure
steam, high pressure and short application times have been designed to achieve
maximum yield (Corey et al., 1986).
15

1.3. Objectives of the Study
The objectives of this study are to optimize chemical peeling of carrots and to
determine the effect of chemical peeling on quality of carrots. For this purpose,
carrots were chemically peeled, time-temperature, time-concentration relations were
estimated and a suitable combination of time-temperature-concentration was
selected. The optimum time-temperature-concentration relations were analyzed
mathematically. Optimum peeling time for steam peeling of carrots was determined.
The finished product quality of carrots peeled by both caustic and high pressure
steam methods under commercial conditions was evaluated and the percent recovery
of the whole carrot was evaluated.
16

CHAPTER 2
MATERIALS AND METHODS
2.1 Raw Material
Carrots of ‘Beypazarı’ variety, cultivated during 2004 season, were purchased
from local market. The carrots were of medium size and the average weights were in
the range of 75-110 grams.
Caustic solutions of 0.25, 0.50, 0.75 and 1.00 %(w/v) of NaOH (Merck
NaOH pellets pure) were used at temperatures 57, 67, 77 and 87°C for varying time
intervals for peeling of carrots.
Steam peeling treatments were conducted with a Pressure Cooker (Solingen
Germania 18/10 Cr/Ni Aluminium 18/10 Cr/Ni); a 7 liter capacity vessel at an inlet
steam pressure of 130.70kPa and a constant temperature of 107°C was used. The
time of exposure to steam was equal to the total time of processing. For peeling,
different time intervals were used to find out the appropriate peeling conditions.
2.2. Experimental
2.2.1. Chemical Peeling of Carrots
Temperature controlled water bath (Nüve Scientific Shaker Water Bath, ST
402, Turkey) were used to hold the solutions at constant temperature. Only one carrot
was used in each treatment. Treatments were repeated three times and averaged. The
carrots were immersed in the solution for a predetermined time and cooled in tap
water 15°C for 1min at a flow rate of 100ml/s. They were then evaluated according
to degree of peeling. Unpeeled surface of the carrots were calculated by using
transparent papers and samples were scored according to degree of peel removal
from Table 2.1 (Bayındırlı, 1994).
17

Table 2.1. Degree of Peeling – Score Relation for Carrots
Very good peeling Peeling higher than 98% * * * *
Good peeling Peeling higher than 75% * * *
Slight peeling Peeling higher than 50% * *
No peeling Peeling higher than 0% *
2.2.2. Steam Peeling of Carrots
Only one carrot was put into the pressure cooker in each treatment.
Treatments were repeated three times and averaged. The carrots were waited in the
pressure cooker for a predetermined time and cooled in a tap water 15°C for 1min at
a flow rate of 100ml/s. They were then evaluated according to degree of peeling.
Unpeeled surface of the carrots were calculated by using transparent papers and
samples were scored according to degree of peel removal (Table2.1)
2.2.3. Quality Evaluations After Chemical Peeling
All analyses were carried at all temperatures and all lye concentrations for
very good peeling (>98%) of carrots. Samples were milled by a grater before
analysis. Treatments were repeated three times and averaged.
2.2.3.1.Color
Color was measured by Minolta color reader (CR-10, Japan) and expressed
by CIE coordinates (L*a*b*) system. L*, a* and b* indicates whiteness/darkness,
redness/greenness, blueness/yellowness values, respectively. The samples were
scanned at six different locations to determine average L, and b values. Total color
difference ( ∆ E) was calculated from the following equation (Altunakar et al., 2004);
18

( ) ( ) ( )[ ]2tan
2tan
2tan ****** dardsdardsdards bbaaLLE −+−+−=∆
where, standard values referred to the BaSO4 plate (L*=96.9, a*=0 and b*=7.2).
2.2.3.2. Unpeeled Skin Surface Area
After the peeling treatment, the remaining skin on the carrot surface was
measured as area (cm2)/carrot by specially prepared transparent papers and referring
to average carrot surface area as percent (%) (Garrote et al., 1993).
2.2.3.3. Peeling Yield
It was measured by weighing carrots before and after peeling and calculated
as percent (%) (Garrote et al., 1993).
2.2.3.4. Total Soluble Solids
Triplicate readings were carried out at 20°C by using refractometer (RFM
330, Bellingham + Stanley Ltd.) and mean value calculated as °Brix (Setty et al.,
1993).
2.2.3.5. Depth of NaOH Penetration
A peeled carrot was cut into two identical parts. From the central part of a one
part, thin slices (1 mm) were cut. A few drops of phenolphthalein solution (3%; w/v)
were applied to the slices and one slice was placed into a phenolphthalein solution.
After waiting few minutes, if penetration occurs, the color turns into violet-pink. This
change can be measured by using a scheduled magnifying glass and value expressed
by mm (Garrote et al., 1993).
2.2.3.6. Pectin Analysis
The carrot sample was extracted with HCl and ethanol. The extract was
filtrated and then washed with ethanol. After washing, extract was dried at 103°C.
Dried extract was solved in ethanol and water. By using phenolphthalein indicator
solution, extract was titrated with NaOH solution. The mixture was shaken with HCl
solution and titrated again with NaOH solution with the help of phenolphthalein
19

indicator solution. The used up NaOH solution was used to calculate the amount of
pectin of the sample (TS 10373, 1992).
2.2.3.7. Beta-Carotene (β-Carotene) Analysis
Chemicals
All solvents used were of high-pressure liquid chromatography (HPLC)
grade and the other chemicals of analytical grade. They were purchased from Riedel-
de Haën (Sigma-Aldrich Laborchemikalien GmbH, Germany). The β-carotene
standard (type IV from carrots) was purchased from Sigma Chemical Company (St
Louis, MO). Chloroform and ethanol were used for extracting β-carotene from
carrot. (The Merck Index 12th ed. Sigma-Aldrich Chemie GmbH, Steinheim,
Germany).
Extraction Procedure
For extraction of β-carotene, 5g of the carrot pulp was homogenized by the
Ultra Turrax homogenizer (IKA ULTRATURRAX T18, Basic, Brazil) in the
presence of 20 ml ethanol:chloroform (1:1, v/v) mix. After precipitation of the carrot
pulp, the solvent was removed to the separating funnel. Then 20 ml chloroform was
added to the carrot pulp and homogenized by the Ultra Turrax. To precipitate the
carrot pulp, 5-10 ml of ethanol was used. After precipitation, the solvent was
removed to the separating funnel again. These steps were repeated three times.
Finally, the solvent was removed from carrot pulp by filtration and the filter cake
reextracted with 20 ml ethanol:chloroform (1:1, v/v) until the color of filter cake was
white.
The β-carotene extract, which was in the separating funnel, was washed with
pure water and 0.1N KOH solution several times. Water was used for water soluble
solids and 0.1N KOH was used for saponification of lipids other than carotenoids
(C.deSá and Rodriguez-Amaya, 2003). The lower layer was separated, combined and
evaporated under vacuum by using a rotary evaporator (Rotavapor,Brinkmann
Instruments, Büchi Laboratoriums, Switzerland) until all chloroform was evaporated.
The residue in the rotary balloon was dissolved with acetone and poured out to the
balloon of 25 ml and filled with acetone. The acetone extract was filled to the
20

eppendorf tubes to store the extract until analyzed at below -20°C. Before analysis,
samples were filtered through a 0,45µm Millipore (Bedford, USA) membrane filter
and injected directly into the HPLC system immediately.
HPLC instrumentation and conditions
The analysis was performed by using a Shimadzu (Kyoto, Japan) VP series
HPLC apparatus. For the analysis, a C18 column (Tracer Extrasil ODS2, 5µm,
25x0,46cm; Teknokroma, Barcelona, Spain), a degasser (Shimadzu model DGU-
14A), a UV-vis photodiode array detector (Shimadzu model SPD-M10Avp) set at
438nm, an HPLC pump (Shimadzu model LC-10 AT-VP) and a system controller
(Shimadzu model SCL-10A) were used. The injection volume was 20µl of solution
at room temperature from a 100µl Hamilton LC syringe via a U6K injector. The
mobile phase was composed of acetonitrile:chloroform (92:8, v/v) and the flow rate
was set at 1ml/min.
2.2.4. Quality Evaluations After Steam Peeling
The analysis was carried at very good peeling(>98%) of carrots. Samples
were milled by a grater before analysis. Treatments were repeated three times and
averaged.
2.2.4.1. Color
Color was measured by Minolta color reader (CR-10, Japan) and expressed
by CIE coordinates (L*a*b*) system. L*, a* and b* indicates whiteness/darkness,
redness/greenness, blueness/yellowness values, respectively. The samples were
scanned at six different locations to determine average L, and b values. Total color
difference ( ∆ E) was calculated from the following equation (Altunakar et al., 2004);
( ) ( ) ( )[ ]2tan
2tan
2tan ****** dardsdardsdards bbaaLLE −+−+−=∆
where, standard values referred to the BaSO4 plate (L*=96.9, a*=0 and b*=7.2).
21

2.2.4.2. Unpeeled Skin Surface Area
After the peeling treatment, the remaining skin on the carrot surface was
measured as area (cm2)/carrot by specially prepared transparent papers and referring
to average carrot surface area as percent (%) (Garrote et al., 1993).
2.2.4.3. Peeling Yield
It was measured by weighing carrots before and after peeling and calculated
as percent (%) (Garrote et al., 1993).
2.2.4.4. Total Soluble Solids
Triplicate readings were carried out at 20°C by using refractometer (RFM
330, Bellingham + Stanley Ltd.) and mean value calculated as °Brix (Setty et al.,
1993).
2.2.4.5. Pectin Analysis
The carrot sample was extracted with HCl and ethanol. The extract was
filtrated and then washed with ethanol. After washing, extract was dried at 103°C.
Dried extract was solved by using ethanol and water. By using phenolphthalein
indicator solution, extract was titrated with NaOH solution. The mixture was shaken
with HCl solution and titrated again with NaOH solution with the help of
phenolphthalein indicator solution. The used up NaOH solution was used to calculate
the amount of pectin of the sample (TS 10373, 1992).
2.2.4.6. Beta-Carotene (β-Carotene) Analysis
Chemicals
All solvents used were of high-pressure liquid chromatography (HPLC)
grade and the other chemicals of analytical grade. They were purchased from Riedel-
de Haën (Sigma-Aldrich Laborchemikalien GmbH, Germany). The β-carotene
standard (type IV from carrots) were purchased from Sigma Chemical Company (St
Louis, MO). Chloroform and ethanol was used for extracting β-carotene from carrot.
(The Merck Index 12th ed. Sigma-Aldrich Chemie GmbH, Steinheim, Germany).
22

Extraction Procedure
For extraction of β-carotene, 5g of the carrot pulp was homogenized by the
Ultra Turrax homogenizer (IKA ULTRATURRAX T18, Basic, Brazil) in the
presence of 20 ml ethanol:chloroform (1:1, v/v) mix. After precipitation of the carrot
pulp, the solvent was removed to the separating funnel. Then 20 ml chloroform was
added to the carrot pulp and homogenized by the Ultra Turrax. To precipitate the
carrot pulp, 5-10 ml of ethanol was used. After precipitation, the solvent was
removed to the separating funnel again. These steps were repeated three times.
Finally, the solvent was removed from carrot pulp by filtration and the filter cake
reextracted with 20 ml ethanol:chloroform (1:1, v/v) until the color of filter cake was
white.
The β-carotene extract, which was in the separating funnel, was washed with
pure water and 0.1N KOH solution several times. Water was used for water soluble
solids and 0.1N KOH was used for saponification of lipids other than carotenoids
(C.deSá and Rodriguez-Amaya, 2003). The lower layer was separated, combined and
evaporated at under vacuum by using a rotary evaporator (Rotavapor,Brinkmann
Instruments, Büchi Laboratoriums, Switzerland) until all chloroform was evaporated.
The residue in the rotary balloon was dissolved with acetone and poured out to the
balloon of 25 ml and filled with acetone. The acetone extract was filled to the
eppendorf tubes to store the extract until analyzed at below -20°C. Before analysis,
samples were filtered through a 0,45µm Millipore (Bedford, USA) membrane filter
and injected directly into the HPLC system immediately.
HPLC instrumentation and conditions
The analysis was performed by using a Shimadzu (Kyoto, Japan) VP series
HPLC apparatus. For the analysis, a C18 column (Tracer Extrasil ODS2, 5µm,
25x0,46cm; Teknokroma, Barcelona, Spain), a degasser (Shimadzu model DGU-
14A), a UV-vis photodiode array detector (Shimadzu model SPD-M10Avp) set at
438nm, an HPLC pump (Shimadzu model LC-10 AT-VP) and a system controller
(Shimadzu model SCL-10A) were used. The injection volume was 20µl of solution
at room temperature from a 100µl Hamilton LC syringe via a U6K injector. The
mobile phase was composed of acetonitrile:chloroform (92:8, v/v) and the flow rate
was set at 1ml/min.
23

2.3. Data Analysis
Analysis of variance (ANOVA) with two ways and Tukey’s Multiple
Comparison Test (P < 0.05) were used to obtain statistical comparison of treatments.
Also Multiple Regression was applied to the data by using Minitab for Windows
(V14).
24

CHAPTER 3
RESULTS AND DISCUSSION
3.1. Chemical Peeling of Carrots
The peeling rates of carrots when put into various sodium hydroxide solutions
at various pre-determined temperatures and concentrations were measured. A desired
product represents conditions which would result in practically total removal of the
skin, minimum peeling loss and maximum product yield. The time-temperature of
the lye solution and time-concentration of the lye solution relationships for complete
peeling of carrots were tried to be found experimentally. In Table A1, the minimum
time for very good peeling is shown for each concentration at constant temperature
as shaded area. As tabulated in the table, the minimum time to reach ‘very good
peeling’ was dependent on the temperature and the severity of the lye concentration.
The minimum required time for ‘very good peeling’ was the basic criteria for
assessing each treatment. It was seen that peeling time was dependent on temperature
and concentration of sodium hydroxide solution as temperature and concentration of
lye increased, peeling time decreased (Table A1). The same result was obtained for
peeling of tomatoes since the increase in lye concentration and temperature
decreased the time necessary for efficient peeling (Bayındırlı, 1994).
After data collection, the time-temperature and time-concentration graphs
were plotted according to the minimum time to reach ‘complete peeling’ score
(Table A1) and the mathematical equations for both relationships were found by
finding out the constants of the general equations determined before the analysis by
the linear regression principle.
The time-concentration relations for chemical peeling of carrots were
investigated. While plotting time versus concentration graph, it was seen that the data
best fit an exponential equation of the form (Figure 3.1):
25

C = e ( λ + γ t) (1)
And;
Ln C = λ + γ t (2)
Equation (2) is the linear form of equation (1) and the parameters λ, γ and correlation
coefficient obtained by regression analysis for each sodium hydroxide concentration
are shown in Table A2 and the best fits are demonstrated in Figures 3.1 and 3.2.
0,00,20,40,60,81,01,21,4
0 4 8 12 16 20 24 28 32
time (min)
conc
(%, N
aOH
)
57°C
67°C
77°C
87°C
equation 1
Figure 3.1.Time-concentration relations for chemical peeling of carrots.
Similarly, the effect of time-temperature relations was described by an
exponential relationship:
T = e (σ + βt) (3)
And;
Ln T = σ + βt (4)
The parameters σ, β and correlation coefficient are shown in Table A3 and
the best fits for the equations (3) and (4) are shown in Figures 3.3 and 3.4
respectively.
26

-1,67-1,37-1,07-0,77-0,47-0,170,130,430,73
0 4 8 12 16 20 24 28
time (min)
Ln C
(%,N
aOH
)
57°C
67°C
77°C
87°C
equation 2
Figure 3.2.Time-concentration relations for chemical peeling of carrots.
As can be seen from Figures 3.1 through 3.4, experimental data fit well to the
exponential equation model for both temperature and concentration. It is also
observed that increase in both temperature and concentration of lye solution led to a
decrease in peeling time. But temperature was the main variable affecting the peeling
time as the change in the slope of the constant temperature lines in Figure 3.1 is
greater than that of constant concentration lines in Figure 3.3. For example, when the
temperature was increased from 57°C to 67°C at 0.50% NaOH, the minimum time
for “very good peeling” was decreased about 6.5 min. When the temperature was
increased from 67°C to 77°C at 0.25% NaOH, the minimum time for “very good
peeling” was decreased about 4 minutes. While increase of concentration from
0.50% to 0.75% led to a 2.5min decrease at 67°C and increase of concentration from
0.75% to 1.00% led to a 1.5 min. decrease at 77°C in that time. A little change in the
concentration did not seem to affect the peeling time as much as the temperature did.
Another clue for this result is that no peeling was observed during the usage of
0.25% NaOH solution at 57°C. The effect of temperature was also obtained
important at peeling of Antep peanut (Bayındırlı et al., 2001) and tomatoes
(Bayındırlı, 1994).
27

Penetration of lye solution takes place via diffusion and chemical reactions
depends strictly on temperature. Floros and Chinnan (1990) showed that diffusion of
lye solution didn’t occur at low temperatures because epicuticular waxes on the
surface of fruits and vegetables were in the solid state. They did not allow NaOH to
enter the fruit. At higher temperatures, the wax liquefied and NaOH readily diffused
inside the tissue.
4552
596673
8087
94
0 4 8 12 16 20 24 28 32
time (min)
tem
pera
ture
(°C
)
0,25%
0,50%
0,75%
1,00%
equation 3
Figure 3.3.Time-temperature relations for chemical peeling of carrots.
In order to decide on optimum combination, we should consider minimum
concentration, minimum time and minimum temperature. Before selecting
concentration, temperature can be selected in that 77°C is the most effective.
Because the difference in the peeling time for “very good peeling” between 67°C and
77°C at 0.25% concentration is 4min., that difference is only 1 min between 77°C
and 87°C.
28

3,95
4,04
4,13
4,22
4,31
4,40
4,49
0 4 8 12 16 20 24 28 32
time (min)
Ln T
(°C
)
0,25%
0,50%
0,75%
1,00%
equation 4
Figure 3.4.Time-temperature relations for chemical peeling of carrots.
Once the temperature is fixed, a decision could be made on concentration
easily. At temperature of 77°C, the difference in the peeling time between 0.50% and
0.75% were 3.5min., while that was only 1.5min. between 0.75% and 1.00%. Thus it
was not necessary to increase the concentration further as increasing concentration
increased the amount of peeling aid and amount of possible chemical residue on the
sample, with only a small decrease in peeling time. Decreasing the concentration on
the other hand, increased the peeling time resulting in probably penetration depth of
the chemical, so the peeling loss. Considering all of the items above therefore, a
suitable set of conditions for chemical peeling of carrots was determined as 0.75%
sodium hydroxide concentration at 77°C for 10.5 minutes.
According to multiple regression analysis, temperature and concentration of
lye solution was significant for peeling time (P<0.05). The regression equation is:
t = 47.4 - 14.1 C - 0.324 T (5)
29

9080
0.2
5
0.3Temperature70
0.4
15
0.5
25
0.6 0.7 0.8
Peeling Time
600.9 1.0Concentration
Figure 3.5. Temperature-concentration-peeling time relations for chemical peeling of carrots.
The temperature-concentration-peeling time relations are shown at Figures
3.5 and F1 and obtained by using Minitab. When the concentration of the lye
solution was low, peeling time was long although temperature of lye solution
increased. When the temperature of lye solution was low, the decrease of peeling
time was not important enough to consider although the lye solution increased. The
decrease of peeling time was measured when the increase of concentration and
temperature of lye solution were considered together.
Consequently, the estimated exponential model represents the case quite well
and this exponential model could be applied to all varieties simply by changing the
constants in the expression.
30

3.2. Steam Peeling of Carrots
Within this work, the effect of heating treatment during the steam peeling of
carrots was assessed. Saturated steam of 130.70 kPa at 107°C was applied to a carrot
at different time intervals to evaluate the peeling degree. The minimal time was
achieved to peel carrots rather than cooking at predetermined pressure and
temperature of the steam. A desired process also represents conditions which would
result in practically total removal of the skin, minimum peeling loss and maximum
product yield. In Table A4 the applied time for peeling degree of carrots were shown.
Temperature and pressure of the steam peeling is constant, and then the main
variable affecting the peeling is time.
Peeled surface area for steam peeling mainly depended on the exposure time
of the steam. The data could be fitted to an exponential line of the form (Figure 3.6):
50
60
70
80
90
100
0 2 4 6 8 10
time (min)
peel
ed s
urfa
ce a
rea
(%)
107°C;130.7kPa
equation 6
Figure 3.6.Peeled surface area-time relations for steam peeling of carrots.
31

P = e (a + b t) (6)
And;
Ln P = a + bt (7)
Equation (6) is the linear form of equation (5) and the parameters a, b and
correlation coefficient obtained by regression analysis is shown in Table A5 and the
best fits are demonstrated in Figures 3.6 and 3.7.
44,1
4,24,3
4,44,5
4,64,7
0 5 10
time (min)
Ln p
eele
d su
rfac
e ar
ea (%
)
107°C; 130.7kPa
equation 7
Figure 3.7.Peeled surface area-time relations for steam peeling of carrots.
As can be seen from Figures 3.6 and 3.7, experimental data fit well to the
exponential model for the saturated steam of 130.7 kPa and 107°C. When
mathematically complete peeling (100 %) was considered, a suitable time for peeling
was determined as 8.92min.
Consequently, the estimated exponential model represents the case quite well
and this model could be applied to all varieties simply by using saturated steam of
130.7 kPa and 107°C.
32

III.3.Effect of Chemical Peeling on Quality of Carrots
The results of analysis are shown in Tables A6 and A7 at appendix. There are
two control samples for comparing the data efficiently. Control 1 (C1) is raw carrot
and Control 2 (C2) is the mechanically peeled carrot. There was not a significant
change of total soluble solids of samples as compared with control samples. Setty et
al (1993) indicated that no significant changes in the important constituents such a
°Brix have been reported in tomatoes peeled by hot water, steam or others.
Statistically, temperature and concentration of lye solution was insignificant for total
soluble solids (P<0.05). The regression equation is at Appendix F.
As the severity of lye concentration was increased, the time for complete
peeling (peeling > 98 %) was decreased. Since lye solution penetrates into the fruits
and vegetables via several chemical reactions, exposure time of sample played an
important role on quality change of carrots. In fact as can be seen in tables in
appendices, most of the quality factors showed more or less a change by exposure
time.
67
68
69
70
71
72
73
74
75
0,00 0,25 0,50 0,75 1,00 1,25
concentration(%,NaOH)
pect
in (m
g/g)
57°C
67°C
77°C
87°C
Figure 3.8.Pectin-concentration relations for chemically peeled carrots.
33

As the severity of the treatment was increased, the weight loss of the carrot
increased. Exposure time of the sample was the main parameter to evaluate the
peeling loss of the carrots. Table A7 shows the weight loss-peeling yield-treatment
relations. Mechanical peeling is the more severe treatment although time is not a
parameter for it.
Floros and Chinnan (1988) indicated that high temperature causes mechanical
failure of the cell and then the effect of heat on the tissue causes biochemical
changes, melting and breakdown of substances such as pectins and polysaccharides
and general disturbance and disorganization of the structure of the cell. Cell walls are
composite microstructures of cellulose microfibrils embedded in a matrix of
polysaccharides and some proteins. Cellulose constituents some 15-28 % of the
weight of the cell wall, hemicellulose 6-10 % and pectic substances 47-66 %. Heat
penetration to the tissue altered the pectin in the middle lamella at above 60°C.
Pectin in the primary and secondary walls changes, causing the separation of the
compact lamella into fibrils and a local decrease in the amount of pectin is observed
(Garrote et al., 2000).
63
65
67
69
71
73
75
77
45 54 63 72 81 90 99
temperature (°C)
pect
in (m
g/g)
0.25%
0.50%
0.75%
1.00%
Figure 3.9.Pectin-temperature relations for chemically peeled carrots.
34

The effect of lye peeling on pectin amount of carrots was evaluated and the
optimum temperature and concentration for the pectin amount was determined.
Figure 3.8 shows pectin-concentration relations at constant temperature. The ordinate
shows the amount of pectin after the peeling treatment. As seen from the figure from
left to the right, concentration increases and then the amount of pectin of the peeled
carrots increases. At 87°C values; time is not as high as other treatments. However;
the pectin amount is low at 87°C 1.00 % NaOH concentration. The lowest pectin
amount is at 57°C and 0.50 %. This demonstrates that temperature is the second
important factor after the time. At 57°C and 0.50 % NaOH concentration, the time
period is 24 minutes. Although temperature is the lowest, the pectin amount is the
lowest than the others. The optimum concentration for peeling can be chosen from
this figure. The optimum concentration for peeling is 0.75 % because the amount of
pectin is higher than 0.50 % and also the pectin amount does not increase
significantly when the concentration of solution is 1.00 %.
676869707172737475
72 75 78 81 84 87 90
peeling yield (%)
pect
in (m
g/g)
57°C (0.50;075;1.00%) 67°C (0.25;0.50;0.75;1.00%)77°C (0.25;0.50;0.75;1.00%) 87°C (0.25;0.50;0.75;1.00%)
Figure 3.10.Pectin-peeling yield relations at constant temperature
35

The optimum temperature determination can be found by using Figure 3.9.
According to Figure 3.9, the amount of pectin is the highest at every temperature
when the concentration of the lye solution is 1.00 %. From Figure 3.8, we know that
temperature is important for the amount of pectin; Figure 3.9 also confirms the same
statement. Except for 57°C and 0.50 % value; the highest the temperature is, the
lowest the pectin amount is.
In addition to the temperature, concentration values are arranged in increasing
order. Once the concentration of lye solution increases, the waiting period of the
carrot in the lye solution decreases; when time is short the amount of pectin of the
sample increases. The concentration was determined 0.75 % according to Figure 3.8.
In Figure 3.9, since the concentration of the lye solution is 0.75 %; the amount of
pectin of the peeled carrots were indicated nearly the same; except for 87°C. The
determination of the temperature, the 57 and 77°C values were compared because
67°C value is lower than these two. By the help of peeling yield from Figure 3.10,
the optimum temperature of the quality evaluation was 77°C because the peeling
yield was higher than 57°C value. As mentioned before, the peeling period at 57°C
was longer than 67 and also 77°C.
676869707172737475
72 75 78 81 84 87 90
peeling yield (%)
pect
in (m
g/g)
0.25% (67;77;87°C) 0.50% (57;67;77;87°C)0.75% (57;67;77;87°C) 1.00% (57;67;77;87°C)
Figure 3.11. Pectin-peeling yield relation at constant concentration
36

The estimated mathematical model represented that the optimum peeling
condition for chemically peeled carrots was 77°C 0.75% and 10.5 minutes. The
quality evaluation determined the optimum chemical peeling condition of the carrot
as 0.75% NaOH concentration at 77°C for 10.5 minutes by the help of pectin. It can
be clearly said that the estimated mathematical model fitted to the quality evaluation.
While examining the Figure 3.10; the value which included the lowest
amount of pectin showed the lowest yield of peeling. Separation of the peel indicates
a local decrease of the amount of pectin (Garrote et al., 2000). From that important
information; peeling yield, in other words weight loss, also determined the amount of
pectin of the peeled carrot. From Figures 3.9 and 3.10, increased concentration
decreased time, then pectin amount increased; but, the peeling yield did not change
significantly at 57°C. In Figure 3.10, the amount of pectin at 67, 77 and 87°C
increased when the peeling yield increased. Pectin degraded due to heat at 87°C; so,
the amount of pectin was the lowest. The slope of 77°C is highest than the slope of
67°C, by the help of this information, peeling yield of 77°C values were highest than
the values of 67°C. The highest amount of pectin region, which is the top of the
Figure 3.10, demonstrates the points of different temperature values. From left to
right, peeling yield increases; however, the amount of pectin does not increase like
peeling yield at that region. There are two points on the graph which the 67 and 77°C
values are nearly the same. The lowest pectin and peeling yield value, as mentioned
before in figures 3.8 and 3.9, confirms the mathematical optimum here again at that
point.
Like Figure 3.10, from left to right, peeling yield increases at constant
concentration at Figure 3.11. From left to right, the concentration points changes in
increasing order. At the maximum peeling yield point, the amount of pectin does not
reach at maximum value. However, that point is the 1.00 % NaOH concentration
point. According to figures 3.8, 3.9 and 3.10, it was the value of 87°C and at that
temperature, the amount of pectin was not the maximum. The other 1.00 % values
have much pectin. The peeling yield of that pectin value is the lowest at 57°C.
Peeling yield were nearly the same at 67 and 77°C. The increase of concentration
decreased peeling time, increase in concentration increased peeling yield at the same
time. When the 0.75 % NaOH values were evaluated, the highest pectin with the
37

highest peeling yield which is the optimum value for chemical peeling can be seen
clearly.
According to multiple regression for peeling yield, the temperature and
concentration of lye solution were significant for peeling yield of the carrots
(P<0.05). The regression equation of peeling yield is:
PY= 56.3 + 10.6 C + 0.232 T (8)
Figure 3.12 and 3.13 are the reverse graphs for Figures 3.10 and 3.11,
respectively. The hot lye solution dissolves and removes the epicuticular and
cuticular waxes of the outer pericarp surface, penetrates the skin and diffuses
uniformly into the fruit. The diffusion of lye causes breakdown of the epidermal and
hypodermal cells and solubilization of the pectic substances in the middle lamella,
separating the skin from the edible part of the fruit. More severe action of lye causes
destruction of cell walls especially of the mesocarp cells resulting in increased
peeling loss (Floros et al., 1987). Prolonged peeling treatments increase peeling
losses (Smith et al., 1980). The increase of peeling loss of the carrot caused the
decrease of the amount of pectin of the peeled carrot.
676869707172737475
10 13 16 19 22 25 28 31 34
weight loss (%)
pect
in (m
g/g)
57°C (0.50;0.75;1.00%) 67°C (0.25;0.50;0.75;1.00%)77°C (0.25;0.50;0.75;1.00%) 87°C (0.25;0.50;0.75;1.00%)
Figure 3.12.Pectin-weight loss relation at constant temperature.
38

676869707172737475
10 13 16 19 22 25 28 31 34
weight loss (%)
pect
in (m
g/g)
0.25% (67;77;87°C) 0.50% (57;67;77;87°C)0.75% (57;67;77;87°C) 1.00% (57;67;77;87°C)
Figure 3.13.Pectin-weight loss relation at constant concentration.
According to statistical analysis, temperature and concentration were
insignificant for the amount of pectin. However, the model fit to the pectin relation.
Then, it can be understood from figures 3.8 to 3.12; the difference was not
significant.
According to multiple regression obtained for pectin amount, the temperature
of lye solution and peeling time were significant for pectin, but the concentration of
lye solution was not significant for the amount of pectin (P<0.05). The regression
equation is of pectin is:
PE = 109 - 0.283 T- 6.45 C- 0.832 t (9)
The pectin content also determines the finished product quality of carrots.
Texture is an important quality attribute of frozen fruits and vegetables. A major
result of freezing on fruits and vegetables is usually a loss of tissue firmness.
Freezing causes disruption of the membranes of cells and excessive softness. Before
freezing there must be an application of preheating needed. (Fuchigami et al., 1995
(a)). The chemical peeling of carrots provides the preheating treatment at the same
time. A correlation between pectic composition in cell walls and softening of cooked
vegetables reported. Excessive softness could be overcome by low temperature
39

blanching. The firming effects of a low temperature, long-time treatment was useful
for improvement in texture of carrots. By the help of this treatment, softening of
carrots was greatly diminished, but cell damage was observed.(Fuchigami et al.,
1995 (a), (b)). Figures 3.8 and 3.9 expressed the lowest pectin amount. Low
temperature-long time caused high peel loss. Also, pectin degradation was high and
the amount of pectin was the lowest However; the firmness of the carrot was the
best. Although the amount of removed pectin develops the firmness of the carrots,
the health quality of carrot diminishes. Baker (1997) suggested that dietary
supplementation with pectin may reduce levels of serum total cholesterol, decrease
low density lipoprotein cholesterol, and moderate the glucose response. Fuchigami et
al (1995 (a)) determined the firmness of carrots at various temperatures. The
temperature of 70°C was an important level. The below and above of 70°C, the
pectin degradation was low. The temperature of 70°C neighborhood caused carrots
firmer than the others. Below 70°C, the needed time for degrading pectin was long.
For instance, 60°C for 30 min. was enough for pectin degradation. However, long
time caused high peel loss. The temperature above 80°C needed short time for
degradation. The level of pectin was lower, then the carrots were firmer, but the
treatment was not economic. Also for health concerns the amount of pectin was very
low than 77°C values. Generally, the chemical peeled carrots were firmer due to the
applied temperatures. Finally, the pectin level of mathematical optimum value also
suggests the optimum firmness of carrot.
The severity of lye action and the depth of penetration depend primarily upon
the concentration of the solution and the time it is permitted to act on the fruit. If the
lye peeling process is carried out satisfactorily, diffusion and action of lye will be
controlled and cell wall degradation effects will be restricted to epidermal and
hypodermal regions with a minimum effect on parenchymatous mesocarp cells. If the
lye solution is applied for too long a time, or it is highly concentrated, severe action
will take place deeply inside the flesh, and some loss of the edible part of the fruit
will occur (Floros et al., 1987). In our study, the concentration is the most important
parameter for that condition because, when the concentration is high, the penetration
time decreases. The penetration depth of the chemical peeling could not be measured
because the NaOH residue was removed with the peel. The NaOH solution did not
penetrate to the edible part of the carrot. The applied concentrations were chosen low
40

for that reason. In addition to concentration, time is the second important factor for
penetration depth. Low concentration regulation is important because of time. Very
low concentration of lye solution causes the increase of the waiting time. At that
waiting time, carrot was exposed lye solution for a long time.
Diffusion of lye solution into the carrot causes chemical reactions. Cell wall
degradation, pectin loss and then the unfavorable result is the removal of the edible
parts. For this reason the regulation of the concentration-time relation is very
important. The edible part was recovered by the help of these parameter
combinations.
When penetration occurs, firstly there is color change with an indicator on the
surface of the fruit. Diffusion of lye solution causes penetration of lye solution into
the carrot. Figure 3.14 shows the color change of the carrot when the penetration
occurs. The carrots on the photograph were dipped in a lye solution for peeling and
after dipping they were washed with water to remove the peels. They were
completely peeled. However, the second one had a color change with an indicator.
Carrot 2 had NaOH residue on the surface. Carrot 1 demonstrates the complete
peeling conditions of Table A1, carrot 2 demonstrates the complete peeling of a
carrot which was peeled to see the difference and it was not a condition of this
study’s peeling.
Figure 3.14.Penetration depth measurement. Carrot 1: There is not penetration of lye solution. Carrot 2: There is penetration of lye solution.
1 2
41

In Figure B3, carrot 1 demonstrates carrot before peeling and carrot 2
demonstrates chemical peeling of carrots. There was not any color difference before
and after peeling. All of the complete peeling conditions of Table A1 were tested
then same result was obtained. In Figure 3.15 the two carrots show the peeled
carrots. There is no penetration inside the skin occurred. Depending on the
concentration, the chemical peeling process is effective on carrots.
Figure 3.15.Carrots after peeling.
Analysis of the heat-affected tissue indicated that less carotenoids were
present in the chemical peeling treatment than in the unheated (mechanical peeling)
control. This was most likely due to easier extraction from the raw tissue (control)
than from the heated peeled samples. It was not known if β-carotene (pro-vitamin A)
is adversely affected by heat-caused cellular disruption (Walter and Giesbrecht,
1982).
Analysis of heat-affected vegetables has problems somewhat different from
those of raw samples. Cooking softens the cell walls and makes the extraction of
carotenoids easier. However, formation of degradation products during cooking may
pose some analytical difficulties. Obtaining data on heat-affected foods are
considered expensive, difficult and time-consuming, requiring considerable material
resources and trained analysts (C.deSá and Rodriguez-Amaya, 2004).
Carotenoids are prone to degradation because of their structure. Their double
bond results in oxidation quickly. The reaction rate increases with heat and light.
Prooxidants and antioxidants affect the reaction rate, too. The second important
factor after oxidation for degradation of carotenoids is the high temperature.
42

Furthermore, the applied temperature during the process not only increases the rate
of carotenoid degradation, but also reverses the carotenoids from high vitamin A
activity to low vitamin A activity (Tüzün, 1992; Cemeroğlu et al., 2001).
In Appendix C the chromatograms of chemical peeling treatments were
shown. Standard chromatogram for β-carotene and the spectrum of β-carotene was
shown for understanding the results. Mechanically peeled carrot was control
chromatogram. In control, the peak showed its maximum absorbance and the
presence of β-carotene was recognized. However, as mentioned before, heat caused
degradation of β-carotene and also the difficulty of extraction of β-carotene from the
heat-affected tissue. It is clearly understood that the chemical peeling changes the
structure of β-carotene. The formula of β-carotene is at Appendix E. The amount of
β-carotene could not be calculated due to these facts. Figure 3.16 expresses the
chromatogram of the mathematical optimum value.
Minutes0 2 4 6 8 10 12 14
mAU
0
200
400
600
800
mAU
0
200
400
600
8002: 436 nm, 8 nm10 numara10 numara.dat
AreaRetention Time
Figure 3.16. Chromatogram of mathematical optimum value of chemical peeling of carrots (77°C; 0.75%; 10.5 min).
The physical properties were also determined during the experiments. The
color is the most significant physical property for consumer acceptance of the peeled
product. Very good peeling (peeled surface higher than 98 %) was achieved for all
concentrations and temperatures except 0.25 % at 57°C, and green color formation
was observed on the surface of the carrot. Statistically, for total color difference
43

temperature is insignificant, however; concentration is significant. For complete
peeling conditions, Figure 3.17 demonstrates total color difference values of the
chemically peeled carrots.
According to statistical analysis, the total color difference (ΔE) of carrots
only changes with concentration. The NaOH concentrations of 0.50 and 0.75%
peeled carrots were alike. However; the NaOH concentration of 0.25 and 1.00% were
alike. The reason for that result is at 0.25% the concentration was very low and at
1.00% the time was very low. So, the effect of solution to the color of carrot could be
the same. In any case, the NaOH concentrations of 0.50 and 0.75% demonstrated the
same effect due to the peeling time-concentration of lye solution relations. Finally,
the ΔE results were only significant with concentration (P<0.05).
a
a
abbb
bb b
bb
a aa
a
6264666870727476
57 57 57 67 67 67 67 77 77 77 77 87 87 87 87
temperature (°C)
∆E
0.25%
0.50%
0.75%
1.00%
Figure 3.17. Variation of total color difference (ΔE) of carrots by peeling concentrations at different temperatures of caustic solutions. Each bar represents mean of three replications. Bars with the same letters are not significantly different at the P< 0.05 level.
Figure 3.18 demonstrates difference between raw carrot (C1) and chemical
peeling. The total color difference (ΔE) of raw carrot and chemically peeled carrots
were different from each other. The chemical peeling process changed the
appearance of the product. However; the appearance of raw carrot is not good and
the peel must be removed. The main comparison for total color difference is between
the peeling methods. The other peeling method is conventional peeling method,
which is mechanical peeling (C2). Figure 3.19 expresses the difference between
44

mechanical and chemical peelings. The ΔE of mechanically peeled carrot value was
very closely to 0.50 and 0.75% values of all temperatures. There was difference
between 0.50, 0.75% values of all temperatures and mechanical peeling.
C1 C1 C1 C1
55
60
65
70
75
80
57 57 57 67 67 67 67 77 77 77 77 87 87 87 87
conditions
∆E
0.25%
0.50%
0.75%
1.00%
C1
Figure 3.18. Variation of total color difference (ΔE) of carrots by peeling concentrations at different temperatures of caustic solutions with raw carrot (C1).Each bar represents mean of three replications.
C2 C2 C2 C2
60636669727578
57 57 57 67 67 67 67 77 77 77 77 87 87 87 87
conditions
∆E
0.25%
0.50%
0.75%
1.00%
C2
Figure 3.19. Variation of total color difference (ΔE) of carrots by peeling concentrations at different temperatures of caustic solutions with mechanically peeled carrot (C2). Each bar represents mean of three replications.
45

The lightness of the sample was expressed as (L*) value and temperature and
concentration were responsible for the difference of the samples in chemical peeling,
statistically. Figure 3.20 expresses the lightness of carrots by peeling concentrations
at different temperatures of caustic solutions. An interesting result was obtained. The
lightness of carrots was both significant and insignificant to the other carrots when
the concentration of the lye solution was 0.75%. Also the L* value of carrots were
insignificant when the concentration of lye solution was 0.50 and 1.00%.In addition,
the L* value of carrots were significant when the concentration of the lye solution
was 0.25% (P<0.05). Considering the concentration, the evaluation of lightness is
complex. However; for chemical peeling, the more bright carrots were peeled at all
concentrations of 57°C.
aaa
b
b
b ba b
a ba b
a b
b
bb
b
4042444648505254
57 57 57 67 67 67 67 77 77 77 77 87 87 87 87
temperature (°C)
light
ness
(L*)
0.25%
0.50%
0.75%
1.00%
Figure 3.20. Variation of lightness (L*) of carrots by peeling concentrations at different temperatures of caustic solutions. Each bar represents mean of three replications. Bars with the same letters are not significantly different at the P< 0.05 level.
46

aaa
bbbb b
bb
b
b
bb b
39
42
45
48
51
54
0,25 0,25 0,25 0,50 0,50 0,50 0,50 0,75 0,75 0,75 0,75 1,00 1,00 1,00 1,00
concentration (%)
light
ness
(L*) 57°C
67°C
77°C
87°C
Figure 3.21. Variation of lightness (L*) of carrots by peeling temperatures at different concentrations of caustic solutions. Each bar represents mean of three replications. Bars with the same letters are not significantly different at the P< 0.05 level.
Figure 3.21 expresses the lightness of carrots by peeling temperatures at
different concentrations of caustic solutions. The significant difference was between
57°C with other temperature samples. As stated before from Figure 3.20, more bright
colors were obtained by using the 57°C solutions for peeling. They were also
statistically different than others (P<0.05).
C1 C1C2 C2 C2C1 C1 C2
4042444648505254
57 57 57 67 67 67 67 77 77 77 77 87 87 87 87
conditions
light
ness
(L*)
0.25%
0.50%
0.75%
1.00%
C1
C2
Figure 3.22. Variation of lightness value (L*) comparison with C1:raw carrot and C2:mechanically peeled carrot. Each bar represents mean of three replications.
47

Figure 3.22 expresses the difference between two control values with
chemical peeling. The lightness of mechanically peeled carrot (C2) was like the raw
carrot (C1). These two results were near only with 57°C chemically peeled carrots.
The increase of temperature of the lye solution decreases the brightness of the
product. Although they were less brilliant, they were still highly acceptable.
The other color measurements are the intensity of redness and yellowness for
carrots because orange color is obtained by suitable combination of these two values.
Redness and yellowness are coded by a* and b*, respectively. As mentioned before,
total color difference (ΔE) is calculated by using lightness L*, redness a* and
yellowness. For redness a* value, the temperature and concentration of the lye
solution were significant, however; for yellowness b* value, only concentration is
significant, statistically. Figure 3.23 demonstrates the a* values of carrots by peeling
concentrations at different temperatures of caustic solutions. When the value of a*
increases, the intense of redness increases. According to the figure, the evaluation of
redness from one concentration to other had different behavior like the one in
lightness values. The redness of carrots was both significant and insignificant to the
other carrots when the concentration of lye solution was 1.00%. Except from 1.00%,
the carrots which peeled with NaOH concentration of 0.50 and 0.75% were
insignificant to each other, however, significant with 0.25 %(P<0.05).
aaa b
bbb b
b bba b
a ba ba b
0
10
20
30
40
57 57 57 67 67 67 67 77 77 77 77 87 87 87 87
temperature (°C)
a* v
alue 0.25%
0.50%
0.75%
1.00%
Figure 3.23. Variation of a* values of carrots by peeling concentrations at different temperatures of caustic solutions. Each bar represents mean of three replications.
48

Figure 3.24 demonstrates the a* values of carrots by peeling temperatures at
different concentrations of caustic solutions. The redness intensity of chemically
peeled carrots was recognized from this figure. The intense red carrots were peeled
by the lye solution of 57°C. Also, they were statistically different from other lye
temperature peeled samples (P<0.05). The intensity of redness of chemically peeled
carrots was between C1 and C2 values. They were all compared with steam peeling
values at appendix D.
a aab b b b
bb b b
b b bb
0
10
20
30
40
0,25 0,25 0,25 0,50 0,50 0,50 0,50 0,75 0,75 0,75 0,75 1,00 1,00 1,00 1,00
concentration (%)
a* v
alue 57°C
67°C
77°C
87°C
Figure 3.24. Variation of a* values of carrots by peeling temperatures at different concentrations of caustic solutions. Each bar represents mean of three replications.
The b* values show the intensity of yellowness. Intense red and intense
yellow produces intense orange color. Statistically, temperature was insignificant,
but concentration was significant. Figure 3.25 expressed the concentration
significance of b* values. The yellowness of carrots was both significant and
insignificant to the other carrots when the concentration of lye solution was 1.00%.
The b* value of peeled carrots were insignificant when the lye concentration of 0.50
and 0.75% were used. However; they were significant when peeled with 0.25% lye
solution (P<0.05).
49

aa
abbb b
b bb ba b
a ba b
a b
354045505560
57 57 57 67 67 67 67 77 77 77 77 87 87 87 87
temperature (°C)
b* v
alue
0.25%
0.50%
0.75%
1.00%
Figure 3.25. Variation of b* values of carrots by peeling concentrations at different
temperatures of caustic solutions. Each bar represents mean of three replications.
The lye concentration of 0.50% had the intense yellow value than others,
especially at 77 and 87°C. The intensity of yellowness of chemically peeled carrots
was between C1 and C2 values. Finally, the chemically peeled carrots orange color
was slightly good. As stated before, they were all compared with steam peeling
values at appendix D.
The image of the chemical peeled carrot, which was mathematical optimum
value, was at Appendix B.
50

3.4. Effect of Steam Peeling on Quality of Carrots
The results of analysis are shown in Tables A6 and A7 at appendix. There are
two control samples for comparing the data efficiently. Control 1 (C1) is raw carrot
and Control 2 (C2) is the mechanically peeled carrot. There was not a significant
change of total soluble solids of steam peeled samples as compared with control
samples. Setty et al (1993) indicated that no significant changes in the important
constituents such a °Brix have been reported in tomatoes peeled by hot water, steam
or others.
Floros and Chinnan (1988) indicated that high temperature causes mechanical
failure of the cell and then the effect of heat on the tissue cause biochemical changes,
melting and breakdown of substances such as pectins and polysaccharides. Heat
penetration to the tissue altered the pectin in the middle lamella at above 60°C.
Pectin in the primary and secondary walls changes, causing the separation of the
compact lamella into fibrils and a local decrease in the amount of pectin is observed
(Garrote et al., 2000).
As the severity of the treatment was increased, the weight loss of the carrot
increased. Exposure time of the sample was the main parameter to evaluate the
peeling loss of the carrots. Table A7 shows the weight loss-peeling yield-treatment
relations. Mechanical peeling is the more severe treatment although time is not a
parameter for it.
0
20
40
60
80
100
peeling yield weight loss pectin
chem.peel.
steam peel.
mech. peel.
Figure 3.26. Peeling yield (%)-weight loss (%)-pectin(mg/g) relations of chemical, steam and mechanical peeling methods. Each bar represents mean of three replications.
51

pect
in (m
g/g)
556065707580
77°C0.75%
steampeel.
mech.peel.
raw carrot
peeling conditions
Figure 3.27. The comparison of the amount of pectin of raw carrot with steam, mechanical and chemical (77°C; 0.75%;10.5min.-optimum conditions) peeling methods. Each bar represents mean of three replications.
The time interval for steam peeling was not low, but the effectiveness of
treatment was higher than chemical peeling. So, the weight loss was lower than
chemical peeling. In addition to that, pectin amount was higher than chemical
peeling results. Figure 3.26 expressed the relationship between the average values of
chemical peeling data with mechanical and steam peeling. The peeling yield was,
proportional with the amount of pectin.
Figure 3.27 expressed the amount of pectin difference between the three
peeling methods with raw carrot. The amount of pectin of steam peeled carrot was
very close to raw carrot value. The mechanically peeled carrot had the lowest pectin
because it had the highest peel loss.
As mentioned before, the level of heat treatment was important in peeling
treatments. The peel loss of steam peeling was lower than chemical peeling
applications. The amount of pectin was higher. Carrots preheated above 85°C
softened quickly as temperature rose (Fuchigami et al., 1995 (a)).The steam peeled
carrot was expected less firm than the chemically peeled carrots, especially
mathematical optimum value.
Analysis of the heat-affected tissue indicated that less carotenoids were
present in the steam peeling treatment than in the unheated (mechanical peeling)
control. This was most likely due to easier extraction from the raw tissue (control)
than from the heated peeled samples. It was not known if β-carotene (pro-vitamin A)
is adversely affected by heat-caused cellular disruption (Walter and Giesbrecht,
52

1982). Analysis of heat-affected vegetables has problems somewhat different from
those of raw samples. Cooking softens the cell walls and makes the extraction of
carotenoids easier. However, formation of degradation products during cooking may
pose some analytical difficulties. (C.deSá and Rodriguez-Amaya, 2004).
Carotenoids are prone to degradation because of their structure. Their double
bond results in oxidation quickly (Appendix E). The reaction rate increases with heat
and light. The second important factor after oxidation for degradation of carotenoids
is the high temperature. (Tüzün, 1992; Cemeoğlu et al., 2001).
In Appendix C the chromatograms of peeling treatments were shown.
Standard chromatogram for β-carotene and the spectrum of β-carotene was shown
for understanding the results. Mechanically peeled carrot was control chromatogram.
In control, the peak showed its maximum absorbance and the presence of β-carotene
was recognized. However, as mentioned before, heat caused degradation of β-
carotene and also the difficulty of extraction of β-carotene from the heat-affected
tissue. It is clearly understood that the steam peeling changes the structure of β-
carotene. The amount of β-carotene could not be calculated due to these facts like
chemical peeling.
The physical properties were also determined during the experiments. The
color is the most significant physical property for consumer acceptance of the peeled
product. In Figure 3.28 the total color difference values were compared. At 87°C
1.00% lye concentration value was very close to steam peeled carrot. The steam
peeled product was also insignificant with 0.25 and 1.00% lye peeled products.
53

stea
m
stea
m
stea
m
stea
m
58
63
68
73
78
57 57 57 67 67 67 67 77 77 77 77 87 87 87 87
conditions
∆E
0.25%
0.50%
0.75%
1.00%
steam
Figure 3.28. Variation of total color difference (ΔE) of carrots by peeling concentrations at different temperatures of caustic solutions with steam peeled carrots. Each bar represents mean of three replications.
55
61
67
73
79
chemical steam raw mechanical
conditions
∆E
77°C; 0.75%
steam
C1
C2
Figure 3.29. Comparison of total color difference (ΔE) of peeling treatments with raw carrot. Each bar represents mean of three replications.
In Figure 3.29, the total color difference values were compared. Chemical
and steam peeled products close to each other. However; mechanical peeling was
very different. Steam peeled carrot was close to raw carrot. Also, chemical peeled
carrot was close to mechanical peeled carrot. Finally, there is a little difference
between chemical and steam peeled products for ΔE.
54

stea
m
stea
m
stea
m
stea
m
394245485154
57 57 57 67 67 67 67 77 77 77 77 87 87 87 87
conditions
light
ness
(L*) 0.25%
0.50%
0.75%
1.00%
steam
Figure 3.30. Variation of lightness (L) of carrots by peeling concentrations at
different temperatures of caustic solutions with steam peeled carrot. Each bar represents mean of three replications.
In Figure 3.30, chemical and steam peeled products were compared. The
brightness of steam peeled product was nearly close to chemical peeled products
except for 57°C values. Steam peeled product was less brilliant but still highly
acceptable.
44
46
48
50
52
54
chemical steam raw mechanical
conditions
light
ness
(L*)
77°C;0.75%
steam
C1
C2
Figure 3.31. Comparison of lightness (L) of peeling treatments with raw carrot.
Each bar represents mean of three replications.
55
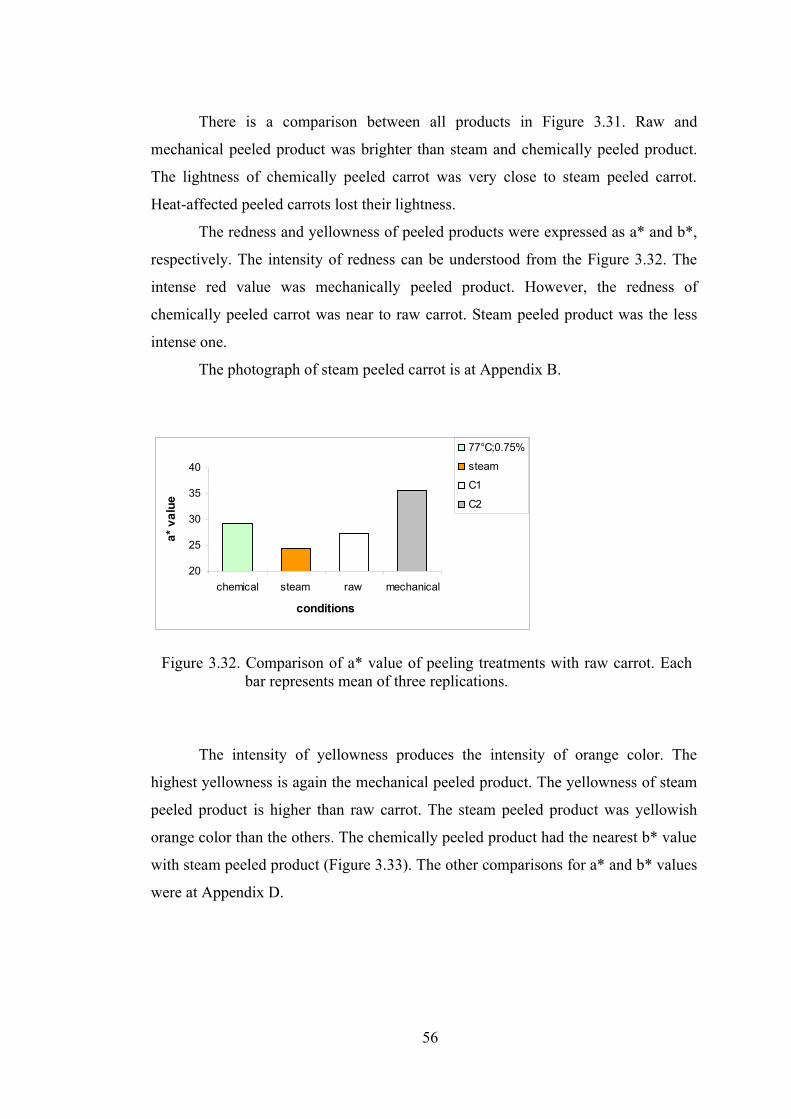
There is a comparison between all products in Figure 3.31. Raw and
mechanical peeled product was brighter than steam and chemically peeled product.
The lightness of chemically peeled carrot was very close to steam peeled carrot.
Heat-affected peeled carrots lost their lightness.
The redness and yellowness of peeled products were expressed as a* and b*,
respectively. The intensity of redness can be understood from the Figure 3.32. The
intense red value was mechanically peeled product. However, the redness of
chemically peeled carrot was near to raw carrot. Steam peeled product was the less
intense one.
The photograph of steam peeled carrot is at Appendix B.
20
25
30
35
40
chemical steam raw mechanical
conditions
a* v
alue
77°C;0.75%
steam
C1
C2
Figure 3.32. Comparison of a* value of peeling treatments with raw carrot. Each bar represents mean of three replications.
The intensity of yellowness produces the intensity of orange color. The
highest yellowness is again the mechanical peeled product. The yellowness of steam
peeled product is higher than raw carrot. The steam peeled product was yellowish
orange color than the others. The chemically peeled product had the nearest b* value
with steam peeled product (Figure 3.33). The other comparisons for a* and b* values
were at Appendix D.
56

30354045505560
chemical steam raw mechanical
conditions
b* v
alue
s
77°C;0.75%
steam
C1
C2
Figure 3.33. Comparison of b* value of peeling treatments with raw carrot. Each bar represents mean of three replications.
As clearly stated that, steam peeled product was less brilliant and yellowish
but it was still highly acceptable.
57

CHAPTER 4
CONCLUSION AND RECOMMENDATIONS
In chemical peeling of carrots, time-concentration and time-temperature
relations are exponential. Peeling temperature other than concentration and time was
found to be the most important factor affecting the peeling. Increases in both
temperature and lye solution led to a decrease in peeling time. At low temperatures
the time for complete peeling was considerably higher.
Very good peeling was achieved for all concentrations and temperatures
except 0.25% at 57°C, and green color formation was observed on the surface of the
carrot.
Treatment with 0.75% NaOH at 77°C for 10.5min was found to be optimum
to peel the carrots mathematically.
In steam peeling mathematically complete peeling was achieved at 8.92min.
The time-peeled surface area relations were exponential.
Depending on the temperature, concentration and time; chemical peeling
process is superior to mechanical peeling, since it is effective on carrots having
irregular shapes and cavities. Chemical peeling of carrots is not only an efficient
method, but also reduces peeling losses. So, increases the yields and saves labor as
well.
Comparing of steam peeling, chemical peeling of carrots is not as efficient as
steam peeling due to the peel losses. The conditions for steam peeling will be
developed and the time for the peeling can be decreased.
The lye solution did not affect the carrot after peeling. There was not any
residue of NaOH on the surface and also inside of the carrot.
The color and brightness of chemically and steam peeled carrots were not
significantly different from each other. However, they are different from
mechanically peeled carrot. They were less brilliant than mechanically peeled carrot;
but they were still acceptable. The chemically peeled carrot was more brilliant than
steam peeled carrot.
58

For steam peeling, the development of the applied process may be possible.
The higher steam temperature and lower waiting period can help to develop the
finished quality of the carrot.
Considering the similarities between steam and chemical peeling
mechanisms, it is reasonable to expect improved efficiency and reduced peeling loss
in the case of steam as well. However; the two methods for peeling carrots are
suitable when considering the needs for the processes. For cooking industries such as
canning, the two processes are suitable. The need and conditions of the plant are
important for selecting the method.
For freezing, the pectin degradation is important. The degraded amount of
pectin determines the firmness of the carrot. The finished product quality mainly
depends on the product quality. However, the dietary concerns indicate that the
pectin amount is important. Also the peeling yield of the treatment and saving labor
are important, too. The peeling condition of 0.75% at 77°C for 10.5min was selected
due to these facts.
According to multiple regression for pectin amount, the temperature of lye
solution and peeling time were significant for pectin, although the concentration of
lye solution was insignificant for the amount of pectin (P<0.05). The temperature and
concentration of lye solution were significant for peeling yield of the carrots
(P<0.05)
The further research for heat-used peeled carrots is the determination of β-
carotene content by developing the used method. The heat affected the tissue, so that
the separation of the peaks was not obtained. This was due to the decrease of β-
carotene content of carrots. Moreover, it was not known if β-carotene (pro-vitamin
A) is adversely affected by heat-caused cellular disruption.
According to multiple regression analysis, temperature and concentration of
lye solution was significant for peeling time (P<0.05).
Finally, the models represent the case quite well and such an equation is
applicable to all varieties of carrots by simply inserting new constants into the
equation for the variety and condition of the carrot used in the next operation.
However, the two peeling methods are efficient than mechanical peeling and saves
labor. The selection of the proper method mainly depends on the conditions of the
application and the plant design of the next process.
59

REFERENCES
Altunakar, B., Şahin, S., and Şumnu, G. 2004. “Functionality of Batters Containing Different Starch Types for Deep-fat Frying of Chicken Nuggets”. European Food Research and Technology 218:318-322.
Anonymous, 1964. “Lye Peeling of Fruit and Root Crops”. Diamond Chemical Co., Cleveland, QH.
Baker, R.A. 1997. “Reassessment of Some Fruit and Vegetable Pectin Levels”. Journal of Food Science 62(2):225-229.
Bayındırlı, L., Bayındırlı, A., Şahin, S., Şumnu, G. and Gider, S. 1996(a)."Studies on Caustic Peeling of Apples". Journal of Food Science and Technology 33(3):240-242.
Bayındırlı, L., Sumnu, G. and Özkal, S.G. 1996(b). “Effects of Isopropylalcohol on Lye Peeling of 'Amasya' Apples”. Fruit Processing, Flüssiges Obst 6:237-239.
Bayındırlı, L., Bayındırlı, A. and Gençler, D. 1997. “Modelling of Lye Peeling of Potatoes”. Gıda Teknolojisi 2:2.
Bayındırlı, L. 1994. “Mathematical Analysis of Lye Peeling of Tomatoes”. Journal of Food Engineering 23:225-231.
Bayındırlı, L., Altan, A. and Sevimli, M. 2001. “Mathematical Analysis of Lye Peeling of Peanuts”. Gıda Teknolojisi 5(5): 60-64.
Bayındırlı, L., Tuncer, E. and Öztürk, S.B. 2002. “Mathematical Analysis of Lye Peeling of Walnuts”. Gıda 27(4):241-245.
Bolin, H.R. and Huxsoll, C.C. 1991. “Color of Minimally Processed Carrot (Daucus carota) Surface Discoloration Caused by Abrasion Peeling”. J. Food Sci. 56(2):416-418.
60

Burns, J., Fraser, P.D. and Bramley, P.M. 2003. “Identification and Quantification ofCarotenoids, Tocopherols and Chlorophylls in Commonly Consumed Fruits and Vegetables”. Phytochemistry 62:939-947.
Cemeroğlu, B., Yemenicioğlu, A. and Özkan, M. 2001. “Meyve ve Sebzelerin Bileşimi ve Soğukta Depolanmaları”. Food Technology Association Publications, No:24 , Ankara.
Corey, K.A., Schlimme, D.V. and Frey, B.C. 1986. “Peel Removal by High Pressure Steam from Processing Tomatoes with Yellow Shoulder Disorder”. J. Food Sci. 51(2):388-394.
Cruess, W.V. 1958. “Commercial Fruit and Vegetable Products” , 4th ed. McGraw-Hill Book Co., New York.
C.de Sá, M. and Rodriguez-Amaya, D.B. 2003. “Carotenoid Composition of Cooked Green Vegetables from Restaurants”. Food Chemistry 83:595-600.
C.de Sá, M. and Rodriguez-Amaya, D.B. 2004. “Optimization of HPLC Quantification of Carotenoids in Cooked Green Vegetables-Comparison of Analytical and Calculated Data”. Journal of Food Composition and Analysis 17:37-51.
Fuchigami, M., Miyazaki, K. and Hyakumoto, N. 1995(a). “Frozen Carrots Texture and Pectic Components as Affected by Low-Temperature-Blanching and Quick Freezing”. Journal of Food Science 60(1):132-136.
Fuchigami, M.,. Hyakumoto, N. and Miyazaki, K. 1995(b). “Programmed Freezing Affects Texture, Pectic Composition and Electron Microscopic Structures of Carrots”. Journal of Food Science 60(1):137-141.
Floros, J.D., Wetzstein, H.Y. and Chinnan, M.S. 1987. “Chemical (NaOH) Peeling as Viewed by Scanning Electron Microscopy: Pimiento Peppers as a Case Study”. Journal of Food Science 52(5): 1312-1320.
Floros, J.D. and Chinnan, M.S. 1988(a). “Seven Factor Response Surface Optimization of a Double-Stage Lye (NaOH) Peeling Process for Pimiento Peppers”. Journal of Food Science 53(2):631-638.
61

Floros, J.D. and Chinnan, M.S. 1988(b). “Microstructural Changes during Steam Peeling of Fruits and Vegetables”. Journal of Food Science 53(3): 849-853.
Floros, J.D. and Chinnan, M.S. 1990. “Diffusion Phenomena during Chemical (NaOH) Peeling of Tomatoes”. Journal of Food Science 55(2): 552-553.
Food and Nutrition Board 2001. “Dietary Reference Intakes for Vitamin A, Vitamin K, Arsenic, Boron, Chromium, Copper, Iodine, Manganese, Molbydenium, Nickel, Silicon, Vanadium and Zinc”. National Academy Press, Washington, DC.
Garrote, R.L., Coutaz, V.R., Luna, J.A., Silva, E.R. and Bertone, R.A. 1993. “Optimizing Processing Conditions for Chemical Peeling of Potatoes using Response Surface Methodology”. Journal of Food Science 58(4):821-826.
Garrote, R.L., Coutaz, V.R., Silva, E.R. and Bertone, R.A. 1994. “Determining Process Conditions for Chemical Peeling of Asparagus”. Lebensm.-Wiss. u.-Technol. 27:19-22.
Garrote, R.L., Silva, E.R., Bertone, R.A. and Avalle, A. 1997. ”Effect of Time and Number of Cycles on Yield and Peeling Quality of Steam Peeled Potatoes and Asparagus”. Lebensm.-Wiss. u.-Technol. 30:448-451.
Garrote, R.L., Silva, E.R. and Bertone, R.A. 2000. “Effect of Thermal Treatment on Steam Peeled Potatoes”. Journal of Food Engineering 45:67-76
Gould, W.A. 1983. “Tomato Production Processing and Quality Evaluation” , 2nd ed. AVI Publishing Co., Westport, CT.
Hart, M.R., Graham, R.P., William, G.S. and Hanni, P.R. 1974. “Lye Peeling ofTomatoes Using Rotating Rubber Discs”. Food Technol. 28:38.
Huxsoll, C.C., Weaver, M.L., and Ng, K.C. 1981. “Double-dip Caustic Peeling ofApples” I:Laboratory-scale development. American Potato J. 58:327-338.
Huxsoll, C.C. and Smith, T.J. 1975. “Peeling Potatoes for Processing”. In potatoProcessing, 3rd ed, W.F. Talburt and O. Smith (Ed). The AVI PublishingCompany, Inc., Westport, CT.
62

Kaleoğlu, M., Bayındırlı, L. and Bayındırlı, A. 2004. “Lye Peeling of ‘Tombul’ Hazelnuts and Effect of Peeling on Quality”. Trans IChemE, Part C, Food and Bioproducts Processing 82(C3):201-206.
Kertesz, Z.I. 1951. “The Pectic Substances”. Interscience Publishers, Inc., New York.
McNeil, M., Darvill, A.G., Fry, S.G. and Albersheim, P. 1984. “Structure and Function of the Primary Cell Walls of Plants”. Ann. Rev. Biochem. 53:625-630.
Murkovic, M., Mülleder, U. and Neunteufl, H. 2002. “Carotenoid Content in Different Varieties of Pumpkins”. Journal of Food Composition and Analysis 15:633-638.
Powers, M.J., Adams, H.W. and Ititani, W.M. 1977. “Chemical and Physical Factorsin Peeling Apples and Potatoes”. J. Food Sci. Technol. 30:155-162.
Reeve, R.M. 1976. “Histological Structure Affects Peeling of Fruits and Vegetables”.Food Technol . 30(12):48-52.
Schlimme, D.V., Corey, K.A. and Frey, B.C. 1984. “Evaluation of Lye and Steam Peeling Using Four Processing Tomato Cultivars”. J. Food Sci. 49:1415-1418
Setty, G.R., Vijayalakshmi, M.R. and Devi, A.U. 1993. “Methods for Peeling Fruits and Vegetables : A Critical Evaluation”. J. Food Sci. Technol. 30(3):155-162.
Smith, D. A., Harris, H. and Rymal, K.S. 1980. “Effect of Cold Water Injection during High Pressure Steam Peeling of Sweet Potatoes”. J. Food Sci. 45:750-751
Smith, D. A., Dozier, W.A., Griffey, W.A. and Rymal, K.S. 1981. “Effect of Steam Temperature, Speed of Cooling and Cutin Disruption in Steam and Lye Peeling of Apples”. J. Food Sci. 47:267-269.
Surles, R.L., Weng, N., Simon, P.W. and Tanumihardjo, S.A. 2004.”CarotenoidProfiles and Consumer Sensory Evaluation of Specialty Carrots (Daucus carota, L.) of Various Colors”. J. Agric. Food Chem. 52:3417-3421.
63

Tüzün, C. 1992. “Biochemistry” 2nd ed. Palme Publications, Ankara
Walter, W M. and Giesbrecht, F.G. 1982. “Effect of Lye Peeling Conditions on Phenolic Destruction, Starch Hydrolysis, and Carotene Loss in Sweet Potatoes” J. Food Sci. 47:810-812.
Walter, W M. and Schadel, W.E. 1982. “Effect of Lye Peeling Conditions on SweetPotato Tissue”. J. Food Sci. 47:813-817.
Woodroof, J.G. and Luh, B.S. 1975. “Commercial Fruit Processing”. The AVI Publ.Co. Inc, Westport, Connecticut.
www.carrotmuseum.com
64

APPENDIX A
PEELING DATA FOR CARROTS
Table A1. Time-Temperature-Concentration-Score Relation for Chemical Peeling of Carrots.
57°C0,25% 0,50% 0,75% 1%22 min ** 15 min ** 8 min ** 7min **25 min ** 18 min *** 11 min *** 10 min ***27 min ** 20 min *** 15 min *** 12 min ***30 min *** 24 min **** 18,5 min **** 14,5 min****
67°C0,25% 0,50% 0,75% 1%12 min ** 10 min ** 7 min ** 5 min **15 min ** 12 min *** 11 min *** 7 min ***18 min *** 15 min *** 13 min *** 9 min ***22 min **** 17,5min **** 15 min **** 11,5min****
77°C0,25% 0,50% 0,75% 1%10 min ** 7 min *** 3,5 min *** 3,5 min***12 min *** 10 min *** 5 min *** 5 min ***14 min *** 12 min *** 7 min *** 7 min ***18 min**** 14 min **** 10,5 min **** 9 min ****
87°C0,25% 0,50% 0,75% 1%10 min ** 7 min *** 5 min *** 3,5 min***12 min *** 10 min *** 7 min *** 5 min ****15 min *** 12 min **** 10 min **** 7 min ****17 min**** 14 min **** 12 min **** 8 min ****
65

Table A2. Operational Parameters & Constants for Time – Concentration Relations
Table A3. Operational Parameters & Constants for Time – Temperature Relations
Concentration (%, NaOH)
Temperature (°C) λ γ r2
0.25, 0.50, 0.75, 1.00 57 1.0602 -0.0730 0.9999
0.25, 0.50, 0.75, 1.00 67 1.6325 -0.1348 0.9806
0.25, 0.50, 0.75, 1.00 77 1.3323 -0.1494 0.9926
0.25, 0.50, 0.75, 1.00 87 0.7049 -0.1179 0.9484
Temperature (°C) Concentration (%,
NaOH)σ β r2
57, 67, 77, 87 0.25 5.2359 -0.0473 0.9150
57, 67, 77, 87 0.50 4.8374 -0.0340 0.9645
57, 67, 77, 87 0.75 4.8599 -0.0441 0.9491
57, 67, 77, 87 1.00 4.7123 -0.0448 0.9784
66

Table A4. Time-Score Relation for Steam Peeling of Carrots
107°C 130,7 kPa2 min **
4 min **6 min ***
8,5 min ****
Table A5. Operational Parameters & Constants for Time – Peeled Surface Area Relations
Temperature(°C)Pressure
(kPa) a b r2
107 130,7 3,9212 0,0767 0,9939
67

Table A6. Total Soluble Solids for Carrots (°Brix).a. Chemically Peeled Carrots.
sample no temp(°C)
conc(% NaOH) time(min) °Brix
1 57 0.50 24 8.42 57 0.75 18.5 8.33 57 1.00 14.5 8.24 67 0.25 22 8.45 67 0.50 17.5 8.36 67 0.75 15 8.17 67 1.00 11.5 7.98 77 0.25 18 8.39 77 0.50 14 8.210 77 0.75 10.5 7.911 77 1.00 9 7.812 87 0.25 17 8.313 87 0.50 12 8.114 87 0.75 10 7.915 87 1.00 5 7.7
b. Total Soluble Solids for Carrots (°Brix).
sample no condition °Brix16 steam peeling 7.917 mechanical peeling 7.718 raw carrot 7.8
68

Table A7. Peeling yield-weight loss-pectin relations.
application peeling yield(%) weight loss(%) pectin(mg/g)1 57°C 0.50% 73.90 26.10 67.802 57°C 0.75% 74.60 25.40 73.593 57°C 1.00% 76.50 23.50 73.884 67°C 0.25% 74.09 25.91 70.505 67°C 0.50% 78.80 21.20 72.586 67°C 0.75% 81.45 18.55 73.027 67°C 1.00% 84.29 15.71 73.968 77°C 0.25% 78.30 21.70 69.629 77°C 0.50% 80.70 19.30 71.7110 77°C 0.75% 81.30 18.70 73.2311 77°C 1.00% 84.31 15.69 73.6712 87°C 0.25% 78.20 21.80 69.8513 87°C 0.50% 82.50 17.50 70.1314 87°C 0.75% 84.50 15.50 71.0115 87°C 1.00% 88.10 11.90 73.02
average 80.10 19.90 71.8416 steam peel. 91.30 8.70 74.3217 mech. peel. 68.50 31.50 64.5518 raw carrot 75.77
69
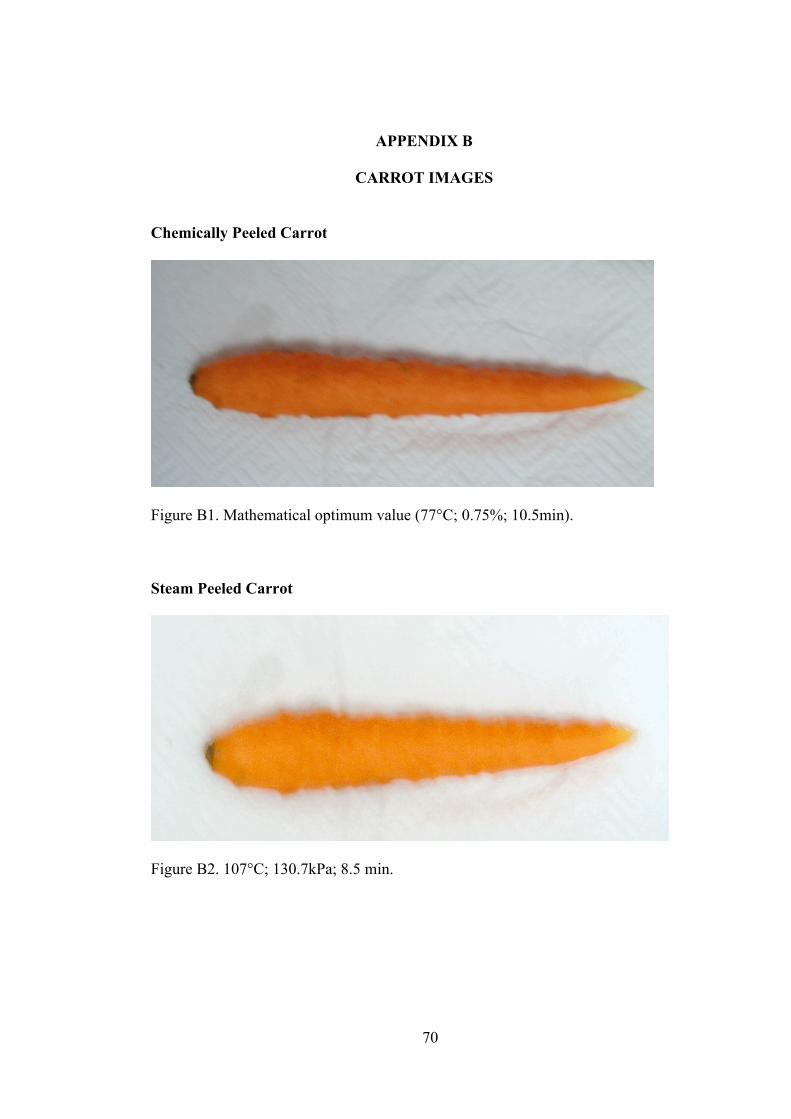
APPENDIX B
CARROT IMAGES
Chemically Peeled Carrot
Figure B1. Mathematical optimum value (77°C; 0.75%; 10.5min).
Steam Peeled Carrot
Figure B2. 107°C; 130.7kPa; 8.5 min.
70

Figure B3.Carrots before and after peeling.
1 2
71

APPENDIX C
CHROMATOGRAMS
Minutes
0.0 2.5 5.0 7.5 10.0 12.5 15.0 17.5 20.0 22.5 25.0 27.5 30.0
mA
U
0
100
200
300
400
mA
U
0
100
200
300
400
1: 436 nm, 8 nmKloroformKloroform.dat
AreaRetention Time
Figure C1: Mechanically peeled carrot (control)
Minutes0 2 4 6 8 10 12 14
mA
U
0
500
1000
1500
2000
2500
3000
mA
U
0
500
1000
1500
2000
2500
3000
2: 436 nm, 8 nm200ppmstd200ppmstd.dat
AreaRetention Time
Figure C2: β-Carotene Standard Chromatogram (200 ppm)
72

Chemical Peeling
Minutes
0 2 4 6 8 10 12 14
mA
U
0
50
100
150
200
mA
U
0
50
100
150
2002: 436 nm, 8 nm1 numara1 numara.dat
AreaRetention Time
Figure C3: 57°C; 0.50% NaOH; 24min
Minutes
0 2 4 6 8 10 12 14
mA
U
0
50
100
150
200
mA
U
0
50
100
150
2002: 436 nm, 8 nm2 numara2 numara.dat
AreaRetention Time
Figure C4: 57°C; 0.75% NaOH; 18.5 min
Minutes0 2 4 6 8 10 12 14
mA
U
0
50
100
150
200
mA
U
0
50
100
150
2002: 436 nm, 8 nm3 numara3 numara.dat
AreaRetention Time
Figure C5: 57°C; 1.00% NaOH; 14.5 min
73

Minutes
0 2 4 6 8 10 12 14
mA
U
0
50
100
150
200
250
mA
U
0
50
100
150
200
2502: 436 nm, 8 nm4 numara4 numara.dat
AreaRetention Time
Figure C6: 67°C; 0.25% NaOH; 22 min.
Minutes0 2 4 6 8 10 12 14
mA
U
0
100
200
300
400
500
mA
U
0
100
200
300
400
500
2: 436 nm, 8 nm5 numara5 numara.dat
AreaRetention Time
Figure C7: 67°C; 0.50% NaOH; 17.5 min.
Minutes
0 2 4 6 8 10 12 14
mA
U
0
100
200
300
400
mA
U
0
100
200
300
4002: 436 nm, 8 nm6 numara6 numara.dat
AreaRetention Time
Figure C8: 67°C; 0.75% NaOH; 15 min.
74

Minutes
0 2 4 6 8 10 12 14
mA
U
0
50
100
150
200
250
300
mA
U
0
50
100
150
200
250
3002: 436 nm, 8 nm7 numara7 numara.dat
AreaRetention Time
Figure C9: 67°C; 1.00% NaOH; 11.5 min.
Minutes0 2 4 6 8 10 12 14
mA
U
0
50
100
150
200
250
mA
U
0
50
100
150
200
2502: 436 nm, 8 nm8 numara8 numara.dat
AreaRetention Time
Figure C10: 77°C; 0.25% NaOH; 18 min.
Minutes
0 2 4 6 8 10 12 14
mA
U
0
500
1000
1500
2000
mA
U
0
500
1000
1500
20002: 436 nm, 8 nm9 numara9 numara.dat
AreaRetention Time
Figure C11: 77°C; 0.50% NaOH; 14 min.
75

Minutes
0 2 4 6 8 10 12 14
mA
U
0
200
400
600
800
mA
U
0
200
400
600
8002: 436 nm, 8 nm11 numara11 numara.dat
AreaRetention Time
Figure C12: 77°C; 1.00% NaOH; 9 min.
Minutes0 2 4 6 8 10 12 14
mA
U
0
20
40
60
80
100
mA
U
0
20
40
60
80
1002: 436 nm, 8 nm12 numara12 numara.dat
AreaRetention Time
Figure C13: 87°C; 0.25% NaOH; 17 min.
Minutes0 2 4 6 8 10 12 14
mA
U
0
50
100
150
200
250
mA
U
0
50
100
150
200
2502: 436 nm, 8 nm13 numara13 numara.dat
AreaRetention Time
Figure C14: 87°C; 0.50% NaOH; 12 min.
76

Minutes0 2 4 6 8 10 12 14
mA
U
0
50
100
150
200
mA
U
0
50
100
150
2002: 436 nm, 8 nm14 numara14 numara.dat
AreaRetention Time
Figure C15: 87°C; 0.75% NaOH; 10 min.
Minutes
0 2 4 6 8 10 12 14
mA
U
0
200
400
600
800
1000
1200
1400
mA
U0
200
400
600
800
1000
1200
1400
2: 436 nm, 8 nm15 numara15 numara.dat
AreaRetention Time
Figure C16: 87°C; 1.00% NaOH; 5 min.
77

Steam Peeling
Minutes0 2 4 6 8 10 12 14
mA
U
0
100
200
300
400
500
600
mA
U
0
100
200
300
400
500
6002: 436 nm, 8 nm16 numara16 numara.dat
AreaRetention Time
Figure C17: 107°C; 130.7kPa; 8.5 min.
78

Minutes
0.0 2.5 5.0 7.5 10.0 12.5 15.0 17.5 20.0 22.5 25.0 27.5 30.0
mA
U
0
200
400
600
800
1000
mA
U
0
200
400
600
800
1000
1: 436 nm, 8 nmStdbetakaroten(1000ppm)Stdbetakaroten(1000ppm).dat
AreaRetention Time
Figure C18: β-Carotene Standard Chromatogram (1000 ppm)
Figure C19: Absorption spectrum of β-Carotene
79

APPENDIX D
COLOR
C1 C1 C1 C1C2 C2 C2 C2
stea
m
stea
m
stea
m
stea
m
0
10
20
30
40
0,25
0,25
0,50
0,50
0,75
0,75
1,00
1,00
conditions
a va
lue
57°C
67°C
77°C
87°C
C1
C2
steam
Figure D1: Variation of a* value comparison with chemical peeling,C1 ,C2 and steam peeling. Each bar represents mean of three replications.
C1 C1 C1 C1
C2 C2 C2 C2
stea
m
stea
m
stea
m
stea
m
0102030405060
57 57 57 67 67 67 67 77 77 77 77 87 87 87 87
conditions
b va
lue
0.25%0.50%0.75%1.00%C1C2steam
Figure D2: Variation of b* value comparison with chemical peeling,C1 ,C2 and steam peeling. Each bar represents mean of three replications.
80

APPENDIX E
Table E1.Full Nutritional Analysis
Name Unit Amount Male%RDA
Female%RDA
Food energy KCal 30.960 1.1% 1.4%Protein Gms 0.742 1.2% 1.5%Total lipid (fat) Gms 0.137 0.1% 0.2%Carbohydrate, by diff. Gms 7.301 1.6% 2.2%Total saturated fat Gms 0.022 0.1% 0.1%Total monounsaturated fat Gms 0.006 Total polyunsaturated fat Gms 0.055 Cholesterol Mg 0.000 0.0% 0.0%Sodium Mg 25.200 5.0% 5.0%Total dietary fiber Gms 2.160 8.6% 8.6%Vitamin A Re 2025.360 202.5% 253.2%Vitamin A IU 20252.880 Ascorbic acid Mg 6.696 11.2% 11.2%Thiamin Mg 0.070 4.7% 6.3%Riboflavin Mg 0.042 2.5% 3.3%Niacin Mg 0.668 3.5% 4.5%Vitamin B6 Mg 0.106 5.3% 6.6%Vitamin B12 Mcg 0.000 0.0% 0.0%Folacin Mcg 10.080 5.0% 5.6%Potassium Mg 232.560 11.6% 11.6%Calcium Mg 19.440 2.4% 2.4%Phosphorus Mg 31.680 4.0% 4.0%Magnesium Mg 10.800 3.1% 3.9%Iron Mg 0.360 3.6% 2.4%Zinc Mg 0.144 1.0% 1.2%Pantothenic acid Mg 0.142 2.8% 2.8%Copper Mg 0.034 1.7% 1.7%Manganese Mg 0.102 2.9% 2.9%Ash Gms 0.626 Water Gms 63.209 Food energy KJ 130.320 Lauric acid (12:0) Gms 0.001 Myristic acid (14:0) Gms 0.001 Palmitic acid (16:0) Gms 0.017 Stearic acid (18:0) Gms 0.001 Palmitoleic acid(16:1) Gms 0.001
81

Oleic acid (18:1) Gms 0.004 Linoleic acid (18:2/n6) Gms 0.048 0.8% 1.0%Linolenic acid(18:3/n3) Gms 0.007 0.4% 0.6%Phytosterols Mg 8.640 Histidine Gms 0.012 1.2% 1.5%Isoleucine Gms 0.030 3.7% 4.7%Leucine Gms 0.031 2.8% 3.5%Lysine Gms 0.029 3.0% 3.8%Methionine Gms 0.005 Cystine Gms 0.006 Methionine+Cystine Gms 0.011 1.0% 1.3%Phenylalanine Gms 0.023 Tyrosine Gms 0.014 Phenylalanine+Tyrosine Gms 0.037 3.4% 4.3%Threonine Gms 0.027 5.0% 3.1%Tryptophan Gms 0.008 2.8% 3.6%Valine Gms 0.032 4.0% 5.0%Arginine Gms 0.031 Alanine Gms 0.042 Aspartic acid Gms 0.099 Glutamic acid Gms 0.145 Glycine Gms 0.022 Serine Gms 0.025
82

Recommended dietary allowances:
Vitamin A is the name for a group of compounds which have the biological activity of retinol. Vitamin A is measured in retinol equivalents (RE) which allows the different forms of vitamin A to be compared. One retinol equivalent equals 1 mcg of retinol or 6 mcg of beta carotene. Vitamin A is also measured in international units (IU) with 1 mcg RE equivalent to 3.33 IU.
Data source: USDA Nutrient Values Web Site
Figure E1. β-Carotene
Figure E2. Vitamin A
83

APPENDIX F
STATISTICAL ANALYSIS
General Linear Model: TSS versus Temperature, Concentration
Factor Type Levels ValuesTemperature fixed 4 57, 67, 77, 87Concentration fixed 4 0.25, 0.50, 0.75, 1.00
Analysis of Variance for TSS, using Adjusted SS for Tests
Source DF Seq SS Adj SS Adj MS F PTemperature 3 1.5939 1.5495 0.5165 1.73 0.177Concentration 3 1.3962 1.3962 0.4654 1.56 0.215Error 38 11.3419 11.3419 0.2985Total 44 14.3320
S = 0.546324 R-Sq = 20.86% R-Sq(adj) = 8.37%
Regression Analysis: TSS versus Temperature-Concentration-Time
Predictor Coef SE Coef T PConstant 8.8586 0.8168 10.84 0.000Temperature -0.008260 0.005739 -1.44 0.178Concentration -0.4963 0.2476 -2.00 0.070Time 0.01284 0.01703 0.75 0.467
S = 0.06536 R-Sq = 93.5 %
Analysis of Variance
Source DF SS MS F PRegression 3 0.67701 0.22567 52.82 0.00
0Residual Error 11 0.04699 0.00427 Total 14 0.72400
The regression equation is:
TSS = 8.86 - 0.00826 T- 0.496 C+ 0.0128 t
84

General Linear Model: Pectin versus Temperature, Concentration
Factor Type Levels ValuesTemperature fixed 4 57, 67, 77, 87Concentration fixed 4 0.25, 0.50, 0.75, 1.00
Analysis of Variance for Pectin, using Adjusted SS for Tests
Source DF Seq SS Adj SS Adj MS F PTemperature 3 9.68 11.99 4.00 0.16 0.925Concentration 3 67.85 67.85 22.62 0.88 0.467Error 23 592.27 592.27 25.75Total 29 669.79
S = 5.07452 R-Sq = 11.57% R-Sq(adj) = 0.00%
Regression Analysis: Pectin versus Temperature, Concentration, Time
Predictor Coef SE Coef T PConstant 108.82 11.52 9.44 0.000Temperature -0.28321 0.08097 -3.50 0.005Concentration -6.451 3.494 -1.85 0.092Time -0.8315 0.2403 -3.46 0.005
S = 0.9221 R-Sq = 81.6%
Analysis of Variance
Source DF SS MS F PRegression 3 41.614 13.871 16.31 0.00
0Residual Error 11 9.353 0.850 Total 14 50.967
85

General Linear Model: L, a, b versus Temperature, Concentration
Factor Type Levels ValuesTemperature fixed 4 57, 67, 77, 87Concentration fixed 4 0.25, 0.50, 0.75, 1.00
Analysis of Variance for L, using Adjusted SS for Tests
Source DF Seq SS Adj SS Adj MS F PTemperature 3 254.407 191.639 63.880 21.88 0.000Concentration 3 50.366 50.366 16.789 5.75 0.001Error 83 242.370 242.370 2.920Total 89 547.143
S = 1.70884 R-Sq = 55.70% R-Sq(adj) = 52.50%
Analysis of Variance for a, using Adjusted SS for Tests
Source DF Seq SS Adj SS Adj MS F PTemperature 3 483.45 382.29 127.43 29.72 0.000Concentration 3 135.47 135.47 45.16 10.53 0.000Error 83 355.92 355.92 4.29Total 89 974.83
S = 2.07079 R-Sq = 63.49% R-Sq(adj) = 60.85%
Analysis of Variance for b, using Adjusted SS for Tests
Source DF Seq SS Adj SS Adj MS F PTemperature 3 64.98 29.60 9.87 0.82 0.488Concentration 3 353.92 353.92 117.97 9.77 0.000Error 83 1002.27 1002.27 12.08Total 89 1421.17
S = 3.47499 R-Sq = 29.48% R-Sq(adj) = 24.38%
Tukey Simultaneous TestsResponse Variable L
All Pairwise Comparisons among Levels of Temperature
Temperature = 57 subtracted from:
Temperature Diff. of Means SE of Diff T-Value Adj. P-Value67 -3.890 0.5454 -7.133 0.000077 -3.236 0.5454 -5.933 0.000087 -3.952 0.5454 -7.247 0.0000
86

Temperature = 67 subtracted from:
Temperature Diff. of Means SE of Diff T-Value Adj. P-Value77 0.65417 0.4933 1.3261 0.549187 -0.06250 0.4933 -0.1267 0.9993
Temperature = 77 subtracted from:
Temperature Diff. of Means SE of Diff T-Value Adj. P-Value87 -0.7167 0.4933 -1.453 0.4705
Tukey Simultaneous TestsResponse Variable L
All Pairwise Comparisons among Levels of Concentration
Concentration = 0.25 subtracted from:
Concentration Diff. of Means SE of Diff T-Value Adj. P-Value0.50 2.064 0.5454 3.785 0.00160.75 1.352 0.5454 2.479 0.07081.00 1.956 0.5454 3.587 0.0031
Concentration = 0.50 subtracted from:
Concentration Diff. of Means SE of Diff T-Value Adj. P-Value0.75 -0.7125 0.4933 -1.444 0.47571.00 -0.1083 0.4933 -0.220 0.9962
Concentration = 0.75 subtracted from:
Concentration Diff. of Means SE of Diff T-Value Adj. P-Value1.00 0.6042 0.4933 1.225 0.6130
Tukey Simultaneous TestsResponse Variable a
All Pairwise Comparisons among Levels of Temperature
Temperature = 57 subtracted from:
Temperature Diff. of Means SE of Diff T-Value Adj. P-Value67 -3.275 0.6609 -4.956 0.000077 -4.525 0.6609 -6.847 0.000087 -6.067 0.6609 -9.180 0.0000
87

Temperature = 67 subtracted from:
Temperature Diff. of Means SE of Diff T-Value Adj. P-Value77 -1.250 0.5978 -2.091 0.164587 -2.792 0.5978 -4.670 0.0001
Temperature = 77 subtracted from:
Temperature Diff. of Means SE of Diff T-Value Adj. P-Value87 -1.542 0.5978 -2.579 0.0556
Tukey Simultaneous TestsResponse Variable a
All Pairwise Comparisons among Levels of Concentration
Concentration = 0.25 subtracted from:
Concentration Diff. of Means SE of Diff T-Value Adj. P-Value0.50 2.238 0.6609 3.386 0.00590.75 3.500 0.6609 5.296 0.00001.00 1.213 0.6609 1.835 0.2646
Concentration = 0.50 subtracted from:
Concentration Diff. of Means SE of Diff T-Value Adj. P-Value0.75 1.263 0.5978 2.112 0.15781.00 -1.025 0.5978 -1.715 0.3227
Concentration = 0.75 subtracted from:
Concentration Diff. of Means SE of Diff T-Value Adj. P-Value1.00 -2.288 0.5978 -3.827 0.0014
Tukey Simultaneous TestsResponse Variable b
All Pairwise Comparisons among Levels of TemperatureTemperature = 57 subtracted from:
Temperature Diff. of Means SE of Diff T-Value Adj. P-Value67 -0.844 1.109 -0.761 0.871777 -0.206 1.109 -0.186 0.997787 -1.494 1.109 -1.347 0.5359
88

Temperature = 67 subtracted from:
Temperature Diff. of Means SE of Diff T-Value Adj. P-Value77 0.6375 1.003 0.6355 0.920387 -0.6500 1.003 -0.6480 0.9160
Temperature = 77 subtracted from:
Temperature Diff. of Means SE of Diff T-Value Adj. P-Value87 -1.287 1.003 -1.283 0.5760
Tukey Simultaneous TestsResponse Variable b
All Pairwise Comparisons among Levels of Concentration
Concentration = 0.25 subtracted from:
Concentration Diff. of Means SE of Diff T-Value Adj. P-Value0.50 5.710 1.109 5.149 0.00000.75 3.364 1.109 3.034 0.01671.00 1.981 1.109 1.786 0.2872
Concentration = 0.50 subtracted from:
Concentration Diff. of Means SE of Diff T-Value Adj. P-Value0.75 -2.346 1.103 -2.338 0.09761.00 -3.729 1.103 -3.717 0.0020
Concentration = 0.75 subtracted from:
Concentration Diff. of Means SE of Diff T-Value Adj. P-Value1.00 -1.383 1.103 -1.379 0.5160
89

General Linear Model: DE versus Temperature, Concentration
Factor Type Levels ValuesTemperature fixed 4 57, 67, 77, 87Concentration fixed 4 0.25, 0.50, 0.75, 1.00
Analysis of Variance for DE, using Adjusted SS for Tests
Source DF Seq SS Adj SS Adj MS F PTemperature 3 27.795 23.303 7.768 2.01 0.119Concentration 3 139.445 139.445 46.482 12.02 0.000Error 83 320.835 320.835 3.865Total 89 488.074
S = 1.96608 R-Sq = 34.27% R-Sq(adj) = 29.51%
Tukey Simultaneous TestsResponse Variable DE
All Pairwise Comparisons among Levels of Temperature
Temperature = 57 subtracted from:
Temperature Diff. of Means SE of Diff T-Value Adj. P-Value67 0.5182 0.6275 0.826 0.842177 0.0694 0.6275 0.111 0.999587 -0.8460 0.6275 -1.348 0.5352
Temperature = 67 subtracted from:
Temperature Diff. of Means SE of Diff T-Value Adj. P-Value77 -0.449 0.5676 -0.791 0.858587 -1.364 0.5676 -2.404 0.0843
Temperature = 77 subtracted from:
Temperature Diff. of Means SE of Diff T-Value Adj. P-Value87 -0.9154 0.5676 -1.613 0.3771
90

Tukey Simultaneous TestsResponse Variable DE
All Pairwise Comparisons among Levels of Concentration
Concentration = 0.25 subtracted from:
Concentration Diff. of Means SE of Diff T-Value Adj. P-Value0.50 2.9294 0.6275 4.6687 0.00010.75 2.4565 0.6275 3.9150 0.00111.00 0.3574 0.6275 0.5695 0.9409
Concentration = 0.50 subtracted from:
Concentration Diff. of Means SE of Diff T-Value Adj. P-Value0.75 -0.473 0.5676 -0.833 0.83851.00 -2.572 0.5676 -4.532 0.0001
Concentration = 0.75 subtracted from:
Concentration Diff. of Means SE of Diff T-Value Adj. P-Value1.00 -2.099 0.5676 -3.699 0.0022
91

REGRESSION ANALYSIS
Peeling Time versus Temperature, Concentration
Predictor Coef SE Coef T PConstant 47.365 2.172 21.81 0.000Concentration -14.063 1.066 -13.19 0.000Temperature -0.32408 0.02666 -12.16 0.000
S = 1.108 R-Sq = 95.9%
Analysis of Variance
Source DF SS MS F PRegression 2 347.71 173.85 141.66 0.00
0Residual Error 12 14.73 1.23 Total 14 362.43
9080
0.2
5
0.3Temperature70
10
0.4
15
0.5
20
0.6 0.7 0.8
FITS1
600.9 1.0Concentration
Figure F1. Temperature- concentration-peeling time(fitted time for regression equation) relations for chemical peeling of carrots.
92

Peeling Yield versus Concentration, Temperature
Predictor Coef SE Coef T PConstant 56.282 4.607 12.22 0.000Concentration 10.551 2.262 4.66 0.001Temperature 0.23237 0.05655 4.11 0.001
S = 2.350 R-Sq = 73.9%
Analysis of Variance
Source DF SS MS F PRegression 2 188.057 94.029 17.03 0.00
0Residual Error 12 66.275 5.523 Total 14 254.333
93