mathematical modeling as a new approach for improving the ... · current therapy 3.3. novel...
TRANSCRIPT

To appear in Preclinical Development Handbook,Shayne Gad Ed., John Wiley and Sons, USA.
1
Mathematical Modeling as a New Approach for Improving the
Efficacy/Toxicity Profile of Drugs: The Thrombocytopenia Case
Study
Zvia Agur1,2, Moran Elishmereni1, Yuri Kogan1, Yuri Kheifetz1, Irit Ziv2,
Meir Shoham2, and Vladimir Vainstein1,2
1Institute for Medical Biomathematics (IMBM), Israel 2Optimata Ltd., Israel
Contributors information:1Institute for Medical Biomathematics (IMBM)
PO Box 282, 10 HaTe’ena St., Bene-Ataroth 60991, Israel.
Phone: 972-3-9733075; Fax: 972-3-9733410;
E-mail: [email protected]
2Optimata Ltd.,
Abba Hillel St., no. 7
Ramat-Gan 52522 , Israel;
Phone: 972-3-7519226; Fax: 972-37519229;
E-mail: [email protected]

To appear in Preclinical Development Handbook,Shayne Gad Ed., John Wiley and Sons, USA.
2
Table of Contents:
1. Introduction
1.1. Biomathematics and its use for rationalizing drug treatment strategies: a short
history
1.2. Aims of this chapter
2. Thrombopoiesis
2.1. Biology
2.2. Mathematical modeling
3. Thrombocytopenia
3.1. Pathology
3.2. Current therapy
3.3. Novel cytokine therapy
4. Modeling drug effects on thrombopoiesis
4.1. Toxicity modeling: IL-11
4.2. Efficacy modeling: Thrombopoietin (TPO)
4.3. Modeling combination therapy: Chemotherapy and TPO support
5. Using the validated model for improving drug efficacy/toxicity profile
5.1. Model validation using retrospective human study results: IL-11 and TPO
5.2. Model validation in prospective animal trials: TPO applied to the Virtual
Mouse and Virtual Monkey
5.3. Predicting the optimal toxicity/efficacy ratio in monkeys: TPO
6. Using the thrombopoiesis model for predicting an unknown animal toxicity
mechanism
7. Transition to Phase I
8. Summary
9. References

To appear in Preclinical Development Handbook,Shayne Gad Ed., John Wiley and Sons, USA.
3
1. Introduction
Despite recent innovations, many life-threatening diseases still lack effective
treatments. In March 2004, the Food and Drug Administration (FDA) agency
issued a major report that identifies both the problems and the potential solutions
for bringing more breakthroughs in the medical science to patients, as quickly
and efficiently as possible. The report looks at the development processes for
drugs, biologics, and medical devices, and calls for a joint effort of industry,
academic researchers, product developers, patient groups, and the FDA to
identify key problems and to develop solutions: “… A new product development
toolkit -- containing powerful new scientific and technical methods such as
computer-based predictive models... is urgently needed to improve predictability
and efficiency along the critical path from laboratory concept to commercial
product.” [24]. The role of the present chapter is to demonstrate how the science
of biomathematics can be harnessed for improving the solution of safety issues
in the critical path of drug development, in general, and in the transition from the
preclinical phases to Phase I, in particular.
1.1 Biomathematics and its use for rationalizing drug treatment
strategies: a short history
A new synthesis of ecology and 'hard' biology, called biomathematics, emerged
in the second half of the 20th century in the scientific community. Its role was to
rationalize complex biological processes. Thus, in contrast to experimental
biologists, who work at the microscopic cellular level and develop analytic tools
that are analogous to the stills camera in photography, biomathematicians
develop formulae, which effectively animate these shots, allowing us to
understand the dynamics of the complex process we are investigating.
Biomathematics has enabled the development of a range of new theories dealing

To appear in Preclinical Development Handbook,Shayne Gad Ed., John Wiley and Sons, USA.
4
with significant problems of disease progression and control, hitherto beyond the
reach of 'snap shot', experimental biology.
But in spite of these efforts, until recently the biomedical research community
was unanimous in viewing biological systems as too complex to enable accurate
retrieval by mathematical models. This declarable mistrust in the power of
biomathematics left the biomedical sciences lagging behind other sciences, as an
immature sequel of experimental observations. In recent years, the somewhat
disillusioned post-genomic era has rediscovered biological complexity, renaming
it “system biology”. It seems that, finally, biomathematicians are becoming
legitimate and almost beloved children of the scientific community.
In the 1980’s, notions from population dynamics have been used by Agur and
colleagues to develop relatively simple formulae describing the growth patterns
of interwoven populations of healthy and cancerous cells, formulae which have
resulted in new drug regimens where the toxicity of chemotherapy has been
significantly reduced [4, 6]. The power of mathematics here was to prove the
universality of the theoretical results and, therefore, to justify and encourage
collaboration with cancer research experimentalists. The latter not only verified
the theory in the laboratory, but also pinpointed the feasibility and strength of the
theory-to-lab arrow [8, 54].
In the above mentioned mathematical models, populations are subjected to a loss
process due to randomly occurring environmental disturbances, which are
effective only during a portion of the life-cycle. The models are studied over a
large range of time-scales of the environmental change and for different degrees
of variance in the system parameters. Analysis shows that the expected survival
time of the population has a strong non-monotonic dependence on the relation
between the duration of the disturbance-resistant life-stages and the periodicity
of the environmental disturbance. This effect, termed "resonance phenomenon",
was found at integer and fractional multiple of this relation. Interestingly,

To appear in Preclinical Development Handbook,Shayne Gad Ed., John Wiley and Sons, USA.
5
persistence in all harshly-varying environments is shown to depend on the
degree of resonance in the environmental and population processes [1-4].
The universality of the resonance phenomenon, and its implication that the
frequency of environmental disturbances determines population growth, seemed
to offer attractive possibilities for the control of the cancer disease. Thus, Agur
and colleagues have shown, both theoretically and experimentally, how the
resonance phenomenon could be employed for choosing cytotoxic drug regimens
that allow discrimination between different target cell populations. More
specifically, it was asserted that one could determine the period of drug pulses,
so as to maximize the elimination of malignant cells and, at the same time, to
minimize the destruction of drug-susceptible host cells.
In the first stage, it was necessary to investigate the generality of the resonance
phenomenon for the dynamics of different host cell populations. To allow
analytical tractability and, hence, parameter-independent conclusions,
deliberately crude mathematical models of the cancer patient were constructed,
making simplified assumptions that both tumor and target host tissues are cells
that vary only in cell-cycle parameters. The spatial arrangement of these cells
was hence ignored. The interest was focused on comparing the overall behavior
of the tumor to that of the host target tissues under different chemotherapy
regimens of cell-cycle-phase-specific drugs, and on finding regimens that are
selective to cancer cells. The conviction was that only a simplified model can
clarify the underlying properties of the biomedical scenario. Model analysis
showed that the resonance phenomenon is valid when considering drug-induced
myelotoxicity and tumor progression. Specifically, the mathematical analysis
suggested that the efficacy/toxicity ratio of cell-cycle phase-specific drugs would
be maximized at an integer or fractional multiple of the mean cycle time of the
host target populations (this being denoted the "Z-method"). This applies either
when mean cancer cell-cycle parameters differ from those of the target host cell

To appear in Preclinical Development Handbook,Shayne Gad Ed., John Wiley and Sons, USA.
6
population, or when those are similar but the variation in the distribution of their
cell-cycle is larger [6, 17, 37].
It seemed mandatory, already at this level of qualitative understanding of the
system, to carefully examine the plausibility of applying the Z-method to cancer
and host cells. To this end, a series of laboratory experiments was launched, first
examining the effect of drug-pulsing rhythm on cell proliferation, in vitro, and
then checking how varying the pulsing rhythm of different drugs will affect
disease progression on the level of the whole organism.
Applying an antimetabolite chemotherapeutic drug, Cytarabine (ara-C), to
lymphoma cells in vitro, it was experimentally shown that when total drug dose
and total treatment duration were kept constant, drug schedules exerting
significantly higher cell growth were those possessing periodicity that was an
integer multiple of the average population cell-cycle time, as evaluated by rates
of DNA synthesis. In equivalent in vivo experiments, mice were treated by short
ara-C pulses, having different distributions of the inter-dosing intervals,
including stochastically determined periodicity. Toxicity was evaluated by
spleen weight, differential peripheral blood measurements, kinetic measurements
of bone marrow cell proliferation (with bromodeoxiuridine labeling and flow
cytometry analysis) and by overall animal survival. Results of these trials proved
the superiority of the Z-method controlling cell proliferation. In particular, it was
shown that when the inter-dosing interval is an exact multiple of the inter-mitotic
time of bone marrow stem and progenitor cells, cell-cycle kinetics are less
affected, myelotoxicity is minimal and survival time of tumor bearing mice is
maximal [6-8, 54].
The above experiments demonstrate that regimens employing a drug period,
which coincides with the inherent periodicity of bone-marrow cells, protect the
bone-marrow rather well, leading to increased life-expectancy of cancer-bearing
mice. In contrast, other regimens, notably those employing intervals that are

To appear in Preclinical Development Handbook,Shayne Gad Ed., John Wiley and Sons, USA.
7
randomly distributed around the same mean periodicity, are extremely toxic. In
general, this work is a proof of the concept that by using a rational drug
scheduling, based on the Z-method, it is feasible to control drug toxicity exerted
onto the bone-marrow of cancer-bearing mice, while at the same time delaying
their tumor progression. This conclusion has been further supported under more
realistic and complex tumor growth models (e.g., [12, 45]) and under
physiologically-based mathematical models of human hematopoiesis (e.g., [62]).
The above described mathematical models added important new insights on drug
treatment strategies, by considering fundamental effects on cellular dynamics.
Yet, to enable mathematical tractability, drug-related characteristics were treated
very simplistically. For this reason, only qualitative conclusions can be drawn
from these model analyses. Now that the proof of concept has been provided, the
models are becoming increasingly instrumental in planning concrete treatment
strategies. To this end, modeling of the underlying pathological and
physiological processes in a patient is wedded with the detailed relevant
pharmacokinetics (PKs) and pharmacodynamics (PDs) (e.g., [10, 62]). By
uniting in one framework the pharmacological properties of the drug with the
dynamic properties of the cells in the target tissues, one obtains an improved
understanding of how the timing of drug administration, the inter-dosing
interval, drug fractionation, and other aspects of treatment scheduling, may
affect the patient. Biomathematics has the power of integrating the vast
biomedical and pharmaceutical knowledge into a concise formal language,
which enables intensive calculations of the outcomes of complex processes.
These calculations, being by far more comprehensive and accurate than any
human intuition can be, justify their use for rational treatment design at any stage
of the critical path, especially when partial preclinical results collected in several
species are to be used for predicting the human response.

To appear in Preclinical Development Handbook,Shayne Gad Ed., John Wiley and Sons, USA.
8
1.2 Aims of this chapter
In this chapter, we will discuss the application of mathematical modeling tools to
elucidate the hematological disorder, thrombocytopenia, in different animal
species, and to accurately describe the efficacy and safety of the
thrombocytopenia alleviating drugs, thrombopoietin and interleukin-11. Model
validation in mice, monkeys and humans, by the use of diverse experimental
information, will be discussed, as well and the use of the animal models for
predicting human safety and for improving patient treatment.
2. Thrombopoiesis
Any mathematical model describing a biological process is based on a verbal
model of the process, that is, on an algorithm concisely describing its essential
physiological “flow”. We devote this section to a brief presentation of the verbal
model of thrombopoiesis, and to the subsequent description of a mathematical
model, constituting the essence of platelet development.
2.1 Biology
Platelets are components of the hematopoietic system, being the nucleus-lacking
derivatives of megakaryocytes (MKs). Platelets function primarily in processes
of thrombus formation and vascular repair, but also have roles in natural
immunity and metastatic tumor biology. Platelet counts in healthy humans
average at 150-400 billion cells per one liter of blood, a homeostasis which is
crucial to maintain. Low counts may lead to severe hemorrhage, renal failure,
and other disorders, while high counts indicate poor prognosis with respect to
cardiovascular diseases and malignancies. Thrombopoiesis, the formation of
blood platelets, has been studied for the last century, though critical advances in
our understanding of the unique processes that accompany it are only of the last
To appear in Preclinical Development Handbook,Shayne Gad Ed., John Wiley and Sons, USA.
9
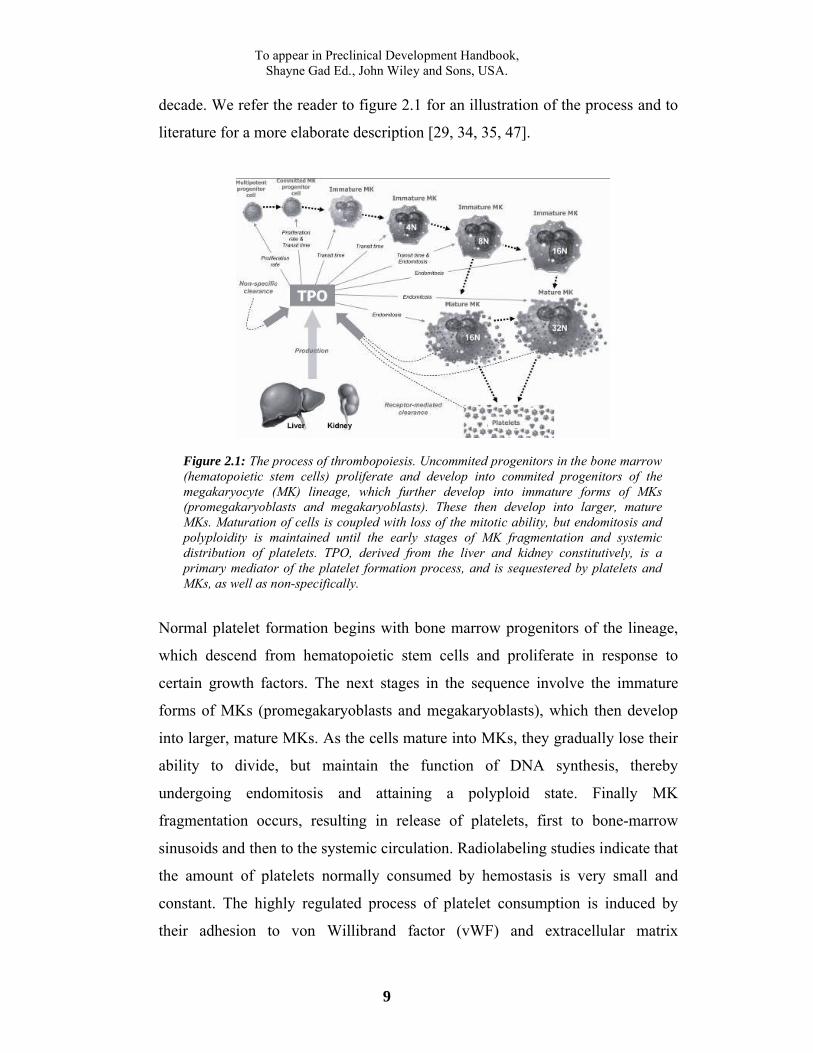
decade. We refer the reader to figure 2.1 for an illustration of the process and to
literature for a more elaborate description [29, 34, 35, 47].
Figure 2.1: The process of thrombopoiesis. Uncommited progenitors in the bone marrow (hematopoietic stem cells) proliferate and develop into commited progenitors of the megakaryocyte (MK) lineage, which further develop into immature forms of MKs (promegakaryoblasts and megakaryoblasts). These then develop into larger, mature MKs. Maturation of cells is coupled with loss of the mitotic ability, but endomitosis and polyploidity is maintained until the early stages of MK fragmentation and systemic distribution of platelets. TPO, derived from the liver and kidney constitutively, is a primary mediator of the platelet formation process, and is sequestered by platelets and MKs, as well as non-specifically.
Normal platelet formation begins with bone marrow progenitors of the lineage,
which descend from hematopoietic stem cells and proliferate in response to
certain growth factors. The next stages in the sequence involve the immature
forms of MKs (promegakaryoblasts and megakaryoblasts), which then develop
into larger, mature MKs. As the cells mature into MKs, they gradually lose their
ability to divide, but maintain the function of DNA synthesis, thereby
undergoing endomitosis and attaining a polyploid state. Finally MK
fragmentation occurs, resulting in release of platelets, first to bone-marrow
sinusoids and then to the systemic circulation. Radiolabeling studies indicate that
the amount of platelets normally consumed by hemostasis is very small and
constant. The highly regulated process of platelet consumption is induced by
their adhesion to von Willibrand factor (vWF) and extracellular matrix

To appear in Preclinical Development Handbook,Shayne Gad Ed., John Wiley and Sons, USA.
10
components of damaged blood vessel wall underlying the endothelium.
Following platelet adhesion, a clot is formed and the vessel wall is recovered.
With a life span of approximately ten days, unconsumed platelets that senesce
are removed by macrophages of the reticuloendothelial system, mostly in the
spleen.
Thrombopoietin (TPO), a glycoprotein produced by the liver and kidney
constitutively and by the bone-marrow upon demand, is characterized as the
primary regulator of platelet formation. Though the focus was set on TPO
already in the late 60's, it was successfully cloned only in 1992. TPO acts in all
stages of thrombopoiesis, its receptors being expressed on each cell type in the
lineage. Interestingly, systemic and bone-marrow levels of TPO are inversely
correlated to platelet numbers: due to high affinity platelet-bearing TPO
receptors, increased amounts of platelets result in high internalization of TPO,
forming successful autoregulation of the thrombopoiesis. It is noted that slightly
less significant cytokines, namely the interleukins 3, 6, 11, and stem cell factor
(SCF), stromal cell-derived factor 1 (SDF-1) and granulocyte macrophage
colony-stimulating factor (GM-CSF), were also identified as modulators in
normal platelet formation, each acting in different developmental phases, and
some acting in synergy with others. Studies indicate that effects of the
surrounding tissue, comprised of fibroblasts, endothelial cells, and macrophages,
are also of capability of augmenting thrombopoiesis, though these environmental
factors are not thought to be critical since platelets are easily produced also in
vitro.
The manipulation of molecular and genetic techniques in the last two decades
has greatly boosted the understanding of biological pathways and mechanisms
involved in platelet formation. Nonetheless, at the current stage, the regulation of
thrombopoiesis, the central molecular components taking part in it, and their
significance for therapeutic intervention in platelet-associated illnesses, are yet to
be clarified.

To appear in Preclinical Development Handbook,Shayne Gad Ed., John Wiley and Sons, USA.
11
2.2 Mathematical modeling
Although the intricacies of thrombopoiesis are far from being fully elucidated,
current knowledge enabled the verbalization, and subsequently the mathematical
formalization of a basic thrombopoiesis-describing model. Schematized in figure
2.2, and elaborated elsewhere, the model divides the entire thrombopoietic
lineage into seventeen compartments. Every compartment, except for the first, is
represented by time-dependent age distribution, where the number of cells is
given as a function of discrete age (time spent in the compartment) and time. The
number of cells in the first compartment is a function of time only. There are six
groups of compartments in the model, in accordance with the above-mentioned
structure of the thrombopoietic lineage. The subdivision of the six groups is as
follows: (a) one compartment of lineage-uncommitted progenitors (UCP), (b)
one compartment of lineage-committed progenitors (CP), (c) six compartments
of endomitotic progenitors (EP), (d) four compartments of developing
progenitors (DP), (e) four compartments of MKs, and (f) one compartment of
blood-circulating platelets.
Figure 2.2: A scheme of the thrombopoiesis mathematical model. The model consists of seventeen compartments which can be clustered in the following six groups: (a) one compartment of lineage-uncommitted stem cell progenitors (UCP), (b) one compartment of lineage-committed progenitors (CP), (c) six compartments of endomitotic progenitors (EP) of ploidies 4N, 8N, 16N, 32N, 64N 128N, (d) four

To appear in Preclinical Development Handbook,Shayne Gad Ed., John Wiley and Sons, USA.
12
compartments of developing progenitors (DP) of ploidies 16N, 32N, 64N 128N, (e) four compartments of megakaryocytes (MKs) of ploidies 16N, 32N, 64N 128N, and (f) one compartment of individual, blood-circulating platelets. Relevant key parameters included in the kinetic calculations of the different compartments: amplification rate; flow-on fraction (flowon); transit time; and rate of platelet release. The arrows indicate the direction of inter-compartmental cell flow.
The first compartment, UCP, refers to all bone marrow hematopoietic progenitor
cells that can differentiate into more than one line (e.g., pluripotent stem cells,
CFU-GEMM, etc). We assume one homogeneous UCP population, as its
division into various sub-populations is not feasible, since kinetic data regarding
the various sub-populations of the UCP compartment (i.e. rates of proliferation,
maturation and self-renewal) is rather scarce. In our model, cells of this
compartment proliferate at a certain rate (αUCP) and differentiate into MKs or
other precursors. Based on previous studies showing that the probabilities of
stem cell differentiation into any given hematopoietic lineage are constant, it was
assumed that a fixed proportion of mature uncommitted progenitor cells flows
into the thrombopoietic lineage (φUCP). Apoptotic cell death may have a
significant effect on cell numbers in the proliferating compartments. Thus, we
included its effect together with the effect of cell proliferation into the total
amplification of cell number in a specific compartment. As currently no
information is available concerning apoptosis in the non-proliferating MK
compartments, this issue was disregarded in these compartments.
The CP compartment stands for an age distribution of progenitor cells already
committed to the thrombopoietic lineage, but still capable of proliferation. The
compartment is characterized by a transit time (τCP) and a number of mitoses
(Nm). The latter represents the average number of possible cell divisions at that
stage. This number may be non-integer, considering that certain cells can be
quiescent and undergo fewer mitoses than others. Cells leaving CP enter the first
of the six EP compartments, which comprises cells that have lost proliferation
ability and yet are not sufficiently mature to release platelets. Thus, this
subgroup of compartments, namely EP4, EP8, EP16, EP32, EP64 and EP128,
are formed according to the biologically-known sequence of cells of the MK

To appear in Preclinical Development Handbook,Shayne Gad Ed., John Wiley and Sons, USA.
13
lineage bearing ploidy of 4N, 8N, 16N, 32N, 64N and 128N, respectively. These
endomitotic precursors cannot divide, but continue endomitosis. The cells that
enter the EP4 compartment are of ploidy 2N, at the exit they have ploidy 4N, and
so on for subsequent EP compartments. It is assumed that MKs can release
platelets only after reaching the 16N-ploidy phase. Hence to arrive at platelet
production in our model, the EP16 compartment must be entered. After cells
spend their designated transit time (τEP) in an EP compartment, they can move to
the next EP compartment. Fractions of cells that continue endomitosis after
moving through EP16, EP32 or EP64 are designated φEP16, φEP32 and φEP64,
respectively, where in normal conditions φEP64 = 0.
Alternatively, cells at the EP16, EP32 or EP64 stage may stop the endomitotic
process by entering the relevant DP compartment, which is represented by four
subgroups of cells. DP cells of 16N, 32N, 64N and 128N ploidy increase their
cytoplasmic contents prior to platelet production. Cells that have stopped
endomitosis after exiting EP16 compartment enter into DP16; cells that have
stopped endomitosis after exiting EP32 compartment enter into DP32, and so
forth. After spending a certain amount of time (τDP) in the DP compartment, cells
pass to the corresponding MK compartment. The four sub-compartments of this
stage signify cells capable of releasing platelets. MK16 compartment receives
cells exiting from DP16, MK32 receives cell exiting from DP32, and so on. As
in previous compartments, here too the cells are distributed over age (time spent
in the compartment), yet there is no predefined transit time. Instead, the new
cells entering MK are assumed to have some initial releasing capacity, indicating
the number of potential platelets, or total platelets volume, to be released until
the cell is exhausted. This capacity is assumed to be larger for cells of larger
ploidy. Cells release platelets continuously, and their releasing capacity is
consumed until it drops to zero, there upon disappearing from the compartment.
The last compartment, PL, represents platelet counts distributed by age (time
spent in blood after the release). Distribution of mean platelet volume (MPV) is

To appear in Preclinical Development Handbook,Shayne Gad Ed., John Wiley and Sons, USA.
14
also computed in order to allow calculations of platelets degradation. The
platelets are readily consumed by the body in an age-independent manner, and in
terms of volume (platelets number multiplied by MPV). There is also a maximal
life span for old platelets, so that all non-consumed platelets disappear upon
reaching a maximal age (denoted by τPL). New platelets appear at every time
step, as released by MK cells. This release is also described in terms of volume,
and at every time step the amount and MPV are evaluated for the new platelets,
taking into account the relative contributions of MK cells of different ploidies.
The formal description of the cellular compartments is supplemented by the
model for the endogenous TPO, which regulates the dynamics of the process. A
one-compartment PK model for TPO, with a constant production and a linear
non-specific clearance, is applied. In addition, there is an alternative, specific
clearance of TPO, achieved through the consumption by the cells (receptor
binding and internalization). To include this in the model, distributions of
receptors per cell in all the line-committed compartments (CP and the groups
that follow) are incorporated. Formulae are constructed for receptor numbers
distributed over cell age. Receptors, constantly produced by the cells, excluding
platelets that have no nucleus, bind free TPO and are internalized. To reflect the
non-specific clearance of TPO, Michaelis-Menten behavior is assumed for TPO-
receptor kinetics.
The major stabilizing feedback in the model is exerted via the effects of TPO on
the cells throughout the lineage. Kinetic parameters of the model’s
compartments are functions of TPO concentrations; In the UCP compartment,
the amplification rate is an increasing function of the TPO concentration.
Similarly, the number of mitoses in the CP compartment is an increasing
function of TPO. In contrast, the transit times in CP, EP, and DP, and the EP
flow-on (fraction of cells that continue endomitosis) are decreasing functions of
the TPO concentration. Finally, the MPV of released platelets (and
consequentially, the loss of cell volume) is an increasing function of the TPO

To appear in Preclinical Development Handbook,Shayne Gad Ed., John Wiley and Sons, USA.
15
concentration in the MK compartments. For all the dependencies listed above,
sigmoid functions with saturation for large values of TPO concentration are
used. In addition to this feedback, a TPO-independent feedback on cell
proliferation in the model, or a “crowding effect”, is included as well. The
amplification rate in UCP and number of mitoses in CP are decreasing functions
of cell numbers in these compartments, respectively. This represents internal
regulation of cell proliferation in these stages. Such functions are also assumed
to have a sigmoid form.
The model is mathematically formalized according to the above description,
using discrete difference equations. The variables of the model (e.g. cell
numbers) are represented as functions of discrete time-points, with a certain step
t. The set of the model equations describes the recursive calculation of the
system state for the current time point, using the state of the system at previous
time points. For the specific clearance model, steady-state approximations are
used, as these processes are on a much faster time-scale than all the rest of the
model. The model is simulated using a C++ code, and its parameters are
estimated either directly from experimental measurements, or by fitting the
model to the published experimental data. The validation of the model is further
described in section 5.
3. Thrombocytopenia
Setting the essential rules for depicting thrombopoiesis, as explained in section
2, it is possible to evaluate not only the homeostatic behavior of the system, but
also its irregularities. Diversion from normal steady state thrombopoiesis can
arise from various reasons, and can have several physiological consequences. In
this section, we will discuss some of the main mechanisms leading to low
platelet count, termed thrombocytopenia (TP). Both current and future
therapeutic avenues will be illustrated.

To appear in Preclinical Development Handbook,Shayne Gad Ed., John Wiley and Sons, USA.
16
3.1 Pathophysiology
The concise summary of TP pathophysiology, presented in this section, is based
on extensive reviews of this pathology in the current hematology literature,
notably [16, 29, 41]. The clinical significance of TP, characterized by a blood
platelet count of less than 150,000 cells per microliter, stems from the major role
of platelets in the process of normal hemostasis. Low platelet counts lead to
diminished ability of hemostasis, and consequently, increased bleeding
propensity. Yet there are important exceptions to this rule. Firstly, clinically
significant bleeding occurs regularly only when the amount of platelets
decreases beyond 10-20,000/µL. Secondly, exact clinical manifestation of this
disorder depends on the underlying pathophysiological mechanisms: While TP
induced by low platelet production leads to increased risk of bleeding, TP caused
by excessive platelet consumption may result in an elevated risk of
thromboembolism.
TP can be caused by one, or more, of the following mechanisms (elaborated in
the following section): (a) decreased platelet production, (b) increased
sequestration of platelets, or (c) their accelerated destruction. TP induced by the
first mechanism, impaired production of platelets, accompanies a variety of bone
marrow pathologies. Congenital hereditary decreased production-TP, one of
these cases, is very rare. It can be caused by malfunctioning TPO receptor
signaling (e.g., amegakaryocytic TP) or by impaired MK fragmentation into
mature platelets. The more common syndrome is acquired decreased production
TP. This form of TP can be a result of pathological bone marrow infiltration in
hematopoietic malignancies (leukemias and lymphomas) or in massive
metastases of extramedullary solid tumors. Alternatively, this could occur in
myelodysplastic syndromes and vitamin B12 deficiency, when intrinsic
maturation defects arise in the early hematopoietic progenitors, with
involvement of 1-3 hematopoietic lines. Extrinsic inhibitors of hematopoietic
progenitor proliferation, such as (a) cytotoxic drugs (anticancer chemotherapy),

To appear in Preclinical Development Handbook,Shayne Gad Ed., John Wiley and Sons, USA.
17
(b) circulating auto-antibodies to MKs (immune thrombocytopenic purpura,
systemic lupus erythematosus, etc.), (c) proinflammatory cytokines (sepsis), or
(d) various viral infections (EBV, CMV, HIV, etc.), can induce this TP form as
wells.
Increased sequestration-TP, the second mechanism, is a common finding in
splenomegaly of any cause. A frequent consequence of splenic enlargement is
increased pressure in the portal vein, which causes draining of blood from the
spleen into the liver. This syndrome, referred to as portal hypertension, is present
in a variety of chronic liver diseases and in cases of portal vein thrombosis due
to hypercoagulation states. In portal hypertension, increased sequestration is
often the only cause of TP. Other diseases with splenomegaly generally produce
TP of a combined etiology. For example, splenomegaly is associated with
conditions of leukemia and lymphoma, in which bone marrow infiltration results
in decreased platelet production. Similar combinations of TP mechanisms appear
in several infectious disorders (e.g. brucellosis and visceral leishmaniasis) and
inflammatory diseases (e.g. Felty’s syndrome and systemic juvenile rheumatoid
arthritis).
Pathologically accelerated platelet destruction (the third mechanism of TP) can
be induced by either increased consumption, or by physical factors. Physical
platelet destruction occurs upon increased blood shear stress near valvular and
intravascular prosthetic devices. There are varying disorders of increased platelet
consumption by pathological uncontrolled coagulation. Thrombotic
thrombocytopenic purpura (TTP) and hemolytic uremic syndrome (HUS) are
associated with thrombosis, rather than bleeding, despite low platelet count.
Recent progress in TTP research reveals that the underlying pathology involves
decreased or absent function of a protease known as a disintegrin and
metalloproteinase with a thrombospondin type 1 motif, member 13
(ADAMTS13), responsible for specific cleavage of vWF. As a consequence,
large multimers of vWF are formed, and they initiate bouts of platelet adhesion

To appear in Preclinical Development Handbook,Shayne Gad Ed., John Wiley and Sons, USA.
18
and activation. Conversely, pathogenesis of HUS is incompletely understood.
Since this disorder appears typically after certain bacterial infection, it is
assumed that cross-reactive antibodies are responsible for platelet activation in
this syndrome. Disseminated intravascular coagulation (DIC), distinct from the
latter two disorders by its simultaneous induction of both thrombosis and
bleeding, is a common feature of several severe illnesses including
overwhelming sepsis, poisoning due to snake bites, amniotic fluid embolism and
fat embolism. The pathogenesis of DIC includes uncontrolled activation of
intravascular coagulation pathways, leading to increased platelet consumption.
Accelerated destruction-TP can also be attributed to immunological disorders.
The most recognized disorder of this type is immune (idiopathic)
thrombocytopenic purpura (ITP). The underlying pathology consists of
formation of auto-antibodies against specific platelet surface antigens. Platelets
covered with autoantibodies are effectively and prematurely destroyed by the
phagocytes of the reticuloendothelial system. In the minority of cases, presence
of auto-antibodies to MKs is also suspected, which results in TP of mixed
etiology – both decreased production and accelerated destruction. Other diseases
with autoimmune platelet destruction include systemic lupus erythematosus and
antiphospholipid antibody syndrome. Drug-induced immune TP was observed
upon the use of many exogenous factors, including heparin, gold, antibiotics and
anti-inflammatory drugs. In these cases, antibodies are formed against the
complex of a drug with platelet surface antigens. In heparin-induced TP,
thrombotic complications are common (similar to those in TTP), since
antibodies lead to excessive platelet activation in addition to increased clearance.
To examine the risk of TP in new drugs, or in yet to be tried drug regimens, the
PK and PD of the drug should be simulated superimposed on a mathematical
model of the underlying TP mechanism. However, how to determine the specific
TP mechanism in each particular case is a very challenging task. While certain
clues can be received from patient's medical history, physical examination and
To appear in Preclinical Development Handbook,Shayne Gad Ed., John Wiley and Sons, USA.
19
peripheral blood smear, bone marrow biopsy is frequently required in order to
evaluate number of MKs. Low numbers are indicative of decreased production,
while increased numbers are associated with accelerated destruction. Some cases
remain undefined, even after thorough laboratory investigation and manipulation
of extensive tools. The type of TP guides both further clinical work-up for
specific underlying pathology, as well as possible treatment options.
3.2 Current therapy
In light of the different mechanisms for TP, treatment is diverse and highly
dependent on the underlying cause. Generally, we can divide current therapy
into treatments directed against pathophysiological mechanisms, and
symptomatic treatment of TP-induced bleeding/thrombosis. In the majority of
the cases, platelet counts do not drop below 10-20,000 per microliter of blood, so
that serious bleeding complications do not develop. Treatment of the underlying
causes includes withdrawal of the offending stimulus, e.g. discontinuation of an
immunogenic drug, removal of vWF complexes by plasma exchange in TTP,
replacement of mechanical prosthesis by a biological one, and also includes
specific treatment of malignancies and infections.
It is imperative to identify accelerated platelet destruction by the
reticuloendothelial system, for which splenectomy and/or administration of
intravenous immunoglobulins (IVIG) is indicated in refractory cases.
Splenectomies lead to decreased auto-antibody production, and remove a large
fraction of phagocytes responsible for platelet destruction. IVIG, on the other
hand, saturates antibody-binding receptors on the phagocytes and suppresses
their interaction with antibody-covered platelets and MKs. Therefore,
theoretically IVIG should be more effective in cases of MK-specific antibodies.
This hypothesis, however, has not been examined clinically, due to technical
difficulties in identifying antibody specificity in particular patients. Importantly,
To appear in Preclinical Development Handbook,Shayne Gad Ed., John Wiley and Sons, USA.
20
neither a splenectomy, nor IVIG therapy, are effective in cases of direct
complement-mediated antibody toxicity to platelets and MKs.
Symptomatic treatment of TP-associated bleeding disorders consists mainly of
transfusion of donor platelets. Platelet transfusions are commonly used, with
approximately 9 million units yearly applied in the US alone. Though repeated
platelet transfusions may aid in preventing bleeding, they can transmit both viral
and bacterial infections, and cause alloimmunization which requires HLA-
matched donors. Health care costs and inconvenience to patients also pose a
concern. Furthermore, this treatment must be repeated on a regular and frequent
basis, due to the short half-life of donor platelets (3-4 days), and since the
underlying causes of TP are left untreated. Platelet transfusions are of especially
low efficacy in immunologically-mediated TP that involve an even shorter
platelet half-life.
3.3 Novel cytokine therapy
Over the past 15 years, attempts to find new therapies to replace platelet
transfusions in the treatment of thrombocytopenic disorders have naturally been
focused on the growth factors involved in normal thrombopoiesis (see section 2).
Interleukin (IL)-11, discovered in 1990 to be a thrombopoietic growth factor
secreted from bone-marrow stromal cells, was the first candidate for this
purpose. The genetically-engineered form of this protein, recombinant human
IL-11 (rhIL-11) was evaluated for treatment in patients with non-myeloid
malignancies that suffered from chemotherapy-induced thrombocytopenia, and
did, in fact, produce a dose-dependent increase in platelets. RhIL-11, approved
in 1997 for prevention of severe drug-induced thrombocytopenia, is currently the
only cytokine licensed in the US for this purpose. However, with its only modest
thrombopoietic activity and its use often associated with intolerable side effects,
IL-11 has not satisfied the demands for an efficacious thrombopoietic agent to be
applied in the clinical setting [19, 48, 53].

To appear in Preclinical Development Handbook,Shayne Gad Ed., John Wiley and Sons, USA.
21
In light of the central role of TPO in the proliferation and survival of MKs and
increased platelet production, its potential to replace standard platelet transfusion
therapy and improve platelet harvesting efficacy in donors seems even greater
than that of IL-11 [19, 28]. Recombinant human TPO (rhTPO) has been
examined for exogenous application in patients with initial thrombocytopenic
disorders, as well as for treatment of chemotherapeutically-induced
myelosuppression in cancer patients. However, phase 1 studies with rhTPO in
healthy individuals remain disappointing: In a trial that was aimed at improving
platelet yields in donors, some of them developed immune-mediated TP due to
appearance of auto-antibodies to native TPO. Evaluation of rhTPO therapy has
also encountered difficulties due to delayed peak platelet response and
neutralizing antibodies formed against the pegylated molecule. It is believed that
most complications are caused by significant antigenic differences between the
native and recombinant TPO proteins. As a result, this molecule currently
remains in its developmental stage, and is not yet approved. Small TPO analogs
and synthetic TPO-derived agents are currently being developed to bypass
immunogenicity-related problems [14, 22, 33, 38, 57-59, 61, 65].
Mathematical modeling of thrombopoiesis (as described in section 2) and drug-
induced TP (as will be shown in section 6) can aid in disentangling disease
dynamics and in deciphering pathophysiological mechanisms underlying the
disease. In particular, mathematical models of TPO-affected thrombopoiesis and
of IL-11-induced side-effects, enable to propose improved treatment schedules
for both drugs, obtaining maximum efficacy and substantially improved safety
(see section 4 and 5). In turn, preclinical validation of these improved regimens
can give new hope for clinical application of these cytokines in their multiple
arenas.

To appear in Preclinical Development Handbook,Shayne Gad Ed., John Wiley and Sons, USA.
22
4. Modeling drug effects on thrombopoiesis
Innovative cytokine-based therapeutics of IL-11 and TPO (see section 3)
developed for application in thrombopoiesis-related syndromes and for
efficiently harvesting donor platelets have been extensively studied in the last
decade or so. Yet, even today, toxicity-related limitations of each of these
molecules prevent their clinical applicability. The following section will be
dedicated to mathematical models focusing on both beneficial and detrimental
consequences of these therapeutic avenues, and on the manner by which such
models may be used to suggest improved treatment strategies.
4.1 Toxicity modeling: Interleukin (IL)-11:
Though IL-11 treatment has been approved for treating drug-induced TP for
almost a decade, its induction of intolerably toxic effects has proved to crucially
impede its therapeutic use. The cytokine has been shown to elicit a wide range of
side-effects, mainly associated with blood volume expansion (BVE). These
include complications of various grades of edema, anemia, pleural effusion,
cardiac arrhythmia, etc [48].
An initial and generalized perspective on this issue required a mathematical
model of IL-11-induced BVE. However, the definitive mechanism underlying
IL-11-mediated water accumulation is yet to be discovered, and the incomplete
data [20, 48], restrict the possibility to produce a concrete and reliable model for
this problem. Instead, a novel biomathematical approach was developed so that
not one, but several mathematical models, each representing an alternative
mechanism for BVE following IL-11 therapy, were devised and evaluated [36].
The underlying assumption here was that by concurrently simulating multiple
models, which formally describe alternative mechanisms, but all producing the
same fluid-retentive behavior, it is possible to faithfully depict this effect despite

To appear in Preclinical Development Handbook,Shayne Gad Ed., John Wiley and Sons, USA.
23
the obscurity of the actual mechanism and related data. Accordingly,
convergence of all models to yield unified BVE dynamics was the characteristic
by which their success and predictive ability was measured. Furthermore, since
the range of different models that capture the behavior of stable biological
systems, e.g., body water homeostasis, is assumed to be relatively narrow, the
chances of arriving at a reliable model was considered even greater in the drug-
afflicted BVE setting [36].
Three closely-related biologically-based models were constructed using ordinary
differential equations (ODEs) and standard Michaelis-Menten kinetics. The
models incorporated basic water regulation properties (blood volume, pressure
and vascular compartments) and endocrinal feedback effects (compartments for
BVE-upregulating and downregulating hormones), together with the IL-11-
induced perturbation of the system. Notably, a short-term neuronal influence or
long-term permanent structural changes were not considered, restricting the
modeling to the therapeutic time scale. The variation between the different
models was expressed in (a) the component directly affected by IL-11, being
either blood volume or blood vessels, and (b) the components affected by the
endocrinal hormones, being both vessels and volume (full effect) or only volume
(partial effect). Thus, model 1 assumes IL-11-induced vessel enlargement and
full endocrinal feedback; model 2 assumes IL-11-induced volume expansion and
full endocrinal function; model 3 assumes IL-11-induced volume expansion and
partial endocrinal function. The models were identical in all other assumptions.
Dynamics of subcutaneously-administered IL-11 were represented by a one-
compartment PK model, with first order absorption from the external tissue. IL-
11 concentrations in the tissue (IT) and plasma (I
P) are given by
TT IcI 1 (4.1)
and
PTP IcIfcI 21 (4.2),

To appear in Preclinical Development Handbook,Shayne Gad Ed., John Wiley and Sons, USA.
24
where )0( tI T is the administered IL-11 concentration, and 0)0( tI P . The
coefficient c1 denotes the rate of drug transport from the primary tissue to the
plasma, c2 is the drug clearance rate, and the fraction of transferred drug, an
indicator of bioavailability, is f.
Blood pressure was described by considering its classical correlation to heart
rate, stroke volume and systemic vascular resistance. As heart rate variability
was disregarded in experiments, and an inverse relationship between vascular
resistance and vascular capacity was assumed, blood pressure was described to
be a function of blood volume and the vascular capacity (expressed in terms of
vessel surface):
0
23)(
n
tS
tVtP
(4.3)
The function P(t) is blood pressure at time t, S(t) denotes overall vessel surface
at time t, V(t) is blood volume at time t, and n0 is a parameter. Steady state
values of pressure, overall vessels surface and volume were given by Pst, S
st, and
Vst, respectively.
Dynamics of the BVE-upregulating hormones (HU), and the BVE-
downregulating hormones (HD) were subjected to blood pressure variations, and
were therefore given by
tHdtPPgH UstU 11 (4.4)
and
tHdPtPgH DstD 22 (4.5),
respectively. The description is general, and does not refer to hormonal
concentrations per se, but rather, to effects associated with endocrinal
deviations. In equations 4.4 and 4.5, formation rates (α1, α2) and degradation
rates (d1, d2) of the endocrinal effects were taken as constants, and blood
To appear in Preclinical Development Handbook,Shayne Gad Ed., John Wiley and Sons, USA.
25
pressure deviations from steady state allowed formation of each factor using the
function
g(x)= x if x>0
0 if x≤0 (4.6).
The vascular structure was described in two-dimensional units, e.g. by relating to
the average surface of the inner endothelium layer of blood vessels. IL-11-
induced vessel surface enlargement (in model 1) and HU-induced
vasoconstriction or HD-induced vasodilation (in models 1 and 2), were described
by biologically-compatible non-linear functions. As described earlier, model 3
does not enable vascular resizing in response to IL-11 or hormones. All three
models, however, incorporate simple intrinsic feedback effects to vessel steady-
state in blood vessel dynamics. Thus, the equation for models 1, 2 and 3 are
given by 4.7, 4.8 and 4.9, respectively.
tSStHk
tH
tHk
tH
tIk
tIS str
U
rD
rU
rU
rP
rP
3
2
2
1
1
0
0
2
2
1
1
0
0
(4.7),
tSStHk
tH
tHk
tHS str
U
rD
rU
rU
3
2
2
1
1
2
2
1
1
(4.8),
and
tSSS st 3 (4.9).
Vascular modification rates in response to IL-11, HU, and HD are denoted as b0,
b1 and b
2, respectively, and b
3 is the coefficient of direct vessel surface
regulation. Parameters k0,k
1,k
2 and r
0,r
1,r
2 are positive.
Volume dynamics were initially characterized by water absorption-excretion
differences. Absorption rates were assumed not to deviate from steady state
values, whereas excretion rates were taken as susceptible to (a) systemic blood
pressure deviations, known to specifically act on renal water excretion, and to

To appear in Preclinical Development Handbook,Shayne Gad Ed., John Wiley and Sons, USA.
26
(b) the IL-11-induced effects. The function of blood volume was therefore
described by the difference between absorption rates, which were constant (Ast),
and excretion rates, which were set as the pressure-related difference between
normal steady-state excretion (Est) and the excretion in the IL-11 scenario
(Edrug):
tEEP
tPAV drugst
n
stst
1
(4.10)
The power coefficient n1
sets the strength of the dependence of the volume
changes on the pressure variation. Assuming equal steady state absorption and
excretion rates (Ast=E
st) under normal conditions, equation 4.10 turns into
tEP
tP
P
tPEV drug
n
st
n
stst
11
1
(4.11).
Excretion of volume in the therapeutic scenario (i.e. the term Edrug) was assumed
to be affected by the hormones in all three models. As described above, in
models 2 and 3 it was additionally assumed that the drug directly influences
volume excretion. Both of these effects (IL-11 and hormone mediated) were
assumed to be non-linear, and introduced into the volume dynamics given in
equation 4.11. For model 1, this gave
2
2
1
111
2
2
1
11q
D
qD
qU
qU
n
st
n
stst
tHm
tH
tHm
tH
P
tP
P
tPEV
(4.12),
while for models 2 and 3, the equation was
2
2
1
1
0
011
2
2
1
1
0
01q
D
qD
qU
qU
qP
qP
n
st
n
stst
tHm
tH
tHm
tH
tIm
tI
P
tP
P
tPEV
(4.13).
The IL-11, HU and HD -afflicted rates of water excretion are denoted g0, g
1 and
g2, respectively. Parameters m
0,m
1,m
2 and q
0,q
1,q
2 are positive constants.
Subsequent calibration of the models was accomplished by obtaining and
utilizing data from a human study of IL-11 safety, and their predictive ability

To appear in Preclinical Development Handbook,Shayne Gad Ed., John Wiley and Sons, USA.
27
was evaluated under different regimens of IL-11 therapy. These stages of the
work are further described in section 5.
4.2 Efficacy modeling: Thrombopoietin (TPO)
As we have illustrated in section 3, platelet deficiencies hamper the development
of improved therapeutic regimens for hematology and oncology patients, as well
as in their clinical management [19, 22]. The possible use of TPO to abrogate
these disorders has also been debated (section 3). The PK of rhTPO therapy was
mathematically modeled in terms of ODEs, and solved numerically using the
Euler method. This extension was simulated in conjunction with the
thrombopoiesis model described in section 2 (see also [50, 51]). The independent
PK model for rhTPO was similar in its structure to that of endogenous TPO,
though the kinetic parameters were assumed to be different. The reason for this
lies in the fact that exogenously-administered synthetic molecules have been
shown to differ from the endogenous analogs in a number of characteristics [59].
The model extension also assumes competitive binding of TPO and rhTPO to
cell receptors. When describing the PD of the drug, its effects were considered
similar to those of the endogenous protein, the latter already existing in the
model. Parameter calibration of the model, as well as its retrospective and
prospective validation in different species, is detailed in section 5.
4.3 Modeling combination therapy: chemotherapy and TPO
support
The consideration of TPO as a potential candidate for alleviating chemotherapy-
induced TP in patients with malignant disorders (see section 3) introduces the
issue of combination therapy. The addition of TPO to a cytotoxic-drug affected
scenario, allowing restoration of the damaged thrombopoietic system, can be
described via minor manipulation of the basic mathematical model. To do this,
To appear in Preclinical Development Handbook,Shayne Gad Ed., John Wiley and Sons, USA.
28
one should take into account the effect of chemotherapeutic drugs on the
thrombopoietic lineage. Chemotherapy nonspecifically damages all dividing
cells, particularly progenitor cells of the thrombopoietic lineage. These targets
are represented by the UCP and CP compartments of the TPO model (section 2).
Accordingly, the model assumes that the cytotoxic drug eliminates dividing cells
in a concentration-dependent manner, and, possibly (depending on the drug), in a
cell-cycle phase specific manner. The model incorporates the PK of the drug, to
obtain the time course of drug concentrations in blood and the bone marrow.
Subsequently, a PD model for this drug is applied: the apoptosis probability of a
dividing cell is calculated as a function of its position in the cycle and of the
current drug concentration.
After constructing such a model and validating it, drug developers and treating
physicians can explore the unlimited space of possible conjugate treatments, in
which the side effects of chemotherapy are suppressed by use of exogenous
TPO. The model allows examining different treatment regimens, predicting their
possible outcomes and selecting the best possible treatment strategies, while
avoiding adverse effects, such as those observed in clinical trials of TPO. This
identification of improved treatment strategy can be done for the general
population, as well as on patient-specific basis, the latter requiring the specific
model parameters of the treated patient, which can be evaluated using the
individual platelet profiles post drug intervention.
5. Using the validated model for predicting improved
efficacy/toxicity profile
As explained in section 3, clinical evaluation of IL-11 and TPO was obstructed
due to safety problems. It was therefore imperative to investigate the
mathematical models of TPO-mediated thrombopoiesis and IL-11-induced fluid
retention (sections 2, 4, and 5), in order to suggest how to overcome the
limitations involved in the development of these drugs. We will show in this

To appear in Preclinical Development Handbook,Shayne Gad Ed., John Wiley and Sons, USA.
29
section how species-specific model parameters can be evaluated and the means
by which retrospective and prospective validation of the mathematical models is
achieved. Thereafter we will discuss model use for predicting improved
chemotherapy and supportive administration regimens.
5.1 Model validation by retrospective human study results: IL-
11 and TPO
Since modeling IL-11-mediated BVE has employed the specially-developed
multiple modeling approach (see section 4), the above-depicted diverse models
are considered validated and of predictive capability only upon their arrival at
unified volume dynamics. The study therefore consisted of two essential steps:
experimentally-based calibration and parallel assessment of model simulation-
derived BVE behavior. These procedures are described hereafter [36].
In the first stage, model parameters were successfully calibrated to
retrospectively retrieve clinically-evaluated, blood volume measurements
following daily IL-11 administration of 25 µg/kg doses to healthy volunteers for
a week [20]. The data that served for approximation were collected during the
first week, that is, within the therapeutic time frame. However, subsequent
simulations of the models under the same regimen failed to generate unified
behavior of BVE dynamics (figure 5.1, upper panel). In contrast, when
simulations were preceded by calibration of the models using data from stages
both within therapy (the first week), and up to one month following treatment
termination, the output dynamics were highly similar between the models (figure
5.1, lower panel). In fact, the observed high correlation between the numbers of
experimental points used for model calibration, and models' increased similarity
(data not shown), strengthened the possibility that by using more data points,
model similarity and thus reliability and clinical predictability, can be improved.
To appear in Preclinical Development Handbook,Shayne Gad Ed., John Wiley and Sons, USA.
30
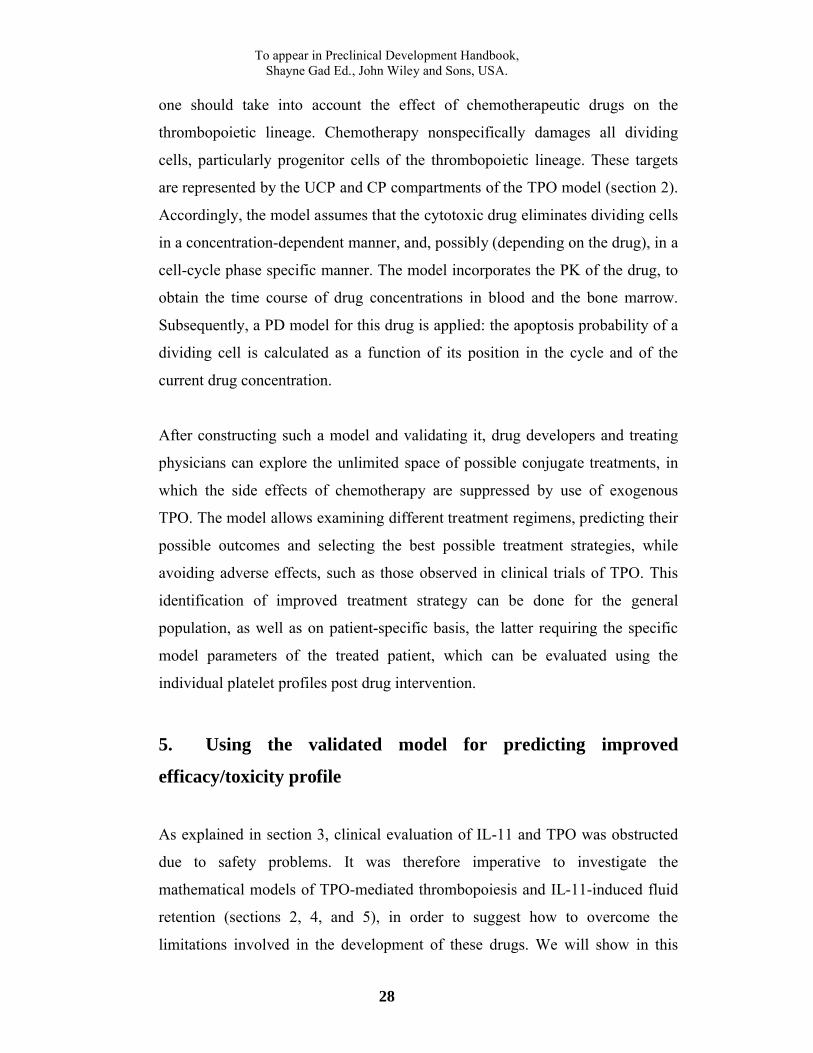
Figure 5.1: Comparison of alternative mathematical models for BVE dynamics following calibration by results of a clinical IL-11 study. Blood volume (liters) measured during one week of IL-11 therapy (7 daily doses of 25 µg/kg), was taken from a previous study in healthy humans. Three models, calibrated with data from either the therapeutic days (upper panel), or both the therapeutic and post-therapeutic windows (lower panel) were simulated under the above experimental treatment schedule (data adapted from [36]).
In the second stage of the work, the predictability of the models was evaluated in
a wider therapeutic spectrum. The models were simulated under IL-11 treatment
strategies of various durations, various inter-dosing intervals and various dose
intensities, where model-derived dynamics were again compared to assess the
model robustness in portraying BVE dynamics. Highest values of similarity
between models, as shown by the difference index, were observed when the
average IL-11 dose per day of the tested treatment was close to that of the
experimental treatment of daily 25 µg/kg doses (see figure 5.2, as an example).
This suggests that in this example of obscure toxicity mechanism, one can trust
the model-derived BVE predictions for various IL-11 treatments, provided their
average daily dose of IL-11 is in proximity to that used in the original clinical
experiment.

To appear in Preclinical Development Handbook,Shayne Gad Ed., John Wiley and Sons, USA.
31
Figure 5.2: Model-derived BVE dynamics in therapeutic regimens that are close to experimental schedules in average dose per day values. Model simulations under the experimental schedule (treatment 'exp') and other regimens of various durations, doses, and inter-dosing intervals (treatments 1-11), following calibration with clinical measurements, are compared using the difference index (data adapted from [36]).
The mathematical method applied in the case of IL-11 shows that given
preliminary experimental data from various stages of therapy, beginning at
phases within the therapeutic window and ending at the recuperated steady-state,
the different models reliably predict dynamics of water retention within a certain
span of IL-11-administration strategies. Considering the recommended IL-11
levels (10-100 µg/kg/day), and the above model-derived conclusions, clinical
studies evaluating BVE within concentrations of 10, 20, 30, etc. µg/kg/day are
required to form a complete predictability frame of BVE within all relevant
treatment scenarios. This would then allow appraisal of the clinical applicability
of each of these IL-11 therapy schedules, as well as others.
As in the above-presented process of IL-11 model evaluation, clinical
information was used for the TPO case. A thrombopoiesis computational model
was designed on the basis of the mathematical descriptions of TPO-induced
thrombopoiesis (elaborated in sections 2, 4), to enable simulation and evaluation
of in vivo platelet formation and to suggest therapeutic TPO regimens of
improved efficacy and reduced immunogenicity [51]. The computer model was

To appear in Preclinical Development Handbook,Shayne Gad Ed., John Wiley and Sons, USA.
32
adjusted and validated for both murine, simian and human, as will be elaborated
below.
Currently human validation of the thrombopoiesis computer model is possible
only in retrospective, as the drug has not yet undergone the appropriate
regulatory procedures enabling human administration. To retrospectively
validate the model it was calibrated using a set of biologically realistic parameter
values, so that homeostatic behavior, i.e. a normative count of 320,000
platelets/l blood, was retrieved in untreated conditions. Next, simulation of the
computerized model under recombinant human TPO (rhTPO) administration was
carried out. Data from a clinical trial [56], which included PK information (i.e.
rhTPO concentration in blood) and accurate platelet counts in response to
different TPO dosages, served the calibration process: Three patients were
assigned to a single IV bolus administration of each of the four dosages 0.3, 0.6,
1.2 or 2.4 g/kg. The three platelet count curves for each dosage were averaged
and a single parameter set, which enabled the model to accurately retrieve
platelet dynamics observed under the various treatment regimens, as shown in
figure 5.3, was identified. This parameter set was determined as the
representative for the "average patient".
While TPO therapies pose many questions, such as its effects on elevated
platelet counts in clonal thrombocytosis, the opposite problem, namely that of
reduced platelet counts, introduces equally significant challenges. Since TP is a
common dose-limiting side effect of cancer chemotherapeutics, as discussed in
sections 3 and 4, accurate predictions of the chemotherapeutically reduced
platelet dynamics are of importance when planning treatments. To allow
predicting effect of cytotoxics on thrombopoiesis in individual patients, the
average “Virtual Patient” was tested for its ability to retrieve the outcomes of a
standard chemotherapeutic treatment by doxorubicin. The model was
successfully calibrated in reference to clinical published experimental data [60],
as shown by figure 5.3 (lower right panel) and improved TPO regimens were

To appear in Preclinical Development Handbook,Shayne Gad Ed., John Wiley and Sons, USA.
33
suggested. Prospective validation of the generality and clinical predictability of
the model is warranted. A different biomathematical approach, elaborated in
section 7, uses data from human and animal cell culturing and from preclinical
studies that are available in the pharmaceutical industry, in order to develop
therapeutic strategies with minimal suppression of thrombopoiesis.
Figure 5.3: Model predictions of platelet profiles in patients treated by TPO and chemotherapy compared to clinical results. Average platelet counts in human patients are plotted, following a single IV bolus rhTPO administration of 0.3 g/kg (upper left panel), 1.2 g/kg (upper right panel), or 2.4 g/kg (lower left panel), or an IV infusion of doxorubicin for three days, the total dose being 90 mg/m2 (lower right panel). Simulation-generated curves are shown by thick lines; clinical results are shown by thin lines.
In conclusion, the thrombopoiesis computer model was successfully calibrated to
accurately retrieve relevant clinical information reflecting TPO therapy, as well
as to chemotherapy, but it is yet to undergo prospective human validation.
Importantly, the models described here for different thrombopoietic growth
factors are each targeted towards opposing aspects of therapy: while the IL-11
mathematical model attempts to define the toxicity associated with drug-induced
alleviation of TP, the computerized-TPO model is aimed at accurately predicting
the direct beneficial results of such therapy on platelet restoration.

To appear in Preclinical Development Handbook,Shayne Gad Ed., John Wiley and Sons, USA.
34
5.2 Model validation in prospective animal trials: TPO applied
to the Virtual Mouse and Virtual Monkey
To use the model predictions for clinical decision-making, one must still
substantiate the superiority of the model-suggested improved TPO regimens.
This task must be carried out in animals first, not only due to safety issues, but
also because typically in such cases, the agent in question is not yet approved for
the treatment of patients. Once a proof of concept in animals is provided for its
power to suggest improved regimens, the model can become instrumental during
the clinical phases of drug development, for avoiding excessive and unnecessary
toxicity and for reducing the number of patients in Phase I of the clinical
development. These steps are expected to pave the road for routine clinical use
of the computer-based prediction tool.
The underlying assumption in this work was that improved TPO schedules are
those employing the smallest drug doses required to achieve the desired efficacy.
This assumption is based on a biomathematical study which examined the effect
of dose intensities on drug immunogenicity. Results of this work suggest that for
given immuno-reactive system, there exists a critical drug dose for which the
relevant immunogenic threshold is expected to be exceeded, thus affecting
patient health [15].
To validate the model’s predictions in preclinical experiments with BALB/C
mice and Rhesus monkeys, the thrombopoiesis model was calibrated to reflect
murine or simian thrombopoiesis. This was achieved by using literature-derived
data. The species-adapted models, "Virtual Mouse" and "Virtual Monkey", were
subsequently used to adjust the improved TPO treatment to the species in
question, and test this treatment in animal experiments. This work is described
hereafter [51].

To appear in Preclinical Development Handbook,Shayne Gad Ed., John Wiley and Sons, USA.
35
Parameter calibration of the thrombopoiesis computer model was performed for
fine-tuning the model to accurately describe thrombopoiesis in each species.
This work involved definition of a biologically realistic range of values for each
parameter in murine thrombopoiesis [13, 21, 33, 40, 46, 49, 55] and simian
thrombopoiesis [18, 19, 23, 26, 27, 42, 52, 64], which were then entered as the
initial parameter values, subsequently to be fine-tuned according to the specific
tested population. Ability of the model to retrieve platelet profiles in each animal
group was then tested.
Figure 5.4: Model predictions of platelet profiles in mice treated by TPO as compared to experimental results. Upper panel: The thrombopoiesis model-generated predictions indicating similar efficacy in platelet formation between a “conventional” single dose TPO treatment of 17.5 g/kg, and a model-suggested reduced TPO treatment of four daily doses of 2 g/kg each, comprising only 10%-45% of the standard regimen. Experimental results of platelet formation (middle panel) and MPV measurements (lower panel) following conventional rmTPO therapy (black diamonds) and the alternative therapy (white squares) in mice, according to the above schedules, validate the model predictions. Treatments are

To appear in Preclinical Development Handbook,Shayne Gad Ed., John Wiley and Sons, USA.
36
initiated at day 0. Average ± s.d. of five mice are shown, per each entry (data adapted from [50, 51]).
Next, the prediction accuracy of the thrombopoiesis computer model was
validated in mice. Specifically, simulating the model it was predicted that
platelet counts, similar to those achieved with the accepted TPO administration
schedule can also be generated under different schedules of appreciably reduced
TPO doses (figure 5.4, upper panel). Hence, two different administration
regimens were experimentally applied to mice clustered in two experimental
arms, and their subsequent responses were compared. Mice of the first arm (A)
received a standard regimen consisting of a single injection of 17.5 µg/kg
recombinant murine TPO (rmTPO), which was well below the reported
saturating level [13]. The second arm (B) tested the model-generated proposition
that the same platelet yields can be obtained in mice receiving a total dose of 8
µg/kg rmTPO, divided over four equal daily injections, whereas the null
hypothesis here was that a significantly smaller total dose of rmTPO would be
less efficient in elevating the platelet counts.
The results of the experiments, presented in figure 5.4 (middle panel), clearly
show that the platelet profile of arm A (a regimen of one 17.5 µg/kg rmTPO
injection), is similar to the profile of arm B (applying a regimen of four daily
2µg/kg rmTPO doses). The differences are statistically insignificant, as
evaluated by the student’s t-test. The average profiles of both arm A and B
peaked at fairly the same time (day 5 vs. day 6, respectively) and at similar mean
platelet counts of 2741±193 x 109/L and 2685±164 x 109/L, respectively. The
latter schedule resulted in a slightly extended thrombocytosis. MPV, known to
decrease in platelet production induced by low dose TPO in mice [31], was
compared between arm A and arm B as well (figure 5.4, lower panel). Results
show that the familiar phenomenon of MPV reduction also occurred similarly in
both groups. Once again, arm A had preceded arm B in reaching its nadir by
about 24 hours (6.76 fL on day 6, vs. 6.74fL on day 7, respectively). Specific
adverse effects were not observed following either treatment.

To appear in Preclinical Development Handbook,Shayne Gad Ed., John Wiley and Sons, USA.
37
In order to evaluate in Rhesus monkeys the efficacy of the treatment regimen,
already validated in mice, we first checked the ability of the simian
thrombopoiesis model to predict individual monkey responses to different TPO
treatments. Next, the simian response to the model-suggested schedule was
simulated and the resulting predictions were compared with the platelet counts
that were experimentally obtained under the model-suggested schedule.
Figure 5.5: Comparison of model predictions to empirical data of TPO therapy in a Rhesus monkey. Daily experimental measurements (rectangles) are shown as well as model simulations (solid line) of platelet counts of one monkey treated by TPO. Fourteen daily doses of 5 µg/kg TPO were applied, administration days marked by triangles (data adapted from [50, 51]).
To this end, model parameters were first evaluated to fit the empirical platelet
profile of a single Rhesus monkey. The quantitatively adequate simulations of
thrombopoiesis response to treatment were apparent from their resemblance to
the empirical results (figure 5.5). This calibrated model was further validated in
several other monkeys, each receiving a different drug schedule (see schedule in
figure 5.6, top panel).
Results in figure 5.7 demonstrate that the model predictions run remarkably
close to the empirical data points. Note that as the platelet counts were
monitored in these monkeys only once weekly, a mismatch is introduced into the
comparison between the empirical results and the daily predicted counts.

To appear in Preclinical Development Handbook,Shayne Gad Ed., John Wiley and Sons, USA.
38
Therefore, there is no reason to assume that the peaks in the predicted responses
on days that were not tested empirically, did not actually take place.
Figure 5.6: TPO administration schedules applied in simians for model validation. Upper panel: Five different schedules, comprising various combinations of 5 μg/kg doses of recombinant full length Rhesus monkey TPO (each dose indicated by triangles), were individually applied to the studied monkeys. Lower panel: model-suggested TPO schedules (also using doses of 5 μg/kg) applied to two monkeys.
5.3 Predicting the optimal TPO toxicity/efficacy ratio in
monkeys
Once verified, the Virtual Rhesus model was simulated for identifying an
improved TPO administration regimen. The model-based regimen was then
evaluated for verifying its improved efficacy and safety profile. This was done in
two monkeys (see figure 5.6, bottom panel). The resulting elevation in platelet
counts peaked at 1700 - 2400x109/L following each treatment cycle. The results
of a second cycle of the same treatment were similar to those of the first one in
showing no neutralizing Antibodies. Only when the dosing cycle was applied for
the third time, low antibody titers were detectable, which did not jeopardize
TPO’s efficacy and did not result in decreased platelet counts. The individual
empirical responses of the two monkeys to the first treatment cycle are shown in

To appear in Preclinical Development Handbook,Shayne Gad Ed., John Wiley and Sons, USA.
39
figure 5.8, top panel (to be compared with a highly immunogenic response of a
monkey who underwent another TPO treatment, figure 5.7, bottom panel).
Figure 5.7: Comparison of model predictions to experimental platelet profiles of Rhesus monkeys under various TPO treatment schedules. Three monkeys (upper, middle, and lower panels) were subjected to individual TPO regimens, consisting of multiple dosing treatments of 5 µg/kg TPO, administration days marked by triangles. Experimental measurements of platelet counts in blood were performed weekly or bi-weekly (squares), and are plotted against model simulations (solid line).
These results show that the model predicted administration regimen of smaller
TPO doses with an interval of 24 hours yields platelet counts that are equal in
effect to the more than double dose regimen, administered as a bolus injection.
This experiment joins previous in vivo experiments with other drugs in verifying
a mathematical theory discussed in section 1.1, which essentially suggests that
treatment efficacy can be decisively influenced by modulating the inter-dosing

To appear in Preclinical Development Handbook,Shayne Gad Ed., John Wiley and Sons, USA.
40
interval according to the internal cell kinetics. The monkey experiment supports
the model prediction of an equally efficient and non-immunogenic treatment, if
dose is fractionated by an appropriate dosing-interval. Importantly, this
schedule, adopted for improving safety of TPO administered for platelet
harvesting in monkeys, has been in use for the last five years, or so. No adverse
effects have been associated with this model-suggested treatment.
Figure 5.8: Superiority of the model-suggested TPO treatment schedule validated in Rhesus monkeys, as compared to other regimens. Upper panel: empirical platelet profiles of monkeys under the model-suggested TPO regimen of 4 daily 5 µg/kg doses (solid squares and circles) are plotted, administration days are marked by triangles. Lower panel: Antibody titer and platelet profiles of a monkey undergoing an arbitrary treatment by 12 TPO doses.
In general terms, the experimental results in both animal species supported and
validated the predictions of the mathematical model that more efficacious
treatment with TPO can be implemented. Although, intuitively it may not seem

To appear in Preclinical Development Handbook,Shayne Gad Ed., John Wiley and Sons, USA.
41
beneficial for the patient to replace a single injection by multiple doses, it is
clearly of significance for safety considerations.
The computerized mathematical model is capable of successfully predicting
treatment scenarios not yet tested experimentally, as well as of identifying safer
regimens. This tool is expected to be of aid in suggesting improved drug
strategies for an individual or for a patient-population. Human trials are
necessary for testing the suggested improved TPO strategies, possibly in
conjunction with chemotherapy.
6. Using the thrombopoiesis model for predicting an unknown
animal toxicity mechanism
Several pathophysiological mechanisms can account for drug-induced TP (see
section 3), and the actual underlying mechanism in each particular case can have
important therapeutic implications. Yet, no easily applicable non-invasive
laboratory tests are available for distinguishing between the different
mechanisms for TP. In this section, we describe the manner by which
mathematical modeling can help understand dynamics and etiology of drug-
induced TP.
A monoclonal antibody-based drug, developed against a platelet-unrelated
antigen and currently under preclinical evaluation, was found to possess cross-
reactive effects eliciting severe TP in monkeys. Despite routine laboratory
testing and histological examination of bone marrow of affected monkeys, the
drug's mechanism for inducing TP has not been elucidated. In an attempt to
decipher the underlying mechanism, we used the mathematical model for TPO-
regulated thrombopoiesis [50, 51], which was previously formed (as described in
section 2) and validated in vivo (as depicted in sections 4-5). This model was
extended to include the effect of the drug on MKs and platelets. Since the

To appear in Preclinical Development Handbook,Shayne Gad Ed., John Wiley and Sons, USA.
42
mechanism is still unknown, several biologically-plausible alternatives were
examined. Antibodies can exert their effect either by antibody-assisted
phagocytosis, or by complement-mediated direct toxicity [30]. In the first
mechanism, antibody-covered platelets or platelet-forming MKs would be
efficiently removed by macrophages that bear specific antibody-recognizing
receptors. In the latter case, platelet-bound antibodies activate the complement
pathway that leads to cell membrane perforation and cell destruction (figure 6.1).
Figure 6.1: The “phagocytosis” putative mechanism and the "hits" putativemechanism of drug-induced thrombocytopenia. In the “phagocytosis” mechanism (upper panel), drug molecules bind to platelet and megakaryocyte surface antigens, leading to their phagocytosis by the reticuloendothelial system. In the "hits" mechanism (lower panel), drug molecules bind to platelet surface antigens, leading to complement activation and direct destruction of the cells.
Mathematical implementation of both antibody-mediated killing mechanisms
into the PD-extended model was performed as follows. For complement-
mediated toxicity, an “accumulated hits” model, according to which each platelet
suffers from cumulative damage (“hits”) induced by antibody-mediated
complement binding, was suggested. Upon accumulation of a certain number of
“hits”, the platelet is permanently damaged. The resulting probability density
function, P(t), describing a fraction of platelets with a given number of “hits” in
time t post-exposure, is given by the gamma function

To appear in Preclinical Development Handbook,Shayne Gad Ed., John Wiley and Sons, USA.
43
!m
ettP
tm
,
where m is the number of “hits” needed for platelet destruction, and α is the rate
of “hit” formation. The rate of “hits” is given by a linear function of the antibody
concentration in blood:
baX ,
where X is antibody concentration , and a and b are parameters.
For the case of antibody-mediated phagocytosis, the "phagocytosis" model, it
was assumed that the rate of platelet “capture” by macrophages has a form of
Hill's function, depending on the number of antibodies that are bound to the
platelets surface. This is described, as follows
zz
z
iK
iBiB
*max ,
where B(i) is the rate of capture of platelets that possess i bound antibodies, and
K and z are parameters. Since binding and dissociation of antibodies from the
platelet surface are stochastic processes, the distribution of platelets with respect
to the number of bound antibodies, Vi, was explicitly calculated, so that the rate
of antibody-induced platelet elimination is given by
i
ii BVR * .
Antibodies can act against mature platelets, bone marrow-derived MKs, or both.
Hence, several combinations of these suggested drug-toxicity mechanisms were
implemented in the extended model. Retrospective results of real-life
experiments in a number of individual Rhesus monkeys [50, 51] were used for
comparison with the simulated outcomes of these various alternative models. For
each combination, the PD-associated parameters of the extended model were
adjusted to best fit to these experimental results. Only one of the combinations
was expected to consistently retrieve experimental data, and thus be identified as
the preferable mechanism underlying this antibody-mediated TP. Systemic
platelet profiles in individual monkeys following administration of multiple or

To appear in Preclinical Development Handbook,Shayne Gad Ed., John Wiley and Sons, USA.
44
single doses of the drug were compared with the best-fit profiles produced by
models with different drug effect mechanisms (figure 6.2). The analysis of these
simulations indicated that the “hits” model failed to predict dynamics of the
drug-induced TP, while the “phagocytosis” model coincided with experimental
data. Model results also show that by assuming toxicity to both platelets and
MKs, rather than to just platelets, more precise predictions can be yielded.
We conclude that the developed computerized thrombopoiesis model
superimposed by mathematical models for putative toxicity mechanisms can
retrieve adverse thrombocytopenic effects recorded empirically in simians.
Different models of drug toxicity mechanisms yield different profiles of blood
platelets, yet the antibody-mediated phagocytosis of platelets and MKs seems
the most plausible mechanism of the drug-induced TP in this situation. In this
manner, mathematical modeling can help decipher the underlying mechanisms
of other disorders.
Figure 6.2: Model retrieval of drug-induced thrombocytopenia in Rhesus monkeys. Platelet dynamics derived from experiments in four monkeys, receiving a treatment of

To appear in Preclinical Development Handbook,Shayne Gad Ed., John Wiley and Sons, USA.
45
multiple doses (A-F) or a single high dose (G-L) of the drug. The effects of each treatment on the monkey’s platelet profile were simulated by the three mathematical models of alternative drug-toxicity mechanisms. Model predictions were then statistically compared with the experimental results. Simulation results of the “phagocytosis” model assuming that the drug targets platelets alone (left column panels), of the “phagocytosis” model assuming that the drug targets both platelets and megakaryocytes (middle column panels), or of the “hits” model, assuming that the drug targets only platelets (right column panels). Panels A-C, D-F, G-I and J-L correspond to data from each of the four monkeys. Empirical data (thin lines) is shown vs. simulation-derived dynamics (thick lines).
7. Transition to Phase I
Drug development is a costly and time-consuming endeavor, due to its
requirement for enormous collections of data concerning the efficacy and safety
of the proposed drug. The ability to extrapolate toxicity and efficacy data from
animal to human is therefore of great importance for efficiently advancing
development of pharmaceuticals. Yet, despite the efforts invested in this
direction, and the great advances achieved in recent years, extrapolation of data
from animals to humans is still considered unreliable [11, 32, 39]. In this section,
we provide a detailed description of an algorithm, which in conjunction with
data from cell cultures and animal experiments, can be used for the modeling of
clinically-stimulated (drug-induced) TP in humans, and show how this method
enables good clinical predictability of this disorder.
As discussed in section 3, TP can result from therapeutic intervention, such as
anticancer chemotherapy. The mathematical model of thrombopoiesis, described
in section 2, was used as a basic model for retrieving clinical cytotoxic drug-
induced TP. Yet, to obtain a reasonable approximation of the predicted toxicity
in humans, based on preclinical data, additional assumptions and simplifications
are required. These are detailed below.
First, translation of drug PD from the preclinical to the clinical stage is
necessary. One must consider (a) differences between in vitro and in vivo data,
and (b) differences between PD parameters of different species. Both variation

To appear in Preclinical Development Handbook,Shayne Gad Ed., John Wiley and Sons, USA.
46
types involve built-in inaccuracies: With respect to the comparison between in
vitro and in vivo experiments, a few issues must be taken into account. Cells in
vitro are more sensitive to a drug, and thus more susceptible to drug-induced
apoptosis. They have higher mitotic indices due to less contact inhibition, and
are usually exposed to constant levels of drug concentration over time. Cells in
the physiological, whole-organism context, however, are of lower sensitivity to a
drug; the surrounding microenvironment, consisting of high proliferating and
less drug-susceptible cells, provides a constant influx of healthy cells into the
total pool, thereby limiting the damage caused by the drug [43]. Differences in
exposure to growth factors between the two experimental settings exist as well.
Drug sensitivity differs not only between in vitro and in vivo settings, but also in
various species, which may differ in size of cells, mitotic indices of various
compartments and differential stages of cells, apoptotic indices, transit times,
sensitivity to hormones, etc. [25].
In order to replicate clinical use of the drug, the basic mathematical model iss
extended to incorporate an additional formula for the drug PD. It is assumed that
bone marrow cells are exposed to systemic drug concentration at any time, as the
tissue is highly vascularized. The model also assumes that cells at different
developmental stages, denoted by a subscript X (e.g. UCP, CP, EP), are of
diverse sensitivity to the drug. The functional relation between the concentration
of the cytotoxic drug in blood (CDbl) and the cytotoxic effect (CE) is given by
the equation
tCDftCE blx , (7.1)
where CEx denotes the fraction of bone marrow thrombopoietic cells of a
differentiation stage X, eliminated following exposure to CDbl at time t
(CDbl(t)). The dependence is represented by function f, where 10 tCDf bl
for any t.
Most cytotoxic drugs target mitotic phases of the cell cycle, and are thereby
more harmful to proliferating, rather than resting, cells. Accordingly, by further

To appear in Preclinical Development Handbook,Shayne Gad Ed., John Wiley and Sons, USA.
47
subdividing the model compartments into cell-cycle phases (G0-G1 and S-G2-M
sub-compartments), a more accurate prediction of drug toxicity can be obtained.
For example, in the above model, representation of UCP and CP compartments
(see section 2) uses cell-cycle length instead of amplification rate. This allows us
to calculate, not only the total number of cells remaining at every time point after
drug application, but also the number of cells at every age and cell-cycle phase.
In EP compartments, the age and the position in the endomitotic cycle are
synchronized, thus there is no need for additional distribution. The rest of the
compartments, consisting of non-dividing cells, are not considered susceptible to
the standard cytotoxic drug, and are therefore not subdivided in this manner.
Cytotoxic drugs that selectively target these stages can be addressed after
subdivision of those compartments. In this complex form of the model,
parameters (e.g. compartments sizes, transit times), are evaluated differently for
all the species examined, while the model equations themselves remain of the
same structure.
Following adaptation of the model equations to include the PD of the drug,
parameters are calibrated using the available experimental information.
Preclinical toxicity data to be used by the model consist of the platelet
measurements over time in one animal of a chosen species (S), which has shown
(in previous in vitro studies) higher sensitivity to the drug than other species.
Various sets of data are obtained for a wide range of drug doses, so that different
thrombocytopenic responses, from low toxicity to grade 3-4 toxicities, are
considered.
The model also exploits data from cell culture assays. For example, for the
estimation of the cytotoxic drug concentration, the model uses IC20, IC50 and
IC90 (the concentrations of the drug leading to inhibition of 20%, 50%, and 90%
of in vitro cell growth, respectively, as compared to untreated cells), These are
obtained from toxicity tests of the platelet lineage-committed bone marrow cells
(the CFU-Meg assay), in both human and species S-derived cells [44]. In the

To appear in Preclinical Development Handbook,Shayne Gad Ed., John Wiley and Sons, USA.
48
complex form of the model, one may also use experimental tools of cell cycle
analysis, such as standard cell-sorting assays.
Based on this data, three functions f (Eq. 7.1), denoted as finVitroHu, finVitroS, and
finVivoS for human cell cultures, species S cell cultures, and preclinical S species
studies respectively, can be evaluated. In estimating the function finVivoS, it is
necessary to consider only the drug's killing effect on bone marrow cells of
compartment X, the depletion of which is mainly responsible for platelet nadir
(see Eq. 7.1). X is identified by the time of the nadir after drug application,
taking into account the transit times of the different bone marrow compartments.
As a first approximation, only one compartment X of drug-sensitive cells is
assumed.
The parameters of function f in the clinical scenario (finVivoHu), which cannot be
estimated as in the other three cases due to lack of data, are thereby calculated
according to their counterparts: First, it is assumed that between different
species, there is a linear relation between the drug killing effect observed in vivo
and in vitro (that is, the finVivo /finVitro ratio is constant between diverse species).
The function finVivoHu is thereby obtained by shifting the IC values on the
concentration axis according to this relation, using the in vitro data of IC50
(IC50inVitroHu) and IC90 (IC90inVitroHu). The relation itself is found by comparing
the in vitro and in vivo data for species S. Then the shift of finVivoS to finVivoHu on
the concentration axis for IC50 is computed by the equation
inVitroS
inVitroHuinVivoSinVivoHu IC
ICICIC
50
505050
(7.2).
The same method can be applied for IC90.
The last step requires simulations of the model with the human parameters,
under different regimens, applying the finVivoHu effect on the same type of bone
marrow cells as in species S. The clinical toxicity profile of the drug, that is, the
induction and severity of drug-induced TP in humans, is therefore predictable.

To appear in Preclinical Development Handbook,Shayne Gad Ed., John Wiley and Sons, USA.
49
Importantly, though, this estimation is a first approximation and a safety factor
should be considered prior to initiation of clinical trials.
8. Summary
Mathematical models are instrumental in increasing the understanding of
intricate drug-patient interactions. Specifically, a mathematically-based
method, termed Z-method, has been devised for increasing efficacy/toxicity
ratio of chemotherapeutics. The method suggests that safety of cell-cycle-
specific drugs can be increased by resonating drug-pulsing with the internal
periodicity of target host cells replication. Experimental verification of the Z-
method in mice provides a proof-of-concept for the utility of biomathematics
in drug development.
Increasing model complexity, a prerequisite for the quantitative precision of
its conclusions, was performed, in the aim of providing a practical tool for
predicting drug effects on platelet counts. To this end, thrombopoiesis
models of various mammal species have been developed. Models of TPO
supportive treatment have been prospectively validated in mice and
monkeys.
Toxicity effects of IL-11 therapy and chemotherapy have been modeled and
various drug regimens were tested. Model validation under data limitation
has been examined and the need to collect patient’s recovery data has been
emphasized. The range of the treatment schedules under which the models
could reliably predict the outcomes of drug therapy under obscured
biological knowledge has been defined.
The thrombopoiesis model has been employed for suggesting TPO
administration schedules, which would maximize drug safety while
maintaining its efficacy. Dose fractionation, having a well-calculated,
species-dependent dosing interval, preserves drug effect on platelet counts,

To appear in Preclinical Development Handbook,Shayne Gad Ed., John Wiley and Sons, USA.
50
yet reduces its immunologic adverse effects below the clinically relevant
threshold.
The above schedule, adjusted by the murine thrombopoiesis model, was
validated in mice for efficacy. The monkey-adjusted schedule derived from
simulations of the simian thrombopoiesis model, was validated in Rhesus
monkeys for both efficacy and toxicity. Now the human model may be
employed for improving safety of TPO mimetics and other
thrombocytopenia alleviating drugs.
To the best of our knowledge this is the first instance of a mathematical
model generating quantitative predictions, the precision of which was
validated in the preclinical setting.
The thrombopoiesis model can be used, in conjunction with alternative
mathematical models, for deciphering unknown drug toxicity mechanisms in
different species. This can be achieved by comparing preclinical study results
with the simulated drug-affected platelet profiles, generated for different
models of putative drug toxicity mechanisms.
In order to facilitate the transition from preclinical studies to Phase I, the
mathematical models for the effect of investigational drugs on different
animal species can be adapted accordingly and simulated in the human
patient model for predicting parameters, the early estimation of which can
economize Phase I clinical trials.
9. References
[1] Agur, Z. (1982). Persistence in uncertain environments. Population Biology,
Lecture Notes in Biomathematics (eds. Freedman, H.I., Strobeck, C.)
Heidelberg, Springer-Verlag, 125-132.
[2] Agur, Z. (1985). Randomness, synchrony and population persistence. Journal
of Theoretical Biology, 112, 677-693.

To appear in Preclinical Development Handbook,Shayne Gad Ed., John Wiley and Sons, USA.
51
[3] Agur, Z., Deneubourg, JL. (1985). The effect of environmental disturbances
on the dynamics of marine intertidal populations. Theoretical Population
Biology, 27 (1), 75-90.
[4] Agur, Z. (1986). The effect of drug schedule on responsiveness to
chemotherapy. Annals of the New York Academy of Sciences, 504, 274-277.
[5] Agur, Z. (1988). Population dynamics in harshly varying environments;
evolutionary, ecological and medical aspects. Chapter in: Mathematical
Ecology (Hallam T.G., Gross, L.J., Levin, S.A., eds.) World Scientific, 440-
454.
[6] Agur, Z., Arnon, R., Schechter, B. (1988). Reduction of cytotoxicity to normal
tissues by new regimes of cell-cycle phase-specific drugs. Mathematical
Biosciences, 92, 1-15.
[7] Agur, Z., Arnon, R., Sandak, B., Schechter, B. (1991). Zidovudine toxicity to
murine bone marrow may be affected by the exact frequency of drug
administration. Experimental Hematology, 19, 364-368.
[8] Agur, Z., Arnon, R., Sandak, B., Schechter, B. (1992). The effect of the
dosing interval on myelotoxicity and survival in mice treated by cytarabine.
European Journal of Cancer, 28A (6/7), 1085-1090.
[9] Agur, Z. (1998). Resonance and anti-resonance in the design of
chemotherapeutic protocols. Journal of Theoretical Biology, 1, 237-245.
[10] Agur, Z., Ziv, I., Shohat, R., Wick, M., Webb, C., Hankins, D., Arakelyan, L.,
Sidransky, D. Using a novel computer technology for tailoring targeted and
chemotherapeutic drug schedules to the individual patient. First AACR
International Conference on Molecular Diagnostic in Cancer Therapeutic
Development. Chicago IL, USA, (2006).
[11] Al-Dabbagh, S.G., Smith, R.L. (1984) Species differences in oxidative drug
metabolism: some basic considerations. Archives of Toxicology, Suppl. 7, 219-
31.
[12] Arakelyan, L., Vainstein, V., Agur, Z. (2002). A computer algorithm
describing the process of vessel formation and maturation, and its use for

To appear in Preclinical Development Handbook,Shayne Gad Ed., John Wiley and Sons, USA.
52
predicting the effects of anti-angiogenic and anti-maturation therapy on
vascular tumor growth. Journal of Angiogenesis, 5, 203-214.
[13] Arnold, J.T., Daw, N.C., Stenberg, P.E., Jayawardene, D., Srivastava, D.K.,
Jackson, C.W. (1997). A single injection of pegylated murine megakaryocyte
growth and development factor (MGDF) into mice is sufficient to produce a
profound stimulation of megakaryocyte frequency, size, and ploidization.
Blood, 89, 823-833.
[14] Basser, R. (2002). The impact of thrombopoietin on clinical practice. Current
Pharmaceutical Design, 8(5), 369-77.
[15] Castiglione, F., Selitser, V., Agur, Z. (2003). The analyzing hypersensitive to
chemotherapy in a cellular automata model of the immune system. Chapter
in: Cancer Modelling and Simulation (Preziosi L. ed.), CRC Press, LLC, UK.
[16] Cines, D.B., Bussel, J.B., McMillan, R.B., Zehnder, J.L. Congenital and
acquired thrombocytopenia. (2004). Hematology, the American Society of
Hematology Education Program Book, 390-406.
[17] Cojocaru, L., Agur, Z. (1992). A theoretical analysis of interval drug dosing
for cell-cycle-phase-specific drugs. Mathematical Biosciences, 109, 85-97.
[18] De Serres, M., Yeager, R.L., Dillberger, J.E., Lalonde, G., Gardner, G.H.,
Rubens, C.A., Simkins, A.H., Sailstad, J.M., McNulty, M.J., Woolley, J.L.
(1999). Pharmacokinetics and hematological effects of the pegylated
thrombopoietin peptide mimetic GW395058 in rats and monkeys after
intravenous or subcutaneous administration. Stem Cells, 17, 316-326.
[19] Demetri, G.D. (2001). Targeted approaches for the treatment of
thrombocytopenia. The Oncologist, 6 (Suppl. 5), 15–23.
[20] Dykstra, K.H., Rogge, H., Stone, A., Loewy, J., Keith, J.C. Jr., Schwertschlag,
U.S. (2000). Mechanism and amelioration of recombinant human interleukin-
11 (rhIL-11)-induced anemia in healthy subjects. Journal of Clinical
Pharmacology, 40(8), 880-8.
[21] Ebbe, S., Stohlman, F. (1965). Megakaryocytopoiesis in the rat. Blood, 26,
20-35.

To appear in Preclinical Development Handbook,Shayne Gad Ed., John Wiley and Sons, USA.
53
[22] Elting, L.S., Rubenstein, E.B., Martin, C.G., Kurtin, D., Rodriguez, S., Laiho,
E., Kanesan, K., Cantor, S.B., Benjamin, R.S. (2001). Incidence, cost, and
outcomes of bleeding and chemotherapy dose modification among solid tumor
patients with chemotherapy-induced thrombocytopenia. Journal of Clinical
Oncology, 19, 1137–1146.
[23] Farese, A.M., Hunt, P., Boone, T., MacVittie, T.J. (1995). Recombinant
human megakaryocyte growth and development factor stimulates
thrombopoiesis in normal nonhuman primates. Blood, 86, 54-59.
[24] FDA White Paper on Innovation and Stagnation in drug industry, Challenges
and Opportunities on the Clinical Paths to New Medical Products, March
2004.
[25] Harker, L.A., Finch, C.A. (1969). Thrombokinetics in man. Journal of
Clinical Investigation, 48, 963-974.
[26] Harker, L.A., Hunt, P., Marzec, U.M., Kelly, A.B., Tomer, A., Hanson, S.R.,
Stead, R.B. (1996a). Regulation of platelet production and function by
megakaryocyte growth and development factor in nonhuman primates. Blood,
87, 1833-1844.
[27] Harker, L.A., Marzec, U.M., Hunt, P., Kelly, A.B., Tomer, A., Cheung, E.,
Hanson, S.R., Stead, R.B. (1996b). Dose-response effects of pegylated human
megakaryocyte growth and development factor of platelet production and
function in nonhuman primates. Blood, 88, 511-521.
[28] Haznedaroglu, I.C., Goker, H., Turgut, M., Buyukasik, Y., Benekli, M.
(2002). Thrombopoietin as a drug: biologic expectations, clinical realities, and
future directions. Clinical and Applied Thrombosis/Hemostasis, 8, 193–212.
[29] Hoffman, R., Benz, E.J., Shattil, S.J., Furie, B., Cohen, H.J., Silberstein, L.E.,
McGlave, P. Hematology 3rd ed., Churchill Livingstone, 2000.
[30] Janeway, C.A., Travers, P., Walport, M., Shlomchik, M. Immunobiology. 6th
ed. New York: Garland Science, 2005.
[31] Kabaya, K., Akahori, H., Shibuya, K., Nitta, Y., Ida, M., Kusaka, M., Kato,
T., Miyazaki, H. (1996). In vivo effects of pegylated recombinant human

To appear in Preclinical Development Handbook,Shayne Gad Ed., John Wiley and Sons, USA.
54
megakaryocytes growth and development factor on hematopoiesis in normal
mice. Stem Cells, 14, 651-660.
[32] Kararli, T.T. (1995). Comparison of the gastrointestinal anatomy, physiology,
and biochemistry of humans and commonly used laboratory animals.
Biopharmaceutics and Drug Disposition, 16(5), 351-80.
[33] Kaushansky, K., Lin, N., Grossman, A., Humes, J., Sprugel, K.H., Broudy,
V.C. (1996). Thrombopoietin expands erythroid, granulocyte-macrophage,
and megakaryocytic progenitor cells in normal and myelosuppressed mice.
Experimental Hematology, 24, 265-269.
[34] Kaushansky, K. (2005). The molecular mechanisms that control
thrombopoiesis. Journal of Clinical Investigation, 115, 3339–3347.
[35] Kaushansky, K. (2006). Lineage-specific hematopoietic growth factors. New
England Journal of Medicine, 354, 2034-45.
[36] Kheifetz, Y., Elishmereni, M., Horowitz, S., Agur, Z. (2006). Fluid-retention
side-effects of the chemotherapy-supportive treatment Interleukin-11:
Mathematical modelling as affected by data availability. Computational and
Mathematical Methods in Medicine, in press.
[37] Kheifetz, Y., Kogan, Y., Agur, Z. (2006). Long-range predictability in models
of cell populations subjected to phase-specific drugs: Growth-rate
approximation using properties of positive compact operators. Mathematical
Models and Methods in the Applied Sciences, 16 (7), 1-18.
[38] Li, J., Yang, C., Xia, Y., Bertino, A, Glaspy, J., Roberts, M., Kuter, D.J.
(2001). Thrombocytopenia caused by the development of antibodies to
thrombopoietin. Blood, 98(12), 3241-8
[39] Lin, J.H. (1995). Species similarities and differences in pharmacokinetics.
Drug Metabolism and Disposition, 23(10), 1008-21.
[40] Luoh, S., Stephanich, E., Solar, G., Steinmetz, H., Lipari, T., Pestina, T.I.,
Jackson, C.W., de Sauvage, F.J. (2000). Role of the distal half of the c-Mpl
intracellular domain in control of platelet production by thrombopoietin in
vivo. Molecular and Cellular Biology, 20, 507-515.

To appear in Preclinical Development Handbook,Shayne Gad Ed., John Wiley and Sons, USA.
55
[41] McCrae, K.R. Bussel, J.B., Mannucci, P.M., Cines, D.B. Platelets: an update
on diagnosis and management of thrombocytopenic disorders. (2001).
Hematology, the American Society of Hematology Education Program Book,
282-305.
[42] Neelis, K.J., Hartong, S.C., Egeland, T., Thomas, G.R., Eaton, D.L.,
Wagemaker, G. (1997a). The efficacy of single-dose administration of
thrombopoietin with coadministration of either granulocyte/macrophage or
granulocyte colony-stimulating factor in myelosuppressed Rhesus monkeys.
Blood, 90, 2565-2573.
[43] Phillips, R. M., Bibby, M. C., Double, J. A. (1990). A critical appraisal of the
predictive value of in vitro chemosensitivity assays. Journal of the National
Cancer Institute, 82, 1457-1468.
[44] Ratajczak, J., Machalinski, B., Samuel, A., Pertusini, E., Majka, M., Czajka,
R., Ratajczak, M.Z. (1998). A novel serum free system for cloning human
megakaryocytic progenitors (CFU-Meg). The role of thrombopoietin and
other cytokines on bone marrow and cord blood CFU-Meg growth under
serum free conditions. Folia Histochemica et Cytobiologica, 36(2), 61-6.
[45] Ribba, B., Alarcon, T., Marron, K., Maini, P.K., Agur, Z. (2005). Doxorubicin
treatment efficacy on non-Hodgkin's lymphoma: Computer model and
simulations. Bulletin of Mathematical Biology, 67, 79-99.
[46] Schermer, S. (1967). Blood morphology of laboratory animals. F.A. Davis
Co., Philadelphia, PE.
[47] Schulze, H., Shivdasani, R.A. (2005). Mechanisms of thrombopoiesis. Journal
of Thrombosis and Haemostasis, 3, 1717–24.
[48] Schwertschlag, U.S., Trepicchio, W.L., Dykstra, K.H., Keith, J.C., Turner,
K.J., Dorner, A.J. (1999). Hematopoietic, immunomodulatory and epithelial
effects of interleukin-11. Leukemia, 13(9), 1307-15.
[49] Siegers, M.P., Feinendegen, L.E., Lahiri, S.K., Cronkite, E.P. (1979). Relative
number and proliferation kinetics of hemopoietic stem cells in the mouse.
Blood Cells, 5, 211-236.

To appear in Preclinical Development Handbook,Shayne Gad Ed., John Wiley and Sons, USA.
56
[50] Skomorovski, K. Agur, Z. (2001). A new method for predicting and
optimizing thrombopoietin (TPO) therapeutic protocols in thrombocytopenic
patients and in platelet donors [abstract]. The Hematology Journal, 1 (Suppl.
1), 185.
[51] Skomorovski K., Harpak H., Ianovski A., Vardi M., Visser TP., Hartong S.,
Van Vliet H., Wagemaker G., Agur Z. (2003). New TPO treatment schedules
of increased safety and efficacy: pre clinical validation of a thrombopoiesis
simulation model. British Journal of Haematology, 123 (4), 683-691.
[52] Sola, M.C., Christensen, R.D., Hutson, A.D., Tarantal, A.F. (2000).
Pharmacokinetics, pharmacodynamics, and safety of administering pegylated
recombinant megakaryocyte growth and development factor to newborn
Rhesus monkeys. Pediatric Research, 47, 208-214.
[53] Tepler, I., Elias, L., Smith, J.W. 2nd, Hussein, M., Rosen, G., Chang, A.Y.,
Moore, J.O., Gordon, M.S., Kuca, B., Beach, K.J., Loewy, J.W., Garnick,
M.B., Kaye, J.A. (1996). A randomized placebo-controlled trial of
recombinant human interleukin-11 in cancer patients with severe
thrombocytopenia due to chemotherapy. Blood, 87(9), 3607-14.
[54] Ubezio, P., Tagliabue, G., Schechter, B., Agur, Z. (1994). Increasing 1-beta-
D-Arabinofuranosylcytosine efficacy by scheduled dosing interval based on
direct measurement of bone marrow cell kinetics. Cancer Research, 54, 6446-
6451.
[55] Ulich, T.R., del Castillo, J., Senaldi, G., Cheung, E., Roskos, L., Young, J.,
Molineux, G., Guo, J., Schoemperlen, J., Munyakazi, L., Murphy-Filkins, R.,
Tarpley, J.E., Toombs, C.F., Kaufman, S., Yin, S., Nelson, A.G., Nichol, J.L.,
Sheridan, W.P. (1999). Megakaryocytopoiesis: The prolonged hematologic
effects of a single injection of PEG-rHuMGDF in normal and
thrombocytopenic mice. Experimental Hematology, 27, 117-130.
[56] Vadhan-Raj, S., Murray, L.J., Bueso-Ramos, C., Patel, S., Reddy, S.P., Hoots,
W.K., Johnston, T., Papadopolous, N.E., Hittelman, W.N., Johnston, D.A.,
Yang, T.A., Paton, V.E., Cohen, R.L., Hellmann, S.D., Benjamin, R.S.,
Broxmeyer, H.E. (1997). Stimulation of megakaryocyte and platelet

To appear in Preclinical Development Handbook,Shayne Gad Ed., John Wiley and Sons, USA.
57
production by a single dose of recombinant human thrombopoietin in patients
with cancer. Annals of Internal Medicine, 126, 673-681.
[57] Vadhan-Raj, S. (1998). Recombinant human TPO: clinical experience and in
vivo biology. Seminars in Hematology, 35, 261–268.
[58] Vadhan-Raj, S. (2000). Clinical experience with recombinant human
thrombopoietin in chemotherapy-induced thrombocytopenia. Seminars in
Hematology, 37 (2 Suppl 4), 28-34.
[59] Vadhan-Raj, S. (2001). Recombinant human thrombopoietin in
myelosuppressive chemotherapy. Oncology (Williston Park), 15 (7 Suppl 8),
35-8.
[60] Vadhan-Raj, S., Patel, S., Bueso-Ramos, C., Folloder, J., Papadopolous, N.,
Burgess, A., Broemeling, L.D., Broxmeyer, H.E., Benjamin, R.S. (2003).
Importance of predosing of recombinant human thrombopoietin to reduce
chemotherapy-induced early thrombocytopenia. Journal of Clinical Oncology,
21, 3158-3167.
[61] Vadhan-Raj, S., Cohen, V., Bueso-Ramos, C. (2005). Thrombopoietic growth
factors and cytokines. Current Hematology Reports, 4(2), 137-44.
[62] Vainstein V., Ginosar, Y., Shoham, M., Ranmar, D., Ianovski, A., Agur, Z.
(2005). The complex effect of granulocyte on human granulopoiesis analyzed
by a new physiologically-based mathematical model. Journal of Theoretical
Biology, 234(3), 311-27.
[63] Vainstein, V., Ginosar, Y., Shoham, M., Ianovski, A., Rabinovich, A., Kogan,
Y., Selitser, V., Ariad, S., Chan, S., Agur, Z. Clinical validation of a
physiologically-based computer model of human granulopoiesis and its use
for improving cancer therapy by doxorubicin and granulocyte colony-
stimulating factor (G-CSF). Annual Meeting American Society of Hematology
(ASH), Orlando, FL, USA., 2006.
[64] Wagemaker, G., Hartong, S.C., Neelis, K.J., Egeland, T., Wognum, A.W.
(1998). In vivo expansion of hemopoietic stem cells. Stem Cells. 16 Suppl 1,
185-191.

To appear in Preclinical Development Handbook,Shayne Gad Ed., John Wiley and Sons, USA.
58
[65] Wolff, S.N., Herzig, R., Lynch, J., Ericson, S.G., Greer, J.P., Stein, R.,
Goodman, S., Benyunes, M.C., Ashby, M., Jones, D.V. Jr, Fay, J. (2001).
Recombinant human thrombopoietin (rhTPO) after autologous bone marrow
transplantation: a phase I pharmacokinetic and pharmacodynamic study. Bone
Marrow Transplantion, 27(3), 261-8.