mathematical modeling of a lithium ion battery with ... mathematical modeling of a... · extrusion...
TRANSCRIPT
S
Me
LD
a
ARRAA
KLTPT
1
pt
dtosat
2
epae
p
0d
Journal of Power Sources 196 (2011) 5985–5989
Contents lists available at ScienceDirect
Journal of Power Sources
journa l homepage: www.e lsev ier .com/ locate / jpowsour
hort communication
athematical modeling of a lithium ion battery with thermalffects in COMSOL Inc. Multiphysics (MP) software
ong Cai, Ralph E. White ∗
epartment of Chemical Engineering, University of South Carolina, 301 Main Street, Columbia, SC 29208, United States
r t i c l e i n f o
rticle history:eceived 2 February 2011eceived in revised form 7 March 2011
a b s t r a c t
The existing lithium ion battery model in Multiphysics (MP) software (COMSOL Inc., Palo Alto, CA) isextended to include the thermal effects. The thermal behavior of a lithium ion battery is studied duringthe galvanostatic discharge process with and without a pulse.
ccepted 8 March 2011vailable online 15 March 2011
eywords:ithium ion batteryhermal model
© 2011 Elsevier B.V. All rights reserved.
ulse dischargeemperature
. Introduction
The existing lithium ion battery model in COSMOL Inc. Multi-hysics 3.5a is extended here by adding an energy balance and theemperature dependence of properties of the battery.
This thermal model is developed based on the pseudo two-imensional (P2D) model which was described in [1,2] and ahermal, electrochemistry coupled model. The diffusion coefficientf Li ions in the solid phase and electrolyte, the reaction rate con-tants of the electrochemical reactions, the open circuit potentialsnd the thermal conductivity of the binary electrolyte depend onhe temperature in the model presented here.
. Mathematical model
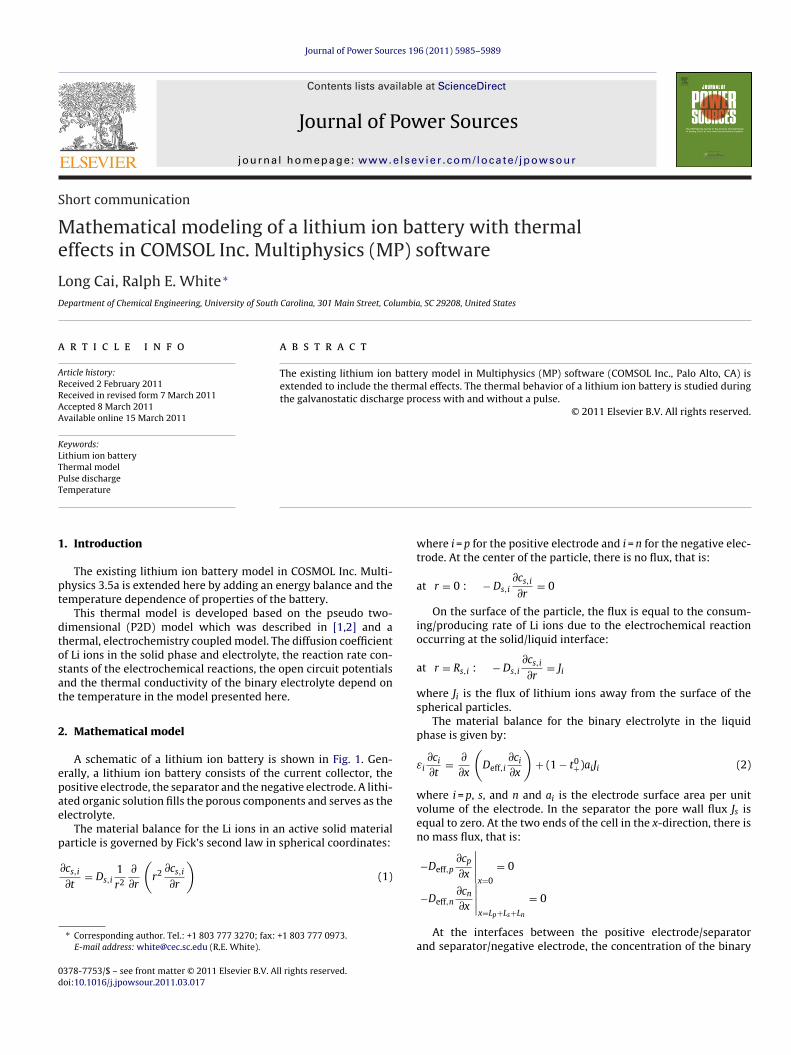
A schematic of a lithium ion battery is shown in Fig. 1. Gen-rally, a lithium ion battery consists of the current collector, theositive electrode, the separator and the negative electrode. A lithi-ted organic solution fills the porous components and serves as thelectrolyte.
The material balance for the Li ions in an active solid material
article is governed by Fick’s second law in spherical coordinates:∂cs,i
∂t= Ds,i
1r2
∂
∂r
(r2 ∂cs,i
∂r
)(1)
∗ Corresponding author. Tel.: +1 803 777 3270; fax: +1 803 777 0973.E-mail address: [email protected] (R.E. White).
378-7753/$ – see front matter © 2011 Elsevier B.V. All rights reserved.oi:10.1016/j.jpowsour.2011.03.017
where i = p for the positive electrode and i = n for the negative elec-trode. At the center of the particle, there is no flux, that is:
at r = 0 : − Ds,i∂cs,i
∂r= 0
On the surface of the particle, the flux is equal to the consum-ing/producing rate of Li ions due to the electrochemical reactionoccurring at the solid/liquid interface:
at r = Rs,i : − Ds,i∂cs,i
∂r= Ji
where Ji is the flux of lithium ions away from the surface of thespherical particles.
The material balance for the binary electrolyte in the liquidphase is given by:
εi∂ci
∂t= ∂
∂x
(Deff,i
∂ci
∂x
)+ (1 − t0
+)aiJi (2)
where i = p, s, and n and ai is the electrode surface area per unitvolume of the electrode. In the separator the pore wall flux Js isequal to zero. At the two ends of the cell in the x-direction, there isno mass flux, that is:
−Deff,p∂cp
∂x
∣∣∣∣x=0
= 0∣
−Deff,n∂cn
∂x
∣∣∣x=Lp+Ls+Ln
= 0
At the interfaces between the positive electrode/separatorand separator/negative electrode, the concentration of the binary
5986 L. Cai, R.E. White / Journal of Power S
Nomenclature
as specific interfacial area, m2 m−3
c concentration of the binary electrolyte, mol m−3
Cp specific heat, J kg−1 K−1
cs concentration of lithium ion in solid, mol m−3
De salt diffusion coefficient, m2 s−1
Ds diffusion coefficient of lithium ion in solid electrodeparticles, m2 s−1
Ecell cell voltage, VF Faraday’s constant, 96,487 C eq−1
h effective heat transfer coefficient, W m−2 K−1
Iapp applied current density, A m−2
J pore wall flux of lithium ions, mol m−2 s−1
k electrochemical reaction rate constant,m2.5 mol−0.5 s−1
L thickness of battery component, mR gas constant, 8.3145 J mol−1 K−1
Rs radius of electrode particle, mt time, sT temperature, Kt+ transference number of lithium ionU open-circuit potential, VUi,ref open circuit potential of electrode i under the refer-
ence temperature, Vx spatial coordinateε porosityεf volume fraction of fillers� density, kg m−3
�i electronic conductivity of solid matrix, S m−1
� thermal conductivity, W m−1 K−1
�1 potential in the solid phase, V�2 potential in the electrolyte, V
Subscriptseff effectivemax maximumn negative electrode
e
p positive electrodes separator
lectrolyte and its flux are continuous
cp|x=L−p
= cs|x=L+p
cs|x=(Lp+Ls)− = cn|x=(Lp+Ls)+
Fig. 1. Schematic of a lithium ion battery.
ources 196 (2011) 5985–5989
−Deff,p∂cp
∂x
∣∣∣∣x=L−
p
= −Deff,s∂cs
∂x
∣∣∣∣x=L+
p
−Deff,s∂cs
∂x
∣∣∣∣x=(Lp+Ls)−
= −Deff,n∂cn
∂x
∣∣∣∣x=(Lp+Ls)+
The effective diffusion coefficient of the binary electrolyte in theliquid phase is corrected by porosity:
Deff,i = De,iεibruggi
where the diffusion coefficient of the binary electrolyte (De,i) isgiven in Ref. [3] as follows:
De,i = 10−4 × 10−4.43−(54/(T−229−5.0×10−3ci))−0.22×10−3ci (3)
The charge balance in the solid phase is governed by Ohm’s law:
�eff,i∂2�1,i
∂x2= aiFJi (4)
where i = p and n. The effective conductivity is determinedby �eff,i = �i(1 − εi − εf,i). The specific area can be calculated byai = (3/Rs,i)(1 − εi − εf,i). At the interface of the current collector andthe positive electrode, the charge flux is equal to the current densityapplied to the cell:
−�eff,p∂�1,p
∂x
∣∣∣∣x=0
= Iapp
where Iapp is the applied current density.At the interfaces of the positive electrode/separator and the sep-
arator/negative electrode, there is no charge flux:
−�eff,p∂�1,p
∂x
∣∣∣∣x=Lp
= 0
−�eff,n∂�1,n
∂x
∣∣∣∣x=Lp+Ls
= 0
The potential of the solid phase at the right end of the cell is setto zero �1,n|x=Lp+Ls+Ln = 0, and the potential of the solid phase atx = 0, �1,p|x=0 is equal to Ecell (the cell voltage).
The charge balance in the liquid phase is based on Ohm’s lawand is given by:
− ∂
∂x
(�eff,i
∂�2,i
∂x
)+ 2RT(1 − t0+)
F
∂
∂x
(�eff,i
∂(ln ci)∂x
)= aiFJi (5)
where i = p, s and n and the specific conductivity of the binary elec-trolyte is a function of temperature and the concentration of thebinary electrolyte in the liquid phase:
�eff,i = �iεibruggi
where the expression of the ionic conductivity for the binary elec-trolyte is given in Ref. [3] as follows:
�i = 10−4 × ci(−10.5 + 0.668 × 10⁻³ci + 0.494 × 10⁻⁶c2i
+ 0.074T −1.78 × 10⁻⁵ciT − 8.86 × 10⁻¹⁰c2i T − 6.96 × 10⁻⁵T2
+2.80 × 10⁻⁸ciT2)
2(6)
At the two ends of the cell, there is no charge flux in the liquidphase: ∣ ∣
−�eff,p∂�2,p
∂x
∣∣∣x=0
= 0 and −�eff,n∂�2,n
∂x
∣∣∣x=Lp+Ls+Ln
= 0
The potential in the solution phase and its flux are continuousat the interfaces of the electrodes and the separator.

wer Sources 196 (2011) 5985–5989 5987
t
J
a
�
w
wtth
Q
Q
Q
ie
U
wp
3
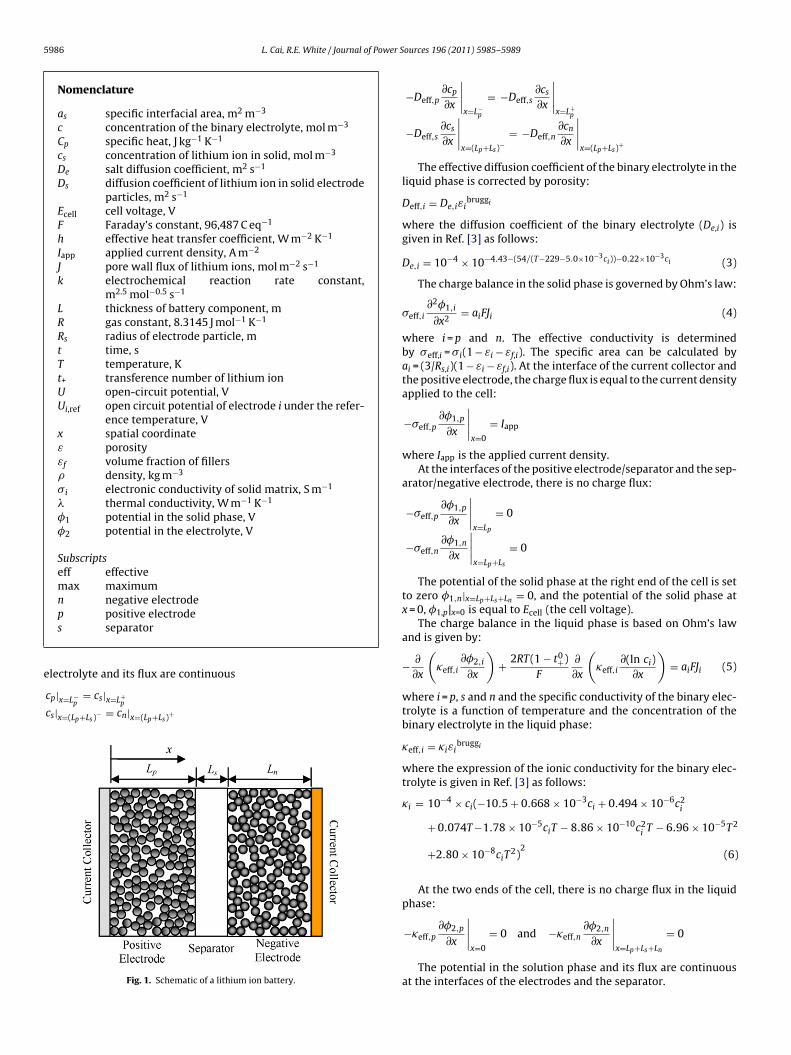
m1tatggwcdtpoptecpv
Fig. 2. Geometries and variables coupling between the geometries using COSMOLMultiphysics 3.5a. (The top 1D geometry consists of three segments which denotethe positive electrode, the separator and the negative electrode. The bottom tworectangles represent the solid phases in the positive electrode and the negativeelectrode, respectively. The pore wall flux is extracted from the 1D geometry and
the two limiting conditions. The concentration profile under theadiabatic condition is flatter than that in the isothermal case, whichindicates a better diffusion property in the electrolyte under theadiabatic condition than under the isothermal condition.
L. Cai, R.E. White / Journal of Po
In the above equations the pore wall flux, Ji, is determined byhe Bulter–Volmer equation:
i = ki(cs,i,max − cs,i,surf)0.5c0.5
s,i,surfc0.5i
×[
exp(
0.5F
RTi
)− exp
(−0.5F
RTi
)](7)
nd the overpotential of the intercalation reaction is given by:
i = �1,i − �2,i − Ui
The energy balance is given by [4,5]:
CpdT
dt= �
∂2T
∂x2+ Qrxn + Qrev + Qohm (8)
ith the boundary conditions determined by Newton’s cooling law:
−�∂T
∂x
∣∣∣∣x=0
= h (T∞ − T)
−�∂T
∂x
∣∣∣∣x=Lp+Ls+Ln
= h (T − T∞)
here h is the heat transfer coefficient, T∞ is the environmentalemperature, Qrxn is the total reaction heat generation rate, Qrev ishe total reversible heat generation rate, Qohm is the total ohmiceat generation rate. The heat fluxes are defined by:
rxn = FaJ(�1 − �2 − U)
rev = FaJT∂U
∂T
ohm = �eff
(∂�1
∂x
)2
+ �eff
(∂�2
∂x
)2
+ 2�effRT
F(1 − t0
+)∂(ln c)
∂x
∂�2
∂x
The temperature dependent open circuit potential of electrodeis approximated by Taylor’s first order expansion around a refer-nce temperature:
i = Ui,ref + (T − Tref)[
dU
dT
]i
here Ui,ref is the open circuit potential under the reference tem-erature Tref.
. The COMSOL Multiphysics (MP) 3.5a model
The mathematical model described in Section 2 is a multi-scaleodel. We developed several geometries using this software: a
D geometry which consists of three sequentially connected lineso represent the positive electrode, the separator and the neg-tive electrode, respectively, a 2D geometry which consists ofwo rectangles to denote the solid phase in the electrodes. Theeometries are shown in Fig. 2. The vertical coordinate in the 2Deometry indicates the radial direction of the solid particles. Sincee ignore the diffusion of Li ions in the x-direction in the parti-
le, the corresponding diffusion coefficient is set to zero in thisirection. The concentration of the binary electrolyte, the poten-ial in the electrolyte, the potential in the solid phase and theore wall flux are solved in the 1D geometry. The concentrationf Li ions in the solid phase is solved in the 2D geometry. Theore wall flux is extruded from the 1D domain and projected
o the top boundary of the 2D geometry by using “subdomainxtrusion coupling variables” in COMSOL Multiphysics. The con-entration of Li ions on the top boundary in the 2D geometry isrojected to the 1D domain by using “boundary extrusion couplingariables”.projected to the top boundary of the 2D geometry. The concentration of Li ions onthe top boundary of the 2D geometry is projected to the 1D domain as the surfaceconcentration of the solid particles.)
The thermal behavior of the Li ion battery during pulse dischargeis also simulated in COSMOL Multiphysics. The battery is dischargedfor 3000 s at C/2 rate first and then discharged at 3 C rate until thecell voltage drops to 2.5 V. The change of the applied current densityis implemented by using the smoothed Heaviside function “flsmhs”and is shown in Fig. 3. The model parameters can be found in Ref.[5].Simulation results
Fig. 4 shows the temperature on the cell surface at 1 C dischargeprocess under three different cooling conditions where the heattransfer coefficient is 10.0, 1.0 and 0.1 W m−2 K−1, respectively, andtwo limiting conditions: the isothermal condition and the adiabaticcondition.
The thermal effect on the cell voltage shown in Fig. 5. The cellprovides more discharge capacity when it is placed in a better heatisolation environment (i.e. adiabatic condition). In a better isolatedenvironment, the cell temperautre increases faster during the 1 Cdischarge process which results in the higher diffusion coefficientfor the binary electrolyte and reduces the diffusion limitations.
The reduction of the diffusion limit in the binary electrolyte canbe verified by comparing the concentration profile of the electrolyteunder different cooling conditions. Fig. 6 shows the concentrationprofiles of the electrolyte at the end of 1 C discharge process under
Fig. 3. Current density profile in the discharge process including a 3 C pulse.

5988 L. Cai, R.E. White / Journal of Power Sources 196 (2011) 5985–5989
Fig. 4. Temperature on the cell surface during 1 C discharge process under different cooling conditions.
roces
c1carTr
Fec
increases.The P2D model mentioned in Section 2 is also useful for simulat-
Fig. 5. Cell voltage for 1 C discharge p
Fig. 7 shows the cell temperature during the 1 C discharge pro-ess at different current rates as the heat transfer coefficient is.0 W m−2 K−1. As expected, the cell gets hotter as the dishcargeurrent rate increases. It is also noticed that the wave part which
ppears in beginning of the temperature curve at low currentate (less than 2 C) does not exist in the high current rate cases.he wave part on the temperature curve is characterised by theeversible heat generation during discharging. Under low currentig. 6. Comparison of the concentration profiles of the binary electrolyte at thend of the 1 C discharge process under the isothermal condition and the adiabaticondition.
s under different cooling conditions.
rate discharging, the reversible heat is roughly equivelant to theohmic heat, but becomes unimportant as the discharge current rate
ing the discharge process with pulse. Fig. 8 shows the cell voltageduring the C/2 discharge for 3000 s followed by a 3 C pulse dischargeuntil the cell voltage drops to 2.5 V. The corresponding temperature
Fig. 7. Temperature on the cell surface during discharge process under differentcurrent rates while the heat transfer coefficient h = 1.0 W m−2 K−1 where the DOD isdefined as: DOD = time * C rate/3600.

L. Cai, R.E. White / Journal of Power Sources 196 (2011) 5985–5989 5989
Fig. 8. Cell voltage at C/2 discharge for 3000 s followed by a 3 C pulse discharge.
F
opp
t
Fig. 10. Concentration of the binary electrolyte at the two ends of the cell (the
[
[
ig. 9. Temperature on the cell surface in the discharge process with 3 C pulse.n the surface of the cell is also plotted in Fig. 9. The surface tem-erature at the end of the 3 C pulse is slightly less than that in theure 3 C discharge process.
Fig. 10 shows the concentration of the binary electrolyte athe two ends of the cell during the pulse discharge process. At
[
[
[
bottom line is at x = 0, the top line is at x = 1.65 × 10⁻⁴ m) in the C/2 discharge processwith a 3 C pulse. Mathematical modeling of a lithium ion battery with thermal effectsin COMSOL.
the beginning of the pulse, the concentration of the electrolytechanges extremely, after that it relaxes and tend to a stablevalue.
5. Conclusions
The thermal behavior of a lithium ion battery during galvano-static discharge w/o pulse can be predicted by using COMSOLMultiphysics (MP) 3.5a. Though better thermal isolation environ-ment improves the discharge capacity, the higher cell temperatureraises the risk of thermal runaway and more rapid degradation ofthe cell.
References
1] M. Doyle, T.F. Fuller, J. Newman, Journal of Electrochemical Society 140 (1993)1526–1533.
2] T.F. Fuller, M. Doyle, J. Newman, Journal of Electrochemical Society 141 (1994)1–10.
3] N. Lars Ole Valoen, Journal of Electrochemical Society 152 (2005) A882–A891.
4] W.B. Gu, C.Y. Wang, Journal of Electrochemical Society 147 (2000) 2910–2922.
5] K. Kumaresan, G. Sikha, R.E. White, Journal of Electrochemical Society 155 (2008)A164–A171.