mathematical modeling the risk of growing …nlcsk.org/images/docs/orava/holecy.pdf · mathematical...
TRANSCRIPT

MATHEMATICAL MODELING THE RISK OF GROWING SPRUCE STANDS
Jan Holecy
Technical University of Zvolen
A lecture held for the participants of the workshopSPRUCE FORESTS DECLINE IN THE BESKYDY MOUNTAINS
Reasons, Impacts, Solutions
ORAVSKA POLHORA, 04. 12., 2008

OBJECTIVE:
To explain the essence and assessment of risk concerning growing
spruce forest stands in the presence of aggregated
forest
management
risk.

CONTENT:
• Introduction• Definitions of basic concepts• Paradigm of risk and its shifting• Description of hazard• Measurement of risk• Economic analysis of risk• Conclusions• Institutional framework for accepting the risk in
forestry

INTRODUCTION
Spruce is the most endangered tree species grown in the territory of Slovakia.


AN ANSWER:
No, we cannot; but we must act as we do.
(Douglas & Wildawsky, 1983)
A QUESTION:
Can we know the risks we face, now or in the future?
Definition
of
hazard:
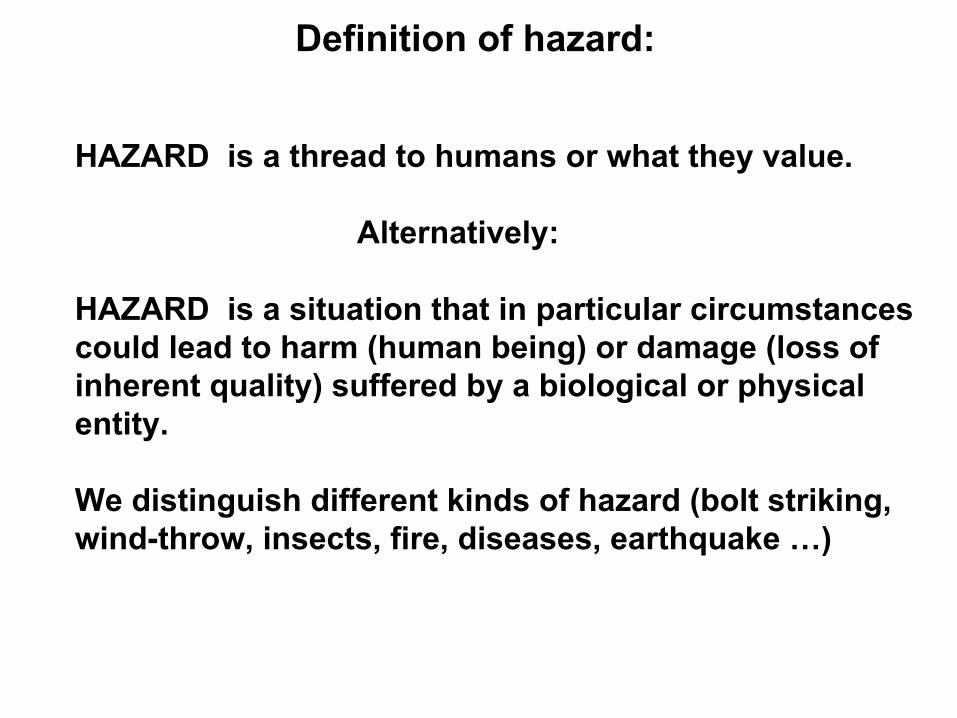
HAZARD is a thread to humans or what they value.
Alternatively:
HAZARD is a situation that in particular circumstances could lead to harm (human being) or damage (loss of inherent quality) suffered by a biological or physical entity.
We distinguish different kinds of hazard (bolt striking, wind-throw, insects, fire, diseases,
earthquake …)

Definition of vulnerability:
Resistance Resilience
Hazard
event
/ stressor
Forest ecosystem performance after
a disaster
„Normal“
performance
level
of the forest
ecosystem
(may
be
subject
of a silvicultural
pattern)
Forest ecosystem performance after
the
impact
of a stressor
VULN
ERA
BIL
ITY
(dam
age
pote
ntia
l)
0 Time
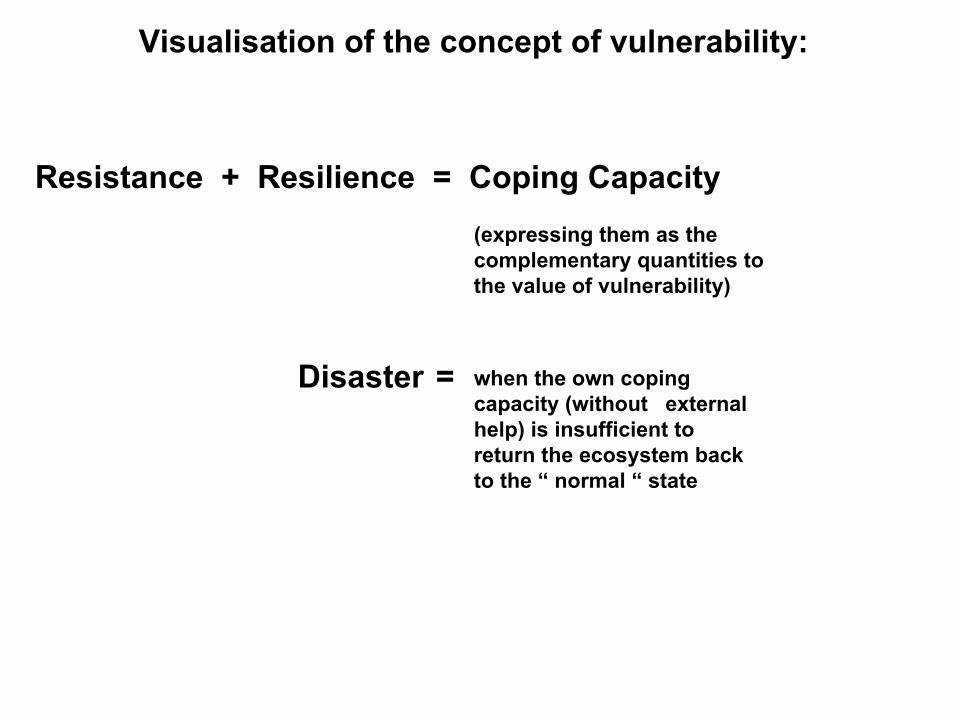
Visualisation
of the
concept
of vulnerability:
Resistance
+ Resilience
= Coping
Capacity(expressing
them
as the complementary
quantities
to the
value
of vulnerability)
Disaster
= when
the
own
coping capacity
(without
external help) is
insufficient
to return
the
ecosystem
back to the
“
normal “
state

The concept of the economic vulnerability of forest :
VFSV ( t ) = FSV ( t ) –
SVFS ( t )
VFSV ( t )
is the vulnerable forest stand value at age ( t ) and
FSV ( t )
- the forest stand value at age ( t )
SVFS ( t )
- the salvage value of a forest stand after its
it refers to the endangered value of a forest stand
damaging or destruction at age ( t )
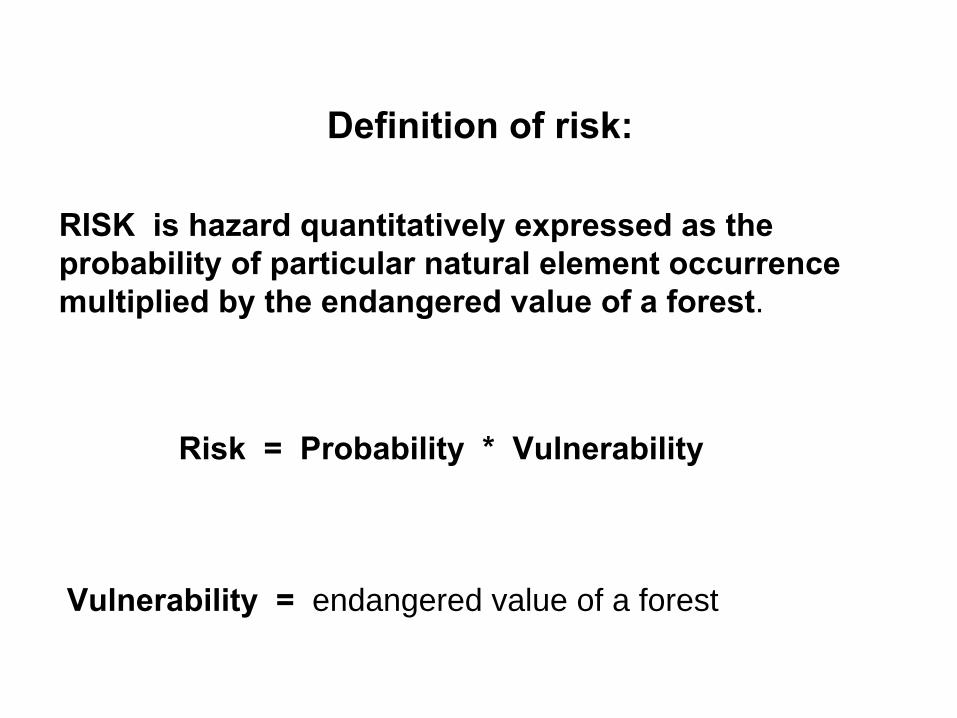
Definition of risk:
RISK is hazard quantitatively expressed as the probability of particular natural element occurrence multiplied by the endangered value of a forest.
Risk = Probability * Vulnerability
Vulnerability = endangered value of a forest

Risk
= ∑
Probability
* Vulnerabilitykinds
of hazard
Economic interpretation of risk concerning management of forest:
Vulnerability is referred to in terms of money.
Analysed hazards:
FUNGHI, IMMISSIONS, INSECTS, WIND-THROW

A PARADIGM OF RISK AND ITS SHIFTING
Ensuring security forestry requires a paradigm shift in the concept of disaster prevention and preparedness.
Instead of starting with a focus on natural hazards and their quantification, the assessment and ranking the vulnerability of forest should serve as the starting point in defining the priorities and means of remedial interventions.
Old Paradigm
Focus on naturalhazards
and theirQuantification
From
the
„securityforestry“
New Paradigm
Focus on the
assess-ment
and ranking
ofVulnerability
To the
„risk
forestry“

DESCRIPTION OF HAZARD
Data:
Areas of spruce forests destroyed by natural elements in the territory of Central Slovakia.
Source:
National Forest Inventory Database
Institute for Forest Management
Planning in Zvolen, Slovakia
Period
of observation:
1993 – 2002
Area
of observed
forest
land:
144 276 ha

Modelling the probabilities of forest stands destruction by the occurrence of natural elements:
Point estimate of the population proportion ( f ):
∑
∑
=
== k
ii
k
ii
N
nf
1
1 nnk
ii =∑
=1and NN
k
ii =∑
=1
ni is expected destroyed area of forest within the age class ( i )
Ni - expected area of forest within the age class ( i )
k - number of assumed age classes
MEASUREMENT OF RISK

Problem:
Observed destruction probabilities related to the age of forest stands prove to be significantly different .
Solution:
Weibull probability distribution W(c,γ) described by its distribution function F( t )
as proposed by KOUBA (2002) and
von GADOW (2000):
( ) γtcetF .1 −−=
where (
t
)
denotes the age of a forest stand.

Probability of destruction during 1 year related to the age of forest stand ( t ) is presented by point estimates
of
probabilities p( t ) expressed in terms of the following relation:
( ) ( )N
ntFktp .Δ= , i. e.
( ) ( ) ftFktp ..Δ=

FUNGHI AREA AREA POPULATION UNIFORM DESTROYED
AGE GROWN DESTROYED PROPORTION AREA EXPECTED
( ha ) ( ha ) ( ha ) ( ha )
( t ) A( t ) a1( t ) f( t ) N( t ) n1( t )
10 100 564 0,0000 0,000000 96 184,29 0,0000
20 142 236 0,3630 0,000003 96 184,29 0,2455
30 120 596 4,6350 0,000038 96 184,29 3,6967
40 101 685 9,4436 0,000093 96 184,29 8,9327
50 92 353 8,0820 0,000088 96 184,29 8,4173
60 140 941 23,4453 0,000166 96 184,29 16,0001
70 156 814 43,2313 0,000276 96 184,29 26,5166
80 158 220 26,0004 0,000164 96 184,29 15,8061
90 158 583 26,1754 0,000165 96 184,29 15,8759
100 107 606 15,4539 0,000144 96 184,29 13,8136
110 54 157 9,4249 0,000174 96 184,29 16,7388
120 31 036 1,1710 0,000038 96 184,29 3,6289
130 15 429 0,0000 0,000000 96 184,29 0,0000
140 9 292 0,0000 0,000000 96 184,29 0,0000
150 53 251 0,0000 0,000000 96 184,29 0,0000
TOTAL 1 442 764 167,4257 0,001348 1 442 764,30 129,6722
f = 0,000089878

IMMISSIONS AREA AREA POPULATION UNIFORM DESTROYED
AGE GROWN DESTROYED PROPORTION AREA EXPECTED
( ha ) ( ha ) ( ha ) ( ha )
( t ) A( t ) a2( t ) f( t ) N( t ) n2( t )
10 100 564 0,0000 0,000000 96 184,29 0,0000
20 142 236 7,9865 0,000056 96 184,29 5,4007
30 120 596 8,3109 0,000069 96 184,29 6,6286
40 101 685 8,5683 0,000084 96 184,29 8,1048
50 92 353 6,7350 0,000073 96 184,29 7,0144
60 140 941 20,9819 0,000149 96 184,29 14,3189
70 156 814 32,6695 0,000208 96 184,29 20,0384
80 158 220 18,7566 0,000119 96 184,29 11,4025
90 158 583 37,8301 0,000239 96 184,29 22,9448
100 107 606 31,7129 0,000295 96 184,29 28,3469
110 54 157 20,5264 0,000379 96 184,29 36,4552
120 31 036 22,9173 0,000738 96 184,29 71,0229
130 15 429 24,7629 0,001605 96 184,29 154,3698
140 9 292 14,3322 0,001542 96 184,29 148,3503
150 53 251 95,0511 0,001785 96 184,29 171,6849
TOTAL 1 442 764 351,1417 0,007341 1 442 764,30 706,0830
f = 0,000489396

INSECTS AREA AREA POPULATION UNIFORM DESTROYED
AGE GROWN DESTROYED PROPORTION AREA EXPECTED
( ha ) ( ha ) ( ha ) ( ha )
( t ) A( t ) a3( t ) f( t ) N( t ) n3( t )
10 100 564 6,8600 0,000068 96 184,29 6,5612
20 142 236 7,9865 0,000056 96 184,29 5,4007
30 120 596 12,9459 0,000107 96 184,29 10,3253
40 101 685 10,0885 0,000099 96 184,29 9,5428
50 92 353 23,4148 0,000254 96 184,29 24,3862
60 140 941 25,4116 0,000180 96 184,29 17,3420
70 156 814 56,7233 0,000362 96 184,29 34,7922
80 158 220 72,5926 0,000459 96 184,29 44,1302
90 158 583 69,2337 0,000437 96 184,29 41,9917
100 107 606 54,7123 0,000508 96 184,29 48,9050
110 54 157 20,8738 0,000385 96 184,29 37,0722
120 31 036 13,7866 0,000444 96 184,29 42,7261
130 15 429 2,5672 0,000166 96 184,29 16,0038
140 9 292 1,2245 0,000132 96 184,29 12,6746
150 53 251 1,9965 0,000037 96 184,29 3,6061
TOTAL 1 442 764 380,4177 0,003696 1 442 764,30 355,4600
f = 0,000246374

WIND-THROW AREA AREA POPULATION UNIFORM DESTROYED
AGE GROWN DESTROYED PROPORTION AREA EXPECTED
( ha ) ( ha ) ( ha ) ( ha )
( t ) A( t ) a4( t ) f( t ) N( t ) n4( t )
10 100 564 2,2900 0,000023 96 184,29 2,1903
20 142 236 95,8376 0,000674 96 184,29 64,8083
30 120 596 83,4329 0,000692 96 184,29 66,5439
40 101 685 77,7304 0,000764 96 184,29 73,5254
50 92 353 129,3974 0,001401 96 184,29 134,7659
60 140 941 290,8510 0,002064 96 184,29 198,4891
70 156 814 325,8261 0,002078 96 184,29 199,8507
80 158 220 346,5683 0,002190 96 184,29 210,6845
90 158 583 396,2250 0,002499 96 184,29 240,3191
100 107 606 311,8958 0,002899 96 184,29 278,7908
110 54 157 159,5729 0,002946 96 184,29 283,4042
120 31 036 80,8229 0,002604 96 184,29 250,4775
130 15 429 44,1908 0,002864 96 184,29 275,4817
140 9 292 15,0001 0,001614 96 184,29 155,2637
150 53 251 43,1177 0,000810 96 184,29 77,8807
TOTAL 1 442 764 2402,7589 0,026121 1 442 764,30 2 512,4759
f = 0,001741432
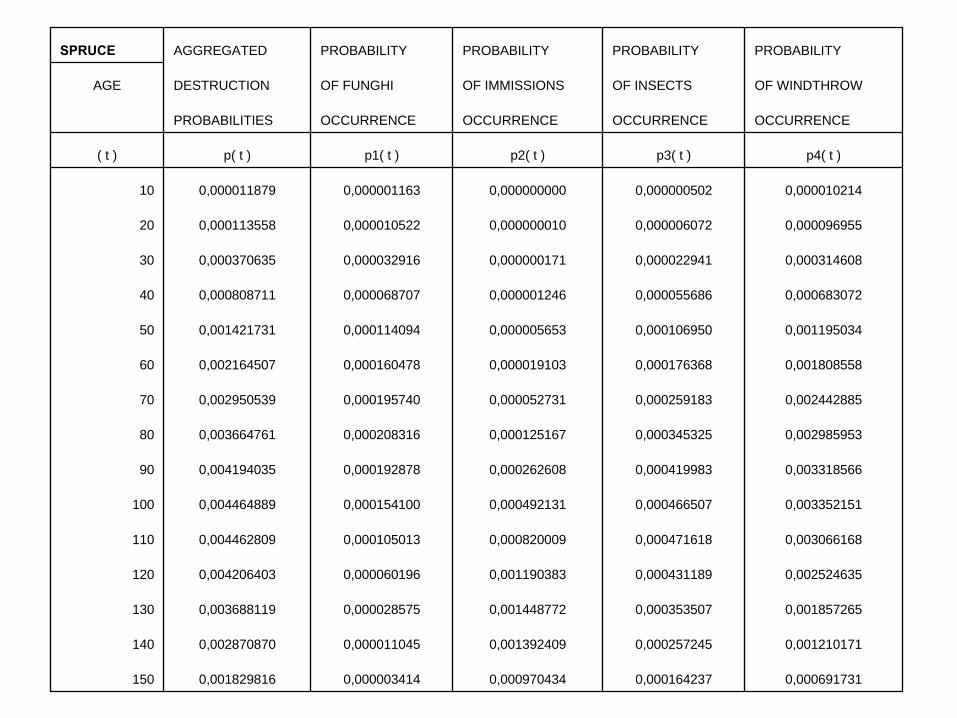
SPRUCE AGGREGATED PROBABILITY PROBABILITY PROBABILITY PROBABILITY
AGE DESTRUCTION OF FUNGHI OF IMMISSIONS OF INSECTS OF WINDTHROW
PROBABILITIES OCCURRENCE OCCURRENCE OCCURRENCE OCCURRENCE
( t ) p( t ) p1( t ) p2( t ) p3( t ) p4( t )
10 0,000011879 0,000001163 0,000000000 0,000000502 0,000010214
20 0,000113558 0,000010522 0,000000010 0,000006072 0,000096955
30 0,000370635 0,000032916 0,000000171 0,000022941 0,000314608
40 0,000808711 0,000068707 0,000001246 0,000055686 0,000683072
50 0,001421731 0,000114094 0,000005653 0,000106950 0,001195034
60 0,002164507 0,000160478 0,000019103 0,000176368 0,001808558
70 0,002950539 0,000195740 0,000052731 0,000259183 0,002442885
80 0,003664761 0,000208316 0,000125167 0,000345325 0,002985953
90 0,004194035 0,000192878 0,000262608 0,000419983 0,003318566
100 0,004464889 0,000154100 0,000492131 0,000466507 0,003352151
110 0,004462809 0,000105013 0,000820009 0,000471618 0,003066168
120 0,004206403 0,000060196 0,001190383 0,000431189 0,002524635
130 0,003688119 0,000028575 0,001448772 0,000353507 0,001857265
140 0,002870870 0,000011045 0,001392409 0,000257245 0,001210171
150 0,001829816 0,000003414 0,000970434 0,000164237 0,000691731

PROBABILITIES OF A SPRUCE STAND DESTRUCTION DUE TO THE EXPECTED OCCURRENCE OF PARTICULAR HAZARDS
0,000
0,001
0,002
0,003
0,004
0,005
1 2 3 4 5 6 7 8 9 10 11 12 13 14 15
Age classes ( t )
Prob
abili
ty p
er 1
yea
r
TOTAL FUNGHI IMMISSIONS INSECTS WINDTHROW
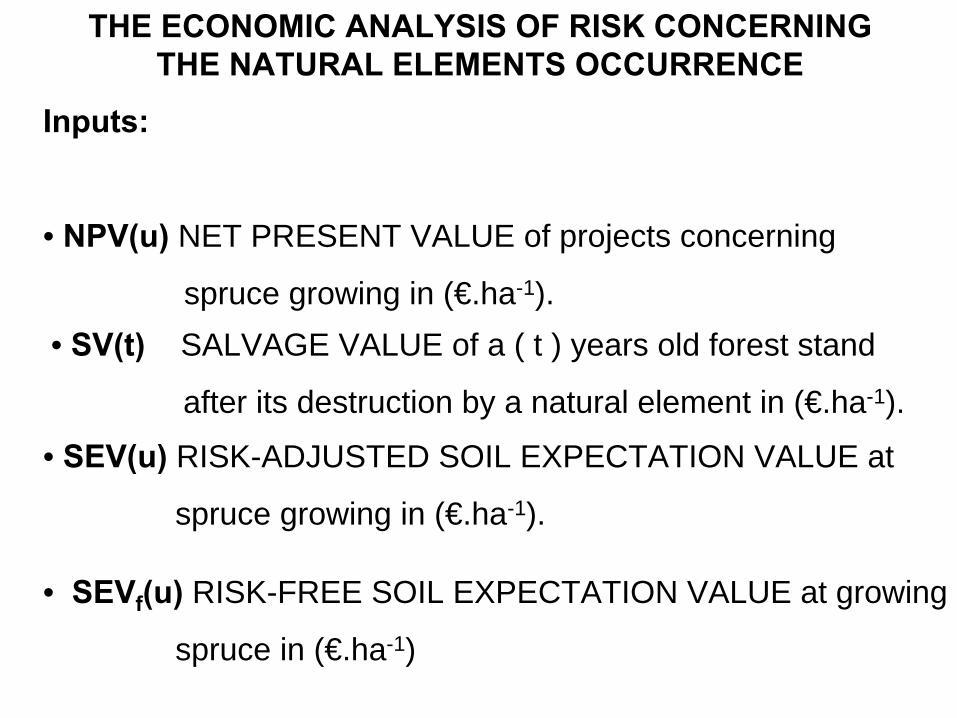
THE ECONOMIC ANALYSIS OF RISK CONCERNING THE NATURAL ELEMENTS OCCURRENCE
Inputs:
• NPV(u)
NET PRESENT VALUE of projects concerning
spruce growing in (€.ha-1).• SV(t)
SALVAGE VALUE of a ( t ) years old forest stand
after its destruction by a natural element in (€.ha-1).
• SEV(u)
RISK-ADJUSTED SOIL EXPECTATION VALUE at
spruce growing in (€.ha-1).
• SEVf
(u)
RISK-FREE SOIL EXPECTATION VALUE at growing
spruce in (€.ha-1)

1. Net present value of a forestry project NPV( u )
2. Risk adjusted soil expectation value SEV( u )
∑= +
−=
u
tttt
rCR
uNPV0 )1(
)(
1r)(1r)(1 . )()( u
u
−++
=uNPVuSEV

4. Risk-free soil expectation valueSEVf
( u ) (REED, 1984) but presented only in the form of a
differential equation.
The algorithm of its calculation uses the transition probability matrix ( W ) as a tool for the description of age class structure dynamics in the presence of risk.
3. Salvage value of a ( t ) years old forest stand SV( t )

w1
1-w1
0 0 … 0w2
0 1-w2
0 … 0.
. . .
.
. . ..
. . .
W
=
wj
0 0 1-wj
… 0.
. . .
.
. . ..
. . .
wk
0 0 0 … 1-wk
( wj
) is the probability of a stand destruction in the age class ( j )
( wk
) = 1.0
Transition probability matrix (
W )

The share of particular age classes ( j ) on 1 ha originally planted during the assumed decades ( i ) of a forestry project is given by the elements of vector p(i):
p(i)
= p(0)
. Wi
where p(0)
= [1, 0, 0,…, 0]
KOUBA (1989)

The shares of expected destroyed areas are described by the elements of ( qij
):
qij = pij . gj
gj+1 = pre g1 = w1
Gentan probabilities ( gj ) were proposed by SUZUKI (1983)
11
).1( +=∏ − j
j
ij ww
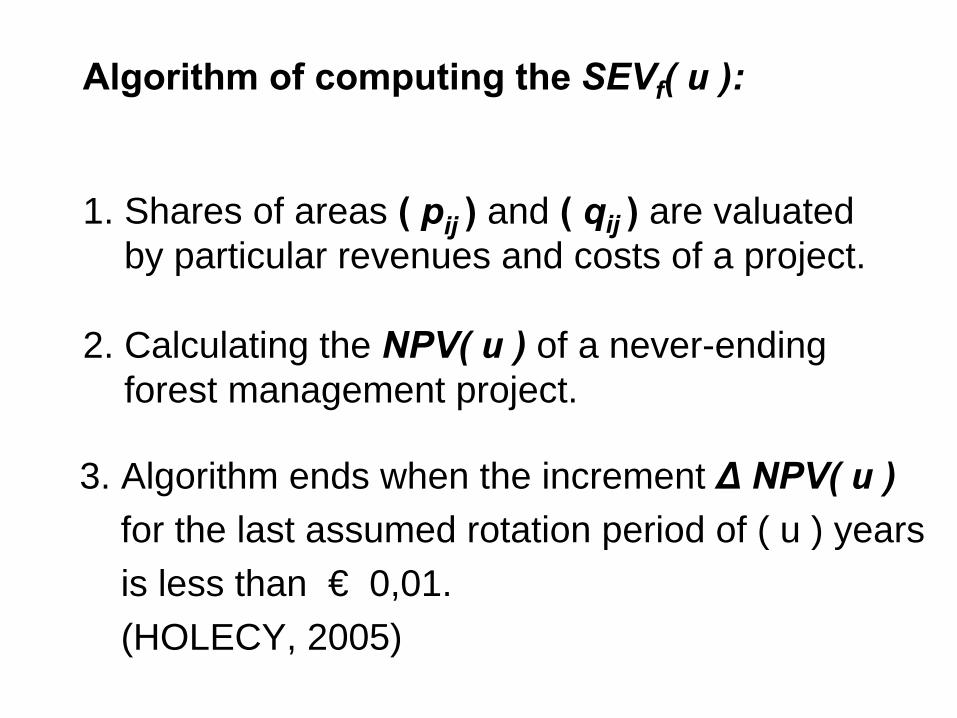
Algorithm of computing the
SEVf
( u ):
1. Shares of areas (
pij
)
and (
qij
)
are valuated by particular revenues and costs of a project.
2. Calculating the NPV( u )
of a never-ending forest management project.
3. Algorithm ends when the increment Δ
NPV( u )for the last assumed rotation period of ( u ) years is less than € 0,01.(HOLECY, 2005)
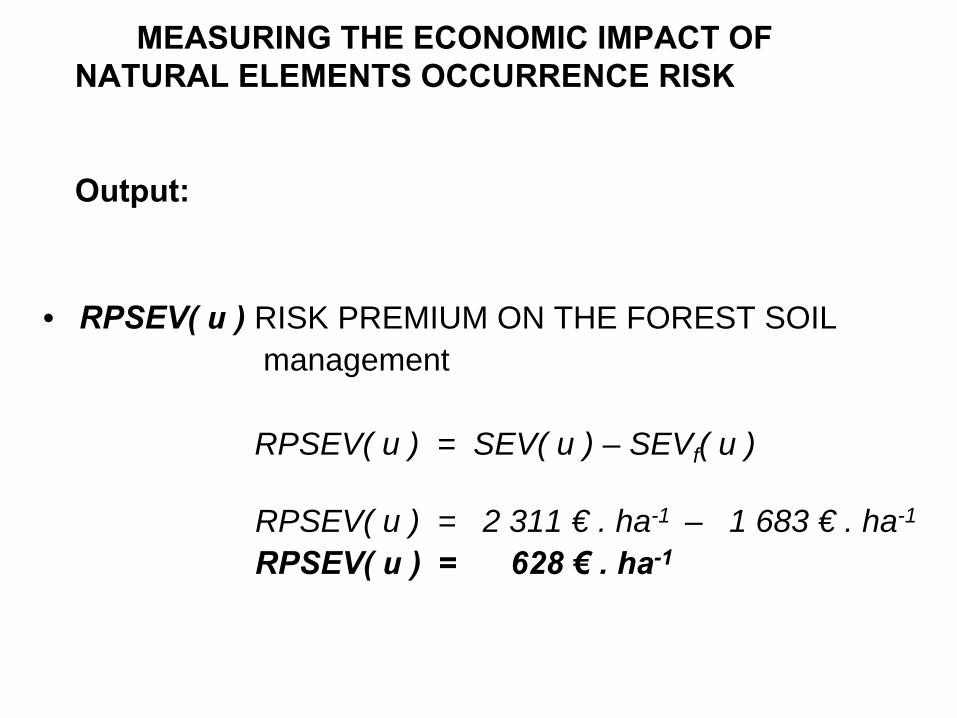
MEASURING THE ECONOMIC IMPACT OF NATURAL ELEMENTS OCCURRENCE RISK
Output:
• RPSEV( u
)
RISK PREMIUM ON THE FOREST SOIL management
RPSEV( u ) = SEV( u ) – SEVf ( u )
RPSEV( u ) = 2 311 € . ha-1 – 1 683 € . ha-1
RPSEV( u
) =
628
€
. ha-1

TABLE 1: Input data for the spruce management project
SPRUCE: yield-class: 28
AGE STUMPAGE THINNINGS REVENUES COSTS
VALUE VALUE
( t ) ST( t ) TH( t ) R( t ) C( t )
(years) (€ .ha-1) (€ .ha-1) (€ .ha-1) (€ .ha-1)
0 0 0 0 1648
10 0 0 0 1252
20 0 0 0 287
30 911 140 140 104
40 2028 299 299 104
50 3548 451 451 104
60 5023 535 535 104
70 5895 553 553 104
80 6989 551 551 104
90 7664 524 524 104
100 8550 535 535 104
110 9220 504 504 104
120 10488 521 521 104
130 10982 501 501 104
140 11598 471 471 104
150 12085 437 12522 104

TABLE 2: The economic analysis of a spruce management project according to the expected decennial cash-flows
SPRUCE: yield-class: 28
AGE DISCOUNT DISCOUNTED DISCOUNTED DISCOUNTED DISCOUNTED NET SOIL
FACTORS STUMPAGE THINNINGS THINNINGS COSTS PRESENT EXPECTATION
ACCUMMULATED ACCUMMULATED VALUE VALUE
( t ) ( p = 0.01 p.a. ) DST( t ) DTH( t ) DTHA( t ) DCA( t ) NPV( u ) SEV( u )
(years) (€ .ha-1) (€ .ha-1) (€ .ha-1) (€ .ha-1) (€ .ha-1) (€ .ha-1)
0 1,000000 0 0 0 1648 -1648
10 0,951466 0 0 0 2840 -2840 -58507
20 0,861349 0 0 0 3087 -3087 -22263
30 0,779768 711 109 109 3168 -2348 -10659
40 0,705914 1432 211 320 3241 -1489 -5062
50 0,639055 2267 288 608 3307 -431 -1195
60 0,578528 2906 310 918 3367 457 1085
70 0,523734 3087 289 1207 3421 874 1835
80 0,474129 3314 261 1469 3470 1312 2496
90 0,429223 3290 225 1694 3514 1469 2574
100 0,388570 3322 208 1902 3555 1669 2730
110 0,351768 3243 177 2079 3591 1731 2671
120 0,318451 3340 166 2245 3624 1960 2876
130 0,288289 3166 144 2389 3654 1901 2671
140 0,260984 3027 123 2512 3681 1858 2514
150 0,236266 2855 103 2615 3705 1765 2311

TABLE 3: The calculation of the Vulnerable Forest Stand Value according to its age
SPRUCE: yield-class: 28
AGE FOREST SALVAGE RISK VULNERABLE
EXPECTATION VALUE OF PREMIUM ON FOREST
VALUE FOREST FOREST STAND
STAND SOIL VALUE
( t ) FEV( t ) SV( t ) RPSEV( u ) VFSV( t )
(years) (€ .ha-1) (€ .ha-1) (€ .ha-1) (€ .ha-1)
0 0 0 628 628
10 1850 0 628 2479
20 3669 0 628 4297
30 4611 0 628 5240
40 5295 0 628 5924
50 5875 1821 628 4683
60 6348 2282 628 4695
70 6777 2646 628 4760
80 7232 2943 628 4918
90 7736 3207 628 5158
100 8323 4684 628 4267
110 8958 4878 628 4709
120 9695 5006 628 5318
130 10490 5159 628 5959
140 11391 5327 628 6692
150 12419 5421 628 7626

CONCLUSIONS
1. The risk is considerably higher at growing
older spruce
stands.
2. The impact of the all
disturbances
on the capital
value of forest land is very strong.
3. The risk of management
at growing pure spruce stands could be decreased by planting mixed forests composed
also of beech, maple and ash-tree.

INSTITUTIONAL FRAMEWORK FOR ACCEPTING THE RISK IN FORESTRY
• Deterioration of forest and other ecosystems• Decreasing the quality of the environment• Disturbing the sustainability of forestry• Reduction of social benefits accruing from forestry• Decreasing the profitability of forest enterprises• Decreasing the financial stability of forest enterprises
Negative impacts of risk attending the forest management:

Remedial interventions to cope the presence of risk in forestry:
• Ecosystem management approach.• Planting the ecologically more stable mixed forests.• Preservation and strengthening the biological diversity.• Collaborative and participative planning approaches.• Insurance of spruce forests in order to strengthen the
financial stability of forest land management.

THANK YOU FOR YOUR ATTENTION !