mathematical modelling of phage dynamics: applications in stec studies tom evans
Post on 20-Dec-2015
220 views
TRANSCRIPT

Mathematical Modelling of Phage Dynamics:
Applications in STEC studies
Tom Evans

1. Some biology
2. Molecular level modelling
3. Population level modelling

1. Some biology
• Shiga toxin-encoding bacteriophages (Stx phages).
• Encode the toxins Stx1 or Stx2• Temperate, i.e. following infection of an E. coli
cell by Stx phage, either lysis or lysogeny will occur
• Lysis leads to the death of the bacterial cell• If the lysogenic pathway is selected, the phage
inserts its DNA into the bacterial chromosome. Thus the bacteria survives and gains some new genes.

• ST strains of E. coli can cause disease in humans
• They enter the human food chain via livestock
• Symptoms include bloody diarrhoea and kidney failure

• What are the processes at the molecular level which govern the lysis/lysogeny switching mechanism and hence the rate at which toxins are released?
• Can a resident population of phages (bacteria) be invaded by a mutant strain of phages (bacteria)? For example, can a more virulent strain of phages invade a less virulent strain, and if so what are the implications for the spread of toxins?

2. Molecular level modelling
• Suppose that a single E. coli cell is infected by a single Stx phage.
• Then either the lytic or the lysogenic response will be induced.
• What determines which of these outcomes occurs?
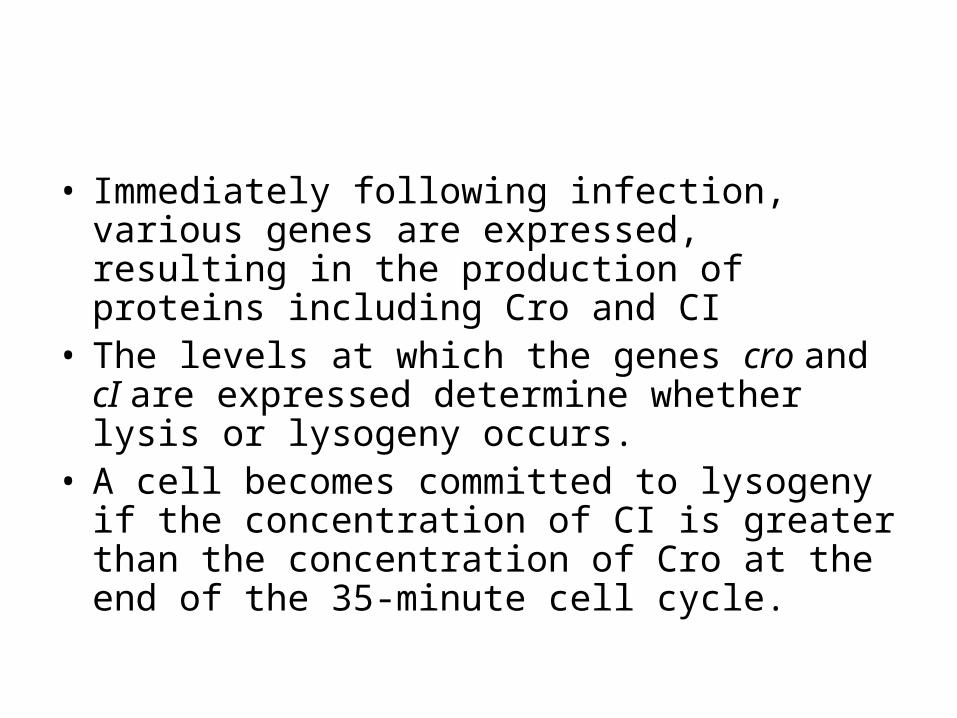
• Immediately following infection, various genes are expressed, resulting in the production of proteins including Cro and CI
• The levels at which the genes cro and cI are expressed determine whether lysis or lysogeny occurs.
• A cell becomes committed to lysogeny if the concentration of CI is greater than the concentration of Cro at the end of the 35-minute cell cycle.

• A model can be used to simulate the lysis/lysogeny decision making process.
• Arkin et al (1998) describes a model of the system, and uses a “stochastic” computer algorithm to simulate its behaviour.
• The model consists of sets of:– Chemical species– Chemical reactions between the species– The rates at which the reactions take place

• The model allows for random behaviour
• Thus, the rate constants are actually probabilities per unit time of a reaction event taking place.
• Low numbers of molecules mean that random effects are likely to be significant

• For example, in order for the CI protein to function it must first form a dimer.
• Therefore the model must include a reaction which represent dimerization of CI:
CI + CI CI2• We must also specify a rate law, which
determines how frequently this reaction occurs: k1*[CI][CI] – k2*[CI2]

• All the important reactions and their rate laws must be included in the model. Complicated.
• The model can then be used to simulate the levels of the Cro and CI proteins during the 35-minute cell cycle.
• The model must be run many times to establish what happens on average.

Time (minutes)
0 35

Summary of Molecular Level Modelling
• A version of the Arkin model is available as part of the “Dynetica” simulation tool.
• Can be used to run simulations of the lysis-lysogeny switching mechanism for Stx phages.
• No new work as yet.

3. Population Dynamics and Evolution
• As well as considering what happens at the molecular level, we can look at how populations of phages and bacteria interact.
• Assume that populations of bacteria, phages and lysogens exist in a given environment.
• Also assume that resources flow into this environment
• We can write down equations which specify the rates at which the populations change over time.
• Stewart and Levin (1983) and Mittler (1996).

• The equations include factors such as– The adsorption rate (delta)– The phage burst size (beta)– The proportion of phage infections which lead
to lysogeny (lambda)– The ability of bacteria to take in resources
from the environment (psi)
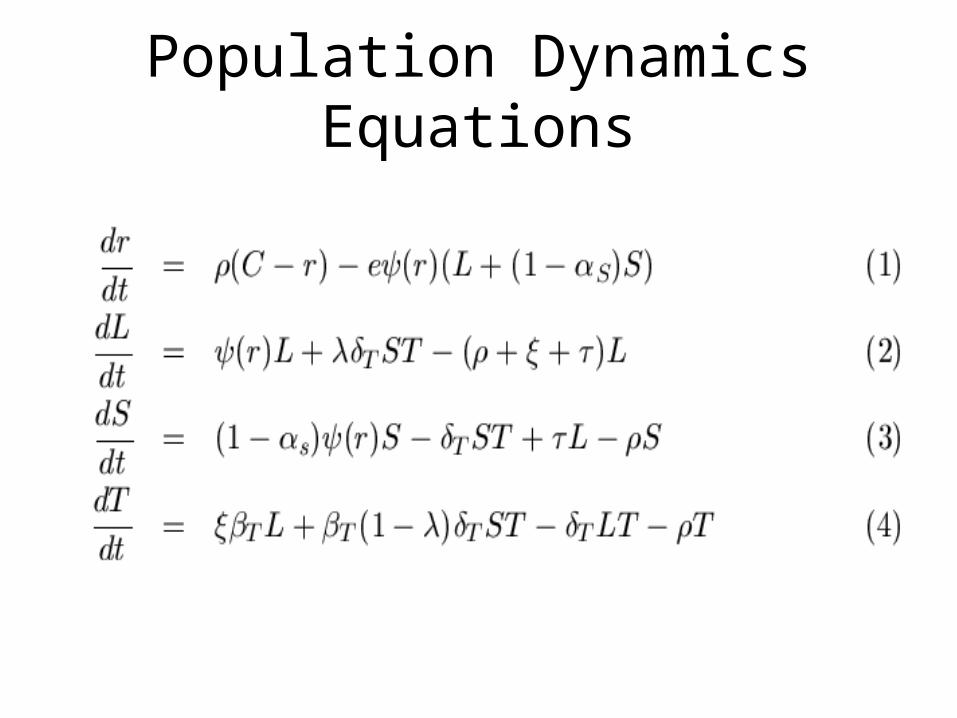
Population Dynamics Equations


• Once the equations have been specified, a computer program can be used to simulate the populations over time.
• These simulations can be used to help answer questions about the way in which phage and bacterial populations change over time.

• As well as looking at the population dynamics of phages and bacteria, we can look at how different characteristics evolve through successive generations
• For example, suppose that E. coli strains differ only in two parameters: (i) their resistance to phage infection and (ii) their ability to take in resources from their environment
• Also suppose that we have a resident population which consists of a single strain of E. coli (i.e. all members of this population have the same values for the two parameters)
• If a few mutant E. coli cells with a different values of one or both parameters emerges, will this mutant population be able to grow in number, or will it just die out?
• The answer depends on the relative fitness levels of the resident and mutant populations.

A Fitness Equation
• 1=resident
• 2=invading mutant
• Fitness of invading mutant
• Where

A Pairwise Invasibility Plot (PIP)

Summary of Population Level Modelling
• Used to model population dynamics and evolution
• Simulate populations of phages and bacteria. Find equilibria.
• Establish “optimal” evolutionary strategies for phages and bacteria
• New work

Conclusion
• Modelling at two different levels: Molecular and Population
• Ultimately the two levels should be combined in a single model
• Not easy to do