mathematics achievement: a comparative study of …
TRANSCRIPT

The Pennsylvania State University
The Graduate School
College of Education
THE EFFECT OF SUPPLEMENTARY TUTORING ON STUDENTS’
MATHEMATICS ACHIEVEMENT: A COMPARATIVE STUDY OF JAPAN
AND THE UNITED STATES
A Dissertation in
Educational Theory and Policy
and
Comparative and International Education
by
Izumi Mori
2012 Izumi Mori
Submitted in Partial Fulfillment
of the Requirements
for the Degree of
Doctor of Philosophy
December 2012

ii
The dissertation of Izumi Mori was reviewed and approved* by the following:
Suet-ling Pong
Professor of Education, Demography, and Sociology
Dissertation Advisor
Chair of Committee
David P. Baker
Professor of Education and Sociology
David Johnson
Professor of Sociology, Human Development and Family Studies, and
Demography
Kathryn Hynes
Assistant Professor of Human Development and Family Studies and
Demography
Soo-yong Byun
Assistant Professor of Educational Theory and Policy
Mindy Kornhaber
Associate Professor of Education
Program Coordinator of Educational Theory and Policy
*Signatures are on file in the Graduate School

iii
ABSTRACT
Supplementary tutoring, also known as shadow education, private tutoring, or out-of-
school tutoring, refers to a range of organized tutoring practices in academic subjects that
occur outside regular school hours. This study used the 2006 Programme for International
Student Assessment (PISA) and compared between the United States and Japan, two
countries with different patterns of dominant use of supplementary tutoring. The study
addressed the following three questions: (1) What factors affect students’ participation in
supplementary tutoring in the United States and Japan? (2) What are the effects of
supplementary tutoring on students’ mathematics achievement in the two countries? (3)
Do the effects differ by student subgroups in each country? This study distinguished
between two types of supplementary tutoring: out-of-school tutoring (taught by non-
school teachers) and school-tutoring (taught by schoolteachers). The study used
propensity score matching as an analytic strategy, which created counterfactual groups
that were as similar as possible to facilitate comparison between the treated and
controlled subjects. Nearest-neighbor method, stratification method, and kernel method
were used along with the conventional OLS method. Regarding the background of
participation, supplementary tutoring in Japan was largely represented by out-of-school
tutoring as a private service, used by middle-class students for obtaining academic
excellence. In contrast, supplementary tutoring in the United States was typically
represented by in-school tutoring as a social service, used by low-achieving students in
low-SES schools for ensuring minimum proficiency. The study obtained no statistically
significant estimates of the effects of either type of tutoring in two countries. These
results suggested that while the students’ opportunities to receive tutoring varied, the
academic consequences of tutoring did not vary among students. Methodological issues
in using propensity score methods were identified in the study, and their implications for
meeting causal assumptions were discussed.

iv
TABLE OF CONTENTS
LIST OF FIGURES…………………………………………………………………….. .vi
LIST OF TABLES………………………………………………………………......…...vii
ACKNOWLEDGEMENTS……………………………………………………………...ix
Chapter 1 INTRODUCTION…………………………………………………………….1
Purpose of the Study………………………………………………………………….3
Organization of the Dissertation……………………………………………………...4
Chapter 2 LITERATURE REVIEW……………………………………………………..5
Shadow Education/Private Supplementary Tutoring………………………………....5
Out-of-School-Time Lessons/Afterschool Tutoring………………………………….9
Comparing Two Bodies of Research………………………………………………..11
Single-Country Studies……………………………………………………………..13
Multiple-Country Studies…………………………………………………………...17
Factors that Affect Students' Participation in Supplementary Tutoring…………….18
Theoretical Considerations on the Role and Impact of Supplementary
Tutoring…………………….. ……………………………………...................22
Effect of Supplementary Tutoring on Students' Academic Achievement……….….23
The Effect of Private Tutoring…………………………………………………...27
The Effect of Afterschool Tutoring/Out-of-School Tutoring……………………32
Chapter 3 RESEARCH METHODOLOGY…………………………………………...39
Research Questions…………………………………………………………………39
Data and Measures.…………………………………………………………………39
Counterfactual Analysis for Causal Inference……………………………………...47
Propensity Score Methods.…………………………………………………………50
Advantages of Propensity Score Methods....……………………………………52
Applications of Propensity Score Methods………………………………..……53
Missing Data.………………………………………………………………………57
Chapter 4 EMPIRICAL RESULTS…………………………………………………....59
Participation in Supplementary Tutoring…………………………………….….….59
Differences between Tutored and Non-tutored Students……………………….… 61

v
Estimating Propensity Scores…………………………………………………..…...68
Matching Using Estimated Propensity Scores……………………………………...80
Covariate Balance before and after Propensity Score Matching……………………89
Causal Effect of Tutoring Participation on Students' Mathematics Achievement….95
Heterogeneity of the Causal Effect of Tutoring Participation……..………………102
Chapter 5 SUMMARY AND DISCUSSIONS... ………………………………….…108
Summary of Main Findings……………...……………………………………...…110
Relevance for Theory and Policy...………………………………………….….....115
Methodological Issues………………..……………………………………….…...117
Recommendations for Future Research…………………………………………...121
REFERENCES………………………………………………………………………...123
APPENDIX……………………………………………………………………………129
Appendix A Measures on Supplementary Tutoring………………………..….….129
Appendix B Missing Data……………………………...........................................131
Appendix C Correlation Matrix……………………………………….……….…133
Appendix D Full OLS Results…………………………………………………....136
Appendix E Propensity Score Distribution with Trimming…………....................142

vi
LIST OF FIGURES
Figure 2.1 Conceptual Model on the Effect of Supplementary Tutoring on
Mathematics Achievement…………………………………………………….26
Figure 4.1 Propensity Score Distribution with Common Support, Out-of-school
Tutoring, United States……………………………………………………...…76
Figure 4.2 Propensity Score Distribution with Common Support, School Tutoring,
United States…………………………………………………………………...77
Figure 4.3 Propensity Score Distribution with Common Support, Out-of-school
Tutoring, Japan…………………………………………………………………79
Figure 4.4 Propensity Score Distribution with Common Support, School Tutoring,
Japan…………………………………………………………………………....80
Figure 4.5 Propensity Score Distribution before and after Matching (Nearest
Neighbor), Out-of-school Tutoring, United States…………………………….82
Figure 4.6 Propensity Score Distribution before and after Matching (Nearest
Neighbor), School Tutoring, United States…………………………………….85
Figure 4.7 Propensity Score Distribution before and after Matching (Nearest
Neighbor), Out-of-school Tutoring, Japan…………………………………..…86
Figure 4.8 Propensity Score Distribution before and after Matching (Nearest
Neighbor), School Tutoring, Japan……………………………………….……88
vii
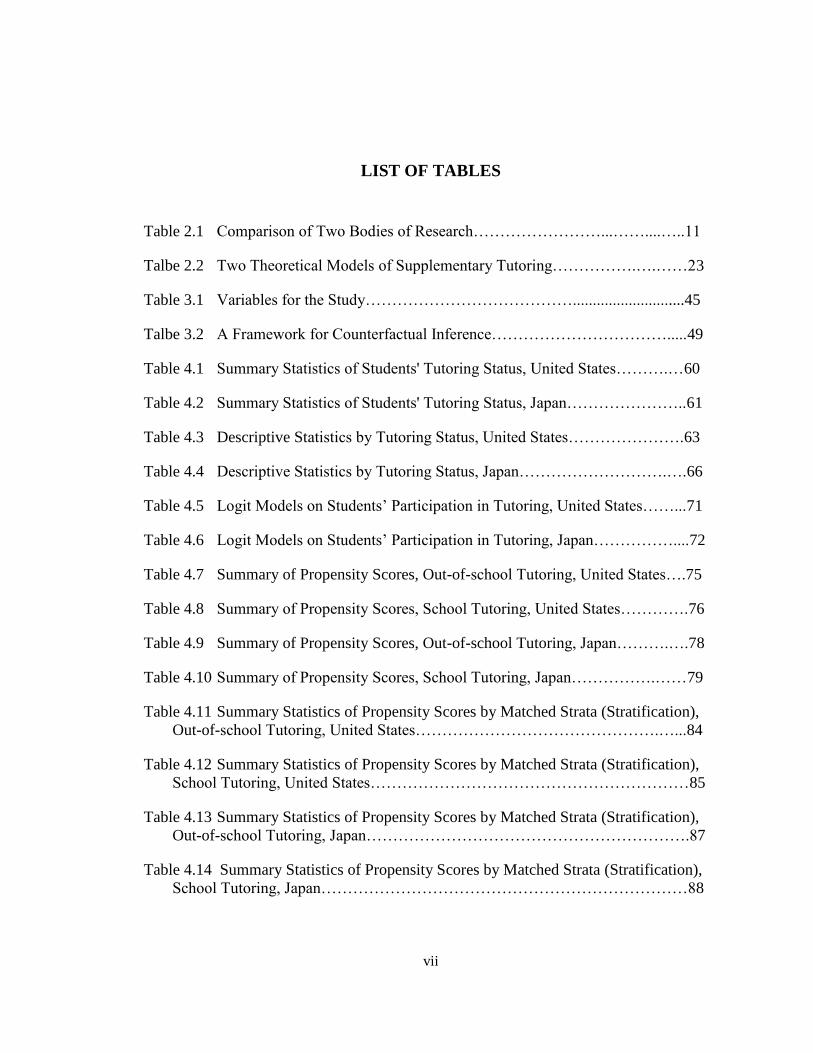
LIST OF TABLES
Table 2.1 Comparison of Two Bodies of Research……………………...……....…..11
Talbe 2.2 Two Theoretical Models of Supplementary Tutoring…………….….……23
Table 3.1 Variables for the Study…………………………………............................45
Talbe 3.2 A Framework for Counterfactual Inference…………………………….....49
Table 4.1 Summary Statistics of Students' Tutoring Status, United States……….…60
Table 4.2 Summary Statistics of Students' Tutoring Status, Japan…………………..61
Table 4.3 Descriptive Statistics by Tutoring Status, United States………………….63
Table 4.4 Descriptive Statistics by Tutoring Status, Japan……………………….….66
Table 4.5 Logit Models on Students’ Participation in Tutoring, United States……...71
Table 4.6 Logit Models on Students’ Participation in Tutoring, Japan……………....72
Table 4.7 Summary of Propensity Scores, Out-of-school Tutoring, United States….75
Table 4.8 Summary of Propensity Scores, School Tutoring, United States………….76
Table 4.9 Summary of Propensity Scores, Out-of-school Tutoring, Japan……….….78
Table 4.10 Summary of Propensity Scores, School Tutoring, Japan…………….……79
Table 4.11 Summary Statistics of Propensity Scores by Matched Strata (Stratification),
Out-of-school Tutoring, United States……………………………………….…...84
Table 4.12 Summary Statistics of Propensity Scores by Matched Strata (Stratification),
School Tutoring, United States……………………………………………………85
Table 4.13 Summary Statistics of Propensity Scores by Matched Strata (Stratification),
Out-of-school Tutoring, Japan…………………………………………………….87
Table 4.14 Summary Statistics of Propensity Scores by Matched Strata (Stratification),
School Tutoring, Japan……………………………………………………………88
viii
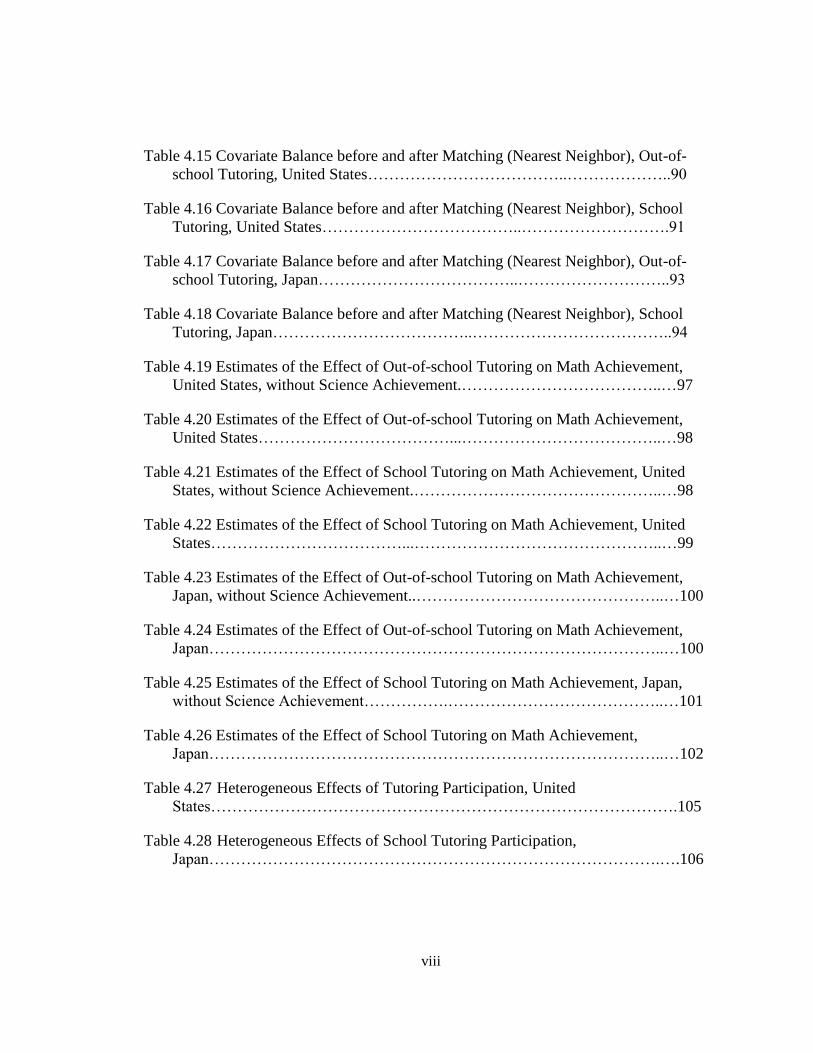
Table 4.15 Covariate Balance before and after Matching (Nearest Neighbor), Out-of-
school Tutoring, United States………………………………..………………..90
Table 4.16 Covariate Balance before and after Matching (Nearest Neighbor), School
Tutoring, United States………………………………..……………………….91
Table 4.17 Covariate Balance before and after Matching (Nearest Neighbor), Out-of-
school Tutoring, Japan………………………………..………………………..93
Table 4.18 Covariate Balance before and after Matching (Nearest Neighbor), School
Tutoring, Japan………………………………..………………………………..94
Table 4.19 Estimates of the Effect of Out-of-school Tutoring on Math Achievement,
United States, without Science Achievement.………………………………..…97
Table 4.20 Estimates of the Effect of Out-of-school Tutoring on Math Achievement,
United States………………………………...………………………………..…98
Table 4.21 Estimates of the Effect of School Tutoring on Math Achievement, United
States, without Science Achievement.………………………………………..…98
Table 4.22 Estimates of the Effect of School Tutoring on Math Achievement, United
States………………………………...………………………………………..…99
Table 4.23 Estimates of the Effect of Out-of-school Tutoring on Math Achievement,
Japan, without Science Achievement..………………………………………..…100
Table 4.24 Estimates of the Effect of Out-of-school Tutoring on Math Achievement,
Japan…………………………………………………………………………..…100
Table 4.25 Estimates of the Effect of School Tutoring on Math Achievement, Japan,
without Science Achievement…………….…………………………………..…101
Table 4.26 Estimates of the Effect of School Tutoring on Math Achievement,
Japan…………………………………………………………………………..…102
Table 4.27 Heterogeneous Effects of Tutoring Participation, United
States…………………………………………………………………………….105
Table 4.28 Heterogeneous Effects of School Tutoring Participation,
Japan………………………………………………………………………….….106

ix
ACKNOWLEDGEMENTS
First and foremost, I would like to thank my advisor Dr. Suet-ling Pong for
guiding and encouraging me throughout the course of my dissertation research. Her
precise and straightforward advice has always benefited me to extend my capacity as a
researcher. I would also like to thank Dr. David Baker for sharing with me his expertise
in cross-national research and co-authoring a paper on shadow education. Among the
committee members, Dr. David Johnson gave me valuable statistical advice on my
analysis and answered my questions whenever I visited his office. Dr. Kate Hynes shared
her expertise on afterschool programs and encouraged me to emphasize the policy
perspective. Dr. Soo-yong Byun gave me critical comments that motivated me to publish
articles from this dissertation.
I would also like to acknowledge the institutional supports from the Department
of Education Policy Studies and the Population Research Institute at Penn State.
Dr. Gordon De Jong provided me with a demography scholarship to complete my
dissertation. The Fulbright Program (the Japan-U.S. Educational Commission and the
Institute of International Education) has generously funded my initial years of study at
Penn State. Without all of these supports, my graduate study in the U.S. would not have
been possible.
Finally, I would like to thank my parents and my beloved friends for their
unconditional love and support during the pursuit of my doctoral degree. I am happy to
finish the dissertation defense in the beautiful summer in State College.

1
Chapter 1
INTRODUCTION
Beyond school hours, many students across the world engage in supplementary
tutoring. Supplementary tutoring, also known as shadow education, private tutoring, or
out-of-school tutoring, refers to a range of organized tutoring practices in academic
subjects that occur outside regular school hours. Whether at school, home, commercial
institutions or community organizations, students receive extra lessons in academic
subjects to support their learning in formal schools. While schools continue to serve as
the primary institution for educating children, the prevalence of supplementary tutoring
suggests that learning also takes place outside school. By engaging in supplementary
tutoring of various forms, students may deepen their understanding of school subjects,
receive remedial instruction, or practice for system-wide standardized tests and national
examinations.
Today, supplementary tutoring exists all over the world (Baker et al., 2001; Bray
1999). For example, it has existed for decades in Japan, where more than half of today’s
middle school students receive some type of academic tutoring outside school
(Monbukagakusho, 2008). Families pay for tutoring, expecting these extra lessons to
increase their children’s academic achievement. Supplementary tutoring is relatively rare
in the United States but has also grown over the past decades, especially under the No
Child Left Behind (NCLB) legislation that uses such out-of-school lessons to boost
students’ academic achievement.

2
While sharing an overall goal, variation exists in types of supplementary tutoring.
For example, supplementary tutoring that is privately funded and administered constitutes
a huge for-profit industry in many East Asian countries. Supplementary tutoring that is
publicly funded and privately administered is observed under the supplemental
educational services policy of the NCLB in the United States. Besides variation in
funding and administration, location may also vary. Supplementary tutoring may take
place at school facilities, community centers, commercial institutions, or students’ homes,
led by schoolteachers or other instructors. Despite such differences in forms, at the core
of all these tutoring practices is one single aim: to support students’ academic learning
outside of formal school settings.
Across societies, many students receive such services, expecting tutoring lessons
to have some positive academic impact. However, researchers have only begun to address
the issue of the causal effect of supplementary tutoring in recent years (Briggs, 2001;
Heinrich et al., 2010; Kuan, 2011; Lauer et al., 2006). Research findings on the
effectiveness of supplementary tutoring remain inconclusive to date. In particular, only a
handful of studies have adequately addressed the methodological problem of selection
bias. Selection is the key issue in estimating the causal effect of supplementary tutoring,
because students who receive supplementary tutoring are likely to be selected according
to their characteristics, including prior academic achievement, socioeconomic status, and
motivation. Failure to control for these factors may bias estimates of the causal effect of
tutoring.

3
Specifically, two types of selection may be found in student participation in
supplementary tutoring. One is positive selection when high-SES students are more likely
to engage in supplementary tutoring. This is the case in Japan, where middle-class
students engage in tutoring on a private basis (Mori & Baker, 2010; Stevenson & Baker,
1992; Yamamoto & Brinton, 2010). The other is negative selection when low-SES
students are more likely to engage in supplementary tutoring. This is the case in the
United States, where poor and underachieving students receive tutoring lessons via public
funding (U.S. Department of Education, 2007; Weiss et al., 2009). As these examples
suggest students’ participation in supplementary tutoring is often affected by various
selection factors for different countries. Causal effect of supplementary tutoring on
educational outcomes needs to be examined after approximately controlling for such
selection.
In addition to addressing selection for the overall group of students, causal effects
may vary by student subgroups. Previous studies have suggested that the effect of
supplementary tutoring may be stronger for certain types of students who may derive
greater benefits from it than other students (Kuan, 2011; Lauer et al., 2006). When
populations are heterogeneous, estimates of the causal effect corrected for selection bias
may not be applicable to the overall group.
Purpose of the Study
The purpose of this study is to examine whether and how supplementary tutoring
increases students’ academic achievement. I focus on two countries that have different

4
patterns of selection in supplementary tutoring: the United States and Japan. I also
examine heterogeneous effects by student subgroups. More specifically, I ask the
following questions: (1) What factors affect students’ participation in supplementary
tutoring in the United States and Japan? (2) What are the effects of supplementary
tutoring on students’ mathematics achievement in the two countries? (3) Do the effects
differ by student groups in each country?
Organization of the Dissertation
The structure of my thesis is as follows. In chapter 2, I will review relevant
literature in order to provide empirical and theoretical perspectives on the background
and effect of supplementary tutoring. In chapter 3, I will describe data and variables for
the study and introduce propensity score matching as an analytic strategy. In chapter 4, I
will show the results of my analysis and interpret the findings. In the final chapter, I will
summarize the findings, discuss methodological and policy implications of the study, and
provide recommendations for future research.

5
Chapter 2
LITERATURE REVIEW
In this chapter, I first introduce two existing bodies of research on supplementary
tutoring: shadow education/private tutoring, and out-of-school-time lessons/afterschool
tutoring. By reviewing these two research trends, I distinguish some key dimensions of
supplementary tutoring described in each literature. I then introduce single-country
studies and multiple-country studies on supplementary tutoring to explain how
researchers have investigated this phenomenon worldwide. Following these reviews, I
introduce empirical studies on the factors that affect students’ participation in tutoring. I
then examine theoretical explanations of the effect of supplementary tutoring. Finally, I
examine empirical literature on the effect of supplementary tutoring on students’
academic achievement and identify selection bias as a key methodological issue to be
addressed.
Shadow Education/Private Supplementary Tutoring
In examining the issue of supplementary tutoring, I review two relevant bodies of
literature. Throughout the review, I clarify terminologies relevant to the study of
supplementary tutoring and identify the focus of my study. One body of research focuses
on shadow education or private tutoring; the other body of research focuses on out-of-
school-time lessons or afterschool tutoring organized by the school. Although these two

6
bodies of studies are rooted in different research traditions and have a slightly different
focus, both are relevant in defining the subject of my study. In one of the earlier studies
(Stevenson & Baker, 1992), shadow education was defined as a set of out-of-school
educational activities designed to enhance students’ formal school career. These activities
include a set of undertakings ranging from commercial afterschool classes and private
home tutors, to correspondence courses. Stevenson and Baker argued that the use of
shadow education improved a student’s chance of successfully moving through the
allocation process in formal schooling.
Bray (1999) described private supplementary tutoring as a shadow education
system, noting that “shadow” is used as a metaphor in the following sense:
First, private supplementary tutoring only exists because the mainstream
education exists; second, as the size and shape of the mainstream system change,
so do the size and shape of supplementary tutoring; third, in almost all societies
much more public attention focuses on the mainstream than on its shadow; and
fourth, the features of the shadow system are much less distinct than those of the
mainstream system (Bray, 1999, p. 17).
Baker and his colleagues (2001) further defined shadow education as “outside-
school learning activities paralleling features of formal schooling used by students to
increase their own educational opportunities”, noting that it includes “organized,
structured learning opportunities that take on school-like processes” (p. 2). Examples of

7
shadow education include a range of activities such as correspondence courses, one-on-
one private tutoring, examination preparatory courses, and full-scale preparatory
examination schools. The authors suggested that shadow education occurs worldwide,
and is particularly extensive in Japan, Hong Kong, Singapore, Taiwan, Korea, Greece,
and Turkey.
While shadow education has gained in popularity as a term for this particular
activity, private tutoring (or private supplementary tutoring) often signifies the same
phenomenon. In The Shadow education system: Private tutoring and its implications for
planners, Bray (1999) defined private tutoring as having the following three elements: 1)
supplementation to mainstream schools, 2) privateness, and 3) academic subjects.
Supplementation means that tutoring covers subjects already covered in school.
Privateness means that tutoring is provided at private expense1. Academic subjects
indicate that academic subjects are the main focus, whereas lessons in music, art, and
sports are excluded. This definition has been widely used in subsequent international
studies on private tutoring.
The terms shadow education and private tutoring (or private supplementary
tutoring) are often used interchangeably (Bray, 1999, 2009; Ireson et al., 2005; Lee &
Shouse, 2011). However, specific nuances held by each term are also recognized in the
literature. For example, while private tutoring has an image of “one-on-one” tutoring of
1 Therefore, the author explicitly focused on “tutoring provided by private entrepreneurs and
individuals for profit-making purposes” (Bray, 1999, p. 20).

8
an individual, shadow education has an image of extra lessons that “shadow” teachings in
the mainstream school system (Buchmann et al., 2010; Byun & Park, 2012)2 .
One issue with such terminology is the lack of clear definition on the funding
aspect of supplementary tutoring. Bray (2003, pp. 19–20) wrote that private
supplementary tutoring focuses on tutoring provided by tutors for financial gain, and “it
is not concerned with extra lessons that are given by mainstream teachers to needy pupils,
on a voluntary basis, outside school hours.” Following Bray’s definition, private tutoring
means that “tutoring is received on a fee-paying basis” (p. 20). This view does not
necessarily hold for shadow education. Although private supplementary tutoring is
widely called shadow education, whether shadow education simply refers to a fee-paying
service or also includes free tutoring is not explicitly stated.
Despite such ambiguity in the definition, in many cases both shadow education
and private tutoring tend to refer to supplementary tutoring that is market-driven and
used on an individual basis. These types of tutoring often take place in private institutions
or private homes of tutors and tutees, and are largely free from governmental control. As
these lessons often require substantial fees that are outside poor families’ available
resources, they tend to create inequality between those who can afford such lessons and
those who cannot. Thus, shadow education or private tutoring signifies a form of private
education outside the formal education system that may not be available to all students.
2 Some countries have a specific term for shadow education or private supplementary tutoring.
This includes juku in Japan, hagwon in South Korea, buxiban in Taiwan, and dersane in Turkey.
9
Out-of-School-Time Lessons/Afterschool Tutoring
Another major body of research on supplementary tutoring is called out-of-
school-time lessons or afterschool tutoring (e.g., Lauer et al., 2006; Weiss et al., 2009).
These studies have mainly developed in the United States over the past decades. There
has been a policy effort to provide quality afterschool programs for school-aged children
under federal initiatives such as the 21st Century Community Learning Centers (21st
CCLC) program3. Unlike privately-funded supplementary tutoring, this type of tutoring is
publicly funded. Therefore, it tends to serve low-achieving students (sometimes described
as “at-risk” students) or families with fewer resources to allocate toward educational
opportunities. These tutoring programs are provided for free or for a small fee. They are
often held at school as a school-based program, or in the community as a community-
based program.
Out-of-school-time lessons or afterschool tutoring is often considered a social
service provided by the government or by non-profit institutions. These afterschool
programs tend to have a wider purpose that is not limited to raising students’ academic
achievement. Rather, the range of purposes includes providing a safe environment for
children, providing childcare for working mothers, and developing students’ career and
personality. However, among such purposes, academic achievement is gaining a greater
3 The 21
st CCLC program was implemented in 1997 by the U.S. federal government to support
academic achievement, provide enrichment opportunities, and reduce risky behaviors. Because
the program focuses on achievement, students are enrolled regardless of mother’s working status
(Hynes & Sanders, 2010).

10
focus in the recent U.S. policy climate to emphasize academic standards. As these
tutoring programs are based on a policy initiative, a number of studies examining the
quality and effect of tutoring have emerged in recent years. At the core of these
evaluation studies is the desire to demonstrate the effectiveness of tutoring in supporting
students’ learning. By providing additional learning opportunities for students who need
help, publicly-funded tutoring aims to close the achievement gap and reduce educational
inequality between students.
“Afterschool program” as a broader term refers to a range of programs with a
variety of content and goals. Hynes and Sanders (2010) raised two main purposes of
afterschool programs that relate to social changes in the United States. One is afterschool
as childcare. In response to the rise in maternal employment since the 1960s, a demand
for non-maternal childcare increased, which paved the way for more afterschool
programs. Afterschool programs that served as a type of childcare were also supported by
a substantial increase in childcare funding since the mid-1990s. Another purpose is
afterschool as developmental and academic support. This includes engaging youths in
project-based learning, providing a safe afterschool environment, helping working
mothers, and promoting career development for older youths. In addition, as schools face
pressure to improve the academic performance of students who have social, emotional,
and health issues, out-of-school time provides a suitable opportunity to support these
students outside regular school hours (Hynes & Sanders, 2010).

11
Comparing Two Bodies of Research
To summarize, studies on shadow education/private tutoring usually examine
supplementary tutoring provided by individuals or for-profit institutes and paid for by
families. On the other hand, studies of out-of-school-time lessons/afterschool tutoring
examine supplementary tutoring provided by schools or communities and funded by the
government. Research on the former type of tutoring is conducted at the worldwide level,
whereas research on the latter type of tutoring is conducted mostly in the United States.
Table 2.1 offers a comparison of these two bodies of research.
Table 2.1 Comparison of the Two Bodies of Research
Although these two lines of research have been pursued separately, the two
streams should be considered together, as both types of tutoring exist in a single-country
context even though one type may be more dominant than the other. For example, private
tutoring exists in the United States (Buchmann, 2010; Byun & Park, 2012) despite the
Shadow Education/
Private tutoring
Afterschool tutoring/ Out-
of-school tutoring
Funding Families Government
Nature Private service Social service
Provision Corporate or individual Government or non-profit
Place Private centers or individual
homes
School or community
settings
Context Across the world Mainly in the U.S.
12
prevalence of afterschool tutoring. Similarly, afterschool tutoring exists in Japan despite
the prevalence of private tutoring.
In fact, the border between private tutoring and afterschool tutoring/out-of-school
tutoring is increasingly blurring. Not only do both types of tutoring share the
characteristic of being an organized out-of-school activity that provides additional
academic help for students, but policy intervention brings them together where privately-
funded tutoring is increasingly integrated into public policies. This includes the situation
in which private tutoring once used by wealthy students becomes available to poor
students via public subsidies. The point is that one form of tutoring (tutoring paid for by
families) may evolve into another form of tutoring (tutoring via public funding) as a
result of policy changes. Conversely, the promotion of publicly-funded tutoring for poor
families as a policy measure may encourage the development of privately-funded tutoring
to be used by wealthy families.
For example, tutoring that used to be paid for by families is now being provided
via public funding under the supplemental educational services mandate in the No Child
Left Behind Act (NCLB) in the United States (Vergari 2007). Under this policy, school
districts are required to provide supplementary tutoring to students in schools that failed
to make adequate yearly progress (AYP) over three consecutive years. The policy aims to
raise the academic achievement of lower-income and lower-achieving students by
providing them publicly-funded free tutoring.
Japan also has undertaken a publicly-funded tutoring initiative on the local level
in recent years. Starting in 2005, several districts in Tokyo provided financial assistance

13
for tutoring to low-income families on welfare who had elementary or middle school
children. In 2008, the Tokyo prefectural government expanded the assistance to all
eligible families and introduced a no-interest loan policy for financing private tutoring.
The purpose of this policy was to encourage economically-disadvantaged students’
entrance into high schools and colleges, thereby reducing inequality in educational
opportunities (Tokyo Metropolitan Government, 2008).
South Korea’s afterschool policy is another example of a mix of private tutoring
and afterschool tutoring in a country (and also where privately-funded tutoring is being
replaced by publicly-funded tutoring). After a series of attempts to reduce household
spending on private tutoring, in 2005 the Korean government introduced an afterschool
policy that aimed to offer high-quality tutoring programs at a low cost. A major goal of
the policy was to narrow educational gaps due to socioeconomic status by offering
quality afterschool tutoring programs in school. The classes are sometimes taught by
certified instructors from private tutoring institutions (Lee, 2005).
Single-Country Studies
Two major approaches exist in conceptualizing supplementary tutoring. One is a
single-country approach, which views supplementary tutoring as a phenomenon specific
to one country. The other is a multiple-country approach, which views supplementary
tutoring from a cross-national perspective. Over time, supplementary tutoring activities
have developed in various parts of the world. Until the early 1990s, private tutoring was
mainly studied as a phenomenon in East Asian societies, often with a focus on the

14
societies’ exam-oriented education systems. In Japan, major growth and monitoring of
private tutoring began after the 1970s. The government’s national survey on private
supplementary tutoring started in 1976; some major research on this topic came out soon
thereafter (Komiyama, 2000; NIRA, 1997; Yuki et al., 1987). In one of the earliest
scholarly studies of private tutoring in Japan, Rohlen (1980) examined juku, the private
supplementary tutoring institutions in Japan. From an anthropological viewpoint he
described the relationship between schools and juku as similar to “ideal” and “reality.”
In an early sociological study on Japanese shadow education, Stevenson and
Baker (1992) employed an allocation theory to explain the link between students’
participation in shadow education and their formal school career. The study assumed that
the examination system was tightly linked to allocation of opportunities in formal
schooling and of future job opportunities, and that shadow education could enhance this
link. Using quantitative data in Japan, the authors estimated the effect of student
characteristics on participation in various types of shadow education activities and found
that higher socioeconomic status and students’ higher school performances were strongly
associated with their use of shadow education.
In the 1990s, scholars focused on Japanese private supplementary tutoring. This
includes Harnish (1994), who examined curricular aspects of juku; Russell (2002), who
examined the culture of teaching and learning in Japanese juku; and Cummings (1997),
who described juku in the context of East Asian private education. A recent survey by the
Ministry of Education showed that 25.9% of elementary school students and 53.5% of
15
middle school students received private supplementary tutoring in Japan in 2008
(Monbukagakusho, 2008)4.
South Korea is another country in which private supplementary tutoring has a
long history and a tight link between its examination systems. The country’s participation
in private tutoring is among the highest in the world. A survey in 2010 indicated that
72.2% of middle school students and 52.8% of high school students received private
supplementary tutoring in 2010 (Statistics Korea, 2011). Korea is also known for its
drastic reforms in private tutoring. In 1980, the government banned private tutoring in
order to equalize educational opportunity (Lee, 2005; Mori, 2008). By addressing the
issue of private tutoring, a major concern at that time, the government attempted to gain
political support. However, the demand for private education was so high in Korea that
families continued to use private tutoring even after the reform. Consequently, the policy
was gradually relaxed and private tutoring was officially legalized in 2000. Despite
governmental efforts to equalize educational opportunities, private tutoring continued to
be prevalent in Korea (Lsee, 2005).
In the United States, supplementary tutoring has experienced a rapid expansion
under the competitive pressure of high-stakes achievement tests (Russell 2002; Stotsky et
al., 2010; Sullivan, 2010). One of the major policy attempts to incorporate supplementary
tutoring into a public policy is the NCLB promulgated in 2002, which mandates that
school districts provide supplemental educational services to schools that fail to make
adequate yearly progress (AYP) for three consecutive years. In 2006–2007, 3.3 million
4 These numbers only include gakushu juku, academic private tutoring institutions.

16
students were eligible for Title I supplemental educational services, a six-fold increase
since 2002–2003 (U.S. Department of Education, 2009). Besides being used for such
remedial purposes, supplementary tutoring in the U.S. has also developed for enrichment
proposes. Scholarly research and articles and stories in the mainstream media (e.g., the
New York Times) indicate that a family’s socioeconomic status and their educational
involvement affect students’ participation in tutoring for college entrance purposes
(Anderson, 2011; Buchmann et al., 2010).
In Canada, a study showed that about 24% of Ontario parents with school-aged
children had hired tutors in 2002, and the tutoring business has grown between 200 and
500% in major Canadian cities over the past 30 years (Aurini & Davies, 2004). Based on
an institutional perspective, Aurini and Davies described the transformation of private
tutoring in Canada as becoming more “school-like,” referring to the increase in learning-
center franchises which differ from the existing small-scale tutoring operators. Aurini
(2006) also examined private tutoring in Canada as a case of legitimation, suggesting that
tutoring develops in an isomorphic form compared to regular schools.
Besides these developments in North America, tutoring has also developed in
European countries. A study in Greece suggested that supplementary tutoring mediates
the transmission of educational advantage over generations (Katsillis & Rubinson, 1990).
In England, estimates suggest that 27% of primary and secondary school students had a
private tutor for exams and help with daily learning (Ireson & Rushforth, 2004). All of
these studies show that the recent development of private tutoring is occurring at the
global level.

17
Multiple-Country Studies
While single-country studies have an advantage in examining supplementary
tutoring in a specific country context, multiple-country studies have an advantage in
examining the phenomenon from a cross-national perspective, using concepts and
indicators that are comparable across societies. I review three major cross-national
studies on supplementary tutoring here. First, in integrating studies from a wide range of
countries and regions, Bray (1999) documented the growth of supplementary tutoring
across different societies. The range of societies mentioned in the study included Egypt,
Tanzania, Greece, Malta, Brazil, Cambodia, Malaysia, Singapore, Taiwan, and many
others. Besides revealing the scale of supplementary tutoring, Bray summarized the
background of the phenomenon based on the global evidence and examined some policy
responses. He found that some governments may ban private tutoring on the grounds that
it distorts formal education and exacerbates inequality. However, he also noted that other
governments may encourage private tutoring in order to support students who need
additional learning opportunities.
Second, soon after Bray’s study, subsequent researchers provided further
empirical evidence on this topic. Baker and his colleagues (2001) used a large
international survey of schooling and achievement to show the worldwide existence of
supplementary tutoring. Analyzing the Third International Mathematics and Science
Study (TIMSS) data, these authors showed that a substantial degree of supplementary
tutoring in mathematics occurred throughout the world, even in countries in which the
existence of supplementary tutoring had not been previously reported. The researchers
18
found high rates of participation in Colombia, Slovakia, and the Philippines, and non-
negligible rates of participation in the European countries of Norway, Germany, Sweden,
France and the Netherlands.
Third, monitoring of private supplementary tutoring in post-socialist Eurasian
countries began in 2003. Silova et al. (2006) showed that in Azerbaijan, 93% of
respondents reported having received private tutoring in the form of lessons or courses
during their final year of secondary school; 80% reported receiving such tutoring in
Georgia; 79% in Ukraine; 71% in Mongolia; 66% in Poland; and 56% in Slovakia. A
study in Turkey suggested that the use of private tutoring, known as dersane, was
determined by students’ family background (Tansel & Bircan, 2006).
Factors that Affect Students’ Participation in Supplementary Tutoring
Previous studies have examined several key factors that are associated with
student participation in supplementary tutoring.
Academic achievement. Studies that reveal the association between students’
academic achievement and participation in supplementary tutoring have shown two
contrasting results. On the one hand, higher-achieving students are more likely to
participate in supplementary tutoring in many East Asian societies (Bray & Kwok, 2003;
Lee, 2005; Stevenson & Baker, 1992). Similarly in the United States, higher-achieving
students are more likely to participate in a specific type of tutoring for college entrance
preparation (Anderman, 2010; Buchmann et al., 2010).

19
On the other hand, lower-achieving students are more likely to participate in
supplementary tutoring in certain contexts, especially under the tutoring program for
lower-achieving students or students at risk in the United States (U.S. Department of
Education, 2007; Weiss et al., 2009). This is primarily because the government subsidizes
supplementary tutoring for students who need additional help, through initiatives such as
the 21st Century Community Learning Centers (CCLC) and supplemental educational
services mandate under the No Child Left Behind Act in the United States. Looking at
this from an international perspective, Baker and his colleagues (2001) also found that
supplementary tutoring was used as a remedial strategy by lower-achieving students in
many countries, including the United States, Canada, Australia, and France.
Socioeconomic status. Studies have also examined the relationship between
family’s socioeconomic status and students’ use of supplementary tutoring. The measure
of socioeconomic status (SES) typically includes parental occupation, education, and
income. Similarly to the relationship between academic achievement and tutoring
participation, the positive relationship between students’ SES and their use of tutoring is
observed in many East Asian societies. Studies have revealed that students from higher-
SES families are more likely to participate in supplementary tutoring, especially that of a
private nature (Bray & Kwok, 2003; Lee, 2005; Rohlen, 1980). Also in the United States,
higher-SES students are more likely to participate in tutoring for college entrance
preparation (Anderson, 2011; Buchmann et al., 2010; Byun & Park, 2012), although the
percentage is relatively small compared to afterschool tutoring.
20
As mentioned above in the case of the United States, the negative relationship
between students’ SES and tutoring participation also has been observed. This typically
occurs when tutoring is publicly subsidized for lower-SES students, where family’s
financial resources do not constrain students from participating in tutoring. Lower-SES
students are eligible to participate in tutoring in educational systems in which this activity
is publicly subsidized as a matter of government policy.
Parental involvement. Parental involvement is another major factor that may be
related to students’ participation in tutoring. Park et al. (2011) conceptualized tutoring as
one of the strategies of parental involvement and revealed the positive relationship
between parental involvement and the use of private supplementary tutoring. Students
often receive supplementary tutoring in order to gain academic excellence and advantage
outside school. Parents who encourage their children to engage in additional learning
opportunities outside school hope that their children succeed in their regular school or on
national examinations. In this regard, supplementary tutoring suggests the demand
beyond formal schools. This is where parental involvement comes in. Some observers
consider private supplementary tutoring as a market response to deficiencies in formal
schooling, wherein families purchase extra lessons to compensate for such deficiencies
(Dawson, 2010; Dierkes, 2008). Other scholars argued that parental anxiety has led
families to pursue educational advantage outside school (Aurini & Davies, 2004; Judson,
2010). Yamamoto and Brinton (2010) also suggested that private supplementary tutoring
is an activity through which parents can invest in their children’s learning and thus
enhance their educational achievement.

21
Socio-demographic characteristics. Other major student-level factors include
students’ grade level, gender, number of siblings, urbanicity, race/ethnicity, immigrant
status, and educational motivation (Bray, 1999; Byun & Park, 2012; Dang, 2007; Park,
2012). Studies have suggested that students’ participation in tutoring varies by students’
grade level. For example, the third-year middle school students have the highest
participation rates in tutoring in Japan, as the majority of them prepare for high school
entrance examination (Mori & Baker, 2010). Students’ participation in tutoring may also
vary by gender and the number of siblings, where norms about educational investment
vary by these characteristics. Supplementary tutoring tends to be more prevalent in large
cities, mainly because of the availability of tutoring. Race/ethnicity is another major
factor that may affect participation in tutoring, especially in the United States. While
Asian students are more likely to participate in tutoring in some context, such as for SAT
preparation (Buchmann et al., 2010; Byun & Park, 2012), black and Hispanic students are
more likely to participate in tutoring in other context, such as for school-based
afterschool programs (U.S. Department of Education, 2007). These facts also relate to the
discussion that immigrant background and religiosity influence students’ participation in
tutoring (Byun & Park, 2012; Park, 2012; Zhou & Kim, 2006). Park (2012) suggested
that ethnic communities such as immigrant churches promote social capital, thereby
affecting educational aspirations and expectations among families in the community.
Finally, students’ non-cognitive features including their motivation to study may also be
related to participation in tutoring (Steinberg, 2011).
22
Theoretical Considerations on the Role and Impact of Supplementary Tutoring
Based on these findings from previous studies, two theoretical models on the role
of supplementary tutoring are presented in Table 2.2. These models are the “social
reproduction” and “social mobility” models. They show two hypothetical ways in which
supplementary tutoring operates in different institutional contexts, showing two different
directions of selection. Since these arguments are theoretically driven, the reality is often
more complex than described in the models. For example, as mentioned above,
supplementary tutoring in the United States is used by both higher-SES and lower-SES
students.
In the social reproduction model, tutoring is voluntarily sought by families with
the financial resources to pay for it. The main users are students from middle-class
families and the nature of instruction is enrichment. The purpose of the tutoring is to gain
academic excellence and advantage. The tutoring is considered a private service, so that
families need both financial and cultural resources in supporting their children to
participate in supplementary tutoring. In terms of social stratification, this model is
considered to reinforce existing inequality.
In the social mobility model, tutoring is publicly subsidized by the government.
The main users are students from low-income families and the nature of instruction is
remedial. The purpose of tutoring is to ensure minimum proficiency for students who
need the most help. Tutoring is considered a social service or form of cultural resources
that support low-SES children’s learning. In terms of social stratification, this model is

23
considered to reduce inequality and promote upward social mobility for low-status
students.
Table 2.2 Two Theoretical Models of Supplementary Tutoring
Social Reproduction Model Social Mobility Model
Funding Families (private) Government (public)
Main users Middle-class students Lower-income students
Nature of instruction Enrichment Remedial
Purpose Academic excellence Minimum proficiency
Nature of service Private service Social service
Theoretically, three possible consequences exist on the effect of supplementary
tutoring: positive effect, negative effect, and no effect. For each case, I suggest some
theoretical explanations below. When supplementary tutoring has a positive effect on
students’ academic achievement, three factors may account for this positive effect: (1)
additional learning time, (2) quality of tutoring, and (3) students’ motivation and
engagement. First, additional learning time increases the level and extent of subject
materials learned by students and thereby increases their academic achievement (Aronzon
et al., 1998; Dobbie & Fryer, 2011; NCTL, 2010). This idea assumes that more time
spent on learning leads to better achievement. Such an argument is often the basis of the
extended school time debate in U.S. education policy, including evidence borrowed from
other countries that require a longer school day (Patall et al., 2010). Second, a better
quality of tutoring may enhance students’ achievement. Although quality may be difficult
to measure, it may be observed through instructors’ teaching experiences, qualifications,
24
program content, or the price of tutoring. Anecdotal evidence from East Asian societies,
including South Korea and Hong Kong, indicates that the higher the quality of tutoring,
the more expensive the service is—and students are expected to learn more from better-
quality tutors. Third, tutoring may have an effect by enhancing students’ motivation to
study. Studies of student engagement suggest that more-involved students tend to learn
better (e.g., Fredricks et al., 2004; Willms, 2003). Therefore, students may be expected to
enhance their academic achievement by becoming more motivated to engage in and
increasing their positive attitudes toward supplementary tutoring.
When supplementary tutoring has a negative effect on students’ academic
achievement, three factors may account for this negative effect: (1) lack of sufficient
learning time, (2) low quality of tutoring (e.g., inexperienced instructors), and (3) lack of
students’ motivation and engagement (i.e., disengagement in learning). These are in fact
the reversal of factors contributing to a positive effect explained above (additional
learning time, quality of tutoring, and students’ motivation and engagement). In addition,
two additional factors for the negative effect may exist: (4) long hours of study (e.g.,
fatigue) and (5) discrepancy with formal school curriculum. This means that
supplementary tutoring is no longer complementing but competing with formal
schooling; not supplementing but simply repeating lessons in formal schools and not
being effective or even having a negative influence.
When supplementary tutoring has no effect on students’ academic achievement,
two accounts may be possible. First, it is possible that these positive effects may be
cancelled out when negative effects of supplementary tutoring are prevalent. That is, even

25
when supplementary tutoring positively affects some students’ academic outcomes, the
overall effect may appear insignificant as some other students’ experience negative
achievement gains.
Another scenario on the lack of effect is the successful removal of selection bias
involved in students’ participation in supplementary tutoring. For example, when a group
of high-achieving students receive supplementary tutoring, a naïve analysis would
suggest that supplementary tutoring has a positive effect on students’ academic outcome.
However, when characteristics that are originally associated with students’ participation
in tutoring (i.e., socioeconomic status, demographic characteristics) are adjusted, such
seemingly positive effect of supplementary tutoring may disappear.
Figure 2.1 shows the conceptual model for my study.

26
Figure 2.1 Conceptual Model on the Effect of Supplementary Tutoring on
Mathematics Achievement
Treatment Outcome
Supplementary Tutoring in Math Mathematics Achievement
Student Characteristics
Socioeconomic status, Demographic characteristics,
Learning motivation and attitudes
School Characteristics
School sector, School size, School location,
School resources, Student-teacher ratio
Observed Covariates
Effect of Supplementary Tutoring on Students’ Academic Achievement
Studies have revealed a range of impacts of supplementary tutoring on different
dimensions of students’ educational and social outcomes. In addition to the academic
impact of tutoring on students’ test scores, which is the main focus of this study, other
key impacts of supplementary tutoring have been discussed in the literature. These
include impact on college enrollment (Buchmann et al., 2010; Stevenson & Baker, 1992),
on learning attitudes and engagement, on risk behaviors such as drug and alcohol use, and

27
on personal and social development (Dynarski et al., 2004; Lauer et al., 2006; Patall et al.,
2010; Weiss et al., 2009).
In this study, I focus on the effect of supplementary tutoring on students’
academic achievement. The body of literature on the academic effects of tutoring has
increased over the years. This increase is apparent in two ways. One group of research
studies assessed the degree of inequality in the use of supplementary tutoring. These
studies typically focused on shadow education or private tutoring, which is privately
funded and used by students to increase their academic excellence. Another group of
research studies examined the extent to which supplementary tutoring affects the
achievement gap among students. This work emphasizes out-of-school-time lessons or
afterschool tutoring that is publicly funded. In general, the former group of studies is
rooted in the sociological literature while the latter is based in the program evaluation
literature. Recognizing the difference in study purposes, I draw from both literatures in
order to summarize the key findings of the impact of supplementary tutoring to date.
The Effect of Private Tutoring
Briggs (2001) analyzed the effect of commercial test preparation programs on the
standardized college entrance examinations of U.S. high school students, using the
National Education Longitudinal Survey (NELS) of 1988. Utilizing linear regression
analysis and controlling for demographic variables, indicators of students’ high school
performance, as well as other covariates such as proxies for student motivation and
dummy variables for other test preparation activities, Briggs found a statistically

28
significant effect of coaching on two standardized test measures. According to Briggs,
coaching had a positive effect on math and verbal sections of the SAT (Scholastic
Aptitude Test), as well as on math and reading sections of the ACT (American College
Testing). However, as the author noted, there is a chance that linear regression did not
fully account for self-selection bias. That is, students who are more likely to seek
coaching activities are more likely to be highly motivated students who have strong test-
taking ability. As such, ability is unobservable but is a variable related to tutoring—
Briggs cautioned that the statistical results may be biased due to failure to meet the
conditional independence assumption in regression analysis.
Buchmann and colleagues (2010) also examined the effects of test preparation
activities, which they called “American style” of shadow education, on the SAT and
college enrollment. Drawing on the NELS data of 1994, the authors examined a series of
test preparation activities (books/video/software, high school course, private course,
private tutor) in an ordinary least squares (OLS) regression model. The key covariates in
the model included family income, parental education, race/ethnicity, gender, residence,
parental engagement, and prior achievement. The authors found a statistically significant
effect of the test preparation services, especially for costly SAT courses and private
tutoring. For example, compared to using no test preparation, taking a high-school course
produced a gain in SAT scores of about 26 points. Similarly, taking a private/commercial
course increased scores by about 30 points; a private tutor increased scores by about 37
points.

29
While the study extended the literature on “shadow education” and contributed
new insights from a U.S. perspective, methodologically it faced the same issue noted
above—a lack of control for possible selection bias. Although the authors controlled
major socio-demographic variables and prior achievement as key predictors of test
preparation activities, students who receive some types of test preparation are likely to
have better test scores and be from families with a higher income and more involved
parents. Therefore, students who engage in test preparation have a different set of
characteristics from students who do not engage in such preparation. Under these
circumstances, it is difficult to determine whether score gains due to test preparation are
attributable to the preparation itself or the fact that test preparation is utilized by different
populations of students. In particular, students who engage in test preparation are
considered to be highly motivated and better test-takers. In Buchman et al. (2010), these
potential covariates are likely to be correlated with both measures for test preparation and
the achievement outcome, leading to an endogenous problem. A regression model is less
robust in handling endogeneity bias (Guo & Fraser, 2010), so their findings are likely to
be upwardly biased if selection and endogeneity are issues.
Dang (2007) analyzed the Vietnam Living Standards Surveys 1997–1998 and
1992–1993 and found that spending on private tutoring has a positive effect on primary
and lower secondary students’ academic performance. The survey is a nationally
representative household survey in Vietnam that contains information on student-level
and school/community-level characteristics, as well as students’ self-reported measure on
academic performance in the previous grade (measured in four categories as excellent,
30
good, average and poor). The study used the instrumental variable approach to address
the possible endogeneity of household spending on private tutoring. As Dang suggested,
although characteristics such as parental concern for children’s education and student’s
innate ability are difficult to measure and observe, they are likely to affect both spending
on private tutoring and students’ achievement. He used private tutoring fees charged by
schools as an instrument to represent the “official” price of private tutoring in the
community and predict domestic spending on private tutoring.
Utilizing a joint Tobit and ordered probit econometric model, the analysis was
conducted in two stages. First, the determinants of expenditures on private tutoring were
estimated. Second, the impact of expenditures on private tutoring on student academic
performance was assessed. The author included a range of variables to determine both
expenditures on private tutoring classes and academic performance of students. Student
characteristics included household expenditures per capita, students’ grade level, age and
age squared, gender, parental education, ethnic minority, and number of siblings. School
and community characteristics included share of qualified teachers, number of book sets
per student, share of people with higher educational degrees, and distance to school.
Dang found that, controlling for other characteristics, private tutoring has a positive
impact on students’ academic performance, particularly for lower secondary students
compared to primary students. However, the author cautioned that his argument
depended heavily on the validity of the instrument used in the analysis.
Domingue and Briggs (2009) used data from the Education Longitudinal
Survey of 2002 to estimate the effect of coaching on SAT score, using both linear
31
regression and propensity score matching. They highlighted the advantage of using the
propensity score matching approach in estimating causal effect compared to using the
more traditional linear regression approach. In particular, propensity score matching
restricted the sample to coached and uncoached students considered counterfactuals in
estimating the effect. For those students who had taken both the PSAT and SAT, they
found effect estimates of roughly 11 to 15 points on the math section and 6 to 9 points on
the verbal, although only the math effects were statistically significant. They also found
that coaching is more effective for certain kinds of students, particularly those who had
taken challenging academic coursework and came from high-socioeconomic backgrounds.
Kuan (2011) used the Taiwan Educational Panel Study in 2001 and 2003 to
look at the effects of private tutoring on mathematics performance among junior high
school students in Taiwan. Via survey data for 7th
-grade students in 333 junior high
schools in Taiwan, Kuan performed propensity score matching to address the selection
issue in students’ participation in cram schools. By matching tutored and non-tutored
students who had similar probabilities of receiving tutoring, Kuan found a small average
positive treatment effect of math cramming. With an additional analysis of the effect by
student subgroups, the author found that the effect of math cramming was more
prominent among each of the following subgroups: students with lower probability of
receiving cramming, students with lower prior math score, and students with lower
parental educational level. Kuan recognized the issue of omitted variables as one
limitation in his analysis, noting that propensity score matching itself cannot overcome
the problem of unobservable measures.

32
Byun and Park (2012) employed the Educational Longitudinal Study to
examine the effect of SAT and private one-on-one tutoring on high school students’
mathematics and reading achievement. Using ordinary least squares (OLS) regression
and controlling for prior achievement, they found a significant positive effect on
supplementary tutoring for East Asian students.
Choi (2012) used the Seoul Educational Longitudinal Study to look at the
effect of private tutoring on elementary, middle, and high school students’ mathematics
and English ability. Utilizing quantile regression, the authors found a heterogeneous
impact of tutoring via distribution of students’ achievement in math and English. The
effect is larger for lower-achieving students, especially in English in elementary and
middle school, and math in elementary and high school, suggesting that lower-achieving
students may benefit more from tutoring in these cases. In particular, the author
suggested that engaging in private tutoring in the English language confers greater
advantage when students’ grades are lower, since language skills are more malleable
when students are younger.
The Effect of Afterschool Tutoring/Out-of-School Tutoring
Here, studies of the effect of supplementary, publicly funded tutoring are
examined. These studies are all based on data from the United States due to the
availability of high-quality U.S. data which enables program evaluation and to recent U.S.
policy that calls for such evaluation studies. In fact federal and local governments have
been encouraging the evaluation of supplementary tutoring programs to determine
33
whether these programs are meeting their intended goals. Despite this call for evidence-
based results and subsequent increase in such studies, empirical studies have offered
mixed evidence. Using the National Longitudinal Study of NCLB (NLS-NCLB) and a
difference-in-differences approach, researchers revealed statistically significant
achievement gains among participants in supplementary tutoring in reading and math in
the United States (U.S. Department of Education, 2007). The report was based on
longitudinal student-level data on nine large, urban school districts across the country.
The NLS-NCLB survey originally sampled 300 school districts that included about 1,500
schools across the nation in 2004–2005 and 2006–2007.
These researchers noted that use of a conventional regression model to examine
achievement effect cross-sectionally may produce biased estimates of program effects.
To avoid this issue, they implemented a quasi-experimental difference-in-differences
approach that uses within-subject pre-post comparisons and comparisons between
participating and nonparticipating students. The method is also referred to as a student
fixed-effect approach in econometric terms. By using this method and controlling for
student characteristics (not explicitly mentioned in the report), they found positive
achievement gains among participants in supplementary tutoring in reading and math.
The study also revealed that those who participated in these programs for several years
had twice the gains of students who participated for one year, and that African American,
Hispanic, and students with disabilities experienced greater achievement gains from
participation in tutoring activities.
34
Contrary to the above findings, some studies have shown a non-significant
effect of tutoring. Using data from Jefferson County Public Schools in Kentucky, Munoz
and Ross (2009) compared students who received tutoring with students who were
eligible for tutoring but did not receive it, and who had similar characteristics based on
the following five variables: previous diagnostic test scores in reading, gender, race,
participation in the free or reduced-price lunch program, and single-parent homes. The
Jefferson Country Public Schools are the 26th largest school district in the nation and
located in a large metropolitan area. Of 150 schools in the district, 30 were required to
offer the NCLB-mandated supplemental educational services during the 2005–2006
school year when the survey took place. Although students, parents, teachers and
administrators were generally in favor of the program, Munoz and Ross found overall
non-significant effects of tutoring for those who received tutoring, both in reading and
mathematics, compared to the matched control students.
The study recognized the need to isolate confounding factors in measuring the
impact of supplementary tutoring. It also referred to a range of uncontrollable factors,
including “characteristics of the tutoring setting, contamination from core academic and
other support programs, student interest and motivation, and limitations of standardized
achievement tests for sensitively measuring tutoring impacts” (Munoz & Ross, 2008, p.
3), all of which may bias the treatment effect. As the survey contained district-level data,
specific description of the nature of supplementary tutoring was available:

35
Providers serving students in Jefferson County, KY ranged from large national
companies to local community-based organizations. A typical tutoring session
lasted 1 hr after school, two days per week. Provider programs had a variety of
methods of instruction. Some had one-on-one or small-group instruction; others
tutored in the home of the student or online. Most programs lasted for several
weeks, with the majority of tutoring taking place in the second (spring) semester
of the school year (p. 6).
The study raised three possible explanations for the absence of tutoring effects.
One is the limited duration of the tutoring activity relative to regular school programs and
other educational experiences. Another is the failure of standardized tests to assess
higher-order learning or specific knowledge skills that may be taught during tutoring
sessions. The third is communication problems among parents, schools, and tutoring
providers in implementing the program, including the lack of provider efforts to respond
to parents’ concerns.
Using regression discontinuity design, Jacob and Lefgren (2004) examined the
effect of summer remedial programs on third- and sixth-grade students’ academic
achievement. They found that remedial programs had a modest but positive net impact on
third-grade achievement in math and reading, but little net impact on sixth-grade
achievement. This study used administrative data from the Chicago Public School system.
Student-level information included test scores and student demographics (race, gender,
age, guardian, and free lunch eligibility), bilingual and special education status, and
36
residential and school mobility. School-level information included demographic and
school resource information, such as racial and socioeconomic composition of the school.
Regression discontinuity method estimates the causal effect of an educational
intervention by comparing the treated and controlled subjects who are just above or
below the threshold of receiving the intervention. As students in this specific region are
considered to have similar characteristics, students in the treated and control groups are
considered to be randomly assigned. The average treatment effect is therefore identified
among marginal students around the threshold, as continuity of unobserved
characteristics is assumed in that margin. In this case, the threshold is a certain level of
test scores that indicates students’ eligibility to receive remedial instruction.
Using survey data from Milwaukee Public Schools and the propensity score
matching method, Heinrich et al. (2010) found no statistically significant effect of
supplementary tutoring on students’ reading and math achievement gains at any grade
level. They included a range of socio-demographic variables and prior achievement
measures considered to affect current achievement. However, no effect was found.
Heinrich and her colleagues (2010) supplemented this analysis with findings from a
qualitative study and found that the lack of an effect may be due to several factors:
insufficient hours attending supplementary tutoring, lack of continuity in students’
daytime and after-school learning environments, quality of instruction, and student
motivation to learn from tutoring.
To summarize, many studies focusing on privately-funded supplementary tutoring
indicated a positive effect of engaging in this activity. On the other hand, studies focusing
37
on publicly-funded supplementary tutoring in the United States offered mixed results5 on
the effectiveness of supplementary tutoring. Looking at this disagreement in measured
program effects, Lauer et al. (2006) suggested possible heterogeneity in the effect of
tutoring. The authors synthesized 35 studies of out-of-school-time programs that
provided adequate control or comparison groups in examining treatment effects. Their
summary suggested that some of a program’s demonstrated ineffectiveness might be due
to the aggregation of intervention outcomes that fail to differentiate heterogeneous effects
according to student subgroups. Referring to the evaluation of 21st Century Community
Learning Centers conducted by Dynarski et al. (2004), Lauer and her colleagues argued
that aggregating results across programs can mask positive outcomes.
Selection bias is a major problem in examining the effect of supplementary
tutoring on academic achievement. Since the decision to receive supplementary tutoring
is hardly randomized across students and their families, use of a quasi-experimental
design is necessary to avoid estimation bias. Students may be selected for tutoring due to
unobserved characteristics, such as motivation and test-taking skills. Studies that
attempted to address the selection issue tackled the problem by including an instrumental
5 Such disagreement in the effects of tutoring is potentially problematic in the U.S. where some
types of tutoring are publicly funded and expected to have a program effect. In cases where
tutoring is privately pursued by families, providers are not legally required to demonstrate
program effects, even though families may be concerned about the effectiveness of tutoring as
consumers of such services.

38
variable or adding a large number of relevant covariates into the model, including a proxy
measure for unobservable characteristics.
After controlling for selection bias, prior research tended to indicate an effect for
a full population. Studies usually assume the homogeneity of the impact of
supplementary tutoring, to obtain an average treatment effect across a general pool of
students. However, several studies found the heterogeneity of the causal effect. The
impact may differ according to social group—therefore, the effect of supplementary
tutoring should be considered in specific contexts in which important social differences
are in evidence across student groups. One such feature includes students’ grade levels.
Since the studies summarized here focused on different grade levels, findings may only
be interpreted within the particular grade level analyzed. The key subgroup difference
may also include differences by students’ probability of receiving tutoring, students’ prior
achievement, and parental education (Kuan, 2011). In addition, in the U.S. context,
possible differences in the effect of supplementary tutoring according to race and
ethnicity have been examined (Buchmann et al., 2010; Byun & Park, 2012; U.S.
Department of Education, 2007). These findings suggest that tutoring effects may vary
depending on contexts. Heterogeneity of the effect is important, since who benefits from
and gains educational advantages from engaging in tutoring programs is a key issue
relating to theoretical concerns about educational opportunity and equality.

39
Chapter 3
RESEARCH METHODOLOGY
This chapter states the research questions and describes the data and measures for
the study. Propensity score matching is introduced as an analytic strategy.
Research Questions
Based on the reviewed literature, I ask the following questions: (1) What are the
factors that affect students’ participation in supplementary tutoring in the United States
and Japan? (2) What are the effects of supplementary tutoring on students’ mathematics
achievement in the two countries? (3) Do the effects differ by student subgroups in each
country?
Data and Measures
I used the 2006 Program for International Student Assessment (PISA) for this
research. This is a cross-national study of achievement of 15-year-old students across the
world. The study has been sponsored by the Organization for Economic Cooperation and
Development (OECD) every three years since 2000. Administered to a minimum of
4,500 students in over 57 countries and economies across the world, PISA offers
40
researchers internationally comparable home and school background information besides
its performance indicators in reading, mathematics, and science. At the school level,
PISA samples include approximately 150 schools (35 students from each school) from
each country. The majority of the samples for 15-year-old students are equivalent to tenth
graders in the United States, and first year high school students in Japan.
These students’ mathematics achievement is my outcome variable.
Mathematics is a common subject necessitating tutoring, and math performance is
considered most comparable across countries because it is relatively unaffected by a
country’s language or culture. PISA accesses all three domains of reading, mathematics,
and science every three years. Its objective is not limited to assessing the mastery of the
school curriculum, but that of the knowledge and skills, which are essential for full
participation in society (OECD 2005). Among the participating countries in PISA, the
mean of academic achievement is set to 500 and the standard deviation is set to 100.
My treatment variable is the supplementary tutoring in mathematics. In PISA
2006, student respondents were asked whether they spent time studying mathematics
during out-of-school-time lessons, either at school, home or elsewhere (Q31). However,
the nature of supplementary tutoring covered with this question was somewhat vague, as
it did not specifically distinguish where the tutoring took place and who taught students.
In order to identify the specific nature of tutoring, I have used auxiliary information that
queries whether the students’ own schoolteachers were involved in offering tutoring
lessons (Q32). Details about these items that come from the PISA 2006 student
questionnaire are shown in the Appendix A.

41
By considering these two items (Q31 and Q32) together, four categories were
created: (a) receiving supplementary tutoring by teachers outside school (hereafter “out-
of-school tutoring”), (b) receiving supplementary tutoring by schoolteachers themselves
(hereafter “school tutoring”), (c) receiving both types of tutoring (hereafter “both
tutoring”), and (d) receiving neither type of tutoring (hereafter “no tutoring”)6.
Students who received supplementary tutoring were likely to differ in critical
ways from students who did not receive assistance. Thus, building on the previous studies,
I included controls to account for selection bias that may exist in the choice of
supplementary tutoring. These control variables included a range of student and school
characteristics, which have been described below:
Highest parental occupational status was a continuous measure of the higher
index of the occupational status of either parent. Originally, it entailed students’ fathers
and mothers being asked open ended questions about their occupations. The responses
were coded into four-digit ISCO codes (ILO 1990) and then, mapped to the International
Socio-Economic Index of occupational status (ISEI) (Ganzeboom et al., 1992). Highest
educational level of parents had six categories of the higher index of educational level of
either parent. Parental education here was classified using the International Standard
6 These categories distinguish the types of instructors for tutoring (schoolteachers or non-
schoolteachers). Non-schoolteachers refer to tutors who are not associated with the concerned
schools but teach elsewhere, including at other schools, home, commercial institutions or
community organizations. Location of tutoring remains unspecified, which is a limitation of PISA
2006.

42
Classification of Education (ISCED) (OECD, 1999). Indices on parental education were
constructed by recoding educational qualifications into the following categories: (0)
None; (1) ISCED 1 (primary education); (2) ISCED 2 (lower secondary); (3) ISCED
Level 3B or 3C (vocational/pre-vocational upper secondary); (4) ISCED 3A (upper
secondary) and/or ISCED 4 (non-tertiary post-secondary); (5) ISCED 5B (vocational
tertiary); and (6) ISCED 5A, 6 (theoretically oriented tertiary and post-graduate). Home
educational resources was an index composed of the following five items: (a) a desk for
study, (b) a quiet place to study, (c) educational software, (d) books for schoolwork, and
(e) a dictionary. Wealth was an index composed of seven items: (a) own room, (b)
dishwasher, (c) Internet, (d) cell phone, (e) television, (f) computers, and (g) cars.
Private-funded schools distinguished between publicly- or privately-funded
educational institutions. The original index on school type had three categories: (a) public
schools controlled and managed by a public education authority or agency, (b)
government-dependent private schools controlled by a non-government organization or
with a governing board not selected by a government agency, but which received more
than 50% of their core funding from government agencies, and (c) government-
independent private schools controlled by a non-government organization or having a
governing board not selected by a government agency, but which received less than 50%
of their core funding from government agencies. In my research, I combined (a) and (b)

43
to create a measure for publicly-funded schools. The remaining (c) denotes a measure
privately-funded schools7.
Gender was measured as a dichotomous variable (female=1, male=0). The
following demographic characteristics were only measured for the United States.
Race/ethnicity was a set of five dummy variables: (a) non-Hispanic white (reference), (b)
black, (c) Hispanic, (d) Asian, and (e) other race. Language at home was a dichotomous
variable: speaking foreign language at home (=1) and speaking native language at home
(=0). Grade level was a set of three dummy variables: (a) modal grade (reference), (b)
above modal grade, and (c) below modal grade. Mother's employment status was a set of
three dummy variables: (a) mother works full-time, (b) mother works part-time, and (c)
mother does not work (reference).
General interest in learning science was an index of instrumental motivation
to learn science, constructed by the OECD. Positive values indicated higher levels of
motivation. Regular lessons in mathematics was the students’ self-reported measure on
the hours spent taking math lessons at school. It had five categories: (a) none, (b) less
than 2 hours, (c) 2 to 4 hours, (d) 4 to 6 hours, and (e) 6 hours or more. Self study in math
was the students’ self-reported measure about the hours spent on self study in math. It
had the same five categories for the hours spent taking math lessons..
Science achievement was a continuous measure of science test scores and was
included as a proxy of prior math achievement.
7 While it is also possible to distinguish privately-administered schools, I focus on the funding
aspect as I consider it to be more relevant in students’ selection into supplementary tutoring.

44
The following variables were included as covariates for school characteristics.
School mean parental education was an aggregate measure of parental education at the
school level. School location was a set of four dummy variables: (a) school in the village
or small town (reference), (b) school in the town, (c) school in the city, and (d) school in
a large city. Shortage of math teachers was derived from four items measuring the school
principals’ perceptions of factors hindering instruction at school. Higher values indicated
a higher degree of teacher shortage. Parent pressure on academic standards was derived
from three items measuring the degree of parental pressure on academic standards at their
children’s schools. Higher values indicated a higher degree of parental pressure. School
size was the total enrolment at school based on enrolment data provided by the school
principals. Student-teacher ratio was obtained by dividing the school size by the total
number of teachers. Quality of educational resources was computed on the basis of seven
items measuring the school principals’ perceptions of potential factors hindering
instruction at school. Higher values indicated higher levels of educational resources.
Percent receiving free/reduced lunch was a continuous measure limited to the United
States. Vocational orientation was a dichotomous measure limited to Japan.
Table 3.1 shows the variables used in this study.
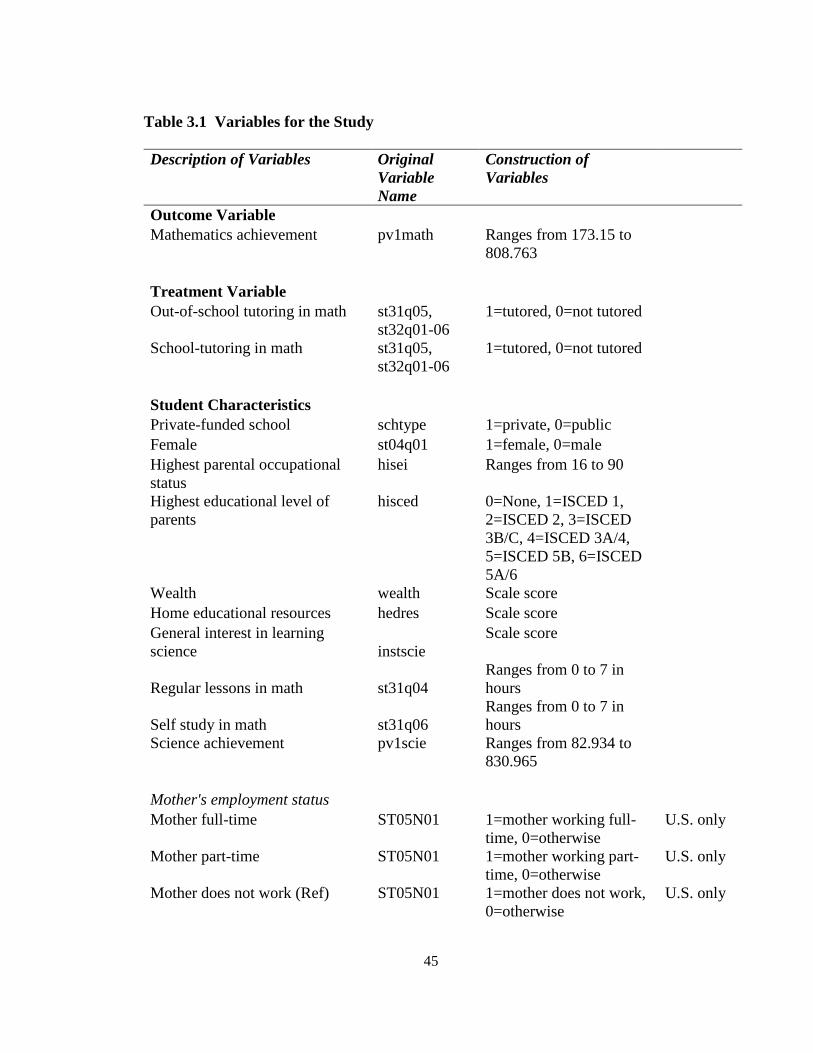
45
Table 3.1 Variables for the Study
Description of Variables Original
Variable
Name
Construction of
Variables
Outcome Variable
Mathematics achievement pv1math Ranges from 173.15 to
808.763
Treatment Variable
Out-of-school tutoring in math st31q05,
st32q01-06
1=tutored, 0=not tutored
School-tutoring in math st31q05,
st32q01-06
1=tutored, 0=not tutored
Student Characteristics
Private-funded school schtype 1=private, 0=public
Female st04q01 1=female, 0=male
Highest parental occupational
status
hisei Ranges from 16 to 90
Highest educational level of
parents
hisced 0=None, 1=ISCED 1,
2=ISCED 2, 3=ISCED
3B/C, 4=ISCED 3A/4,
5=ISCED 5B, 6=ISCED
5A/6
Wealth wealth Scale score
Home educational resources hedres Scale score
General interest in learning
science instscie
Scale score
Regular lessons in math st31q04
Ranges from 0 to 7 in
hours
Self study in math st31q06
Ranges from 0 to 7 in
hours
Science achievement pv1scie Ranges from 82.934 to
830.965
Mother's employment status
Mother full-time ST05N01 1=mother working full-
time, 0=otherwise
U.S. only
Mother part-time ST05N01 1=mother working part-
time, 0=otherwise
U.S. only
Mother does not work (Ref) ST05N01 1=mother does not work,
0=otherwise
U.S. only
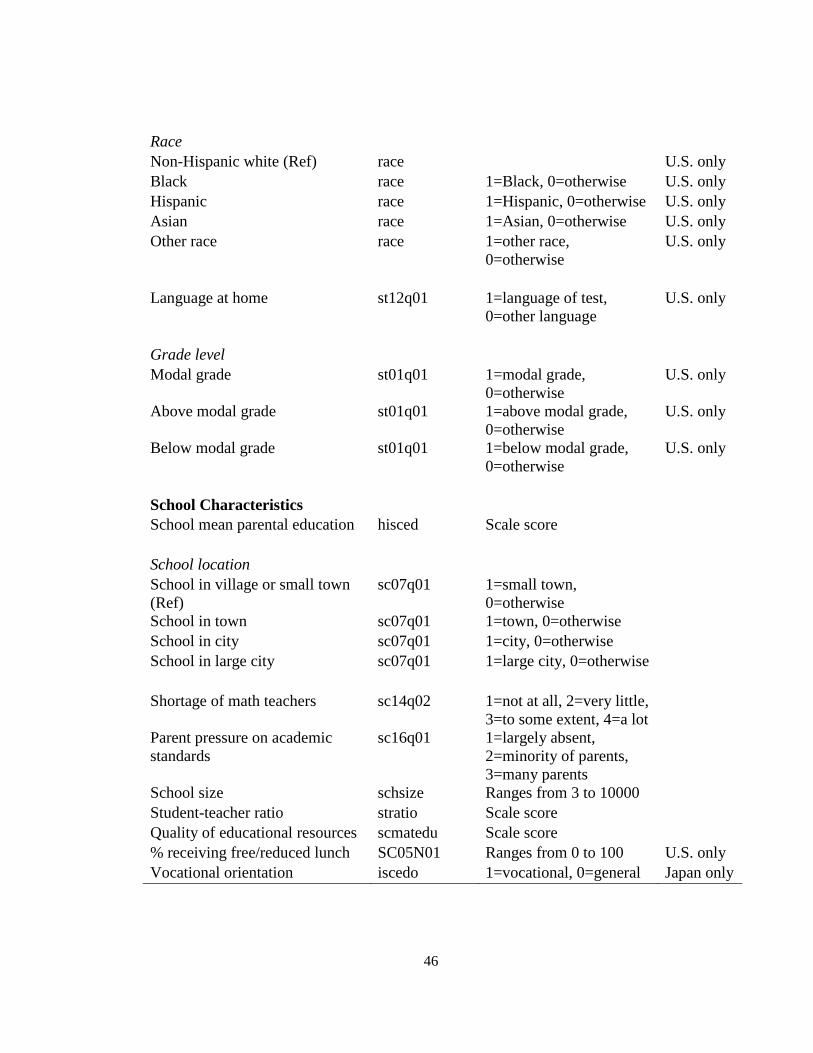
46
Race
Non-Hispanic white (Ref) race U.S. only
Black race 1=Black, 0=otherwise U.S. only
Hispanic race 1=Hispanic, 0=otherwise U.S. only
Asian race 1=Asian, 0=otherwise U.S. only
Other race race 1=other race,
0=otherwise
U.S. only
Language at home st12q01 1=language of test,
0=other language
U.S. only
Grade level
Modal grade st01q01 1=modal grade,
0=otherwise
U.S. only
Above modal grade st01q01 1=above modal grade,
0=otherwise
U.S. only
Below modal grade st01q01 1=below modal grade,
0=otherwise
U.S. only
School Characteristics
School mean parental education hisced Scale score
School location
School in village or small town
(Ref)
sc07q01 1=small town,
0=otherwise
School in town sc07q01 1=town, 0=otherwise
School in city sc07q01 1=city, 0=otherwise
School in large city sc07q01 1=large city, 0=otherwise
Shortage of math teachers sc14q02 1=not at all, 2=very little,
3=to some extent, 4=a lot
Parent pressure on academic
standards
sc16q01 1=largely absent,
2=minority of parents,
3=many parents
School size schsize Ranges from 3 to 10000
Student-teacher ratio stratio Scale score
Quality of educational resources scmatedu Scale score
% receiving free/reduced lunch SC05N01 Ranges from 0 to 100 U.S. only
Vocational orientation iscedo 1=vocational, 0=general Japan only

47
Counterfactual Analysis for Causal Inference
In examining my research question on the causal effect of supplementary
tutoring, I drew on the counterfactual approach (Holland, 1986; Rubin, 1974; Winship &
Morgan, 1999). The key assumption of this approach, also called the potential outcomes
framework, is to consider that subjects assigned to treatment and control groups have
potential outcomes in both states (Winship & Morgan, 1999). When a subject is assigned
to a treatment group, the potential outcome for the control state exists besides its actual
treatment outcome. When a subject is assigned to a control group, the potential outcome
for the treatment state exists besides its actual controlled outcome. This means that we
consider two potential outcomes per subject, one for what actually happened and the
other for what would have happened had the subject been assigned to the opposite state.
The causal effect is defined as the difference in potential outcomes between the treatment
and control states (Winship & Morgan, 1999).
In reality, one cannot observe both of these outcomes for the same subject at
one time. When a subject receives a treatment, we can only observe its outcome for the
treated state. The potential outcome for the controlled state will be left unobserved.
Similarly, when a subject is under a control, the potential outcome for the treated
condition will be unobserved. This issue is called the fundamental problem of causal
inference in statistical research (Holland 1986). Often in natural science research,
randomized controlled experiments may be conducted to simulate these two
counterfactual states. Such randomized experiments are considered gold standards of

48
scientific research for drawing causal inferences. However, often in social science
research involving human participants and their social behaviors, randomized controls are
neither feasible nor ethical. In such cases, researchers need to apply a quasi-experimental
design to draw causal inferences by using existing survey data.
To estimate causal effects using the counterfactual approach, it is necessary to
simulate two counterfactual outcomes that are unobserved in survey data. Following the
notation by Morgan and Winship (2007), I denote potential outcome variables as Y1 and
Y0. They correspond to two alternative causal states, one of which is unobserved for each
subject in the data: Y1
is an outcome for the state when a subject receives a treatment and
Y0
is an outcome for the state when a subject is under a control. In addition, I define
causal exposure variable D, which is equal to 1 when a subject is actually exposed to the
treatment and 0 when a subject is unexposed to the treatment.
Table 3.2 shows a framework for counterfactual inference. Two of the
unobserved (or counterfactual) outcomes are highlighted in the table. One is an outcome
for the hypothetical state when a subject would have received a treatment, when it was
actually under a control (Y1 | D=0). Another is an outcome for the hypothetical state
when a subject would have been under a control, when it was actually treated (Y0 | D=1).

49
Table 3.2 A Framework for Counterfactual Inference
Group Y1 Y
0
Treatment group
(D=1) Observable as Y Counterfactual
Control group
(D=0) Counterfactual Observable as Y
(From Morgan & Winship, 2007, p. 35)
In the above table, causal effects are defined within rows by comparing the
outcomes between Y1 and Y
0. Since we cannot observe counterfactual outcomes for the
same individual i, we estimate causal effects by aggregating the individual outcomes. The
Average Treatment Effect (ATE) is the difference in means between the two potential
outcomes, denoted as follows:
ATE = E (Y1 – Y
0)
= E (Y1) – E (Y
0)
The Average Treatment effect on the Treated (ATT) is a specific condition of ATE when
the treatment effect is considered only for those who have been treated. This outcome is
substantially more meaningful when a researcher is interested in the group of students
who are typically exposed to the treatment state.
ATT = E (Y1 – Y
0 | D=1)
= E (Y1
| D=1) – (Y0 | D=1)

50
The Average Treatment effect on the Untreated (ATU) is another specific condition of
ATE when the treatment effect is considered only for those who are untreated. This
outcome may be substantially more meaningful, for instance, when a researcher wishes to
know the effect of expanding a certain treatment (i.e., job training program) to the
population that is currently not receiving the treatment.
ATU = E (Y1 – Y
0 | D=0)
= E (Y1
| D=0) – (Y0
| D=0)
Propensity Score Methods
As one way to draw a causal inference, propensity score methods were
developed in statistics and these have subsequently been used in many research fields
including economics, medicine, and education. According to a seminal study by
Rosenbaum and Rubin (1983), the propensity scores are defined as a conditional
probability of assignment to treatment given the observed covariates. These are a type of
balancing score that are predicted with covariates and summarized into a single-
dimensional scale. Usually, logit or probit models are used to generate these propensity
scores. After prediction, each person is assigned a propensity score, regardless of whether
he or she actually received the treatment. While propensity scores originally take the
form of probabilities, the logit of the probability is often used in the matching process due

51
to its distributional properties. The propensity scores are estimated using the following
logit equation:
The propensity of receiving a treatment is calculated as follows:
Where α is the estimated constant term; is the estimated vector of coefficients; and X is
the vector of covariates (Dehejia & Wahba, 2002; Rosenbaum & Rubin, 1983).
Propensity score analysis has an important assumption called the strongly
ignorable treatment assignment. This means that the assignment for a treatment condition
does not depend on the outcome of interest. Essentially, this is based on the same idea as
the conditional independence assumption in the ordinary least squares (OLS) regression.
When this assumption is satisfied, the method mimics randomization. However, when the
assumption is not satisfied, the results may be biased.
Propensity scores are a means to an end. As propensity scores signify one’s
likelihood of receiving treatment, they enable a matching of the units with similar
likelihoods of receiving treatments. It is through this matching process that we know the
effects of the treatment. Since propensity scores are on a continuous scale, matching units

52
based on the exact same score is impossible. Therefore, we match units based on a
similar range of propensity score distribution8.
Advantages of Propensity Score Methods
There are some advantages of using propensity scores in making causal
inferences. First, since propensity scores are one-dimensional balancing scores, matching
units based on a multiple dimensions of covariates becomes feasible. Second, since
propensity score analysis is a semi-parametric method, it is more suitable for drawing
causal inferences than the OLS model. The OLS model is potentially problematic when
there are few counterfactual groups with a similar tendency to receive treatment. In such
cases, the parametric assumption of the OLS model relies on extrapolation, which does
not come from the actual data. In order to reduce this potential bias, the propensity score
analysis ensures that there is a substantial overlap between the comparable counterfactual
groups, which is called the “common support” region. This process eliminates those
treated subjects with no comparable controls. Third, unlike some quasi-experimental
methods that rely on the longitudinal design of data, propensity score methods do not
necessarily require such a data structure. When correctly applied, the propensity score
analysis is applicable to cross-sectional data when making causal inference (e.g.,
Dronkers & Avram, 2010; Leow et al., 2004; Vandenberghe & Robin, 2004).
8 Rosenbaum and Rubin (1983) suggested that there were three major ways to enable such
comparison: matching, sub-classification, and covariate adjustment.

53
Applications of Propensity Score Methods
For my specific research question, propensity score methods enabled an
examination of the causal effect of supplementary tutoring on students’ academic
achievement, by comparing the achievement outcomes of the tutored (treated) students
with the non-tutored (controlled) students who, in all other ways, had nearly identical
background characteristics. Therefore, students who received supplementary tutoring
were matched with students who did not receive supplementary tutoring but had a similar
propensity score.
The propensity score analysis was conducted as follows. First, I used a
logistic regression to estimate the probability of students’ receiving a treatment. The
selection of predictors that were included in the propensity score equation ultimately
determined the accuracy of the propensity score results (Caliendo & Kopeinig, 2008).
This first step answered my first research question; who participated in supplementary
tutoring. Second, using the predicted probabilities from the logistic regression, I matched
students in the treatment and non-treatment groups based on their estimated propensity
scores. After verifying the covariate balance, I estimated the Average Treatment effect on
the Treated (ATT) in terms of mathematics achievement, which indicated the differences
in potential achievement between the tutored and the non-tutored students given the
propensity scores. This second step answered my second research question; whether
participation in tutoring had any causal effects. Subsequently, the propensity score
analysis was conducted separately for student subgroups of interest. This third step
54
answered my third research question; whether the effects of tutoring differ by student
subgroups.
In this study, I investigated two treatments: “out-of-school school”
supplementary tutoring and “school” supplementary tutoring. In order to sort out the
effects for each type of treatment, I made two comparisons: (a) students who have
received out-of-school tutoring (but not school tutoring) with students who received no
tutoring, and (b) students who received school tutoring (but not out-of-school tutoring)
with students who received no tutoring.
I used the logit model to predict students’ probability of receiving
supplementary tutoring. The predictor variables were selected based on the previous
empirical and theoretical literature on students’ participation in tutoring, as well as how
well these variables predicted their participation in my model. After obtaining the
propensity scores, I checked how the propensity scores balanced between the treated and
the control groups. I used two sample t-tests to make sure that the mean for each
covariate did not significantly differ between the two groups.
In addition to checking the covariate balance, I compared the distribution of
the propensity scores between the tutored and non-tutored students using a histogram.
Some students were predicted to have a higher propensity to receiving tutoring,
irrespective of whether they actually received tutoring or not. Some students were
predicted to have a lower propensity to receiving tutoring, irrespective of whether they
received tutoring or not. The purpose of this comparison was to match students with
similar likelihoods of receiving tutoring. In order to ensure that the comparison was made

55
within the reasonably similar propensity score range, I imposed common support, which
was to remove either treated cases (tutored students) or control cases (non-tutored
students) whose propensity scores did not fall between the minimum and maximum
propensity scores of either cases were removed from the sample. Following these
procedures ensured that the outliers that could potentially bias the results were excluded
from the analysis, and that data was balanced.
Subsequently, I matched students using three different matching techniques
and compared the results across these methods. Each matching technique had its own
strengths. The first matching technique was the nearest-neighbor method. This was a
case where the control group was matched to a treated case based on the closest
propensity score. The idea behind this method was to match students who were similar in
terms of their propensity score distance. I used an option to impose a tolerance level on
the maximum propensity score distance (caliper distance) to avoid the risk of bad
matches. According to the suggestion by the existent literature, I set this caliper to a
quarter of the standard deviation of a propensity score distribution (Guo & Fraser, 2010).
I chose a one-to-one matching with the replacement of control units (Dehejia & Wahba,
2002).
The second matching technique was the stratification method. This method
divided propensity scores into a set of strata and matched treatment and control cases
within each stratum. This was based on the idea of matching the treated and controlled
observations within strata that had similar propensity score ranges. After the difference in
56
mean outcomes was calculated for each stratum, the weighted average of the difference
across all the strata was obtained by considering the number of cases in each stratum.
The third matching technique was the kernel matching. Kernel matching used
weighted averages of all cases in the control group to estimate the counterfactual
outcomes. The weight was calculated using the propensity score distance between a
treated case and matched controlled cases, with epan the epanechnikow kernel. This
method matched every available pair between the treated and control groups as it
weighed the differences in outcomes according to their distance. A closer pair gained
more weight and had more influence on the result, whereas a distant pair gained less
weight and had less influence on the result.
In addition to estimating the average treatment effect with propensity score
methods, I also ran the OLS models to obtain the comparable estimates of the effects of
supplementary tutoring on students’ achievement. I used the same set of variables used to
predict propensity scores in my OLS models. I ran two versions of the OLS: one was
before imposing the common support and the other was after imposing common support.
By comparing the estimated treatment effects across propensity score methods and OLS
models, I discussed how my results were robust depending on the estimation strategies.
Finally, to examine my third research question; whether the effect of
supplementary tutoring varied by student sub-group, I divided the sample and estimated
the treatment effects separately for each group, using the three matching methods
mentioned above. Through this process, I examined whether there existed some
heterogeneity in the causal effects.
57
In estimating a causal model for academic achievement, a major limitation of
the cross-sectional databases such as the PISA came to the fore. This was that they lacked
repeated measures of achievement. However, propensity score modeling seemed to be the
best possible method to estimate the causal effect under such circumstances (Dronkers &
Robert, 2008; Rutkowski & Rutkowski, 2010). I used the science test scores as a proxy
for previous achievement in mathematics9. I checked sensitivity by estimating the ATTs
with and without science achievement being mentioned in the logit model to predict the
propensity scores.
Missing Data
To deal with missing data, I implemented the stochastic regression imputation,
a type of single imputation method that estimates the missing values based on the
predicted values generated by a regression model plus a residual term to reflect
uncertainty in the predicted values (Little & Rubin, 2002). Compared to multiple
imputation in which estimates are calculated from multiple datasets, single imputation
only creates one dataset, often yielding underestimated variances. Using the STATA’s
“ice” command, I used all variables in the analysis model as well as some auxiliary
variables that are not in the analysis model but are highly correlated with analyzed
variables that have missing information. The imputation was conducted by running a
series of regression equations predicting the value for each individual missing value,
9 Reading test scores are absent for the United States in 2006 due to technical issues.

58
using the remaining covariate information (Little & Rubin, 2002). This means that each
variable in the imputation model served as both predictor and response variables.
In the current data for the United States and Japan, there was no missing data
for mathematics achievement, the dependent variable. For the treatment variables on the
types of supplementary tutoring, 4.58% were missing in the U.S. and 1.51% were missing
in Japan. For other covariates, those with higher than 5% of missing information included
the following variables: in the United States, 6.95% were missing for highest parental
occupational status, 10.41% for school size, 17.29% for student-teacher ratio, and 7.08%
for percentage of students receiving free/reduced lunch. In Japan, 8.38% were missing for
highest parental occupational status. Appendix B shows the percentages of missing data
for all variables in the United States and Japan.

59
Chapter 4
EMPIRICAL RESULTS
In this chapter, I examine the causal effect of two types of supplementary
tutoring—out-of-school and school—on students’ mathematics achievement, using
propensity score matching. For the United States and Japan, I first show frequencies of
participation in out-of-school tutoring and describe differences between tutored and non-
tutored students in terms of student and school characteristics. I then match samples using
propensity scores and check covariate balances between treated and control groups. As I
obtain matched samples, I estimate the causal effect of tutoring participation on students’
mathematics achievement. I also examine the heterogeneity of the causal effect in terms
of some student characteristics.
Participation in Supplementary Tutoring
Table 4.1 shows summary statistics for students’ tutoring status in the United
States. Among all U.S. students in the sample, 6.2% received out-of-school tutoring in
math, 11.5% received school tutoring in math, 11.6% received both types of tutoring in
math, and 70.7% received neither type of tutoring. Before controlling for any factors,
students who received no tutoring had the highest average mathematics test score
(488.51), followed by students who received out-of-school tutoring (475.02) and students
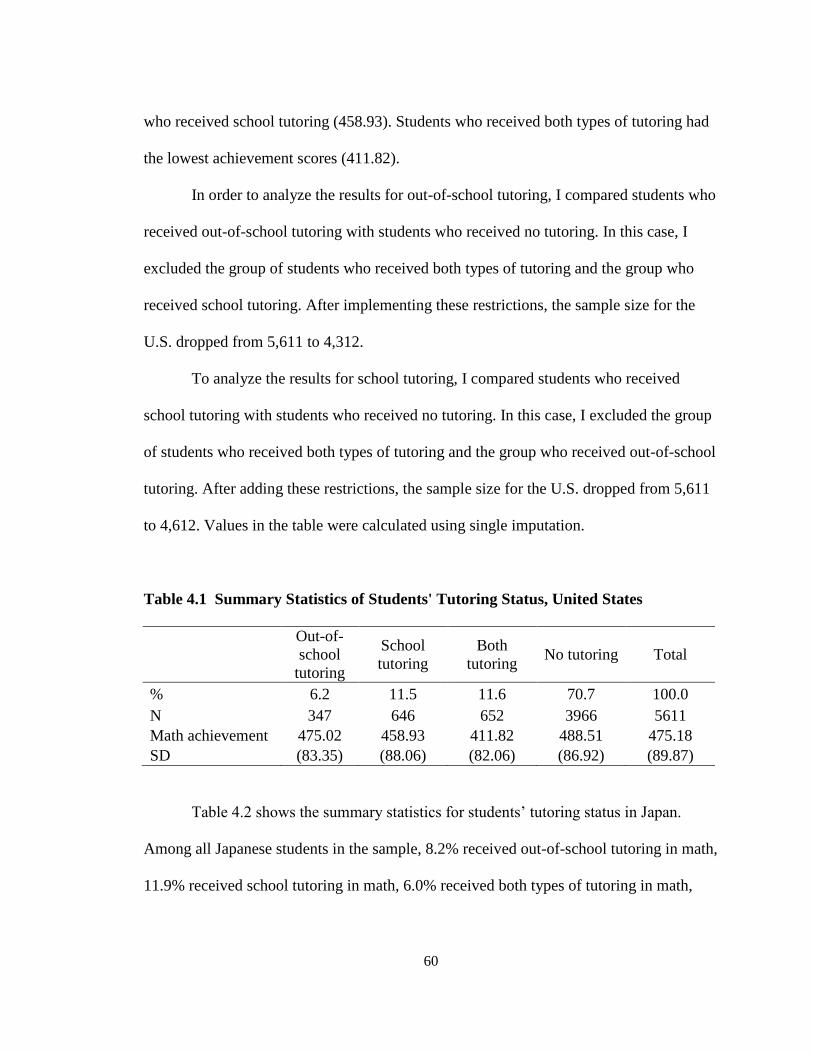
60
who received school tutoring (458.93). Students who received both types of tutoring had
the lowest achievement scores (411.82).
In order to analyze the results for out-of-school tutoring, I compared students who
received out-of-school tutoring with students who received no tutoring. In this case, I
excluded the group of students who received both types of tutoring and the group who
received school tutoring. After implementing these restrictions, the sample size for the
U.S. dropped from 5,611 to 4,312.
To analyze the results for school tutoring, I compared students who received
school tutoring with students who received no tutoring. In this case, I excluded the group
of students who received both types of tutoring and the group who received out-of-school
tutoring. After adding these restrictions, the sample size for the U.S. dropped from 5,611
to 4,612. Values in the table were calculated using single imputation.
Table 4.1 Summary Statistics of Students' Tutoring Status, United States
Out-of-
school
tutoring
School
tutoring
Both
tutoring No tutoring Total
% 6.2 11.5 11.6 70.7 100.0
N 347 646 652 3966 5611
Math achievement 475.02 458.93 411.82 488.51 475.18
SD (83.35) (88.06) (82.06) (86.92) (89.87)
Table 4.2 shows the summary statistics for students’ tutoring status in Japan.
Among all Japanese students in the sample, 8.2% received out-of-school tutoring in math,
11.9% received school tutoring in math, 6.0% received both types of tutoring in math,

61
and 74.0% received neither type of tutoring. Before controlling for any factors, students
who received out-of-school tutoring had the highest average mathematics test score
(572.61) among all four categories. This was followed by students who received school
tutoring (522.77) and students who received no tutoring (522.27), who had roughly the
same average test scores. Students who received both types of tutoring had the lowest
achievement scores (512.56).
In order to analyze the results for out-of-school tutoring, I compared students who
received out-of-school tutoring and no tutoring. In doing so, the sample size dropped
from 5,952 to 4,888. To analyze results for school tutoring, I compared students who
received school tutoring and no tutoring. The result was a drop in sample size from 5,952
to 5,108. Values in the table were calculated using single imputation.
Table 4.2 Summary Statistics of Students' Tutoring Status, Japan
Out-of-
school
tutoring
School
tutoring
Both
tutoring No tutoring Total
% 8.2 11.9 6.0 74.0 100.0
N 486 706 358 4402 5952
Math achievement 572.61 522.77 512.56 522.27 525.82
SD (80.54) (92.00) (102.21) (87.95) (89.88)
Difference between Tutored and Non-tutored Students
The findings in Table 4.3 show that in the United States, students who received
either type of tutoring differed on several student and school characteristics from students
who received no tutoring. The table also contains the results of significance tests that

62
showed whether tutored and non-tutored students significantly differed on each variable.
I first interpret the findings for out-of-school tutoring and then those for school tutoring.
In the United States, students who received out-of-school tutoring in math tend to
have lower math achievement. They are more likely to be in public schools and tend to be
female. On average, tutored students are from the same socioeconomic level as non-
tutored students in terms of parental occupational status, education level, and wealth.
However, tutored students tend to have more home education resources compared to non-
tutored students. In terms of academic motivation, tutored students in the U.S. have
greater interest in learning science and study by themselves for more hours. Tutored
students are more likely to have mothers who are employed. In terms of race, Black and
Asian students are more likely to be tutored, whereas White students are less likely to be
tutored. With regard to school characteristics, tutored students in the U.S. tend to be in
schools with a lower level of mean parental education, but with slightly higher level of
parental pressure on academic subjects. Their schools tend to be larger and located in a
large city.
In the United States, students who received school tutoring in math tend to have
lower academic achievement in math and science. They are more likely to be in public
schools and tend to have a lower socioeconomic status in terms of parental occupation.
However, tutored students have better home education resources than non-tutored
students. In terms of academic motivation, tutored students in the U.S. have more interest
in learning science and study longer by themselves. They tend to have lower math
achievement compared to their school mean achievement. As for race, tutored students

63
are more likely to be Black and Hispanic and less likely to be White. They are slightly
less likely to speak non-native language at home and tend to be either above or below
modal grade. For school characteristics, tutored students are in schools with lower level
of mean parental education and higher level of students receiving free/reduced lunch.
Their school size tends to be slightly larger and these schools tend to be located in large
cities than in small town.
Table 4.3 Descriptive Statistics by Tutoring Status, United States
United States
Variables Tutored
(Out-of-school)
Tutored
(School) Not tutored
Mean SD Mean SD Mean SD
Dependent Variable
Mathematics
achievement 475.02 83.35 ** 458.93 88.06 ** 488.51 86.92
Student
Characteristics
Private-funded school 0.07 0.26 * 0.08 0.27 * 0.11 0.31
Female 0.58 0.49 ** 0.53 0.50 0.49 0.50
Highest parental
occupational status 53.18 15.98 50.88 17.13 ** 52.77 16.91
Highest educational
level of parents 4.90 1.19 4.74 1.33 4.81 1.26
Wealth -0.04 0.93 -0.02 0.99 0.03 1.01
Home educational
resources 0.15 0.91 ** 0.06 0.95 * -0.02 1.01
General interest in
learning science 0.21 0.89 ** 0.17 0.86 ** -0.08 1.02
Regular lessons in math 4.51 2.94 4.27 2.93 4.33 3.10
Self study in math 2.80 0.96 ** 2.71 0.98 ** 2.34 0.96
Difference from school
mean math achievement 2.33 69.00 -11.05 76.87 ** 8.26 73.93
Science achievement 495.05 98.78 468.15 100.75 ** 504.01 102.06

64
Mother's employment
status
Mother full-time 0.61 0.49 0.55 0.50 0.57 0.49
Mother part-time 0.17 0.38 0.15 0.36 0.15 0.35
Mother does not work
(Ref) 0.20 0.40 * 0.26 0.44 0.25 0.44
Race
Non-Hispanic white
(Ref) 0.50 0.50 ** 0.50 0.50 ** 0.64 0.48
Black 0.16 0.37 ** 0.17 0.38 ** 0.10 0.31
Hispanic 0.18 0.39 0.24 0.43 ** 0.16 0.37
Asian 0.07 0.26 ** 0.05 0.21 0.03 0.18
Other race 0.07 0.25 0.04 0.20 + 0.06 0.23
Language at home 0.86 0.35 * 0.85 0.36 ** 0.90 0.30
Grade level
Modal grade (Ref) 0.71 0.45 0.66 0.47 ** 0.74 0.44
Above modal grade 0.18 0.38 0.20 0.40 + 0.17 0.37
Below modal grade 0.11 0.31 0.14 0.35 ** 0.09 0.29
School Characteristics
School mean parental
education 4.76 0.58 * 4.73 0.58 ** 4.83 0.58
School location
School in village or
small town (Ref) 0.22 0.42 ** 0.32 0.47 + 0.36 0.48
School in town 0.32 0.47 0.30 0.46 0.31 0.46
School in city 0.25 0.44 0.23 0.42 0.22 0.42
School in large city 0.17 0.38 ** 0.12 0.33 ** 0.09 0.28
Shortage of math
teachers 3.30 0.90 3.30 0.94 + 3.36 0.89
Parent pressure on
academic standards 2.30 0.65 * 2.13 0.69 ** 2.22 0.67
School size 1570.99 1073.55 ** 1401.60 941.38 + 1327.05 957.36
Student-teacher ratio 16.31 5.11 ** 15.63 4.47 15.50 4.70
Quality of educational
resources 0.32 0.95 0.31 0.99 0.32 1.00
% receiving 36.20 26.75 ** 36.43 27.67 ** 32.02 25.75

65
free/reduced lunch
N 347 646 3966
** p<0.01, * p<0.05, + p<0.1
Note: Statistical significance for each column shows a comparison with the non-tutored
category.
Findings in Table 4.4 show that in Japan, students who received either type of
tutoring differed in several student and school characteristics from students who received
no tutoring. After interpreting findings for out-of-school tutoring, I interpret those for
school tutoring.
In Japan, students who received out-of-school tutoring in math tend to have
higher academic achievement in math and science than students who receive no tutoring.
They are more likely to be in private schools and their socioeconomic status tends to be
higher than that of non-tutored students in terms of parent occupational status, education
level, wealth, and home education resources. On average, tutored students in Japan have
more interest in learning science and study by themselves for more hours. With regard to
school characteristics, tutored students tend to be in schools with a higher level of mean
parent education and higher level of parental pressure on academic subjects. Their
schools tend to be larger and located in cities than in towns. These schools have better
educational resources and are more academically than vocationally oriented.
In Japan, students who receive school tutoring in math tend to have the same level
of academic achievement in math and science compared to students who are not tutored.
Tutored students are more likely to be in private schools and tend to be male. On average,
tutored students have higher socioeconomic status in terms of parent occupation,

66
education, home education resources, and wealth. Tutored students in Japan tend to have
greater interest in learning science and study longer by themselves. Their math
achievement is slightly lower than their own school mean achievement. There is no
significant difference in city size among schools that enroll tutored students. However, on
average, tutored students are in slightly larger schools and experience greater parental
pressure on academic subjects and better school resources.
Table 4.4 Descriptive Statistics by Tutoring Status, Japan
Japan
Variables
Tutored
(Out-of-
school)
Tutored
(School) Not tutored
Mean SD Mean SD Mean SD
Dependent Variable
Mathematics achievement 572.61 80.54 ** 522.77 92.00 522.27 87.95
Student Characteristics
Private-funded school 0.32 0.47 ** 0.32 0.47 ** 0.27 0.44
Female 0.51 0.50 0.47 0.50 * 0.51 0.50
Highest parental
occupational status 55.56 15.12 ** 50.86 15.03 * 49.42 14.45
Highest educational level
of parents 5.53 0.84 ** 4.97 1.09 * 4.87 1.14
Wealth 0.25 0.94 ** 0.05 1.01 * -0.05 0.99
Home educational
resources 0.25 0.93 ** 0.12 1.00 ** -0.06 0.99
General interest in learning
science 0.19 0.94 ** 0.16 0.90 ** -0.07 1.02
Regular lessons in math 6.18 1.77 ** 5.35 2.36 ** 4.86 2.38
Self study in math 2.61 0.99 ** 2.38 0.91 ** 1.99 0.89
Difference from school
mean math achievement -2.34 57.40 -2.21 63.22 + 2.03 60.09
Science achievement 581.93 86.07 ** 532.94 100.35 530.21 97.24
School Characteristics

67
School mean parental
education 5.39 0.41 ** 4.93 0.57 4.90 0.59
School location
School in village or small
town (Ref) 0.02 0.15 ** 0.07 0.26 0.06 0.24
School in town 0.22 0.41 ** 0.30 0.46 0.30 0.46
School in city 0.43 0.50 0.41 0.49 0.40 0.49
School in large city 0.33 0.47 ** 0.22 0.41 0.24 0.43
Shortage of math teachers 3.81 0.49 3.83 0.46 3.80 0.51
Parent pressure on
academic standards 2.61 0.57 ** 2.36 0.64 ** 2.24 0.65
School size 862.62 343.38 ** 773.06 493.82 ** 735.06 403.35
Student-teacher ratio 14.21 4.18 ** 13.01 4.97 + 12.69 4.53
Quality of educational
resources 0.65 1.06 ** 0.53 1.02 ** 0.37 1.01
Vocational orientation 0.04 0.19 ** 0.21 0.41 ** 0.28 0.45
N 486 706 4402
** p<0.01, * p<0.05, + p<0.1
Note: Statistical significance for each column shows a comparison with the non-tutored
category.
The above description reveals some similarities and differences in the ways
students participate in two types of supplementary tutoring in two countries. For out-of-
school tutoring, tutored students in the U.S. tend to exhibit lower academic achievement
and the same level of socioeconomic status compared to non-tutored students. In contrast,
tutored students in Japan tend to indicate greater academic achievement and higher
socioeconomic status compared to non-tutored students. This contrast suggests that out-
of-school tutoring is typically used for remedial purposes by average-SES students in the
United States, whereas in Japan it is typically used for enrichment by higher-SES
students who are already performing well. However, the two countries share similar
trends on some measures, including home education resources, students’ motivation to

68
study, school location, and school size. This suggests that in both the U.S. and Japan, out-
of-school tutoring is typically used by well-resourced and higher-motivated students who
go to larger schools in large cities.
For school tutoring, tutored students in the U.S. tend to have lower academic
achievement and lower socioeconomic status compared to non-tutored students. In
contrast, tutored students in Japan tend to have the same level of academic achievement
and higher socioeconomic status compared to non-tutored students. This contrast
suggests that school tutoring is typically used for remedial purposes by lower-SES
students in the United States, whereas it is typically used to maintain the existing
performance level of higher-SES students in Japan. The two countries share similar
trends in some measures, including home educational resources, students’ motivation to
study, and school size. This suggests that in both the U.S. and Japan, school tutoring is
typically used by well-resourced and higher-motivated students who go to larger
schools10
.
Estimating Propensity Scores
In order to estimate the causal effect of supplementary tutoring participation on
students’ math achievement, I estimated propensity scores for two types of tutoring in
10
Unlike out-of-school tutoring, school location is only relevant for the U.S. but not for Japan.
That is, while school tutoring is typically used by students who live in large cities in the United
States, students typically receive school tutoring regardless of their school location in Japan.

69
each country. Since propensity score analysis approximates a randomized experiment
using survey data, students’ participation in two types of tutoring (out-of-school tutoring
and school tutoring) are regarded as two types of treatment in my study. Based on
previous studies, I chose a set of variables that simultaneously predict students’
participation in each type of tutoring (treatment) and their mathematics achievement
(outcome). I assumed that all of the predictors were observed prior to students’
participation in tutoring, meaning that they were not affected by the treatment. In addition,
I assumed that selection for participation in tutoring was solely based on observable
characteristics included in the model. These conditions were necessary to estimate the
causal effect of tutoring on mathematics achievement.
Using the predictor variables, I ran two sets of logit models for each country; one
for out-of-school tutoring and the other for school tutoring, to estimate the probability of
students’ participation in tutoring. Here, the propensity score is defined as the predicted
probability of students’ assignment to, or participation in, supplementary tutoring
(Rosenbaum & Rubin, 1983). Propensity scores are estimated to facilitate the comparison
of outcomes between the treated (tutored) and control (non-tutored) subjects who are as
similar as possible, in order to obtain less biased estimates of treatment effects based on
observed characteristics. For a given propensity score, assignment to the treatment status
is considered quasi-random; therefore, treated and control units should be on average
observationally identical (Becker & Ichino, 2002). To achieve this condition, propensity
scores as well as covariates need to balance between the treated and control groups. This

70
process of checking the balancing property ensures that members of the treated and
control groups are sufficiently similar (Becker & Ichino, 2002; Zeiser, 2011).
To create propensity scores and check balance, I used STATA’s “pscore”
command which executes the following procedures: (a) estimate the logit or probit model
with all covariates; (b) split the sample into five or more strata of the propensity score; (c)
within each stratum, test that the average propensity scores and means of each covariate
do not differ between treated and control units; and (d) if the test fails in one stratum,
split the stratum in half and test again (Becker & Ichino, 2002; Frisco et al,. 2007). The
current analysis followed the above procedures in STATA and achieved balance in
propensity scores and in most covariates between the treated and control cases within
each stratum.
The results of these logit models are shown below. Table 4.5 shows the results for
the United States. While the overall trends are similar to the results for the descriptive
statistics in Table 4.3, several features are worth noting. While two of the SES measures,
parent education level and home education resources, marginally predict students’
participation in out-of-school tutoring at the 10% level, SES measures that include these
two are not significant predictors of school tutoring in the United States. This means that,
controlling for other variables in the model, students who have more educated parents
and students with more educational resources are more likely to receive out-of-school
tutoring; however, students’ likelihood of receiving school tutoring does not differ by
these SES measures. When students’ mothers are employed either full- or part-time
(compared to no employment), students are more likely to participate in out-of-school

71
tutoring. This does not apply to school tutoring, meaning that students participate in
school tutoring regardless of mothers’ employment status. In terms of race, Black and
Asian students are more likely than White students to receive out-of-school tutoring. The
case is slightly different for school tutoring, in which Black and Hispanic students are
more likely than White students to receive tutoring.
Table 4.5 Logit Models on Students’ Participation in Tutoring, United States
Variables Out-of-school
Tutoring
School
Tutoring
Private-funded school .683 .591 **
Female 1.221 + 1.004
Highest parental occupational status 1.002 1.000
Highest educational level of parents 1.100 + 1.050
Home educational resources 1.133 + 1.078
Wealth .912 1.017
General interest in learning science 1.265 ** 1.274 **
Regular lessons in math 1.123 1.325 **
Regular lessons in math, squared .982 .962 **
Self study in math 3.581 ** 3.251 **
Self study in math, squared .867 ** .873 **
Science achievement 1.001 .997 **
Mother full-time 1.345 * .952
Mother part-time 1.585 ** 1.169
Black 1.401 + 1.559 **
Hispanic 1.145 1.639 **
Asian 1.902 * 1.461
Other race 1.455 .903
Language at home .979 .989
Above modal grade .997 1.273 *
Below modal grade 1.279 1.336 *
School mean parental education .765 + .982
School in town 1.505 * 1.214
School in city 1.586 * 1.254
School in large city 2.148 ** 1.264
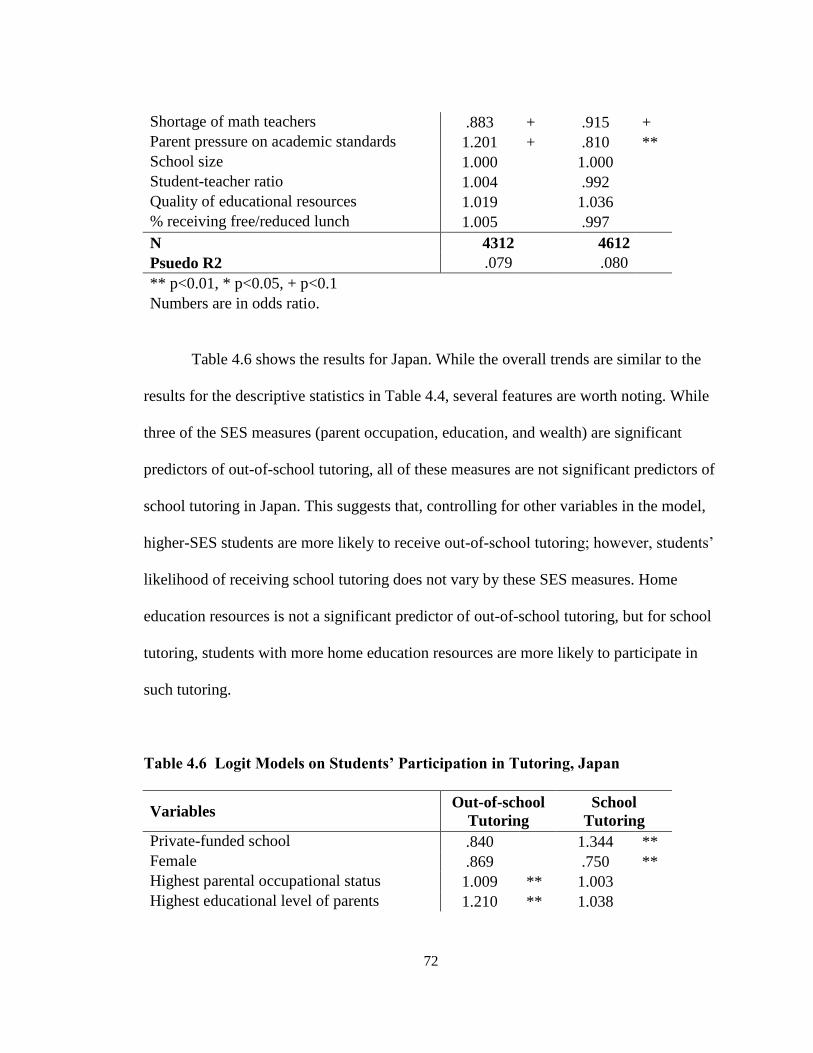
72
Shortage of math teachers .883 + .915 +
Parent pressure on academic standards 1.201 + .810 **
School size 1.000 1.000
Student-teacher ratio 1.004 .992
Quality of educational resources 1.019 1.036
% receiving free/reduced lunch 1.005 .997
N 4312 4612
Psuedo R2 .079 .080
** p<0.01, * p<0.05, + p<0.1
Numbers are in odds ratio.
Table 4.6 shows the results for Japan. While the overall trends are similar to the
results for the descriptive statistics in Table 4.4, several features are worth noting. While
three of the SES measures (parent occupation, education, and wealth) are significant
predictors of out-of-school tutoring, all of these measures are not significant predictors of
school tutoring in Japan. This suggests that, controlling for other variables in the model,
higher-SES students are more likely to receive out-of-school tutoring; however, students’
likelihood of receiving school tutoring does not vary by these SES measures. Home
education resources is not a significant predictor of out-of-school tutoring, but for school
tutoring, students with more home education resources are more likely to participate in
such tutoring.
Table 4.6 Logit Models on Students’ Participation in Tutoring, Japan
Variables Out-of-school
Tutoring
School
Tutoring
Private-funded school .840 1.344 **
Female .869 .750 **
Highest parental occupational status 1.009 ** 1.003
Highest educational level of parents 1.210 ** 1.038

73
Home educational resources 1.078 1.121 **
Wealth 1.183 ** 1.029
General interest in learning science 1.053 1.222 **
Regular lessons in math .745 + .778 **
Regular lessons in math, squared 1.039 * 1.036 **
Self study in math 2.478 ** 4.270 **
Self study in math, squared .899 ** .824 **
Science achievement 1.002 * .999 +
School mean parental education 2.158 ** .563 **
School in town 1.044 .858
School in city 1.253 .804
School in large city 1.557 .816
Shortage of math teachers .693 ** 1.036
Parent pressure on academic standards 1.284 * 1.168 +
School size .999 ** 1.000
Student-teacher ratio 1.038 * 1.004
Quality of educational resources 1.173 ** 1.097 *
Vocational orientation .447 ** .835
N 4888 5108
Psuedo R2 .164 .059
Once propensity scores were obtained and the balancing property was satisfied, I
checked for a potential substantial overlap in propensity scores between the treated and
control cases. This overlap, called the common support region, ensures that comparisons
are made within the propensity score range where there are sufficient treated and control
cases (Becker & Ichino, 2002; Caliendo & Kopeinig, 2008). Previous studies suggest
several ways to check for this overlap. I conducted Minima and Maxima comparison, a
straightforward way to delete all observations whose propensity score is smaller than the
minimum and larger than the maximum in the opposite group (Caliendo & Kopeinig,
2008). That is, treated cases (tutored students) and control cases (non-tutored students)

74
whose propensity scores did not fall between the minimum and maximum propensity
scores for either case were removed from the sample.
One should be careful in imposing the common support restriction, as “high
quality matches may be lost at the boundaries of the common support and the sample
may be considerably reduced” (Becker & Ichino, 2002, p. 362). Therefore, next I show a
summary of propensity scores before and after imposing the common support restriction,
and examine proportions of cases removed for being outliers. In addition, I show the
histogram or density distribution of the propensity score in both groups after imposing
the common support. Such visual inspection enables a data quality check and helps
determine which matching algorithm may work better in subsequent matching. It should
be noted that common support is particularly important for kernel matching, as the
method matches all control cases with treated cases using weights. On the other hand,
nearest-neighbor method itself handles the common problem well, as the method discards
control cases that do not find adequate matches (Caliendo & Kopeinig 2008).
Table 4.7 shows the summary of propensity scores for out-of-school tutoring in
the United States. It shows that tutored students have a higher mean propensity score than
non-tutored students. Common support removed 1.03% of the sample for having no
comparable match, all in the control group (37 cases with the lowest propensity scores
and 5 cases with the highest propensity scores). As a result, the maximum propensity
score was adjusted to .411 instead of .511 and the minimum propensity score was
adjusted to .009 instead of .003. From here on, I restrict the sample for propensity score

75
analysis to cases that are “on support,” by deleting subjects that are off the common
support region.
Table 4.7 Summary of Propensity Scores, Out-of-school Tutoring, United States
Treated (Tutored) Control (Non-tutored) Total
Propensity scores N Mean SD Min Max N Mean SD Min Max
All 347 .125 .074 .009 .411 3965 .077 .058 .003 .511 4312
Off support
(1.03%) 0 42
(37 below minimum, 5
above maximum)
On support 347 .125 .074 .009 .411 3923 .077 .057 .009 .395 4270
Figure 4.1 shows the propensity score distribution after imposing the common
support restriction for out-of-school tutoring in the United States. The bars in the upper
half show the density distribution for tutored (=treated) students, and the bars in the lower
half show the distribution for non-tutored (=control) students. This propensity score
histogram by treatment status is made using the STATA’s “psgraph” command. Note that
the histogram is not proportional to the actual sample sizes for treated and control cases,
but is adjusted to represent each group with equal weights. For example, treated cases are
much smaller (347) than the control cases (3926) as described in Table 4.7.
The figure shows that students who received tutoring are more likely to have
higher values on propensity scores than students who did not receive tutoring. The
unequal distribution of propensity scores between treated and control groups indicates
that assignment to the treatment (out-of-school tutoring) is not random and that
systematic differences exist between these two groups of students.
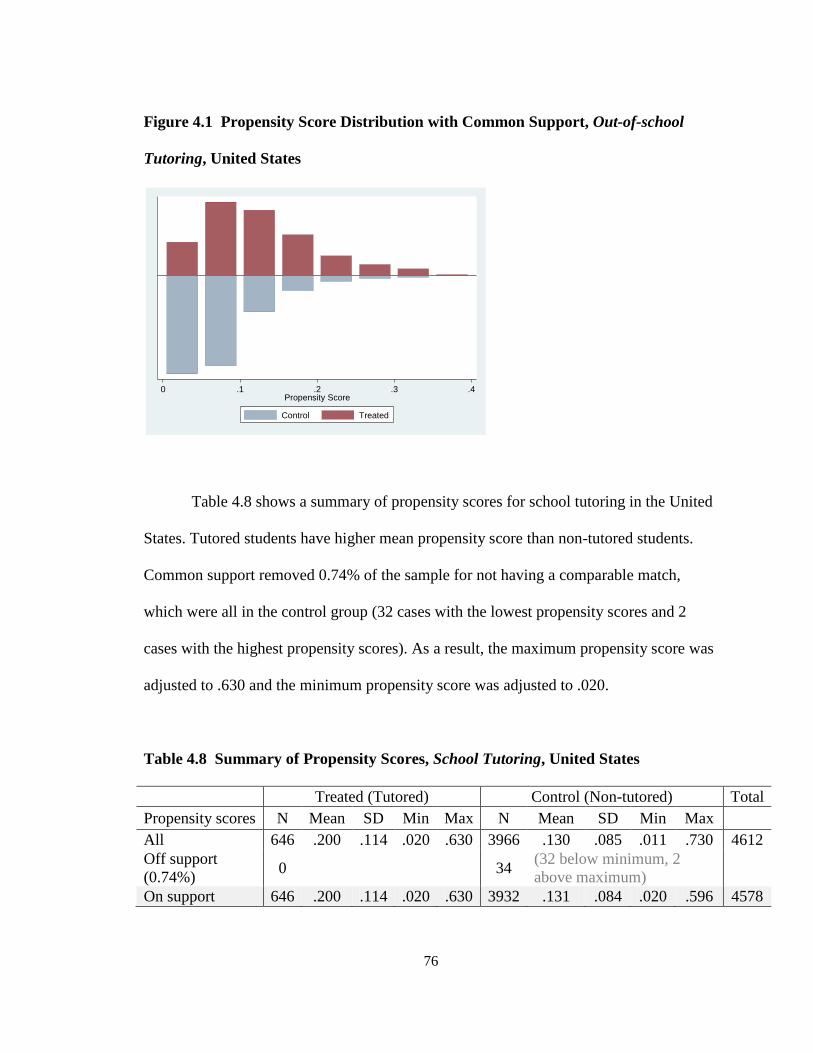
76
Figure 4.1 Propensity Score Distribution with Common Support, Out-of-school
Tutoring, United States
0 .1 .2 .3 .4Propensity Score
Control Treated
Table 4.8 shows a summary of propensity scores for school tutoring in the United
States. Tutored students have higher mean propensity score than non-tutored students.
Common support removed 0.74% of the sample for not having a comparable match,
which were all in the control group (32 cases with the lowest propensity scores and 2
cases with the highest propensity scores). As a result, the maximum propensity score was
adjusted to .630 and the minimum propensity score was adjusted to .020.
Table 4.8 Summary of Propensity Scores, School Tutoring, United States
Treated (Tutored) Control (Non-tutored) Total
Propensity scores N Mean SD Min Max N Mean SD Min Max
All 646 .200 .114 .020 .630 3966 .130 .085 .011 .730 4612
Off support
(0.74%) 0 34
(32 below minimum, 2
above maximum)
On support 646 .200 .114 .020 .630 3932 .131 .084 .020 .596 4578

77
Figure 4.2 exhibits propensity score distribution after imposing common support
for school tutoring in the United States. The figure shows that students who received
tutoring are slightly more likely to have higher values on propensity scores than students
who did not receive tutoring, although the proportion of treated cases versus control cases
is relatively similar across different propensity score ranges. The unequal distribution of
propensity scores between treated and control groups indicates that assignment to the
treatment (school tutoring) is not random and that systematic differences exist between
these two groups of students.
Figure 4.2 Propensity Score Distribution with Common Support, School Tutoring,
United States
0 .2 .4 .6Propensity Score
Control Treated
Table 4.9 offers a summary of propensity scores for out-of-school tutoring in
Japan. It shows that tutored students have higher mean propensity scores than non-tutored
students. Common support removed 11.03% of the sample for not having a comparable

78
match, 2 of whom were in the treated group (with the highest propensity scores) and 536
in the control group (with the lowest propensity scores). As a result, the maximum
propensity score was adjusted to .556 and the minimum to .008.
Table 4.9 Summary of Propensity Scores, Out-of-school Tutoring, Japan
Treated (Tutored) Control (Non-tutored) Total
Propensity scores N Mean SD Min Max N Mean SD Min Max N
All 486 .198 .113 .008 .584 4402 .089 .093 .001 .556 4888
Off support
(11.03%) 2
(2 above maximum
support) 536
(536 below minimum
support)
On support 484 .196 .111 .008 .553 3866 .100 .094 .008 .556 4350
Figure 4.3 indicates propensity score distribution after imposing common support
for out-of-school tutoring in Japan. The figure shows that students who received tutoring
are more likely to have higher values on propensity scores than students who did not
receive tutoring. Students who did not receive tutoring tend to be clustered in the lowest
propensity score range, suggesting that many of those who were predicted to be least
likely to receive tutoring actually did not receive tutoring. The unequal distribution of
propensity scores between treated and control groups indicates that assignment to the
treatment (out-of-school tutoring) is not random and that systematic differences exist
between these two groups of students.

79
Figure 4.3 Propensity Score Distribution with Common Support, Out-of-school
Tutoring, Japan
0 .2 .4 .6Propensity Score
Control Treated
Table 4.10 offers a summary of propensity scores for school tutoring in Japan. It
shows that tutored students have higher mean propensity scores than non-tutored
students. Common support removed 1.81% of the sample for not having a comparable
match, which were all in the control group (90 cases with the lowest propensity scores
and 1 case with the highest propensity score). As a result, the maximum propensity score
was adjusted to .466 and the minimum propensity score was adjusted to .030.
Table 4.10 Summary of Propensity Scores, School Tutoring, Japan
Treated (Tutored) Control (Non-tutored) Total
Propensity scores N Mean SD Min Max N Mean SD Min Max
All 706 .178 .079 .030 .466 4402 .132 .073 .017 .510 5108
Off support
(1.81%) 0 91
(90 below minimum, 1 above
maximum)
On support 706 .178 .079 .030 .466 4311 .134 .072 .030 .462 5017

80
Figure 4.4 exhibits propensity score distribution after imposing common support
for school tutoring in Japan. The figure shows that students who received tutoring are
slightly more likely to have higher values on propensity scores than students who did not
receive tutoring. The unequal distribution of propensity scores between treated and
control groups indicates that assignment to the treatment (school tutoring) is not random
and that systematic differences exist between these two groups of students.
Figure 4.4 Propensity Score Distribution with Common Support, School Tutoring,
Japan
0 .1 .2 .3 .4 .5Propensity Score
Control Treated
Matching Using Estimated Propensity Scores
Using propensity scores obtained from the logit models, I matched tutored
(treated) and non-tutored (control) students who had a similar propensity of receiving two

81
types of supplementary tutoring. The goal in performing matching was to produce two
samples of students who were similar on all observed characteristics except for their
participation in supplementary tutoring. I used three types of matching methods explained
in the previous chapter: (a) nearest-neighbor matching (one-to-one match with
replacement and within a caliper), (b) stratification matching, and (c) kernel matching.
As causal effects are estimated from counterfactual cases created from these
matching methods, matching must be done appropriately. To show how well the matches
were made, I checked the balance in propensity scores between treated and control cases.
Balance in propensity scores was checked for the former two matching methods: nearest-
neighbor matching and stratification method. Since the kernel method uses all the control
cases with weights, it is hard to check balance in a meaningful way. Since nearest-
neighbor and stratification methods are based on different ideas, I show how propensity
scores balance in a different manner for each method. For the nearest-neighbor method,
boxplots for propensity score distribution before and after matching are presented. For
the stratification method, summary statistics for propensity scores for five strata after
matching are presented.
Figure 4.5 shows the distribution of propensity scores for tutored (treated) and
non-tutored (control) students before and after implementing nearest-neighbor matching,
for out-of-school tutoring in the United States. The left figure, before matching, shows
some overlap in propensity score distribution between the two groups . There are
disparities at the highest end as well as around the mean values.

82
The right figure offers a distribution of propensity scores after matching for the
same sample of students, using a nearest neighbor matching (one-to-one match with
replacement and within a caliper). As a result of this matching, for out-of-school tutoring
in the United States, the sample size decreased from 4,270 to 694 (347 treated and 347
controls). The figure shows that the distributions of propensity scores in two groups are
well balanced. Control cases with relatively lower propensity scores are removed with
matching, so that the mean and maximum values for the control cases rose after matching
to achieve similar distributions between the two groups. Substantively, this suggests that
many of the students who were not tutored (control cases) also had a lower likelihood of
receiving tutoring before matching; however, since those with a higher likelihood were
selected for matching within in the control group, treated and control cases became more
comparable.
Figure 4.5 Propensity Score Distribution before and after Matching (Nearest
Neighbor), Out-of-school Tutoring, United States
0.1
.2.3
.4
Estim
ate
d p
rope
nsity s
core
Control Treated
Propensity Score Distribution Before Matching, USA
0.1
.2.3
.4
Estim
ate
d p
rope
nsity s
core
Control Treated
Propensity Score Distribution After Matching, USA

83
Table 4.11 offers summary statistics for propensity scores by five strata created
via stratification matching for out-of-school tutoring in the United States. Unlike nearest-
neighbor matching, in stratification matching sample size stayed the same as long as all
treated and control cases fell under some strata and were used in matching. The table
indicates that the means for propensity scores were similar between the treated and
control groups within each stratum, demonstrating that each stratum was similar enough
in terms of propensity scores.
Note that the fifth stratum only has one case in the treated group, with a
propensity score of .411. This may suggest that even though common support was
imposed, an outlier emerged when stratification matching was conducted. However,
caution is necessary when deciding whether this particular case should be viewed as an
outlier. As shown in Table 4.7, the next highest propensity score in the control group
was .395, which is not hugely different from .411. The fifth stratum was created to ensure
that the means in the treated and control cases in the fourth strata were similar enough. I
kept this case in the fifth stratum because I believed that it would not significantly bias
the result. Since the average treatment effect is obtained by weighting the cases in each
stratum, one case in the fifth stratum would not overly contribute to the overall estimate.

84
Table 4.11 Summary Statistics of Propensity Scores by Matched Strata
(Stratification), Out-of-school Tutoring, United States
Treated (Tutored) Control (Non-tutored)
Mean S.D. N Mean S.D. N
Stratum 1 .035 .011 47 .031 .011 1541
Stratum 2 .074 .014 101 .072 0.01 1413
Stratum 3 .141 .027 146 .136 0.03 806
Stratum 4 .258 .041 52 .256 0.04 163
Stratum 5 .411 . 1 0
Figure 4.6 shows the distribution of propensity scores for treated and control
cases before and after implementing nearest-neighbor matching, for school tutoring in the
United States. Before matching, the figure shows some overlap between students who
received school tutoring (treated) and students who received no tutoring (controls), but
also some disparities at the higher end as well as in their mean values. After matching,
the figure shows that the distributions of propensity scores are similar in the two groups.
This shows that within the control group, a smaller number of students with relatively
high propensity scores was chosen through matching. As a result of nearest neighbor
matching, for school tutoring in the United States, the sample size decreased from 4,578
to 1,292 (646 treated and 646 controls).

85
Figure 4.6 Propensity Score Distribution before and after Matching (Nearest
Neighbor), School Tutoring, United States 0
.2.4
.6
Estim
ate
d p
rope
nsity s
core
Control Treated
Propensity Score Distribution Before Matching, USA
0.2
.4.6
Estim
ate
d p
rope
nsity s
core
Control Treated
Propensity Score Distribution After Matching, USA
Table 4.12 offers summary statistics for propensity scores according to seven
strata created by stratification matching for school tutoring in the United States. The table
shows that the means for propensity scores were similar between treated and control
groups within each stratum, indicating that each stratum was similar enough in terms of
propensity scores.
Table 4.12 Summary Statistics of Propensity Scores by Matched Strata
(Stratification), School Tutoring, United States
Treated (Tutored) Control (Non-tutored)
Mean S.D. N Mean S.D. N
Stratum 1 .041 .008 16 .038 0.01 462
Stratum 2 .079 .013 98 .075 0.01 1249
Stratum 3 .126 .014 152 .124 0.01 1025
Stratum 4 .175 .014 116 .173 0.01 538
Stratum 5 .271 .054 216 .266 0.05 613
Stratum 6 .473 .054 47 .464 0.05 45
Stratum 7 .630 . 1 0

86
Figure 4.7 shows the distribution of propensity scores for treated and control
cases before and after implementing nearest-neighbor matching, for out-of-school
tutoring in Japan. Before matching, propensity scores were clustered in the lower tail in
the control group. This suggests that students who were expected to have a lower
probability of receiving out-of-school tutoring in Japan actually did not receive tutoring.
After matching, the distribution is more balanced. As a result of nearest neighbor
matching, for out-of-school tutoring in Japan the sample size decreased from 4,350 to
968 (484 treated and 484 controls).
Figure 4.7 Propensity Score Distribution before and after Matching (Nearest
Neighbor), Out-of-school Tutoring, Japan
0.2
.4.6
Estim
ate
d p
rope
nsity s
core
Control Treated
Propensity Score Distribution Before Matching, JPN
0.2
.4.6
Estim
ate
d p
rope
nsity s
core
Control Treated
Propensity Score Distribution After Matching, JPN
Table 4.13 exhibits summary statistics for propensity scores by seven strata
created via stratification matching for out-of-school tutoring in Japan. The table shows
that the means for propensity scores were similar between treated and control groups

87
within each stratum, indicating that each stratum was similar enough in terms of
propensity scores.
Table 4.13 Summary Statistics of Propensity Scores by Matched Strata
(Stratification), Out-of-school Tutoring, Japan
Treated (Tutored) Control (Non-tutored)
Mean S.D. N Mean S.D. N
Stratum 1 .027 .012 34 .025 .012 1617
Stratum 2 .065 .008 27 .062 .007 434
Stratum 3 .088 .007 39 .087 .007 353
Stratum 4 .125 .015 83 .125 .014 547
Stratum 5 .176 .014 97 .174 .014 347
Stratum 6 .279 .052 178 .273 .052 535
Stratum 7 .458 .045 26 .441 .037 33
Figure 4.8 shows the distribution of propensity scores for treated and control
cases before and after implementing nearest-neighbor matching, for school tutoring in
Japan. Before matching, the propensity scores tend to be concentrated in the lower ends
of the control group. After matching, propensity score distributions are similar between
the treated and control groups. As a result of nearest neighbor matching, for school
tutoring in Japan the sample size decreases from 5,017 to 1,412 (706 treated and 706
controls).

88
Figure 4.8 Propensity Score Distribution before and after Matching (Nearest
Neighbor), School Tutoring, Japan 0
.1.2
.3.4
.5
Estim
ate
d p
rope
nsity s
core
Control Treated
Propensity Score Distribution Before Matching, JPN
0.1
.2.3
.4.5
Estim
ate
d p
rope
nsity s
core
Control Treated
Propensity Score Distribution After Matching, JPN
Table 4.14 shows summary statistics for propensity scores by eight strata
created via stratification matching for school tutoring in Japan. The means of propensity
scores were similar between treated and control groups within each stratum, showing that
each stratum was similar enough in terms of propensity scores.
Table 4.14 Summary Statistics of Propensity Scores by Matched Strata
(Stratification), School Tutoring, Japan
Treated (Tutored) Control (Non-tutored)
Mean S.D. N Mean S.D. N
Stratum 1 .041 .006 18 .041 .006 423
Stratum 2 .062 .008 30 .062 .007 601
Stratum 3 .088 .007 70 .087 .007 598
Stratum 4 .127 .015 156 .125 .015 1134
Stratum 5 .175 .016 195 .172 .014 793
Stratum 6 .241 .028 177 .237 .027 648
Stratum 7 .332 .024 52 .337 .027 107
Stratum 8 .428 .020 8 .426 .025 7
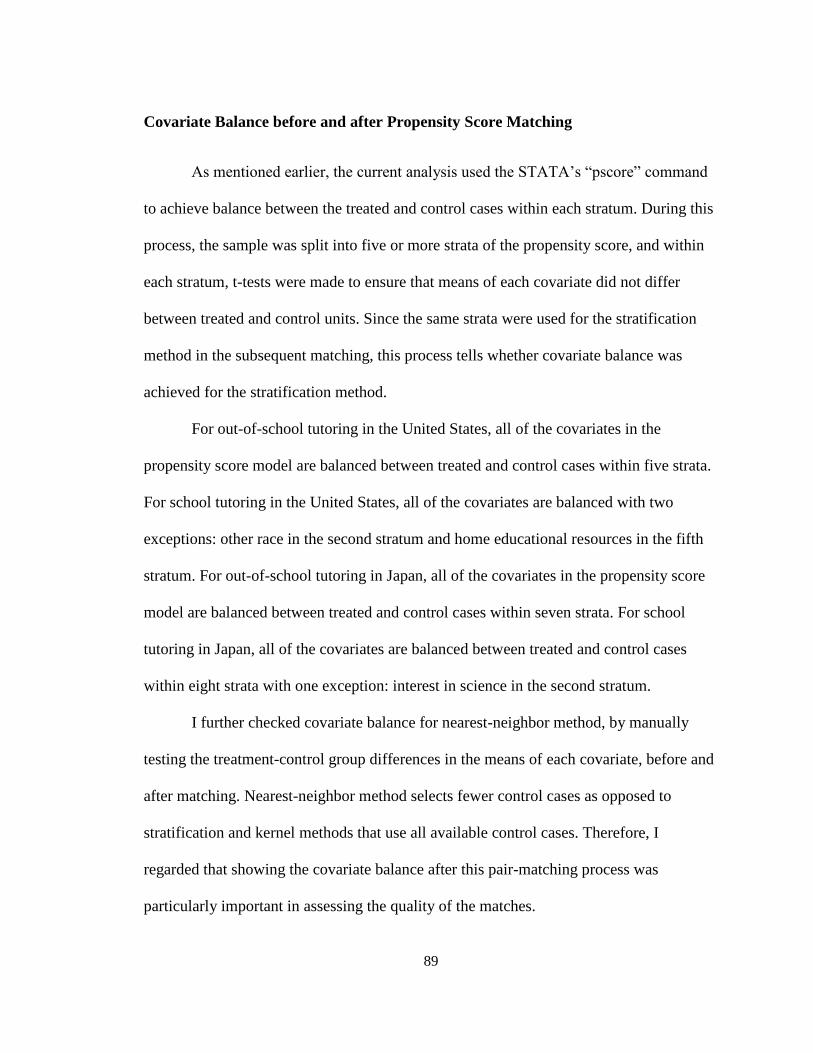
89
Covariate Balance before and after Propensity Score Matching
As mentioned earlier, the current analysis used the STATA’s “pscore” command
to achieve balance between the treated and control cases within each stratum. During this
process, the sample was split into five or more strata of the propensity score, and within
each stratum, t-tests were made to ensure that means of each covariate did not differ
between treated and control units. Since the same strata were used for the stratification
method in the subsequent matching, this process tells whether covariate balance was
achieved for the stratification method.
For out-of-school tutoring in the United States, all of the covariates in the
propensity score model are balanced between treated and control cases within five strata.
For school tutoring in the United States, all of the covariates are balanced with two
exceptions: other race in the second stratum and home educational resources in the fifth
stratum. For out-of-school tutoring in Japan, all of the covariates in the propensity score
model are balanced between treated and control cases within seven strata. For school
tutoring in Japan, all of the covariates are balanced between treated and control cases
within eight strata with one exception: interest in science in the second stratum.
I further checked covariate balance for nearest-neighbor method, by manually
testing the treatment-control group differences in the means of each covariate, before and
after matching. Nearest-neighbor method selects fewer control cases as opposed to
stratification and kernel methods that use all available control cases. Therefore, I
regarded that showing the covariate balance after this pair-matching process was
particularly important in assessing the quality of the matches.

90
Table 4.15 shows the covariate balance before and after nearest-neighbor
matching for out-of-school tutoring in the United States. It shows that while there are
significant between-group differences in the mean of most covariates before matching, all
of the significant differences are removed after matching. This contrast shows that
covariates are successfully balanced after nearest-neighbor matching. The table also
shows that the number of control cases significantly drops after matching.
Table 4.15 Covariate Balance before and after Matching (Nearest Neighbor), Out-
of-school Tutoring, United States
Before Matching After Matching
Treated Control t-test Treated Control t-test
(N=347) (N=3965) (N=346) (N=346)
Private-funded school .07 .11 2.00 * .07 .06 -.77
Female .58 .49 -3.05 ** .58 .61 .77
Highest parental
occupational status 53.18 52.77 -.43 53.18 54.31 .92
Highest educational level
of parents 4.90 4.81 -1.31 4.90 4.90 -.03
Home educational
resources .15 -.02 -3.00 ** .15 .10 -.73
Wealth -.04 .03 1.15 -.04 -.06 -.26
General interest in
learning science .21 -.08 -5.18 ** .20 .20 -.09
Regular lessons in math 4.51 4.33 -1.06 4.50 4.71 .93
Self study in math 2.80 2.34 -8.59 ** 2.79 2.81 .16
Science achievement 495.05 504.03 1.58 495.50 492.18 -.45
Mother full-time .61 .57 -1.15 .60 .58 -.54
Mother part-time .17 .15 -1.38 .17 .18 .20
Mother not working .20 .25 2.04 * .21 .21 .09
White .50 .64 5.06 ** .50 .50 -.08
Black .16 .10 -3.41 ** .16 .17 .10
Hispanic .18 .16 -1.01 .18 .20 .39
Asian .07 .03 -3.56 ** .07 .07 .00
Other race .07 .06 -.85 .07 .07 -.15

91
Language at home .86 .90 2.36 * .86 .86 .00
Modal grade .71 .74 1.20 .71 .72 .17
Above modal grade .18 .17 -.51 .18 .15 -1.13
Below modal grade .11 .09 -1.15 .11 .14 1.04
School mean parental
education 4.76 4.83 2.01 * 4.76 4.77 .26
School in small town .22 .36 5.17 ** .22 .25 .72
School in town .32 .31 -.59 .32 .31 -.41
School in city .25 .22 -1.38 .25 .25 .00
School in large city .17 .08 -5.28 .17 .17 .20
Shortage of math
teachers 3.30 3.36 1.27 3.30 3.32 .26
Parent pressure on
academic standards 2.30 2.22 -2.00 * 2.29 2.26 -.63
School size 1570.99 1327.03 -4.51 ** 1568.21 1490.12 -1.00
Student-teacher ratio 16.31 15.50 -3.05 ** 16.31 16.17 -.36
Quality of educational
resources .32 .32 .06 .32 .37 .67
% receiving free/reduced
lunch 36.20 32.00 -2.91 ** 36.25 36.72 .22
** p<0.01, * p<0.05, + p<0.1
Table 4.16 shows the covariate balance before and after nearest-neighbor
matching for school tutoring in the United States. It shows that all of the significant
differences in covariate means are removed after matching, suggesting that covariates
were successfully balanced after matching.
Table 4.16 Covariate Balance before and after Matching (Nearest Neighbor),
School Tutoring, United States
Before Matching After Matching
Treated Control t-test Treated Control t-test
(N=646) (N=3966) (N=646) (N=646)
Private-funded school .08 .11 2.12 * .08 .08 .20
Female .53 .49 -1.60 .53 .52 -.45
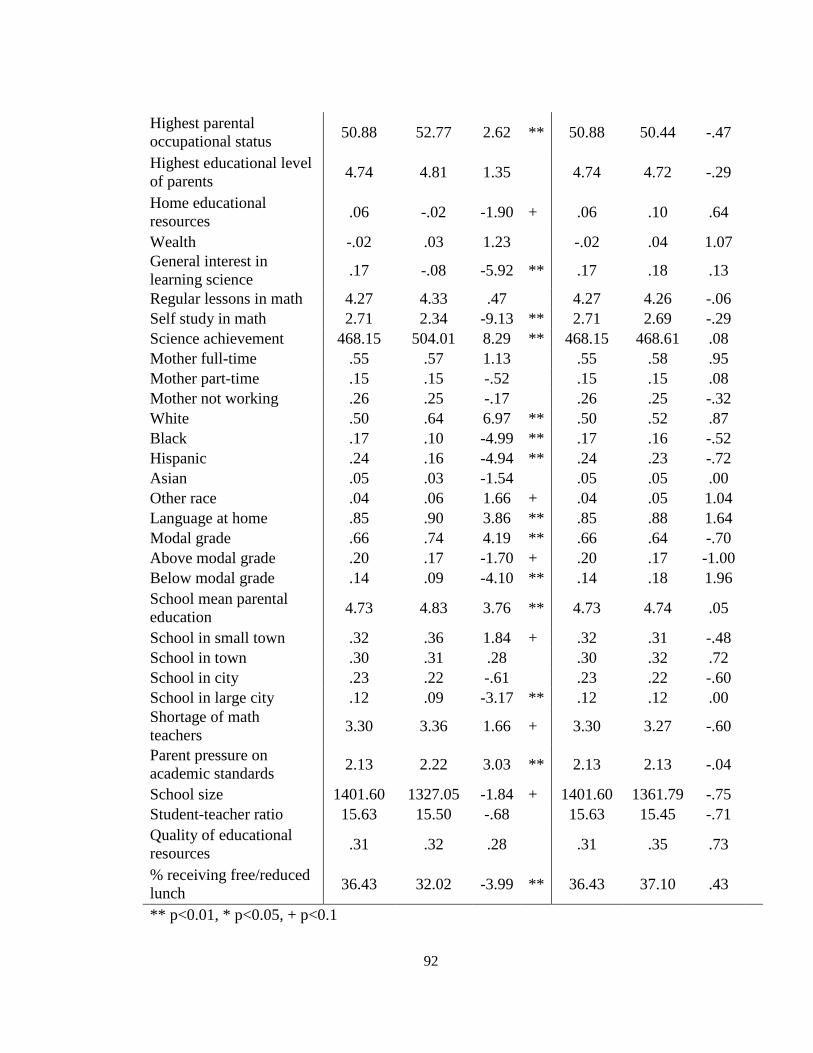
92
Highest parental
occupational status 50.88 52.77 2.62 ** 50.88 50.44 -.47
Highest educational level
of parents 4.74 4.81 1.35 4.74 4.72 -.29
Home educational
resources .06 -.02 -1.90 + .06 .10 .64
Wealth -.02 .03 1.23 -.02 .04 1.07
General interest in
learning science .17 -.08 -5.92 ** .17 .18 .13
Regular lessons in math 4.27 4.33 .47 4.27 4.26 -.06
Self study in math 2.71 2.34 -9.13 ** 2.71 2.69 -.29
Science achievement 468.15 504.01 8.29 ** 468.15 468.61 .08
Mother full-time .55 .57 1.13 .55 .58 .95
Mother part-time .15 .15 -.52 .15 .15 .08
Mother not working .26 .25 -.17 .26 .25 -.32
White .50 .64 6.97 ** .50 .52 .87
Black .17 .10 -4.99 ** .17 .16 -.52
Hispanic .24 .16 -4.94 ** .24 .23 -.72
Asian .05 .03 -1.54 .05 .05 .00
Other race .04 .06 1.66 + .04 .05 1.04
Language at home .85 .90 3.86 ** .85 .88 1.64
Modal grade .66 .74 4.19 ** .66 .64 -.70
Above modal grade .20 .17 -1.70 + .20 .17 -1.00
Below modal grade .14 .09 -4.10 ** .14 .18 1.96
School mean parental
education 4.73 4.83 3.76 ** 4.73 4.74 .05
School in small town .32 .36 1.84 + .32 .31 -.48
School in town .30 .31 .28 .30 .32 .72
School in city .23 .22 -.61 .23 .22 -.60
School in large city .12 .09 -3.17 ** .12 .12 .00
Shortage of math
teachers 3.30 3.36 1.66 + 3.30 3.27 -.60
Parent pressure on
academic standards 2.13 2.22 3.03 ** 2.13 2.13 -.04
School size 1401.60 1327.05 -1.84 + 1401.60 1361.79 -.75
Student-teacher ratio 15.63 15.50 -.68 15.63 15.45 -.71
Quality of educational
resources .31 .32 .28 .31 .35 .73
% receiving free/reduced
lunch 36.43 32.02 -3.99 ** 36.43 37.10 .43
** p<0.01, * p<0.05, + p<0.1
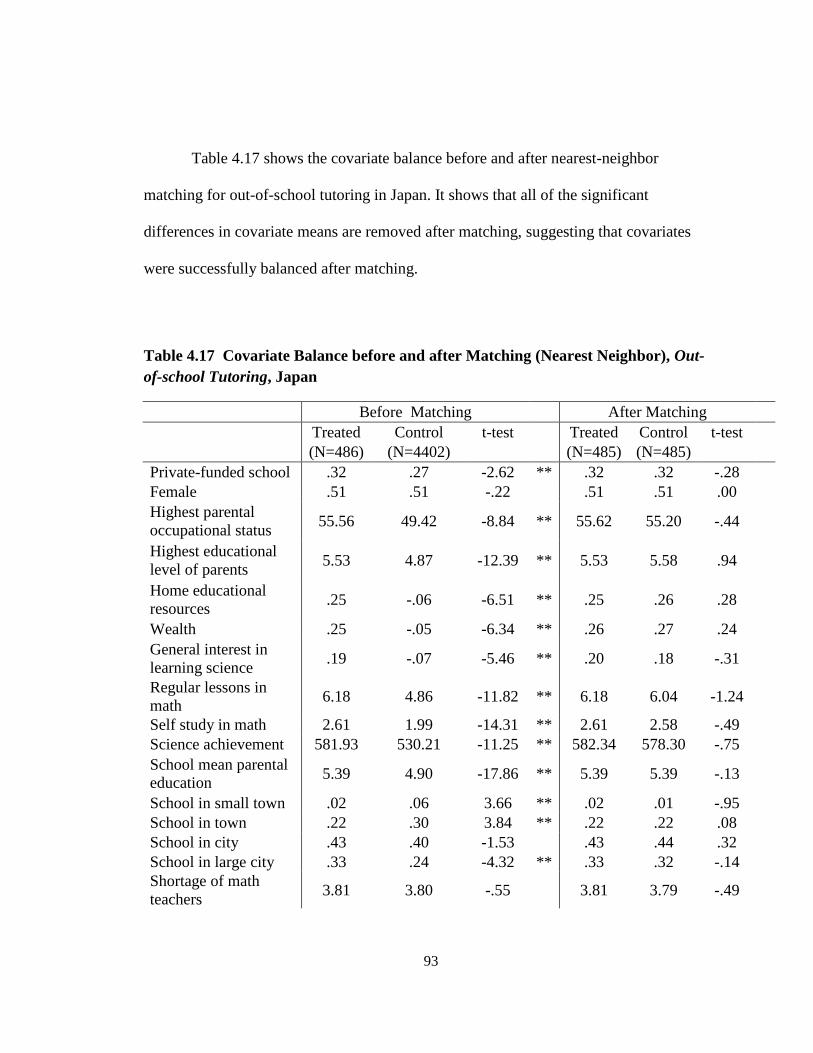
93
Table 4.17 shows the covariate balance before and after nearest-neighbor
matching for out-of-school tutoring in Japan. It shows that all of the significant
differences in covariate means are removed after matching, suggesting that covariates
were successfully balanced after matching.
Table 4.17 Covariate Balance before and after Matching (Nearest Neighbor), Out-
of-school Tutoring, Japan
Before Matching After Matching
Treated Control t-test Treated Control t-test
(N=486) (N=4402) (N=485) (N=485)
Private-funded school .32 .27 -2.62 ** .32 .32 -.28
Female .51 .51 -.22 .51 .51 .00
Highest parental
occupational status 55.56 49.42 -8.84 ** 55.62 55.20 -.44
Highest educational
level of parents 5.53 4.87 -12.39 ** 5.53 5.58 .94
Home educational
resources .25 -.06 -6.51 ** .25 .26 .28
Wealth .25 -.05 -6.34 ** .26 .27 .24
General interest in
learning science .19 -.07 -5.46 ** .20 .18 -.31
Regular lessons in
math 6.18 4.86 -11.82 ** 6.18 6.04 -1.24
Self study in math 2.61 1.99 -14.31 ** 2.61 2.58 -.49
Science achievement 581.93 530.21 -11.25 ** 582.34 578.30 -.75
School mean parental
education 5.39 4.90 -17.86 ** 5.39 5.39 -.13
School in small town .02 .06 3.66 ** .02 .01 -.95
School in town .22 .30 3.84 ** .22 .22 .08
School in city .43 .40 -1.53 .43 .44 .32
School in large city .33 .24 -4.32 ** .33 .32 -.14
Shortage of math
teachers 3.81 3.80 -.55 3.81 3.79 -.49
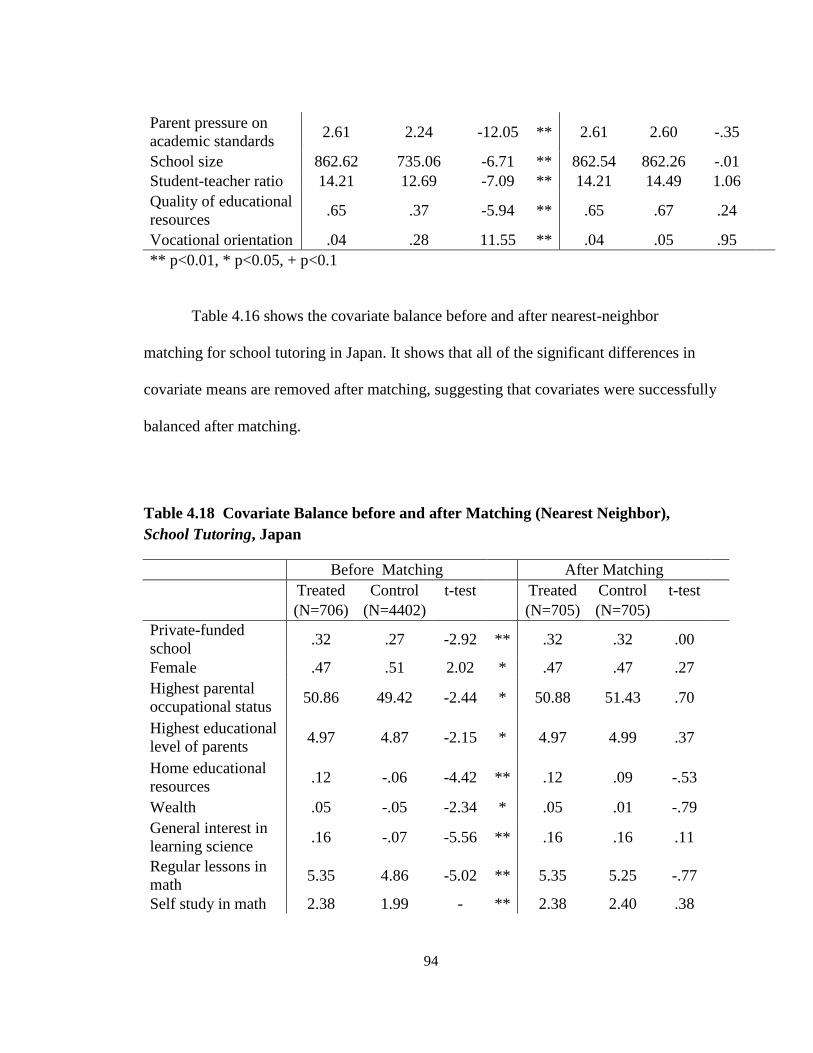
94
Parent pressure on
academic standards 2.61 2.24 -12.05 ** 2.61 2.60 -.35
School size 862.62 735.06 -6.71 ** 862.54 862.26 -.01
Student-teacher ratio 14.21 12.69 -7.09 ** 14.21 14.49 1.06
Quality of educational
resources .65 .37 -5.94 ** .65 .67 .24
Vocational orientation .04 .28 11.55 ** .04 .05 .95
** p<0.01, * p<0.05, + p<0.1
Table 4.16 shows the covariate balance before and after nearest-neighbor
matching for school tutoring in Japan. It shows that all of the significant differences in
covariate means are removed after matching, suggesting that covariates were successfully
balanced after matching.
Table 4.18 Covariate Balance before and after Matching (Nearest Neighbor),
School Tutoring, Japan
Before Matching After Matching
Treated Control t-test Treated Control t-test
(N=706) (N=4402) (N=705) (N=705)
Private-funded
school .32 .27 -2.92 ** .32 .32 .00
Female .47 .51 2.02 * .47 .47 .27
Highest parental
occupational status 50.86 49.42 -2.44 * 50.88 51.43 .70
Highest educational
level of parents 4.97 4.87 -2.15 * 4.97 4.99 .37
Home educational
resources .12 -.06 -4.42 ** .12 .09 -.53
Wealth .05 -.05 -2.34 * .05 .01 -.79
General interest in
learning science .16 -.07 -5.56 ** .16 .16 .11
Regular lessons in
math 5.35 4.86 -5.02 ** 5.35 5.25 -.77
Self study in math 2.38 1.99 - ** 2.38 2.40 .38
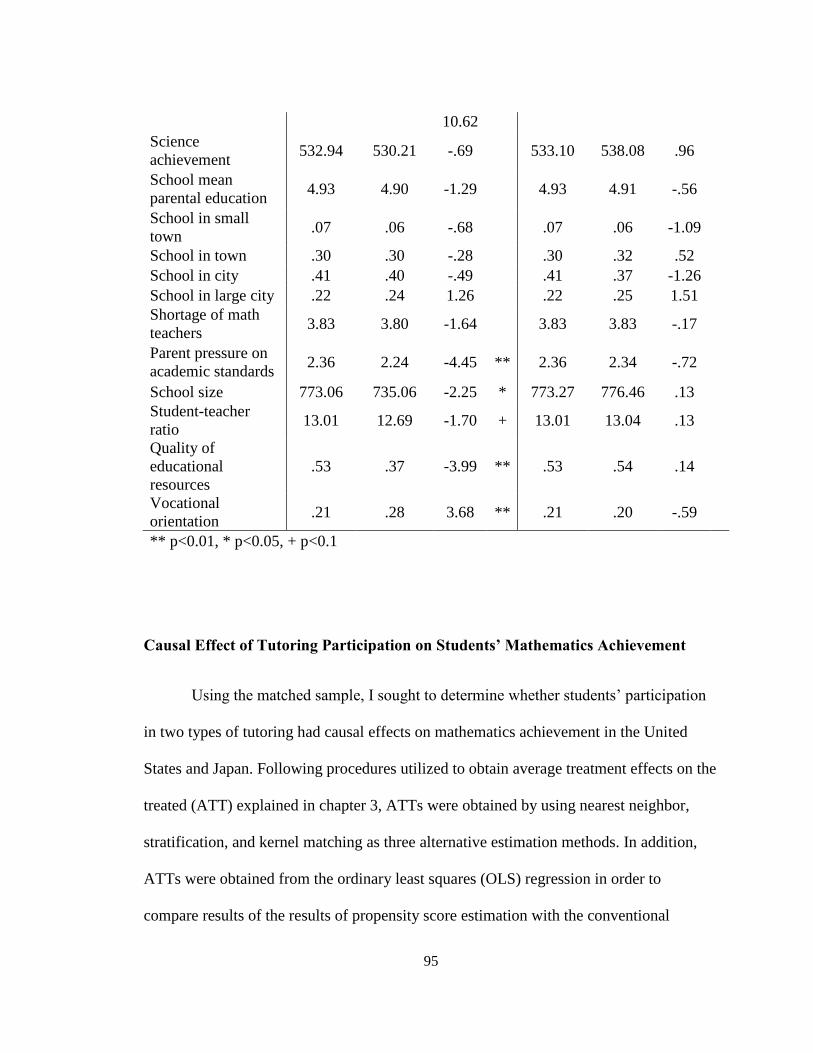
95
10.62
Science
achievement 532.94 530.21 -.69 533.10 538.08 .96
School mean
parental education 4.93 4.90 -1.29 4.93 4.91 -.56
School in small
town .07 .06 -.68 .07 .06 -1.09
School in town .30 .30 -.28 .30 .32 .52
School in city .41 .40 -.49 .41 .37 -1.26
School in large city .22 .24 1.26 .22 .25 1.51
Shortage of math
teachers 3.83 3.80 -1.64 3.83 3.83 -.17
Parent pressure on
academic standards 2.36 2.24 -4.45 ** 2.36 2.34 -.72
School size 773.06 735.06 -2.25 * 773.27 776.46 .13
Student-teacher
ratio 13.01 12.69 -1.70 + 13.01 13.04 .13
Quality of
educational
resources
.53 .37 -3.99 ** .53 .54 .14
Vocational
orientation .21 .28 3.68 ** .21 .20 -.59
** p<0.01, * p<0.05, + p<0.1
Causal Effect of Tutoring Participation on Students’ Mathematics Achievement
Using the matched sample, I sought to determine whether students’ participation
in two types of tutoring had causal effects on mathematics achievement in the United
States and Japan. Following procedures utilized to obtain average treatment effects on the
treated (ATT) explained in chapter 3, ATTs were obtained by using nearest neighbor,
stratification, and kernel matching as three alternative estimation methods. In addition,
ATTs were obtained from the ordinary least squares (OLS) regression in order to
compare results of the results of propensity score estimation with the conventional

96
estimation strategy. Two types of OLS estimates are presented: one using the sample
after imposing common support and the other using the full sample before imposing
common support. Detailed results for the full-sample OLS, including estimates for all
other covariates, are presented and discussed in the Appendix D.
To ensure the sensitivity of these causal effect estimates on the inclusion and
exclusion of science achievement as a covariate, which is used as a proxy for prior
academic achievement, the same sets of analyses using with and without science
achievement are repeated. Within each country, the result without science achievement is
shown first, followed by the result with science achievement.
United States
Table 4.19 shows the estimates of the effect of out-of-school tutoring on math
achievement in the United States, without science achievement included as a covariate.
The ATT obtained using three methods – stratification, kernel, and OLS with and without
common support – are significantly negative and similar in size. Except for the nearest-
neighbor estimates, the rest of the estimates all suggest that the average causal effect of
out-of-school tutoring on math achievement in the United States is negative. That is, out-
of-school tutoring has a detrimental impact on U.S. students’ mathematics achievement.
Note that different numbers of control cases were used with the three matching
methods. Since the nearest-neighbor method used one-to-one match, the same numbers of
control and treated cases were used. Its sample size is about one-seventh of the sample

97
size in the stratification and kernel methods. Compared with a large sample size, a small
sample size tends to inflate the standard error, leading to a smaller t-statistic and
insignificant coefficient. This very fact makes the nearest-neighbor method the most
stringent test.
Table 4.19 Estimates of the Effect of Out-of-school Tutoring on Math Achievement,
United States, without Science Achievement
ATT/OLS S.E. t N treat N control N total
Nearest neighbor -7.130 6.831 -1.040 346 346 692
Stratification -10.516 4.831 -2.177 * 346 3914 4260
Kernel -10.178 4.852 -2.100 * 346 3922 4268
OLS (with support) -10.481 4.361 -2.850 ** 4270
OLS -11.699 4.015 -2.910 ** 4312
Table 4.20 shows the effects of participation in out-of-school tutoring on math
achievement in the United States, with science achievement included as a covariate. The
effects from the two types of OLS remain to be significantly negative. However, the ATT
obtained utilizing nearest neighbor, stratification, and kernel are statistically insignificant,
although their values are largely the same as the OLS methods. It is clear that propensity
score methods are more likely to produce larger standard errors, thus removing statistical
significance which is more likely to be found in the OLS method.
The inclusion of science achievement as a covariate changes both the propensity
score estimates and OLS estimates into a consistently upward direction. When science
achievement is included, the propensity score estimates suggest that out-of-school
tutoring in the U.S. has no overall effect on math achievement, whereas the propensity

98
score estimates indicated the negative effect when science achievement was excluded.
However, OLS results consistently show the negative effect of out-of-school tutoring in
the U.S., regardless of the inclusion of science achievement.
Table 4.20 Estimates of the Effect of Out-of-school Tutoring on Math Achievement,
United States, with Science Achievement
ATT/OLS S.E. t N treat N control N total
Nearest neighbor -2.540 6.681 -.380 347 347 694
Stratification -5.776 4.804 -1.202 346 3924 4270
Kernel -5.449 4.870 -1.120 346 3923 4269
OLS (with support) -5.641 1.996 -2.830 ** 4270
OLS -5.758 2.002 -2.880 ** 4312
Table 4.21 exhibits the estimates of the effect of school tutoring on math
achievement in the United States, without science achievement. Across propensity score
methods and OLS methods, all of the estimates are negative and statistically significant.
This means that when science achievement is not used to predict students’ participation
in tutoring, it shows that the effect of school tutoring is negative in the United States.
Compared to the estimates for out-of-school tutoring in the United States, the sizes of the
effects for school tutoring are much larger in the negative direction.
Table 4.21 Estimates of the Effect of School Tutoring on Math Achievement, United
States, United States, without Science Achievement
ATT/OLS S.E. t N treat N control N total
Nearest neighbor -18.652 5.446 -3.420 ** 644 644 1288
Stratification -21.600 3.733 -5.786 ** 645 3928 4573

99
Kernel -20.639 3.895 -5.300 ** 644 3940 4584
OLS (with support) -21.437 3.320 -6.460 ** 4578
OLS -21.450 3.327 -6.450 ** 4612
After including science achievement (shown in Table 4.22), the ATTs for school
tutoring in the United States obtained via all three propensity score methods are
insignificant. Contrary to the estimates without science achievement, these results with
science achievement show no overall effect of school tutoring on math achievement in
the United States. The values of OLS estimates are relatively close the kernel estimates,
going in the same negative direction. The OLS estimates are also statistically
insignificant. All results suggest the lack of overall effect of school tutoring in the United
States.
Table 4.22 Estimates of the Effect of School Tutoring on Math Achievement, United
States, with Science Achievement
ATT/OLS S.E. t N treat N control N total
Nearest neighbor -1.118 5.400 -.210 646 646 1292
Stratification -4.561 3.339 -1.366 645 3933 4578
Kernel -3.089 3.956 -.780 645 3932 4577
OLS (with support) -2.500 1.583 -1.580 4578
OLS -2.491 1.582 -1.570 4612
Japan
Table 4.23 shows the estimates of the effect of out-of-school tutoring on math
achievement in Japan, without science achievement. The ATT is consistently positive but

100
statistically insignificant, suggesting that there is no overall effect of out-of-school
tutoring in Japan. The effects OLS are also insignificant, supporting the lack of effect of
out-of-schooling in Japan.
Table 4.23 Estimates of the Effect of Out-of-school Tutoring on Math Achievement,
Japan, without Science Achievement
ATT/OLS S.E. t N treat N control N total
Nearest neighbor 1.873 4.603 .407 486 486 972
Stratification .461 3.655 .126 486 3828 4314
Kernel .267 4.219 .060 486 3869 4355
OLS (with support) 1.531 3.543 .430 4350
OLS 2.547 3.620 .700 4888
After controlling for science achievement, shown in Table 4.24, the ATTs
obtained from the propensity score methods are consistently around the value of zero, and
all results are statistically insignificant. The OLS estimates are also statistically
insignificant. Thus, the OLS and propensity score methods, with or without science
achievement, are consistent in showing null effects for out-of-school tutoring in Japan.
Unlike previous results for the United States, the out-of-school tutoring results for Japan
are not sensitive to the inclusion of science achievement..
Table 4.24 Estimates of the Effect of Out-of-school Tutoring on Math Achievement,
Japan, with Science Achievement
ATT/OLS S.E. t N treat N control N total
Nearest neighbor .601 5.595 .110 484 484 968
Stratification .491 3.628 .135 484 3866 4350
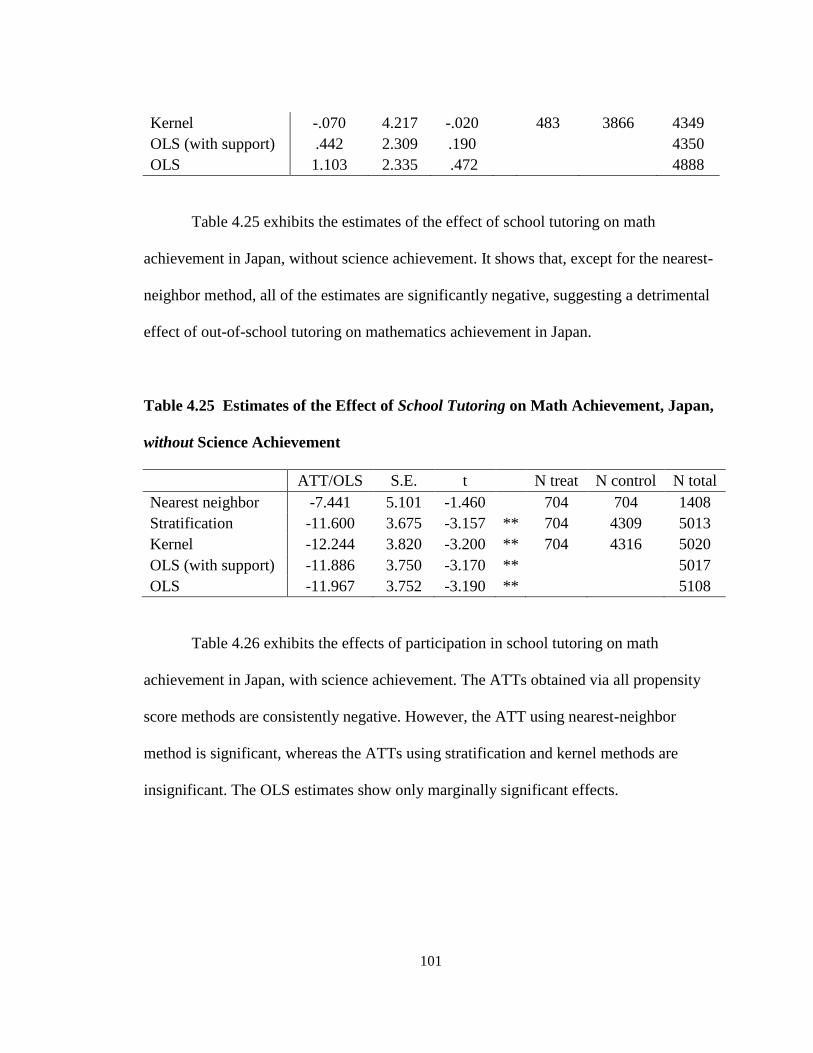
101
Kernel -.070 4.217 -.020 483 3866 4349
OLS (with support) .442 2.309 .190 4350
OLS 1.103 2.335 .472 4888
Table 4.25 exhibits the estimates of the effect of school tutoring on math
achievement in Japan, without science achievement. It shows that, except for the nearest-
neighbor method, all of the estimates are significantly negative, suggesting a detrimental
effect of out-of-school tutoring on mathematics achievement in Japan.
Table 4.25 Estimates of the Effect of School Tutoring on Math Achievement, Japan,
without Science Achievement
ATT/OLS S.E. t N treat N control N total
Nearest neighbor -7.441 5.101 -1.460 704 704 1408
Stratification -11.600 3.675 -3.157 ** 704 4309 5013
Kernel -12.244 3.820 -3.200 ** 704 4316 5020
OLS (with support) -11.886 3.750 -3.170 ** 5017
OLS -11.967 3.752 -3.190 ** 5108
Table 4.26 exhibits the effects of participation in school tutoring on math
achievement in Japan, with science achievement. The ATTs obtained via all propensity
score methods are consistently negative. However, the ATT using nearest-neighbor
method is significant, whereas the ATTs using stratification and kernel methods are
insignificant. The OLS estimates show only marginally significant effects.

102
Table 4.26 Estimates of the Effect of School Tutoring on Math Achievement, Japan,
with Science Achievement
ATT/OLS S.E. t N treat N control N total
Nearest neighbor -12.171 5.309 -2.290 * 706 706 1412
Stratification -4.541 3.866 -1.170 706 4311 5017
Kernel -4.772 3.767 -1.267 704 4311 5015
OLS (with support) -4.040 2.209 -1.830 + 5017
OLS -4.029 2.208 -1.820 + 5108
To summarize, these results generally indicate either negative or the lack of an
overall effect of participation in two types of tutoring on math achievement in these two
countries. When science achievement was included, non of the propensity score estimates
except for the nearest-neighbor estimate in Japan showed any significant effect of
tutoring. When science achievement was included, OLS estimates showed statistically
significant negative effects for out-of-school tutoring in the United States and marginally
significant negative effects for school tutoring in Japan. In general, when science
achievement was included as an additional covariate, the negative estimates were
upwardly adjusted and the positive estimates were downwardly adjusted. The statistical
significance for these estimates after including science achievement tended to disappear
or become weaker.
Heterogeneity of the Causal Effect of Tutoring Participation
These results indicated the lack of an overall effect of participation in either type
of tutoring on math achievement in these two countries. However, these overall results

103
may be masking subgroup differences. Using the nearest neighbor, stratification, and
kernel methods, I examined the heterogeneous effects of tutoring participation on math
achievement according to several student characteristics.
First, heterogeneity by propensity score quintile was reviewed to determine
whether those with greater or less likelihood of participating in tutoring gained more
from attending the lessons. Previous studies on supplemental tutoring in Taiwan
suggested that private math tutoring is more useful to those who are less likely to
undertake it (Kuan, 2011). Therefore, heterogeneity in the causal effect was tested by
propensity score quintile for both types of tutoring in each country.
Second, heterogeneity was examined by parent education level. Previous studies
have suggested that private supplementary tutoring in the U.S. is more effective for
students from high socioeconomic backgrounds (Domingue & Briggs, 2009), whereas
supplementary tutoring that is publicly funded is more effective for at-risk students in the
United States (Lauer et al., 2006). In my study, heterogeneity was tested by whether
parent education level was above college or below high school.
Third, heterogeneity was examined by the extent of home education resources. A
study in Korea suggested that parents’ time and efforts in selecting and monitoring
private tutoring are associated with increased academic performance (Park et al., 2011).
Since home education resources signify the extent of educational resources provided by
parents to their children, I tested whether heterogeneity existed in this measure (above or
below its mean value).

104
Fourth, heterogeneity was examined by students’ motivation to study. Previous
studies have suggested that motivated students, including those who undertaking
challenging academic coursework and those with values and behaviors that facilitate
academic success, are more likely to benefit from supplemental tutoring (Byun & Park,
2012; Domingue & Briggs, 2009). Therefore, heterogeneity was tested by the hours of
students’ self-study (above or below mean value).
Finally, for the United States I examined heterogeneity according to students’
race/ethnicity. Previous studies have suggested that private supplementary tutoring is
particularly effective for East Asian students who tend to be more motivated to study than
other racial/ethnic groups (Byun & Park, 2012). Therefore, I tested whether heterogeneity
existed by students’ race/ethnicity (White, Black, Hispanic, Asian, and others).
Results in Table 4.27 show the heterogeneous effects of participation in two types
of tutoring in the United States. Although I obtained estimates using all three methods, I
only show the estimates using a kernel method, as all three methods showed similar
results and the kernel method was considered the most sophisticated method among the
three. For out-of-school tutoring, it has a significant negative effect for those in the third
quintile, who have an average likelihood of participating in out-of-school tutoring. When
the first to the third quintiles are combined, the result also showed a marginally
significant negative effect for this group. There was no significant heterogeneous effect
by parental education, hours of self-study, and race/ethnicity. However, out-of-school
tutoring had a significantly negative effect on students with fewer home educational
resources.

105
School tutoring had a negative effect for students in the fifth quintile, who are
most likely to receive such tutoring. When the fourth and fifth quintiles were combined to
represent a group with higher propensities to receive tutoring, school tutoring also
showed a negative effect for this group. There was no significant heterogeneous effect by
parental education, home educational resources, and hours of self-study. However, school
tutoring had a significantly negative effect on Asian students and a significantly positive
effect on students of other racial group. For other race/ethnic groups, no significant
heterogeneous effects were found.
Table 4.27 Heterogeneous Effects of Tutoring Participation (Kernel), United States
Out-of-school
Tutoring School Tutoring
ATT t ATT t
Quintile=1 23.41 1.28 8.62 .72
Quintile=2 -21.90 -1.53 2.86 .29
Quintile=3 -25.74 -2.04 * 10.92 1.29
Quintile=4 -5.69 -.58 -7.55 -1.08
Quintile=5 1.04 .14 -10.54 -1.94 *
Quintile<=2 -7.74 -.68 5.25 .69
Quintile>2 -4.98 -.93 -4.82 -1.13
Quintile<=3 -15.72 -1.85 + 8.14 1.42
Quintile>3 -1.13 -.19 -9.45 -2.06 *
College or above -5.83 -.77 -9.62 -1.58
High school or below -5.71 -.97 -.40 -.08
Higher home
educational recourses 3.37 .53 -2.95 -.55
Lower home
educational resources -16.18 -2.29 * -4.35 -.77
More self-study -3.21 -.48 -3.99 -.67

106
Less self-study -2.77 -.40 4.07 .77
Non-hispanic white -12.08 -1.52 -5.97 -1.18
Black -1.49 -.14 -4.08 -.43
Hispanic 11.19 1.01 .74 .09
Asian -8.82 -.43 -47.15 -2.38 *
Other race .61 .03 37.20 2.04 *
** p<0.01, * p<0.05, + p<0.1
Results in Table 4.28 show the heterogeneous effects of participation in two types
of tutoring in Japan. The results show the estimates using a kernel method. For out-of-
school tutoring, there was no significant heterogeneous effect by propensity score quintile,
parental education, home educational resources, and hours of self study. School tutoring
had a significantly negative effect on the students in the first to the third quintiles
combined, suggesting that it has a detrimental effect for those who are less likely to
receive school tutoring.
Table 4.28 Heterogeneous Effects of School Tutoring Participation (Kernel), Japan
Out-of-school
Tutoring School Tutoring
ATT t ATT t
Quintile=1 -3.66 -.16 -24.68 -1.81 +
Quintile=2 -22.98 -1.35 -4.37 -.49
Quintile=3 -2.04 -.24 -13.21 -1.40
Quintile=4 6.50 1.05 8.00 1.15
Quintile=5 -1.05 -.18 -6.71 -.94
Quintile<=2 -15.16 -1.11 -10.45 -1.38
Quintile>2 1.25 .31 -2.94 -.66
Quintile<=3 -6.68 -.86 -11.84 -1.99 *
Quintile>3 1.86 .43 -.13 -.03

107
College or above -.57 -.12 .72 .13
High school or below .40 .05 -7.18 -1.42
Higher home educational
resources -1.33 -.23 -2.84 -.51
Lower home educational
resources -1.02 -.17 -6.31 -1.17
More self study -10.26 -1.64 -3.24 -.48
Less self study 9.06 1.63 -2.98 -.66
** p<0.01, * p<0.05, + p<0.1
These results, including differences between the United States and Japan, are
further discussed in the next chapter.
108
Chapter 5
SUMMARY AND DISCUSSIONS
Supplementary tutoring, also known as shadow education, private tutoring, or out-
of-school tutoring, refers to a range of organized tutoring practices in academic subjects
that occur outside regular school hours. Across societies, many students receive such
services, expecting tutoring lessons to have some positive academic impact.
Depending on the nature of supplementary tutoring, its use may have different
implications for educational equality. When supplementary tutoring is subject to private
demand, meaning that it is privately used by families, more advantaged students may
benefit from it. When supplementary tutoring is provided with public funding, low-
income students may benefit more from it. Therefore, examining the participant
characteristics as well as the causal effect of supplementary tutoring on student
achievement is necessary for understanding supplementary tutoring, either as a source of
educational inequality or as an equalizer of academic achievement.
This study used the 2006 Programme for International Student Assessment
(PISA) and compared between the United States and Japan, two countries with similar
economic development but different patterns of dominant use of supplementary tutoring.
For these two countries, the study addressed the following three questions: (1) What
factors affect students’ participation in supplementary tutoring in the United States and
Japan? (2) What are the effects of supplementary tutoring on students’ mathematics

109
achievement in the two countries? (3) Do the effects differ by student subgroups in each
country?
This study extended previous research on supplementary tutoring by
distinguishing between two types of supplementary tutoring: out-of-school tutoring
(taught by non-school teachers) and school tutoring (taught by school teachers), in order
to identify the different dimensions of the phenomenon. By separating these two types of
tutoring, the study identified specific student characteristics that were associated with
each type of tutoring. While out-of-school tutoring was considered to be used mainly on a
private basis, school tutoring was considered to be used more publicly among all kinds of
students.
In estimating causal effects of supplementary tutoring, selection into participation
in tutoring needed to be addressed. Propensity score matching was one possible solution
to addressing the selection bias, along with other approaches including instrumental
variable method and difference-in-differences method (Morgan & Winship, 2007).
Compared to the ordinary least squares (OLS) method, propensity score matching was
considered as a more effective approach in reducing selection bias. This method
summarized multiple pretreatment characteristics of a subject into a single-dimensional
variable, called the propensity score, in order to make the matching feasible (Becker &
Ichino, 2002).
Propensity score methods were based on a counterfactual framework, which
presupposes two potential outcomes for the same subject; one is an outcome when the
subject receives a treatment and the other is an outcome when the subject is under a

110
control. The heart of this method was to create counterfactual groups that are as similar as
possible to facilitate comparison between the treated and controlled subjects. In this study,
I estimated the Average Treatment effect on the Treated (ATT), which was the difference
in achievement outcome for students who actually received supplementary tutoring and
the potential achievement outcome for the same group of students had they not received
the treatment. Therefore, unlike OLS estimates that applies to the entire population, ATT
focused only on those who are treated.
I compared treated and control cases using propensity scores and removed cases
with no comparable matches at the highest and lowest ends of the propensity score
distribution. I then matched the treated and control cases using three different techniques
to obtain ATT. These matching techniques included pairing subjects (nearest-neighbor
method), classifying subjects into strata (stratification method), and weighting subjects
according to the propensity score distance (kernel method). Through these semi-
parametric matching processes, I claimed that reasonable comparisons were made
between the treated and control cases. The three matching methods had a trade-off
between quality and quantities of the matching, but their joint consideration offered a
way to assess the robustness of the estimates (Becker & Ichino, 2002).
Summary of Main Findings
When participants in supplementary tutoring were compared with non-
participants, low-SES and average-achieving students were more likely to participate in
out-of-school tutoring in math in the United States. Participants in out-of-school tutoring

111
were more likely to be in public schools, tended to be female, and had the average level
of parental occupational status, education level, and wealth. Out-of-school tutored
students in the U.S. had more home education resources, had greater interest in learning
science, and studied by themselves for more hours than those who were not tutored.
Tutored students in the U.S. were more likely to have mothers who are employed, and
their schools tended to be larger and located in a large city. As for race/ethnicity, black
and Asian students were more likely to participate in out-of-school tutoring in the United
States.
On the other hand, in Japan, high-SES and high-achieving students were more
likely to participate in out-of-school tutoring. Participants in out-of-school tutoring were
more likely to be in private schools and they tended to have higher parent occupational
status, education level, wealth, and home education resources. Out-of-school tutored
students in Japan had more interest in learning science and studied by themselves for
more hours. Tutored students in Japan tended to be in schools with a higher level of mean
parent education and higher level of parental pressure on academic subjects. Their
schools tended to be larger and located in cities than in towns, and these schools had
better educational resources and were more academically than vocationally oriented.
For school tutoring, low-SES and low-achieving students were more likely to
participate in these lessons in the United States. Participants in school tutoring were more
likely to be in public schools and tended to have a lower parental occupation. However,
tutored students had better home education resources, had more interest in learning
science, and studied longer by themselves. School-tutored students tended to have lower
112
school math achievement. As for race/ethnicity, tutored students were more likely to be
Black and Hispanic. They were slightly less likely to speak non-native language at home
and tended to be either above or below modal grade. For school characteristics, tutored
students were in schools with lower level of mean parental education and higher level of
students receiving free/reduced lunch. Their school size tended to be slightly larger and
these schools tend to be located in large cities than in small town.
In contrast, slightly high-SES and average-achieving were more likely
participated in school tutoring in Japan. Participants in school tutoring were more likely
to be in private schools and tended to be male. School-tutored students had higher parent
occupation, education, home education resources, and wealth compared to non-tutored
students. Tutored students in Japan tended to have greater interest in learning science and
studied longer by themselves. Their math achievement was slightly lower than their own
school mean achievement. On average, tutored students were in slightly larger schools
and experienced greater parental pressure on academic subjects and better school
resources. Given these participants’ characteristics, out-of-school tutoring in Japan fits
the social reproduction model, while school-tutoring in the United States fits the social
mobility model.
When I examined the effect of out-of-school tutoring in the United States using
propensity score methods, no statistically significant effects were obtained. Similarly, no
statistically significant effects for school tutoring in the United States were obtained.
However, this suggests that selection bias that existed in the negative direction prior to
matching (i.e., low-SES and low-achievement) was removed due to matching. Using the
113
same set of covariates to predict propensity scores, I also estimated the OLS model.
While statistically significant negative effect was obtained for out-of-school tutoring in
the United States, such significant effect disappeared in the propensity score analysis.
When I examined the effect of out-of-school tutoring in Japan using propensity
score methods, no statistically significant effect was obtained. Similarly, no statistically
significant effect for school tutoring in Japan was obtained. However, this suggests that
selection bias that existed in the negative direction prior to matching (i.e., high-SES and
high-achievement) was removed due to matching. Using the same set of covariates to
predict propensity scores, I also estimated the OLS model. The OLS results for both types
of tutoring in Japan were largely consistent with the propensity score results.
In addition, I examined how these overall effects may change according to student
subgroup. Using the nearest neighbor, stratification, and kernel methods, I examined the
heterogeneous effects of tutoring participation on math achievement by the following
characteristics: propensity score quintile, parent education level, extent of home
education resources, students’ motivation to study, and students’ race/ethnicity (U.S.
only). For out-of-school tutoring in the United States, no heterogeneous effects were
found by propensity score quintile, except for the significant negative effect for those in
the third quintile. For school tutoring, while it had a positive effect for students on or
below the third quintile (who are less likely to receive school tutoring), it has a negative
effect for students on or above the fourth quintile (who are most likely to receive school
tutoring). In the United States, there was no significant heterogeneous effect by parental
education and hours of self study on either type of tutoring. Out-of-school tutoring had a

114
weakly negative effect on students with fewer home educational resources. As for
heterogeneity by race/ethnicity, school tutoring had a negative effect on Asian students
and a positive effect on students of other racial group.
In Japan, out-of-school tutoring had a negative effect on students in the second
quintile, who had a relatively low likelihood of receiving tutoring. School tutoring had a
negative effect on the students in the first and second quintiles combined, suggesting that
it had a detrimental effect for those who are less likely to receive school tutoring in Japan.
There was no significant heterogeneous effect by parental education and home
educational resources. Out-of-school tutoring had a positive effect on students who study
less by themselves, suggesting that it may complement the lack of students’ self-learning
habits.
The overall results of this study showed no significant effect of either type of
supplementary tutoring in two countries. Substantively, this suggests that neither type of
tutoring contribute to the disparities in academic outcomes among students. That is, while
I observed inequality in student characteristics in terms of the opportunity to receive
supplementary tutoring, I observed no inequality in academic outcomes in terms of the
consequences of supplementary tutoring11
.
11
Here, it is necessary to note that PISA does not necessarily measure curriculum-based
achievement or test-taking abilities. While TIMSS (Trends in Mathematics and Science
Achievement), the other major international academic achievement test measures curriculum-
based achievement, PISA focuses on how well students are prepared for entering the workforce.

115
Relevance for Theory and Policy
Aside from tutoring used on a private basis, tutoring provided with public funding
should be evaluated on its participant characteristics and the program effects.
Policymakers and practitioners need to be informed of the way supplementary tutoring
operates. This study had a particular emphasis on addressing the selection bias in
students’ participation in tutoring. However, it is necessary to review measures and
mechanisms that possibly explain tutoring participation before the study draws any solid
policy implications.
Previous studies have suggested that program evaluation for out-of-school
academic lessons needs to consider the aspects including measures of program
characteristics, intensity and duration of program use, program quality, and students’
engagement in the program (Lauer et al., 2006; Heinrich et al. 2010). For example, in
order to draw specific policy recommendations, data needs to measure when students
started the program, how often and how long students were in the program, what quality
of lessons students received from what type of teachers, how much students were
engaged, where the lesson took place, and in what format.
Summarizing the literature on out-of-school-time lessons, Lauer and her
colleagues suggested the following (2006, p. 307):
In deciding whether to fund OST [out-of-school-time] programs, policymakers
should look at other factors, such as program duration, cost, and implementation
issues (e.g., staff recruitment, program location).

116
Heinrich, Meyer, and Whitten (2010, p. 295) who examined the effect of
supplementary tutoring program on students’ achievement emphasized that research
needs to get “inside the black box” to better understand why certain supplementary
tutoring programs may or may not be effective. This, in turn, suggests that we need more
theoretical explanations about the possible mechanism of the effect of supplementary
tutoring. Numerous variables and mediating mechanisms may exist; we need elaborate
theories that can be tested with data. For instance, we may ask if tutoring affect
achievement through increased motivation, study skills, social capital, or engagement
with adults or peers in the program.
Gordon, Bridglall, and Moroe (2005) suggested in a book titled Supplementary
education: The hidden curriculum of high academic achievement that school alone
cannot close the achievement gap and that high academic achievement is supported by
“exposure to family and community-based activities and learning experiences that occur
outside of school” (p. 41). The authors argued that supplementary education have the
potential to equalize the uneven distribution of a variety of capitals, including human
capital, cultural capital, and social capital. By providing additional learning opportunities
and empowering students in supplementary tutoring, they believed that students will
achieve better.
In addition, recent policy debate and initiatives on “extended school day” may be
informative for the academic benefit of supplementary tutoring programs. Advocates of
the extended school day indicate that increasing the amount of learning time in formal

117
schooling improves students’ academic outcomes, and supplementary tutoring is part of
such strategies to support learning in formal schools (Omer, 2012; Patall et al., 2010). As
a related concept, some policy initiatives also emphasize “complementary learning,”
which is an effort to align out-of-school supports with school supports and to maximize
the use of resources available for students’ learning and development (Little, 2009; Weiss
et al., 2009).
With adequate data and theory to explain the mechanism and the effect of out-of-
school supplementary lessons, future studies may provide implications for policymakers
and practitioners on how to effectively raise students’ academic achievement, how to
identify a target group of students who needs additional instruction, and whether certain
tutoring programs are achieving their goals to reduce achievement gap between students.
Methodological Issues
Three major methodological issues emerged during the analysis. First, data
balancing procedures in propensity score matching necessarily involves researchers’
arbitrary decisions. This includes the way to identify the common support region. This
study followed the maxima and minima approach (Caliendo & Kopeinig, 2008) as one
conventional approach. However, when I stratified propensity scores into several strata,
there were cases when possible outliers (with no comparable matches) may have
remained. In addition, some previous studies recommend trimming, a more conservative
way to estimate treatment effects by further removing cases at the highest and lowest
ends of the propensity score distribution (Frisco et al, 2007; Zeiser, 2011). Literature

118
suggests removing below the 2nd percentile and above the 98th percentile as one
standard for trimming (Zeiser, 2011). I estimated the results using this trimming method.
The propensity score distribution before and after trimming obtained by the trimmed data
is presented in the Appendix E. Compared to the results without trimming, a greater
number of cases were trimmed both in the treated and control cases, including the treated
cases in the highest propensity score range. I regarded this as a potential problem, as
treated cases with reasonable counterparts (control cases) may have been lost due to
trimming. Despite suggestions in the previous literature, trimming involves arbitrary
standard, which may not universally apply for all types of data. This is why I did not
impose trimming for the present analysis.
As this account shows, propensity score analysis involves steps that require
researchers’ own discretions and justifications based on their data in hand. Regarding
such practical decisions in propensity score analysis, some researchers suggest that “the
choice of method depends on the data situation at hand” (Caliendo and Kopeinig, 2008, p.
47). This applies to a series of data balancing procedures in propensity score matching,
including the common support, trimming, and different matching techniques to obtain
ATT. The beauty of propensity score methods is that they enable to create truly
comparable counterfactual groups by closely examining the data; however, there is “no
one best method” in achieving this condition.
Second, propensity score methods involve an issue in representing population
characteristics. Researchers have repeatedly noted that when a portion of data is
discarded with matching, the data is no longer representative of the population (Glynn et
119
al., 2006; Hoshino, 2009). Although the very process of selecting and matching cases is
the advantage of this method, the concern on the loss of information has been addressed
by many researchers. By referring to the study by Bryson, Dorsett, and Purdon (2002),
Caliendo and Kopeinig (2008, p. 47) advised the following about the discarding of data:
[W]hen the proportion of lost individuals is small, this poses few problems.
However, if the number is too large, there may be concerns whether the estimated
effect on the remaining individuals can be viewed as representative. It may be
instructive to inspect the characteristics of discarded individuals since those can
provide important clues when interpreting the estimated treatment effects.
As an alternative approach to solve this problem, recent studies have shown that
propensity score can be used as weights to obtain a balanced sample of treated and
controlled cases, by retaining all cases in the analysis (Hirano & Imbens, 2002; Hoshino,
2009; Imbens, 2004). Rosenbaum and Rubin (1983) originally proposed matching,
subclassification, and covariate adjustment as three practical applications of propensity
scores in their seminal work. Propensity score weighting is another new approach that
adds to these variations12. Studies suggest that an analysis using inverse propensity score
weights has population-based interpretations (Glynn et al. 2006), meaning that results
may be generalized for the whole population. However, the method can be sensitive to
12
Kernel matching I conducted in this study is based on a similar idea as weighting. For detailed
discussions, see Callahan et al. (2010) and Hoshino (2009).

120
the estimated weights (Glynn et al., 2006). I plan to explore this approach in my future
study.
Third, propensity score methods often face difficulty in meeting its
methodological assumptions. Meeting assumptions is critical in making causal inference.
Previous studies have suggested several different ways to check the strongly ignorable
treatment assignment (i.e., making sure to include all relevant variables, checking the
model fit for estimating propensity scores, and checking covariance balance after
matching), recognizing that there is no direct way to assess whether this assumption has
been sufficiently met (Hoshino, 2009). This in turn suggests that researchers should not
be too dismissive of the conventional ordinary least squares (OLS) method for estimating
causal effects. If OLS is conducted in an appropriate way (i.e., meeting all the
assumptions), the method may be reliable enough in drawing implications for causality,
or at least reinforces the results obtained by other more advanced methods for addressing
selection bias (i.e., propensity score matching). The results in this study suggested that
regarding the effect of tutoring, by and large, the size of the coefficients obtained by OLS
methods were not largely different from the ones obtained by propensity score methods.
The standard errors for OLS methods tended to be smaller, however, partly reflecting the
smaller sample size used in the propensity score methods.
Conducting propensity score matching using cross-sectional data such as PISA
may have methodological limitations. For example, possible inclusion of some treatment
variables (i.e., student motivation), which could have been influenced by the student
achievement outcome, may lead to violate this assumption. To avoid this potential
121
problem, the use of longitudinal data would be recommended. In addition, lack of prior
achievement in estimating the causal effect on academic achievement is a major
weakness of this study. Just as the OLS regression requires, propensity score methods
require that all the variables that predict the outcome to be included in the analysis.
Although the current study used science achievement as a proxy and tested the models
both with and without the proxy, having data with prior achievement would provide more
robust estimates of the effect.
Recommendations for Future Research
Based on the findings and limitations of the current study, I present several
recommendations for future research. To begin with, I identify three issues to obtain
more plausible estimates of the effect of supplementary tutoring. First, treatment variable
must be a valid measure of supplementary tutoring. Although this study established the
distinction between out-of-school tutoring and school tutoring using PISA, future study
should identify the features of supplementary tutoring in a more direct way, so that the
study will be more relevant to policy. Second, a sound theory to predict the mechanism of
the causal effect of tutoring is necessary. Future studies should gain more insights into
the “black box” of the effect of tutoring, such as by adding theoretically-relevant
covariates in the analysis and by using qualitative data to make more substantive
interpretation of the mechanism. Third, future study should use longitudinal data, or at
least cross-sectional data with prior achievement, to identify the causal effect of
supplementary tutoring. With such data, researchers may use propensity score methods as

122
well as other methodological techniques to draw a causal inference, such as difference-in-
differences approach, to obtain more valid estimates of the effect of tutoring.
As for technical issues, I have three future tasks. First, sensitivity analysis should
be used to check whether unobserved variables simultaneously affect assignment to
treatment and the outcome variable, causing a “hidden bias” (DiPrete & Gangl, 2004).
STATA’s “rbounds” (Rosenbaum bounds) command enables to assess this procedure.
Second, ways to obtain robust standard errors for ATT should be examined. For example,
the use of bootstrapping option should be explored to see how such option may change
the estimation standard errors in propensity score matching (Becker & Ichino, 2002).
Third, replicate weights and plausible values, two of the analytical tools in PISA for
adjusting design weights and obtaining plausible achievement estimates, should be used
in the future analysis.
Furthermore, future studies need to address the non-academic benefits of
supplementary tutoring. Although improving students’ academic achievement is the
primary purpose of supplementary tutoring, supplementary tutoring may support non-
cognitive development of students especially when students are younger (i.e., elementary
school students in lower grades). For example, students may gain useful experience by
engaging with adults and peers outside the regular school environment. Supplementary
tutoring may also have a childcare function. Parents may be satisfied that their children
spend time studying under a supervised environment. Although these functions do not
directly relate to improving academic outcomes, these non-cognitive benefits of tutoring
should also be considered in the policy discussion.

123
References
Anderson, J. (2011). Push for A's at Private School Is Keeping Costly Tutors Busy. New
York Times, June 7.
Aronson, J., Zimmerman, J., Carlos, L., & Center, E. (1999). Improving Student
Achievement by Extending School: Is It Just a Matter of Time? West Ed.
Aurini, J. (2006). Crafting Legitimation Projects: An Institutional Analysis of Private
Education Businesses. Sociological Forum, 21(1), 83-111.
Aurini, J. & Davies, S. (2004). The Transformation of Private Tutoring: Education in a
Franchise Form. Canadian Journal of Sociology, 29(3), 419-438.
Baker, D. P., Akiba, M., LeTendre, G. K., & Wiseman, A. W. (2001). Worldwide
Shadow Education: Outside-School Learning, Institutional Quality of Schooling,
and Cross-National Mathematics Achievement. Educational Evaluation and
Policy Analysis, 23(1), 1-17.
Becker, S. O. & Ichino, A. (2002). Estimation of Average Treatment Effects Based on
Propensity Scores. The Stata Journal, 2(4), 358-377.
Bray, M. (1999). The Shadow Education System : Private Tutoring and Its Implications
for Planners (Vol. 61). Paris: UNESCO, International Institute for Educational
Planning.
Bray, M. & Kwok, P. (2003). Demand for Private Supplementary Tutoring: Conceptual
Considerations, and Socio-Economic Patterns in Hong Kong. Economics of
Education Review, 22(6), 611-620.
Bray, M. & Silova, I. (2006). The Private Tutoring Phenomenon: International Patterns
and Perspectives. Education in a Hidden Marketplace: Monitoring of Private
Tutoring. New York: Open Society Institute.
Bray, M. (2003). Adverse Effects of Private Supplementary Tutoring. Paris: UNESCO
International Institute for Educational Planning.
Briggs, D. C. (2001). The Effect of Admissions Test Preparation: Evidence from NELS:
88. Chance, 14(1), 10-21.
Buchmann, C., Condro D. J., & Roscigno, V. J. (2010). Shadow Education, American
Style: Test Preparation, the SAT and College Enrollment. Social forces, 89(2),
435-461.
Byun, S. & Park, H. (2012). The Academic Success of East Asian American Youth.
Sociology of Education, 85(1), 40-60.
Caliendo, M. & Kopeinig, S. (2008). Some Practical Guidance for the Implementation of
Propensity Score Matching. Journal of Economic Surveys. 22 (1), 31-72.
Callahan, R., Wilkinson, L., & Muller, C. (2010). Academic Achievement and Course
Taking among Language Minority Youth in US Schools: Effects of ESL
Placement. Educational Evaluation and Policy Analysis, 32(1), 84-117.
124
Callahan, R., Wilkinson, L., Muller, C., & Frisco, M. (2009). ESL Placement and
Schools: Effects on Immigrant Achievement. Educational Policy, 23(2), 355-384.
Choi, J. (2012). Unequal Access to Shadow Education and Its Impacts on Academic
Outcomes: Evidence from Korea. Paper Presented at the RC28 Conference, Hong
Kong, May 2012.
Cummings, W. K. & Altbach, P. G. (1997). The Challenge of Eastern Asian Education:
Implications for America. New York: State University of New York Press.
Dang, H. A. (2007). The Determinants and Impact of Private Tutoring Classes in
Vietnam. Economics of Education Review, 26(6), 683-698.
Dang, H. & Rogers, F. H. (2008). The Growing Phenomenon of Private Tutoring: Does It
Deepen Human Capital, Widen Inequalities, or Waste Resources? The World
Bank Policy Research Working Paper No. 4530.
Dawson, W. (2010). Private Tutoring and Mass Schooling in East Asia: Reflections of
Inequality in Japan, South Korea, and Cambodia. Asia Pacific Education Review,
11(1), 14-24.
Dehejia, R. H. & Wahba, S. (2002). Propensity Score-Matching Methods for
Nonexperimental Causal Studies. Review of Economics and Statistics, 84(1), 151-
161.
Dierkes, J. (2008). Japanese Shadow Education: The Consequences of School Choice. In
M. Forsey, Scott Davies and Geofferey Walford (Ed.), The Globalization of
School Choice? (pp. 231-248). Oxford: Symposium Books.
Dobbie, W. & Fryer R. G. (2011). Getting Beneath the Veil of Effective Schools:
Evidence from New York City: National Bureau of Economic Research.
Domingue, B. & Briggs, D. C. (2009). Using Linear Regression and Propensity Score
Matching to Estimate the Effect of Coaching on the SAT. Multiple Linear
Regression Viewpoints, 35(1), 12-29.
Dronkers, J. & Robert, P. (2008). Differences in Scholastic Achievement of Public,
Private Government-Dependent, and Private Independent Schools. Educational
Policy, 22(4), 541-577.
Dronkers, J. A. & Avram, S. (2010). A Cross-National Analysis of the Relations of
School Choice and Effectiveness Differences between Private-Dependent and
Public Schools. Educational Research and Evaluation, 16(2), 151-175.
Dynarski, M., James-Burdumy, S., Moore, M., Rosenberg, L., Deke, J., & Mansfield, W.
(2004). When Schools Stay Open Late: The National Evaluation of the 21st
Century Community Learning Centers Program: New Findings. Report submitted
to the US Department of Education, National Center for Education Evaluation
and Regional Assistance. Washington, DC: US Government Printing Office.
Fredricks, J. A., Blumenfeld, P. C., & Paris, A. H. (2004). School Engagement: Potential

125
of the Concept, State of the Evidence. Review of Educational Research, 74(1), 59-
109.
Glenn, R. J., Schneeweiss, S. & Stu¨rmer, T. (2006). Indications for Propensity Scores
and Review of their Use in Pharmacoepidemiology. Basic & Clinical
Pharmacology & Toxicology, 98: 253-259.
Guo, S. Y. & Fraser, M. W. (2010). Propensity Score Analysis: Statistical Methods and
Applications. SAGE Publications.
Gordon, E. W., Bridglall, B. L., & Meroe, A. S. (2005). Supplementary Education: The
Hidden Curriculum of High Academic Achievement. New York: Rowman &
Littlefield Publication Inc.
Harnisch, D. L. (1994). Supplementary Education in Japan: Juku Schooling and Its
Implication. Journal of Curriculum Studies, 26(3), 323-334.
Heinrich, C. J., Meyer, R. H., & Whitten, G. (2010). Supplemental Education Services
under No Child Left Behind. Educational Evaluation and Policy Analysis, 32(2),
273.
Hoshino, T. (2009). Chousa kansatsu deeta no toukei kagaku: Inga suiron, sentaku
baiasu, deeta yuugou [Statistical science in observational data: Causal inference,
selection bias, and data merging]. Iwanami Shoten.
Hynes, K. & Sanders, F. (2010). The Changing Landscape of Afterschool Programs.
Afterschool Matters, 12, 17-27.
Ireson, J. & Rushforth, K. (2004). Private Tutoring: How Prevalent and Effective Is It?
London Review of Education, 2(2), 109-122.
Ireson, J. & Rushforth, K. (2005). Mapping and Evaluating Shadow Education. London:
Institute of Education, University of London.
Jacob, B. A. & Lefgren, L. (2004). Remedial Education and Student Achievement: A
Regression-Discontinuity Analysis. Review of economics and statistics, 86(1),
226-244.
Judson, T. (2010). The Japanese Model. In Why More Students Rely on Tutors: Has High
School Gotten Harder or Are Students Seeking Extra Help to Beat the
Competition? The New York Times, September 26.
http://www.nytimes.com/roomfordebate/2010/09/26/why-more-students-rely-on-
tutors
Katsillis, J. & Rubinson, R. (1990). Cultural Capital, Student Achievement, and
Educational Reproduction: The Case of Greece. American Sociological Review,
55 (2), 270-279.
Komiyama, H. (2000). Juku: Gakkou surimuka jidai wo maeni [Juku at the era of reduced
role of schooling]. Iwanami Shoten.
Kuan, P. Y. (2011). Effects of Cram Schooling on Mathematics Performance: Evidence

126
from Junior High Students in Taiwan. Comparative Education Review, 55(3),
342-368.
Lauer, P. A., Akiba, M., Wilkerson, S. B., Apthorp, H. S., Snow, D., & Martin-Glenn, M.
L. (2006). Out-of-School-Time Programs: A Meta-Analysis of Effects for at-Risk
Students. . Review of Educational Research, 76(2), 275-313.
Lee, C. (2005). Korean Education Fever and Private Tutoring. KEDI Journal of
Educational Policy, 2(1), 99-107.
Lee, J. (2007). Two Worlds of Private Tutoring: The Prevalence and Causes of after-
School Mathematics Tutoring in Korea and the United States. Teachers College
Record, 109(5), 1207-1234.
Lee, S. & Shouse, R. C. (2011). The Impact of Prestige Orientation on Shadow Education
in South Korea. Sociology of Education, 84(3), 212-224.
Leow, C., Marcus, S., Zanutto, E., & Boruch, R. (2004). Effects of Advanced Course-
Taking on Math and Science Achievement: Addressing Selection Bias Using
Propensity Scores. American Journal of Evaluation, 25, 461-478.
Little, R. & Rubin, D. (2002). Statistical Analysis with Missing Data [Second Edition]. .
New Jersey: John Wiley and Sons, Inc.
Monbukagakusho. (2008). Kodomono gakkougai deno gakushu katsudo ni kansuru jittai
chosa houkokusho [A national survey on child’s out-of-school learning activities].
Morgan, S. L. & Winship, C. (2007). Counterfactuals and Causal Inference: Methods
and Principles for Social Science. New York: Cambridge University Press.
Morgan, S. L. (2001). Counterfactuals, Causal Effect Heterogeneity, and the Catholic
School Effect on Learning. Sociology of Education, 74(4), 341-374.
Mori, I. (2008). The political background of private tutoring: A comparison of Japan and
Korea. Paper presented at the 52nd
annual conference of the Comparative and
International Education Society, New York, 17-21 March.
Mori, I. & Baker, D. (2010). The Origin of Universal Shadow Education: What the
Supplemental Education Phenomenon Tells Us About the Postmodern Institution
of Education. Asia Pacific Education Review, 11(1), 36-48.
Muñoz, M. A. & Ross, S. M. (2009). Supplemental Educational Services as a Component
of No Child Left Behind: A Mixed-Method Analysis of Its Impact on Student
Achievement. National Center for the Study of Privatization in Education.
Occasional Paper.
NCTL, National Center on Time and Learning. (2010). The Relationship between Time
and Learning: A Brief Review of the Theoretical Research.
NIRA, National Institute of Research Advancement (Sougou kenkyuu kaihatsu kikou).
(1997). Gakushuu juku kara mita nihon no kyouiku [Japanese education seen from
the cram school’s perspective].

127
OECD, Organisation for Economic Co-operation and Development. (2009). Pisa Data
Analysis Manual: Spss Second Edition.: OECD Publishing.
Park, H., Byun, S., & Kim, K. (2011). Parental Involvement and Students’ Cognitive
Outcomes in Korea. Sociology of Education, 84(1), 3-22.
Patall, E. A., Cooper, H., & Allen, A. B. (2010). Extending the School Day or School
Year. Review of Educational Research, 80(3), 401-436.
Rohlen, T. P. (1980). The Juku Phenomenon: An Exploratory Essay. Journal of Japanese
Studies, 6(2), 207-242.
Ruben, D. B. & Rosenbaum, P. R. (1983). The Central Role of the Propensity Score in
Observational Studies for Causal Effects. Biometrika, 70, 41-55.
Rubin, D. B. (1974). Estimating Causal Effects of Treatments in Randomized and
Nonrandomized Studies. Journal of Educational Psychology; Journal of
Educational Psychology, 66(5), 688-701.
Russell, N. U. (2002). The Role of the Private Sector in Determining National Standards:
How Juku Undermine Japanese Educational Authority. In G. DeCoker (Ed.),
National Standards and School Reform in Japan and the United States (pp. 158-
176). New York: Teachers College Press.
Rutkowski, L. & Rutkowski, D. (2010). Private and Public Education: A Cross-National
Exploration with Timss 2003. National Center for the Study of Privatization in
Education, Research Paper No. 192. Teachers College, Columbia University.
Silova, I. (2010). Private Tutoring in Eastern Europe and Central Asia: Policy Choices
and Implications. Compare: A Journal of Comparative and International
Education, 40(3), 327-344.
Statistics Korea. (2011). http://kostat.go.kr/portal/english/index.action
Steinberg, M. P. (2011). Educational Choice and Student Participation: The Case of the
Supplemental Educational Services Provision in Chicago Public Schools.
Educational Evaluation and Policy Analysis, 33(2), 159-182.
Stevenson, D. L. & Baker, D. P. (1992). Shadow Education and Allocation in Formal
Schooling: Transition to University in Japan. American Journal of Sociology,
97(6), 1639-1657.
Sullivan, P. (2010). As Private Tutoring Booms, Parents Look at the Returns. New York
Times, August 21.
Tansel, A. & Bircan, F. (2006). Demand for Education in Turkey: A Tobit Analysis of
Private Tutoring Expenditures. Economics of Education Review, 25(3), 303-313.
Tokyo Metropolitan Government. (2008). Charenji shien tokubetsu kashituke jigyou nit
suite [Regarding the “challenge support” special loan policy].
http://www.metro.tokyo.jp/INET/OSHIRASE/2008/06/20i6qf03.htm
U.S. Department of Education. (2007). State and Local Implementation of the No Child

128
Left Behind Act: Volume I—Title I School Choice, Supplementary Educational
Services, and Student Achievement: A Report from the National Longitudinal
Study of No Child Left Behind (NLS-NCLB).
U.S. Department of Education. (2009). State and Local Implementation of the No Child
Left Behind Act: Volume Vii—Title I School Choice and Supplementary
Educational Services: Final Report.
Vandenberghe, V. & Robin, S. (2004). Evaluating the Effectiveness of Private Education
across Countries: A Comparison of Methods. Labour Economics, 11(4), 487-506.
Vergari, S. (2007). Federalism and Market-Based Education Policy: The Supplementary
Education Services Mandate. American Journal of Education, 113(2), 311-341.
Weiss, H. B., Little, P. M. D., Bouffard, S. M., Deschenes, S. N., & Malone, H. J. (2009).
The Federal Role in out-of-School Learning: After-School, Summer Learning, and
Family Involvement as Critical Learning Supports. Cambridge: Harvard Family
Research Project.
Willms, J. D. (2003). Student Engagement at School: A Sense of Belonging and
Participation: Results from PISA 2000. OECD.
Winship, C. & Morgan, S. L. (1999). The Estimation of Causal Effects from
Observational Data. Annual Review of Sociology, 25, 659-706.
Yamamoto, Y. & Brinton, M. C. (2010). Cultural Capital in East Asian Educational
Systems. Sociology of Education, 83(1), 67-83.
Yuki, M., Hashisako, K. & Sato, A. (1987). Gakushuu juku: Kodomo, oya, kyoushi wa
dou mite iruka [Juku: How children, parents, and teachers view it]. Gyousei.
Zeiser, K. L. (2011). Examining Racial Differences in the Effect of Popular Sports
Participation on Academic Achievement. Social Science Research, 40(4), 1142-
1169.

129
Appendix A
Measures on Supplementary Tutoring
The following excerpt shows the items from the student questionnaire in PISA
2006. In Q31, it asked the following question: How much time do you typically spend
per week studying mathematics? The time spent attending out-of-school-time lessons
(at school, at home or somewhere else). There were five answer categories in response to
this question: No time, Less than 2 hours, 2-4 hours, 4-6 hours, and 6 or more hours.
In Q32, it asked the following: What type of out-of-school-time lessons do
you attend currently (if any)? These are lessons in subjects that you are learning at
school, that you spend extra time learning outside of normal school hours. The lessons
might be held at your school, at your home or somewhere else. These are only lessons in
subjects that you also learn at school. There were six answer categories to this question:
(a) <One to one> lessons with a <teacher> who is also a teacher at your school
(b) <One to one> lessons with a <teacher> who is not a teacher at your school
(c) Lessons in small groups (less than 8 students) with a <teacher> who is also a
teacher at your school
(d) Lessons in small groups (less than 8 students) with a <teacher> who is not a
teacher at your school
(e) Lessons in larger groups (8 students or more) with a <teacher> who is also a
teacher at your school
(f) Lessons in larger groups (8 students or more) with a <teacher> who is not a
teacher at your school.
130
As it is clear, Q31 identifies out-of-school supplementary tutoring in mathematics,
but does not identify the provider. Q32 identifies the provider (school teacher or non-
school teacher) but does not distinguish subjects of tutoring. Therefore, I combine these
two items to obtain the measure on school & out-of-school supplementary tutoring in
math. If students answered yes to Q31 and chose schoolteachers (a, c, e) as an instructor,
I construct a “school tutoring” dummy. If students answered yes to Q31 and chose non-
schoolteachers (b, d, f), I construct a “non-school tutoring” dummy.

131
Appendix B
Missing Data
Table B1 Percentage of Missing Data for All Variables, United States (N=5611)
% missing
Mathematics achievement 0
Out-of-school tutoring 4.58
School tutoring 4.58
Private-funded school 2.46
Female 0.02
Highest parental occupational status 6.95
Highest educational level of parents 1.09
Home educational resources 0.80
Wealth 0.61
General interest in learning science 1.18
Regular lessons in math 4.38
Self study in math 3.21
Science achievement 0
Mother full-time 3.12
Mother part-time 3.12
Black 1.57
Hispanic 1.57
Asian 1.57
Other race 1.57
Language at home 2.53
Above modal grade 0.04
Below modal grade 0.04
School mean parental education 0
School in town 3.10
School in city 3.10
School in large city 3.10
Shortage of math teachers 2.41
Parent pressure on academic standards 3.05
School size 10.41
Student-teacher ratio 17.29
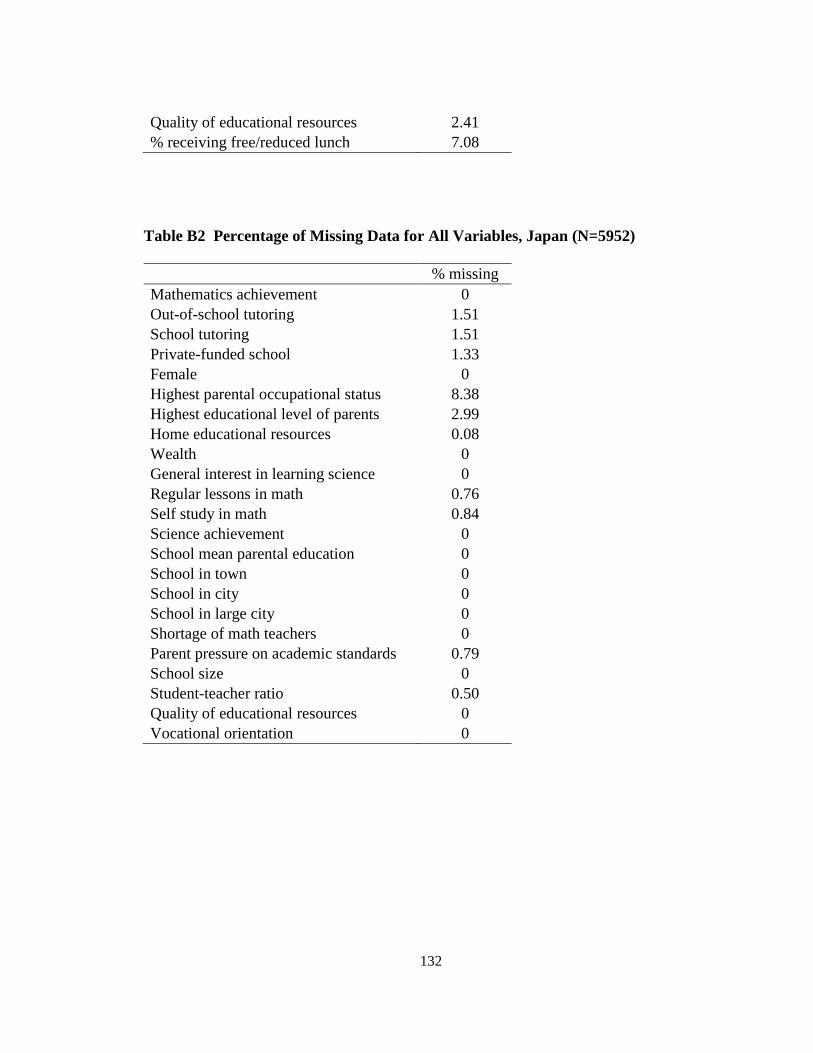
132
Quality of educational resources 2.41
% receiving free/reduced lunch 7.08
Table B2 Percentage of Missing Data for All Variables, Japan (N=5952)
% missing
Mathematics achievement 0
Out-of-school tutoring 1.51
School tutoring 1.51
Private-funded school 1.33
Female 0
Highest parental occupational status 8.38
Highest educational level of parents 2.99
Home educational resources 0.08
Wealth 0
General interest in learning science 0
Regular lessons in math 0.76
Self study in math 0.84
Science achievement 0
School mean parental education 0
School in town 0
School in city 0
School in large city 0
Shortage of math teachers 0
Parent pressure on academic standards 0.79
School size 0
Student-teacher ratio 0.50
Quality of educational resources 0
Vocational orientation 0

133
Appendix C
Correlation Matrix
Table C1 Correlations between All Variables and the Outcome/Treatment
Variables, United States
Mathematics
achievement
Out-of-
school
tutoring
School
tutoring
Mathematics achievement 1.000 .003 -.070
Out-of-school tutoring .003 1.000 -.095
School tutoring -.070 -.095 1.000
Private-funded school .137 -.030 -.029
Female -.072 .039 .020
Highest parental occupational
status .338 .017 -.031
Highest educational level of
parents .312 .023 -.020
Home educational resources .222 .039 .014
Wealth .268 -.013 -.012
General interest in learning
science .095 .048 .057
Regular lessons in math .370 .026 .001
Regular lessons in math,
squared .362 .021 -.011
Self study in math .095 .082 .080
Self study in math, squared .073 .075 .071
Science achievement .893 .019 -.075
Mother full-time .046 .026 -.016
Mother part-time .057 .014 .009
Black -.291 .022 .047
Hispanic -.209 .000 .047
Asian .038 .045 .016
Other race .014 .020 -.019
Language at home .149 -.022 -.038
Above modal grade .113 .009 .028

134
Below modal grade -.309 -.011 .029
School mean parental
education .376 -.009 -.036
School in town .128 .018 .009
School in city .040 .018 .001
School in large city -.142 .053 .024
Shortage of math teachers .087 -.014 -.014
Parent pressure on academic
standards .153 .035 -.039
School size -.038 .062 .019
Student-teacher ratio -.020 .043 .002
Quality of educational
resources .085 .001 .001
% receiving free/reduced
lunch -.393 .015 .032
[Correlations are calculated on an imputed dataset.]
Table C2 Correlations between All Variables and the Outcome/Treatment
Variables, Japan
Mathematics
achievement
Out-of-
school
tutoring
School
tutoring
Mathematics achievement 1.000 .154 -.010
Out-of-school tutoring .154 1.000 -.110
School tutoring -.010 -.110 1.000
Private-funded school -.043 .027 .033
Female -.095 .010 -.021
Highest parental
occupational status .195 .108 .018
Highest educational level
of parents .302 .154 .006
Home educational
resources .148 .074 .046
Wealth .096 .077 .020
General interest in
learning science .292 .057 .059
Regular lessons in math .428 .142 .047
Regular lessons in math,
squared .420 .146 .054
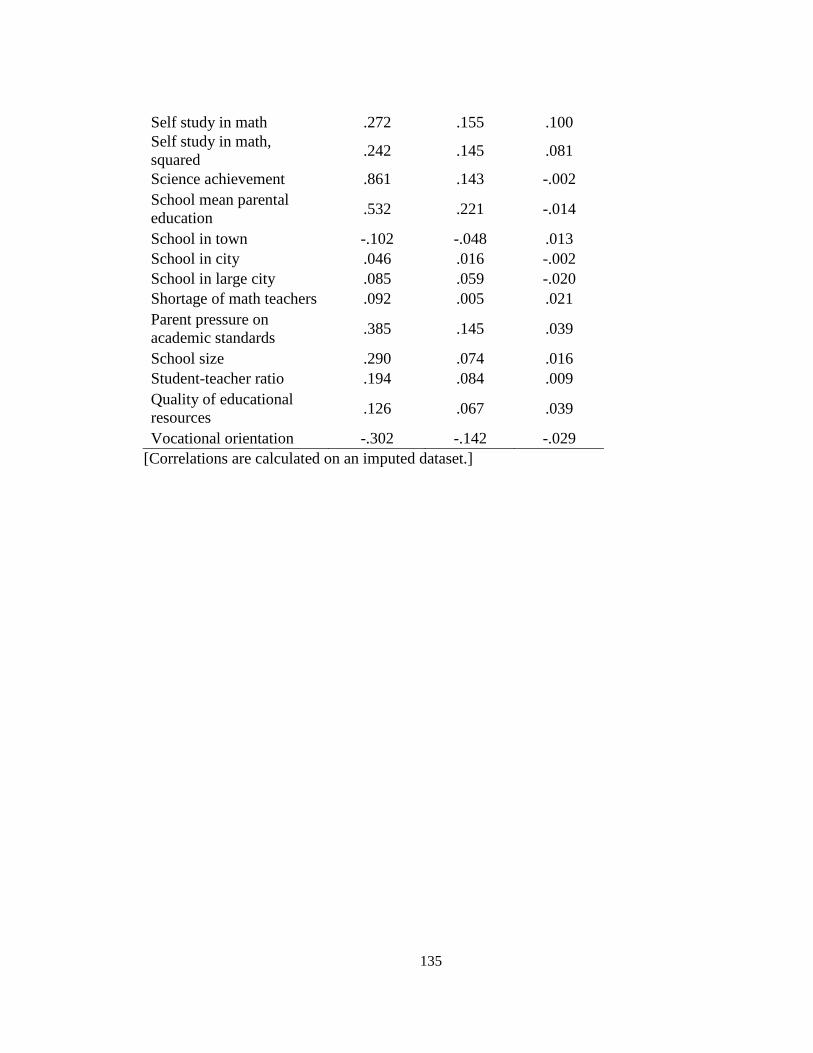
135
Self study in math .272 .155 .100
Self study in math,
squared .242 .145 .081
Science achievement .861 .143 -.002
School mean parental
education .532 .221 -.014
School in town -.102 -.048 .013
School in city .046 .016 -.002
School in large city .085 .059 -.020
Shortage of math teachers .092 .005 .021
Parent pressure on
academic standards .385 .145 .039
School size .290 .074 .016
Student-teacher ratio .194 .084 .009
Quality of educational
resources .126 .067 .039
Vocational orientation -.302 -.142 -.029
[Correlations are calculated on an imputed dataset.]
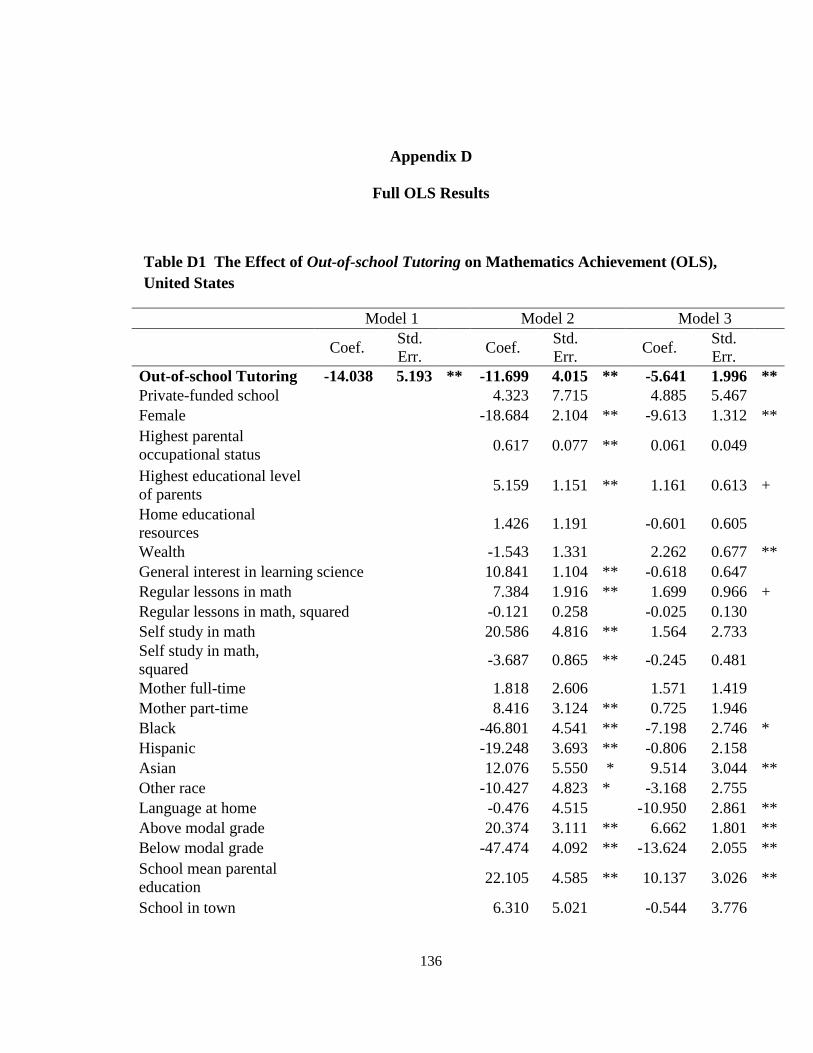
136
Appendix D
Full OLS Results
Table D1 The Effect of Out-of-school Tutoring on Mathematics Achievement (OLS),
United States
Model 1 Model 2 Model 3
Coef. Std.
Err. Coef.
Std.
Err. Coef.
Std.
Err.
Out-of-school Tutoring -14.038 5.193 ** -11.699 4.015 ** -5.641 1.996 **
Private-funded school 4.323 7.715 4.885 5.467
Female -18.684 2.104 ** -9.613 1.312 **
Highest parental
occupational status 0.617 0.077 ** 0.061 0.049
Highest educational level
of parents 5.159 1.151 ** 1.161 0.613 +
Home educational
resources 1.426 1.191 -0.601 0.605
Wealth -1.543 1.331 2.262 0.677 **
General interest in learning science 10.841 1.104 ** -0.618 0.647
Regular lessons in math 7.384 1.916 ** 1.699 0.966 +
Regular lessons in math, squared -0.121 0.258 -0.025 0.130
Self study in math 20.586 4.816 ** 1.564 2.733
Self study in math,
squared -3.687 0.865 ** -0.245 0.481
Mother full-time 1.818 2.606 1.571 1.419
Mother part-time 8.416 3.124 ** 0.725 1.946
Black -46.801 4.541 ** -7.198 2.746 *
Hispanic -19.248 3.693 ** -0.806 2.158
Asian 12.076 5.550 * 9.514 3.044 **
Other race -10.427 4.823 * -3.168 2.755
Language at home -0.476 4.515 -10.950 2.861 **
Above modal grade 20.374 3.111 ** 6.662 1.801 **
Below modal grade -47.474 4.092 ** -13.624 2.055 **
School mean parental
education 22.105 4.585 ** 10.137 3.026 **
School in town 6.310 5.021 -0.544 3.776

137
School in city 1.937 6.124 -3.264 4.099
School in large city 2.316 6.842 -5.003 5.273
Shortage of math teachers 2.435 1.933 3.219 1.355 *
Parent pressure on
academic standards -7.797 3.767 -1.499 2.232
School size -0.002 0.002 0.001 0.002
Student-teacher ratio 0.482 0.447 0.274 0.281
Quality of educational
resources 1.697 1.855 -0.485 1.327
% receiving free/reduced
lunch -0.306 0.103 ** -0.015 0.066
Science achievement 0.689 0.007 **
Constant 489.061 3.698 ** 300.263 23.939 ** 78.081 16.978 **
N 4274 4274 4274
R2 0.002 0.395 0.807
[Model 1 only includes out-of-school tutoring as a covariate. Model 2 includes all covariates except
for science achievement. Model 3 includes all covariates.
Robust standard errors are shown after adjusting for clustering within schools.]
** p<0.01, * p<0.05, + p<0.1
Table D2 The Effect of School Tutoring on Mathematics Achievement (OLS),
United States
Model 1 Model 2 Model 3
Coef. Std.
Err. Coef.
Std.
Err. Coef.
Std.
Err.
School Tutoring -29.576 4.105 ** -21.450 3.327 ** -2.491 1.582
Private-funded school 1.943 7.857 3.314 5.358
Female -18.653 1.960 ** -9.991 1.244 **
Highest parental
occupational status 0.582 0.077 ** 0.041 0.047
Highest educational level
of parents 4.280 1.150 ** 0.957 0.631
Home educational
resources 1.228 1.177 -0.579 0.573
Wealth -0.264 1.274 2.844 0.635 **
General interest in learning science 11.586 1.059 ** -0.192 0.647
Regular lessons in math 7.760 1.868 ** 1.840 0.902 *
Regular lessons in math, squared -0.182 0.254 -0.030 0.124

138
Self study in math 22.853 4.681 ** 2.866 2.592
Self study in math,
squared -4.142 0.837 ** -0.503 0.445
Mother full-time 1.626 2.413 2.017 1.256
Mother part-time 8.713 2.983 ** 0.927 1.844
Black -46.036 4.550 ** -5.515 2.585
Hispanic -20.558 3.645 ** -0.988 2.211
Asian 10.352 6.323 9.891 3.162 **
Other race -6.189 4.985 -2.663 2.795
Language at home 3.144 4.217 -
11.459 2.655 **
Above modal grade 20.289 2.936 ** 6.974 1.667 **
Below modal grade -50.577 3.836 ** -
13.315 2.081 **
School mean parental
education 20.522 4.680 ** 9.599 3.018 **
School in town 6.985 5.107 -0.806 3.711
School in city 2.170 6.095 -4.111 4.040
School in large city 6.558 6.809 -4.150 4.945
Shortage of math teachers 1.368 1.929 3.236 1.315 *
Parent pressure on
academic standards -6.540 3.914 + -2.105 2.283
School size -0.004 0.002 0.001 0.002
Student-teacher ratio 0.450 0.433 0.218 0.268
Quality of educational
resources 0.923 1.874 -0.772 1.295
% receiving free/reduced
lunch -0.312 0.101 ** -0.029 0.068
Science achievement 0.695 0.007 **
Constant 488.509 3.685 ** 311.259 23.182 ** 80.997 16.882 **
N 4612 4612 4612
R2 0.014 0.399 0.810
[Model 1 only includes out-of-school tutoring as a covariate. Model 2 includes all covariates
except for science achievement. Model 3 includes all covariates.
Robust standard errors are shown after adjusting for clustering within schools.]
** p<0.01, * p<0.05, + p<0.1
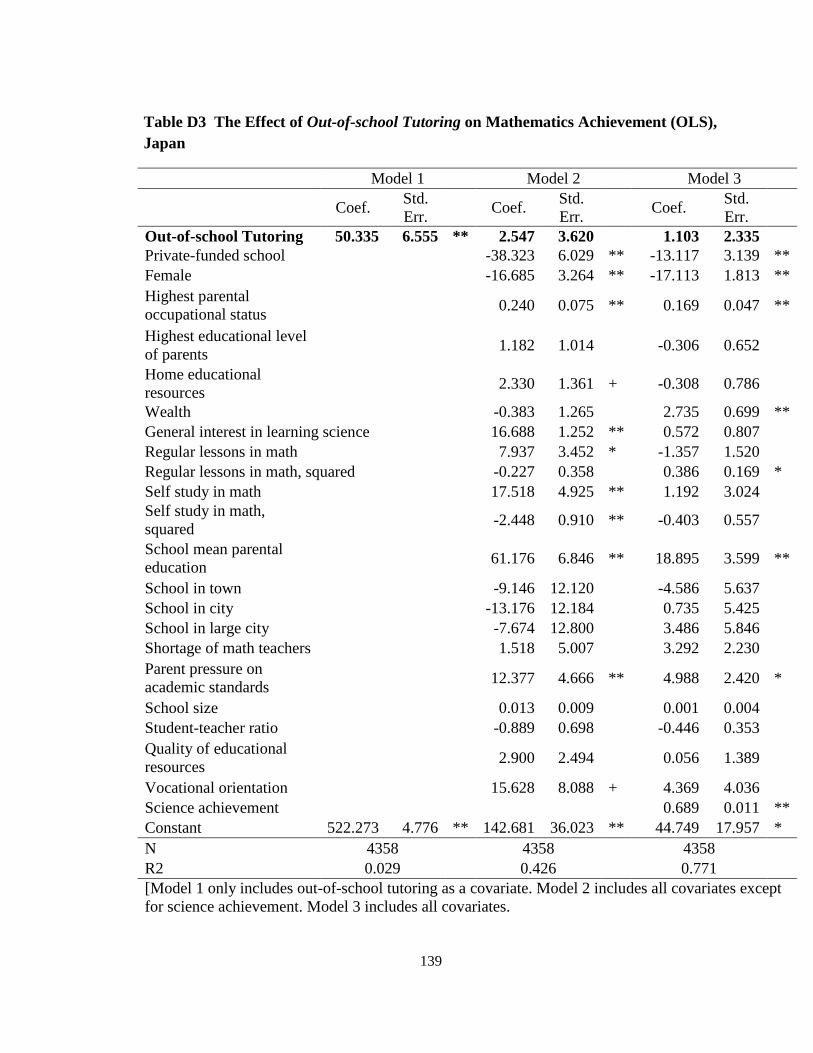
139
Table D3 The Effect of Out-of-school Tutoring on Mathematics Achievement (OLS),
Japan
Model 1 Model 2 Model 3
Coef. Std.
Err. Coef.
Std.
Err. Coef.
Std.
Err.
Out-of-school Tutoring 50.335 6.555 ** 2.547 3.620 1.103 2.335
Private-funded school -38.323 6.029 ** -13.117 3.139 **
Female -16.685 3.264 ** -17.113 1.813 **
Highest parental
occupational status 0.240 0.075 ** 0.169 0.047 **
Highest educational level
of parents 1.182 1.014 -0.306 0.652
Home educational
resources 2.330 1.361 + -0.308 0.786
Wealth -0.383 1.265 2.735 0.699 **
General interest in learning science 16.688 1.252 ** 0.572 0.807
Regular lessons in math 7.937 3.452 * -1.357 1.520
Regular lessons in math, squared -0.227 0.358 0.386 0.169 *
Self study in math 17.518 4.925 ** 1.192 3.024
Self study in math,
squared -2.448 0.910 ** -0.403 0.557
School mean parental
education 61.176 6.846 ** 18.895 3.599 **
School in town -9.146 12.120 -4.586 5.637
School in city -13.176 12.184 0.735 5.425
School in large city -7.674 12.800 3.486 5.846
Shortage of math teachers 1.518 5.007 3.292 2.230
Parent pressure on
academic standards 12.377 4.666 ** 4.988 2.420 *
School size 0.013 0.009 0.001 0.004
Student-teacher ratio -0.889 0.698 -0.446 0.353
Quality of educational
resources 2.900 2.494 0.056 1.389
Vocational orientation 15.628 8.088 + 4.369 4.036
Science achievement 0.689 0.011 **
Constant 522.273 4.776 ** 142.681 36.023 ** 44.749 17.957 *
N 4358 4358 4358
R2 0.029 0.426 0.771
[Model 1 only includes out-of-school tutoring as a covariate. Model 2 includes all covariates except
for science achievement. Model 3 includes all covariates.

140
Robust standard errors are shown after adjusting for clustering within schools.]
** p<0.01, * p<0.05, + p<0.1
Table D4 The Effect of School Tutoring on Mathematics Achievement (OLS), Japan
Model 1 Model 2 Model 3
Coef. Std.
Err. Coef.
Std.
Err. Coef.
Std.
Err.
School Tutoring 0.495 5.973 -11.967 3.752 ** -4.029 2.208 +
Private-funded school -36.992 6.096 ** -12.650 3.105 **
Female -16.378 3.228 ** -16.469 1.760 **
Highest parental
occupational status 0.197 0.073 ** 0.144 0.047 **
Highest educational level
of parents 1.416 0.987 -0.140 0.635
Home educational
resources 2.226 1.315 + -0.511 0.754
Wealth -0.623 1.191 2.742 0.646 **
General interest in learning science 15.932 1.168 ** 0.010 0.741
Regular lessons in math 6.066 3.121 + -1.592 1.306
Regular lessons in math, squared -0.003 0.329 0.428 0.148 **
Self study in math 18.970 4.765 ** 1.893 2.969
Self study in math,
squared -2.447 0.854 ** -0.347 0.534
School mean parental
education 58.667 6.734 ** 16.733 3.497 **
School in town -5.526 11.436 -2.680 5.058
School in city -11.889 11.468 1.708 4.822
School in large city -8.448 12.142 2.626 5.253
Shortage of math teachers 3.001 5.442 3.302 2.330
Parent pressure on
academic standards 12.787 4.685 ** 4.083 2.352
School size 0.017 0.008 * 0.005 0.004
Student-teacher ratio -0.953 0.697 -0.556 0.351
Quality of educational
resources 2.609 2.506 -0.198 1.358
Vocational orientation 12.662 7.844 2.843 3.855
Science achievement 0.693 0.012 **
Constant 522.273 4.776 ** 145.373 35.732 ** 51.708 17.550
**

141
N 5108 5108 5108
R2 0.000 0.412 0.769
[Model 1 only includes out-of-school tutoring as a covariate. Model 2 includes all covariates except
for science achievement. Model 3 includes all covariates.
Robust standard errors are shown after adjusting for clustering within schools.]
** p<0.01, * p<0.05, + p<0.1

142
Appendix E
Propensity Score Distribution with Trimming
Table E1 Summary of Propensity Scores, Out-of-school Tutoring, United States
Treated (Tutored) Control (Non-tutored)
N Mean SD Min Max N Mean SD Min Max
Propensity scores 347 .125 .074 .009 .411 3965 .077 .058 .003 .511
Off common support 42 .060 .146 .003 .511
Trimmed (below 2%) 1 .009 . .009 .009 86 .009 .002 .003 .011
Trimmed (above 2%) 22 .305 .035 .265 .411 64 .317 .051 .263 .511
Table E2 Summary of Propensity Scores, School Tutoring, United States
Treated (Tutored) Control (Non-tutored)
N Mean SD Min Max N Mean SD Min Max
Propensity scores 646 .200 .114 .020 .630 3966 .130 .085 .011 .730
Off common support 34 .057 .163 .011 .730
Trimmed (below 2%) 1 .020 . .020 .020 92 .021 .004 .011 .026
Trimmed (above 2%) 47 .478 .058 .406 .630 46 .476 .068 .401 .730
Table E3 Summary of Propensity Scores, Out-of-school Tutoring, Japan
Treated (Tutored) Control (Non-tutored)
N Mean SD Min Max N Mean SD Min Max
Propensity scores 486 .198 .113 .008 .584 4402 .089 .093 .001 .556
Off common support 536 .005 .002 .001 .008
Trimmed (below 2%) 97 .002 .001 .001 .003
Trimmed (above 2%) 37 .447 .057 .375 .584 61 .416 .039 .373 .556

143
Table E4 Summary of Propensity Scores, School Tutoring, Japan
Treated (Tutored) Control (Non-tutored)
N Mean SD Min Max N Mean SD Min Max
Propensity scores 706 .178 .079 .030 .466 4402 .132 .073 .017 .510
Off common support 91 .030 .051 .017 .510
Trimmed (below 2%) 2 .030 .000 .030 .030 101 .026 .004 .017 .031
Trimmed (above 2%) 32 .372 .037 .330 .466 70 .364 .035 .326 .510

Curriculum Vitae
Izumi Mori
EDUCATION
Ph.D. in Educational Theory and Policy, with a dual-title degree in Comparative and
International Education and a minor in Demography, Pennsylvania State University, 2012.
M.A. in Sociology of Education, University of Tokyo, 2006.
B.A. in English, Sophia University, 2004.
SELECTED PUBLICATIONS
Mori, Izumi. 2012. “The Background and Development of Supplemental Educational
Services in the United States: An Attempt to Decrease Inequality Outside School.”
Comparative Education. No. 45, pp. 115-136 (in Japanese).
Chiu, Ming Ming, Suet-ling Pong, Izumi Mori, and Bonnie Wing-Yin Chow. 2012.
“Immigrant Students’ Emotional and Cognitive Engagement at School: A
Multilevel Analysis of Students in 41 Countries.” Journal of Youth and
Adolescence. Vol. 41 (11), pp. 1409-1425.
Mori, Izumi and David Baker. 2010. “The Origin of Universal Shadow Education: What
the Supplemental Education Phenomenon Tells Us about the Postmodern
Institution of Education.” Asia Pacific Education Review, Vol. 11 (1), pp. 36-48.
Mori, Izumi. 2009. Review of Confronting the Shadow Education System: What
Government Policies for What Private Tutoring? by Mark Bray. In Journal of
Applied Research in Education, Vol. 13, pp. 149-152.
PROFESSIONAL EXPERIENCE
August 2010-May 2011. Research Assistantship for Population Research Institute,
Pennsylvania State University.
August 2009-December 2010. Research Assistantship for Prof. Suet-ling Pong for her
project on Immigrant Students’ Sense of Belongings at School.
STATISTICAL TRAININGS
August 2010. International Database Training, Sponsored by the National Center for
Education Statistics, Washington, D.C.
June 2009. HLM 6 Training Seminar by Douglas Willms, Ochanomizu University, Japan.
GRANTS/ AWARDS
2011 Dissertation Research Initiation Grant, Pennsylvania State University
2009 CIED Summer Research Grant, Pennsylvania State University
2008 Fulbright Foreign Student Program, Institute of International Education