mathematics capstone course the wheels on the bus wheels on the bus.pdf · the wheels on the bus...
TRANSCRIPT

Mathematics Capstone Course
Developed by Dr Agida Manizade amp Dr Laura Jacobsen Radford University MSP project in collaboration with
Mr Michael Bolling Virginia Department of Education
The Wheels on the Bus
I UNIT OVERVIEW amp PURPOSE This unit will allow students to use their knowledge of proportional reasoning specifically scale factor and scale drawing and direct variation to devise an alternate school bus transportation proposal for the high school in our county
II UNIT AUTHOR Thomas Abernethy Jr Lee-Davis High School Hanover County Public Schools Hedy Keller Powhatan High School Powhatan County Public Schools
III COURSE Mathematical Modeling Capstone Course
IV CONTENT STRAND Geometry Measurement Ratios amp Proportions Direct Variation Logic amp Reasoning Statistics
V OBJECTIVES The student will use standard measurement tools in combination with county maps of state-maintained roads and ratios and proportions to determine the distance of existing and proposed bus routes calculate the actual dollar amounts of existing budget allocations calculate the actual cost of existing bus routes and actual cost of proposed bus routes and calculate any savings between existing and proposed bus routes The students will explain and justify their findings and present their proposals in a formal paper and a tri-fold panel
VI MATHEMATICS PERFORMANCE EXPECTATION(s) MPE 1 The student will solve practical problems involving rational numbers (including numbers in scientific notation) percents ratios and proportions MPE 7 Use similar geometric objects in two- or three- dimensions to
a) compare ratios between side lengths perimeters areas and volumes d) solve real-world problems about similar geometric objects
MPE 8 Compare distributions of two or more univariate datasets analyzing center and spread (within group and between group variations) clusters and gaps shapes outliers or other unusual features MPE 9 Design and conduct an experiment survey Key concepts include
d) data collection e) data analysis and recording
MPE 12 The student will transfer between and analyze multiple representations of functions including algebraic formulas graphs tables and words Students will
2 Developed by Dr Agida Manizade amp Dr Laura Jacobsen Radford University MSP project
in collaboration with Mr Michael Bolling Virginia Department of Education
select and use appropriate representations for analysis interpretation and prediction VII CONTENT
Students will use mathematics to collect interpret and analyze data calculate using scale factor from a scale drawing in a manner similar to models such as those found in the fields of computer software technology architecture and logistical planning Students will utilize the computer labs the internet and guest speakers as resources to find real life data
VIII REFERENCERESOURCE MATERIALS County transportation official
Computer labs
County maps of state maintained roads
IX PRIMARY ASSESSMENT STRATEGIES Assessment will be through scoring of studentsrsquo existing transportation cost calculations proposed transportation cost calculations formal proposal paper with proposed savings and a tri-fold panel
X EVALUATION CRITERIA Rubrics for existing cost proposed cost final proposal paper and tri-fold panel are included in each lesson plan The expectation for the final proposal paper and tri-fold panel are also included
XI INSTRUCTIONAL TIME Four 90-minute blocks There is an extended unit component which includes presenting at a math fair andor conducting further research into best time for high schools and amount of sleep needed by high-school aged students
3 Developed by Dr Agida Manizade amp Dr Laura Jacobsen Radford University MSP project
in collaboration with Mr Michael Bolling Virginia Department of Education
Lesson 1 Organize the Chaos
Strand Geometry Ratios amp Proportions Scale Factor (Scale Drawing) Mathematical Objective(s)
Students will solve proportions
Students will perform calculations using a given scale factor in a real life application
Students will convert percentage and calculate dollar amounts
Students will analyze existing transportation costs create research questions and make
preliminary predictions for alternatives to reducing transportation costs
College and Career Ready Mathematics Performance Expectation
MPE 7 Use similar geometric objects in two- or three- dimensions to a) compare ratios between side lengths perimeters areas and volumes d) solve real-world problems about similar geometric objects
RELATED SOL
G14A
NCTM Standards
analyze characteristics and properties of two- and three-dimensional geometric shapes and develop mathematical arguments about geometric relationships
apply appropriate techniques tools and formulas to determine measurements
build new mathematical knowledge through problem solving
solve problems that arise in mathematics and in other contexts
apply and adapt a variety of appropriate strategies to solve problems
monitor and reflect on the process of mathematical problem solving
communicate mathematical thinking coherently and clearly to peers teachers and others
make decisions about units and scales that are appropriate for problem situations involving measurement
4 Developed by Dr Agida Manizade amp Dr Laura Jacobsen Radford University MSP project
in collaboration with Mr Michael Bolling Virginia Department of Education
Additional Objectives for Student Learning
Students will research and analyze existing transportation costs and propose
alternatives to reduce transportation costs
Students will conduct a formal presentation to invited county officials at a math fair
MaterialsResources
Classroom set of calculators
Pie chart showing county allocated educational expenses
Assumption of Prior Knowledge
It is assumed that students have worked with scale factor and solved proportions in
previous math classes
Relevant contexts that are drawn on in relation to this concept include map reading design
and logistics planning
5 Developed by Dr Agida Manizade amp Dr Laura Jacobsen Radford University MSP project
in collaboration with Mr Michael Bolling Virginia Department of Education
Introduction Setting Up the Mathematical Task
Goal of the lesson
ldquoIn this lesson students will practice solving proportions analyze existing transportation costs
collaborate while determining questions that need to be answered and information that needs
to be gathered to generate a proposal and reflect on the current status of a proposalrdquo
Timeline for lesson One 90 minute block
What Who Amount of Time
Warm up Students will complete five
proportions
15 minutes
Introduction discussion
about why students will be
asked to create an alternate
transportation proposal
Whole class 15 minutes
Students will form groups of
two or three or work
individually on the proposal
Students 5 minutes
Collaborate Brainstorm on
what types of information
will be needed to initiate the
project
Students (Individual or
groups of two or three)
15 minutes
Discussion of brainstorming
ideas (Teacher to guide to
necessary topics not
addressed in brainstorming)
ndash Create KWL chart
Students and Teacher 10 minutes
15 minutes
Journal Reflection Students 10 minutes
o Introduction Discussion
Discussion lead-in ldquoOur county faces budget challenges just like any
business or county Many of our buses come to school only partially full
giving the appearance that the current transportation plan is not as cost
efficient as it may be You will be making decisions on how to reduce the
educational transportation costs for our high schoolrdquo (Note If your
county has more than one high school then use maps of state-maintained
roads that feed your school)
6 Developed by Dr Agida Manizade amp Dr Laura Jacobsen Radford University MSP project
in collaboration with Mr Michael Bolling Virginia Department of Education
Display the pie chart of the county allocated educational expenses Have
students calculate the dollar equivalent for each sector If a published pie
chart does not exist then have the students develop one using the
current budget expenditures
Students will focus on the transportation sector and answer the following
questions
How many of you ride the bus to andor from school
How many of you drive to school or have someone drive you to
school
If you ride the bus is your bus full
Are the current busses and routes for our school being used as
efficiently as possible
o Creation of KWL chart (summary of brainstorming session)
K
(What is known)
W
(What we want to learn)
L
(What we did learn)
o Journal Reflection Students will record individually their initial thoughts about
what they think their proposals might be (Students will be referring to these
later)
Strategies for Differentiation
List ideas for addressing needs of a diverse population of students such as o This activity should address the needs of kinesthetic auditory and visual
learners o Adjusting groups to ensure students with processing memory or motor issues
will have their needs met o English language learners (ELLs) ELL students may need additional time to
translate the directions and outcomes
Provide a pie chart for each child with processing or visual challenges
For Next Class
Confirm that a representative from the department of transportation will attend
and have questions ready for himher from brainstorming session
7 Developed by Dr Agida Manizade amp Dr Laura Jacobsen Radford University MSP project
in collaboration with Mr Michael Bolling Virginia Department of Education
o Sample questions How many busses are used for the high school run
How many high school students will a bus hold What is the average cost
of diesel fuel per gallon What is the average miles per gallon for one of
our school busses What is the yearly average cost of bus maintenance
What is an average bus driverrsquos salary What is the average insurance
cost for a bus What are our countyrsquos legal obligations for transporting
students to school on school busses How many gallons of fuel does one
of our bus tanks hold What is the average length of time a student rides
the bus What are the existing bus routes for the high school How
many students are in the high school How many students have
purchased parking passes What is the breakdown of students (ie
number of freshman sophomores juniors seniors) How many students
are planned for on each route
If there is no transportation department representative coming teacher must
have answers to questions from brainstorming session
As an alternative reserve computer lab for students to research answers to their
brainstorming questions
8 Developed by Dr Agida Manizade amp Dr Laura Jacobsen Radford University MSP project
in collaboration with Mr Michael Bolling Virginia Department of Education
Warm up Solve each of the following proportions Show appropriate
work
1 75
w
15
4 2
n
15
10
6
3 8
9
36
p
4 75 ml of olive oil will make 15 entrees If a chef has 300 ml of olive oil how many
entrees can he make
5 Using the following map scale
What is the distance in feet between two random lakes
if they measure 5 inches apart (The actual location of
the lakes is inconsequential rather students will use
the map scale)
Solutions to warm up
1 w = 20 2 n = 25 3 p = 405 4 x = 60 entrees 5 x = 2000 ft
9 Developed by Dr Agida Manizade amp Dr Laura Jacobsen Radford University MSP project
in collaboration with Mr Michael Bolling Virginia Department of Education
Lesson 2 Answers Code and Calculate
______________________________________________________________________
Strand
Geometry - Measurement Ratios amp Proportions (Scale Factor) Direct Variation Statistics
Mathematical Objective(s)
Students will solve proportions
Students will measure using a measuring tool
Students will gather and organize information to their research questions provided by a
guest speaker (or by other means from lesson 1)
Students will perform calculations using a given scale factor in a real life application
specifically the distance of roads using a map key
Students will calculate a variety of daily school bus transportation costs and submit
results for assessment (grading by rubric)
Students will research and analyze existing transportation costs and propose
alternatives to reduce transportation costs
Virginia College and Career Ready Mathematics Performance Expectation(s)
MPE 1 The student will solve practical problems involving rational numbers (including numbers in scientific notation) percents ratios and proportions MPE 7 Use similar geometric objects in two- or three- dimensions to
b) compare ratios between side lengths perimeters areas and volumes d) solve real-world problems about similar geometric objects
MPE 8 Compare distributions of two or more univariate datasets analyzing center and spread (within group and between group variations) clusters and gaps shapes outliers or other unusual features MPE 9 Design and conduct an experiment survey Key concepts include
f) data collection g) data analysis and recording
MPE 12 The student will transfer between and analyze multiple representations of
10 Developed by Dr Agida Manizade amp Dr Laura Jacobsen Radford University MSP project
in collaboration with Mr Michael Bolling Virginia Department of Education
functions including algebraic formulas graphs tables and words Students will select and use appropriate representations for analysis interpretation and prediction Related SOL
A4f A8 AII10 G14A
NCTM Standards
analyze characteristics and properties of two- and three-dimensional geometric shapes and develop mathematical arguments about geometric relationships
apply appropriate techniques tools and formulas to determine measurements
build new mathematical knowledge through problem solving
solve problems that arise in mathematics and in other contexts
apply and adapt a variety of appropriate strategies to solve problems
monitor and reflect on the process of mathematical problem solving
communicate mathematical thinking coherently and clearly to peers teachers and others
use geometric models to gain insights into and answer questions in other areas of mathematics
make decisions about units and scales that are appropriate for problem situations involving measurement
MaterialsResources
County maps displaying all state maintained roads
Highlighters markers crayons etc
Classroom set of rulers
Classroom set of calculators
Representative from the department of transportation for the county
Possible access to personal computers (if no speaker)
Assumption of Prior Knowledge
It is assumed that students have studied similar figures and solved proportions in previous
math classes
It is assumed that students can calculate averages and apply results to reasonable
conclusions in real life applications
Students should be able to use the scale factor of a scale drawing
Related skills that will be needed include map readingdesign and logistics planning
11 Developed by Dr Agida Manizade amp Dr Laura Jacobsen Radford University MSP project
in collaboration with Mr Michael Bolling Virginia Department of Education
Introduction Setting Up the Mathematical Task
Goal of the lesson
ldquoIn this lesson students will be provided with the answers to their research questions
organize and analyze this data calculate the various transportation costs per bus for the high
school and calculate the total transportation cost for the high schoolrdquo
Timeline for lessonmdash Two 90-minute blocks
What Who Amount of Time
Guest speaker will provide answers
to studentsrsquo research questions
Guest speaker 30 minutes
Students will work individually or with chosen groups to code the county maps with existing bus routes (ie color code for each busexisting route)
Students 30 minutes
Groups or individuals will use data to calculate existing transportation costs per bus per day and arrive at a total cost per bus per day
Students 60 minutes (30 minutes into the next day)
Groups or individuals will devise new routes or alternative transportation methods to arrive at a reduction in cost per bus (students will refer to journal writing from lesson 1)
Students 60 minutes
Students will submit their transportation cost calculations for existing bus routes
Students Closure of 2nd
part of lesson 2 (day 3)
12 Developed by Dr Agida Manizade amp Dr Laura Jacobsen Radford University MSP project
in collaboration with Mr Michael Bolling Virginia Department of Education
Assessment of existing transportation calculations
Coding of
existing bus
routes
Mileage distance
calculations
Fuel cost
calculations
Calculation of
Average cost
per day of
Annual Costs
Totals per day
per bus
Grand total
for high
school
4 Legible clearly defined includes a key
Calculations are 93 to 100 accurate
Calculations are
93 to 100
accurate
Calculations are
93 to 100
accurate
Calculations are
93 to 100
accurate
Calculations
are 93 to
100
accurate
3 Legible somewhat defined includes a key
Calculations are 85 to 92 accurate
Calculations are
85 to 92
accurate
Calculations are
85 to 92
accurate
Calculations are
85 to 92
accurate
Calculations
are 85 to
92
accurate
2 Legible somewhat defined no key
Calculations are 77 to 84 accurate
Calculations are
77 to 84
accurate
Calculations are
77 to 84
accurate
Calculations are
77 to 84
accurate
Calculations
are 77 to
84
accurate
1 Legible not clearly defined no key
Calculations are 69 to 76 accurate
Calculations are
69 to 76
accurate
Calculations are
69 to 76
accurate
Calculations are
69 to 76
accurate
Calculations
are 69 to
76
accurate
0 Not legible not clearly defined no key
Calculations are 68 or less accurate
Calculations are
68 or less
accurate
Calculations are
68 or less
accurate
Calculations are
68 or less
accurate
Calculations
are 68 or
less
accurate
Strategies for Differentiation
The various materials will address the needs of a diverse population of students such as
kinesthetic auditory and visual learners
There is an opportunity for peer tutoring
English language learners (ELLs)mdashsome of the vocabulary may take further explanation
All students will have the opportunity to create coding techniques according to their
level of expertise
High-ability students will have the opportunity to move more rapidly into their
proposals for cost reduction
13 Developed by Dr Agida Manizade amp Dr Laura Jacobsen Radford University MSP project
in collaboration with Mr Michael Bolling Virginia Department of Education
Lesson 3 The New Wheels on the Bus
Strand Geometry ndash Measurement Ratios amp Proportions Deductive Reasoning Statistics Mathematical Objective(s)
Students will solve proportions
Students will measure with a measuring tool
Students will perform calculations using a scale factor
Students will formulate an alternative cost reducing measure for high school
transportation costs including logistical planning
College and Career Ready Mathematics Performance Expectation
MPE 1 The student will solve practical problems involving rational numbers (including numbers in scientific notation) percents ratios and proportions
MPE 7 Use similar geometric objects in two- or three- dimensions to
a) compare ratios between side lengths perimeters areas and volumes d) solve real-world problems about similar geometric objects
MPE 8 Compare distributions of two or more univariate datasets analyzing center and spread (within group and between group variations) clusters and gaps shapes outliers or other unusual features MPE 9 Design and conduct an experiment survey Key concepts include
d) data collection e) data analysis and recording
MPE 12 The student will transfer between and analyze multiple representations of functions including algebraic formulas graphs tables and words Students will select and use appropriate representations for analysis interpretation and prediction
RELATED SOL A4F A8 AII10 G14A
14 Developed by Dr Agida Manizade amp Dr Laura Jacobsen Radford University MSP project
in collaboration with Mr Michael Bolling Virginia Department of Education
NCTM Standards
Analyze characteristics and properties of two- and three-dimensional geometric shapes and develop mathematical arguments about geometric relationships
Apply appropriate techniques tools and formulas to determine measurements
Build new mathematical knowledge through problem solving
Solve problems that arise in mathematics and in other contexts
Apply and adapt a variety of appropriate strategies to solve problems
Communicate mathematical thinking coherently and clearly to peers teachers and others
Use geometric models to gain insights into and answer questions in other areas of mathematics
Make decisions about units and scales that are appropriate for problem situations involving measurement
Monitor and reflect on the process of mathematical problem solving
Select and use various types of reasoning and methods of proof
Organize and consolidate their mathematical thinking through communication Recognize and use connections among mathematical ideas
Understand how mathematical ideas interconnect and build on one another to produce a coherent whole
Recognize and apply mathematics in contexts outside of mathematics
Create and use representations to organize record and communicate mathematical ideas
Select apply and translate among mathematical representations to solve problems
Use representations to model and interpret physical social and mathematical phenomena
MaterialsResources
County maps displaying all state maintained roads
Highlighters markers crayons glue scissors etc
Classroom set of rulers
Tri-fold panel boards
Computer lab reserved
Introduction Setting Up the Mathematical Task
Goal of the lesson
ldquoIn this lesson groups or individuals will finalize their cost reduction proposals type
a formal proposal and create a tri-fold panel board with their resulting datardquo
(It is assumed that all students have submitted a science fair project in the past)
15 Developed by Dr Agida Manizade amp Dr Laura Jacobsen Radford University MSP project
in collaboration with Mr Michael Bolling Virginia Department of Education
Time Line for the lesson One 90-minute block
What Who Amount of Time
Revisit KWL Chart begin to fill in ldquoLrdquo column with what we have learned about existing transportation costs
Students and Teacher 5 minutes
Groups or individuals will organize and compile their existing cost calculations and new proposals for cost reduction in paper format to turn in for a grade
Students 55 minutes
Groups or individuals will organize their information onto a tri-fold panel board (similar to a science fair project to be presented to school board members and other county officials at a math fair)
Students 30 minutes
Expectations for Final Proposal Paper and Tri-fold Panel
Paper Format will be double-spaced Times New Roman 12 point font printed front side
only Content will include accurate existing cost of transportation (from KWL chart) accurate
proposed calculations explanation and justification of cost reductions and total savings and
well thought out logistics of the proposal
Tri-fold The tri-fold panel will be designed according to the following picture (titles for
sections may be amended as needed)
16 Developed by Dr Agida Manizade amp Dr Laura Jacobsen Radford University MSP project
in collaboration with Mr Michael Bolling Virginia Department of Education
Assessment
Rubric for Tri-Fold Panel
Excellent ndash 4
points
Good ndash 3 points Average ndash 2
points
Poor ndash 1 point 0 points
Neat organized all elements included eye-catching
Neat organized all elements included
Partially neat partially organized 1 element missing
Lacking neatness and organization more than one element missing
Group or student chose not to participate
Rubric for proposed transportation calculations
Coding of
existing bus
routes
Mileage distance
calculations
Fuel cost
calculations
Calculation of
Average cost
per day of
Annual Costs
Totals per day
per bus
Grand total
for high
school
4 Legible clearly defined includes a key
Calculations are 93 to 100 accurate
Calculations are
93 to 100
accurate
Calculations are
93 to 100
accurate
Calculations are
93 to 100
accurate
Calculations
are 93 to
100
accurate
3 Legible somewhat defined includes a key
Calculations are 85 to 92 accurate
Calculations are
85 to 92
accurate
Calculations are
85 to 92
accurate
Calculations are
85 to 92
accurate
Calculations
are 85 to
92
accurate
2 Legible somewhat defined no key
Calculations are 77 to 84 accurate
Calculations are
77 to 84
accurate
Calculations are
77 to 84
accurate
Calculations are
77 to 84
accurate
Calculations
are 77 to
84
accurate
1 Legible not clearly defined no key
Calculations are 69 to 76 accurate
Calculations are
69 to 76
accurate
Calculations are
69 to 76
accurate
Calculations are
69 to 76
accurate
Calculations
are 69 to
76
accurate
0 Not legible not clearly defined no key
Calculations are 68 or less accurate
Calculations are
68 or less
accurate
Calculations are
68 or less
accurate
Calculations are
68 or less
accurate
Calculations
are 68 or
less
accurate
17 Developed by Dr Agida Manizade amp Dr Laura Jacobsen Radford University MSP project
in collaboration with Mr Michael Bolling Virginia Department of Education
Rubric for Final Proposal Paper
Format of Paper Existing Cost of
Transportation
(from column L on
KWL chart)
Cost of
Proposed
Transportation
(to be graded on
separate rubic)
Explanation
and
Justification of
Cost Reduction
and Total
Savings
Logistics for
Proposal
4 Double-Spaced Times New Roman 12-Font Printed on Front Only
Calculations are accurate
Included Clearly
articulated and
justified
Thorough and
well thought
out
3 Clearly
articulated but
not fully
justified
1 concern not
addressed
2 Weak
articulation
but fully
justified
2 concerns not
addressed
1 Weak
articulation
weak justified
3 concerns not
addressed
0 Instructed Format Not Followed
Inaccurate Not included Weak to little
articulation
andor
justification
More than 3
concerns not
addressed
major concerns
with logic
Extensions for this Unit
Students can present their final proposal paper and tri-fold panel in a math fair Education
officials (school board administrators superintendent department of transportation) will be
invited to attend and judge the entries
Local news officials may be invited to the math fair
The top three entries may present their proposals to the school board for a real life cost
reduction experience
18 Developed by Dr Agida Manizade amp Dr Laura Jacobsen Radford University MSP project
in collaboration with Mr Michael Bolling Virginia Department of Education
Students may conduct further research into best times for high-school students and how much
sleep is required by high-school aged students
Students may find the constant of proportionality knowing that the total miles traveled varies
directly with the number of gallons of gas and use this information to make predictions about
future bus routes
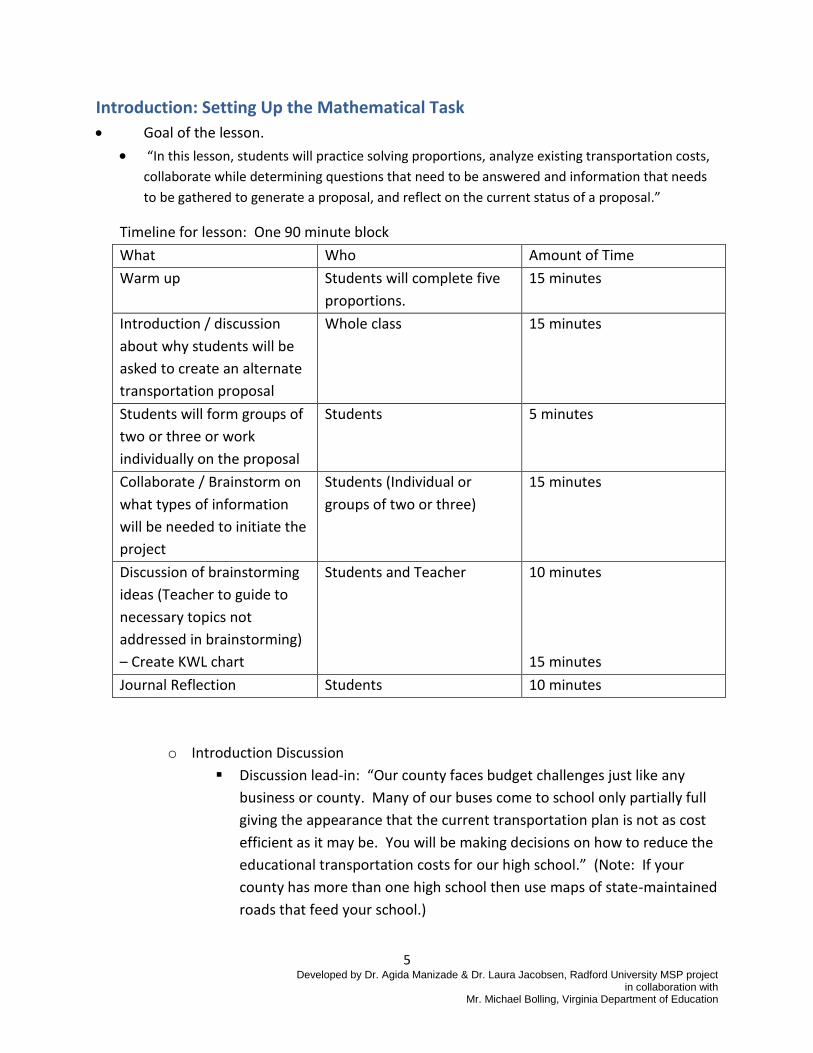
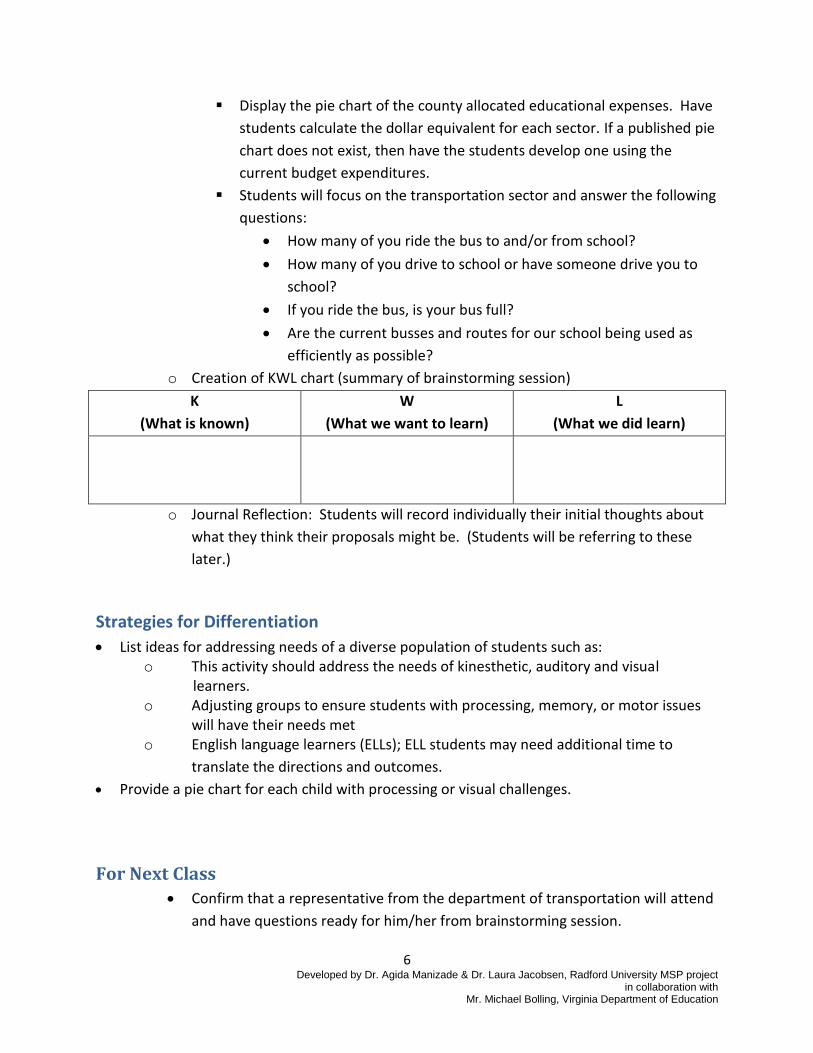