mathematics for public and occupational health professionals
TRANSCRIPT

Mathematics for Public and Occupational Health Professionals


Mathematics for Public and OccupationalHealth Professionals
RYERSON UNIVERSITY
TORONTO

Mathematics for Public and Occupational Health Professionals by Ian Young is licensed under a Creative CommonsAttribution-ShareAlike 4.0 International License, except where otherwise noted.
Please see the Acknowledgement Section of the book for the OER sources used in creating this book.
This book was produced with Pressbooks (https://pressbooks.com) and rendered with Prince.

Contents
Introduction 1
Acknowledgements 2
Chapter 1: Algebra Review
1.1. Introduction to Algebra 5
1.2. Equations 13
1.3. Measurement Systems 25
1.4. Ratios, Rates, and Percent 32
1.5. Exponents and Scientific Notation 40
1.6. Practice question answers 49
Chapter 2: Linear Equations and Graphs
2.1. Graphing a Linear Equation 55
2.2. Slope of a Line 63
2.3. Equation of a Line 71
2.4. Applications 80
2.5. Practice question answers 92
Chapter 3: Introduction to Functions
3.1. Introduction to Functions 99
3.2. Domain and Range 110
3.3. Rates of Change and Behaviour of Graphs 121
3.4. Quadratic Functions 130
3.5. Practice question answers 139

Chapter 4: Exponential and Logarithmic Functions
4.1. Exponential Functions 145
4.2. Logarithmic Functions 161
4.3. Exponential and Logarithmic Models 174
4.4. Practice question answers 181
Chapter 5: Sets and Counting
5.1. Set Theory and Venn Diagrams 185
5.2. Multiplication Axiom 195
5.3. Permutations 204
5.4. Combinations 216
5.5. Practice question answers 228
Chapter 6: Probability - Part 1
6.1. Sample Spaces and Probability 233
6.2. Mutually Exclusive Events and the Addition Rule 241
6.3. Probability Using Tree Diagrams and Combinations 250
6.4. Conditional Probability 259
6.5. Independent Events 267
6.6. Practice question answers 276
Chapter 7: Probability - Part 2
7.1. Binomial Probability 281
7.2. Bayes' Formula 289
7.3. Expected Value and Tree Diagrams 297
7.4. Markov Chains 307
7.5. Practice question answers 317

This textbook was created to support the study of key mathematical concepts and skills amongfuture occupational and public health professionals. Specifically, it contains material adapted frommultiple existing resources on college- and university-level mathematics. The primary intendeduse of the textbook is for the course POH103 “Data Management” at Ryerson University, but itcould be used or adapted to other settings.
The material is designed for first-year undergraduate occupational and public health studentswith different backgrounds in mathematics. The material is intended to prepare students for moreadvanced quantitative courses in biostatistics, epidemiology, and risk assessment, among others.
Introduction | 1

Acknowledgements
This book was created for the Ryerson course POH103, Data Management by Ian Young. It hasbeen adapted from the following three OER texts as follows and organized to reflect the contenttaught in this course:
Wang, M. (2018) Key Concepts of Intermediate Level Math. Victoria, B.C.: BCcampus.Adapted content from Units 2, 4-7, 9, and 11.This text is licensed under a Creative Commons Attribution license.
Sekhon, R. (2011). Applied Finite Mathematics. Houston, TX: OpenStaxAdapted content from Chapters 1, 11, 13, 15, and 17 (section 1-3).This text is licensed under a Creative Commons Attribution license.
Lippman, D. (2016). Business Precalculus.Adapted content from Chapter 1 (pp. 1-22, 24-26), 4 (pp. 153-163), and 5.This text is licensed under a Creative Commons Attribution-Share Alike 3.0 United States License.
Content was adapted for Pressbooks by CareerBoost Digital Publication Assistant, AngelicaChimal, Ryerson BSc student, with the support of the Ryerson University Library DigitalPublication Team.
Cover image photo by Samuel Zeller on Unsplash
2 | Acknowledgements

CHAPTER 1: ALGEBRA REVIEW
Chapter 1: Algebra Review | 3


1.1. Introduction to Algebra
Introduction
Review of basic algebraic terms:
Algebraic term Description Example
Algebraic expressionA mathematical phrase that containsnumbers, variables (letters), and arithmeticoperations (+, – , ×, ÷, etc.).
3x – 45a2 – b + 3
12y3 + 7y2 – 5y +
Constant A number on its own. 2y + 5 constant: 5
Coefficient The number in front of a variable. -9x2 coefficient: -9x coefficient: 1
(x = 1 · x)
Term
A term can be a constant, a variable, or theproduct of a number and variable. (Termsare separated by a plus or minus sign.)
2x3 + 7x2 – 9y – 8Terms: 2x3, 7x2, – 9y, –8
Like terms The terms that have the same variables andexponents (differ only in their coefficients).
2x and -7x-4y2 and 9y2
0.5pq2 and pq2
Polynomial: an algebraic expression that contains one or more terms.
1.1. Introduction to Algebra | 5

Example: 7x , 5ax – 9b , 6x2 – 5x + , 7a2 + 8b + ab – 5
There are special names for polynomials that have one, two, or three terms:
• Monomial: an algebraic expression that contains only one term.
Example: 9x , 4xy2 , 0.8mn2 , a2b
• Binomial: an algebraic expression that contains two terms.
Example: 7x + 9 , 9t2 – 2t , 0.3y +
• Trinomial: an algebraic expression that contains three terms.
Example: ax2 + bx + c , – 4qp2 + 3q + 5
Combining Terms
Like terms: terms that have the same variables and exponents (the coefficients can be different).
Examples:
6 | 1.1. Introduction to Algebra

Example Like or unlike terms
7y and -9y Like terms
6a2, -32a2, and –a2 Like terms
0.3 x2y and -48x2y Like terms
u2v3 and u2v3 Like terms
-8y and 78x Unlike terms
6m3 and -9m2 Unlike terms
-9u3w2 and -9w3u2 Unlike terms
Combine like terms: add or subtract their coefficients and keep the same variables andexponents.
Note: unlike terms cannot be combined.
Example 1.1.1
1) 3a + 7b – 9a + 15b = (3a – 9a) + (7b + 15b) Regroup like terms.
= -6a + 22b Combine like terms.
2) 2y2 – 4x + 3x – 5y2 = (2y2 – 5y2) + (-4x + 3x) Regroup like terms.
= -3y2 – 1x Combine like terms.
= -3y2 – x
3) 8xy2 – x2y + 4x2y – 6xy2
= 8xy2 – x2y + 4x2y – 6xy2 Or underline like terms without regrouping.
= 2xy2 + 3x2y Combine like terms.
4) 2(2m + 3n) + 3(m – 4n) = 4m + 6n + 3m – 12n Distributive property.
= 7m – 6n Combine like terms.
1.1. Introduction to Algebra | 7

Removing Parentheses
If the sign preceding the parentheses is positive (+), do not change the sign of terms inside theparentheses, just remove the parentheses.
Example: (x – 5) = x – 5
If the sign preceding the parentheses is negative (-), remove the parentheses and the negativesign (in front of parentheses), and change the sign of each term inside the parentheses.
Example: – (x – 7) = –x + 7
Remove parentheses:
Algebraic expression Remove parentheses Example
(ax + b) ax + b (5x + 2) = 5x + 2
(ax – b) ax – b (9y – 4) = 9y – 4
– (ax + b) -ax – b – ( x + 7) = – x – 7
– (ax – b) -ax + b – (0.5b – 2.4) = -0.5b + 2.4
Example 1.1.2
1) 9x2 + 7 – (2x2 – 2) = 9x2 + 7 – 2x2 + 2 Remove parentheses.
= 7x2 + 9 Combine like terms.
8 | 1.1. Introduction to Algebra
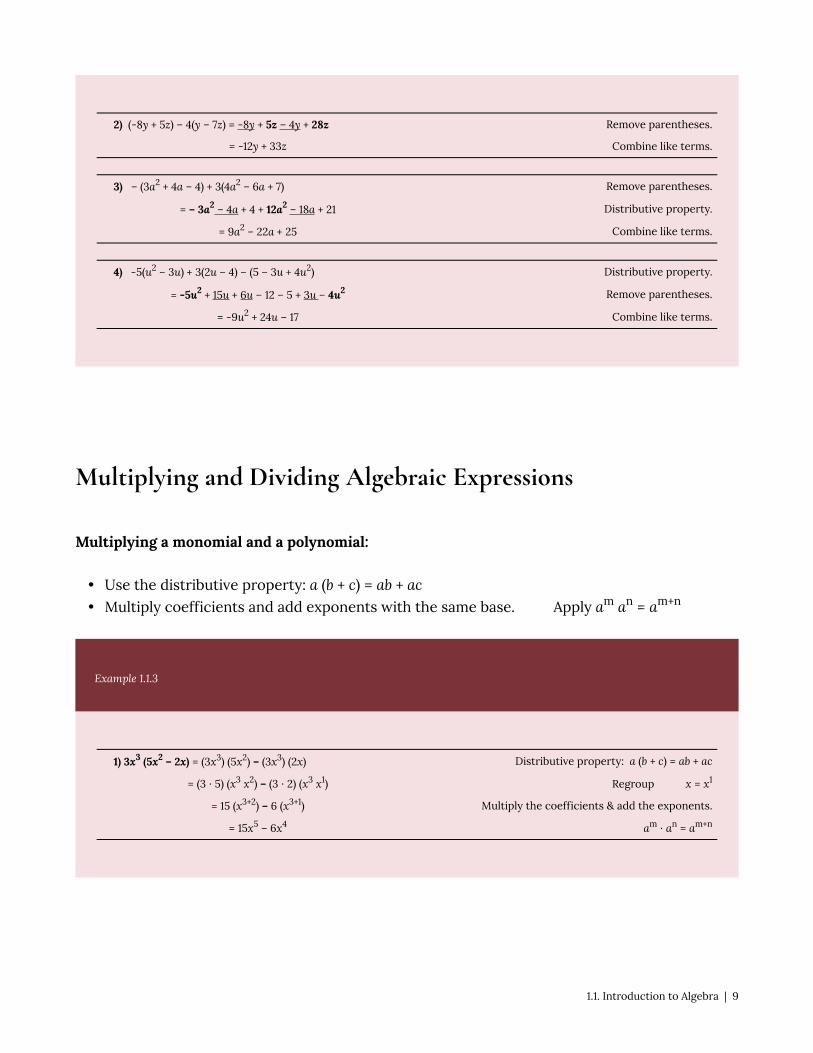
2) (-8y + 5z) – 4(y – 7z) = -8y + 5z – 4y + 28z Remove parentheses.
= -12y + 33z Combine like terms.
3) – (3a2 + 4a – 4) + 3(4a2 – 6a + 7) Remove parentheses.
= – 3a2 – 4a + 4 + 12a2 – 18a + 21 Distributive property.
= 9a2 – 22a + 25 Combine like terms.
4) -5(u2 – 3u) + 3(2u – 4) – (5 – 3u + 4u2) Distributive property.
= -5u2 + 15u + 6u – 12 – 5 + 3u – 4u2 Remove parentheses.
= -9u2 + 24u – 17 Combine like terms.
Multiplying and Dividing Algebraic Expressions
Multiplying a monomial and a polynomial:
• Use the distributive property: a (b + c) = ab + ac• Multiply coefficients and add exponents with the same base. Apply am an = am+n
Example 1.1.3
1) 3x3 (5x2 – 2x) = (3x3) (5x2) – (3x3) (2x) Distributive property: a (b + c) = ab + ac
= (3 ∙ 5) (x3 x2) – (3 ∙ 2) (x3 x1) Regroup x = x1
= 15 (x3+2) – 6 (x3+1) Multiply the coefficients & add the exponents.
= 15x5 – 6x4 am ∙ an = am+n
1.1. Introduction to Algebra | 9

2) 5ab2 (2a2b +ab2 – a) Distribute.
= (5ab2) (2a2b) + (5ab2) (ab2) + (5ab2) (-a) Multiply the coefficients and add exponents.
= (5 ∙ 2) (a1+2 b2+1) + (5a1+1 b2+2) – (5a1+1b2) b = b1 , a = a1
= 10a3b3 + 5a2b4 – 5a2b2 am ∙ an = am+n
Dividing a polynomial by a monomial:
• Split the polynomial into several parts.
• Divide a monomial by a monomial. Apply .
Example 1.1.4
Steps Solution
• Split the polynomial into three parts:
• Divide a monomial by a monomial:
The FOIL method: an easy way to find the product of two binomials(two terms).
(a + b) (c + d) = ac + ad + bc + bdF O I L Example
10 | 1.1. Introduction to Algebra

F – First terms first term × first term (a + b) (c + d) (x + 5) (x + 4)
O – Outer terms outside term × outside term (a + b) (c + d) (x + 5) (x + 4)
I – Inner terms inside term × inside term (a + b) (c + d) (x + 5) (x + 4)
L – Last terms last term × last term (a + b) (c + d) (x + 5) (x + 4)
FOIL method Example
(a + b) (c + d) = ac + ad + bc + bd (x + 5) (x + 4) = x ∙ x + x ∙ 4 + 5x + 5 ∙ 4 = x2 + 9x + 20
F O I L F O I L
Multiplying binomials (2 terms × 2 terms):
Example 1.1.5
1)
F O I L
The FOIL method.
an am = an+ m
Combine like terms.
2) FOIL
an am = an+m
Combine like terms.
1.1. Introduction to Algebra | 11
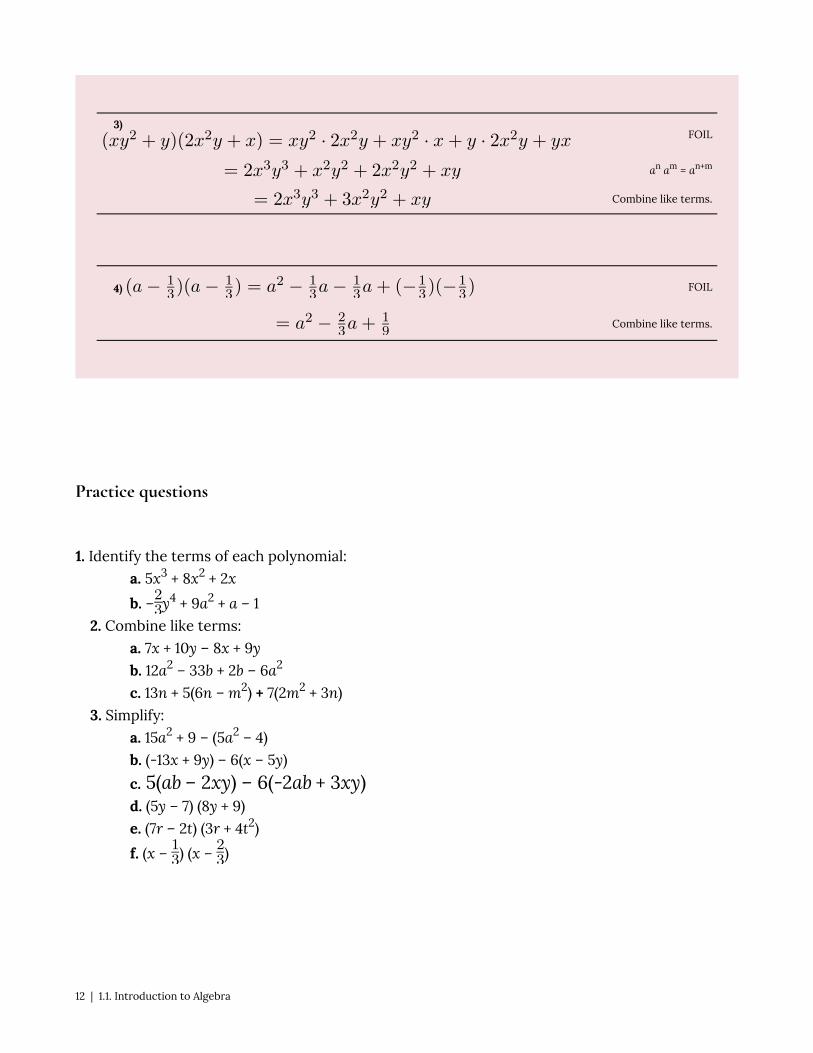
3)FOIL
an am = an+m
Combine like terms.
4) FOIL
Combine like terms.
Practice questions
1. Identify the terms of each polynomial:
a. 5x3 + 8x2 + 2x
b. – y4 + 9a2 + a – 1
2. Combine like terms:
a. 7x + 10y – 8x + 9yb. 12a2 – 33b + 2b – 6a2
c. 13n + 5(6n – m2) + 7(2m2 + 3n)
3. Simplify:
a. 15a2 + 9 – (5a2 – 4)
b. (-13x + 9y) – 6(x – 5y)
c. 5(ab – 2xy) – 6(-2ab + 3xy)d. (5y – 7) (8y + 9)
e. (7r – 2t) (3r + 4t2)
f. (x – ) (x – )
12 | 1.1. Introduction to Algebra
1.2. Equations
Equations
Equation: a mathematical sentence that contains two expressions and is separated by an equalsign (both sides of the equation have the same value).
Example: 4 + 3 = 7, 9x – 4 = 5, 2y – = y
To solve an equation we find a particular value for the variable in the equation that makes theequation true (left side = right side).
Example: For the equation x + 4 = 5
only x = 1 can make it true, since 1 + 4 = 5 (Left side = Right side)
Solution of an equation: the value of the variable in the equation that makes the equation true.
Example: For the equation x + 4 = 5, x = 1 is the solution.
Example 1.2.1
Indicate whether each of the given number is a solution to the given equation.
1.2. Equations | 13
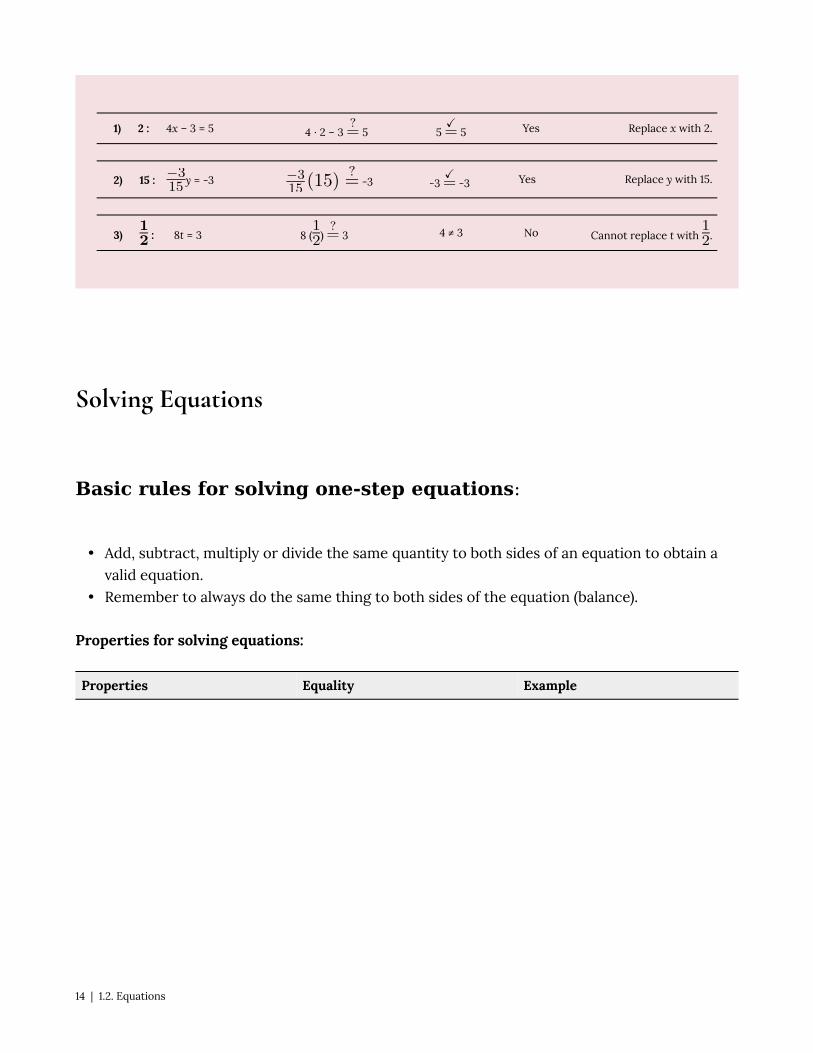
1) 2 : 4x – 3 = 5 4 ∙ 2 – 3 5 5 5 Yes Replace x with 2.
2) 15 : y = -3 -3 -3 -3 Yes Replace y with 15.
3) : 8t = 3 8 ( ) 3 4 ≠ 3 No Cannot replace t with .
Solving Equations
Basic rules for solving one-step equations:
• Add, subtract, multiply or divide the same quantity to both sides of an equation to obtain avalid equation.
• Remember to always do the same thing to both sides of the equation (balance).
Properties for solving equations:
Properties Equality Example
14 | 1.2. Equations

Addition property of equality A = B A + C = B + CSolve
x = 9
Subtraction property of equality A = B A – C = B – CSolve
y = -13
Multiplication property ofequality A = B A · C = B · C
Solve
m = 18
Division property of equality A = B (C ≠ 0)
Solve
n = –5
Example 1.2.2
Solve the following equations.
1) Property of addition.
Check: Replace x with 14.
2) Property of subtraction.
3) Property of multiplication.
1.2. Equations | 15

4) Property of division.
Multi-step equation: an equation that requires more than one step to solve it.
Procedure for solving multi-step equations:
• Clear the fractions or decimals if necessary.
• Simplify and remove parentheses if necessary.
• Combine like terms on each side of the equation.
• Collect the variable terms on one side of the equation and the constants on the other side.
• Isolate the variable (to get the variable alone on one side of the equation).
• Check the solution with the original equation.
Steps Example
16 | 1.2. Equations

Solve
• Eliminate the denominatorsif the equation has fractions. Multiply each term by 5.
• Remove parentheses.
• Combine like terms.
• Collect variable terms onone side and the constantson the other side.
Subtract 10 from both sides.
Subtract 6y from both sides.
• Isolate the variable.
Divide both sides by -5.
• Check with the originalequation.
Replace y with 2.
Multiply each term by 5.
LS = RS (correct)
Equations involving decimals: Multiply every term of both sides of the equation by a multipleof 10 (10, 100, 1000, etc.) to clear the decimals (based on the number with the largest number ofdecimal places in the equation).
Steps Example
1.2. Equations | 17

Solve
• Multiply each term by 100to clear the decimal
The largest number ofdecimal place is two.
• Collect the variable termson one side of the equationand the constants on theother side.
Add 12 to both sides.Add 426x to both sides.
• Isolate the variable.
Example 1.2.3
Solve 0.4y + 0.08 = 0.016 The largest number of decimal place is three.
1000(0.4y) + 1000(0.08) = 1000(0.016) Multiply each term by 1000.
400y + 80 = 16 Combine like terms.
400y = -64 Divide both sides by 400.
y = – 0.16
Equations involving fractions:
Steps Example
18 | 1.2. Equations

Solve
• Multiply each term by thelowest commondenominator (LCD).
• Collect the variable termson one side of the equationand the constants on theother side.
Add 6t to both sides.Subtract 9 from both
sides.
• Isolate the variable. Divide both sides by 10.
Word Problems
Identifying keywords:
• When trying to figure out the correct operation ( + , – , × , ÷ , etc.) in a word problem it isimportant to pay attention to keywords (clues to what the problem is asking).
• Identifying keywords and pulling out relevant information that appear in the word problemare effective ways for solving mathematical word problems.
Key or clue words in word problems:
Addition (+) Subtraction (–) Multiplication (×) Division (÷) Equals to (=)
1.2. Equations | 19

add subtract times divided by equals
sum (of) difference product quotient is
plus take away multiplied by over was
total (of) minus double split up are
altogether less (than) twice fit into were
increased by decreased by triple per amounts to
gain (of) loss (of) of each totals
combined (amount) left how much (total) goes into results in
in all savings how many as much as the same as
greater than withdraw out of gives
complete reduced by ratio/rate yields
together fewer (than) percent
more (than) how much more share
additional how long average
Example 1.2.4
1) Edward drove from Prince George to Williams Lake (235 km), then to Cache Creek (203 km) and finally to
Vancouver (390 km). How many kilometres in total did Edward drive?
235km + 203 km + 390 km = 828 km The key word: total (+)
2) Emma had $150 in her purse on Friday. She bought a pizza for $15, and a pair of shoes for $35. How much
money does she have left?
$150 – 15 – 35 = $100 The key word: left (–)
3) Lucy received $950 per month of rent from Mark for the months September to November. How muchrent in total did she receive?
$950 3 = $2850 The key word: how much total (×)
4) Julia is going to buy a $7500 used car from her uncle. She promises to pay $500 per month. In how many
months can she pay it off?
$7500 ÷ $500 = 15 month The key word: per (÷)
20 | 1.2. Equations

Steps for solving word problems:
– Organize the facts given from the problem (create a table or diagram if it will make the problemclearer)
– Identify and label the unknown quantity (let x = unknown).– Convert words into mathematical symbols, and determine the operation – write an equation
(looking for ‘key’ or ‘clue’ words).– Estimate and solve the equation and find the solution(s).– Check and state the answer. (Check the solution to the equation and check it back into the
problem – is it logical?)
Example 1.2.5
William bought 5 pairs of socks for $4.35 each. The cashier charged him an additional $2.15 in sales tax. He
left the store with a measly $5.15. How much money did William start with?
• Organize the facts (make a table):
5 socks $4.35 each
Sales tax $2.15
Money left $5.15
• Determine the unknown: How much did William start with? (x = ?)• Convert words into math symbols, and determine the operation (find keywords):
• The total cost without the sales tax: $4.35 × 5
• With an additional $2.15 sales tax: ($4.35 × 5) + $2.15
• Estimate and solve the unknown: x = [($4.35 × 5) + $2.15] + $5.15
• Estimate and solve the unknown:
1.2. Equations | 21

• Estimate: x = [($4 × 5) + $2] + $5
= $27
• Actual solution: x = [($4.35 × 5) + $2.15] + $5.15
= $29.05
• Check: If William started with $29.05, and subtract 5 socks for $4.35 each and sales tax in $2.15 to see if
it equals $5.15.
$29.05 – [($4.35 × 5) + $2.15] $5.15
$29.05 – $23.9 $5.15 Correct!
More examples:
Example 1.2.6
James had 96 toys. He sold 13 on first day, 32 on second day, 21 on third day, 14 on fourth day and 7 on the last
day. What percentage of the toys were not sold?
• Organize the facts:
James had 96 toys
The total number of toyssold 13 + 32 + 21 + 14 + 7
The toys not sold 96 – the total number of toys sold
22 | 1.2. Equations

• Determine the unknown: Let x = percentage of the toys were not sold
• The total number of toys sold: 13 + 32 + 21 + 14 + 7 = 87
• The toys not sold: 96 – 87 = 9
• Percentage of the toys were not sold: x = = 0.094 =
9.4%
Example 1.2.7
The 60-litre gas tank in Robert’s car is 1/2 full. Kelowna is about 390 km from Vancouver and his car averages
7 litres per 100 km. Can Robert make his trip to Vancouver?
• Let x = litres of fuel are required to get to Vancouver.
• The 60-litre gas tank in Robert’s car is 1/2 full:
60 L × = 30 L Robert has 30 litres gas in his car.
• Robert’s car averages 7 litres per 100 km, and Vancouver is about 390 km from Kelowna.
Proportion:
(x)(100km) = (7 L) (390 km) Cross multiply and solve for x.
x = = 27.3 L Robert needs 27.3 litres gas to get to Vancouver.
• 30L > 27.3L. Therefore, yes, Robert can make his trip.
1.2. Equations | 23

Practice questions
1. Solve the following equations:
a. x – 7 = 12
b. y + =
c. =
d. 14t + 5 = 8
e. 7(x – 3) + 3x – 5 = 2(5 – 4x)
f. (y + 12) = 4y – yg. 0.5t + 0.05 = 0.025
h.2. Write an expression for each of the following:
a. Susan has $375 in her checking account. If she makes a deposit of y dollars, how muchin total will she have in her account?
b. Mark weighs 175 pounds. If he loses y pounds, how much will he weigh?
c. A piece of wire 45 metres long was cut in two pieces and one piece is w metres long.How long is the other piece?
d. Emily made 4 dozen muffins. If it cost her x dollars, what was her cost per dozenmuffins? What was her cost per muffin?
24 | 1.2. Equations

1.3. Measurement Systems
Measurement Systems
Metric system (SI – international system of units): the most widely used system of measurementin the world. It is based on the basic units of meter, kilogram, second, etc.
SI common units:
Quantity Unit Unit symbol
Length meter m
Mass (or weight) gram kg
Volume litre L
Time second s
Temperature degree (Celsius) °C
Metric prefixes (SI prefixes): large and small numbers are made by adding SI prefixes, which isbased on multiples of 10.
Metric conversion table:
Prefix Symbol(abbreviation) Power of 10 Multiple value Example
mega M 106 1,000,000 1 Mm = 1,000,000 m
kilo- k 103 1,000 1 km = 1,000 m
hecto- h 102 100 1 hm = 100 m
deka- da 101 10 1 dam = 10 m
meter/gram/litre 1
deci- d 10-1 0.1 1 m = 10 dm
centi- c 10-2 0.01 1 m = 100 cm
milli- m 10-3 0.001 1 m = 1,000 mm
micro µ 10-6 0.000 001 1 m = 1,000,000 µm
1.3. Measurement Systems | 25

Metric prefix for length, weight and volume:
Prefix Length (m –meter)
Weight (g –gram)
Liquidvolume (L
– litre)
mega(M)
Mm(Megameter)
Mg(Megagram)
ML(Megalitre)
kilo (k) km(Kilometer)
kg(Kilogram)
kL(Kilolitre)
hecto(h)
hm(hectometer)
hg(hectogram)
hL(hectolitre)
deka(da)
dam(dekameter)
dag(dekagram)
daL(dekalitre)
meter/gram/litre
m(meter) g (gram) L (litre)
deci (d) dm(decimeter)
dg(decigram)
dL(decilitre)
centi(c)
cm(centimeter)
cg(centigram)
cL(centilitre)
milli(m)
mm(millimeter)
mg(milligram)
mL(millilitre)
micro(µ)
µm(micrometer)
µg(microgram)
µL(microlitre)
Steps for metric conversion:
• Identify the number of places to move the decimal point.
– Convert a smaller unit to a larger unit: move the decimal point to the left.
– Convert a larger unit to a smaller unit: move the decimal point to the right.
Example 1.3.1
326 mm = (?) m
• Identify mm (millimeters) and m (meters) on the conversion table.
Count places from mm to m: 3 places left
26 | 1.3. Measurement Systems

• Move 3 decimal places. (1 m = 1000 mm)
Convert a smaller unit (mm) to a larger (m) unit: move the decimal point to the left.
326. mm = 0.326 m Move the decimal point three places to the left (326 = 326.).
Example 1.3.2
4.675 hg = (?) g
• Identify hg (hectograms) and g (grams) on the conversion table.
Count places from hg to g: 2 places right
• Move 2 decimal places. (1 hg = 100 g)
Convert a larger unit (hg) to a smaller (g) unit: move the decimal point to the right.
4.765 hg = 476.5 g Move the decimal point two places to the right.
1.3. Measurement Systems | 27

The Unit Factor Method
Convert units using the unit factor method (or the factor-label method)
• Write the original term as a fraction (over 1).
Example: 10g can be written as
• Write the conversion formula as a fraction or .
Example: 1m = 100 cm can be written as or
• Put the desired or unknown unit on the top.
• Multiply the original term by or . (Cancel out the same units).
Example 1.3.3
1200 g = (?) kg
• Write the original term (the left side) as a fraction:
• Write the conversion formula as a fraction. 1 kg = 1000 g:
• “kg” is the desired unit.
• Multiply: The units “g” cancel out.
28 | 1.3. Measurement Systems

Example 1.3.4
30 cm = (?) mm
• Write the original term (the left side) as a fraction:
• Write the conversion formula as a fraction. 1 cm = 10 mm:
“mm” is the desired unit.
• Multiply: The units “cm” cancel out.
Adding and subtracting SI measurements:
Example 1.3.5
Combine after converting to the same unit.
3 m 3000 mm 1 m = 1,000 mm
– 2000 mm ——–> – 2000 mm
1000 mm
25 kg 25000 g 1 kg = 1000 g
+ 4 g ——–> + 4 g
25004 g
1.3. Measurement Systems | 29

The Relationship between mL, g and cm3
How are mL, g, and cm3 related?
• A cube takes up 1 cm3 of space (1 cm × 1 cm × 1 cm = 1cm3).• A cube holds 1 mL of water and has a mass of 1 gram at 4°C.• 1 cm3 = 1 mL = 1 g
Example 1.3.6
Convert.
1) 16cm3 = ( ? ) g
16cm3 = 16 g 1 cm3 = 1 g
2) 9 L = ( ? ) cm3
9 L = 9000 mL 1 L = 1,000 mL
= 9000 cm3 1 mL = 1 cm3
3) 35 cm3 = (?) cL
35cm3 = 35 mL 1 cm3 = 1 mL
= 3.5 cL move 1 decimal place left.
4) 450 kg = (?) L
450 kg = 450,000 g 1 kg = 1,000 g
= 450,000 mL 1 g = 1 mL
= 450 L 1 L = 1,000 mL
30 | 1.3. Measurement Systems

Example 1.3.7
A swimming pool that measures 10 m by 8 m by 2 m. How many kilolitres of water
will it hold?
V = w l h = (8m) (10m) (2m) = 160 m3 160 m3 = ( ? ) kL
160m3 = 160,000,000 cm3 1 m = 100 cm, 3 × 2 = 6, move 6 places right for volume.
160,000,000 cm3 = 160,000,000 mL 1 mL = 1 cm3
160,000,000 mL = 160 kL 1 kL = 1,000,000 mL
160 m3 = 160 kL The swimming pool will hold 160 kL of water.
Practice questions
1. Convert each of the following measurements:
a. 439 mm = ( ? ) m
b. 3 mL = ( ? ) kL
c. 7230 g = ( ? ) kg
d. 52 cm = ( ? ) mm
3. Combine:
a. 7 m – 3000 mm = ( ? ) mm
b. 63 kg + 6 g = ( ? ) g
4. Complete:a. 38 cm3 = ( ) g
b. 5 L = ( ) cm3
c. 18 L of water has a volume of ___________ cm3 .
d. A water tank measures 45 cm by 35 cm by 25 cm. How many kilolitres of water will ithold?
1.3. Measurement Systems | 31
1.4. Ratios, Rates, and Percent
Ratios and Rates
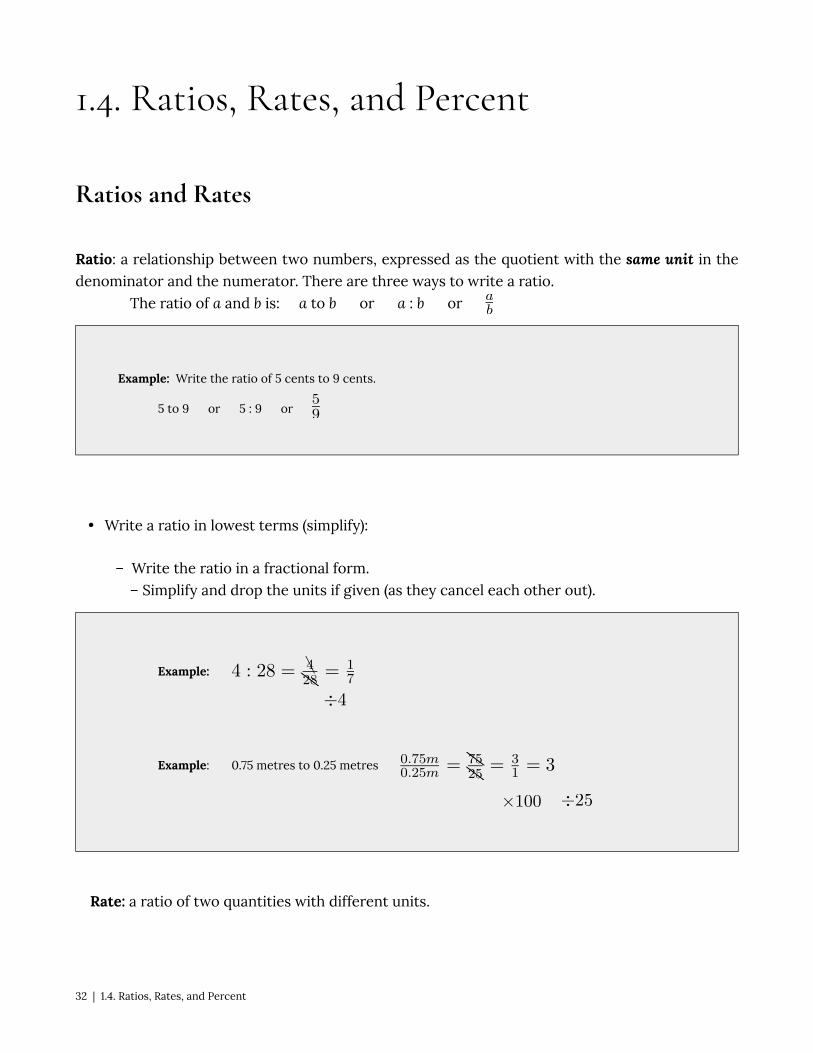
Ratio: a relationship between two numbers, expressed as the quotient with the same unit in thedenominator and the numerator. There are three ways to write a ratio.
The ratio of a and b is: a to b or a : b or
Example: Write the ratio of 5 cents to 9 cents.
5 to 9 or 5 : 9 or
• Write a ratio in lowest terms (simplify):
– Write the ratio in a fractional form.– Simplify and drop the units if given (as they cancel each other out).
Example:
Example: 0.75 metres to 0.25 metres
Rate: a ratio of two quantities with different units.
32 | 1.4. Ratios, Rates, and Percent

Example: teachers to students; money to time; distance to time, etc.
, ,
• Write a rate in lowest terms (simplify the rate):
Example: 80 kilometres per 320 minutes:
÷80
Unit rate: a rate in which the number in the denominator is 1.
Example: 15 dollars per hours: = $15 per h
• Some unit rates:
– Miles (or kilometres) per hour (or minute).– Cost (dollars/cents) per item or quantity.– Earnings (dollars) per hour (or week).
Proportion: an equation with a ratio (or rate) on two sides ( ), in which the two ratios areequal.
Example: Write the following sentence as a proportion.
3 printers is to 18 computers as 2 printers is to 12 computers.
1.4. Ratios, Rates, and Percent | 33

Solving a proportion:
• Cross multiply: multiply along two diagonals.• Solve for the unknown.
Example 1.4.1
4 litres of milk cost $4.38, how much do 2 litres cost?
• Facts and unknown:
4 L milk 2 L milk
$4.38 $ x = ?
• Proportion:
• Cross multiply:
• Solve for x: Divide both sides by 4.
2 litres of milk cost $2.19.
• Check: Replace x with 2.19.
(4) (2.19) = (2) (4.38)
8.76 = 8.76 Correct!
Example 1.4.2
34 | 1.4. Ratios, Rates, and Percent

Tom’s height is 1.75 metres, and his shadow is 1.09 metres long. A building’s shadow is 10 metres long at the
same time. How high is the building?
• Facts and unknown:
Tom’s height = 1.75 m Building’s height (x) = ?
Tom’s shadow = 1.09 m Building’s shadow = 10m
• Proportion:
• Cross multiply:
• Solve for x: Divide both sides by 1.09.
The building’s height is 16.055m.
• Check: Replace x with 16.055.
Correct!
Example 1.4.3
If 15 mL of medicine must be mixed with 180 mL of water, how many mL of medicine must be mixed in 230
mL of water?
1.4. Ratios, Rates, and Percent | 35
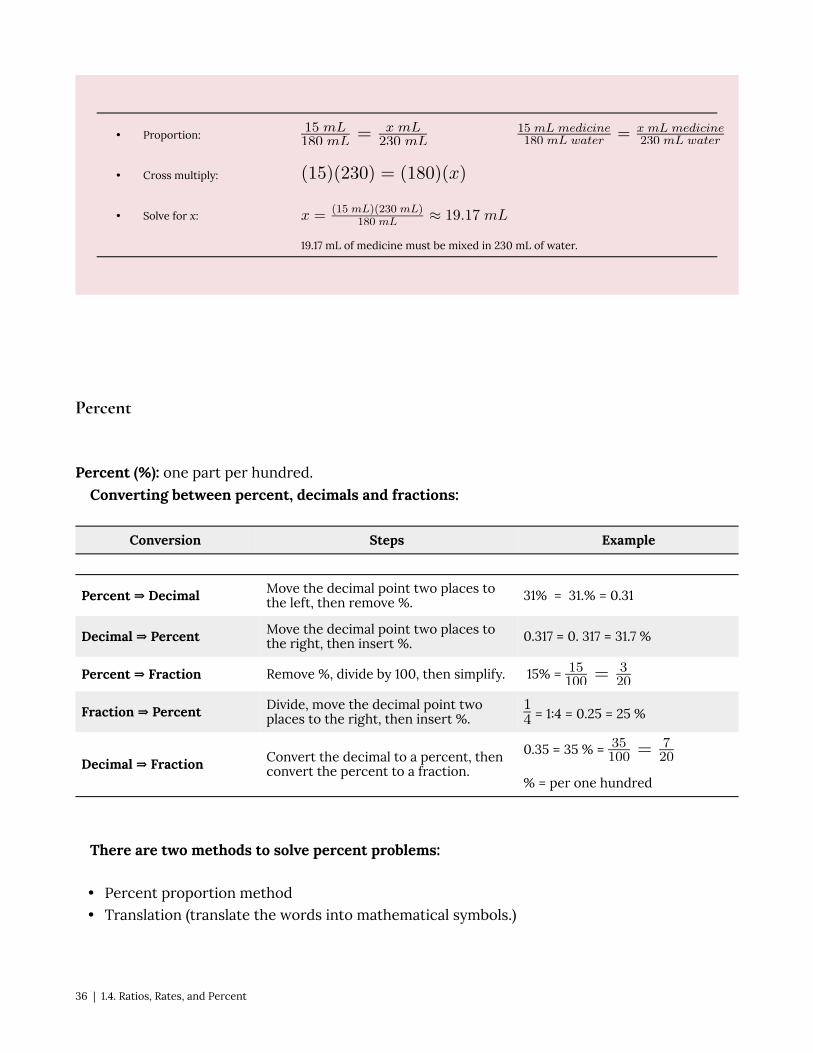
• Proportion:
• Cross multiply:
• Solve for x:
19.17 mL of medicine must be mixed in 230 mL of water.
Percent
Percent (%): one part per hundred.
Converting between percent, decimals and fractions:
Conversion Steps Example
Percent ⇒ Decimal Move the decimal point two places tothe left, then remove %. 31% = 31.% = 0.31
Decimal ⇒ Percent Move the decimal point two places tothe right, then insert %. 0.317 = 0. 317 = 31.7 %
Percent ⇒ Fraction Remove %, divide by 100, then simplify. 15% =
Fraction ⇒ Percent Divide, move the decimal point twoplaces to the right, then insert %. = 1÷4 = 0.25 = 25 %
Decimal ⇒ Fraction Convert the decimal to a percent, thenconvert the percent to a fraction.
0.35 = 35 % =
% = per one hundred
There are two methods to solve percent problems:
• Percent proportion method• Translation (translate the words into mathematical symbols.)
36 | 1.4. Ratios, Rates, and Percent

Percent proportion method:
or
Step Example
8 percent of what number is 4 ?
• Identify the part, whole, and percent.⇑
Percent
⇑
Whole (x)
⇑
Part
• Set up the proportion equation.
• Solve for unknown (x).
Translation method: translate the words into mathematical symbols.
• What ____ x : the word “what” represents an unknown quantity x.• Is ____ = : the word “is” represents an equal sign.• of ____ × : the word “of” represents a multiplication sign.• % to decimal: always change the percent to a decimal.
Example 1.4.4
1) What is 15% of 80?
x = 0.15 • 80 x = (0.15)(80) = 12
2) What percent of 90 is 45?
x % • 90 = 45 x% = = 0.5 = 50%
1.4. Ratios, Rates, and Percent | 37

Divide both sides by 90.
3) 12 is 8% of what number?
12 = 0.08 • x x = = 150
Divide both sides by 0.08.
Percent increase or decrease:
Application Formula
Percent increase Percent increase =
Percent decrease Percent decrease =
Example 1.4.5
A product increased production from 1500 last month to 1650 this month. Find the percent increase.
New value (N): 1650 This month.
Original value (O): 1500 Last month.
Percent increase: A 10% increase.
A product was reduced from 33 to 29. What percent reduction is this?
Percent decrease: A 12 % decrease.
38 | 1.4. Ratios, Rates, and Percent

Practice questions
1. Write the following as a ratio or rate in lowest terms:
a. 4 nickels to 16 nickels.
b. 350 people for 1500 tickets.
c. 160 kilometres per 740 minutes.
2. A train travelled 459 km in 6 hours. What is the unit rate?
3. Write the following sentence as a proportion: 24 hours is to 1,940 kilometres as 12 hours is to
985 kilometres.
4. 4 litres of juice cost $7.38, how much do 2 litres cost?
5. Sarah earns $4,500 in 30 days. How much does she earn in 120 days?
6. A product increased production from 2,800 last year to 3,920 this year. Find the percentincrease.
7. The table below gives survey data regarding Ryerson Occupational and Public Health studentsand summer jobs, but some data is missing:
Year 2015 2016 2017
Unemployed students 350 ? 396
Total number ofstudents 1250 1100 ?
a. What % of students were unemployed in 2015?
b. If the % of unemployed students remained the same in 2016, find the number ofunemployed students in 2016.
c. If the % of unemployed students increased by an additional 5% in 2017, find the totalnumber of students in 2017.
1.4. Ratios, Rates, and Percent | 39
1.5. Exponents and Scientific Notation
Exponents
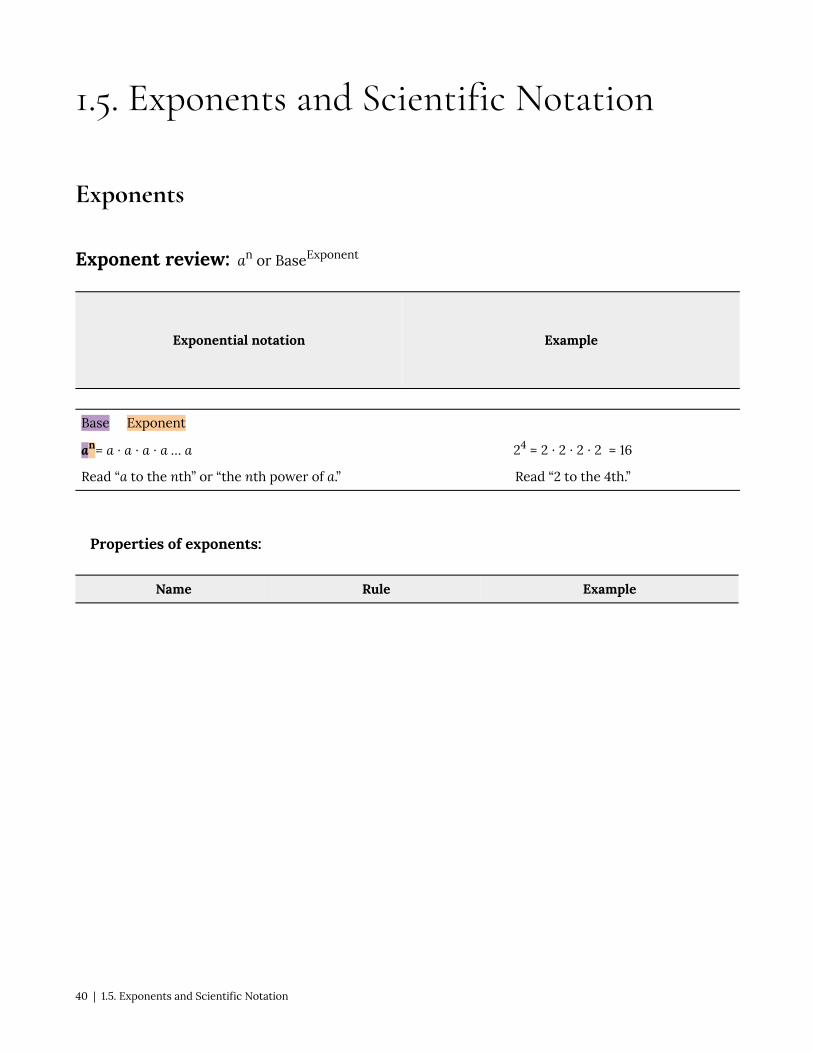
Exponent review: an or BaseExponent
Exponential notation Example
Base Exponent
an= a ∙ a ∙ a ∙ a … a 24 = 2 ∙ 2 ∙ 2 ∙ 2 = 16
Read “a to the nth” or “the nth power of a.” Read “2 to the 4th.”
Properties of exponents:
Name Rule Example
40 | 1.5. Exponents and Scientific Notation
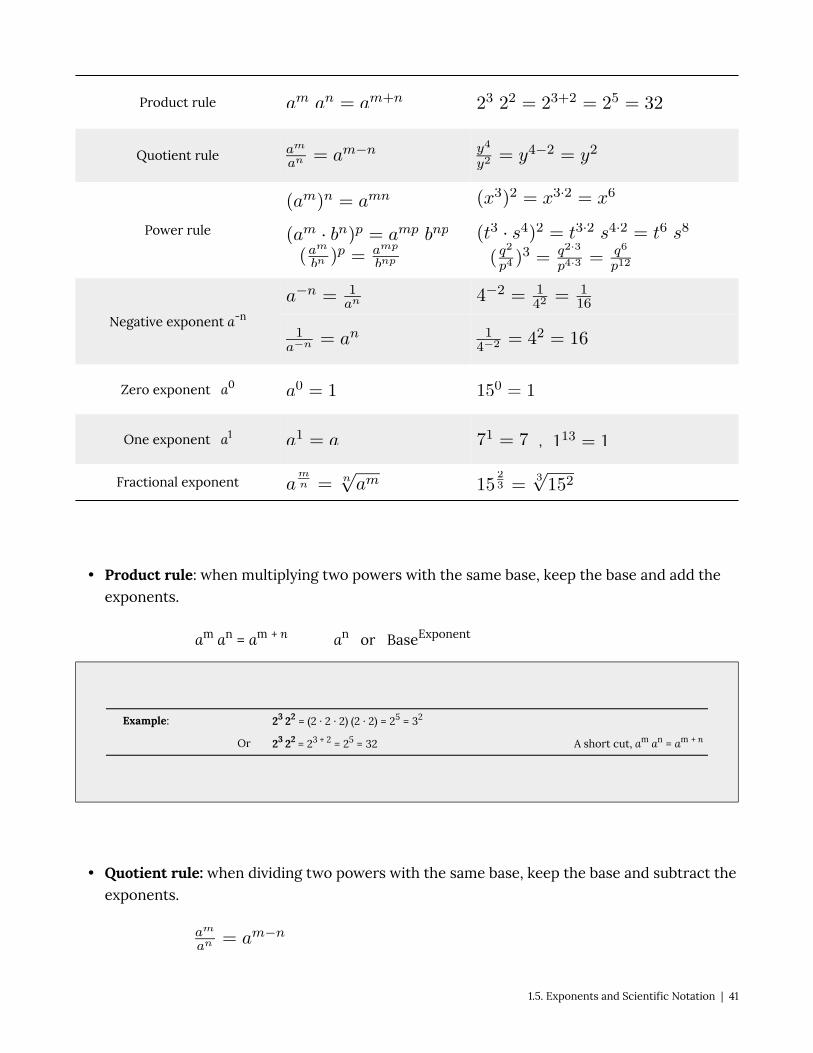
Product rule
Quotient rule
Power rule
Negative exponent a-n
Zero exponent a0
One exponent a1 ,
Fractional exponent
• Product rule: when multiplying two powers with the same base, keep the base and add theexponents.
am an = am + n an or BaseExponent
Example: 23 22 = (2 · 2 · 2) (2 · 2) = 25 = 32
Or 23 22 = 23 + 2 = 25 = 32 A short cut, am an = am + n
• Quotient rule: when dividing two powers with the same base, keep the base and subtract theexponents.
1.5. Exponents and Scientific Notation | 41

Example:
Or A short cut,
This law can also show that why a0 = 1 (zero exponent a0):
• Power rule: when raising an expression to a power, we multiply each exponent inside theparentheses by the power outside the parentheses.
(am)n = amn, (am · bn)p = amp bnp,
Example: (43)2 = (43) (43) = (4 · 4 · 4) (4 · 4 · 4) = 46 = 4096
Or (43)2 = 43 ∙ 2 = 46 = 4096 A short cut, (am)n = amn
Example: (2 · 3)2 = (2 · 3) (2 · 3) = 6 ∙ 6 = 36
Or (2 · 3)2 = 22 32 = 4 ∙ 9 = 36 A short cut , (a · b)n = an bn
Example:
Or A short cut,
• Negative exponent: a negative exponent is the reciprocal of the number with a positiveexponent.
, a−n is the reciprocal of an.
42 | 1.5. Exponents and Scientific Notation

Example:
Example:
• Fractional exponent: a fractional exponent is a different way of writing a radical (i.e. root)sign. The base is first taken to the exponent of m, then the nth root is found to obtain thepower.
Example:
Example 1.5.1
Simplify (do not leave negative exponents in the answer).
1.5. Exponents and Scientific Notation | 43

1)
2)
3)
4)
5) ,
6) ,
7)
8)
9), ,
10) ,
44 | 1.5. Exponents and Scientific Notation

Simplifying Exponential Expressions
• Remove parentheses using “power rule” if necessary. (am bn)p = amp bnp
• Regroup coefficients and variables.
• Use “product rule” and “quotient rule”. am an = am + n ,• Simplify.• Use the “negative exponent” rule to make all exponents positive if necessary.
Example 1.5.2
Simplify.
1)
Remove brackets. ,
Regroup coefficients andvariables.
Simplify.
Make exponent positive. ,
2)
Remove brackets.
Regroup coefficients and variables.
Simplify.
1.5. Exponents and Scientific Notation | 45

Example 1.5.3
Evaluate for a = 2, b = 1, c = -1.
1)
2) Substitute 2 for a and 1 for b,
, ,
3)Substitute 2 for a and 1 for b, and -1 for c.
Scientific Notation
Scientific notation is a special way of concisely expressing very large and small numbers.
Example: 300,000,000 = 3 × 10⁸ m/sec The speed of light.
0.00000000000000000016 = 1.6 × 10⁻¹⁹ C An electron.
Scientific notation: a product of a number between 1 and 10 and a power of 10.
Scientific notation Example
N × 10±n1 ≤ N < 10 67504.3 = 6.75043 × 10⁴
n – integer Standard form Scientific notation
Writing a number in scientific notation:
46 | 1.5. Exponents and Scientific Notation

Step Example
• Move the decimal point after the first nonzero digit. 0.0079 37213000
• Determine n (the power of 10) by counting the number ofplaces you moved the decimal. n = 3 n = 7
• If the decimal point is moved to the right: × 10–n 0.0079 = 7.9 × 10⁻³
3 places to the right.
• If the decimal point is moved to the left: × 10n 37213000. = 3.7213 × 10⁷
7 places to the left.
Example 1.5.4
Write in scientific notation.
1) 2340000 = 2340000. = 2.34× 10⁶ 6 places to the left, × 10n
2) 0.000000439 = 4.39 × 10⁻⁷ 7 places to the right, × 10-n
Example 1.5.5
Write in standard (or ordinary) form.
1) 6.4275 × 104 = 64275
2) 2.9 × 10-3 = 0.0029
1.5. Exponents and Scientific Notation | 47

Practice questions
1. Evaluate:
a. 4x2 + 5y, for x = 1, y = 4
b. (2a)3 – 3b, for a = 5, b = 6
2. Simplify (do not leave negative exponents in the answer):
a. (-92)1
b. y4 y3
c.d. 13a-1
e. (3a2 · b3)4
f.
g.3. Write in scientific notation:
a. 45,600,000
b. 0.00000523
4. Write in standard (or ordinary) form:
a. 3.578 × 10³
b. 4.3 × 10⁻⁵
48 | 1.5. Exponents and Scientific Notation
1.6. Practice question answers
Chapter 1 practice question answers
1.1 Introduction
1. a. 5x3 , 8x2 , 2x
b. – y4 , 9a2 , a , –1
2. a. –x + 19y
b. 6a2 – 31b
c. 9m2 + 64n
3. a. 10a2 + 13
b. -19x + 39y
c. 17ab – 28xy
d. 40y2 – 11y – 63
e. 21r2 + 28rt2 – 6rt –8t3
f. x2 – x +
1.2. Equations
1. a. x = 19
b. y =
c. x =
d. t =
1.6. Practice question answers | 49

e. x = 2
f. y =
g. t = – 0.05
h. x =
2. a. $375 + y
b. 175 – y
c. 45 – w
d. ,
1.3. Measurement Systems
1. a. 0.439 m
b. 0.0000483 kL
c. 7.23 kg
d. 520 mm
3. a. 4000 mm
b. 63006 g
4. a. 38 g
b. 5000 cm3
c. 18,000 cm3
d. 0.039375 kL
1.4. Ratios, Rates, and Percent
1. a.
50 | 1.6. Practice question answers

b.
c.
2. 76.5 km/h
3.
4. $3.69
5. $18,000
6. 40%
7. a. 28%
b. 308
c. 1200
1.5. Exponents and Scientific Notation
1. a. 24
b. 982
2. a. – 92
b. y7
c. x3
d.
e. 81a8 b12
f.
g.
3. a. 4.56 × 10⁷
b. 5.23 × 10⁻⁶
4. a. 3578
b. 0.000043
1.6. Practice question answers | 51


CHAPTER 2: LINEAR EQUATIONS ANDGRAPHS
Chapter 2: Linear Equations and Graphs | 53


2.1. Graphing a Linear Equation
Graphing a Linear Equation
Equations whose graphs are straight lines are called linear equations. The following are someexamples of linear equations:
2x − 3y = 6 , 3x = 4y − 7 , y = 2x − 5 , 2y = 3 , and x − 2 = 0.
A line is completely determined by two points. Therefore, to graph a linear equation, we need tofind the coordinates of two points. This can be accomplished by choosing an arbitrary value for xor y and then solving for the other variable.
Example 2.1.1
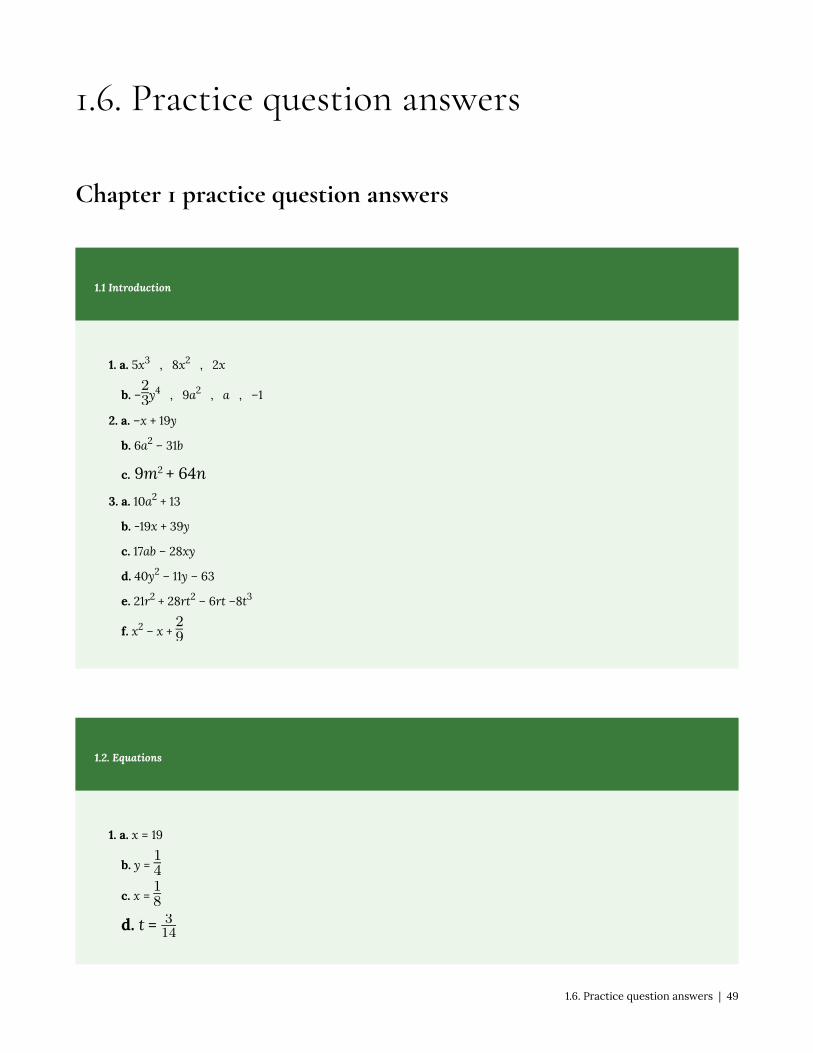
Graph the line: y = 3x + 2
Solution
We need to find the coordinates of at least two points.
We arbitrarily choose x = -1 , x = 0 , and x = 1.
If x = -1, then y = 3(-1) + 2 or -1. Therefore, (-1, -1) is a point on this line.
If x = 0, then y = 3(0) + 2 or y = 2. Hence the point (0, 2).
If x = 1, then y = 5, and we get the point (1, 5). Below, the results are summarized, and the line is graphed.
X -1 0 1
Y -1 2 5
2.1. Graphing a Linear Equation | 55
Example 2.1.2
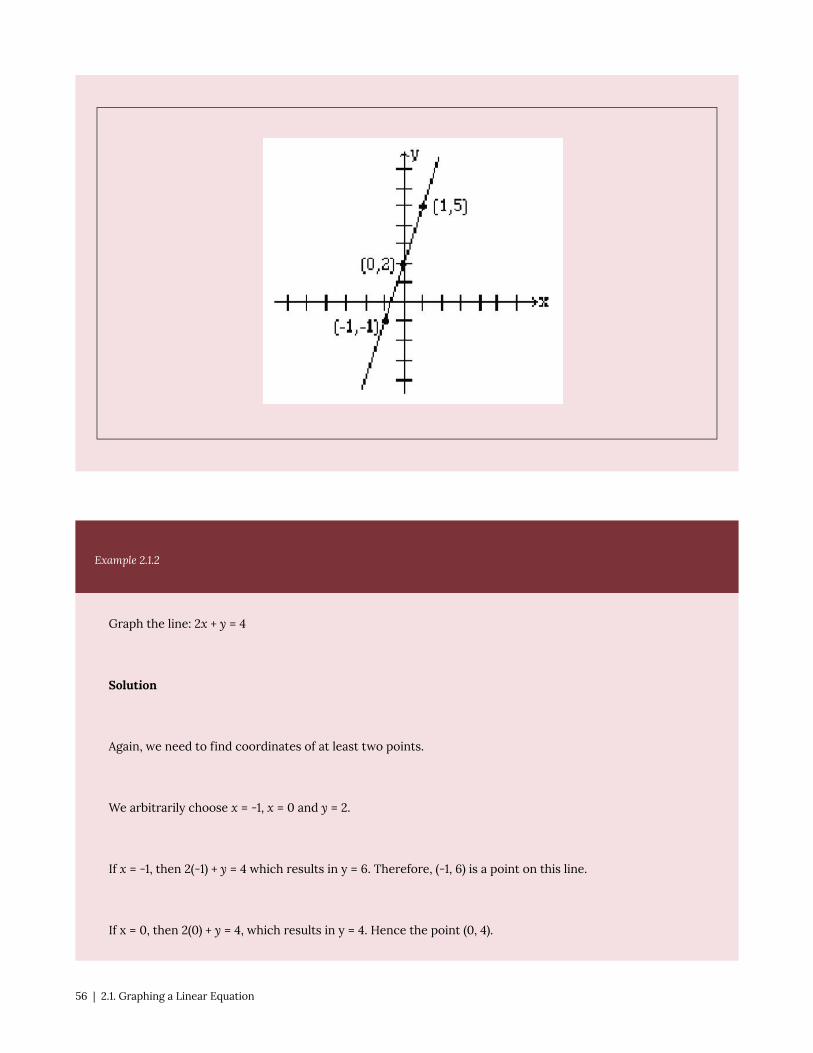
Graph the line: 2x + y = 4
Solution
Again, we need to find coordinates of at least two points.
We arbitrarily choose x = -1, x = 0 and y = 2.
If x = -1, then 2(-1) + y = 4 which results in y = 6. Therefore, (-1, 6) is a point on this line.
If x = 0, then 2(0) + y = 4, which results in y = 4. Hence the point (0, 4).
56 | 2.1. Graphing a Linear Equation
If y = 2, then 2x + 2 = 4, which yields x = 1, and gives the point (1, 2). The table below shows the points, and the
line is graphed.
x -1 0 1
y 6 4 2
The points at which a line crosses the coordinate axes are called the intercepts. When graphing aline, intercepts are preferred because they are easy to find. In order to find the x-intercept, we lety = 0, and to find the y-intercept, we let x = 0.
Example 2.1.3
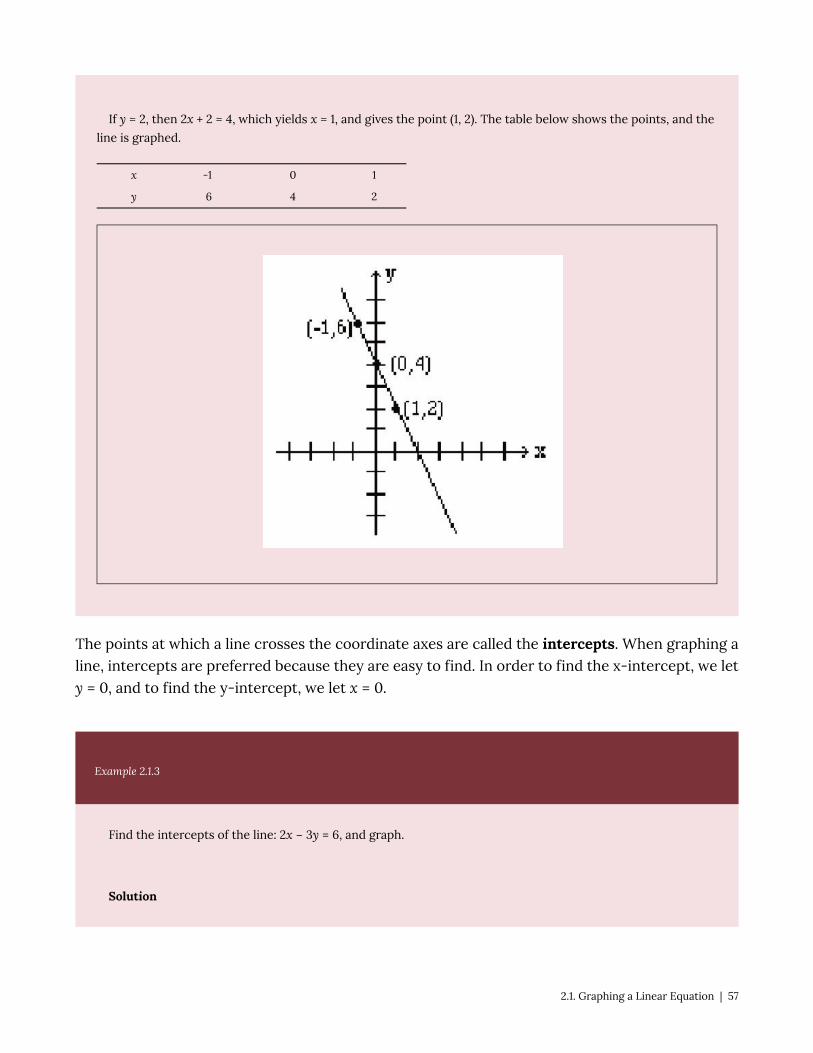
Find the intercepts of the line: 2x − 3y = 6, and graph.
Solution
2.1. Graphing a Linear Equation | 57
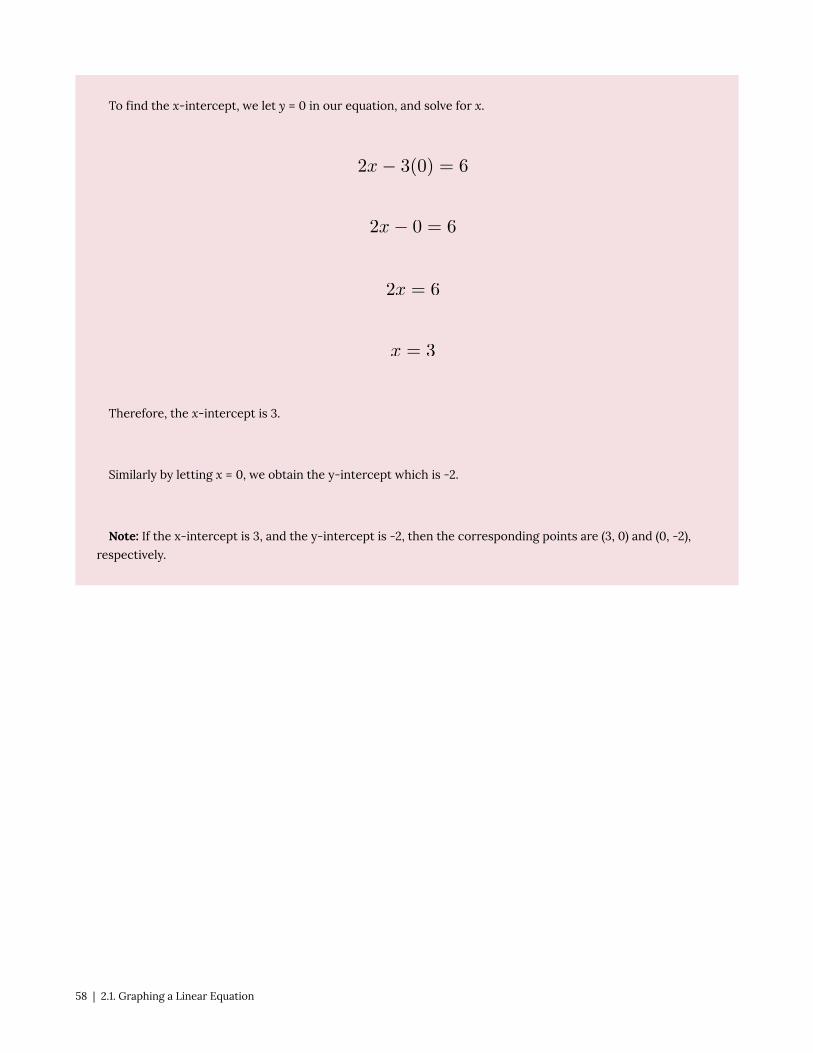
To find the x-intercept, we let y = 0 in our equation, and solve for x.
Therefore, the x-intercept is 3.
Similarly by letting x = 0, we obtain the y-intercept which is -2.
Note: If the x-intercept is 3, and the y-intercept is -2, then the corresponding points are (3, 0) and (0, -2),
respectively.
58 | 2.1. Graphing a Linear Equation

In higher math, equations of lines are sometimes written in parametric form. For example, x = 3 +2t , y = 1 + t. The letter t is called the parametre or the dummy variable. Parametric lines can begraphed by finding values for x and y by substituting numerical values for t.
Example 2.1.4
Graph the line given by the parametric equations: x = 3 + 2t , y = 1 + t
Solution
Let t = 0, 1 and 2, and then for each value of t find the corresponding values for x and y.
The results are given in the table below.
2.1. Graphing a Linear Equation | 59
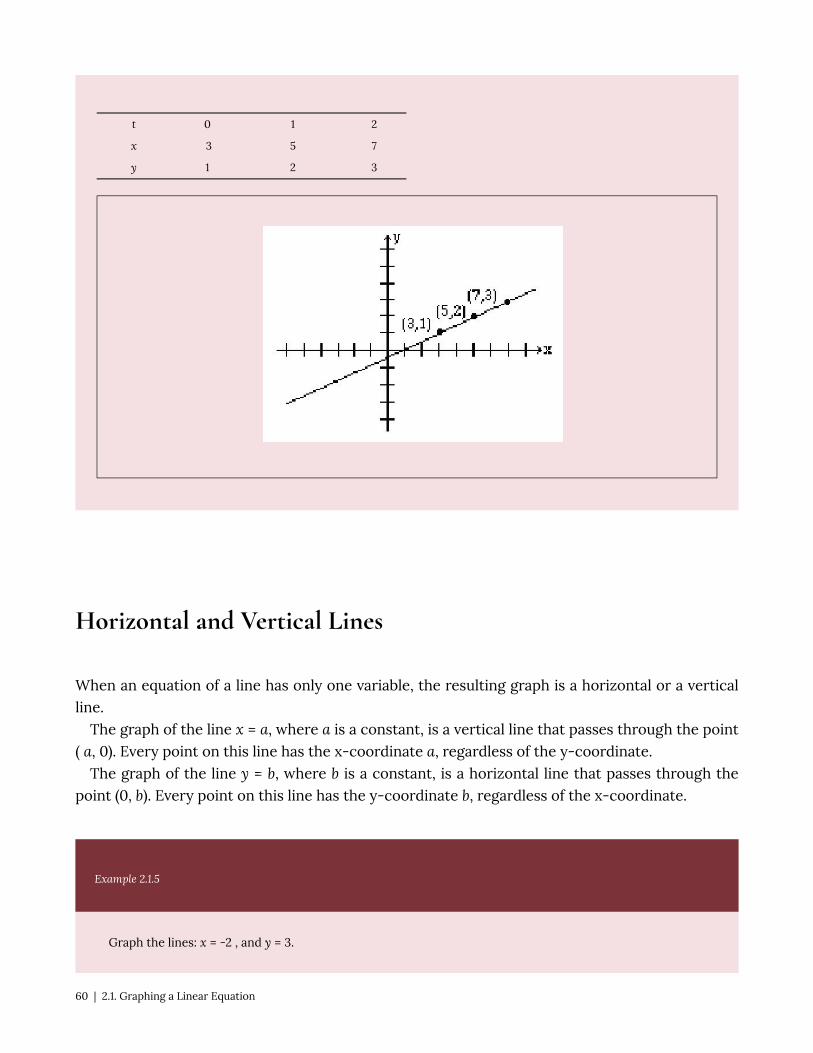
t 0 1 2
x 3 5 7
y 1 2 3
Horizontal and Vertical Lines
When an equation of a line has only one variable, the resulting graph is a horizontal or a verticalline.
The graph of the line x = a, where a is a constant, is a vertical line that passes through the point( a, 0). Every point on this line has the x-coordinate a, regardless of the y-coordinate.
The graph of the line y = b, where b is a constant, is a horizontal line that passes through thepoint (0, b). Every point on this line has the y-coordinate b, regardless of the x-coordinate.
Example 2.1.5
Graph the lines: x = -2 , and y = 3.
60 | 2.1. Graphing a Linear Equation

Solution
The graph of the line x = -2 is a vertical line that has the x-coordinate -2 no matter what the y-coordinate is.
Therefore, the graph is a vertical line passing through (-2, 0).
The graph of the line y = 3, is a horizontal line that has the y-coordinate 3 regardless of what the x-
coordinate is. Therefore, the graph is a horizontal line that passes through (0, 3).
Note: Most students feel that the coordinates of points must always be integers. This is not true, and in real
life situations, not always possible. Do not be intimidated if your points include numbers that are fractions or
decimals.
Practice questions
1. Is the point (2, 3) on the line 5x – 2y = 4?
2. For the line 3x – y = 12, complete the following ordered pairs:
a. (2, ?) (? , 6)
2.1. Graphing a Linear Equation | 61

b. (0, ?) (?, 0)
3. Graph y = 4x – 3
4. Graph 2x + 4 = 0
5. Graph the line using the parametric equations: x = 1 + 2t; y = 3 + t.6. Graph the following three equations on the same set of coordinate axes: y = x + 1; y = 2x + 1; y
= –x + 1.
62 | 2.1. Graphing a Linear Equation

2.2. Slope of a Line
Slope of a Line
In this section, you will learn to:
1. Find the slope of a line if two points are given.2. Graph the line if a point and the slope are given.3. Find the slope of the line that is written in the form y = mx + b.4. Find the slope of the line that is written in the form Ax+ By = c.
In the last section, we learned to graph a line by choosing two points on the line. A graph of a linecan also be determined if one point and the “steepness” of the line is known. The precise number
that refers to the steepness or inclination of a line is called the slope of the line.From previous math courses, many of you remember slope as the “rise over run,” or “the vertical
change over the horizontal change” and have often seen it expressed as:
We give a precise definition.
Definition:If ( x1, y1) and ( x2, y2) are two different points on a line, then the slope of the line is
Example 2.2.1
Find the slope of the line that passes through the points (-2, 3) and (4, -1), and graph the line.
Solution
Let (x1, y1) = (-2, 3) and (x2, y2) = (4, −1) then the slope
2.2. Slope of a Line | 63

To give the reader a better understanding, both the vertical change, -4, and the horizontalchange, 6, are shown in the above figure.
When two points are given, it does not matter which point is denoted as (x1, y1) and which (x2,y2). The value for the slope will be the same. For example, if we choose (x1, y2) = (4, -1) and (x2, y2)= (-2, 3), we will get the same value for the slope as we obtained earlier. The steps involved are asfollows.
The student should further observe that if a line rises when going from left to right, then it hasa positive slope; and if it falls going from left to right, it has a negative slope.
Example 2.2.2
Find the slope of the line that passes through the points (2, 3) and (2, -1), and graph.
64 | 2.2. Slope of a Line

Solution
Let (x1, y1) = (2, 3) and (x2, y2) = (2, -1) then the slope
undefined
Note: The slope of a vertical line is undefined.
Example 2.2.3
2.2. Slope of a Line | 65

Graph the line that passes through the point (1, 2) and has slope .
Solution
Slope equals . The fact that the slope is , means that for every rise of -3 units (fall of 3 units)
there is a run of 4. So if from the given point (1, 2) we go down 3 units and go right 4 units, we reach the
point (5, -1). The following graph is obtained by connecting these two points.
Alternatively, since represents the same number, the line can be drawn by starting at the point (1,
2) and choosing a rise of 3 units followed by a run of -4 units. So from the point (1, 2), we go up 3 units,
and to the left 4, thus reaching the point (-3, 5) which is also on the same line. See the figure below.
66 | 2.2. Slope of a Line

Example 2.2.4
Find the slope of the line 2x + 3y = 6.
Solution
In order to find the slope of this line, we will choose any two points on this line.
Again, the selection of x and y intercepts seems to be a good choice. The x-intercept is (3, 0), and the
y-intercept is (0, 2). Therefore, the slope is
2.2. Slope of a Line | 67

The graph below shows the line and the intercepts: x and y.
Example 2.2.5
Find the slope of the line y = 3x + 2.
Solution
68 | 2.2. Slope of a Line

We again find two points on the line. Say (0, 2) and (1, 5).
Therefore, the slope is .
Look at the slopes and the y-intercepts of the following lines.
The line Slope y-intercept
y = 3x + 2 3 2
y = -2x + 5 -2 5
y = 3/2x – 4 3/2 -4
It is no coincidence that when an equation of the line is solved for y, the coefficient of the x termrepresents the slope, and the constant term represents the y-intercept.
In other words, for the line y = mx + b, m is the slope, and b is the y-intercept.
Example 2.2.6
Determine the slope and y-intercept of the line 2x + 3y = 6.
Solution
We solve for y.
2.2. Slope of a Line | 69

The slope = the coefficient of the x term = – 2/3
The y-intercept = the constant term = 2.
Practice questions
1. Find the slope of the line passing through the following pair of points:
a. (2, 3) and (5, 9)
b. (6, -5) and (4, -1)
c. (-3, -5) and (-1, -7)
2. Determine the slope of the line from the given equation of the line:
a.b.c.
3. Graph the line that passes through the given point and has the given slope.
a. (1, 2) and m = -3/4
b. (0, 2) and m = -2
70 | 2.2. Slope of a Line

2.3. Equation of a Line
Determining the Equation of a Line
In this section, you will learn to:
1. Find an equation of a line if a point and the slope are given.2. Find an equation of a line if two points are given.
So far, we were given an equation of a line and were asked to give information about it. Forexample, we were asked to find points on it, find its slope, and find intercepts. Now we are goingto reverse the process. That is, we will be given either two points, or a point and the slope of a line,and we will be asked to find its equation.
An equation of a line can be written in two forms, the slope-intercept form or the standardform.
The Slope-Intercept Form of a Line: y = mx + bA line is completely determined by two points, or a point and slope. So it makes sense to ask to
find the equation of a line if one of these two situations is given.
Example 2.3.1
Find an equation of a line whose slope is 5, and y-intercept is 3.
Solution
In the last section we learned that the equation of a line whose slope = m and y-intercept = b is y =
mx + b.
Since m = 5, and b = 3, the equation is y = 5x + 3.
2.3. Equation of a Line | 71

Example 2.3.2
Find the equation of the line that passes through the point (2, 7) and has slope 3.
Solution
Since m = 3, the partial equation is y = 3x + b.
Now b can be determined by substituting the point (2, 7) in the equation y = 3x + b.
Therefore, the equation is y = 3x + 1.
Example 2.3.3
Find an equation of the line that passes through the points (-1, 2), and (1, 8).
Solution
72 | 2.3. Equation of a Line

So the partial equation is y = 3x + b
Now we can use either of the two points (-1, 2) or (1, 8), to determine b. Substituting (-1, 2) gives
So the equation is y = 3x + 5.
Example 2.3.4
Find an equation of the line that has x-intercept 3, and y-intercept 4.
Solution
x-intercept = 3, and y-intercept = 4 correspond to the points (3, 0), and (0, 4), respectively.
So the partial equation for the line is y = – 4/3x + b
2.3. Equation of a Line | 73

Substituting (0, 4) gives
Therefore, the equation is y = – 4/3x + 4.
The Standard form of a Line: Ax + By = CAnother useful form of the equation of a line is the Standard form.Let L be a line with slope m, and containing a point (x1, y1). If (x, y) is any other point on the line L,then by the definition of a slope, we get
The last result is referred to as the point-slope form or point-slope formula. If we simplify thisformula, we get the equation of the line in the standard form, Ax + By = C.
Example 2.3.5
Using the point-slope formula, find the standard form of an equation of the line that passes through
the point (2, 3) and has slope – 3/5.
Solution
Substituting the point (2, 3) and m = – 3/5 in the point-slope formula, we get
74 | 2.3. Equation of a Line

Multiplying both sides by 5 gives us
Example 2.3.6
Find the standard form of the line that passes through the points (1, -2), and (4, 0).
Solution
The point-slope form is:
Multiplying both sides by 3 gives us:
We should always be able to convert from one form of an equation to another. That is, if we aregiven a line in the slope-intercept form, we should be able to express it in the standard form, andvice versa.
2.3. Equation of a Line | 75

Example 2.3.7
Write the equation y = – 2/3x +3 in the standard form.
Solution
Multiplying both sides of the equation by 3, we get
Example 2.3.8
Write the equation 3x − 4y = 10 in the slope-intercept form.
Solution
Solving for y, we get:
Finally, we learn a very quick and easy way to write an equation of a line in the standard form.But first we must learn to find the slope of a line in the standard form by inspection.
By solving for y, it can easily be shown that the slope of the line Ax + By = C is −A/B. The readershould verify.
76 | 2.3. Equation of a Line

Example 2.3.9
Find the slope of the following lines, by inspection.
a. 3x − 5y = 10
b. 2x + 7y = 20
c. 4x − 3y = 8
Solution
a. A = 3, B = −5, therefore,
b. A = 2, B = 7, therefore,
c.
Now that we know how to find the slope of a line in the standard form by inspection, our job infinding the equation of a line is going to be very easy.
Example 2.3.10
Find an equation of the line that passes through (2, 3) and has slope −4/5.
Solution
2.3. Equation of a Line | 77

Since the slope of the line is −4/5, we know that the left side of the equation is 4x +5y, and the partial
equation is going to be:
Of course, c can easily be found by substituting for x and y.
The desired equation is
.
If you use this method often enough, you can do these problems very quickly.
Practice questions
1. Write an equation of the line satisfying the following conditions. Write the equation in the formy = mx + b.
a. Passes through (3, 5) and (2, -1).
b. Passes through (5, -2) and m = .
c. Passes through (2, -5) and its x-intercept is 4.
d. Passes through (-3, -4), and (-5, 2).
e. Is a horizontal line passing through (2, -1).
f. Has an x-intercept = 3 and y-intercept = 4.
2. Write an equation of the line that satisfies the following conditions. Write the equation in theform Ax + By = C.
78 | 2.3. Equation of a Line

a. Passes through (-4, -2) and m =
b. Passes through (2, -3) and (5, 1).
2.3. Equation of a Line | 79

2.4. Applications
Applications
Now that we have learned to determine equations of lines, we can apply these ideas to real-lifeequations.
Example 2.4.1
A taxi service charges $0.50 per mile plus a $5 flat fee. What will be the cost of traveling 20 miles? What will
be cost of traveling x miles?
Solution
The cost of traveling 20 miles = y = (.50)(20) + 5 = 10 + 5 = 15
The cost of traveling x miles = y = (.50)(x) + 5 = .50x + 5
In the above problem, $0.50 per mile is referred to as the variable cost, and the flat charge $5 as
the fixed cost. Now if we look at our cost equation y = .50x + 5, we can see that the variable costcorresponds to the slope and the fixed cost to the y-intercept.
Example 2.4.2
The variable cost to manufacture a product is $10 and the fixed cost $2500. If x represents the number of
items manufactured and y the total cost, write the cost function.
80 | 2.4. Applications

Solution
The variable cost represents the slope and the fixed cost represents the y-intercept. Therefore, m = 10 and y
= 2500.
The cost equation is y = 10x + 2500.
Example 2.4.3
It costs $750 to manufacture 25 items, and $1000 to manufacture 50 items. Assuming a linear relationship
holds, find the cost equation, and use this function to predict the cost of 100 items.
Solution
We let x = the number of items manufactured, and let y = the cost.
Solving this problem is equivalent to finding an equation of a line that passes through the points (25, 750) and
(50, 1000).
Therefore, the partial equation is y = 10x + b.
By substituting one of the points in the equation, we get b = 500.
Therefore, the cost equation is y = 10x + 500.
Now to find the cost of 100 items, we substitute x = 100 in the equation y = 10x + 500.
So the cost = y = 10(100) + 500 = 1500.
Example 2.4.4
The freezing temperature of water in Celsius is 0 degrees and in Fahrenheit 32 degrees. And the boiling
temperatures of water in Celsius, and Fahrenheit are 100 degrees, and 212 degrees, respectively. Write a
conversion equation from Celsius to Fahrenheit and use this equation to convert 30 degrees Celsius into
Fahrenheit.
2.4. Applications | 81

Solution
Let us look at what is given.
Centigrade Fahrenheit
0 32
100 212
Again, solving this problem is equivalent to finding an equation of a line that passes through the points (0, 32)
and (100, 212).
Since we are finding a linear relationship, we are looking for an equation y = mx + b, or in this case F = mC+ b,
where x or C represent the temperature in Celsius, and y or F the temperature in Fahrenheit.
slope
The equation is
Substituting the point (0, 32), we get
Now to convert 30 degrees Celsius into Fahrenheit, we substitute C = 30 in the equation
Example 2.4.5
The population of Canada in the year 1970 was 18 million, and in 1986 it was 26 million. Assuming the
population growth is linear, and x represents the year and y the population, write the function that gives a
relationship between the time and the population. Use this equation to predict the population of Canada in
2010.
Solution
The problem can be made easier by using 1970 as the base year, that is, we choose the year 1970 as the year
zero. This will mean that the year 1986 will correspond to year 16, and the year 2010 as the year 40.
Now we look at the information we have.
82 | 2.4. Applications
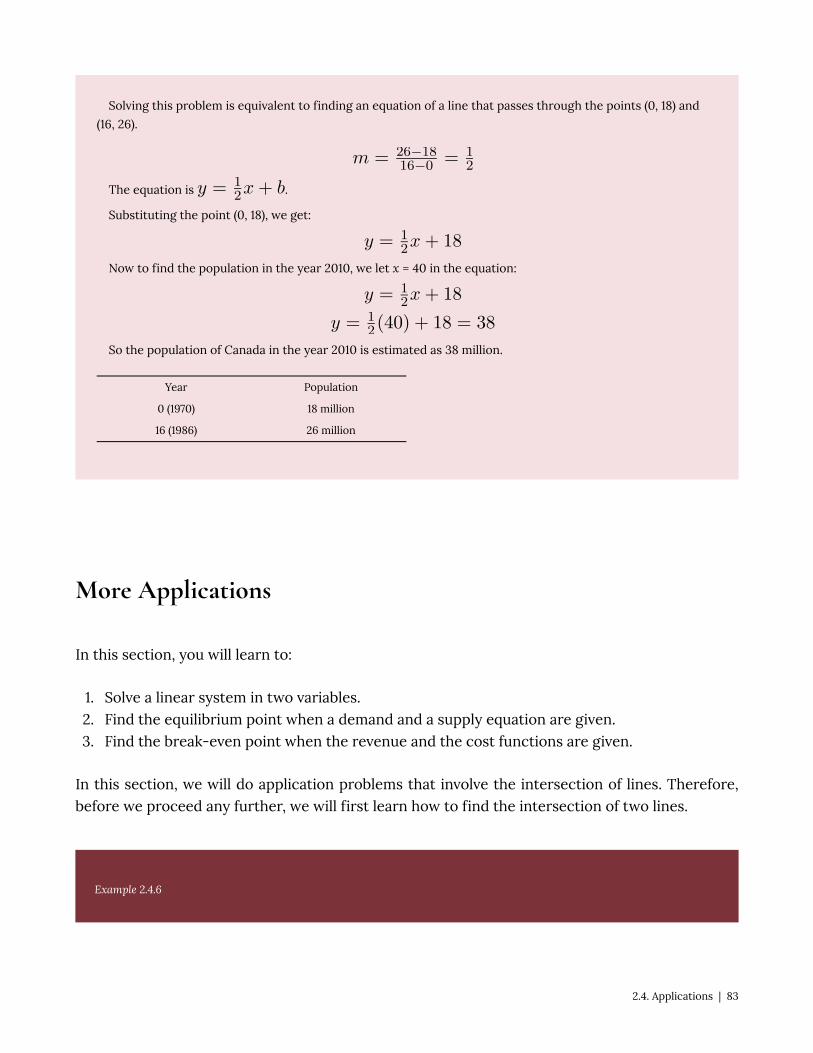
Solving this problem is equivalent to finding an equation of a line that passes through the points (0, 18) and
(16, 26).
The equation is .
Substituting the point (0, 18), we get:
Now to find the population in the year 2010, we let x = 40 in the equation:
So the population of Canada in the year 2010 is estimated as 38 million.
Year Population
0 (1970) 18 million
16 (1986) 26 million
More Applications
In this section, you will learn to:
1. Solve a linear system in two variables.2. Find the equilibrium point when a demand and a supply equation are given.3. Find the break-even point when the revenue and the cost functions are given.
In this section, we will do application problems that involve the intersection of lines. Therefore,before we proceed any further, we will first learn how to find the intersection of two lines.
Example 2.4.6
2.4. Applications | 83

Find the intersection of the line y = 3x − 1 and the line y = −x + 7.
Solution
We graph both lines on the same axes, as shown below, and read the solution (2, 5).
Finding the intersection of two lines graphically is not always easy or practical; therefore, wewill now learn to solve these problems algebraically.
At the point where two lines intersect, the x and y values for both lines are the same. So in orderto find the intersection, we either let the x-values or the y-values equal.
If we were to solve the above example algebraically, it will be easier to let the y-values equal.Since y = 3x − 1 for the first line, and y = −x + 7 for the second line, by letting the y-values equal,we get:
By substituting x = 2 in any of the two equations, we obtain y = 5. Hence, the solution (2, 5).
One common algebraic method used in solving systems of equations is called the eliminationmethod. The object of this method is to eliminate one of the two variables by adding the left andright sides of the equations together. Once one variable is eliminated, we get an equation that hasonly one variable for which it can be solved. Finally, by substituting the value of the variable thathas been found in one of the original equations, we get the value of the other variable. The methodis demonstrated in the example below.
84 | 2.4. Applications

Example 2.4.7
Find the intersection of the lines 2x + y = 7 and 3x − y = 3 by the elimination method.
Solution
We add the left and right sides of the two equations.
Now we substitute x = 2 in any of the two equations and solve for y.
Therefore, the solution is (2, 3).
Example 2.4.8
2.4. Applications | 85

Solve the system of equations x + 2y = 3 and 2x + 3y = 4 by the elimination method.
Solution
If we add the two equations, none of the variables are eliminated. But the variable x can be eliminated by
multiplying the first equation by -2, and leaving the second equation unchanged.
Substituting y = 2 in x + 2y = 3, we get
Therefore, the solution is (-1, 2).
Example 2.4.9
Solve the system of equations 3x − 4y = 5 and 4x − 5y = 6.
Solution
This time, we multiply the first equation by -4 and the second by 3 before adding. (The choice of numbers is
not unique.)
86 | 2.4. Applications

By substituting y = -2 in any one of the equations, we get x = -1. Hence the solution (-1, -2).
Supply, Demand and the Equilibrium Market Price
In a free market economy the supply curve for a commodity is the number of items of a productthat can be made available at different prices, and the demand curve is the number of items theconsumer will buy at different prices. As the price of a product increases, its demand decreasesand supply increases. On the other hand, as the price decreases the demand increases and supply
decreases. The equilibrium price is reached when the demand equals the supply.
Example 2.4.10
The supply curve for a product is y = 1.5x + 10 and the demand curve for the same product is y = -2.5x + 34,
where x is the price and y the number of items produced. Find the following:
a. How many items will be supplied at a price of $10?
b. How many items will be demanded at a price of $10?
c. Determine the equilibrium price.
d. How many items will be produced at the equilibrium price?
Solution
a. We substitute x = 10 in the supply equation, y = 1.5x + 10, and the answer is y = 25.
2.4. Applications | 87

b. We substitute x = 10 in the demand equation, y = -2.5x + 34, and the answer is y = 9.
c. By letting the supply equal the demand, we get:
d. We substitute x = 6 in either the supply or the demand equation and we get y = 19. The graph below shows
the intersection of the supply and the demand functions and their point of intersection, (6, 19).
88 | 2.4. Applications

Break-Even Point
In a business, profit is generated by selling products. If a company sells x number of items at aprice P, then the revenue R is P times x , i.e., R = P · x. The production costs are the sum of thevariable costs and the fixed costs, and are often written as C = mx + b, where x is the number ofitems manufactured.A company makes a profit if the revenue is greater than the cost, and it shows a loss if the cost isgreater than the revenue. The point on the graph where the revenue equals the cost is called the
break-even point.
Example 2.4.11
If the revenue function of a product is R = 5x and the cost function is y = 3x + 12, find the following:
a. If 4 items are produced, what will the revenue be?
b. What is the cost of producing 4 items?
c. How many items should be produced to break-even?
d. What will be the revenue and the cost at the break-even point?
Solution
a. We substitute x = 4 in the revenue equation R = 5x, and the answer is R = 20.
b. We substitute x = 4 in the cost equation C = 3x + 12, and the answer is C = 24.
c. By letting the revenue equal the cost, we get:
2.4. Applications | 89

d. We substitute x = 6 in either the revenue or the cost equation, and we get R = C = 30. The graph below
shows the intersection of the revenue and the cost functions and their point of intersection, (6, 30).
Practice questions
1. The variable cost to manufacture an item is $20, and it costs a total of $750 to produce 20 items.If x represents the number of items manufactured and y the cost, write the cost function.
2. A person who weighs 150 pounds has 60 pounds of muscles, and a person that weighs 180pounds has 72 pounds of muscles. If x represents the body weight and y the muscle weight, write
90 | 2.4. Applications

an equation describing their relationship. Use this relationship to determine the muscle weight ofa person that weighs 170 pounds.
3. In 2005, an average house in Greater Toronto Area cost $335,907 and the average house in2018 cost $787,300. Assuming a linear relationship, predict the price of a similar house in the year2025.
4. In 2010 there were 11,386 laboratory-confirmed cases of gonorrhea reported in Canada. In2015, the number of cases increased to 19,845. Assuming a linear relationship, how many cases ofgonorrhea might we expect in 2030?
5. The supply curve for a product is y = 2000x + 13000, and the demand curve is y = -1000x +28000, where x represents the price and y the number of items. At what price will the supply equaldemand, and how many items will be produced at that price?
6. A company that produces toys has a fixed costs of $10,725, and variable cost of 20 cents a toy.Find the break-even point if the toys sell for $1.50 each.
2.4. Applications | 91

2.5. Practice question answers
Chapter 2 practice question answers
2.1. Graphing a Linear Equation
1. Yes
2. a. (2, -6) (6 , 6)
b. (0, -12) (4, 0)
3.
4.
92 | 2.5. Practice question answers
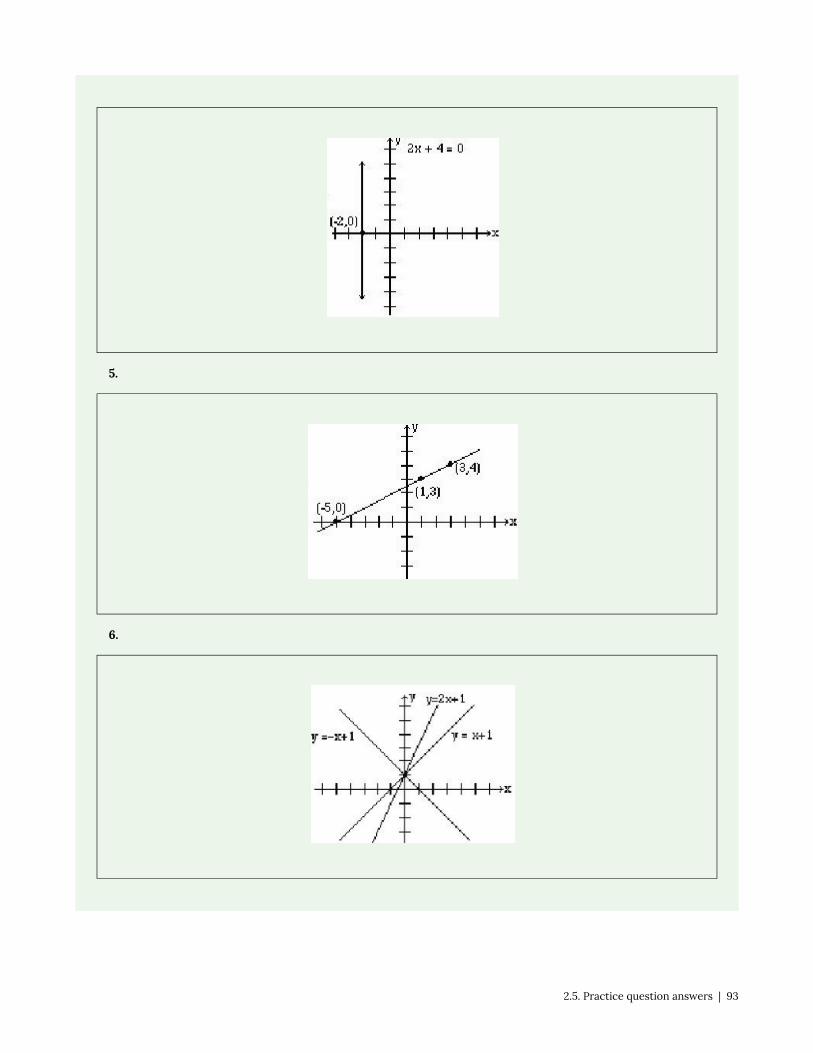
5.
6.
2.5. Practice question answers | 93

2.2. Slope of a Line
1. a. m = 2
b. m = -2
c. m = -1
2. a. m = -2
b. m =
c. m = 2
3. a.
3. b.
2.3. Equation of a Line
94 | 2.5. Practice question answers

1. a.
b.
c.
d.
e.
f.
2. a.
b.
2.4. Applications
1.
2. , pounds
3. ≈ $1,030,358
4. 45,222
5. dollars, items
6. (8250, 12375)
2.5. Practice question answers | 95


CHAPTER 3: INTRODUCTION TOFUNCTIONS
Chapter 3: Introduction to Functions | 97

3.1. Introduction to Functions
What is a Function?
The natural world is full of relationships between quantities that change. When we see theserelationships, it is natural for us to ask “If I know one quantity, can I then determine the other?”This establishes the idea of an input quantity, or independent variable, and a corresponding outputquantity, or dependent variable. From this we get the notion of a functional relationship in whichthe output can be determined from the input.
For some quantities, like height and age, there are certainly relationships between thesequantities. Given a specific person and any age, it is easy enough to determine their height, butif we tried to reverse that relationship and determine age from a given height, that would beproblematic, since most people maintain the same height for many years.
Function: A rule for a relationship between an input, or independent, quantity and an output, or
dependent, quantity in which each input value uniquely determines one output value. We say “the output is
a function of the input.”
Example 3.1.1
In the height and age example above, is height a function of age? Is age a function of height?
In the height and age example above, it would be correct to say that height is a function of age, since each
age uniquely determines a height. For example, on my 18th birthday, I had exactly one height of 69 inches.
However, age is not a function of height, since one height input might correspond with more than one output
age. For example, for an input height of 70 inches, there is more than one output of age since I was 70 inches at
the age of 20 and 21.
3.1. Introduction to Functions | 99

Example 3.1.2
At a coffee shop, the menu consists of items and their prices. Is price a function of the item? Is the item a
function of the price?
We could say that price is a function of the item, since each input of an item has one output of a price
corresponding to it. We could not say that item is a function of price, since two items might have the same
price.
Example 3.1.3
In many classes the overall percentage you earn in the course corresponds to a decimal grade point. Is
decimal grade a function of percentage? Is percentage a function of decimal grade?
For any percentage earned, there would be a decimal grade associated, so we could say that the decimal
grade is a function of percentage. That is, if you input the percentage, your output would be a decimal grade.
Percentage may or may not be a function of decimal grade, depending upon the teacher’s grading scheme. With
some grading systems, there are a range of percentages that correspond to the same decimal grade.
Function Notation
To simplify writing out expressions and equations involving functions, a simplified notation isoften used. We also use descriptive variables to help us remember the meaning of the quantitiesin the problem.
Rather than write “height is a function of age”, we could use the descriptive variable h torepresent height and we could use the descriptive variable a to represent age.
100 | 3.1. Introduction to Functions

“height is a function of age” if we name the function f we write
“h is f of a” or more simply
h = f(a) we could instead name the function h and write
h(a) which is read “h of a”
Remember we can use any variable to name the function; the notation h(a) shows us that hdepends on a. The value “a” must be put into the function “h” to get a result. Be careful – theparentheses indicate that age is input into the function (Note: do not confuse these parentheseswith multiplication!).
Function Notation: The notation output = f(input) defines a function named f. This would be read “output
is f of input”
Example 3.1.4
Introduce function notation to represent a function that takes as input the name of a month, and gives as
output the number of days in that month.
The number of days in a month is a function of the name of the month, so if we name the function f, we could
write “days = f(month)” or d = f(m). If we simply name the function d, we could write d(m)
For example, d(March) = 31, since March has 31 days. The notation d(m) reminds us that the number of days, d
(the output) is dependent on the name of the month, m (the input)
Example 3.1.5
A function N = f(y) gives the number of police officers, N, in a town in year y. What does f(2005) = 300 tell us?
When we read f(2005) = 300, we see the input quantity is 2005, which is a value for the input quantity of the
3.1. Introduction to Functions | 101
function, the year (y). The output value is 300, the number of police officers (N), a value for the output quantity.
Remember N = f(y). So this tells us that in the year 2005 there were 300 police officers in the town.
Tables as Functions
Functions can be represented in many ways: Words (as we did in the last few examples), tablesof values, graphs, or formulas. Represented as a table, we are presented with a list of input andoutput values.
In some cases, these values represent everything we know about the relationship, while in othercases the table is simply providing us a few select values from a more complete relationship.
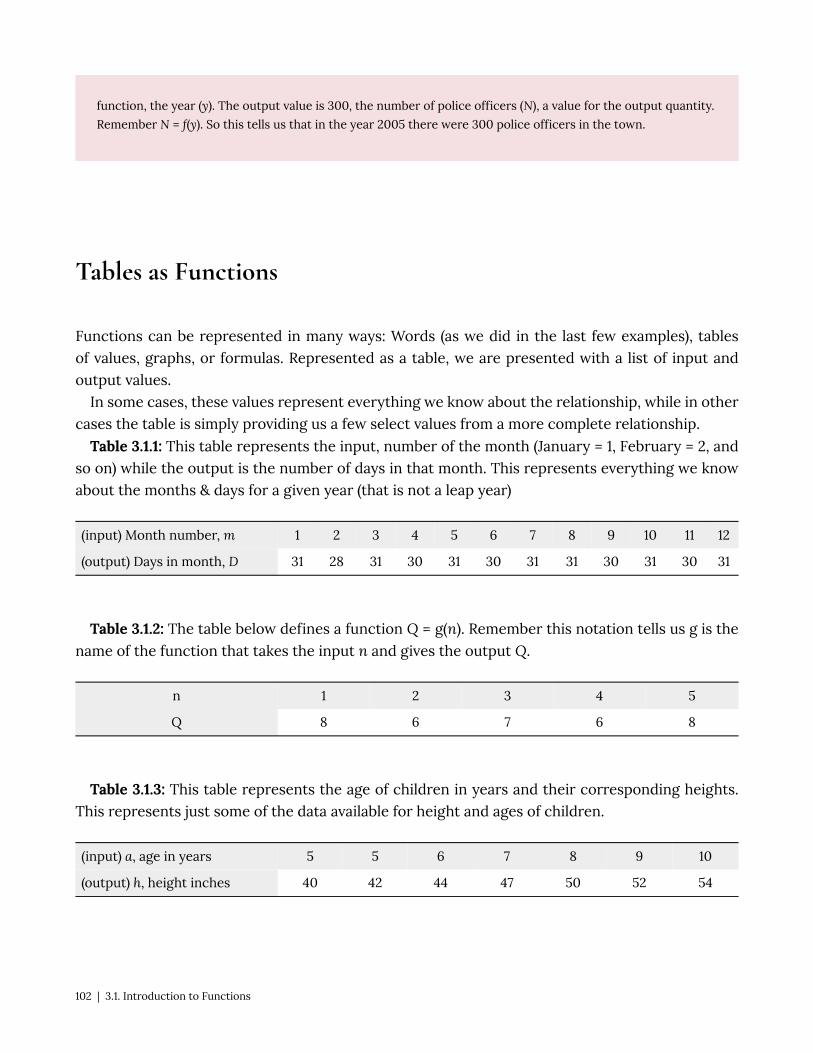
Table 3.1.1: This table represents the input, number of the month (January = 1, February = 2, andso on) while the output is the number of days in that month. This represents everything we knowabout the months & days for a given year (that is not a leap year)
(input) Month number, m 1 2 3 4 5 6 7 8 9 10 11 12
(output) Days in month, D 31 28 31 30 31 30 31 31 30 31 30 31
Table 3.1.2: The table below defines a function Q = g(n). Remember this notation tells us g is thename of the function that takes the input n and gives the output Q.
n 1 2 3 4 5
Q 8 6 7 6 8
Table 3.1.3: This table represents the age of children in years and their corresponding heights.This represents just some of the data available for height and ages of children.
(input) a, age in years 5 5 6 7 8 9 10
(output) h, height inches 40 42 44 47 50 52 54
102 | 3.1. Introduction to Functions

Example 3.1.6
Which of these tables define a function (if any)?
Input Output Input Output Input Output
2 1 -3 5 1 0
5 3 0 1 5 2
8 6 4 5 5 4
The first and second tables define functions. In both, each input corresponds to exactly one output. The
third table does not define a function since the input value of 5 corresponds with two different output values.
Solving and Evaluating Functions
When we work with functions, there are two typical things we do: evaluate and solve. Evaluatinga function is what we do when we know an input, and use the function to determine thecorresponding output. Evaluating will always produce one result, since each input of a functioncorresponds to exactly one output.
Solving equations involving a function is what we do when we know an output, and use thefunction to determine the inputs that would produce that output. Solving a function couldproduce more than one solution, since different inputs can produce the same output.
Example 3.1.7
Using the table shown, where Q = g(n)
n 1 2 3 4 5
Q 8 6 7 6 8
3.1. Introduction to Functions | 103

a) Evaluate g(3)
Evaluating g(3) (read: “g of 3”) means that we need to determine the output value, Q , of the function g given
the input value of n = 3. Looking at the table, we see the output corresponding to n = 3 is Q = 7, allowing us to
conclude g(3) = 7.
b) Solve g(n) = 6
Solving g(n) = 6 means we need to determine what input values, n , produce an output value of 6. Looking at
the table we see there are two solutions: n = 2 and n = 4.
When we input 2 into the function g, our output is Q = 6
When we input 4 into the function g, our output is also Q = 6
Graphs as Functions
Oftentimes a graph of a relationship can be used to define a function. By convention, graphs aretypically created with the input quantity along the horizontal axis and the output quantity alongthe vertical.
The most common graph has y on the vertical axis and x on the horizontal axis, and we say y isa function of x, or y = f(x) when the function is named f.
104 | 3.1. Introduction to Functions

Example 3.1.8
Which of these graphs defines a function y = f(x)?
Looking at the three graphs above, the first two define a function y = f(x), since for each input value along the
horizontal axis there is exactly one output value corresponding, determined by the y-value of the graph. The
3rd graph does not define a function y = f(x) since some input values, such as x = 2, correspond with more than
one output value.
Vertical Line Test: The vertical line test is a handy way to think about whether a graph defines the
vertical output as a function of the horizontal input. Imagine drawing vertical lines through the graph. If any
vertical line would cross the graph more than once, then the graph does not define only one vertical output
for each horizontal input.
Evaluating a function using a graph requires taking the given input and using the graph to lookup the corresponding output. Solving a function equation using a graph requires taking the givenoutput and looking on the graph to determine the corresponding input.
3.1. Introduction to Functions | 105

Example 3.1.9
Given the graph shown:
a) Evaluate f(2)
b) Solve f(x) = 4
Solution
a) To evaluate f(2), we find the input of x = 2 on the horizontal axis. Moving up to the graph gives the point (2,
1), giving an output of y = 1. So f(2) = 1.
b) To solve f(x) = 4, we find the value 4 on the vertical axis because if f(x) = 4 then 4 is the output. Moving
horizontally across the graph gives two points with the output of 4: (-1,4) and (3,4). These give the two solutions
to f(x) = 4: x = -1 or x = 3 This means f(-1) = 4 and f(3) = 4, or when the input is -1 or 3, the output is 4.
Formulas as Functions
When possible, it is very convenient to define relationships using formulas. If it is possible toexpress the output as a formula involving the input quantity, then we can define a function.
106 | 3.1. Introduction to Functions

Example 3.1.10
Express the relationship 2n + 6p = 12 as a function p = f(n) if possible.
To express the relationship in this form, we need to be able to write the relationship where p is a function of
n, which means writing it as p = [something involving n].
subtract 2n from both sides
divide both sides by 6 and simplify
Having rewritten the formula as p =, we can now express p as a function:
It is important to note that not every relationship can be expressed as a function with a formula.Note the important feature of an equation written as a function is that the output value can
be determined directly from the input by doing evaluations – no further solving is required.This allows the relationship to act as a magic box that takes an input, processes it, and returnsan output. Modern technology and computers rely on these functional relationships, since theevaluation of the function can be programmed into machines, whereas solving things is muchmore challenging.
As with tables and graphs, it is common to evaluate and solve functions involving formulas.Evaluating will require replacing the input variable in the formula with the value provided andcalculating. Solving will require replacing the output variable in the formula with the valueprovided, and solving for the input(s) that would produce that output.
Example 3.1.11
Given the function k(t) = t3 + 2:
a) Evaluate k(2)
b) Solve k(t) = 1
Solution
3.1. Introduction to Functions | 107

a) To evaluate k(2), we plug in the input value 2 into the formula wherever we see the input variable t, then
simplify
k(2) = 23 + 2
k(2) = 8 + 2
So k(2) = 10
b) To solve k(t) = 1, we set the formula for k(t) equal to 1, and solve for the input value that will produce that
output
k(t) = 1 substitute the original formula k(t) = t3 + 2
t3 + 2 = 1 subtract 2 from each side
t3 = -1 take the cube root of each side
t = -1
When solving an equation using formulas, you can check your answer by using your solution in the original
equation to see if your calculated answer is correct.
We want to know if k(t) = 1 is true when t = -1.
k(-1) = (-1)3 + 2
= -1 + 2
= 1 which was the desired result.
Example 3.1.12
Given the function h(p) = p2 + 2p
a) Evaluate h(4)
b) Solve h(p) = 3
Solution
To evaluate h(4) we substitute the value 4 for the input variable p in the given function.
a) h(4) = (4)2 + 2(4)
= 16 + 8
= 24
b) h(p) = 3 Substitute the original function h(p) = p2 + 2p
p2 + 2p = 3 This is quadratic, so we can rearrange the equation to get it = 0
108 | 3.1. Introduction to Functions

p2 + 2p – 3 = 0 subtract 3 from each side
p2 + 2p – 3 = 0 this is factorable, so we factor it
(p + 3)(p – 1) = 0
By the zero factor theorem since (p + 3)(p – 1) = 0, either (p + 3) = 0 or (p – 1) = 0 (or both of them equal 0) and
so we solve both equations for p, finding p = -3 from the first equation and p = 1 from the second equation.
This gives us the solution: h(p) = 3 when p = 1 or p = -3.
Practice questions
1. Is your balance a function of your bank account number? (If you input a bank account numberdoes it make sense that the output is your balance?)
2. Is your bank account number a function of your balance? (If you input a balance does it makesense that the output is your bank account number?)
3. If each percentage earned translated to one letter grade, would this be a function?
4. Using the function from Example 3.1.7, evaluate g(4).
5. Using the graph from Example 3.1.9, solve f(x)=1.
6. Given the function :
a. Evaluate g(5)
b. Solve g(m) = 2
3.1. Introduction to Functions | 109
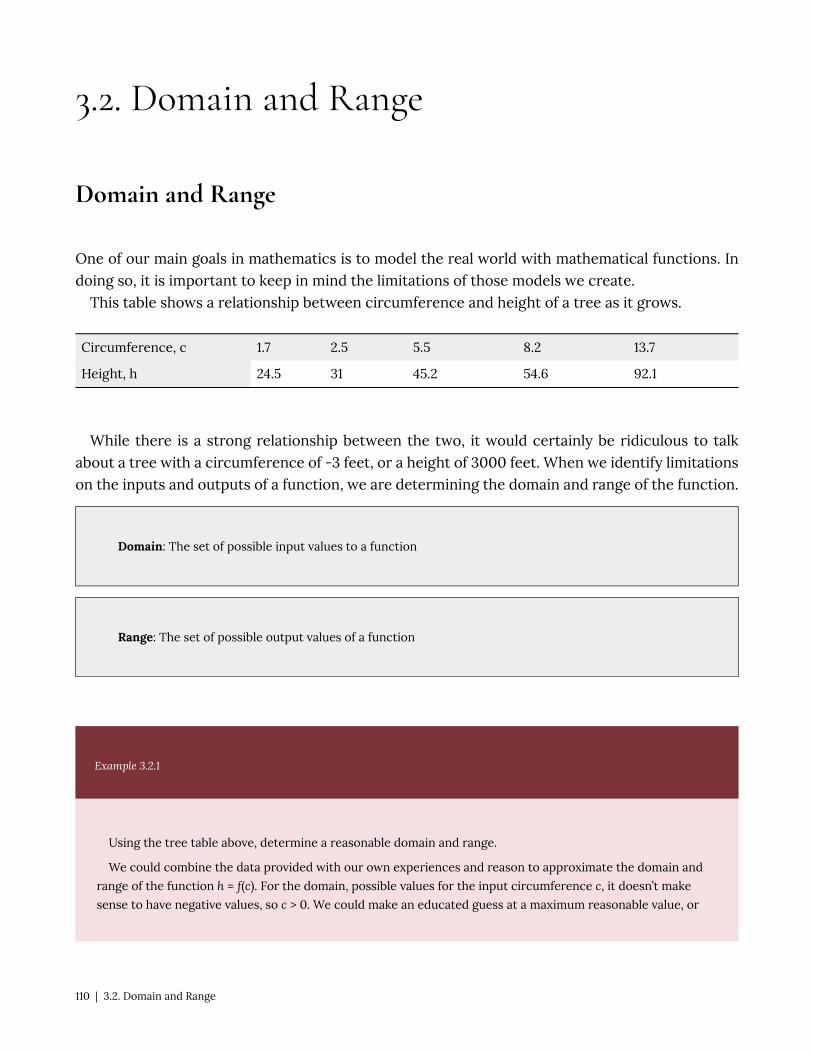
3.2. Domain and Range
Domain and Range
One of our main goals in mathematics is to model the real world with mathematical functions. Indoing so, it is important to keep in mind the limitations of those models we create.
This table shows a relationship between circumference and height of a tree as it grows.
Circumference, c 1.7 2.5 5.5 8.2 13.7
Height, h 24.5 31 45.2 54.6 92.1
While there is a strong relationship between the two, it would certainly be ridiculous to talkabout a tree with a circumference of -3 feet, or a height of 3000 feet. When we identify limitationson the inputs and outputs of a function, we are determining the domain and range of the function.
Domain: The set of possible input values to a function
Range: The set of possible output values of a function
Example 3.2.1
Using the tree table above, determine a reasonable domain and range.
We could combine the data provided with our own experiences and reason to approximate the domain and
range of the function h = f(c). For the domain, possible values for the input circumference c, it doesn’t make
sense to have negative values, so c > 0. We could make an educated guess at a maximum reasonable value, or
110 | 3.2. Domain and Range

look up that the maximum circumference measured is about 119 feet. With this information we would say a
reasonable domain is 0 < c ≤ 119 feet.
Similarly for the range, it doesn’t make sense to have negative heights, and the maximum height of a tree
could be looked up to be 379 feet, so a reasonable range is 0 < h ≤ 379 feet.
Example 3.2.2
When sending a letter through the United States Postal Service, the price depends upon the weight of the
letter, as shown in the table below. Determine the domain and range.
Letters
Weight not Over Price
1 ounce $0.44
2 ounces $0.61
3 ounces $0.78
3.5 ounces $0.95
Suppose we notate Weight by w and Price by p, and set up a function named P, where Price, p is a function of
Weight, w. p = P(w).
Since acceptable weights are 3.5 ounces or less, and negative weights don’t make sense, the domain would be
0 < w ≤ 3.5. Technically 0 could be included in the domain, but logically it would mean we are mailing nothing,
so it doesn’t hurt to leave it out.
Since possible prices are from a limited set of values, we can only define the range of this function by listing
the possible values. The range is p = $0.44, $0.61, $0.78, or $0.95.
Notation
In the previous examples, we used inequalities to describe the domain and range of the functions.This is one way to describe intervals of input and output values, but is not the only way.
3.2. Domain and Range | 111
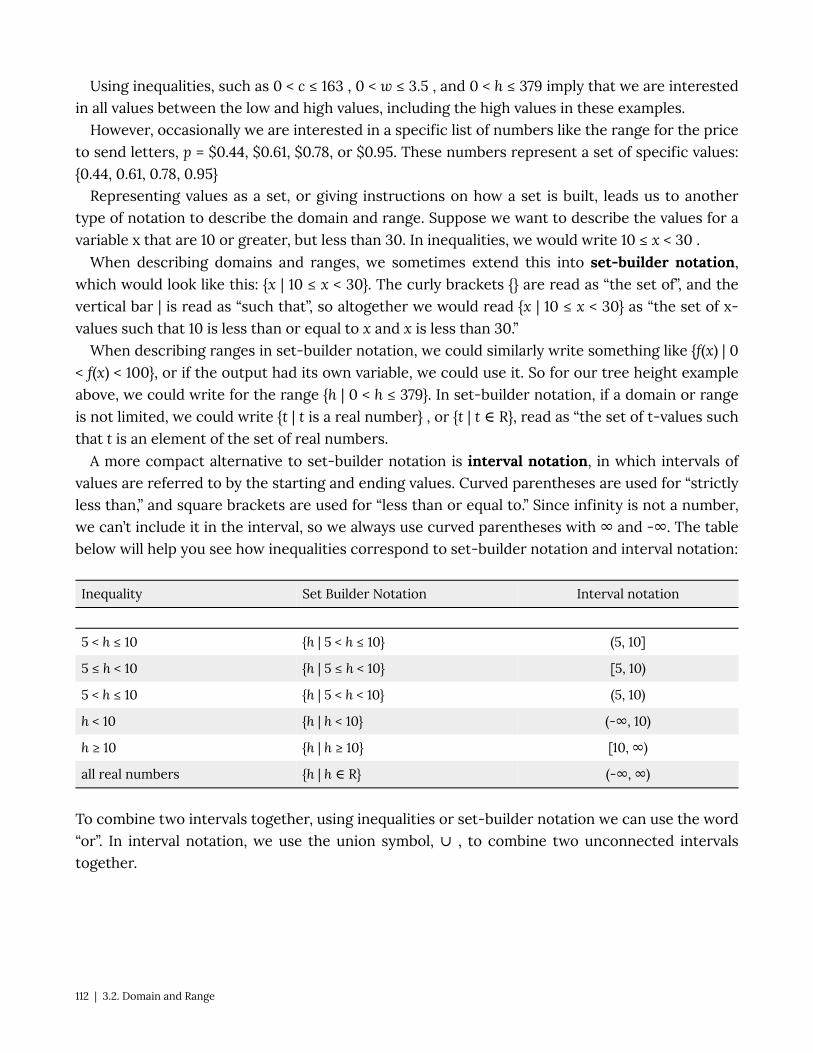
Using inequalities, such as 0 < c ≤ 163 , 0 < w ≤ 3.5 , and 0 < h ≤ 379 imply that we are interestedin all values between the low and high values, including the high values in these examples.
However, occasionally we are interested in a specific list of numbers like the range for the priceto send letters, p = $0.44, $0.61, $0.78, or $0.95. These numbers represent a set of specific values:{0.44, 0.61, 0.78, 0.95}
Representing values as a set, or giving instructions on how a set is built, leads us to anothertype of notation to describe the domain and range. Suppose we want to describe the values for avariable x that are 10 or greater, but less than 30. In inequalities, we would write 10 ≤ x < 30 .
When describing domains and ranges, we sometimes extend this into set-builder notation,which would look like this: {x | 10 ≤ x < 30}. The curly brackets {} are read as “the set of”, and thevertical bar | is read as “such that”, so altogether we would read {x | 10 ≤ x < 30} as “the set of x-values such that 10 is less than or equal to x and x is less than 30.”
When describing ranges in set-builder notation, we could similarly write something like {f(x) | 0< f(x) < 100}, or if the output had its own variable, we could use it. So for our tree height exampleabove, we could write for the range {h | 0 < h ≤ 379}. In set-builder notation, if a domain or rangeis not limited, we could write {t | t is a real number} , or {t | t ∈ R}, read as “the set of t-values suchthat t is an element of the set of real numbers.
A more compact alternative to set-builder notation is interval notation, in which intervals ofvalues are referred to by the starting and ending values. Curved parentheses are used for “strictlyless than,” and square brackets are used for “less than or equal to.” Since infinity is not a number,we can’t include it in the interval, so we always use curved parentheses with ∞ and -∞. The tablebelow will help you see how inequalities correspond to set-builder notation and interval notation:
Inequality Set Builder Notation Interval notation
5 < h ≤ 10 {h | 5 < h ≤ 10} (5, 10]
5 ≤ h < 10 {h | 5 ≤ h < 10} [5, 10)
5 < h ≤ 10 {h | 5 < h < 10} (5, 10)
h < 10 {h | h < 10} (-∞, 10)
h ≥ 10 {h | h ≥ 10} [10, ∞)
all real numbers {h | h ∈ R} (-∞, ∞)
To combine two intervals together, using inequalities or set-builder notation we can use the word“or”. In interval notation, we use the union symbol, ∪ , to combine two unconnected intervalstogether.
112 | 3.2. Domain and Range

Example 3.2.3
Describe the intervals of values shown on the line graph below using set builder and interval notations.
To describe the values, x , that lie in the intervals shown above we would say, “x is a real number greater than
or equal to 1 and less than or equal to 3, or a real number greater than 5.”
As an inequality it is: 1 ≤ x ≤ 3 or x > 5.
In set builder notation: {x | 1 ≤ x ≤ 3 or x > 5}.
In interval notation: [1, 3] ∪ (5, ∞).
Remember when writing or reading interval notation: using a square bracket [ means the startvalue is included in the set; using a parenthesis ( means the start value is not included in the set.
Domain and Range from Graphs
We can also talk about domain and range based on graphs. Since domain refers to the set ofpossible input values, the domain of a graph consists of all the input values shown on the graph.Remember that input values are almost always shown along the horizontal axis of the graph.Likewise, since range is the set of possible output values, the range of a graph we can see from thepossible values along the vertical axis of the graph.
Be careful – if the graph continues beyond the window on which we can see the graph, thedomain and range might be larger than the values we can see.
Example 3.2.4
3.2. Domain and Range | 113

Determine the domain and range of the graph below:
In the graph above, the input quantity along the horizontal axis appears to be “year”, which we could notate
with the variable y. The output is “thousands of barrels of oil per day”, which we might notate with the variable
b, for barrels. The graph would likely continue to the left and right beyond what is shown, but based on the
portion of the graph that is shown to us, we can determine the domain is 1975 ≤ y ≤ 2008 , and the range is
approximately 180 ≤ b ≤ 2010 .
In interval notation, the domain would be [1975, 2008] and the range would be about [180, 2010]. For the
range, we have to approximate the smallest and largest outputs since they don’t fall exactly on the grid lines.
Remember that, as in the previous example, x and y are not always the input and outputvariables. Using descriptive variables is an important tool to remembering the context of theproblem.
Domain and Range from Formulas
Most basic formulas can be evaluated at an input. Two common restrictions are:
114 | 3.2. Domain and Range

• The square root of negative values is non-real.• We cannot divide by zero.
Example 3.2.5
Find the domain of each function:
a)
b)
Solution
a) Since we cannot take the square root of a negative number, we need the inside of the square root to be
non-negative.
x + 4 ≥ 0 when x ≥ -4.
The domain of f(x) is [-4, ∞).
b) We cannot divide by zero, so we need the denominator to be non-zero.
6 – 3x = 0 when x = 2, so we must exclude 2 from the domain.
The domain of g(x) is (-∞, 2) ∪ (2, ∞).
Piecewise Functions
Some functions cannot be described by a single formula.
Piecewise Function: A piecewise function is a function in which the formula used depends upon the
domain the input lies in. We notate this concept as:
3.2. Domain and Range | 115

Example 3.2.6
A museum charges $5 per person for a guided tour with a group of 1 to 9 people, or a fixed $50 fee for 10 or
more people in the group. Set up a function relating the number of people, n, to the cost, C.
To set up this function, two different formulas would be needed. C = 5n would work for n values under 10,
and C = 50 would work for values of n ten or greater. Notating this:
Example 3.2.7
A cell phone company uses the function below to determine the cost, C, in dollars for g gigabytes of data
transfer.
Find the cost of using 1.5 gigabytes of data, and the cost of using 4 gigabytes of data.
To find the cost of using 1.5 gigabytes of data, C(1.5), we first look to see which piece of domain our input falls
in. Since 1.5 is less than 2, we use the first formula, giving C(1.5) = $25.
The find the cost of using 4 gigabytes of data, C(4), we see that our input of 4 is greater than 2, so we’ll use
the second formula. C(4) = 25 + 10(4 – 2) = $45.
116 | 3.2. Domain and Range

Example 3.2.8
Sketch a graph of the function 4\\ \end{cases}" title="Rendered by
QuickLaTeX.com" height="79" width="256" style="vertical-align: -35px;">
We can imagine graphing each function, then limiting the graph to the indicated domain. At the endpoints of
the domain, we put open circles to indicate where the endpoint is not included, due to a strictly-less-than
inequality, and a closed circle where the endpoint is included, due to a less-than-or-equal-to inequality. The
first and last parts are constant functions, where the output is the same for all inputs. The middle part we
might recognize as a line, and could graph by evaluating the function at a couple inputs and connecting the
points with a line.
Now that we have each piece individually, we combine them onto the same graph. When the first and second
parts meet at x = 1, we can imagine the closed dot filling in the open dot. Since there is no break in the graph,
there is no need to show the dot.
3.2. Domain and Range | 117

Practice questions
1. The population of a small town in the year 1960 was 100 people. Since then the population hasgrown to 1400 people reported during the 2010 census. Choose descriptive variables for your inputand output and use interval notation to write the domain and range.
2. Given the following interval, write its meaning in words, set builder notation, and intervalnotation.
3. Given the graph below write the domain and range in interval notation.
118 | 3.2. Domain and Range
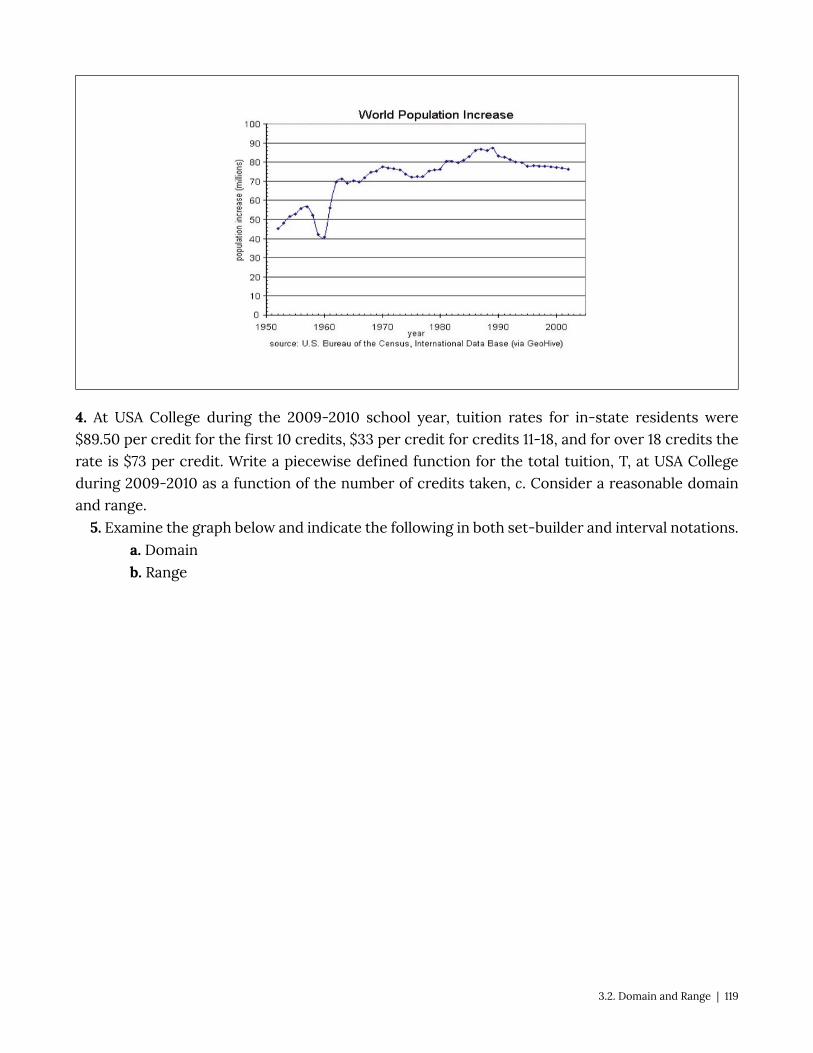
4. At USA College during the 2009-2010 school year, tuition rates for in-state residents were$89.50 per credit for the first 10 credits, $33 per credit for credits 11-18, and for over 18 credits therate is $73 per credit. Write a piecewise defined function for the total tuition, T, at USA Collegeduring 2009-2010 as a function of the number of credits taken, c. Consider a reasonable domainand range.
5. Examine the graph below and indicate the following in both set-builder and interval notations.
a. Domain
b. Range
3.2. Domain and Range | 119

120 | 3.2. Domain and Range

3.3. Rates of Change and Behaviour ofGraphs
Rates of Change and Behaviour of Graphs
Since functions represent how an output quantity varies with an input quantity, it is natural to askabout the rate at which the values of the function are changing.
For example, the function C(t) below gives the average cost, in dollars, of a gallon of gasoline tyears after 2000.
t 2 3 4 5 6 7 8 9
C(t) 1.47 1.69 1.94 2.30 2.51 2.64 3.01 2.14
If we were interested in how the gas prices had changed between 2002 and 2009, we couldcompute that the cost per gallon had increased from $1.47 to $2.14, an increase of $0.67. While thisis interesting, it might be more useful to look at how much the price changed per year. You areprobably noticing that the price didn’t change the same amount each year, so we would be finding
the average rate of change over a specified amount of time.The gas price increased by $0.67 from 2002 to 2009, over 7 years, for an average of
dollars per year. On average, the price of gas increased by about 9.6 cents each
year.
Rate of change: Describes how the output quantity changes in relation to the input quantity. The units on
a rate of change are “output units per input units”.
Some other examples of rates of change include:
• A population of rats increases by 40 rats per week• A barista earns $9 per hour (dollars per hour)• A farmer plants 60,000 onions per acre• A car can drive 27 miles per gallon
3.3. Rates of Change and Behaviour of Graphs | 121

• A population of grey whales decreases by 8 whales per year• The amount of money in your university account decreases by $4,000 per quarter
Average rate of change: The average rate of change between two input values is the total change of the
function values (output values) divided by the change in the input values.
Average rate of change =
Example 3.3.1
Using the cost-of-gas function from earlier, find the average rate of change between 2007 and 2009
From the table, in 2007 the cost of gas was $2.64. In 2009 the cost was $2.14.
The input (years) has changed by 2. The output has changed by $2.14 – $2.64 = -0.50. The average rate of
change is then dollars per year
Notice that in the last example the change of output was negative since the output value of thefunction had decreased. Correspondingly, the average rate of change is negative.
Example 3.3.2
Given the function g(t) shown here, find the average rate of change on the interval [0, 3].
122 | 3.3. Rates of Change and Behaviour of Graphs

At t = 0, the graph shows g(0) = 1
At t = 3, the graph shows g(3) = 4
The output has changed by 3 while the input has changed by 3, giving an average rate of change of:
Example 3.3.3
On a road trip, after picking up your friend who lives 16 km away, you decide to record your distance from
home over time. Find your average speed over the first 6 hours.
t (hours) 0 1 2 3 4 5 6 7
D(t) (km) 16 95 170 265 364 432 538 625
Here, your average speed is the average rate of change.
You traveled 538 km in 6 hours, for an average speed of:
km per hour.
3.3. Rates of Change and Behaviour of Graphs | 123
We can more formally state the average rate of change calculation using function notation.
Average rate of change using function notation: Given a function f(x), the average rate of change on the
interval [a, b] is
Average rate of change =
Example 3.3.4
Compute the average rate of change of on the interval [2, 4].
We can start by computing the function values at each endpoint of the interval:
Now computing the average rate of change:
Average rate of change =
Example 3.3.5
The magnetic force F, measured in Newtons, between two magnets is related to the distance between the
magnets d, in centimetres, by the formula . Find the average rate of change of force if the
distance between the magnets is increased from 2 cm to 6 cm.
We are computing the average rate of change of on the interval [2, 6]
124 | 3.3. Rates of Change and Behaviour of Graphs

Average rate of change = Evaluating the function
Simplifying
Combining the numerator terms
Simplifying further
Newtons per centimetre
This tells us the magnetic force decreases, on average, by 1/9 Newtons per centimetre over this interval.
Graphical Behaviour of Functions
As part of exploring how functions change, it is interesting to explore the graphical behaviour offunctions.
Increasing/decreasing:
A function is increasing on an interval if the function values increase as the inputs increase. More
formally, a function is increasing if f(b) > f(a) for any two input values a and b in the interval with b > a. The
average rate of change of an increasing function is positive.
A function is decreasing on an interval if the function values decrease as the inputs increase. More
formally, a function is decreasing if f(b) < f(a) for any two input values a and b in the interval with b>a. The
average rate of change of a decreasing function is negative.
Example 3.3.6
3.3. Rates of Change and Behaviour of Graphs | 125
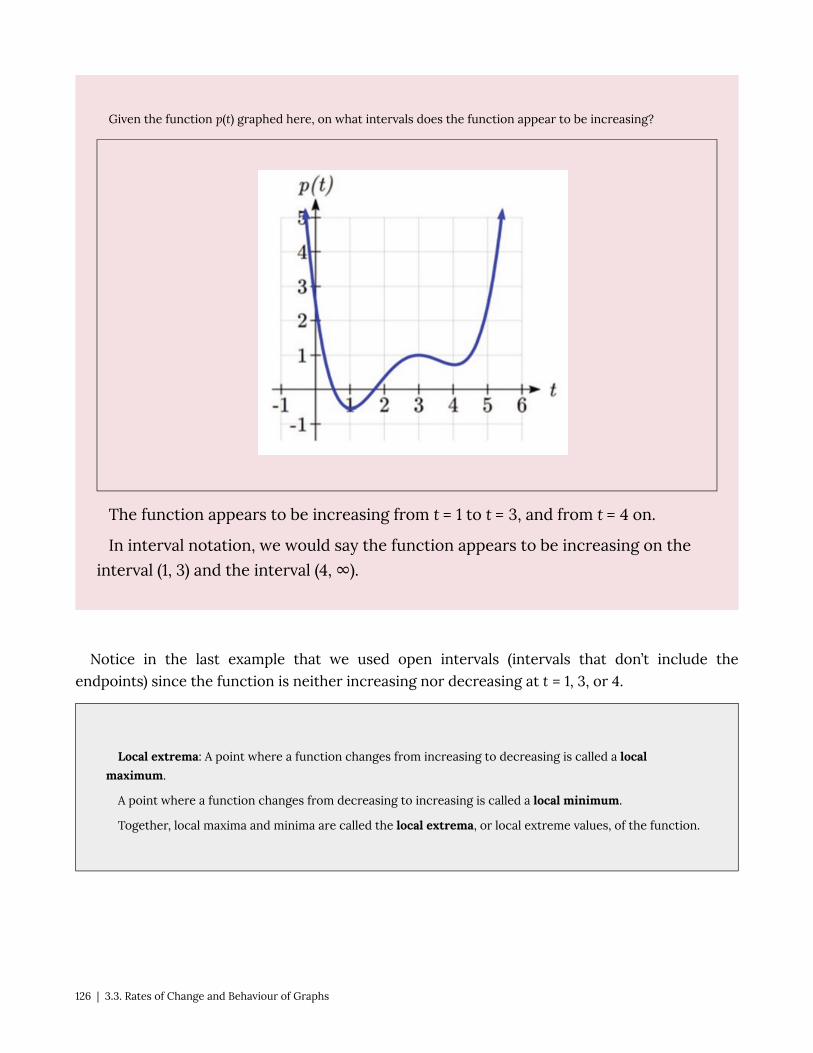
Given the function p(t) graphed here, on what intervals does the function appear to be increasing?
The function appears to be increasing from t = 1 to t = 3, and from t = 4 on.
In interval notation, we would say the function appears to be increasing on the
interval (1, 3) and the interval (4, ∞).
Notice in the last example that we used open intervals (intervals that don’t include theendpoints) since the function is neither increasing nor decreasing at t = 1, 3, or 4.
Local extrema: A point where a function changes from increasing to decreasing is called a localmaximum.
A point where a function changes from decreasing to increasing is called a local minimum.
Together, local maxima and minima are called the local extrema, or local extreme values, of the function.
126 | 3.3. Rates of Change and Behaviour of Graphs
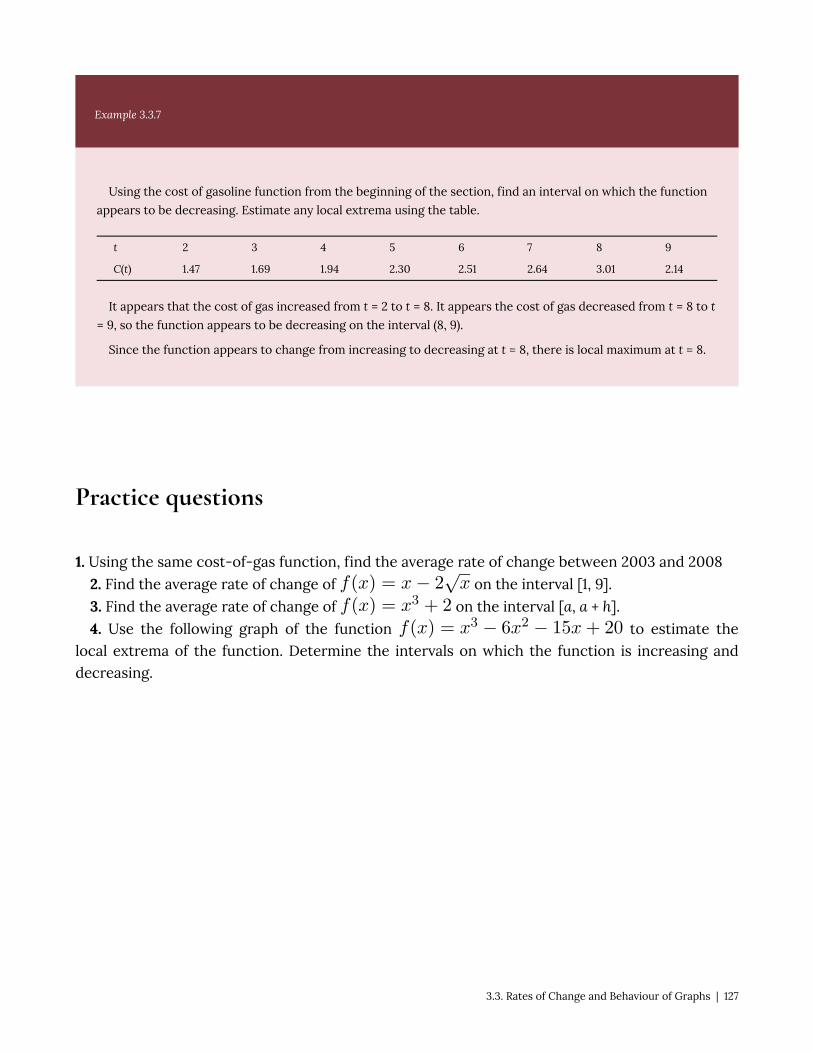
Example 3.3.7
Using the cost of gasoline function from the beginning of the section, find an interval on which the function
appears to be decreasing. Estimate any local extrema using the table.
t 2 3 4 5 6 7 8 9
C(t) 1.47 1.69 1.94 2.30 2.51 2.64 3.01 2.14
It appears that the cost of gas increased from t = 2 to t = 8. It appears the cost of gas decreased from t = 8 to t
= 9, so the function appears to be decreasing on the interval (8, 9).
Since the function appears to change from increasing to decreasing at t = 8, there is local maximum at t = 8.
Practice questions
1. Using the same cost-of-gas function, find the average rate of change between 2003 and 2008
2. Find the average rate of change of on the interval [1, 9].
3. Find the average rate of change of on the interval [a, a + h].
4. Use the following graph of the function to estimate thelocal extrema of the function. Determine the intervals on which the function is increasing anddecreasing.
3.3. Rates of Change and Behaviour of Graphs | 127

5. Examine the graph below and answer the following questions.
a. What is the average rate of change over the time period of the graph?
b. How many local extrema occurred?
c. In what years did local maxima occur?
128 | 3.3. Rates of Change and Behaviour of Graphs

3.3. Rates of Change and Behaviour of Graphs | 129
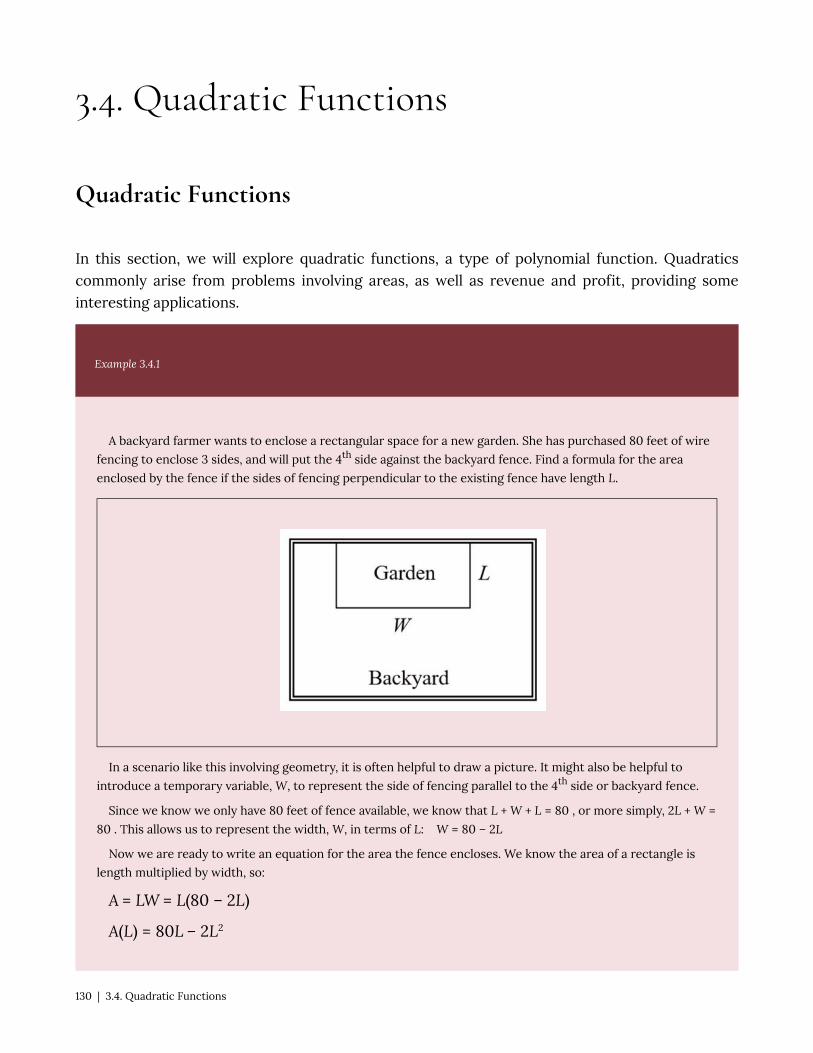
3.4. Quadratic Functions
Quadratic Functions
In this section, we will explore quadratic functions, a type of polynomial function. Quadraticscommonly arise from problems involving areas, as well as revenue and profit, providing someinteresting applications.
Example 3.4.1
A backyard farmer wants to enclose a rectangular space for a new garden. She has purchased 80 feet of wire
fencing to enclose 3 sides, and will put the 4th side against the backyard fence. Find a formula for the area
enclosed by the fence if the sides of fencing perpendicular to the existing fence have length L.
In a scenario like this involving geometry, it is often helpful to draw a picture. It might also be helpful to
introduce a temporary variable, W, to represent the side of fencing parallel to the 4th side or backyard fence.
Since we know we only have 80 feet of fence available, we know that L + W + L = 80 , or more simply, 2L + W =
80 . This allows us to represent the width, W, in terms of L: W = 80 – 2L
Now we are ready to write an equation for the area the fence encloses. We know the area of a rectangle is
length multiplied by width, so:
A = LW = L(80 – 2L)
A(L) = 80L – 2L2
130 | 3.4. Quadratic Functions

This formula represents the area of the fence in terms of the variable length L.
Short Run Behaviour: Vertex
We now explore the interesting features of the graphs of quadratics. In addition to intercepts,
quadratics have an interesting feature where they change direction, called the vertex.
The standard form for a quadratic is , but you will often see them
written in the form . To see why, consider this example.
Example 3.4.2
Sketch a graph of :
We can create a table of values, which we can use to plot several points and
connect them with a smooth curve.
3.4. Quadratic Functions | 131
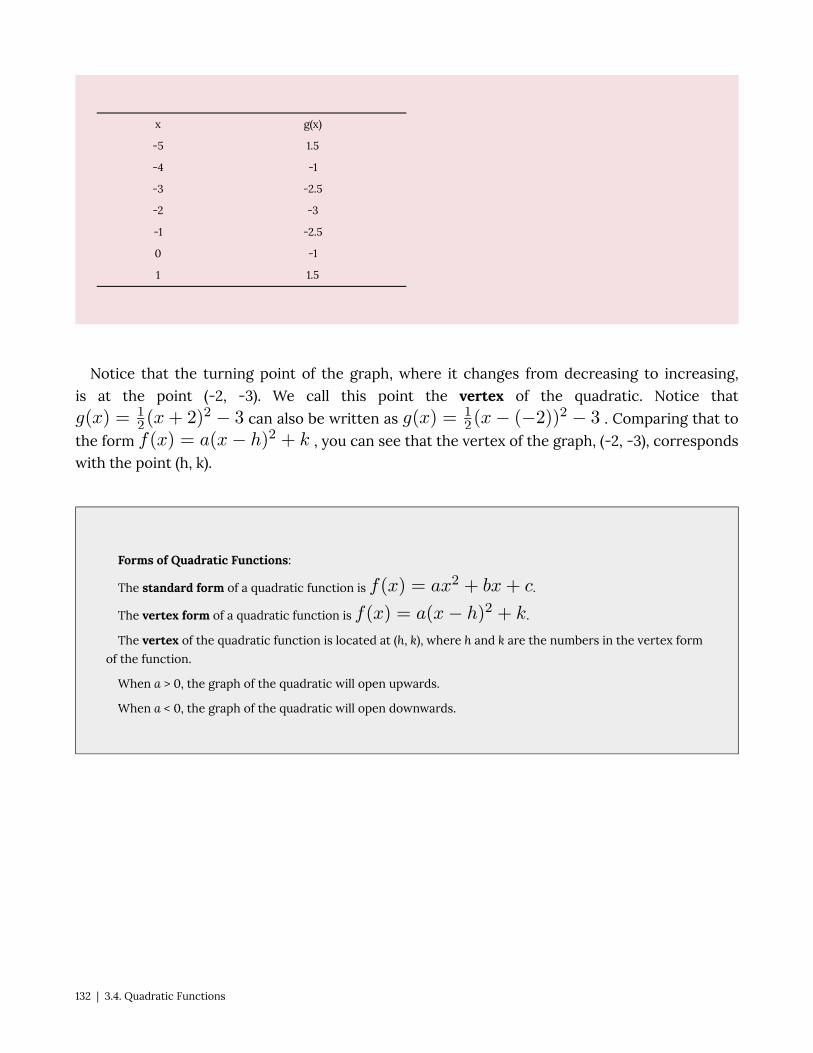
x g(x)
-5 1.5
-4 -1
-3 -2.5
-2 -3
-1 -2.5
0 -1
1 1.5
Notice that the turning point of the graph, where it changes from decreasing to increasing,
is at the point (-2, -3). We call this point the vertex of the quadratic. Notice that
can also be written as . Comparing that to
the form , you can see that the vertex of the graph, (-2, -3), correspondswith the point (h, k).
Forms of Quadratic Functions:
The standard form of a quadratic function is .
The vertex form of a quadratic function is .
The vertex of the quadratic function is located at (h, k), where h and k are the numbers in the vertex form
of the function.
When a > 0, the graph of the quadratic will open upwards.
When a < 0, the graph of the quadratic will open downwards.
132 | 3.4. Quadratic Functions

a > 0a < 0
Example 3.4.3
Write in standard form.
To write this in standard polynomial form, we could expand the formula and simplify terms:
3.4. Quadratic Functions | 133

In the previous example, we saw that it is possible to rewrite a quadratic function given in vertexform and rewrite it in standard form by expanding the formula. It would be useful to reverse thisprocess, since the transformation form reveals the vertex.
Finding the vertex of a quadratic: for a quadratic given in standard form, the vertex (h, k) islocated at:
,
Example 3.4.4
Find the vertex of the quadratic . Rewrite the quadratic into vertex form.
The horizontal coordinate of the vertex will be at
The vertical coordinate of the vertex will be at
Rewriting into vertex form, the value of a will remain the same as in the original quadratic.
In addition to enabling us to more easily graph a quadratic written in standard form, finding thevertex serves another important purpose – it allows us to determine the maximum or minimumvalue of the function, depending on which way the graph opens.
Example 3.4.5
Returning to our backyard farmer from the beginning of the section, what dimensions should she make her
garden to maximize the enclosed area?
Earlier we determined the area she could enclose with 80 feet of fencing on three sides was given by the
equation A(L) = 80L – 2L2 . Notice that quadratic has been vertically reflected, since the coefficient on the
squared term is negative, so the graph will open downwards, and the vertex will be a maximum value for the
area.
In finding the vertex, we know that a is the coefficient on the squared term, so a = -2, b = 80, and c = 0.
Finding the vertex: ,
134 | 3.4. Quadratic Functions

The maximum value of the function is an area of 800 square feet, which occurs when L = 20 feet. When the
shorter sides are 20 feet, that leaves 40 feet of fencing for the longer side. To maximize the area, she should
enclose the garden so the two shorter sides have length 20 feet, and the longer side parallel to the existing
fence has length 40 feet.
Short run Behavior: Intercepts
As with any function, we can find the vertical intercepts of a quadratic by evaluating the functionat an input of zero, and we can find the horizontal intercepts by solving for when the output willbe zero. Notice that depending upon the location of the graph, we might have zero, one, or twohorizontal intercepts.
zero horizontal intercepts one horizontal intercept
We can determine the vertical and horizontal intercepts of a quadratic using the quadraticformula.
3.4. Quadratic Functions | 135

Quadratic formula: for a quadratic function given in standard form , the
quadratic formula gives the horizontal intercepts of the graph of this function.
Example 3.4.6
A ball is thrown upwards from the top of a 40 foot high building at a speed of 80 feet per second. The ball’s
height above ground can be modeled by the equation
.
What is the maximum height of the ball?
When does the ball hit the ground?
To find the maximum height of the ball, we would need to know the vertex of the quadratic.
The ball reaches a maximum height of 140 feet after 2.5 seconds.
To find when the ball hits the ground, we need to determine when the height is zero – when H(t) = 0. While
we could do this using the transformation form of the quadratic, we can also use the quadratic formula:
Since the square root does not simplify nicely, we can use a calculator to approximate the values of the
solutions:
or
The second answer is outside the reasonable domain of our model, so we conclude the ball will hit the
ground after about 5.458 seconds.
Example 3.4.7
136 | 3.4. Quadratic Functions

The supply for a certain product can be modeled by and the demand can be modeled by
, where p is the price in dollars, and q is the quantity in thousands of items. Find the
equilibrium price and quantity.
Recall that the equilibrium price and quantity is found by finding where the supply and demand curve
intersect. We can find that by setting the equations equal:
Add 2q2 to both sides
Divide by 5 on both sides
Take the square root of both sides
Since it doesn’t make sense to talk about negative quantities, the equilibrium quantity is q = 18. To find the
equilibrium price, we evaluate either function at the equilibrium quantity.
The equilibrium is 18 thousand items, at a price of $972.
Practice questions
1. A coordinate grid has been superimposed over the quadratic path of a basketball. Find anequation for the path of the ball. Does he make the basket?
3.4. Quadratic Functions | 137

2. Write in standard form and then in vertex form.
3. For these two equations determine if the vertex will be a maximum value or a minimum value.
a.b.
4. Rewrite the following equation in vertex form: .
5. A new start-up company has determined that their daily profits, P, from selling x boxes of
N95 particulate respirator masks is given by: . In this scenario,what would be the company’s maximum daily profit?
6. A ball is thrown from the top of a 35 m tall building at a speed of 24.5 m per second. The ball’s
height above ground can be modelled by the equation: .
a. What is the maximum height of the ball?
b. When does it hit the ground?
138 | 3.4. Quadratic Functions

3.5. Practice question answers
Chapter 3 practice question answers
3.1. Introduction to Functions
1. Yes
2. No
3. Yes
4. Q = g(4) = 6
5. x = 0 or x = 2
6. a. g(5) = 1
b. m = 8
3.2. Domain and Range
1. Domain; y = years [1960,2010] ; Range, p = population, [100,1400]
2. a. Values that are less than or equal to -2, or values that are greater than or equal to -1 and less than 3
b. {x | x ≤ -2 or -1 ≤ x < 3}
c. (-∞, -2] ∪ [-1, 3)
3. Domain; y = years, [1952,2002] ; Range, p = population in millions, [40,88]
4.
3.5. Practice question answers | 139
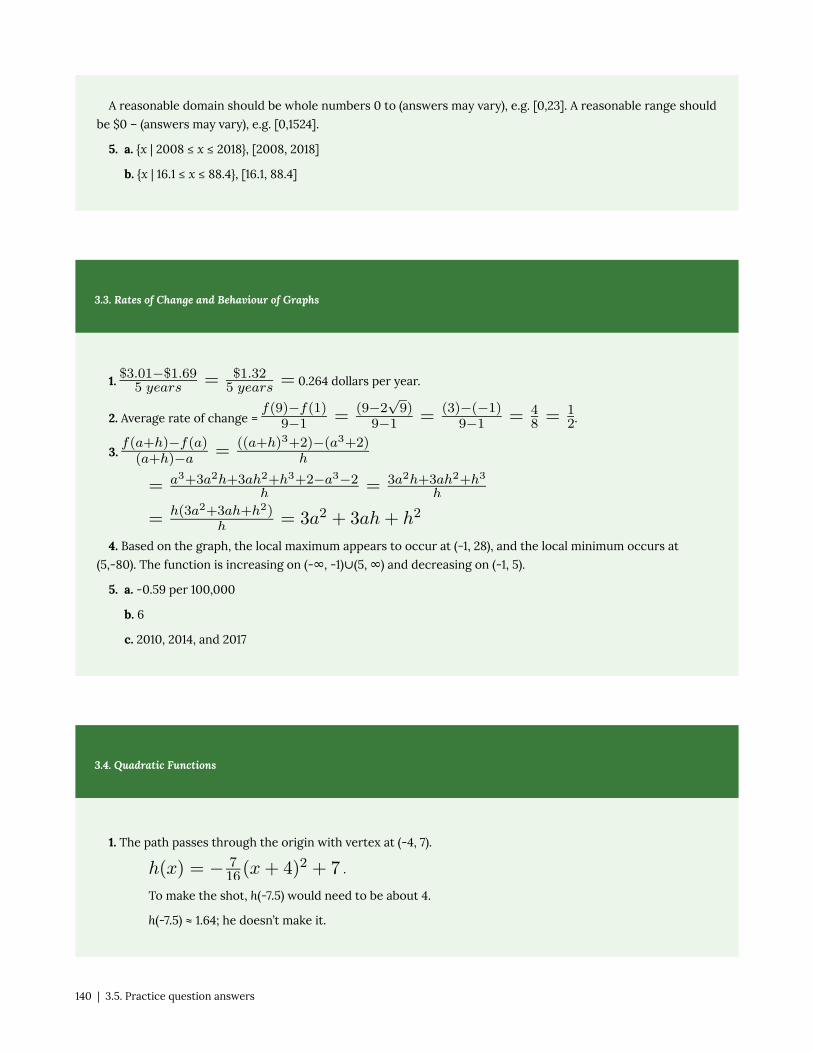
A reasonable domain should be whole numbers 0 to (answers may vary), e.g. [0,23]. A reasonable range should
be $0 – (answers may vary), e.g. [0,1524].
5. a. {x | 2008 ≤ x ≤ 2018}, [2008, 2018]
b. {x | 16.1 ≤ x ≤ 88.4}, [16.1, 88.4]
3.3. Rates of Change and Behaviour of Graphs
1. 0.264 dollars per year.
2. Average rate of change = .
3.
4. Based on the graph, the local maximum appears to occur at (-1, 28), and the local minimum occurs at
(5,-80). The function is increasing on (-∞, -1)∪(5, ∞) and decreasing on (-1, 5).
5. a. -0.59 per 100,000
b. 6
c. 2010, 2014, and 2017
3.4. Quadratic Functions
1. The path passes through the origin with vertex at (-4, 7).
.
To make the shot, h(-7.5) would need to be about 4.
h(-7.5) ≈ 1.64; he doesn’t make it.
140 | 3.5. Practice question answers

2. in standard form; in vertex form.
3. a. Vertex is a minimum value (opens upwards).
b. Vertex is a maximum value (opens downwards).
4.
5. $5387.50
6. a. m
b. sec
3.5. Practice question answers | 141


CHAPTER 4: EXPONENTIAL ANDLOGARITHMIC FUNCTIONS
Chapter 4: Exponential and Logarithmic Functions | 143

4.1. Exponential Functions
Exponential Functions
India is the second most populous country in the world, with a population in 2008 of about 1.14billion people. The population is growing by about 1.34% each year. We might ask if we can find aformula to model the population, P, as a function of time, t, in years after 2008, if the populationcontinues to grow at this rate.
In linear growth, we had a constant rate of change – a constant number that the outputincreased for each increase in input. For example, in the equation , the slope tellsus the output increases by three each time the input increases by one. This population scenario isdifferent – we have a percent rate of change rather than a constant number of people as our rateof change. To see the significance of this difference consider these two companies:
Company A has 100 stores, and expands by opening 50 new stores a year.Company B has 100 stores, and expands by increasing the number of stores by 50% of their total
each year.Looking at a few years of growth for these companies:
Year Stores, Company A Stores, Company B
0 100 Starting with 100 each 100
1 100 + 50 = 150 They both grow by 50 stores in thefirst year.
100 + 50% of 100
100 + 0.50(100) = 150
2 150 + 50 = 200 Store A grows by 50, Store B growsby 75
150 + 50% of 150
150 + 0.50(150) = 225
3 200 + 50 = 250 Store A grows by 50, Store B growsby 112.5
225 + 50% of 225
225 + 0.50(225) = 337.5
Notice that with the percent growth rate, each year the company grows by 50% of the currentyear’s total, so as the company grows larger, the number of stores added in a year grows as well.
To try to simplify the calculations, notice that after 1 year the number of stores for company Bwas:
100 + 0.50(100) or equivalently by factoring100(1 + 0.50) = 150
4.1. Exponential Functions | 145

We can think of this as “the new number of stores is the original 100% plus another 50%”.
After 2 years, the number of stores was:150 + 0.50(150) or equivalently by factoring150(1 + 0.50) now recall the 150 came from 100(1 + 0.50). Substituting that,100(1 + 0.50)(1 + 0.50) = 100(1 + 0.50)2 = 225.
After 3 years, the number of stores was:225 + 0.50(225) or equivalently by factoring225(1 + 0.50) now recall the 225 came from 100(1 + 0.50)2 . Substituting that,100(1 + 0.50)2(1 + 0.50) = 100(1 + 0.50)3 = 337.5.
From this, we can generalize, noticing that to show a 50% increase, each year we multiply by afactor of (1 + 0.50), so after n years, our equation would be
B(n) = 100(1 + 0.50)n
In this equation, the 100 represented the initial quantity, and the 0.50 was the percent growthrate. Generalizing further, we arrive at the general form of exponential functions.
Exponential function: An exponential growth or decay function is a function that grows or shrinks at a
constant percent growth rate. The equation can be written in the form:
or where
Where:
a is the initial or starting value of the function,
r is the percent growth or decay rate, written as a decimal,
b is the growth factor or growth multiplier. Since powers of negative numbers behave strangely, we limit b
to positive values.
To see more clearly the difference between exponential and linear growth, compare the twotables and graphs below, which illustrate the growth of company A and B described above over alonger time frame if the growth patterns were to continue.
Year Company A Company B
146 | 4.1. Exponential Functions

2 200 225
4 300 506
6 400 1139
8 500 2563
10 600 5767
Example 4.1.1
Write an exponential function for India’s population, and use it to predict the population in 2020.
At the beginning of the chapter we were given India’s population of 1.14 billion in the year 2008 and a percent
growth rate of 1.34%. Using 2008 as our starting time (t = 0), our initial population will be 1.14 billion. Since the
percent growth rate was 1.34%, our value for r is 0.0134.
Using the basic formula for exponential growth we can write the formula,
To estimate the population in 2020, we evaluate the function at t = 12, since 2020 is 12 years after 2008.
billion people in 2020.
Example 4.1.2
A guaranteed investment certificate (GIC) is a type of savings account offered by banks, typically offering a
higher interest rate in return for a fixed length of time you will leave your money invested. If a bank offers a 24
month GIC with an annual interest rate of 1.2% compounded monthly, how much will a $1000 investment grow
to over those 24 months?
4.1. Exponential Functions | 147

First, we must notice that the interest rate is an annual rate, but is compounded monthly, meaning interest is
calculated and added to the account monthly.
To find the monthly interest rate, we divide the annual rate of 1.2% by 12 since there are 12 months in a year:
1.2% / 12 = 0.1%. Each month we will earn 0.1% interest.
From this, we can set up an exponential function, with our initial amount of $1000 and a growth rate of r =
0.001, and our input m measured in months.
After 24 months, the account will have grown to:
In all of the preceding examples, we saw exponential growth. Exponential functions can alsobe used to model quantities that are decreasing at a constant percent rate. An example of this isradioactive decay, a process in which radioactive isotopes of certain atoms transform to an atomof a different type, causing a percentage decrease of the original material over time.
Example 4.1.3
Bismuth-210 is an isotope that radioactively decays by about 13% each day, meaning 13% of the remaining
Bismuth-210 transforms into another atom (polonium-210 in this case) each day. If you begin with 100 mg of
Bismuth-210, how much remains after one week?
With radioactive decay, instead of the quantity increasing at a percent rate, the quantity is decreasing at a
percent rate. Our initial quantity is a = 100 mg, and our growth rate will be negative 13%, since we are
decreasing: r = -0.13. This gives the equation:
This can also be explained by recognizing that if 13% decays, then 87% remains.
After one week, 7 days, the quantity remaining would be mg of
Bismuth-210 remains.
Example 4.1.4
148 | 4.1. Exponential Functions

T(q) represents the total number of Android smartphone contracts, in thousands, held by a certain Rogers
store region measured quarterly since January 1, 2010. Interpret all of the parts of the equation:
.
Interpreting this from the basic exponential form, we know that 86 is our initial value. This means that on Jan.
1, 2010 this region had 86,000 Android smartphone contracts. Since b = 1 + r = 1.64, we know that every quarter
the number of smartphone contracts grows by 64%. T(2) = 231.3056 means that in the 2nd quarter (or at the end
of the second quarter) there were approximately 231,305 Android smart phone contracts.
Finding Equations of Exponential Functions
In the previous examples, we were able to write equations for exponential functions since we knewthe initial quantity and the growth rate. If we do not know the growth rate, but instead know onlysome input and output pairs of values, we can still construct an exponential function.
Example 4.1.5
In 2002, a company had 80 retail stores. By 2008, the company had grown to 180 retail stores. If the company
is growing exponentially, find a formula for the function.
By defining our input variable to be t, years after 2002, the information listed can be written as two input-
output pairs: (0, 80) and (6, 180). Notice that by choosing our input variable to be measured as years after the
first year value provided, we have effectively “given” ourselves the initial value for the function: a = 80. This
gives us an equation of the form f(t) = 80bt .
Substituting in our second input-output pair allows us to solve for b:
Divide by 80
Take the 6th root of both sides.
This gives us our equation for the population:
4.1. Exponential Functions | 149

Recall that since b = 1+r, we can interpret this to mean that the population growth rate is r = 0.1447, and so
the population is growing by about 14.47% each year.
In this example, you could also have used to evaluate the 6th root if your calculator doesn’thave an nth root button. We chose to use the f(x) = abx form of the exponential function ratherthan the f(x) = a(1 + r)x form, but this choice was entirely arbitrary – either form would be fine touse.
When finding equations, the value for b or r will usually have to be rounded to be written easily.To preserve accuracy, it is important to not over-round these values. Typically, you want to besure to preserve at least 3 significant digits in the growth rate. For example, if your value for r was0.00317643, you would want to round this no further than to 0.00318.
Graphs of Exponentials
To get a sense for the behaviour of exponentials, let us begin by looking more closely at thefunction f(x) = 2x . Listing a table of values for this function:
x -3 -2 -1 0 1 2 3
f(x) 1 2 4 8
Notice that:
1. This function is positive for all values of x.2. As x increases, the function grows faster and faster (the rate of change increases).3. As x decreases, the function values grow smaller, approaching zero.4. This is an example of exponential growth.
Looking at the function
x -3 -2 -1 0 1 2 3
g(x) 8 4 2 1
150 | 4.1. Exponential Functions

Note this function is also positive for all values of x, but in this case grows as x decreases, anddecreases towards zero as x increases. This is an example of exponential decay. You may noticefrom the table that this function appears to be the horizontal reflection of the f(x) = 2x table. Thisis in fact the case:
Looking at the graphs also confirms this relationship:
Consider a function for the form f(x) = abx . Since a, which we called the initial value in the lastsection, is the function value at an input of zero, a will give us the vertical intercept of the graph.
From the graphs above, we can see that an exponential graph will have a horizontal asymptote onone side of the graph, and can either increase or decrease, depending upon the growth factor. Ahorizontal asymptote is a horizontal line y = b where the graph approaches the line as the inputsget large. The horizontal asymptote will help us determine the long run behaviour and is easy todetermine from the graph.
The graph will grow when the growth rate is positive, which will make the growth factor b largerthan one. When it’s negative, the growth factor will be less than one.
Graphical Features of Exponential Functions:
• Graphically, in the function f(x) = abx
• a is the vertical intercept of the graph
• b determines the rate at which the graph grows. When a is positive,
4.1. Exponential Functions | 151

◦ the function will increase if b > 1
◦ the function will decrease if 0 < b < 1
• The graph will have a horizontal asymptote at y = 0.
• The graph will be concave up if a > 0; concave down if a < 0.
• The domain of the function is all real numbers.
• The range of the function is (0, ∞).
When sketching the graph of an exponential function, it can be helpful to remember that thegraph will pass through the points (0, a) and (1, ab).
The value b will determine the function’s long run behavior:If b > 1, as x→∞ , f(x)→∞ and as x→-∞ , f(x)→0.If 0 < b < 1, as x→∞ , f(x)→0 and as x→-∞ , f(x)→∞ .
Example 4.1.6
Sketch a graph of
This graph will have a vertical intercept at (0,4), and pass through the point (1, ) . Since b < 1, the graph will
be decreasing towards zero. Since a > 0, the graph will be concave up.
We can also see from the graph the long run behavior: as x→∞ , f(x)→0 and as x→-∞ , f(x)→∞ .
152 | 4.1. Exponential Functions
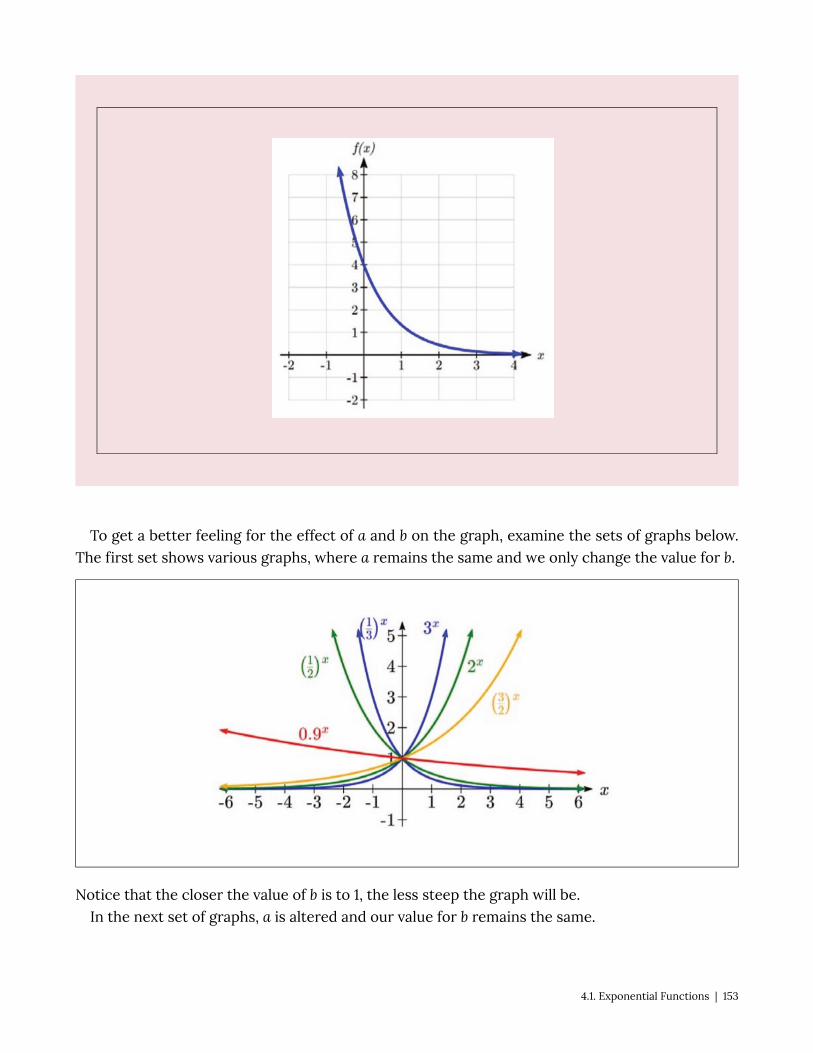
To get a better feeling for the effect of a and b on the graph, examine the sets of graphs below.The first set shows various graphs, where a remains the same and we only change the value for b.
Notice that the closer the value of b is to 1, the less steep the graph will be.In the next set of graphs, a is altered and our value for b remains the same.
4.1. Exponential Functions | 153

Notice that changing the value for a changes the vertical intercept. Since a is multiplying the bx
term, a acts as a vertical stretch factor, not as a shift. Notice also that the long run behavior forall of these functions is the same because the growth factor did not change and none of these avalues introduced a vertical flip.
Example 4.1.7
Match each equation with its graph.
154 | 4.1. Exponential Functions

The graph of k(x) is the easiest to identify, since it is the only equation with a growth factor less than one,
which will produce a decreasing graph. The graph of h(x) can be identified as the only growing exponential
function with a vertical intercept at (0, 4). The graphs of f(x) and g(x) both have a vertical intercept at (0, 2), but
since g(x) has a larger growth factor, we can identify it as the graph increasing faster.
4.1. Exponential Functions | 155

Compound Interest
In the bank guaranteed investment certificate (GIC) example earlier in the section, weencountered compound interest. Typically bank accounts and other savings instruments in whichearnings are reinvested, such as mutual funds and retirement accounts, utilize compound interest.The term compounding comes from the behaviour that interest is earned not on the original value,but on the accumulated value of the account.
In the example from earlier, the interest was compounded monthly, so we took the annual
interest rate, usually called the nominal rate or annual percentage rate (APR) and divided by12, the number of compounds in a year, to find the monthly interest. The exponent was thenmeasured in months.
Generalizing this, we can form a general formula for compound interest. If the APR is writtenin decimal form as r, and there are k compounding periods per year, then the interest percompounding period will be r/k. Likewise, if we are interested in the value after t years, then therewill be kt compounding periods in that time.
Compound Interest Formula:
Compound Interest can be calculated using the formula:
Where:
• A(t) is the account value
• t is measured in years
• a is the starting amount of the account, often called the principal
• r is the annual percentage rate (APR), also called the nominal rate
• k is the number of compounding periods in one year
Example 4.1.8
If you invest $3,000 in an investment account paying 3% interest compounded quarterly, how much will the
account be worth in 10 years?
Since we are starting with $3000, a = 3000.
156 | 4.1. Exponential Functions

Our interest rate is 3%, so r = 0.03.
Since we are compounding quarterly, we are compounding 4 times per year, so k = 4.
We want to know the value of the account in 10 years, so we are looking for A(10), the value when t = 10.
The account will be worth $4045.05 in 10 years.
Example 4.1.9
A Registered Education Savings Plan (RESP) is a post-secondary education savings plan in which parents can
invest money to pay for their children’s later college or university tuition, and the account grows tax free. If Lily
wants to set up an RESP account for her daughter, wants the account to grow to $40,000 over 18 years, and
believes the account will earn 6% compounded semi-annually (twice a year), how much will Lily need to invest
in the account now?
Since the account is earning 6%, r = 0.06.
Since interest is compounded twice a year, k = 2.
In this problem, we don’t know how much we are starting with, so we will be solving for a, the initial amount
needed. We do know we want the end amount to be $40,000, so we will be looking for the value of a so that
A(18) = 40,000.
Lily will need to invest $13,801 to have $40,000 in 18 years.
A Limit to Compounding
Because of compounding throughout the year, with compound interest the actual increase in ayear is more than the annual percentage rate. If $1,000 were invested at 10%, the table below showsthe value after 1 year at different compounding frequencies:
4.1. Exponential Functions | 157

Frequency Value after 1 year
Annually $1100
Semiannually $1102.50
Quarterly $1103.81
Monthly $1104.71
Daily $1105.16
The amount we earn increases as we increase the compounding frequency. Notice, though, thatthe increase from annual to semi-annual compounding is larger than the increase from monthlyto daily compounding. This might lead us to believe that although increasing the frequency ofcompounding will increase our result, there is an upper limit to this process.
To see this, let us examine the value of $1 invested at 100% interest for 1 year.
Frequency Value
Annually $2
Semiannually $2.25
Quarterly $2.441406
Monthly $2.613035
Daily $2.714567
Hourly $2.718127
Once per minute $2.718279
Once per second $2.718282
These values do indeed appear to be approaching an upper limit. This value ends up being soimportant that it gets represented by its own letter, much like how π represents a number.
Euler’s Number: e is the letter used to represent the value that approaches as k gets big.
e ≈ 2.718282
158 | 4.1. Exponential Functions

Because e is often used as the base of an exponential, most scientific calculators have a buttonthat can calculate powers of e, usually labeled ex. Some computer software instead defines afunction exp(x), where exp(x) = ex. Because e arises when the time between compounds becomes
very small, e allows us to define continuous growth and allows us to define a new toolkit function,f(x) = ex .
Continuous Growth Formula:
Continuous Growth can be calculated using the formula:
f(x) = aerx
Where:
• a is the starting amount
• r is the continuous growth rate
This type of equation is commonly used when describing quantities that change more or lesscontinuously, like chemical reactions, growth of large populations, and radioactive decay.
Example 4.1.10
Radon-222 decays at a continuous rate of 17.3% per day. How much will 100mg of Radon-222 decay to in 3
days?
Since we are given a continuous decay rate, we use the continuous growth formula. Since the substance is
decaying, we know the growth rate will be negative: r = -0.173.
f(3) = 100e-0.173(3) ≈ 59.512 mg of Radon-222 will remain.
4.1. Exponential Functions | 159

Practice questions
1. Suppose a company had 50 workplace accidents in 2012, and the number of reported accidentsincreased to 175 by 2018. If the number of accidents grew exponentially, what was the annualgrowth rate?
2. Looking at these two equations that represent the balance in two different savings accounts,which account is growing faster, and which account will have a higher balance after 3 years?
3. A population of 1000 is decreasing 3% each year. Find the population in 30 years.
4. Recalculate Example 4.1.8 with monthly compounding.
5. The population of a nest of ants is 225, with a continuous growth rate of 18% per week. Whatis the population size of the nest after 8 weeks?
6. You are told that your 42 year-old hockey card is worth $1200. If this card appreciated at 19%per year compounded semi-annually, what was the initial value of the card?
160 | 4.1. Exponential Functions

4.2. Logarithmic Functions
Logarithmic Functions
A population of 50 flies is expected to double every week, leading to a function of the form f(x) =50(2)x , where x represents the number of weeks that have passed. When will this population reach500? Trying to solve this problem leads to:
500 = 50(2)x Dividing both sides by 50 to isolate the exponential10 = 2x
While we have set up exponential models and used them to make predictions, you may havenoticed that solving exponential equations has not yet been mentioned. The reason is simple:
none of the algebraic tools discussed so far are sufficient to solve exponential equations. Wemust introduce a new function, named log, as the function that “undoes”an exponential function, like how a square root “undoes” a square. Sinceexponential functions have different bases, we will define correspondinglogarithms of different bases as well.
Logarithm: The logarithm (base b) function, written logb(x) , “undoes” exponential function bx .
The statement ba = c is equivalent to the statement logb(c) = a .
Since the logarithm and exponential “undo” each other (in technical terms, they are inverses), itfollows that:
Properties of Logs: Inverse Properties
logb(bx) = x
blogbx = x
4.2. Logarithmic Functions | 161

Since log is a function, it is most correctly written as logb(c) , using parentheses to denotefunction evaluation, just as we would with f(c). However, when the input is a single variable ornumber, it is common to see the parentheses dropped and the expression written as logbc .
Example 4.2.1
Write these exponential equations as logarithmic equations:
23 = 8 52 = 25 10-4 =
23 = 8 is equivalent to log2(8) = 3
52 = 25 is equivalent to log5(25) = 2
10-4 = is equivalent to log10( ) = -4
Example 4.2.2
Write these logarithmic equations as exponential equations:
is equivalent to
is equivalent to
By establishing the relationship between exponential and logarithmic functions, we can nowsolve basic logarithmic and exponential equations by rewriting.
162 | 4.2. Logarithmic Functions
Example 4.2.3
Solve log4(x) = 2 for x.
By rewriting this expression as an exponential, 42 = x , so x = 16
Most calculators and computers will only evaluate logarithms of two bases.
Common and Natural Logarithms:
The common log is the logarithm with base 10, and is typically written log(x) .
The natural log is the logarithm with base e, and is typically written ln(x) .
Example 4.2.4
Evaluate log(1000) using the definition of the common log.
To evaluate log(1000) , we can say x = log(1000) , then rewrite into exponential form using the common log
base of 10.
10x = 1000
From this, we might recognize that 1000 is the cube of 10, so x = 3.
We also can use the inverse property of logs to write log10(103) = 3
4.2. Logarithmic Functions | 163

Values of the Common Log
Number Number as exponential Log(number)
1000 103 3
100 102 2
10 101 1
1 100 0
0.1 10-1 -1
0.01 10-2 -2
0.001 10-3 -3
Example 4.2.5
Evaluate ln( ) .
We can rewrite ln( ) as ln( ) . Since ln is a log base e, we can use the inverse property for logs: ln(
) = = .
Graphs of Logarithms
Recall that the exponential function f(x) = 2x produces this table of values:
x -3 -2 -1 0 1 2 3
f(x) 1 2 4 8
Since the logarithmic function “undoes” the exponential, g(x) = log2(x) produces the table ofvalues:
164 | 4.2. Logarithmic Functions

x 1 2 4 8
f(x) -3 -2 -1 0 1 2 3
In this second table, notice that:
1. As the input increases, the output increases.2. As input increases, the output increases more slowly.3. Since the exponential function only outputs positive values, the logarithm can only accept
positive values as inputs, so the domain of the log function is (0, ∞) .4. Since the exponential function can accept all real numbers as inputs, the logarithm can
output any real number, so the range is all real numbers or (-∞, ∞) .
Sketching the graph, notice that as the input approaches zero from the right, the output of the
function grows very large in the negative direction, indicating a vertical asymptote at x = 0. Avertical asymptote is a vertical line x = a where the graph tends towards positive or negativeinfinity as the inputs approach a.
In symbolic notation we write as x→0+ , f(x)→-∞ , and as x→∞ , f(x)→∞
4.2. Logarithmic Functions | 165

Graphical Features of the Logarithm
Graphically, in the function g(x) = logb(x):
• The graph has a horizontal intercept at (1, 0)
• The graph has a vertical asymptote at x = 0
• The graph is increasing and concave down
• The domain of the function is x > 0, or (0, ∞)
• The range of the function is all real numbers, or (-∞, ∞)
When sketching a general logarithm with base b, it can be helpful to remember that the graphwill pass through the points (1, 0) and (b, 1). To get a feeling for how the base affects the shape ofthe graph, examine the graphs below.
Notice that the larger the base, the slower the graph grows. For example, the common log graph,while it grows without bound, it does so very slowly. For example, to reach an output of 8, theinput must be 100,000,000.
166 | 4.2. Logarithmic Functions

Logarithm Properties
To utilize the common or natural logarithm functions to evaluate expressions like log2(10), we needto establish some additional properties.
Properties of Logs: Exponent Property
logb(Ar) = rlogb(A)
Example 4.2.6
Rewrite log3(25) using the exponent property for logs.
Since 25 = 52,
log3(25) = log3(52) = 2log35
Example 4.2.7
Rewrite 4ln(x) using the exponent property for logs.
Using the property in reverse, 4ln(x) = ln(x4)
The second important property allows us to change the base of a logarithmic expression.
4.2. Logarithmic Functions | 167

Properties of Logs: Change of Base
Example 4.2.8
Evaluate log2(10) using the change of base formula.
According to the change of base formula, we can rewrite the log base 2 as a logarithm of any other base.
Since our calculators can evaluate the natural log, we might choose to use the natural logarithm, which is the
log base e:
Using our calculators to evaluate this:
This finally allows us to answer our original question – the population of flies we discussed at the beginning
of the section will take 3.32 weeks to grow to 500.
Example 4.2.9
Evaluate log5(100) using the change of base formula.
We can rewrite this expression using any other base. We can rewrite using the common log, base 10:
An alternative approach to solving exponential equations is described below:
168 | 4.2. Logarithmic Functions

Solving exponential equations:
1. Isolate the exponential expressions when possible
2. Take the logarithm of both sides
3. Utilize the exponent property for logarithms to pull the variable out of the exponent
4. Use algebra to solve for the variable.
Example 4.2.10
Solve 2x = 10 for x.
Using this alternative approach, rather than rewrite this exponential into logarithmic form, we will take the
logarithm of both sides of the equation. Since we often wish to evaluate the result to a decimal answer, we will
usually utilize either the common log or natural log. For this example, we’ll use the natural log:
ln(2x) = ln(10) Utilizing the exponent property for logs,
xln(2) = ln(10) Now dividing by ln(2),
x = ≈ 2.861
Notice that this result matches the result we found using the change of base formula.
Example 4.2.11
Previously, we predicted the population (in billions) of India t years after 2008 by using the function f(t) =
1.14(1 + 0.0134)t . If the population continues following this trend, when will the population reach 2 billion?
We need to solve for the t so that f(t) = 2:
4.2. Logarithmic Functions | 169

Divide by 1.14 to isolate the exponential expression
Take the logarithm of both sides of the equation
Apply the exponent property on the right side
Divide both sides by ln(1.0134)
years.
If this growth rate continues, the model predicts the population of India will reach 2 billion about 42 years
after 2008, or approximately in the year 2050.
Additional Properties of Logarithms
Some situations cannot be addressed using the properties already discussed. For these, we needsome additional properties:
Sum of Logs Property:
Difference of Logs Property:
With these properties, we can rewrite expressions involving multiple logs as a single log, orbreak an expression involving a single log into expressions involving multiple logs.
Example 4.2.12
170 | 4.2. Logarithmic Functions
Write log3(5) + log3(8) – log3(2) as a single logarithm.
Using the sum of logs property on the first two terms:
log3(5) + log3(8) = log3(5 · 8) = log3(40)
This reduces our original expression to log3(40) – log3(2)
Then using the difference of logs property,
log3(40) – log3(2) = log3( ) = log3(20)
Example 4.2.13
Evaluate 2log(5) + log(4) without a calculator by first rewriting as a single logarithm.
On the first term, we can use the exponent property of logs to write:
2log(5) = log(52) = log(25)
With the expression reduced to a sum of two logs, log(25) + log(4) , we can utilize the sum of logs property:
log(25) + log(4) = log(4 · 25) = log(100)
Since 100 = 102, we can evaluate this log without a calculator:
log(100) = log(102) = 2
Example 4.2.14
Rewrite as a sum or difference of logs.
First, noticing we have a quotient of two expressions, we can utilize the difference property of logs to write:
Then seeing the product in the first term, we use the sum property:
Finally, we could use the exponent property on the first term:
4.2. Logarithmic Functions | 171

Log Properties in Solving Equations
The logarithm properties often arise when solving problems involving logarithms.
Example 4.2.15
Solve .
In order to rewrite in exponential form, we need a single logarithmic expression on the left side of the
equation. Using the difference property of logs, we can rewrite the left side:
Rewriting in exponential form reduces this to an algebraic equation:
Solving:
Checking this answer in the original equation, we can verify there are no domain issues, and this answer is
correct.
Practice questions
1. Write the exponential equation 42 = 16 as a logarithmic equation.
2. Evaluate log(1,000,000).
172 | 4.2. Logarithmic Functions

3. Rewrite using the exponent property for logs: ln .
4. Solve 5(0.93)x = 10.
5. Without a calculator evaluate by first rewriting as a single logarithm: log2(8) + log2(4)
6. Solve log(x2 – 4) = 1 + log(x + 2).
7. Suppose the population of rats in a city is estimated to be 1.1 million. If the population sizeincreases exponentially at a rate of 15% per year, how many years would it take for the populationsize to reach 5 million rats?
4.2. Logarithmic Functions | 173

4.3. Exponential and Logarithmic Models
Exponential and Logarithmic Models
While we have explored some basic applications of exponential and logarithmic functions, in thissection we explore some important applications in more depth.
More complex exponential equations can often be solved in more than one way. In the followingexample, we will solve the same problem in two ways – one using logarithm properties, and theother using exponential properties.
Example 4.3.1a
In 2008, the population of Kenya was approximately 38.8 million, and was growing by 2.64% each year, while
the population of Sudan was approximately 41.3 million and growing by 2.24% each year. If these trends
continue, when will the population of Kenya match that of Sudan?
We start by writing an equation for each population in terms of t, the number of years after 2008.
To find when the populations will be equal, we can set the equations equal:
For our first approach, we take the log of both sides of the equation:
Utilizing the sum property of logs, we can rewrite each side:
Then utilizing the exponent property, we can pull the variables out of the exponent:
Moving all the terms involving t to one side of the equation and the rest of the terms to the other side:
Factoring out the t on the left:
174 | 4.3. Exponential and Logarithmic Models

Dividing to solve for t:
years until the populations will be equal.
Example 4.3.1b
Solve the problem above by rewriting before taking the log.
Starting at the equation:
38.8(1.0264)t = 41.3(1.0224)t
Divide to move the exponential terms to one side of the equation and the constants to the other side:
Using exponent rules to group on the left:
Taking the log of both sides:
Utilizing the exponent property on the left:
Dividing gives:
years
While the answer does not immediately appear identical to that produced using the previous method, note
that by using the difference property of logs, the answer could be rewritten:
While both methods work equally well, it often requires fewer steps to utilize algebra beforetaking logs, rather than relying solely on log properties.
4.3. Exponential and Logarithmic Models | 175

Radioactive Decay
In an earlier section, we discussed radioactive decay – the idea that radioactive isotopes changeover time. One of the common terms associated with radioactive decay is half-life.
Half Life: The half-life of a radioactive isotope is the time it takes for half the substance to decay.
Given the basic exponential growth/decay equation h(t) = abt , half-life can be found by solving
for when half the original amount remains; by solving , or more simply . Noticehow the initial amount is irrelevant when solving for half-life.
Example 4.3.2
Bismuth-210 is an isotope that decays by about 13% each day. What is the half-life of Bismuth-210?
We were not given a starting quantity, so we could either make up a value or use an unknown constant to
represent the starting amount. To show that starting quantity does not affect the result, let us denote the initial
quantity by the constant a. Then the decay of Bismuth-210 can be described by the equation Q(d) = a(0.87)d .
To find the half-life, we want to determine when the remaining quantity is half the original: . Solving:
Dividing by a
Taking the log of both sides
Use the exponent property of logs
days Divide to solve for d
This tells us that the half-life of Bismuth-210 is approximately 5 days.
176 | 4.3. Exponential and Logarithmic Models

Example 4.3.3
Cesium-137 has a half-life of about 30 years. If you begin with 200 mg of cesium-137, how much will remain
after 30 years? 60 years? 90 years?
Since the half-life is 30 years, after 30 years, half the original amount, 100 mg, will remain.
After 60 years, another 30 years have passed, so during that second 30 years, another half of the substance
will decay, leaving 50 mg.
After 90 years, another 30 years have passed, so another half of the substance will decay, leaving 25 mg.
Example 4.3.4
Carbon-14 is a radioactive isotope that is present in organic materials, and is commonly used for dating
historical artifacts. Carbon-14 has a half-life of 5730 years. If a bone fragment is found that contains 20% of its
original carbon-14, how old is the bone?
To find how old the bone is, we first will need to find an equation for the decay of the carbon-14. We could
either use a continuous or annual decay formula, but opt to use the continuous decay formula since it is more
common in scientific texts. The half life tells us that after 5730 years, half the original substance remains.
Solving for the rate:
Dividing by a
Taking the natural log of both sides
Use the inverse property of logs on the right side
Dividing by 5730
Now we know the decay will follow the equation Q(t) = ae-0.000121t . To find how old the bone fragment is that
contains 20% of the original amount, we solve for t so that Q(t) = 0.20a.
4.3. Exponential and Logarithmic Models | 177
years.
Therefore, the bone fragment is about 13,300 years old.
Doubling Time
For decaying quantities, we asked how long it takes for half the substance to decay. For growingquantities, we might ask how long it takes for the quantity to double.
Doubling Time: The doubling time of a growing quantity is the time it takes for the quantity to double.
Given the basic exponential growth equation h(t) = abt , doubling time can be found by solvingfor when the original quantity has doubled; by solving 2a = a(b)x , or more simply 2 = bx. Againnotice how the initial amount is irrelevant when solving for doubling time.
Example 4.3.5
If you invest money at 8% compounded quarterly, how long will it take your money to double?
Using the compound interest equation, we can write .
To find the doubling time, we look for the time until we have twice the original amount, so when A(t) = 2P.
Notice we don’t need to know how much was invested.
178 | 4.3. Exponential and Logarithmic Models

years.
It will take about 8.75 years for the investment double in value.
Example 4.3.6
Use of a new social networking website has been growing exponentially, with the number of new members
doubling every 5 months. If the site currently has 120,000 users and this trend continues, how many users will
the site have in 1 year?
We can use the doubling time to find a function that models the number of site users, and then use that
equation to answer the question. While we could use an arbitrary a as we have before for the initial amount, in
this case, we know the initial amount was 120,000.
If we use a continuous growth equation, it would look like N(t) = 120ert , measured in thousands of users after
t months. Based on the doubling time, there would be 240 thousand users after 5 months. This allows us to
solve for the continuous growth rate:
Now that we have an equation, N(t) = 120e0.1386t , we can predict the number of users after 12 months:
N(12) = 120e0.1386(12) = 633.140 thousand users.
So after 1 year, we would expect the site to have around 633,140 users.
Practice questions
1. Tank A contains 10 litres of water, and 35% of the water evaporates each week. Tank B contains
4.3. Exponential and Logarithmic Models | 179

30 litres of water, and 50% of the water evaporates each week. In how many weeks will the tankscontain the same amount of water?
2. In 2020, the population of Canada was approximately 37,742,154, with an annual growth rate of0.89%. In the same year, the population of Saudi Arabia was 34,813,871, with an annual growth rateof 1.59%. Assuming these trends continue, when would the populations of these two countries beequal?
3. Recall that Cesium-137 has a half-life of about 30 years. If you begin with 200 mg ofCesium-137, how long will it take until only 1 milligram remains?
4. Plutonium-239, a product of nuclear explosion, has a half-life of 24,000 years. What percentof plutonium-239 would remain after:
a. 100 years
b. 1000 years
c. 10,000 years
5. If tuition at a university is increasing by 6.6% each year, how many years will it take for tuitionto double?
6. Suppose a new strain of influenza has emerged and the number of cases worldwide isdoubling exponentially every 7 months. What is the continuous growth rate (r)?
180 | 4.3. Exponential and Logarithmic Models

4.4. Practice question answers
Chapter 4 practice question answers
4.1. Exponential Functions
1. ≈ 23.2%
2. B(t) is growing faster, but after 3 years A(t) still has a higher account balance.
3. 401.0071 , or about 401 people.
4. $4048.06
5. ≈ 950 ants
6. ≈ 0.59 cents
4.2. Logarithmic Functions
1. log4(16) = 2
2. 6
3. -2ln(x)
4.
5. 5
6. 12
7. ≈ 10.8, or nearly 11 years.
4.4. Practice question answers | 181

4.3. Exponential and Logarithmic Models
1. ≈ 4.1874 weeks.
2. ≈ 11.68 years.
3. 229.3157, or approximately 229 years.
4. a. 99.7%
b. 97.2%
c. 74.9%
5. 10.845, or approximately 11 years.
6. ≈ 9.9%.
182 | 4.4. Practice question answers

CHAPTER 5: SETS AND COUNTING
Chapter 5: Sets and Counting | 183


5.1. Set Theory and Venn Diagrams
Set Theory
In this section, we will familiarize ourselves with set operations and notations, so that we can applythese concepts to both counting and probability problems. We begin by defining some terms.
A set is a collection of objects, and its members are called the elements of the set. We name theset by using capital letters, and enclose its members in curly brackets. Suppose we need to list themembers of the chess club. We use the following set notation.
C ={Ken, Bob, Tran, Shanti, Eric}
A set that has no members is called an empty set. The empty set is denoted by the symbol Ø.
Two sets are equal if they have the same elements.
A set A is a subset of a set B if every member of A is also a member of B.Suppose C = {Al, Bob, Chris, David, Ed} and A = {Bob, David}. Then A is a subset of C, written as
.Every set is a subset of itself, and the empty set is a subset of every set.
Union Of Two Sets
Let A and B be two sets, then the union of A and B, written as , is the set of all elements that are
either in A or in B, or in both A and B.
Intersection Of Two Sets
Let A and B be two sets, then the intersection of A and B, written as , is the set of all elements
that are common to both sets A and B.
A universal set U is the set consisting of all elements under consideration.
5.1. Set Theory and Venn Diagrams | 185

Complement of a Set
Let A be any set, then the complement of set A, written as , is the set consisting of elements in the
universal set U that are not in A.
Disjoint Sets
Two sets A and B are called disjoint sets if their intersection is an empty set.
Example 5.1.1
List all the subsets of the set of primary colors {red, yellow, blue}.
Solution
The subsets are ?, {red}, {yellow}, {blue}, {red, yellow}, {red, blue}, {yellow, blue}, {red, yellow, blue}
Note that the empty set is a subset of every set, and a set is a subset of itself.
Example 5.1.2
Let F = {Aikman, Jackson, Rice, Sanders, Young}, and B = {Griffey, Jackson, Sanders, Thomas}. Find the
intersection of the sets F and B.
186 | 5.1. Set Theory and Venn Diagrams

Solution
The intersection of the two sets is the set whose elements belong to both sets. Therefore,
= {Jackson, Sanders}
Example 5.1.3
Find the union of the sets F and B given as follows.
F = {Aikman, Jackson, Rice, Sanders, Young}
B = {Griffey, Jackson, Sanders, Thomas}
Solution
The union of two sets is the set whose elements are either in A or in B or in both A and B. Therefore
= {Aikman, Griffey, Jackson, Rice, Sanders, Thomas, Young}
Observe that when writing the union of two sets, the repetitions are avoided.
Example 5.1.4
5.1. Set Theory and Venn Diagrams | 187

Let the universal set U = {red, orange, yellow, green, blue, indigo, violet}, and P = {red, yellow, blue}. Find the
complement of P.
Solution
The complement of a set P is the set consisting of elements in the universal set U that are not in P. Therefore:
= {orange, green, indigo, violet}
To achieve a better understanding, let us suppose that the universal set U represents the colorsof the spectrum, and P the primary colors, then represents those colors of the spectrum thatare not primary colors.
Example 5.1.5
Let U = {red, orange, yellow, green, blue, indigo, violet},
P = {red, yellow, blue},
Q = {red, green}, and
R ={orange, green, indigo}.
Find .
Solution
188 | 5.1. Set Theory and Venn Diagrams

We do the problems in steps.
= {red, yellow, blue, green}
= {orange, indigo, violet}
= {red, yellow, blue, violet}
= {violet}
Venn Diagrams
We now use Venn diagrams to illustrate the relationships between sets. In the late 1800’s, anEnglish logician named John Venn developed a method to represent relationship between sets. Herepresented these relationships using diagrams, which are now known as Venn diagrams. A Venndiagram represents a set as the interior of a circle. Often two or more circles are enclosed in arectangle where the rectangle represents the universal set. To visualize an intersection or unionof a set is easy. In this section, we will mainly use Venn diagrams to sort various populations andcount objects.
Example 5.1.6
Suppose a survey of car enthusiasts showed that over a certain time period, 30 drove cars with automatic
transmissions, 20 drove cars with standard transmissions, and 12 drove cars of both types. If every one in the
survey drove cars with one of these transmissions, how many people participated in the survey?
Solution
5.1. Set Theory and Venn Diagrams | 189

We will use Venn diagrams to solve this problem.
Let the set A represent those car enthusiasts who drove cars with automatic transmissions, and set S
represent the car enthusiasts who drove the cars with standard transmissions. Now we use Venn diagrams to
sort out the information given in this problem.
Since 12 people drove both cars, we place the number 12 in the region common to both sets.
(a) (b) (c)
Because 30 people drove cars with automatic transmissions, the circle A must contain 30 elements. This
means x + 12 = 30, or x = 18. Similarly, since 20 people drove cars with standard transmissions, the circle B must
contain 20 elements, or y +12 = 20 which in turn makes y = 8.
Now that all the information is sorted out, it is easy to read from the diagram that 18 people drove cars with
automatic transmissions only, 12 people drove both types of cars, and 8 drove cars with standard transmissions
only. Therefore, 18 + 12 + 8 = 38 people took part in the survey.
Example 5.1.7
A survey of 100 people in California indicates that 60 people have visited Disneyland, 15 have visited Knott’s
Berry Farm, and 6 have visited both. How many people have visited neither place?
190 | 5.1. Set Theory and Venn Diagrams

Solution
Let the set D represent the people who have visited Disneyland, and K the set of people who have visited
Knott’s Berry Farm.
(a) (b)
We fill the three regions associated with the sets D and K in the same manner as
before. Since 100 people participated in the survey, the rectangle representing the
universal set U must contain 100 objects. Let x represent those people in the
universal set that are neither in the set D nor in K. This means 54 + 6 + 9 + x = 100,
or x = 31.
Therefore, there are 31 people in the survey who have visited neither place.
Example 5.1.8
A survey of 100 exercise conscious people resulted in the following information:
• 50 jog, 30 swim, and 35 cycle
• 14 jog and swim
5.1. Set Theory and Venn Diagrams | 191

• 7 swim and cycle
• 9 jog and cycle
• 3 people take part in all three activities
a. How many jog but do not swim or cycle?
b. How many take part in only one of the activities?
c. How many do not take part in any of these activities?
Solution
Let J represent the set of people who jog, S the set of people who swim, and C who cycle. In using Venn
diagrams, our ultimate aim is to assign a number to each region. We always begin by first assigning the number
to the innermost region and then working our way out.
(a) (b) (c)
We place a 3 in the innermost region of Figure (a) because it represents the
192 | 5.1. Set Theory and Venn Diagrams
number of people who participate in all three activities. Next we compute x, y and
z.
• Since 14 people jog and swim, x +3 = 14, or x = 11.
• The fact that 9 people jog and cycle results in y + 3 = 9, or y = 6.
• Since 7 people swim and cycle, z + 3 = 7, or z = 4.• This information is depicted in Figure (b).
Now we proceed to find the unknowns m, n and p:
• Since 50 people jog, m + 11 + 6 + 3 = 50, or m = 30.
• 30 people swim, therefore, n + 11 + 4 + 3 = 30, or n = 12.
• 35 people cycle, therefore, p + 6 + 4 + 3 = 35, or p = 22.• By adding all the entries in all three sets, we get a sum of 88. Since 100 people were surveyed, the number
inside the universal set but outside of all three sets is 100 – 88, or 12.
• In Figure (c), the information is sorted out, and the questions can readily be answered.
a. The number of people who jog but do not swim or cycle is 30.
b. The number who take part in only one of these activities is 30 + 12 + 22 = 64.
c. The number of people who do not take part in any of these activities is 12.
Practice questions
1. Let the Universal set U = {a, b, c, d, e, f, g, h, i, j},V = {a, e, i, f, h}, and W = {a, c, e, g, i}. List themembers of the following sets:
a.b.
2. Consider the following sets: A = {SARS, H1N1, H5N1, MERS-CoV, COVID-19, Influenza,Norovirus}, B = {Listeria, Campylobacter, Salmonella, E. coli O157, Norovirus, Shigella}, and C =
5.1. Set Theory and Venn Diagrams | 193
{SARS, Listeria, Tuberculosis, H5N1, Salmonella, HIV, COVID-19}. List the members of the followingsets:
a.b.
3. A survey of athletes revealed that for their minor aches and pains, 30 used aspirin, 50 usedibuprofen, and 15 used both. All surveyed athletes used at least one of the two painkillers. Howmany athletes were surveyed?
4. A study of 150 high school students found that 25 reported having a previous concussion orhead injury, 52 reported experiencing mental illness, and 15 reported both outcomes. How manystudents did not report either outcome?
5. A survey of 100 students at Ryerson University finds that 50 subscribe to Netflix, 40 subscribeto Amazon Prime, and 30 subscribe to Disney+. Of these, 15 subscribe to both Netflix and AmazonPrime, 10 to both Amazon Prime and Disney+, 10 to both Netflix and Disney+, and 5 have all threesubscription services. Draw a Venn diagram and determine the following:
a. The number of students subscribing to Amazon Prime but not the other two streamingservices.
b. The number of students subscribing to Netflix or Amazon Prime but not Disney+.
c. The number of students not subscribing to any of these services.
194 | 5.1. Set Theory and Venn Diagrams
5.2. Multiplication Axiom
Multiplication Axiom
In this chapter, we are trying to develop counting techniques that will be used in future chaptersto study probability. One of the most fundamental of such techniques is called the MultiplicationAxiom. Before we introduce the multiplication axiom, we first look at some examples.
Example 5.2.1
If a student has two shirts and three pairs of pants they want to wear, how many different outfits consisting
of these shirts and pants can they wear?
Solution
Suppose we call the shirts s1 and s2, and pants p1, p2, and p3. We can have the
following six outfits.
s1p1 , s1p2 , s1p3 , s2p1 , s2p2 , s2p3
Alternatively, we can draw a tree diagram:
5.2. Multiplication Axiom | 195

The tree diagram gives us all six possibilities. The method involves two steps. First
the student chooses a shirt. They have two choices: shirt one or shirt two. If they
choose shirt one, they have three pairs of pants to match it with; pants one, pants
two, or pants three. Similarly if they choose shirt two, they can match it with each
of the three pairs of pants, again. The tree diagram helps us visualize these
possibilities.
The reader should note that the process involves two steps. For the first step of
choosing a shirt, there are two choices, and for each choice of a shirt, there are
three choices of choosing a pair of pants. So altogether there are 2 · 3 = 6
possibilities.
196 | 5.2. Multiplication Axiom

Example 5.2.2
If a student has two shirts, three pairs of pants, and two pairs of shoes they want to wear, how many different
outfits consisting of these items of clothing can they wear?
Solution
Suppose we call the shirts s1 and s2, the pants p1, p2, and p3, and the shoes f1, and f2. The following tree
diagram results.
5.2. Multiplication Axiom | 197

We count the number of branches in the tree, and see that there are 12 different possibilities. This time the
method involves three steps. First, the student chooses a shirt. They have two choices: shirt one or shirt two.
Now suppose they choose shirt one. This takes us to step two of the process which consists of choosing a pair
of pants. They have three choices for a pair of pants, and let us suppose they choose pants two. Now that they
have chosen a shirt and pants, we have moved to the third step of choosing a pair of shoes. Since they have two
pairs of shoes, they have two choices for the last step. Let us suppose they choose shoes two. They have
chosen the outfit consisting of shirt one, pants two, and shoes two, or s1p2f2.
By looking at the different branches on the tree, one can easily see the other possibilities. The important
thing to observe here, again, is that this is a three step process. There are two choices for the first step of
choosing a shirt. For each choice of a shirt, there are three choices of choosing a pair of pants, and for each
combination of a shirt and pants, there are two choices of selecting a pair of shoes. All in all, we have 2 · 3 · 2 =
12 different possibilities.
The tree diagrams help us to visualize the different possibilities, but theyare not practical when the possibilities are numerous. Besides, we are mostlyinterested in finding the number of elements in the set and not the actualpossibilities. But once the problem is envisioned, we can solve it without atree diagram. The two examples we just solved may have given us a clueto do just that. Let us now try to solve the previous example without atree diagram. Recall that the problem involved three steps: choosing a shirt,choosing a pair of pants, and choosing a pair of shoes. The number of ways ofchoosing each are listed below.
The number of ways of choosing ashirt
The number of ways of choosingpants
The number of ways of choosingshoes
2 3 2
By multiplying these three numbers we get 12, which is what we got when we did the problemusing a tree diagram. The procedure we just employed is called the multiplication axiom.
The Multiplication Axiom: If a task can be done in m ways, and a second task can be done in n ways, then
the operation involving the first task followed by the second can be performed in m · n ways.
The general multiplication axiom is not limited to just two tasks and can be used for any number of tasks.
198 | 5.2. Multiplication Axiom

Example 5.2.3
A truck license plate consists of a letter followed by four digits. How many such license plates are possible?
Solution
Since there are 26 letters and 10 digits, we have the following choices for each.
Letter Digit Digit Digit Digit
26 10 10 10 10
Therefore, the number of possible license plates is 26 · 10 · 10 · 10 · 10 = 260,000.
Example 5.2.4
In how many different ways can a 3-question true-false test be answered?
Solution
Since there are two choices for each question, we have
Question 1 Question 2 Question 3
2 2 2
Applying the multiplication axiom, we get 2 · 2 · 2 = 8 different ways.
5.2. Multiplication Axiom | 199

We list all eight possibilities below:
TTT , TTF , TFT , TFF , FTT , FTF , FFT , FFF
The reader should note that the first letter in each possibility is the answer corresponding to the first
question, the second letter corresponds to the answer to the second question, and so on. For example, TFF ,
says that the answer to the first question is given as true, and the answers to the second and third questions
false.
Example 5.2.5
In how many different ways can four people be seated in a row?
Solution
Suppose we put four chairs in a row, and proceed to put four people in these seats. There are four choices for
the first chair we choose. Once a person sits down in that chair, there are only three choices for the second
chair, and so on. We list these possibilities below:
4 3 2 1
So there are altogether 4 · 3 · 2 · 1 = 24 different ways.
Example 5.2.6
How many three-letter word sequences can be formed using the letters {A, B, C} if no letter is to be
200 | 5.2. Multiplication Axiom

repeated?
Solution
Imagine a child having three building blocks labeled A, B, and C. Suppose he puts these blocks on top of each
other to make word sequences. For the first letter he has three choices, namely A, B, or C. Let us suppose he
chooses the first letter to be a B, then for the second block which must go on top of the first, he has only two
choices: A or C. And for the last letter he has only one choice. We list the choices below:
3 2 1
Therefore, 6 different word sequences can be formed.
Finally, we’d like to illustrate this with a tree diagram:
5.2. Multiplication Axiom | 201

All six possibilities are displayed in the tree diagram.
Practice questions
1. A license plate consists of three letters followed by three digits. How many license plates arepossible if no letter may be repeated?
2. How many seven-digit telephone numbers are possible if the first two digits cannot be onesor zeros?
3. In how many ways can a 4-question true-false test be answered?
202 | 5.2. Multiplication Axiom

4. How many different ways are possible to answer an exam with 8 multiple-choice questionscontaining 4 answer options, and 7 true-false questions?
5. You want to create a new password for your phone consisting of 4 numbers (0-9), but youdon’t want to reuse the same number more than once. How many different password possibilitiesare there?
6. A combination lock is opened by first turning to the left, then to the right, and then to the leftagain. If there are 30 digits on the dial, how many possible combinations are there?
5.2. Multiplication Axiom | 203

5.3. Permutations
Permutations
In a previous example, we were asked to find the word sequences formed by using the letters{A,B,C} if no letter is to be repeated. The tree diagram gave us the following six arrangements:
ABC, ACB, BAC, BCA, CAB, and CBAArrangements like these, where order is important and no element is repeated, are called
permutations.
Permutations: A permutation of a set of elements is an ordered arrangement where each element is used
once.
Example 5.3.1
How many three-letter word sequences can be formed using the letters {A, B, C, D}?
Solution
There are four choices for the first letter of our word, three choices for the second letter, and two choices
for the third.
4 3 2
Applying the multiplication axiom, we get 4 · 3 · 2 = 24 different arrangements.
204 | 5.3. Permutations

Example 5.3.2
How many permutations of the letters of the word ARTICLE have consonants in the first and last positions?
Solution
In the word ARTICLE, there are 4 consonants. Since the first letter must be a consonant, we have four
choices for the first position, and once we use up a consonant, there are only three consonants left for the last
spot. We show as follows:
4 3
Since there are no more restrictions, we can go ahead and make the choices for the
rest of the positions. So far we have used up 2 letters, therefore, five remain. So for
the next position there are five choices, for the position after that there are four
choices, and so on. We get:
4 5 4 3 2 1 3
So the total permutations are 4 · 5 · 4 · 3 · 2 · 1 · 3 = 1440.
Example 5.3.3
Given five letters {A, B, C, D, E}. Find the following:
a. The number of four-letter word sequences.
5.3. Permutations | 205

b. The number of three-letter word sequences.
c. The number of two-letter word sequences.
Solution
The problem is easily solved by the multiplication axiom, and answers are as follows:
a. The number of four-letter word sequences is 5 · 4 · 3 · 2 = 120.
b. The number of three-letter word sequences is 5 · 4 · 3 = 60.
c. The number of two-letter word sequences is 5 · 4 = 20.
We often encounter situations where we have a set of n objects and we are selecting r objects to form
permutations. We refer to this as permutations of n objects taken r at a time, and we write it as nPr.
Therefore, this example can also be answered as listed below:
a. The number of four-letter word sequences is 5P4 = 120.
b. The number of three-letter word sequences is 5P3 = 60.
c. The number of two-letter word sequences is 5P2 = 20.
Before we give a formula for nPr, we’d like to introduce a symbol that we will use a great deal inthis as well as in the next chapter.
206 | 5.3. Permutations

Factorial: n! = n(n − 1)(n − 2)(n − 3)··· 3 · 2 · 1.
Where n is a natural number.
0! = 1
Now we define nPr.
The Number of Permutations of n Objects Taken r at a Time:
nPr = n(n − 1)(n − 2)(n − 3)···(n − r +1), or
nPr =
Where n and r are natural numbers.
The reader should become familiar with both formulas and should feel comfortable in applyingeither.
Example 5.3.4
Compute the following using both formulas.
a. 6P3
b. 7P2
Solution
5.3. Permutations | 207

We will identify n and r in each case and solve using the formulas provided.
a. 6P3 = 6 · 5 · 4 = 120, alternately 6P3 = = = = 120
b. 7P2 = 7 · 6 = 42, or 7P2 = = = 42
Next we consider some more permutation problems to get further insight into these concepts.
Example 5.3.5
In how many different ways can 4 people be seated in a straight line if two of them insist on sitting next to
each other?
Solution
Let us suppose we have four people A, B, C, and D. Further suppose that A and B want to sit together. For the
sake of argument, we tie A and B together and treat them as one person. The four people are CD . Since
is treated as one person, we have the following possible arrangements:
CD , DC , C D , D C , CD , DC
Note that there are six more such permutations because A and B could also be tied in the order BA. And they
are:
CD , DC , C D , D C , CD , DC
So altogether there are 12 different permutations.
208 | 5.3. Permutations

Let us now do the problem using the multiplication axiom.
After we tie two of the people together and treat them as one person, we can say
we have only three people. The multiplication axiom tells us that three people can
be seated in 3! ways. Since two people can be tied together 2! ways, there are 3!2! =
12 different arrangements.
Example 5.3.6
You have 4 math books and 5 history books to put on a shelf that has 5 slots. In how many ways can the books
be shelved if the first three slots are filled with math books and the next two slots are filled with history books?
Solution
We first do the problem using the multiplication axiom.
Since the math books go in the first three slots, there are 4 choices for the first slot, 3 for the second and 2
for the third. The fourth slot requires a history book, and has five choices. Once that choice is made, there are 4
history books left, and therefore, 4 choices for the last slot. The choices are shown below:
4 3 2 5 4
Therefore, the number of permutations are 4 · 3 · 2 · 5 · 4 = 480. Alternately, we
can see that 4 · 3 · 2 is really same as 4P3, and 5 · 4 is 5P2. So the answer can be
written as (4P3) (5P2) = 480.
Clearly, this makes sense. For every permutation of three math books placed in the first three
5.3. Permutations | 209

slots, there are 5P2 permutations of history books that can be placed in the last two slots. Hencethe multiplication axiom applies, and we have the answer (4P3) (5P2). We summarize.
1. Permutations: A permutation of a set of elements is an ordered arrangement where eachelement is used once.
2. Factorial: n! = n(n − 1)(n − 2)(n − 3)···3 · 2 · 1. Where n is a natural number. 0! = 1
3. Permutations of n Objects Taken r at a Time: nPr = n(n − 1)(n − 2)(n −3)···(n − r + 1), or nPr = . Where n and r are natural numbers.
Circular Permutations and Permutations with Similar Elements
In this section we will address the following two problems.
1. In how many different ways can five people be seated in a circle?2. In how many different ways can the letters of the word MISSISSIPPI be arranged?
The first problem comes under the category of Circular Permutations, and the second underPermutations with Similar Elements.
Circular PermutationsSuppose we have three people named A, B, and C. We have already determined that they can be
seated in a straight line in 3! or 6 ways. Our next problem is to see how many ways these peoplecan be seated in a circle. We draw a diagram:
It happens that there are only two ways we can seat three people in a circle. This kind ofpermutation is called a circular permutation. In such cases, no matter where the first person
210 | 5.3. Permutations

sits, the permutation is not affected. Each person can shift as many places as they like, and thepermutation will not be changed. Imagine the people on a merry-go-round; the rotation of thepermutation does not generate a new permutation. So in circular permutations, the first person isconsidered a place holder, and where he sits does not matter.
Circular Permutations: The number of permutations of n elements in a circle is (n − 1)!
Example 5.3.7
In how many different ways can five people be seated at a circular table?
Solution
We have already determined that the first person is just a place holder. Therefore,
there is only one choice for the first spot. We have:
1 4 3 2 1
So the answer is 24.
Example 5.3.8
In how many ways can four couples be seated at a round table if the men and women want to sit alternately?
Solution
5.3. Permutations | 211

We again emphasize that the first person can sit anywhere without affecting the permutation. So there is
only one choice for the first spot. Suppose a man sat down first. The chair next to it must belong to a woman,
and there are 4 choices. The next chair belongs to a man, so there are three choices and so on. We list the
choices below.
1 4 3 3 2 2 1 1
So the answer is 144.
Now we address the second problem.
Permutations with Similar ElementsLet us determine the number of distinguishable permutations of the letters ELEMENT.Suppose we make all of the letters different by labeling the letters as follows.
E1LE2ME3NTSince all the letters are now different, there are 7! different permutations.Let us now look at one such permutation, say:
LE1ME2NE3TSuppose we form new permutations from this arrangement by only moving the E’s. Clearly, there
are 3! or 6 such arrangements. We list them below:LE1ME2NE3T
LE1ME3NE2TLE2ME1NE3TLE3ME3NE1TLE3ME2NE1TLE3ME1NE2T
Because the E’s are not different, there is only one arrangement LEMENET and not six. This istrue for every permutation.
Let us suppose there are n different permutations of the letters ELEMENT. Then there are n · 3!permutations of the letters E1LE2ME3NT. But we know there are 7! permutations of the lettersE1LE2ME3NT. Therefore: n · 3! = 7!
Or n = .This gives us the method we are looking for.
212 | 5.3. Permutations

Permutations with Similar Elements:
The number of permutations of n elements taken n at a time, with r1 elements of one kind, r2 elements of
another kind, and so on, is
Example 5.3.9
Find the number of different permutations of the letters of the word MISSISSIPPI.
Solution
The word MISSISSIPPI has 11 letters. If the letters were all different there would have been 11! different
permutations. But MISSISSIPPI has 4 S’s, 4 I’s, and 2 P’s that are alike.
So the answer is
Which equals 34,650.
Example 5.3.10
If a coin is tossed six times, how many different outcomes consisting of 4 heads and 2 tails are there?
Solution
5.3. Permutations | 213

Again, we have permutations with similar elements. We are looking for permutations for the letters HHHHTT.
The answer is .
Example 5.3.11
In how many different ways can 4 nickels, 3 dimes, and 2 quarters be arranged in a row?
Solution
Assuming that all nickels are similar, all dimes are similar, and all quarters are similar, we have permutations
with similar elements. Therefore, the answer is:
Example 5.3.12
A stock broker wants to assign 20 new clients equally to 4 of its salespeople. In how many different ways can
this be done?
Solution
This means that each sales person gets 5 clients. The problem can be thought of as an ordered partitions
problem. In that case, using the formula we get:
214 | 5.3. Permutations

We summarize:
1. Circular Permutations: The number of permutations of n elements in a circle is (n − 1)!
2. Permutations with Similar Elements: The number of permutations of n elements taken n ata time, with r1 elements of one kind, r2 elements of another kind, and so on, such that n = r1 +r2 +···+ rk is
This is also referred to as ordered partitions.
Practice questions
1. A group of 15 people who are members of a volunteer club wish to choose a chair and a secretary.How many different ways can this be done?
2. How many permutations of the letters of the word SECURITY end in a consonant?
3. In how many different ways can five people be seated in a row if two of them insist on sittingnext to each other?
4. In how many ways can 3 English, 3 history, and 2 math books be set on a shelf, if the Englishbooks are set on the left, history books in the middle, and math books on the right?
5. Find the number of different permutations of the letters of the word MASSACHUSETTS.
6. If a team plays 10 games, how many different outcomes of 6 wins, and 4 losses are possible?
7. You and six other classmates decide to take a group selfie photo:
a. How many different arrangements are possible?
b. How many different arrangements are possible if you insist on being in the middle ofthe photo?
c. How many different arrangements are possible if one of your friends insists on being atthe right of the photo, and two other friends insist on standing beside each other?
5.3. Permutations | 215

5.4. Combinations
Combinations
Suppose we have a set of three letters {A,B,C}, and we are asked to make two-letter wordsequences. We have the following six permutations:
AB BA BC CB AC CANow suppose we have a group of three people {A,B,C} as Al, Bob, and Chris, respectively, and we
are asked to form committees of two people each. This time we have only three committees,namely:
AB BC ACWhen forming committees, the order is not important, because the committee that has Al and
Bob is no different than the committee that has Bob and Al. As a result, we have only threecommittees and not six. Forming word sequences is an example of permutations, while forming
committees is an example of combinations – the topic of this section.Permutations are those arrangements where order is important, while combinations are those
arrangements where order is not significant. From now on, this is how we will tell permutationsand combinations apart.
Just as the symbol nPr represents the number of permutations of n objects taken r at a time,nCr represents the number of combinations of n objects taken r at a time.
Our next goal is to determine the relationship between the number of combinations and thenumber of permutations in a given situation.
Example 5.4.1
Given the set of letters {A,B,C,D}. Write the number of combinations of three letters, and then from these
combinations determine the number of permutations.
Solution
We have the following four combinations:
216 | 5.4. Combinations

ABC BCD CDA BDA
Since every combination has three letters, there are 3! permutations for every combination. We list them
below:
ABC BCD CDA BDA
ACB BDC CAD BAD
BAC CDB DAC DAB
BCA CBD DCA DBA
CAB DCB ACD ADB
CBA DBC ADC ABD
The number of permutations are 3! times the number of combinations. That is:
4P3 = 3! · 4C3
or 4C3 =
In general, nCr =
Since nPr =
We have, nCr =
5.4. Combinations | 217
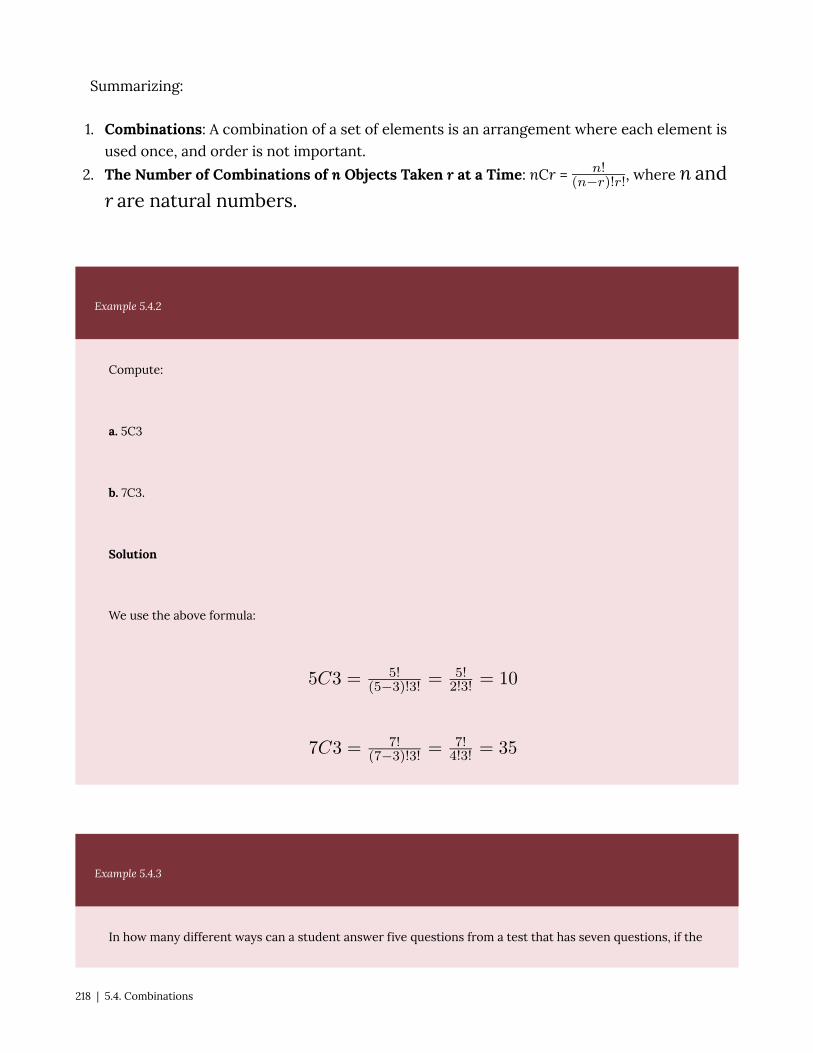
Summarizing:
1. Combinations: A combination of a set of elements is an arrangement where each element isused once, and order is not important.
2. The Number of Combinations of n Objects Taken r at a Time: nCr = , where n andr are natural numbers.
Example 5.4.2
Compute:
a. 5C3
b. 7C3.
Solution
We use the above formula:
Example 5.4.3
In how many different ways can a student answer five questions from a test that has seven questions, if the
218 | 5.4. Combinations

order of the selection is not important?
Solution
Since the order is not important, it is a combination problem, and the answer is:
7C5 = 21.
Example 5.4.4
How many line segments can be drawn by connecting any two of the six points that lie on the circumference
of a circle?
Solution
Since the line that goes from point A to point B is same as the one that goes from B to A, this is a combination
problem. It is a combination of 6 objects taken 2 at a time. Therefore, the answer is:
Example 5.4.5
There are 10 people at a party. If they all shake hands, how many hand-shakes are possible?
Solution
5.4. Combinations | 219

Note that between any two people there is only one hand shake. Therefore, we have:
10C2 = 45 hand-shakes.
Example 5.4.6
The shopping area of a town is in the shape of square that is 5 blocks by 5 blocks. How many different routes
can a taxi driver take to go from one corner of the shopping area to the opposite corner?
Solution
Let us suppose the taxi driver drives from the point A, the lower left hand corner, to the point B, the upper
right hand corner as shown in the figure below.
220 | 5.4. Combinations

To reach his destination, he has to travel 10 blocks; five horizontal, and five vertical. So if out of the 10 blocks
he chooses any five horizontal, the other five will have to be the vertical blocks, and vice versa. Therefore, all he
has to do is to choose 5 out of 10:
The answer is 10C5, or 252.
Alternately, the problem can be solved by permutations with similar elements.
The taxi driver’s route consists of five horizontal and five vertical blocks. If we call a horizontal block H, and a
vertical block a V, then one possible route may be as follows:
HHHHHVVVVV
Clearly there are permutations.
Further note that by definition .
Example 5.4.7
If a coin is tossed six times, in how many ways can it fall four heads and two tails?
Solution
First we solve this problem using the permutations with similar elements technique.
We need 4 heads and 2 tails, that is:
5.4. Combinations | 221
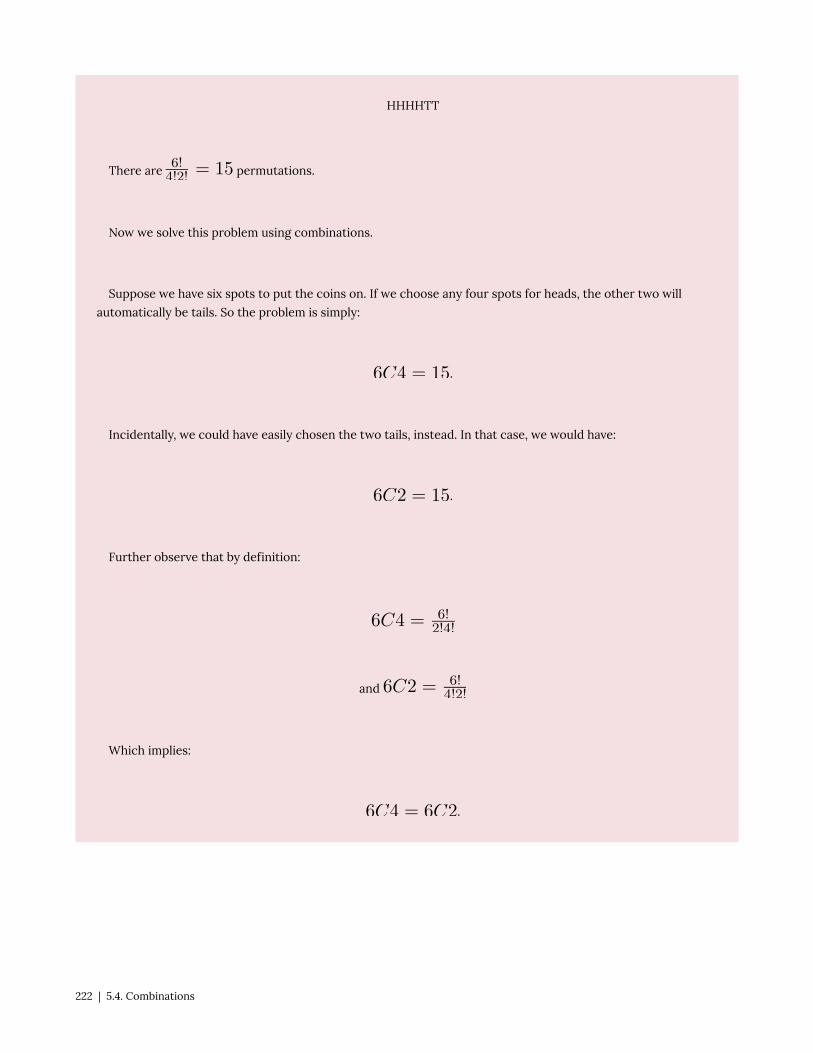
HHHHTT
There are permutations.
Now we solve this problem using combinations.
Suppose we have six spots to put the coins on. If we choose any four spots for heads, the other two will
automatically be tails. So the problem is simply:
.
Incidentally, we could have easily chosen the two tails, instead. In that case, we would have:
.
Further observe that by definition:
and
Which implies:
.
222 | 5.4. Combinations

Combinations Involving Several Sets
So far we have solved the basic combination problem of r objects chosen from n different objects.Now we will consider certain variations of this problem.
Example 5.4.8
How many five-people committees consisting of 2 men and 3 women can be chosen from a total of 4 men
and 4 women?
Solution
We list 4 men and 4 women as follows:
M1M2M3M4W1W2W3W4
Since we want 5-people committees consisting of 2 men and 3 women, we’ll first form all possible two-man
committees and all possible three-woman committees. Clearly there are 4C2 = 6 two-man committees, and
4C3 = 4 three-woman committees, we list them as follows:
2-Man Committees 3-Woman Committees
M1M2 W1W2W3
M1M3 W1W2W4
M1M4 W1W3W4
M2M3 W2W3W4
M2M4
M3M4
For every 2-man committee there are four 3-woman committees that can be chosen to make a 5-person
committee. If we choose M1M2 as our 2-man committee, then we can choose any of W1W2W3 , W1W2W4 ,
5.4. Combinations | 223

W1W3W4 , or W2W3W4 as our 3-woman committees. As a result, we get:
, , , ,
Similarly, if we choose M1M3 as our 2-man committee, then, again, we can choose any of W1W2W3 , W1W2W4 ,
W1W3W4 , or W2W3W4 as our 3-woman committees.
, , , ,
And so on. Since there are six 2-man committees, and for every 2-man committee there are four 3- woman
committees, there are altogether 6 · 4 = 24 five-people committees. In essence, we are applying the
multiplication axiom to the different combinations.
Example 5.4.9
A high school club consists of 4 freshmen, 5 sophomores, 5 juniors, and 6 seniors. How many ways can a
committee of 4 people be chosen that includes:
a. One student from each class?
b. All juniors?
c. Two freshmen and 2 seniors?
d. No freshmen?
224 | 5.4. Combinations

e. At least three seniors?
Solution
a. Applying the multiplication axiom to the combinations involved, we get:
4C1 · 5C1 · 5C1 · 6C1 = 600
b. We are choosing all 4 members from the 5 juniors, and none from the others.
5C4 = 5
c. 4C2 · 6C2 = 90
d. Since we don’t want any freshmen on the committee, we need to choose all members from the remaining
16. That is:
16C4 = 1820
e. Of the 4 people on the committee, we want at least three seniors. This can be done in two ways. We could
have three seniors, and one non-senior, or all four seniors:
(6C3 · 14C1) + 6C4 = 295
Example 5.4.10
How many five-letter word sequences consisting of 2 vowels and 3 consonants can be formed from the
letters of the word INTRODUCE?
5.4. Combinations | 225

Solution
First we select a group of five letters consisting of 2 vowels and 3 consonants. Since there are 4 vowels and 5
consonants, we have:
4C2 · 5C3
Since our next task is to make word sequences out of these letters, we multiply these by 5!:
4C2 · 5C3 · 5! = 7200.
Example 5.4.11
A standard deck of playing cards has 52 cards consisting of 4 suits each with 13 cards. In how many different
ways can a 5-card hand consisting of four cards of one suit and one of another be drawn?
Solution
We will do the problem using the following steps. Step 1. Select a suit. Step 2. Select four cards from this suit.
Step 3. Select another suit. Step 4. Select a card from that suit.
Applying the multiplication axiom, we have:
Ways of selecting a suit Ways if selecting 4 cardsfrom this suit
Ways if selecting the nextsuit
Ways of selecting a cardfrom that suit
4C1 13C4 3C1 13C1
226 | 5.4. Combinations
4C1 · 13C4 · 3C1 · 13C1 = 111,540.
Practice questions
1. How many different 3-people committees can be chosen from 10 people?
2. How many 5-card hands can be chosen from a deck of cards?
3. There are five teams in a league. How many games are played if every team plays each othertwice?
4. How many 4-people committees chosen from four men and six women will have at least threemen?
5. Three marbles are chosen from a jar that contains 5 red, 4 white, and 3 blue marbles. Howmany samples of the following type are possible?
a. All three white
b. One of each colour
c. At least two red
6. There are 15 technicians and 11 chemists working in a research laboratory. In how many wayscould they form a 5-member safety committee if the committee:
a. Must have exactly one technician
b. Must have two chemists and three technicians
c. Must have at least three chemists
5.4. Combinations | 227

5.5. Practice question answers
Chapter 5 practice question answers
5.1. Set Theory and Venn Diagrams
1. a. {a, c, e, f, g, h, i}
b. {c, g}
2. a. {SARS, H5N1, COVID-19}
b. {Tuberculosis, HIV}
3. 65
4. 88
5. a. 20
b. 60
c. 10
5.2. Multiplication Axiom
1. 15,600,000
2. 6,400,000
3. 16
4. 8,388,608
5. 5040
6. 27,000
228 | 5.5. Practice question answers

5.3. Permutations
1. 210
2. 25,200
3. 48
4. 72
5. 64,864,800
6. 210
7. a. 5040
b. 720
c. 240
5.4. Combinations
1. 120
2. 2,598,960
3. 20
4. 25
5. a. 4
b. 60
c. 80
6. a. 4950
b. 17,325
c. 22,737
5.5. Practice question answers | 229


CHAPTER 6: PROBABILITY - PART 1
Chapter 6: Probability - Part 1 | 231


6.1. Sample Spaces and Probability
Sample Spaces and Probability
If two coins are tossed, what is the probability that both coins will fall heads? The problem seemssimple enough, but it is not uncommon to hear the incorrect answer of . A student mayincorrectly reason that if two coins are tossed there are three possibilities, one head, two heads, orno heads. Therefore, the probability of two heads is one out of three. The answer is wrong becauseif we toss two coins there are four possibilities and not three. For clarity, assume that one coin isa penny and the other a nickel. Then we have the following four possibilities:
HH HT TH TTThe possibility HT, for example, indicates a head on the penny and a tail on the nickel, while TH
represents a tail on the penny and a head on the nickel.It is for this reason, we emphasize the need for understanding sample spaces.An act of flipping coins, rolling dice, drawing cards, or surveying people are referred to as an
experiment.
Sample Spaces: A sample space of an experiment is the set of all possible outcomes.
Example 6.1.1
If a die is rolled, write a sample space.
Solution
A die has six faces each having an equally likely chance of appearing. Therefore, the set of all possible
outcomes S is:
6.1. Sample Spaces and Probability | 233

{1, 2, 3, 4, 5, 6}.
Example 6.1.2
A family has three children. Write a sample space.
Solution
The sample space consists of eight possibilities:
{BBB , BBG , BGB , BGG , GBB , GBG , GGB , GGG}
The possibility BGB, for example, indicates that the first born is a boy, the second born a girl, and the third a
boy.
We illustrate these possibilities with a tree diagram:
234 | 6.1. Sample Spaces and Probability

Example 6.1.3
Two dice are rolled. Write the sample space.
Solution
We assume one of the dice is red, and the other green. We have the following 36 possibilities:
6.1. Sample Spaces and Probability | 235

Green
Red 1 2 3 4 5 6
1 (1, 1) (1, 2) (1, 3) (1, 4) (1, 5) (1, 6)
2 (2, 1) (2, 2) (2, 3) (2, 4) (2, 5) (2, 6)
3 (3, 1) (3, 2) (3, 3) (3, 4) (3, 5) (3, 6)
4 (4, 1) (4, 2) (4, 3) (4, 4) (4, 5) (4, 6)
5 (5, 1) (5, 2) (5, 3) (5, 4) (5, 5) (5, 6)
6 (6, 1) (6, 2) (6, 3) (6, 4) (6, 5) (6, 6)
The entry (2, 5), for example, indicates that the red die shows a two, and the green a 5.
Now that we understand the concept of a sample space, we will define probability.
Probability: For a sample space S, and an outcome A of S, the following two properties are satisfied.
1. If A is an outcome of a sample space, then the probability of A, denoted by P(A), is between 0 and 1,
inclusive. 0 ≤ P(A) ≤ 1
2. The sum of the probabilities of all the outcomes in S equals 1.
Example 6.1.4
If two dice, one red and one green, are rolled, find the probability that the red die shows a 3 and the green
shows a six.
Solution
Since two dice are rolled, there are 36 possibilities. The probability of each outcome, listed in Example 6.1.3,
236 | 6.1. Sample Spaces and Probability
is equally likely. Since (3, 6) is one such outcome, the probability of obtaining (3, 6) is 1/36.
The example we just considered consisted of only one outcome of the sample space. We areoften interested in finding probabilities of several outcomes represented by an event.
An event is a subset of a sample space. If an event consists of only one outcome, it is called a
simple event.
Example 6.1.5
If two dice are rolled, find the probability that the sum of the faces of the dice is 7.
Solution
Let E represent the event that the sum of the faces of two dice is 7. Since the possible cases for the sum to be
7 are: (1, 6), (2, 5), (3, 4), (4, 3), (5, 2), and (6, 1).
E = {(1, 6), (2, 5), (3, 4), (4, 3), (5, 2), and (6, 1)}
and the probability of the event E:
P(E) = 6/36 or 1/6.
Example 6.1.6
A jar contains 3 red, 4 white, and 3 blue marbles. If a marble is chosen at random, what is the probability that
the marble is a red marble or a blue marble?
6.1. Sample Spaces and Probability | 237

Solution
We assume the marbles are r1, r2, r3, w1, w2, w3, w4, b1, b2, b3. Let the event C represent that the marble is red
or blue.
The sample space S = {r1, r2, r3, w1, w2, w3, w4, b1, b2, b3}
And the event C = {r1, r2, r3, b1, b2, b3}
Therefore, the probability of C:
P(C) = 6/10 or 3/5.
Example 6.1.7
A jar contains three marbles numbered 1, 2, and 3. If two marbles are drawn, what is the probability that the
sum of the numbers is 4?
Solution
Since two marbles are drawn, the sample space consists of the following six possibilities:
S = {(1, 2), (1, 3), (2, 3), (2, 1), (3, 1), (3, 2)}
Let the event F represent that the sum of the numbers is four. Then:
F = [(1, 3), (3, 1)]
238 | 6.1. Sample Spaces and Probability

Therefore, the probability of F is:
P(F) = 2/6 or 1/3.
Example 6.1.8
A jar contains three marbles numbered 1, 2, and 3. If two marbles are drawn, what is the probability that the
sum of the numbers is at least 4?
Solution
The sample space, as in Example 6.1.7, consists of the following six possibilities:
S = {(1, 2), (1, 3), (2, 3), (2, 1), (3, 1), (3, 2)}
Let the event A represent that the sum of the numbers is at least four. Then:
F = {(1, 3), (3, 1), (2, 3), (3, 2)}
Therefore, the probability of F is:
P(F) = 4/6 or 2/3.
6.1. Sample Spaces and Probability | 239

Practice questions
1. Write a sample space for the following event: a die is rolled, and a coin is tossed.
2. A card is selected from a deck of 52 playing cards. Find the following probabilities:
a. P (a king)
b. P (any suit other than hearts)
3. A jar contains 6 red, 7 white, and 7 blue marbles. If a marble is chosen at random, find thefollowing probabilities:
a. P (red)
b. P (red or blue)
4. Two dice are rolled. Find the following probabilities:
a. P (the sum of the dice is 5)
b. P (the sum of the dice is 3 or 6)
5. A family has four children. Find the following probabilities:
a. P (they have two boys and two girls)
b. P (they have three or more girls)
240 | 6.1. Sample Spaces and Probability

6.2. Mutually Exclusive Events and theAddition Rule
Mutually Exclusive Events and the Addition Rule
In the previous chapter, we learned to find the union, intersection, and complement of a set. Wewill now use these set operations to describe events.
The union of two events E and F, , is the set of outcomes that are in E or in F or in both.
The intersection of two events E and F, , is the set of outcomes that are in both E and F.
The complement of an event E, denoted by Ec, is the set of outcomes in the sample space S thatare not in E. It is worth noting that P(Ec) = 1 − P (E). This follows from the fact that if the samplespace has n elements and E has k elements, then Ec has n − k elements. Therefore:
Of particular interest to us are the events whose outcomes do not overlap. We call these eventsmutually exclusive.
Two events E and F are said to be mutually exclusive if they do not intersect. That is, =?.Next we’ll determine whether a given pair of events are mutually exclusive.
Example 6.2.1
A card is drawn from a standard deck. Determine whether the pair of events given below is mutually
exclusive.
E = {The card drawn is an Ace}
F = {The card drawn is a heart}
Solution
6.2. Mutually Exclusive Events and the Addition Rule | 241

Clearly the ace of hearts belongs to both sets. That is:
= {Ace of hearts} ≠ ?.
Therefore, the events E and F are not mutually exclusive.
Example 6.2.2
Two dice are rolled. Determine whether the pair of events given below is mutually exclusive.
G = {The sum of the faces is six}
H = {One die shows a four}
Solution
For clarity, we list the elements of both sets:
G = {(1, 5), (2, 4), (3, 3), (4, 2), (5, 1)}
H = {(2, 4), (4, 2)}
Clearly, = {(2, 4), (4, 2)} ≠ Ø.
Therefore, the two sets are not mutually exclusive.
242 | 6.2. Mutually Exclusive Events and the Addition Rule

Example 6.2.3
A family has three children. Determine whether the following pair of events are mutually exclusive.
M ={The family has at least one boy}
N ={The family has all girls}
Solution
Although the answer may be clear, we list both the sets:
M ={BBB , BBG , BGB , BGG , GBB , GBG , GGB} and N ={GGG}
Clearly, = Ø
Therefore, the events M and N are mutually exclusive.
We will now consider problems that involve the union of two events.
Example 6.2.4
If a die is rolled, what is the probability of obtaining an even number or a number greater than four?
Solution
6.2. Mutually Exclusive Events and the Addition Rule | 243

Let E be the event that the number shown on the die is an even number, and let F be the event that the
number shown is greater than four.
The sample space S ={1, 2, 3, 4, 5, 6}. The event E ={2, 4, 6}, and the event F ={5, 6}
We need to find .
Since , and , a student may say . This will
be incorrect because the element 6, which is in both E and F has been counted twice, once as an element of E
and once as an element of F. In other words, the set has only four elements and not five. Therefore,
and not .
This can be illustrated by a Venn diagram. The sample space S, the events E and F, and are listed
below.
S = {1, 2, 3, 4, 5, 6} , E = {2, 4, 6} , F = {5, 6} , and = {6}.
The above figure shows S, E, F, and .
Finding the probability of , is the same as finding the probability that E will happen, or F will happen,
244 | 6.2. Mutually Exclusive Events and the Addition Rule

or both will happen. If we count the number of elements n(E) in E, and add to it the number of elements n(F) in
F, the points in both E and F are counted twice, once as elements of E and once as elements of F. Now if we
subtract from the sum, n(E) + n(F), the number , we remove the duplicity and get the correct
answer. So as a rule:
When expressed as a probability:
Applying the above for this example, we get:
This is because, when we add P(E) and P(F), we have added twice. Therefore, we must subtract
, once.
The above example gives us the general formula, called the Addition Rule, for finding theprobability of the union of two events. It states:
If two events E and F are mutually exclusive, then and , and we get:
Example 6.2.5
If a card is drawn from a deck, use the addition rule to find the probability of obtaining an ace or a heart.
Solution
6.2. Mutually Exclusive Events and the Addition Rule | 245

Let A be the event that the card is an ace, and H the event that it is a heart. Since there are four aces, and 13
hearts in the deck, P(A) = 4/52 and P(H) = 13/52.
Furthermore, since the intersection of two events is an ace of hearts,
We need to find :
.
Example 6.2.6
Two dice are rolled, and the events F and T are as follows:
F = {The sum of the dice is four} and T = {At least one die shows a three}
Find .
Solution
We list F and T, and as follows:
F = {(1, 3), (2, 2), (3, 1)}
T = {(3, 1), (3, 2), (3, 3), (3, 4), (3, 5), (3, 6), (1, 3), (2, 3), (4, 3), (5, 3), (6, 3)}
= {(1, 3), (3, 1)}
246 | 6.2. Mutually Exclusive Events and the Addition Rule

Since
We have .
Example 6.2.7
Mr. Washington is seeking a mathematics instructor’s position at a university. His employment depends on
two conditions: whether the board approves the position, and whether the hiring committee selects him. There
is a 80% chance that the board will approve the position, and there is a 70% chance that the hiring committee
will select him. If there is a 90% chance that at least one of the two conditions, the board approval or his
selection, will be met, what is the probability that Mr. Washington will be hired?
Solution
Let A be the event that the board approves the position, and S be the event that Mr. Washington gets
selected. We have:
, , and .
We need to find, .
The addition formula states that:
Substituting the known values, we get:
6.2. Mutually Exclusive Events and the Addition Rule | 247

Therefore, .
Example 6.2.8
The probability that this weekend will be cold is 0.6, the probability that it will be rainy is 0.7, and probability
that it will be both cold and rainy is 0.5. What is the probability that it will be neither cold nor rainy?
Solution
Let C be the event that the weekend will be cold, and R be event that it will be rainy. We are given that:
, ,
We want to find :
We summarize this section by listing the important rules.
1. The Addition Rule: For two events E and F,
2. The Addition Rule for Mutually Exclusive Events: If two events E and F are mutuallyexclusive, then
3. The Complement Rule: If Ec is the complement of event E, then
248 | 6.2. Mutually Exclusive Events and the Addition Rule

Practice questions
1. Determine whether the following pairs of events are mutually exclusive:
a. Three coins are tossed. A = {Two heads come up}, B = {At least one tail comes up}.
b. Two dice a rolled. C = {The sum of the dice is 9}, D = {At least one dice shows a 2}.
c. E = {You will get an A on your next exam}, F = {You will pass your next exam}.
2. Two dice are rolled, and the events G and H are as follows. G = {The sum of the dice is 8}, H ={Exactly one die shows a 6}. Use the addition rule to find .
3. At Ryerson University, 20% of the students take a Mathematics course, 30% take a Statisticscourse, and 10% take both. What percentage of students take either a Mathematics or Statisticscourse?
4. The following table shows the distribution of coffee drinkers by gender:
Coffee drinker Males (M) Females (F) TOTAL
Yes (Y) 31 33 64
No (N) 19 17 36
50 50 100
Use the table to determine the following probabilities:
a.
b.5. If , , and , use the addition rule to find
.
6. A provincial park has 240 campsites. A total of 90 sites have electricity. Of the 66 sites on thelakeshore, 24 of them have electricity. If a site is selected at random, what is the probability that:
a. It will have electricity?
b. It will have electricity or be on the lakeshore?
c. It will be on the lakeshore and not have electricity?
6.2. Mutually Exclusive Events and the Addition Rule | 249

6.3. Probability Using Tree Diagrams andCombinations
Probability Using Tree Diagrams and Combinations
In this section, we will apply previously learnt counting techniques in calculating probabilities, anduse tree diagrams to help us gain a better understanding of what is involved.
We begin with an example.
Example 6.3.1
Suppose a jar contains 3 red and 4 white marbles. If two marbles are drawn with replacement, what is the
probability that both marbles are red?
Solution
Let E be the event that the first marble drawn is red, and let F be the event that the second marble drawn is
red.
We need to find .
By the statement, “two marbles are drawn with replacement,” we mean that the first marble is replaced
before the second marble is drawn.
There are 7 choices for the first draw. And since the first marble is replaced before the second is drawn, there
are, again, seven choices for the second draw. Using the multiplication axiom, we conclude that the sample
space S consists of 49 ordered pairs. Of the 49 ordered pairs, there are 3 × 3 = 9 ordered pairs that show red on
the first draw and, also, red on the second draw. Therefore:
250 | 6.3. Probability Using Tree Diagrams and Combinations

Further note that in this particular case:
Example 6.3.2
If in the previous example, the two marbles are drawn without replacement, then what is the probability that
both marbles are red?
Solution
By the statement, “two marbles are drawn without replacement,” we mean that the first marble is not
replaced before the second marble is drawn.
Again, we need to find .
There are, again, 7 choices for the first draw. And since the first marble is not replaced before the second is
drawn, there are only six choices for the second draw. Using the multiplication axiom, we conclude that the
sample space S consists of 42 ordered pairs. Of the 42 ordered pairs, there are 3 × 2 = 6 ordered pairs that show
red on the first draw and red on the second draw. Therefore,
Here 3/7 represents P(E), and 2/6 represents the probability of drawing a red on the second draw, given that
the first draw resulted in a red. We write the latter as P(Red on the second | red on first) or . The “|”
represents the word “given.” Therefore:
6.3. Probability Using Tree Diagrams and Combinations | 251

The above result is an important one and will appear again in later sections.
We now demonstrate the above results with a tree diagram.
Example 6.3.3
Suppose a jar contains 3 red and 4 white marbles. If two marbles are drawn without replacement, find the
following probabilities using a tree diagram.
a. The probability that both marbles are white.
b. The probability that the first marble is red and the second white.
c. The probability that one marble is red and the other white.
Solution
Let R be the event that the marble drawn is red, and let W be the event that the marble drawn is white. We
draw the following tree diagram:
252 | 6.3. Probability Using Tree Diagrams and Combinations

Although the tree diagrams give us better insight into a problem, they are not practical for problems where
more than two or three things are chosen. In such cases, we use the concept of combinations that we learned
in Chapter 5. This method is best suited for problems where the order in which the objects are chosen is not
important, and the objects are chosen without replacement.
Example 6.3.4
Suppose a jar contains 3 red, 2 white, and 3 blue marbles. If three marbles are drawn without replacement,
find the following probabilities:
a. P(Two red and one white)
b. P(One of each color)
6.3. Probability Using Tree Diagrams and Combinations | 253
c. P(None blue)
d. P(At least one blue)
Solution
Let us suppose the marbles are labeled as R1, R2, R3, W1, W2, B1, B2, B3.
a. P(Two red and one white)
We analyze the problem in the following manner.
Since we are choosing 3 marbles from a total of 8, there are 8C3 = 56 possible combinations. Of these 56
combinations, there are 3C2 × 2C1 = 6 combinations consisting of 2 red and one white. Therefore:
P(Two red and one white) = .
b. P(One of each color)
Again, there are 8C3 = 56 possible combinations. Of these 56 combinations, there are 3C1 × 2C1 × 3C1 = 18
combinations consisting of one red, one white, and one blue. Therefore:
P(One of each color) = .
c. P(None blue)
There are 5 non-blue marbles, therefore:
254 | 6.3. Probability Using Tree Diagrams and Combinations

P(None blue) = .
d. P(At least one blue)
By “at least one blue marble,” we mean the following: one blue marble and two non-blue marbles, or two blue
marbles and one non-blue marble, or all three blue marbles. So we have to find the sum of the probabilities of
all three cases.
P(At least one blue) = P(one blue, two non-blue) + P(two blue, one non-blue) + P(three blue)
P(At least one blue) =
P(At least one blue) = 30/56 + 15/56 + 1/56 = 46/56 = 23/28.
Alternately, we use the fact that P(E) = 1 − P(Ec).
If the event E = At least one blue, then Ec = None blue. But from part c of this example, we have (Ec) = 5/28.
Therefore:
P(E) = 1 − 5/28 = 23/28.
Example 6.3.5
Five cards are drawn from a deck. Find the probability of obtaining two pairs, that is, two cards of one value,
two of another value, and one other card.
Solution
6.3. Probability Using Tree Diagrams and Combinations | 255

Let us first do an easier problem–the probability of obtaining a pair of kings and queens.
Since there are four kings, and four queens in the deck, the probability of obtaining two kings, two queens
and one other card is:
P(A pair of kings and queens) =
To find the probability of obtaining two pairs, we have to consider all possible pairs. Since there are
altogether 13 values, that is, aces, deuces, and so on, there are 13C2 different combinations of pairs.
P(Two pairs) =
We end the section by solving a problem called the Birthday Problem.
Example 6.3.6
If there are 25 people in a room, what is the probability that at least two people have the same birthday?
Solution
Let event E represent that at least two people have the same birthday. We first find the probability that no
two people have the same birthday. We analyze as follows.
Suppose there are 365 days to every year. According to the multiplication axiom, there are 36525 possible
birthdays for 25 people. Therefore, the sample space has 36525 elements. We are interested in the probability
that no two people have the same birthday. There are 365 possible choices for the first person and since the
second person must have a different birthday, there are 364 choices for the second, 363 for the third, and so
on. Therefore:
256 | 6.3. Probability Using Tree Diagrams and Combinations
P(No two have the same birthday) =
Since P(at least two people have the same birthday) = 1 − P (No two have the same birthday):
P(at least two people have the same birthday) =
Practice questions
1. Two apples are chosen from a basket containing five red and three yellow apples. Draw a treediagram and find the following probabilities:
a. P (both red)
b. P (both yellow)
2. Three marbles are drawn from a jar containing five red, four white, and three blue marbles.Find the following probabilities using combinations:
a. P (all three red)
b. P (none white)
3. A committee of four is selected from a total of 4 occupational and public health students, 5nursing students, and 6 nutrition students. Find the probabilities for the following events:
a. At least three occupational and public health students are selected.
b. All four students of the same program are selected.
c. Exactly three students of the same program are selected.
4. A hockey team has 2 goalies, 6 defense players, 8 wingers, and 4 centers. If the team randomlyselects 5 players to attend a charity function, what is the probability that:
a. They are all wingers?
b. No goalies or centers are selected?
c. Two defensive players and one player from each other position are selected?
d. At least one goalie is selected?
5. Complete the following birthday problems:
a. If there are 10 people in a room, what is the probability that no two have the samebirthday?
b. If there are 50 people in a room, what is the probability that at least two have the samebirthday?
6.3. Probability Using Tree Diagrams and Combinations | 257

258 | 6.3. Probability Using Tree Diagrams and Combinations
6.4. Conditional Probability
Conditional Probability
Suppose you and a friend wish to play a game that involves choosing a single card from a well-shuffled deck. Your friend deals you one card, face down, from the deck and offers you thefollowing deal: if the card is a king, he will pay you $5, otherwise, you pay him $1. Should you playthe game?
You reason in the following manner. Since there are four kings in the deck, the probability ofobtaining a king is 4/52 or 1/13. And, the probability of not obtaining a king is 12/13. This impliesthat the ratio of your winning to losing is 1 to 12, while the payoff ratio is only $1 to $5. Therefore,you determine that you should not play.
Now consider the following scenario. While your friend was dealing the card, you happened toget a glance of it and noticed that the card was a face card. Should you, now, play the game?
Since there are 12 face cards in the deck, the total elements in the sample space are no longer52, but just 12. This means the chance of obtaining a king is 4/12 or 1/3. So your chance of winningis 1/3 and of losing 2/3. This makes your winning to losing ratio 1 to 2 which fares much betterwith the payoff ratio of $1 to $5. This time, you determine that you should play.
In the second part of the above example, we were finding the probability of obtaining a king
knowing that a face card had shown. This is an example of conditional probability. Whenever weare finding the probability of an event E under the condition that another event F has happened,we are finding conditional probability.
The symbol P(E | F) denotes the problem of finding the probability of E given that F has occurred.We read P(E | F) as “the probability of E, given F.”
Example 6.4.1
A family has three children. Find the conditional probability of having two boys and a girl given that the first
born is a boy.
Solution
6.4. Conditional Probability | 259
Let event E be that the family has two boys and a girl, and F the event that the first born is a boy. First, we list
the sample space for a family of three children as follows.
S = {BBB , BBG , BGB , BGG , GBB , GBG , GGB , GGG}
Since we know that the first born is a boy, our possibilities narrow down to four outcomes, BBB , BBG , BGB ,
and BGG.
Among the four, BBG and BGB represent two boys and a girl.
Therefore P(E | F) = 2/4 or 1/2.
Conditional probability formulaFor two events E and F, the probability of E given F is:
P(E | F) =
Example 6.4.2
A single die is rolled. Use the above formula to find the conditional probability of obtaining an even number
given that a number greater than three has shown.
Solution
Let E be the event that an even number shows, and F be the event that a number greater than three shows.
We want P(E | F).
E = {2, 4, 6} and F = {4, 5, 6}. Which implies, = {4, 6}
260 | 6.4. Conditional Probability

Therefore, P(F) = 3/6, and P( ) = 2/6
P(E | F) = .
Example 6.4.3
The following table shows the distribution by gender of students at a university who take public
transportation and the ones who drive to school.
Male (M) Female (F) Total
Public Transportation (P) 8 13 21
Drive (D) 39 40 79
Total 47 53 100
The events M, F, P, and D are self explanatory. Find the following probabilities:
a. P(D | M)
b. P(F | D)
c. P(M | P)
Solution
We use the conditional probability formula .
6.4. Conditional Probability | 261

a. .
b. .
c. .
Example 6.4.4
Given P(E) = 0.5, P(F) = 0.7, and P( ) = 0.3. Find the following.
a. P(E | F)
b. P(F | E).
Solution
We use the conditional probability formula .
a. .
b. .
262 | 6.4. Conditional Probability

Example 6.4.5
Given two mutually exclusive events E and F such that P(E) = 0.4, P(F) = 0.9. Find P(E | F).
Solution
Since E and F are mutually exclusive, . Therefore:
.
Example 6.4.6
Given P(F | E) = 0.5, and P( ) = 0.3. Find P(E).
Solution
Using the conditional probability formula, we get:
Substituting:
or
Example 6.4.7
In a family of three children, find the conditional probability of having two boys and a girl, given that the
family has at least two boys.
6.4. Conditional Probability | 263

Solution
Let event E be that the family has two boys and a girl, and let F be the probability that the family has at least
two boys. We want to find P(E | F). We list the sample space along with the events E and F:
S = {BBB , BBG , BGB , BGG , GBG, GBB , GGB , GGG}
E = {BBG , BGB , GBB} and F = {BBB , BBG , BGB , GBB}
= {BBG , BGB , GBB}
Therefore, , and .
And .
Example 6.4.8
At a university, 65% of the students use Windows computers, 50% use Apple (Mac) computers, and 20% use
both. If a student is chosen at random, find the following probabilities.
a. A student uses a Windows computer given that they use a Mac.
b. A student uses a Mac knowing that they use a Windows computer.
Solution
Let event W be that the student uses a Windows computer, and M the probability that they use a Mac.
264 | 6.4. Conditional Probability

a.
b. .
Practice questions
1. A die is rolled. Use the conditional probability formula to find the conditional probability that itshows a three if it is known that an odd number has shown.
2. The following table shows the distribution of coffee drinkers by gender:
Coffee drinker Males (M) Females (F) TOTAL
Yes (Y) 31 33 64
No (N) 19 17 36
50 50 100
Use the table to determine the following probabilities:
a.
b.c.
3. In the Occupational and Public Health program at Ryerson University, 60% of the studentspass Biostatistics, 70% pass Environmental Health Law, and 30% pass both of these courses. If astudent is selected at random, find the following conditional probabilities:
a. They pass Biostatistics given that they passed Law
b. They pass Law given that they passed Biostatistics
4. Consider a family of three children. What is the probability of the family having children ofboth sexes given that the first born child is a boy?
5. If P( ) = 0.25 and P(F | E) = 0.55, find P(E).
6. A survey of drivers was conducted to determine the number of speeding tickets receivedamong males and females. The data are displayed in the table below.
6.4. Conditional Probability | 265

Number of tickets Male (M) Female (F) Total
0 425 600 1025
1 250 175 425
2 125 75 200
3 100 50 150
Total 900 900 1800
Use the table to determine the following probabilities:
a. P(0 speeding tickets)
b. P(F | 1 speeding ticket)
c. P(M | at least 2 speeding tickets)
266 | 6.4. Conditional Probability

6.5. Independent Events
Independent Events
In the previous section, we considered conditional probabilities. In some examples, theprobability of an event changed when additional information was provided. For instance, theprobability of obtaining a king from a deck of cards changed from 4/52 to 4/12 when we weregiven the condition that a face card had already shown. This is not always the case. Theadditional information may or may not alter the probability of the event. For example considerthe following example.
Example 6.5.1
A card is drawn from a deck. Find the following probabilities:
a. The card is a king.
b. The card is a king given that a red card has shown.
Solution
a. Clearly, P(The card is a king) = 4/52 = 1/13.
b. To find P(The card is a king | A red card has shown), we reason as follows:
Since a red card has shown, there are only 26 possibilities. Of the 26 red cards, there are two kings.
Therefore:
6.5. Independent Events | 267

P(The card is a king | A red card has shown) = 2/26 = 1/13.
The reader should observe that in the above example:P(The card is a king | A red card has shown) = P(The card is a king)In other words, the additional information, a red card has shown, did not affect the probability
of obtaining a king. Whenever the probability of an event E is not affected by the occurrence of
another event F, and vice versa, we say that the two events E and F are independent. This leadsto the following definition.
Two events E and F are independent if and only if at least one of the following two conditionsis true:
1.or
2.If the events are not independent, then they are dependent. We can test for independence with
the following formula.
Test for Independence
Two Events E and F are independent if and only if
Example 6.5.2
The table below shows the distribution of colour-blind people by gender.
Male (M) Female (F) Total
Colour-Blind (C) 6 1 7
Not Colour-Blind (N) 46 47 93
Total 52 48 100
268 | 6.5. Independent Events

Where M represents male, F represents female, C represents colour-blind, and N
not colour-blind. Use the independence test to determine whether the events
colour-blind and male are independent.
Solution
According to the test, C and M are independent if and only if .
, and
and
Clearly . Therefore, the two events are not independent. We may say they are dependent.
Example 6.5.3
In a survey of 100 adults, 45 owned a home, and 55 did not. Of the 45 who owned a home, 9 had diabetes, and
of the 55 who did not, 11 had diabetes. Are the events “owning a home” and “having diabetes” independent?
Solution
Let H be the event that an adult owns a home, and D the event that an adult had diabetes. We have:
, , and
6.5. Independent Events | 269
In order for two events to be independent, we must have:
Since , the two events “owning a home” and “having diabetes” are
independent.
Example 6.5.4
A coin is tossed three times, and the events E, F and G are defined as follows:
E: The coin shows a head on the first toss.
F: At least two heads appear.
G: Heads appear in two successive tosses.
Determine whether the following events are independent:
a. E and F b. F and G c. E and G
Solution
To make things easier, we list the sample space, the events, their intersections and the corresponding
probabilities:
S = {HHH , HHT , HTH , HTT , THH , THT , TTH , TTT}
270 | 6.5. Independent Events

E = {HHH , HHT , HTH , HTT},
F = {HHH , HHT , HTH , THH},
G = {HHT , THH},
= {HHH , HHT , HTH},
= {HHT , THH},
= {HHT},
a. In order for E and F to be independent, we must have:
.
But
Therefore, E and F are not independent.
b. F and G will be independent if:
Since , F and G are not independent.
c. We look at :
6.5. Independent Events | 271

Therefore, E and G are independent events.
Example 6.5.5
The probability that Jaime will visit his aunt in Montreal this year is 0.30, and the probability that he will go
river rafting on the Ottawa river is 0.50. If the two events are independent, what is the probability that Jaime
will do both?
Solution
Let A be the event that Jaime will visit his aunt this year, and R be the event that he will go river rafting.
We are given P(A) = 0.30 and P(R) = 0.50, and we want to find .
Since we are told that the events A and R are independent:
.
Example 6.5.6
Given P(B | A) = 0.4. If A and B are independent, find P(B).
Solution
272 | 6.5. Independent Events
If A and B are independent, then by definition P(B | A) = P(B).
Therefore, P(B) = 0.4
Example 6.5.7
Given P(A) = 0.7, P(B | A) = 0.5. Find .
Solution
By definition
Substituting, we have:
Therefore,
Example 6.5.8
Given , , if A and B are independent, find .
Solution
6.5. Independent Events | 273

The addition rule states that:
Since A and B are independent,
We substitute for in the addition formula and get:
By letting , and substituting values, we get:
Therefore, .
Practice questions
1. In a survey of 100 people, 40 were casual drinkers, and 60 did not drink. Of the ones who drank,
274 | 6.5. Independent Events

10 had minor headaches. Of the non-drinkers, 5 had minor headaches. Are the events “drinkers”and “had headaches” independent?
2. Suppose that 80% of the people wear seat belts, and 5% of the people quit smoking last year. If4% of the people who wear seat belts quit smoking, are the events wearing a seat belt and quittingsmoking independent?
3. If , , and E and F are independent, find .
4. John’s probability of passing Data Management is 40%, and Linda’s probability of passing thesame course is 70%. If the two events are independent, find the following probabilities:
a. P (both of them will pass the course)
b. P (at least one of them will pass the course)
5. The table below shows the distribution of employees in a company that reported a previousworkplace injury based on their years of working experience at the company.
Less than 10 years ofexperience (L)
10 or more years ofexperience (E) Total
Did not report a workplace injury(N) 300 100 400
Reported a workplace injury (Y) 150 50 200
450 150 600
Use this table to determine the following probabilities:
a.b.c.d. Are the events L and Y independent?
6. Given , , if A and B are independent, find .
6.5. Independent Events | 275
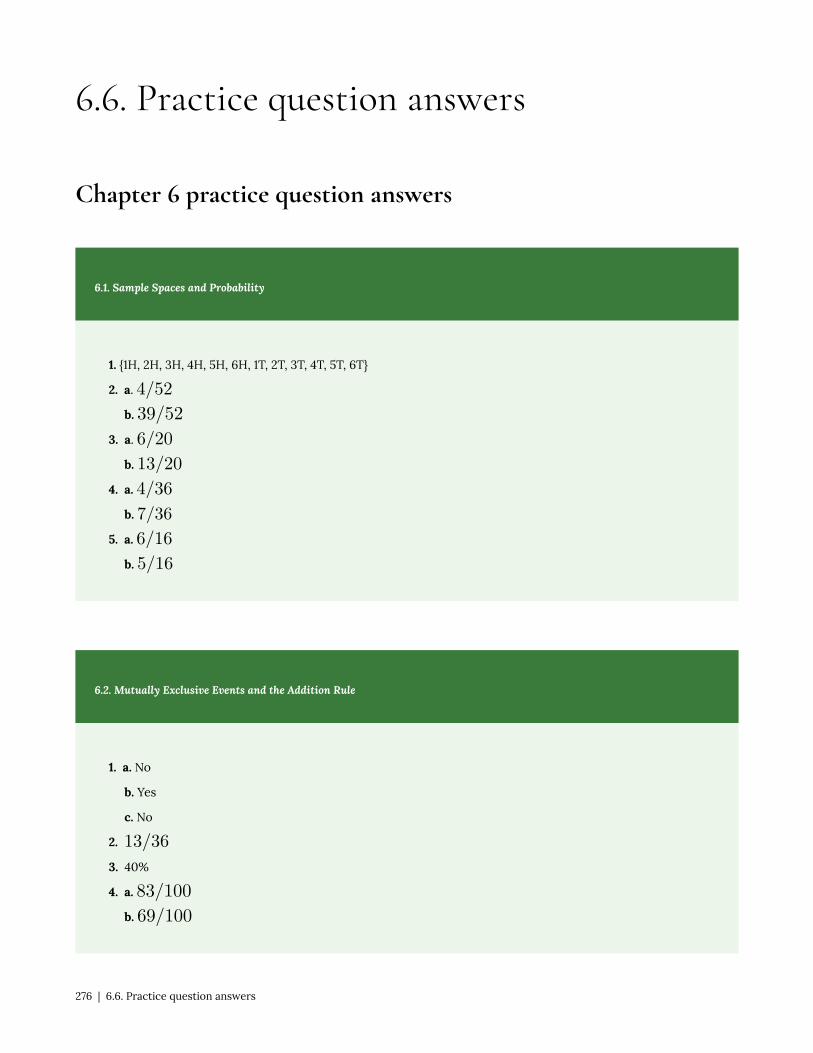
6.6. Practice question answers
Chapter 6 practice question answers
6.1. Sample Spaces and Probability
1. {1H, 2H, 3H, 4H, 5H, 6H, 1T, 2T, 3T, 4T, 5T, 6T}
2. a.
b.
3. a.
b.
4. a.
b.
5. a.
b.
6.2. Mutually Exclusive Events and the Addition Rule
1. a. No
b. Yes
c. No
2.
3. 40%
4. a.
b.
276 | 6.6. Practice question answers

5. 0.5
6. a. 0.375
b. 0.55
c. 0.175
6.3. Probability Using Tree Diagrams and Combinations
1. a.
b.
2. a.
b.
3. a.
b.
c.
4. a. 0.0036
b. 0.1291
c. 0.0619
d. 0.4474
5. a. 0.8831
b. 0.9704
6.4. Conditional Probability
1.
2. a.
b.
6.6. Practice question answers | 277

c.
3. a.
b.
4.
5.
6. a.
b.
c.
6.5. Independent Events
1. No
2. Yes
3. 0.36
4. a.
b.
5. a.
b.
c.
d. Yes
6. 0.50
278 | 6.6. Practice question answers

CHAPTER 7: PROBABILITY - PART 2
Chapter 7: Probability - Part 2 | 279


7.1. Binomial Probability
Binomial Probability
In this section, we will consider types of problems that involve a sequence of trials, where eachtrial has only two outcomes, a success or a failure. These trials are independent. That is, theoutcome of one does not affect the outcome of any other trial. Furthermore, the probability ofsuccess, p, and the probability of failure, (1 − p), remains the same throughout the experiment.
These problems are called binomial probability problems. Since these problems were researchedby a Swiss mathematician named Jacques Bernoulli around 1700, they are also referred to as
Bernoulli trials.We give the following definition:
Binomial Experiment: A binomial experiment satisfies the following four conditions:
1. There are only two outcomes, a success or a failure, for each trial.
2. The same experiment is repeated several times.
3. The trials are independent; that is, the outcome of a particular trial does not affect the outcome of
any other trial.
4. The probability of success remains the same for every trial.
The probability model that we are about to investigate will give us the tools to solve many real-life problems like the ones given below.
1. If a coin is flipped 10 times, what is the probability that it will fall heads 3 times?2. If a basketball player makes 3 out of every 4 free throws, what is the probability that he will
make 7 out of 10 free throws in a game?3. If a medicine cures 80% of the people who take it, what is the probability that among the 10
people who take the medicine, 6 will be cured?4. If a microchip manufacturer claims that only 4% of their chips are defective, what is the
probability that among the 60 chips chosen, exactly three are defective?5. If a telemarketing executive has determined that 15% of the people contacted will purchase
the product, what is the probability that among the 12 people who are contacted, 2 will buythe product?
7.1. Binomial Probability | 281

We now consider the following example to develop a formula for finding the probability of ksuccesses in n Bernoulli trials.
Example 7.1.1
A baseball player has a batting average of 0.300. If he bats four times in a game, find the probability that he
will have:
a. four hits
b. three hits
c. two hits
d. one hit
e. no hits.
Solution
Let us suppose S denotes that the player gets a hit, and F denotes that he does not get a hit. This is a binomial
experiment because it meets all four conditions. First, there are only two outcomes, S or F. Clearly the
experiment is repeated four times. Lastly, if we assume that the player’s skillfulness to get a hit does not change
each time he comes to bat, the trials are independent with a probability of 0.3 of getting a hit during each trial.
We draw a tree diagram to show all situations.
282 | 7.1. Binomial Probability

Let us first find the probability of getting, for example, two hits. We will have to consider the six possibilities,
SSFF , SFSF , SFFS , FSSF , FSFS , FFSS , as shown in the above tree diagram. We list the probabilities of each
below.
P(SSFF) = (0.3)(0.3)(0.7)(0.7) = (0.3)2(0.7)2
7.1. Binomial Probability | 283

P(SFSF) = (0.3)(0.7)(0.3)(0.7) = (0.3)2(0.7)2
P(SFFS) = (0.3)(0.7)(0.7)(0.3) = (0.3)2(0.7)2
P(FSSF) = (0.7)(0.3)(0.3)(0.7) = (0.3)2(0.7)2
P(FSFS) = (0.7)(0.3)(0.7)(0.3) = (0.3)2(0.7)2
P(FFSS) = (0.7)(0.7)(0.3)(0.3) = (0.3)2(0.7)2
Since the probability of each of these six outcomes is (0.3)2(0.7)2, the probability of obtaining two successes is
6(0.3)2(0.7)2.
The probability of getting one hit can be obtained in the same way. Since each permutation has one S and
three F‘s, there are four such outcomes: SFFF , FSFF , FFSF , and FFFS.
And since the probability of each of the four outcomes is (0.3)(0.7)3, the probability of getting one hit is
4(0.3)(0.7)3.
The table below lists the probabilities for all cases, and shows a comparison with the binomial expansion of
fourth degree. Again, p denotes the probability of success, and q = (1 − p) the probability of failure.
Outcome Four Hits Three hits Two Hits One hits No Hits
Probability (0.3)4 4(0.3)3(0.7) 6(0.3)2(0.7)2 4(0.3)(0.7)3 (0.7)4
This gives us the following theorem:
284 | 7.1. Binomial Probability

Binomial Probability Theorem:
The probability of obtaining k successes in n independent Bernoulli trials is given by:
P(n, k; p) = nCkpkqn – k
where p denotes the probability of success and q = (1 − p) the probability of failure.
We use the above formula to solve the following examples.
Example 7.1.2
If a coin is flipped 10 times, what is the probability that it will fall heads 3 times?
Solution
Let S denote the probability of obtaining a head, and F the probability of obtaining a tail.
Clearly, n = 10, k = 3, p = 1/2, and q = 1/2.
Therefore:
b(10, 3; 1/2) = 10C3(1/2)3(1/2)7 = .1172
Example 7.1.3
If a basketball player makes 3 out of every 4 free throws, what is the probability that he will make 6 out of 10
7.1. Binomial Probability | 285

free throws in a game?
Solution
The probability of making a free throw is 3/4. Therefore, p = 3/4, q = 1/4, n = 10, and k = 6.
Therefore:
b(10, 6; 3/4) = 10C6(3/4)6(1/4)4 = .1460
Example 7.1.4
If a medicine cures 80% of the people who take it, what is the probability that of the eight people who take
the medicine, 5 will be cured?
Solution
Here p = .80, q = .20, n = 8, and k = 5.
b(8, 5; .80) = 8C5(.80)5(.20)3 = .1468
Example 7.1.5
If a microchip manufacturer claims that only 4% of their chips are defective, what is the probability that
among the 60 chips chosen, exactly three are defective?
286 | 7.1. Binomial Probability

Solution
If S denotes the probability that the chip is defective, and F the probability that the chip is not defective, then
p = .04, q = .96, n = 60, and k = 3.
b(60, 3; .04) = 60C3(.04)3(.96)57 = .2138
Example 7.1.6
If a telemarketing executive has determined that 15% of the people contacted will purchase the product,
what is the probability that among the 12 people who are contacted, 2 will buy the product?
Solution
If S denoted the probability that a person will buy the product, and F the probability that the person will not
buy the product, then p = .15, q = .85, n = 12, and k = 2.
b(12, 2; .15) = 12C2(.15)2(.85)10 = .2924.
Practice questions
1. What is the probability of getting three ones if a die is rolled five times?
2. A basketball player has an 80% chance of sinking a basket on a free throw. In five free throws,what is the probability that he will sink:
a. Only one basket?
a. Three baskets?
7.1. Binomial Probability | 287

c. At least three baskets?
3. If a medicine cures 75% of the people who take it, what is the probability that of 30 peoplewho take the medicine:
a. 25 will be cured?
b. 26 will be cured?
c. 27 will be cured?
d. At least 25 will be cured?
4. The Canadian Food Inspection Agency (CFIA) has found that 5% of the imported spices intoCanada are contaminated with pathogenic food-borne bacteria. What is the probability that abatch of 25 imported spices will have:
a. One contaminated product?
b. Two contaminated products?
5. An executive has determined that for a door-to-door donation initiative, 20% of thehouseholds visited will provide a donation. If 10 households are visited, what is the probability thatat most 2 will provide a donation?
288 | 7.1. Binomial Probability

7.2. Bayes' Formula
Bayes’ Formula
In this section, we will develop and use Bayes’ Formula to solve an important type of probabilityproblem. Bayes’ formula is a method of calculating the conditional probability P(F | E) from P(E |F). The ideas involved here are not new, and most of these problems can be solved using a treediagram. However, Bayes’ formula does provide us with a tool with which we can solve theseproblems without a tree diagram. We begin with an example.
Example 7.2.1
Suppose you are given two jars. Jar I contains one black and 4 white marbles, and Jar II contains 4 black and 6
white marbles. If a jar is selected at random and a marble is chosen:
a. What is the probability that the marble chosen is a black marble?
b. If the chosen marble is black, what is the probability that it came from Jar I?
c. If the chosen marble is black, what is the probability that it came from Jar II?
Solution
Let JI be the event that Jar I is chosen, JII be the event that Jar II is chosen, B be the event that a black marble
is chosen and W the event that a white marble is chosen. We illustrate using a tree diagram.
7.2. Bayes' Formula | 289

(a)
(b)
a. The probability that a black marble is chosen is P(B) = 1/10 + 2/10 = 3/10.
b. To find P(JI | B), we use the definition of conditional probability, and we get
c. Similarly,
In parts b and c, the reader should note that the denominator is the sum of all probabilities of all branches of
the tree that produce a black marble, while the numerator is the branch that is associated with the particular
jar in question.
This is a statement of Bayes’ formula.
290 | 7.2. Bayes' Formula

Bayes’ Formula:Let S be a sample space that is divided into n partitions, A1, A2, . . . An. If E is any event in S,
then:
Example 7.2.2
A department store buys 50% of its appliances from Manufacturer A, 30% from Manufacturer B, and 20%
from Manufacturer C. It is estimated that 6% of Manufacturer A’s appliances, 5% of Manufacturer B’s
appliances, and 4% of Manufacturer C’s appliances need repair before the warranty expires. An appliance is
chosen at random. If the appliance chosen needed repair before the warranty expired, what is the probability
that the appliance was manufactured by Manufacturer A? Manufacturer B? Manufacturer C?
Solution
Let events A, B and C be the events that the appliance is manufactured by Manufacturer A, Manufacturer B,
and Manufacturer C, respectively. Further, suppose that the event R denotes that the appliance needs repair
before the warranty expires.
We need to find P(A | R), P(B | R) and P(C | R).
We will do this problem both by using a tree diagram and by using Bayes’ formula.
We draw a tree diagram.
7.2. Bayes' Formula | 291

The probability P(A | R), for example, is a fraction whose denominator is the sum
of all probabilities of all branches of the tree that result in an appliance that needs
repair before the warranty expires, and the numerator is the branch that is
associated with Manufacturer A. P(B | R) and P(C | R) are found in the same way. We
list both as follows:
292 | 7.2. Bayes' Formula
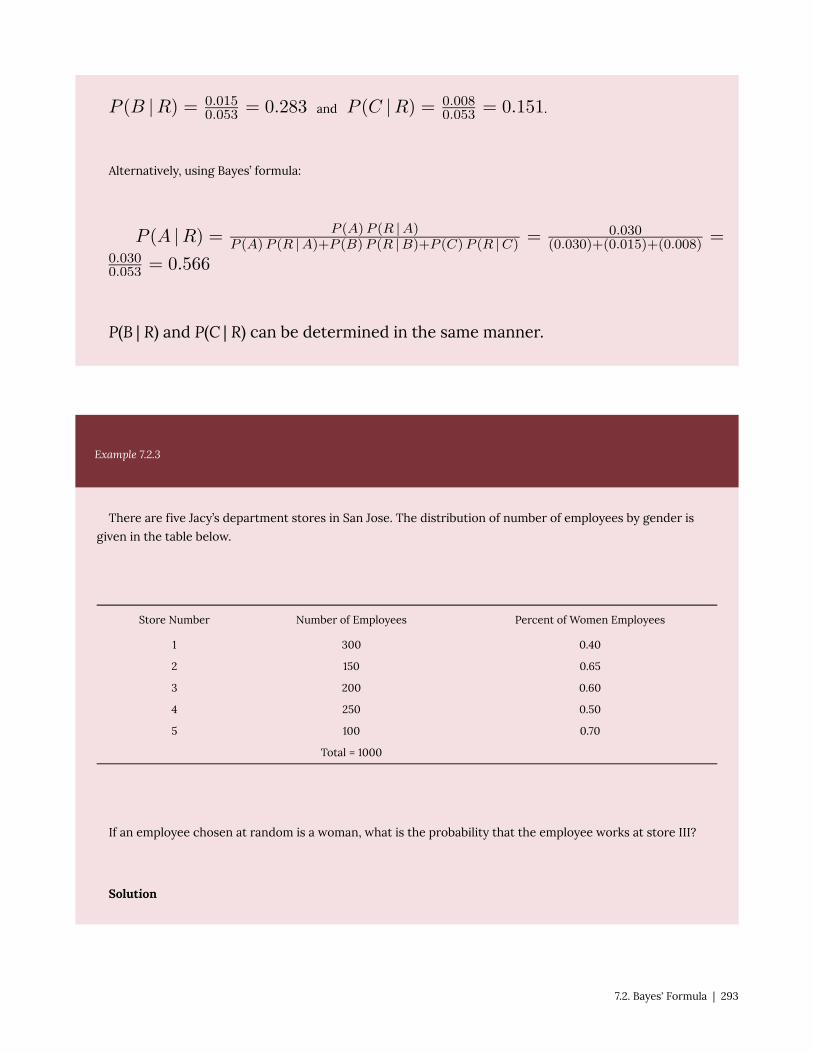
and .
Alternatively, using Bayes’ formula:
P(B | R) and P(C | R) can be determined in the same manner.
Example 7.2.3
There are five Jacy’s department stores in San Jose. The distribution of number of employees by gender is
given in the table below.
Store Number Number of Employees Percent of Women Employees
1 300 0.40
2 150 0.65
3 200 0.60
4 250 0.50
5 100 0.70
Total = 1000
If an employee chosen at random is a woman, what is the probability that the employee works at store III?
Solution
7.2. Bayes' Formula | 293

Let k = 1, 2, …, 5 be the event that the employee worked at store k, and W be the event that the employee is a
woman. Since there are a total of 1000 employees at the five stores,
P(1) = 0.30 P(2) = 0.15 P(3) = 0.20 P(4) = 0.25 P(5) = 0.10
Using Bayes’ formula,
For certain problems, we can use a much more intuitive approach than Bayes’ Formula.
Example 7.2.4
A certain disease has an incidence rate of 2%. A test is available to test for the disease, but it is not perfect.
The false negative rate is 10% (that is, about 10% of people who take the test will test negative, even though
they actually have the disease). The false positive rate is 1% (that is, about 1% of people who take the test will
test positive, even though they do not actually have the disease). Compute the probability that a person who
tests positive actually has the disease:
Imagine 10,000 people are tested. Of these 10,000, 200 will have the disease; 10% of them, or 20, will test
negative and the remaining 180 will test positive. Of the 9800 who do not have the disease, 1% of them, or 98,
will test positive. These data can be summarized in a table as follows:
Positive test Negative test Total
Have disease 180 20 200
Do not have disease 98 9,702 9,800
Total 278 9,822 10,000
Solution
294 | 7.2. Bayes' Formula

So of the 278 people who test positive, 180 will have the disease. Thus:
So about 65% of the people who test positive will have the disease.
Using Bayes’ formula directly would give the same result:
Practice questions
1. Jar I contains five red and three white marbles, and Jar II contains four red and two whitemarbles. A jar is picked at random and a marble is drawn. Draw a tree diagram and find thefollowing probabilities:
a. P (Marble is red)
b. P (The marble came from Jar II given that a white marble is drawn)
c. P (Red marble | Jar I)
2. The table below summarizes the results of a diagnostic test:
Positive test Negative test Total
Have disease 105 15 120
Do not havedisease 40 640 680
Total 145 655 800
Using the table, compute the following:
a. P (Negative test | disease positive)
b. P (Disease positive | test positive)
3. A computer company buys its chips from three different manufacturers. Manufacturer I
7.2. Bayes' Formula | 295

provides 60% of the chips, of which 5% are known to be defective; Manufacturer II supplies 30%of the chips, of which 4% are defective; while the rest are supplied by Manufacturer III, of which3% are defective. If a chip is chosen at random, find the following probabilities:
a. P (The chip is defective)
b. P (The chip came from Manufacturer II | it is defective)
c. P (The chip is defective | it came from manufacturer III)
4. The following table shows the percent of “Conditional Passes” that different types of foodpremises received in a city during their last public health inspection.
Premise Type Number of Premises Percent that Received Conditional Pass
Restaurant 2000 0.07
Grocery Store 425 0.03
Cafe/Bar 1865 0.05
Food Truck/Cart 150 0.08
Other 560 0.05
Total = 5000
If a premise is selected at random, find the following probabilities:
a. P (Received Conditional Pass)
b. P (Received Conditional Pass | Restaurant)
c. P (Grocery Store | Received Conditional Pass)
296 | 7.2. Bayes' Formula

7.3. Expected Value and Tree Diagrams
Expected Value
An expected gain or loss in a game of chance is called expected value. The concept of expectedvalue is closely related to a weighted average. Consider the following situations.
1. Suppose you and your friend play a game that consists of rolling a die. Your friend offersyou the following deal: If the die shows any number from 1 to 5, he will pay you the face valueof the die in dollars, that is, if the die shows a 4, he will pay you $4. But if the die shows a 6,you will have to pay him $18.
Before you play the game you decide to find the expected value. You analyze as follows.Since a die will show a number from 1 to 6, with an equal probability of 1/6, your chance of
winning $1 is 1/6, winning $2 is 1/6, and so on up to the face value of 5. But if the die showsa 6, you will lose $18. You write the expected value.
E = $1(1/6) + $2(1/6) + $3(1/6) + $4(1/6) + $5(1/6) − $18(1/6) = −$0.50This means that every time you play this game, you can expect to lose 50 cents. In other
words, if you play this game 100 times, theoretically you will lose $50. Obviously, it is not inyour interest to play.
2. Suppose of the 10 quizzes you took in a course, on eight quizzes you scored 80, and ontwo you scored 90. You wish to find the average of the 10 quizzes. The average is:
It should be observed that it will be incorrect to take the average of 80 and 90 becauseyou scored 80 on eight quizzes, and 90 on only two of them. Therefore, you take a “weightedaverage” of 80 and 90. That is, the average of 8 parts of 80 and 2 parts of 90, which is 82.
In the first situation, to find the expected value, we multiplied each payoff by the probabilityof its occurrence, and then added up the amounts calculated for all possible cases. In the secondexample, if we consider our test score a payoff, we did the same. This leads us to the followingdefinition.
Expected Value: If an experiment has the following probability distribution,
Payoff x1 x2 x3 ··· xn
Probability p(x1) p(x2) p(x3) ··· p(xn)
7.3. Expected Value and Tree Diagrams | 297

then the expected value of the experiment is:
Expected Value = x1p(x1) + x2p(x2) + x3p(x3) + ··· + xnp(xn)
Example 7.3.1
In a town, 12% of the families have three children, 50% of the families have two children, 20% of the families
have one child, and 10% of the families have no children. What is the expected number of children to a family?
Solution
We list the information in the following table.
Number of Children 3 2 1 0
Probability 0.12 0.50 0.20 0.20
Expected Value = x1p(x1) + x2p(x2) + x3p(x3) + x4p(x4)
E = 3(0.12) + 2(0.50) + 1(0.20) + 0(0.20) = 1.56
So on average, there are 1.56 children to a family.
Example 7.3.2
298 | 7.3. Expected Value and Tree Diagrams

To sell an average house, a real estate broker spends $1200 for advertisement expenses. If the house sells in
three months, the broker makes $8,000. Otherwise, the broker loses the listing. If there is a 40% chance that
the house will sell in three months, what is the expected payoff for the real estate broker?
Solution
The broker makes $8,000 with a probability of 0.40, but he loses $1200 whether the house sells or not.
E = ($8000)(0.40) − ($1200) = $2,000.
Alternatively, the broker makes $(8000−1200) with a probability of .40, but loses $1200 with a probability of
0.60. Therefore:
E = ($6800)(0.40) − ($1200)(0.60) = $2,000.
Example 7.3.3
In a town, the attendance at a football game depends on the weather. On a sunny day the attendance is
60,000, on a cold day the attendance is 40,000, and on a stormy day the attendance is 30,000. If for the next
football season, the weather forecast has predicted that 30% of the days will be sunny, 50% of the days will be
cold, and 20% days will be stormy, what is the expected attendance for a single game?
Solution
Using the expected value formula, we get:
E = (60,000)(0.30) + (40,000)(0.50) + (30,000)(0.20) = 44,000.
7.3. Expected Value and Tree Diagrams | 299
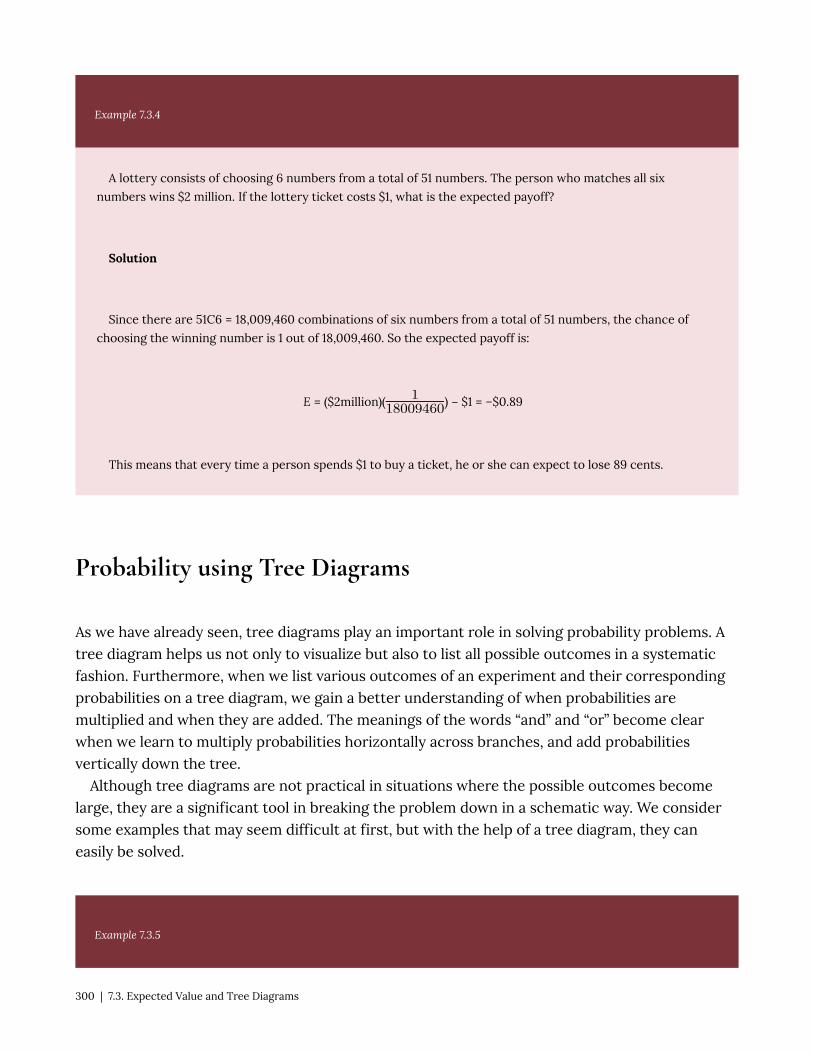
Example 7.3.4
A lottery consists of choosing 6 numbers from a total of 51 numbers. The person who matches all six
numbers wins $2 million. If the lottery ticket costs $1, what is the expected payoff?
Solution
Since there are 51C6 = 18,009,460 combinations of six numbers from a total of 51 numbers, the chance of
choosing the winning number is 1 out of 18,009,460. So the expected payoff is:
E = ($2million)( ) − $1 = –$0.89
This means that every time a person spends $1 to buy a ticket, he or she can expect to lose 89 cents.
Probability using Tree Diagrams
As we have already seen, tree diagrams play an important role in solving probability problems. Atree diagram helps us not only to visualize but also to list all possible outcomes in a systematicfashion. Furthermore, when we list various outcomes of an experiment and their correspondingprobabilities on a tree diagram, we gain a better understanding of when probabilities aremultiplied and when they are added. The meanings of the words “and” and “or” become clearwhen we learn to multiply probabilities horizontally across branches, and add probabilitiesvertically down the tree.
Although tree diagrams are not practical in situations where the possible outcomes becomelarge, they are a significant tool in breaking the problem down in a schematic way. We considersome examples that may seem difficult at first, but with the help of a tree diagram, they caneasily be solved.
Example 7.3.5
300 | 7.3. Expected Value and Tree Diagrams

A person has four keys and only one key fits to the lock of a door. What is the probability that the locked door
can be unlocked in at most three tries?
Solution
Let U be the event that the door has been unlocked and L be the event that the door has not been unlocked.
We illustrate with a tree diagram.
7.3. Expected Value and Tree Diagrams | 301

FirstTry
Second Try
302 | 7.3. Expected Value and Tree Diagrams

Third Try
The probability of unlocking the door in the first try = 1/4.
The probability of unlocking the door in the second try = (3/4)(1/3) = 1/4.
The probability of unlocking the door in the third try = (3/4)(2/3)(1/2) = 1/4.
Therefore, the probability of unlocking the door in at most three tries = 1/4 + 1/4
+ 1/4 = 3/4.
Example 7.3.6
7.3. Expected Value and Tree Diagrams | 303

A jar contains 3 black and 2 white marbles. We continue to draw marbles one at a time until two black
marbles are drawn. If a white marble is drawn, the outcome is recorded and the marble is put back in the jar
before drawing the next marble. What is the probability that we will get exactly two black marbles in at most
three tries?
Solution
We illustrate using a tree diagram.
The probability that we will get two black marbles in the first two tries is listed adjacent to the lowest branch,
and it =
The probability of getting first black, second white, and third black =
304 | 7.3. Expected Value and Tree Diagrams

Similarly, the probability of getting first white, second black, and third black =
Therefore, the probability of getting exactly two black marbles in at most three tries =
Example 7.3.7
A circuit consists of three resistors: resistor R1, resistor R2, and resistor R3, joined in a series. If one of the
resistors fails, the circuit stops working. If the probability that resistors R1, R2, or R3 will fail is 0.07, 0.10, and
0.08, respectively, what is the probability that at least one of the resistors will fail?
Solution
Clearly, the probability that at least one of the resistors fails = 1 − none of the resistors fails.
It is quite easy to find the probability of the event that none of the resistors fails. We don’t even need to draw
a tree because we can visualize the only branch of the tree that assures this outcome.
The probabilities that R1, R2, R3 will not fail are 0.93, 0.90, and 0.92 respectively. Therefore, the probability
that none of the resistors fails = (0.93)(0.90)(0.92) = 0.77.
Thus, the probability that at least one of them will fail = 1 − 0.77 = 0.23.
7.3. Expected Value and Tree Diagrams | 305
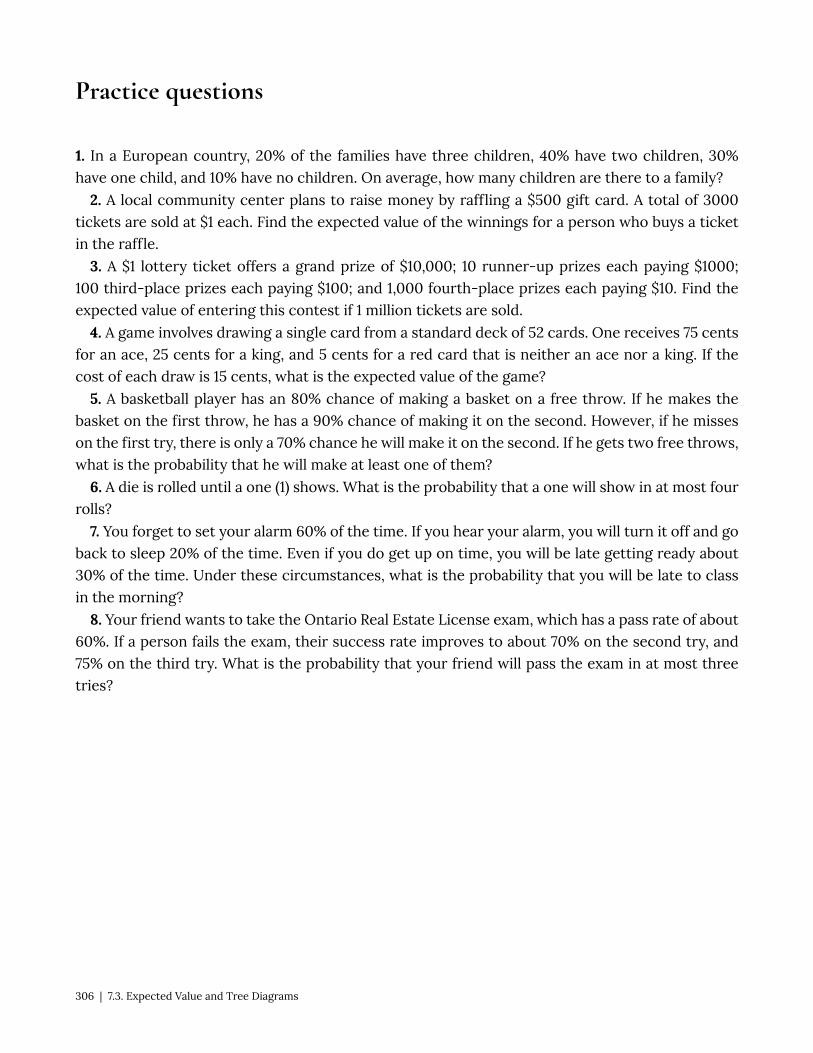
Practice questions
1. In a European country, 20% of the families have three children, 40% have two children, 30%have one child, and 10% have no children. On average, how many children are there to a family?
2. A local community center plans to raise money by raffling a $500 gift card. A total of 3000tickets are sold at $1 each. Find the expected value of the winnings for a person who buys a ticketin the raffle.
3. A $1 lottery ticket offers a grand prize of $10,000; 10 runner-up prizes each paying $1000;100 third-place prizes each paying $100; and 1,000 fourth-place prizes each paying $10. Find theexpected value of entering this contest if 1 million tickets are sold.
4. A game involves drawing a single card from a standard deck of 52 cards. One receives 75 centsfor an ace, 25 cents for a king, and 5 cents for a red card that is neither an ace nor a king. If thecost of each draw is 15 cents, what is the expected value of the game?
5. A basketball player has an 80% chance of making a basket on a free throw. If he makes thebasket on the first throw, he has a 90% chance of making it on the second. However, if he misseson the first try, there is only a 70% chance he will make it on the second. If he gets two free throws,what is the probability that he will make at least one of them?
6. A die is rolled until a one (1) shows. What is the probability that a one will show in at most fourrolls?
7. You forget to set your alarm 60% of the time. If you hear your alarm, you will turn it off and goback to sleep 20% of the time. Even if you do get up on time, you will be late getting ready about30% of the time. Under these circumstances, what is the probability that you will be late to classin the morning?
8. Your friend wants to take the Ontario Real Estate License exam, which has a pass rate of about60%. If a person fails the exam, their success rate improves to about 70% on the second try, and75% on the third try. What is the probability that your friend will pass the exam in at most threetries?
306 | 7.3. Expected Value and Tree Diagrams

7.4. Markov Chains
Markov Chains
We will now study stochastic processes, experiments in which the outcomes of events depend
on the previous outcomes. Such a process or experiment is called a Markov Chain or Markovprocess. The process was first studied by a Russian mathematician named Andrei A. Markov in theearly 1900s.
A small town is served by two telephone companies, Mama Bell and Papa Bell. Due to theiraggressive sales tactics, each month 40% of Mama Bell customers switch to Papa Bell, that is, theother 60% stay with Mama Bell. On the other hand, 30% of the Papa Bell customers switch toMama Bell. The above information can be expressed in a matrix which lists the probabilities of
going from one state into another state. This matrix is called a transition matrix.
The reader should observe that a transition matrix is always a square matrix because all possiblestates must have both rows and columns. All entries in a transition matrix are non-negative as theyrepresent probabilities. Furthermore, since all possible outcomes are considered in the Markovprocess, the sum of the row entries is always 1.
Example 7.4.1
7.4. Markov Chains | 307

Professor Symons either walks to school, or he rides his bicycle. If he walks to school one day, then the next
day, he will walk or cycle with equal probability. But if he bicycles one day, then the probability that he will walk
the next day is 1/4. Express this information in a transition matrix.
Solution
We obtain the following transition matrix by properly placing the row and column entries. Note that if, for
example, Professor Symons bicycles one day, then the probability that he will walk the next day is 1/4, and
therefore, the probability that he will bicycle the next day is 3/4.
Example 7.4.2
In the previous example, if it is assumed that the first day is Monday, write a matrix that gives probabilities of
a transition from Monday to Wednesday.
Solution
Let W denote that Professor Symons walks and B denote that he rides his bicycle. We use the following tree
diagram to compute the probabilities.
308 | 7.4. Markov Chains

Monday Tuesday Wednesday
7.4. Markov Chains | 309

The probability that Professor Symons walked on Wednesday given that he
walked on Monday can be found from the tree diagram, as listed below.
P(Walked Wednesday | Walked Monday) = P(WWW) + P(WBW) = 1/4 + 1/8 = 3/8.
P(Bicycled Wednesday | Walked Monday) = P(WWB) + P(WBB) = 1/4 + 3/8 = 5/8.
P(Walked Wednesday | Bicycled Monday) = P(BWW) + P(BBW) = 1/8 + 3/16 = 5/16.
P(Bicycled Wednesday | Bicycled Monday) = P(BWB) + P(BBB) = 1/8 + 9/16 = 11/16.
We represent the results in the following matrix:
Alternately, this result can be obtained by squaring the original transition matrix.
We list both the original transition matrix T and T2 as follows:
The reader should compare this result with the probabilities obtained from the
tree diagram. Consider the following case, for example:
310 | 7.4. Markov Chains

P(Walked Wednesday | Bicycled Monday) = P(BWW) + P(BBW) = 1/8 + 3/16 = 5/16.
It makes sense because to find the probability that Professor Symons will walk on
Wednesday given that he bicycled on Monday, we sum the probabilities of all paths
that begin with B and end in W. There are two such paths, and they are BWW and
BBW.
Certain Markov chains, called regular Markov chains, tend to stabilize in the long run. It sohappens that the transition matrix we have used in the the above examples is just such a Markovchain. The next example deals with the long term trend or steady-state situation for that matrix.
Example 7.4.3
Suppose Professor Symons continues to walk and bicycle according to the transition matrix given in Example
17.1. In the long run, how often will he walk to school, and how often will he bicycle?
Solution
As we take higher and higher powers of our matrix T, it should stabilize.
7.4. Markov Chains | 311

Therefore, in the long run, Professor Symons will walk to school 1/3 of the time and bicycle 2/3 of the time.
When this happens, we say that the system is in steady-state or state of equilibrium. In thissituation, all row vectors are equal. If the original matrix is an n by n matrix, we get n vectors that
are all the same. We call this vector a fixed probability vector or the equilibrium vector E. In theabove problem, the fixed probability vector E is . Furthermore, if the equilibrium
vector E is multiplied by the original matrix T, the result is the equilibrium vector E. That is,ET = E
or,
Regular Markov Chains
A Markov chain reaches a state of equilibrium if it is a regular Markov chain. A Markov chain is said to be a
regular Markov chain if some power of it has only positive entries.
As we take higher powers of T, Tn, as n becomes large, approaches a state of equilibrium. The equilibrium
distribution vector E can be found by letting ET = E.
Example 7.4.4
A small town is served by two telephone companies, Mama Bell and Papa Bell. Due to their aggressive sales
tactics, each month 40% of Mama Bell customers switch to Papa Bell, that is, the other 60% stay with Mama
Bell. On the other hand, 30% of the Papa Bell customers switch to Mama Bell. The transition matrix is given
below.
312 | 7.4. Markov Chains

If the initial market share for Mama Bell is 20% and for Papa Bell 80%, we’d like to
know the long term market share for each company.
Let matrix T denote the transition matrix for this Markov chain, and M denote the
matrix that represents the initial market share. Then T and M are as follows:
and
Since each month the town’s people switch according to the transition matrix T,
after one month the distribution for each company is as follows:
After two months, the market share for each company is:
After three months the distribution is:
After four months the market share is:
After 30 months the market share is .
The market share after 30 months has stabilized to .
7.4. Markov Chains | 313

This means that:
Once the market share reaches an equilibrium state, it stays the same, that is, ET
= E.
Can the equilibrium vector E be found without raising the transition matrix to large powers? Theanswer to this question provides us with a way to find the equilibrium vector E. The answer lies inthe fact that ET = E. Since we have the matrix T, we can determine E from the statement ET = E.The example below illustrates this approach.
Example 7.4.5
Continuing with the transition matrix T from the previous example, suppose , then
ET = E gives us:
314 | 7.4. Markov Chains

Therefore,
Practice questions
1. A survey of American car buyers indicates that if a person buys a Ford, there is a 60% chancethat their next purchase will be a Ford, while owners of a GM will buy a GM again with a probabilityof 0.80. Express the buying habits of these consumers in a transition matrix.
2. A hockey player decides to either shoot the puck (S) or pass it to a teammate (P) according tothe following transition matrix.
Find the following:
a. If the player shot on the first play, what is the probability that he will pass on the thirdplay?
b. What is the long-term shoot vs. pass distribution of this player?
3. The local police department conducts a campaign to reduce the rates of texting and drivingin the community. The effects of the campaign are summarized in the transition matrix below:
7.4. Markov Chains | 315

If 35% of people in the community reported texting and driving before the campaign:
a. What is the percentage of people in the community that reported texting and drivingafter the campaign?
b. If the campaign were to be repeated multiple times, what is the long-range trend interms of the lowest rate that texting and driving can be reduced to in this community?
4. A large company conducted a training program with their employees to reduce the incidenceof slips, trips and falls in the workplace. About 15% of workers reported a slip, trip or fall accidentthe previous year (year 1). After the training program (year 2), 75% of those who previouslyreported an accident reported no further accidents, while 5% of those who didn’t report aprevious accident reported one this year.
a. Create a transition matrix for this scenario.
b. If the company employs 8500 workers, how many slip, trip and fall accidents werereported in year 2?
c. If the program continued for another year, how many accidents would be reported inyear 3?
d. If the training program were to be repeated for many years, what is the lowestprevalence of slip, trip or fall accidents that could be achieved?
316 | 7.4. Markov Chains

7.5. Practice question answers
Chapter 7 practice question answers
7.1. Binomial Probability
1. 0.0322
2. a. 0.0064
b. 0.2048
c. 0.9424
3. a. 0.1047
b. 0.0604
c. 0.0269
d. 0.2026
4. a. 0.3650
b. 0.2305
5. 0.6778
7.2. Bayes’ Formula
1. a. 0.6458
b. 0.4706
c. 0.625
2. a. 0.125
b. 0.7241
3. a. 0.045
b. 0.2667
7.5. Practice question answers | 317

c. 0.03
4. a. 0.0572
b. 0.07
c. 0.0446
7.3. Expected Value and Tree Diagrams
1. 1.7
2. -0.83 cents
3. -0.96 cents
4. -0.0519 cents
5. 0.94
6. 0.5177
7. 0.776
8. 0.97
7.4. Markov Chains
1.
318 | 7.5. Practice question answers

2. a. 0.32
b. Shoot (S) = , Pass (P) =
3. a. 31%
b. 25%
4. a.
b. 680
c. 561
d. 6.25%
7.5. Practice question answers | 319