mathew j. reeves, phd © dept. of epidemiology, msu 1 lecture 6 – prevention understanding the...
Post on 20-Dec-2015
214 views
TRANSCRIPT

Mathew J. Reeves, PhD © Dept. of Epidemiology, MSU
1
Lecture 6 – Prevention
Understanding the rationale for disease prevention and early intervention (screening)
Mathew J. Reeves BVSc, PhD
Associate Professor, Epidemiology
EPI-546 Block I

Mathew J. Reeves, PhD © Dept. of Epidemiology, MSU
2
Objectives - Concepts
• 1. Primary (1o), Secondary (2o), and Tertiary (3o) prevention• 2. Population-level vs. individual-level prevention• 3. Screening (secondary prevention)
• Mass screening vs. case-finding
• 4. Screening concepts• Pre-clinical phase, lead time, test Se & Sp, importance of trials,
DSMR
• 5. Screening Biases (Observational studies) • Lead-time, Length-time, and Compliance
• 6. Assessing the feasibility of screening • 7. Risks (Harms) vs. Benefits
Mathew J. Reeves, PhD © Dept. of Epidemiology, MSU
3
Objectives - Skills
• 1. Identify examples of 1o, 2o, and 3o prevention
• 2. Communicate the pros and cons of screening
• 3. Explain the importance of selection bias, lead-time and length-time bias in screening programmes
• 4. Understand how to evaluate the efficacy of screening (trials)

Mathew J. Reeves, PhD © Dept. of Epidemiology, MSU
4
Primary (1o) Prevention
• Defn: the protection of health by personal and community-wide efforts with a focus on the whole population
• Objectives:• To prevent new cases of disease occurring and therefore
reduce the incidence of disease
• Where and How?: • Population-level
• Individual level

Mathew J. Reeves, PhD © Dept. of Epidemiology, MSU
5
1o Prevention @ Population-level
• By reducing exposure to causal (risk) factors – e.g., reducing smoking initiation in teenagers
• By adding a factor that prevents disease – e.g., vaccination, water fluoridation
• Usually requires policy and/or legislation – Smoking = tobacco taxes, restrictions on smoking indoors – Physical activity = structural changes to the environment
• sidewalks, walking paths, bike lanes (Town planning)
• Primary prevention at the population-level works best when it is driven by changes in societal attitudes
– e.g., drinking and driving, bikes lanes
Mathew J. Reeves, PhD © Dept. of Epidemiology, MSU
6
1o Prevention @ Individual-level
• By removing or lowering risk factors in at-risk patients• Occurs at the patient-physician level• Rationale behind the periodic health exam (PHE)
– e.g., smoking cessation counseling– e.g., risk factor screening in at-risk patients (BP, BC, Physical
inactivity, abdominal obesity)
• Distinction between primary prevention and secondary prevention hinges on the presence of existing disease
– Primary prevention = no existing disease

Mathew J. Reeves, PhD © Dept. of Epidemiology, MSU
7
Secondary (2o) Prevention• Defn: measures available for the early detection and prompt
treatment of health problems
• Objectives:• To reduce the consequences of disease (death or morbidity) by
screening asymptomatic patients to identify disease in its early stages and intervening with a treatment which is more effective because it is being applied earlier.
• It cannot reduce disease incidence
• Where and how do we screen?: • Population-level or mass screening
• Individual-level screening or case finding

Mathew J. Reeves, PhD © Dept. of Epidemiology, MSU
8
Screening – two different approaches
• Population-level screening• National level policy decision to offer mass screening to a whole sub-
group of a population – e.g., mammography screening (women 40+)– e.g., Vision and hearing screening of all Michigan 2nd graders
• Individual-level screening• Occurs at the individual patient-physician level • Also refereed to case finding
– e.g., BP screening every time you visit MD – e.g., PSA screening
• Also a component of the PHE. • Focus is on identifying existing disease in patients who don’t know they
have it.

Mathew J. Reeves, PhD © Dept. of Epidemiology, MSU
9
Tertiary (3o) Prevention
• Defn: measures available to reduce or eliminate long-term impairments and disabilities, minimize suffering, and promote adjustments to irremediable conditions
• Objectives:• To reduce the consequences of disease (esp. complications and suffering) by
treating disease and/or its direct complications in symptomatic patients.
• A proactive approach to medical care• may involve rehabilitative and/or palliative care
• Examples – education about disease management (asthma)– regular foot exams in diabetics– pain management in hospice patients

Mathew J. Reeves, PhD © Dept. of Epidemiology, MSU
10
Example - Fire Prevention
• Primary (prevent fires from starting)• Education (Smokey the Bear)• Outside fire bans (drought)
• Secondary (early detection)• Smoke detectors• Lookout towers
• Tertiary (reduce consequences)• Fire brigades & smoke jumpers• Fire resistant construction

Mathew J. Reeves, PhD © Dept. of Epidemiology, MSU
11
Prevention – A Reality Check
• Very few preventive interventions are cost saving• e.g., childhood vaccination, seatbelts
• Almost all preventive interventions – even those that work well - cost money!!• e.g., Mam screening $40,000 per YLS
• Prof. Geoffrey Rose, 1992• There is only one rationale to do prevention and that is
ethical

Mathew J. Reeves, PhD © Dept. of Epidemiology, MSU
12
Prevention – A Reality Check
• Compared to the traditional clinical treatment (curative) approach, effective clinical prevention is hard to sustain because:
• Its much less effective (as measured by NNT)– NNT for 1 year statin use for stroke 1o prevention = >13,000
– NNT for lifetime seatbelt use = 400
• Prevention Paradox: • A measure that provides large benefit to the community may
offer little to most individuals.

Mathew J. Reeves, PhD © Dept. of Epidemiology, MSU
13
Screening - Introduction
• Objective: to reduce mortality and/or morbidity by early detection and treatment.
• Secondary prevention.
• Asymptomatic individuals are classified as either unlikely or possibly having disease.
• Important distinction between mass or population-based screening and case finding.
• The allure of screening brought on by new technology is almost irresistible…..

Mathew J. Reeves, PhD © Dept. of Epidemiology, MSU
14

Mathew J. Reeves, PhD © Dept. of Epidemiology, MSU
15
Screening - Introduction
• Effective screening involves both diagnostic and treatment components
• Screening differs from diagnostic testing:
Screening Testing Healthy non-patients Sick patients
No diagnostic intent Diagnostic intent
Very low to low disease prevalence
Low to high disease prevalence

Mathew J. Reeves, PhD © Dept. of Epidemiology, MSU
16
I. Important Concepts in Screening
The Pre-Clinical Phase (PCP)• the period between when early detection by
screening is possible and when the clinical diagnosis would normally have occurred.
Pathology begins
Disease detectable Normal Clinical Presentation
Pre-Clinical Phase
Mathew J. Reeves, PhD © Dept. of Epidemiology, MSU
17
Pre-clinical Phase (PCP)
• Important to know PCP since it helps determine:• Expected utility of screening
– Colorectal cancer = 7-10 years– Childhood diabetes = 2-6 months
• Required minimal frequency of screening– Mam screening women 40-49 = 1-2 years– Mam screening women 50-69 = 3-4 years
• Prevalence of PCP indicates how much early disease there is to detect
• Prevalence of PCP is affected by:• disease incidence, average duration of the PCP, previous screening, sensitivity
of the test • …..see concept of Prevalence pool (Lecture 3)

Mathew J. Reeves, PhD © Dept. of Epidemiology, MSU
18
Lead Time
Lead time = amount of time by which diagnosis is advanced or made earlier
Pathology begins
Disease detectable Normal Clinical Presentation
Lead Time
Screen
Mathew J. Reeves, PhD © Dept. of Epidemiology, MSU
19
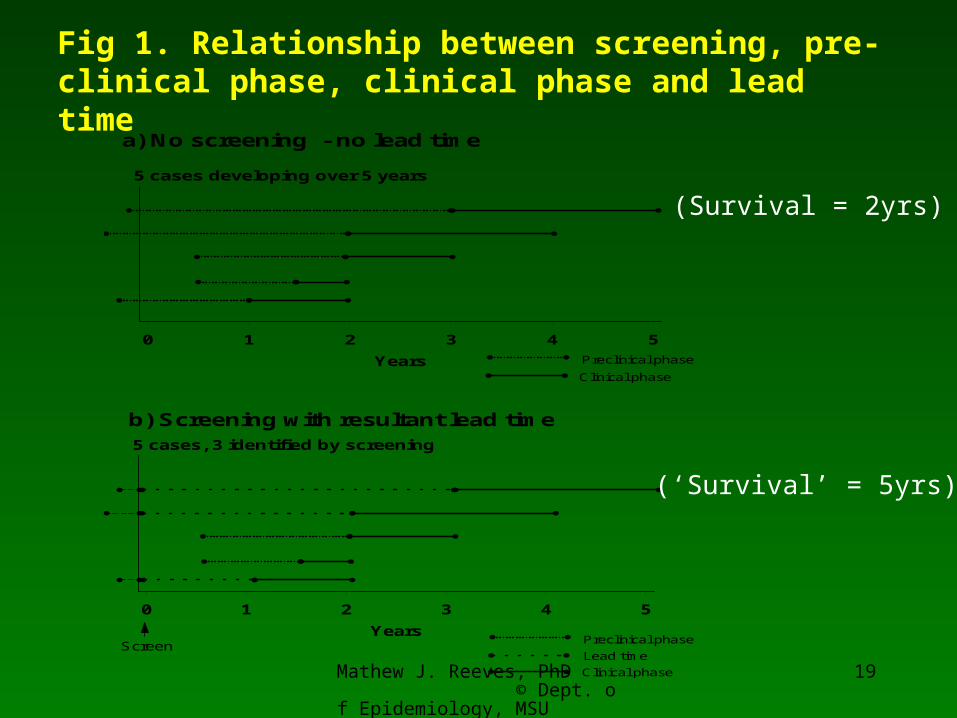
a) No screening - no lead time
Clinical phase
Preclinical phase
5 cases developing over 5 years
0 1 2 3 4 5
Years
Fig 1. Relationship between screening, pre-clinical phase, clinical phase and lead time
b) Screening with resultant lead time
Lead time
Preclinical phase
Clinical phase
Screen
5 cases, 3 identified by screening
0 1 2 3 4 5
Years
(Survival = 2yrs)
(‘Survival’ = 5yrs)

Mathew J. Reeves, PhD © Dept. of Epidemiology, MSU
20
Lead Time
• Equals the amount of time by which treatment is advanced or made “early”
• Not a theory or statistical artifact but what is expected and must occur with early detection
• Does not imply improved outcome!!
• Necessary but not sufficient condition for effective screening.
Mathew J. Reeves, PhD © Dept. of Epidemiology, MSU
21
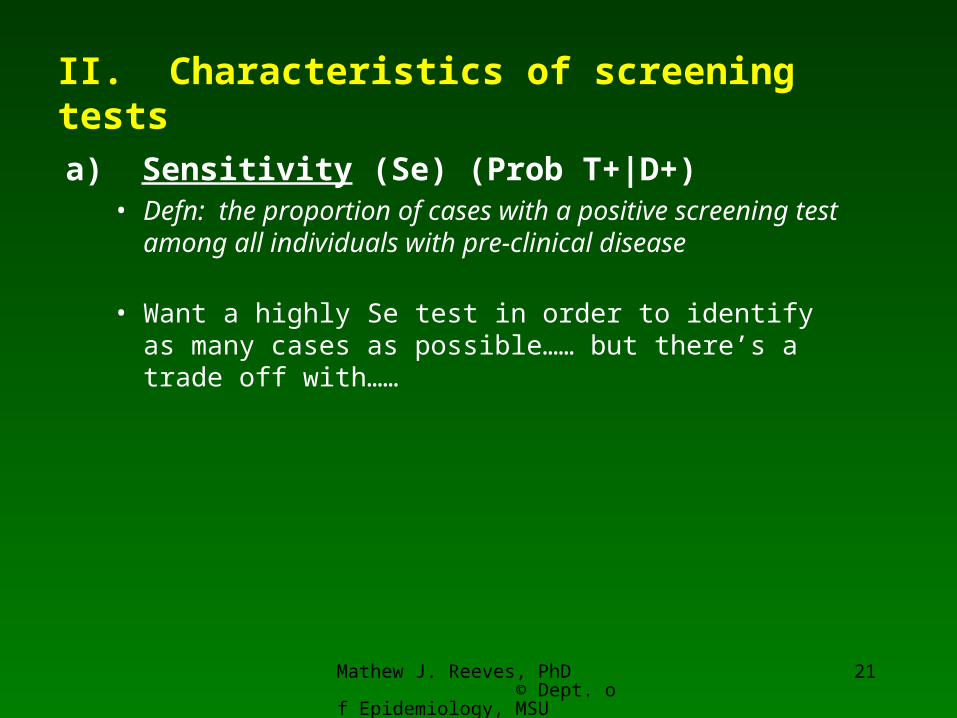
II. Characteristics of screening tests
a) Sensitivity (Se) (Prob T+|D+)• Defn: the proportion of cases with a positive screening test
among all individuals with pre-clinical disease
• Want a highly Se test in order to identify as many cases as possible…… but there’s a trade off with……

Mathew J. Reeves, PhD © Dept. of Epidemiology, MSU
22
II. Characteristics of screening tests
• b) Specificity (Sp) (Prob T-|D-)• Defn: the proportion of individuals with a negative screening
test result among all individuals with no pre-clinical disease
• The feasibility and efficiency of screening programs is acutely sensitive to the PVP which is often very low due to the very low disease prevalence
• e.g., PVP of +ve FOBT for CR CA = < 10%
• N.B. Imperfect Sp affects many (the healthy), whereas an imperfect Se affects only a few (the sick)

Mathew J. Reeves, PhD © Dept. of Epidemiology, MSU
23
III. Evaluation of Screening OutcomesHow do we know if screening is helpful?
RCT • Compare disease-specific mortality rate (DSMR)
between those randomized to screening and those not
• Eliminates all forms of bias (theoretically)• But, problems of:
– Expense, time consuming, logistically difficult, contamination, non-compliance, ethical concerns, changing technology.
• Can also evaluate screening programmes using Cohort and Case-control studies, but they are difficult to do and very susceptible to bias.

Mathew J. Reeves, PhD © Dept. of Epidemiology, MSU
24
The only valid measure of screening is…
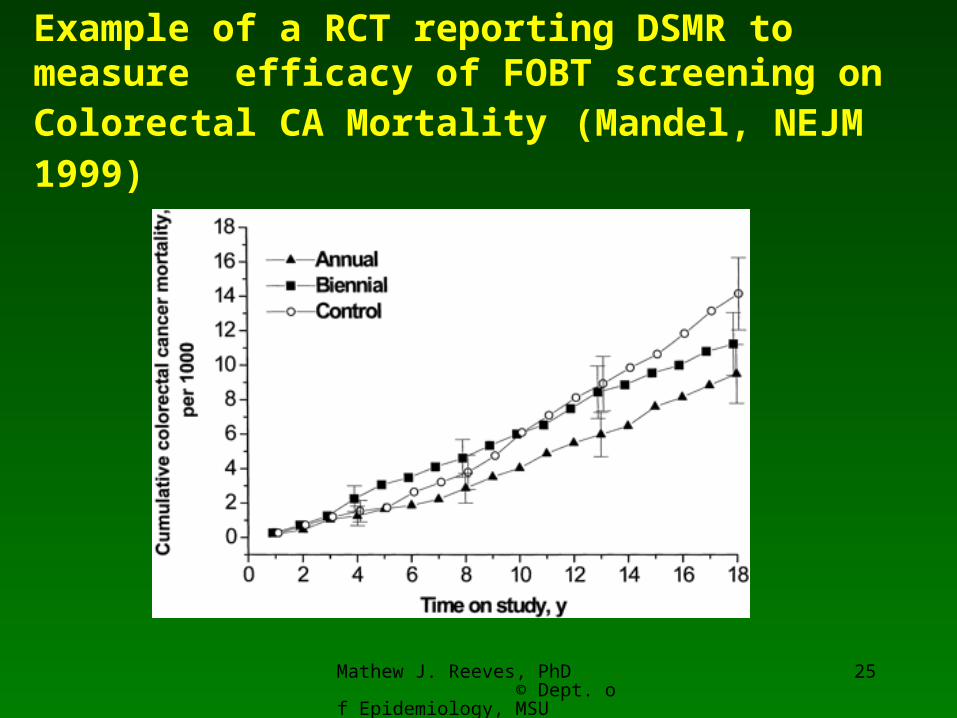
Disease-specific Mortality Rate (DSMR)
the number of deaths due to disease
Total person-years experience
• The only gold-standard outcome measure for screening• NOT affected by lead time • when calculated from a RCT - not affected by compliance
bias or length-time bias.• However, there can be problems with the correct
assignment of cause of death (hence some researchers advocate using only all-cause mortality as the outcome).
Mathew J. Reeves, PhD © Dept. of Epidemiology, MSU
25
Example of a RCT reporting DSMR to measure efficacy of FOBT screening on Colorectal CA Mortality (Mandel, NEJM 1999)

Mathew J. Reeves, PhD © Dept. of Epidemiology, MSU
26
IV. Biases that effect screening studies
• Observational studies and especially survival data are acutely sensitive to:
• 1. Compliance bias (Selection bias):– Volunteers or compliers are better educated and more health conscious – thus they
have inherently better prognosis
• 2. Lead-time bias– Apparent increased survival duration introduced by the lead time that results from
screening. – Screen-detected cases survive longer event without benefit of early treatment
(review Fig 2 in course notes).
• 3. Length-time bias – Screening preferentially identifies slower growing or less progressive cases that
have a better prognosis.

Mathew J. Reeves, PhD © Dept. of Epidemiology, MSU
27
Length-time bias – cases with better prognosis detected by screening
SCREENING
DX
DX
DX
DX
X
X
X
X
Better Prognosis Cases
Worse Prognosis Cases

Mathew J. Reeves, PhD © Dept. of Epidemiology, MSU
28
V. Pseudo-disease and Over-diagnosis
• Over-diagnosis• Limited malignant potential• Extreme form of length-biased sampling• Examp: Pap screening and cervical carcinoma
• Competing risks• Cases detected that would have been interrupted by an unrelated
death• Examp: Prostate CA and CVD death
• Serendipity• Chance detection due to diagnostic testing for another reason • Examp: PSA and prostate CA, FOBT and CR CA

Mathew J. Reeves, PhD © Dept. of Epidemiology, MSU
29
Over-diagnosis – Effect of Mass Pap Screening in Connecticut (Laskey 1976)
Age-adj. Incidence Rate (per 100,000)
Year In-situ Invasive Total % In-situ
1950-54 3.8 18.1 21.9 17
1955-59 9.7 17.1 26.8 36
1960-64 18.8 13.6 32.4 58
1965-69 28.6 11.6 40.2 71
1970-73 32.8 10.9 43.7 75

Mathew J. Reeves, PhD © Dept. of Epidemiology, MSU
30
VI. Assessing the feasibility of screening
• Burden of disease• Effectiveness of treatment without screening
• Acceptability • Convenience, comfort, safety, costs (= compliance)
• Efficacy of screening• Test characteristics (Se, Sp)• Potential to reduce mortality
• Efficiency• Low PVP• Risks and costs of follow-up of test positives • Cost-effectiveness
– Annual Mam screening (50-70 yrs) = $30 – 50,000 /YLS– Annual Pap screening (20-75 yrs) = $1,300,000 YLS
• Balance of risks (harms) vs. benefits

Mathew J. Reeves, PhD © Dept. of Epidemiology, MSU
31

Mathew J. Reeves, PhD © Dept. of Epidemiology, MSU
32
Feasibility
• Efficacy
• Effectiveness
• Cost-effectiveness
• Should we screen? (scientific)
• Can we screen? (practical)
• Is it worth it? (scientific, practical, policy, political)
• Three questions to ask before screening: