matlab® @ work - datatooldatatool.com/downloads/matlab table programming.pdf · matlab® @ work...
TRANSCRIPT
MATLAB® @ Work
[email protected] www.datatool.com
Table Programming Richard Johnson
A table is a MATLAB container for storing column-oriented variables that have the same number of
rows. Unlike numerical or character arrays, the columns can have different data types.
Many of the features of the table are best understood in the context of object oriented programming.
Tables were introduced in R2013b.
Contents
Review of table fundamentals .................................................................................................................. 2
Rownames ................................................................................................................................................. 3
Size functions ............................................................................................................................................ 5
Concatenation ........................................................................................................................................... 7
Missing values ........................................................................................................................................... 9
Joins ........................................................................................................................................................ 11
Grouping ................................................................................................................................................. 13
readtable ................................................................................................................................................. 15
writetable ................................................................................................................................................ 15
Conversion functions .............................................................................................................................. 16
Other considerations .............................................................................................................................. 19
Review ..................................................................................................................................................... 19
Exercises .................................................................................................................................................. 20
Appendix ................................................................................................................................................. 21

2
Review of table fundamentals A table is most useful for storing column-oriented data where the columns (variables) have
different data types.
It is a class with properties and methods.
Its public properties are the data variables and a structure unfortunately named Properties.
The Properties structure has non-extendable fields that are useful for metadata. One of the
fields of Properties is a structure named UserData that you can use for arbitrary contents.
Most of its methods support database and logical set operations. It also has overloads for many
computational functions.
It supports normal indexing for data extraction or replacement.
There is an import function readtable that is useful but a bit limited. You can also use the
Import Data Wizard.
3
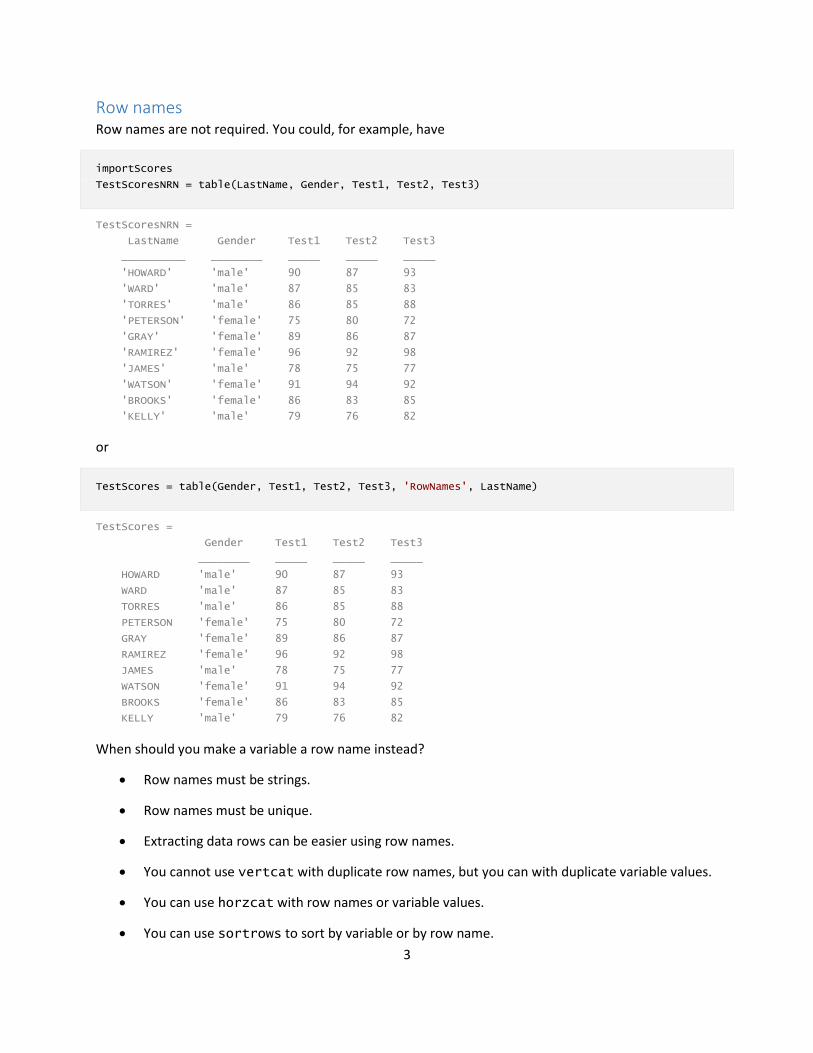
Row names Row names are not required. You could, for example, have
importScores
TestScoresNRN = table(LastName, Gender, Test1, Test2, Test3)
TestScoresNRN =
LastName Gender Test1 Test2 Test3
__________ ________ _____ _____ _____
'HOWARD' 'male' 90 87 93
'WARD' 'male' 87 85 83
'TORRES' 'male' 86 85 88
'PETERSON' 'female' 75 80 72
'GRAY' 'female' 89 86 87
'RAMIREZ' 'female' 96 92 98
'JAMES' 'male' 78 75 77
'WATSON' 'female' 91 94 92
'BROOKS' 'female' 86 83 85
'KELLY' 'male' 79 76 82
or
TestScores = table(Gender, Test1, Test2, Test3, 'RowNames', LastName)
TestScores =
Gender Test1 Test2 Test3
________ _____ _____ _____
HOWARD 'male' 90 87 93
WARD 'male' 87 85 83
TORRES 'male' 86 85 88
PETERSON 'female' 75 80 72
GRAY 'female' 89 86 87
RAMIREZ 'female' 96 92 98
JAMES 'male' 78 75 77
WATSON 'female' 91 94 92
BROOKS 'female' 86 83 85
KELLY 'male' 79 76 82
When should you make a variable a row name instead?
Row names must be strings.
Row names must be unique.
Extracting data rows can be easier using row names.
You cannot use vertcat with duplicate row names, but you can with duplicate variable values.
You can use horzcat with row names or variable values.
You can use sortrows to sort by variable or by row name.

4
You can convert between the two formats.
To convert a variable to row names
TestScoresWithRN = TestScoresNRN;
TestScoresWithRN.Properties.RowNames = TestScoresNRN.LastName;
TestScoresWithRN.LastName = []
TestScoresWithRN =
Gender Test1 Test2 Test3
________ _____ _____ _____
HOWARD 'male' 90 87 93
WARD 'male' 87 85 83
TORRES 'male' 86 85 88
PETERSON 'female' 75 80 72
GRAY 'female' 89 86 87
RAMIREZ 'female' 96 92 98
JAMES 'male' 78 75 77
WATSON 'female' 91 94 92
BROOKS 'female' 86 83 85
KELLY 'male' 79 76 82
To convert row names to a variable
TestScoresWithoutRN = TestScoresWithRN;
TestScoresWithoutRN.LastName = TestScoresWithRN.Properties.RowNames;
TestScoresWithoutRN.Properties.RowNames = {};
TestScoresWithoutRN = TestScoresWithoutRN(:, [5 1 2 3 4])
TestScoresWithoutRN =
LastName Gender Test1 Test2 Test3
__________ ________ _____ _____ _____
'HOWARD' 'male' 90 87 93
'WARD' 'male' 87 85 83
'TORRES' 'male' 86 85 88
'PETERSON' 'female' 75 80 72
'GRAY' 'female' 89 86 87
'RAMIREZ' 'female' 96 92 98
'JAMES' 'male' 78 75 77
'WATSON' 'female' 91 94 92
'BROOKS' 'female' 86 83 85
'KELLY' 'male' 79 76 82
You could use the variable names rather than the column numbers to rearrange the table in this last line
of code.
5
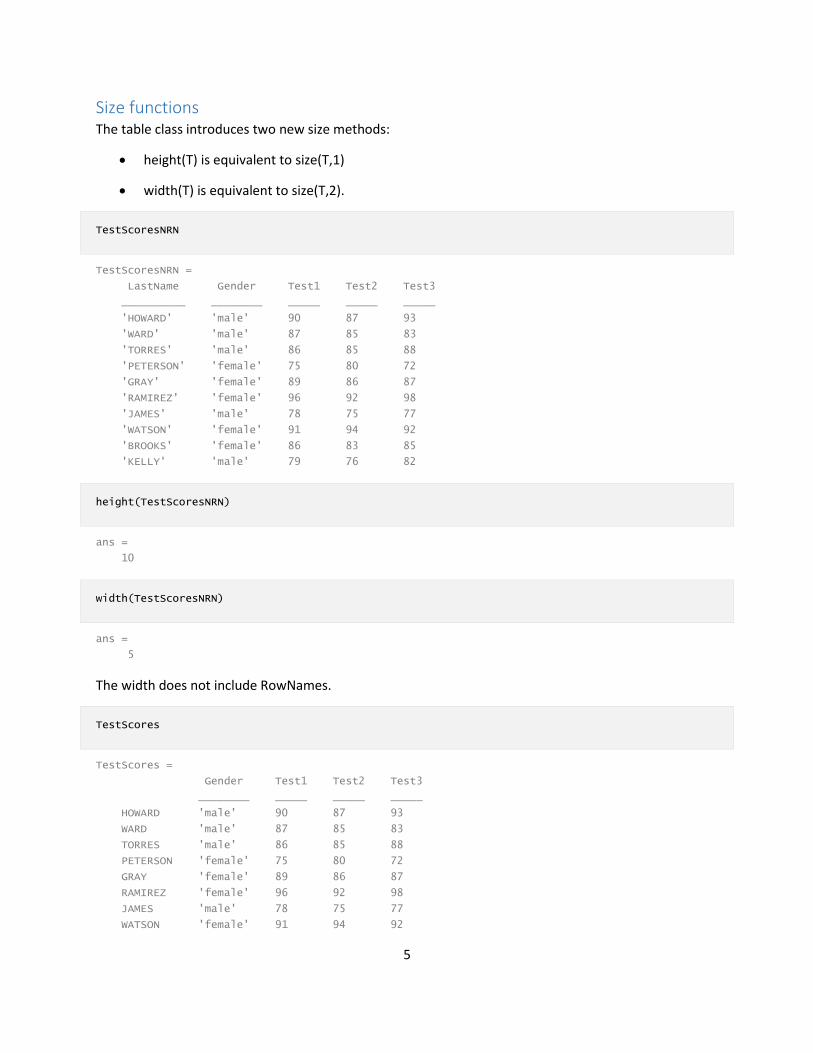
Size functions The table class introduces two new size methods:
height(T) is equivalent to size(T,1)
width(T) is equivalent to size(T,2).
TestScoresNRN
TestScoresNRN =
LastName Gender Test1 Test2 Test3
__________ ________ _____ _____ _____
'HOWARD' 'male' 90 87 93
'WARD' 'male' 87 85 83
'TORRES' 'male' 86 85 88
'PETERSON' 'female' 75 80 72
'GRAY' 'female' 89 86 87
'RAMIREZ' 'female' 96 92 98
'JAMES' 'male' 78 75 77
'WATSON' 'female' 91 94 92
'BROOKS' 'female' 86 83 85
'KELLY' 'male' 79 76 82
height(TestScoresNRN)
ans =
10
width(TestScoresNRN)
ans =
5
The width does not include RowNames.
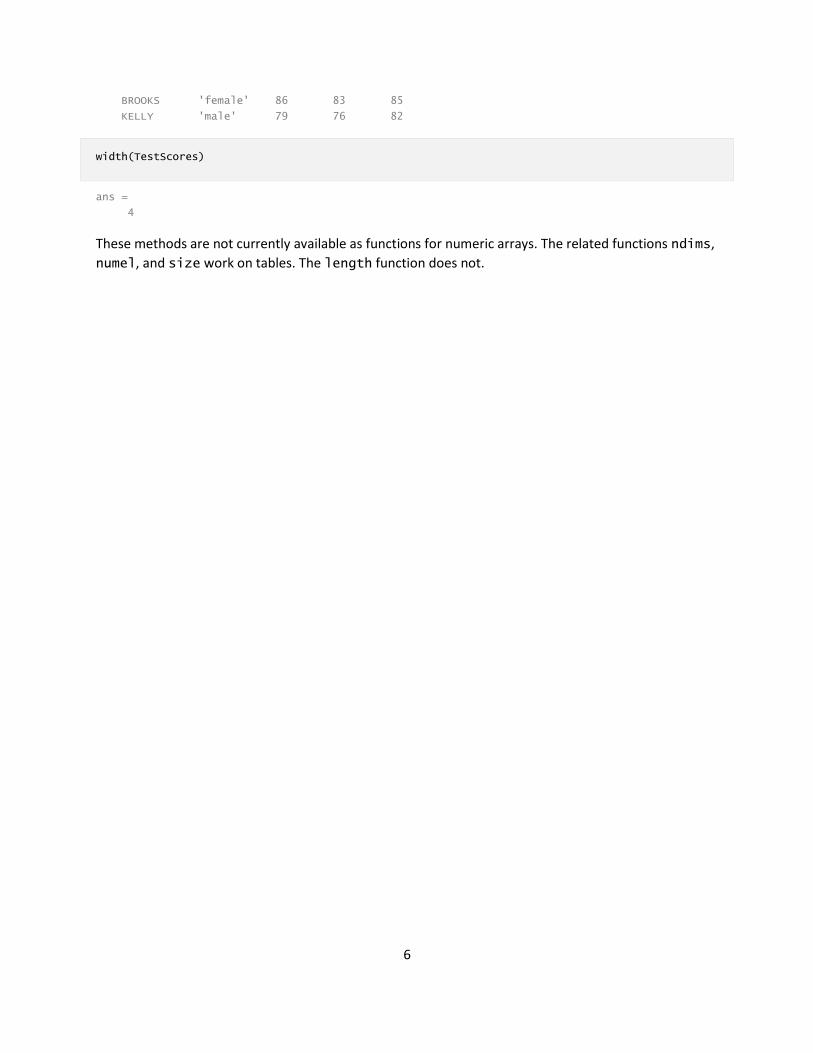
TestScores
TestScores =
Gender Test1 Test2 Test3
________ _____ _____ _____
HOWARD 'male' 90 87 93
WARD 'male' 87 85 83
TORRES 'male' 86 85 88
PETERSON 'female' 75 80 72
GRAY 'female' 89 86 87
RAMIREZ 'female' 96 92 98
JAMES 'male' 78 75 77
WATSON 'female' 91 94 92
6
BROOKS 'female' 86 83 85
KELLY 'male' 79 76 82
width(TestScores)
ans =
4
These methods are not currently available as functions for numeric arrays. The related functions ndims,
numel, and size work on tables. The length function does not.
7
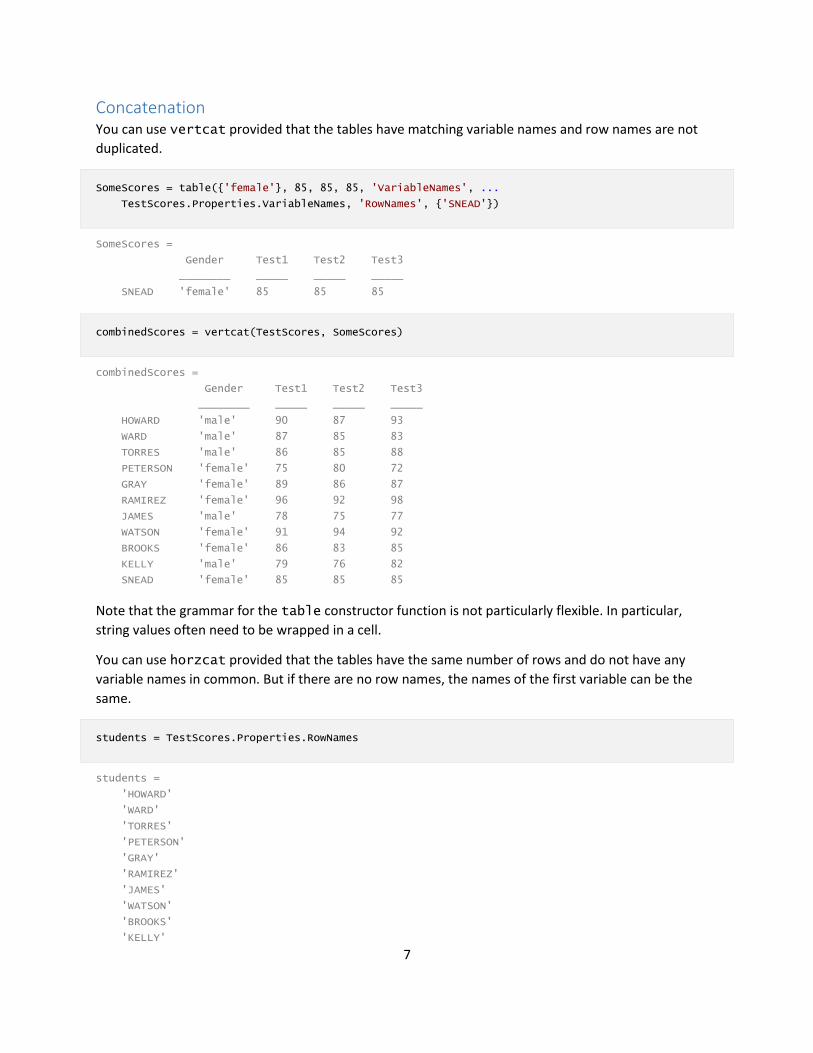
Concatenation You can use vertcat provided that the tables have matching variable names and row names are not
duplicated.
SomeScores = table({'female'}, 85, 85, 85, 'VariableNames', ...
TestScores.Properties.VariableNames, 'RowNames', {'SNEAD'})
SomeScores =
Gender Test1 Test2 Test3
________ _____ _____ _____
SNEAD 'female' 85 85 85
combinedScores = vertcat(TestScores, SomeScores)
combinedScores =
Gender Test1 Test2 Test3
________ _____ _____ _____
HOWARD 'male' 90 87 93
WARD 'male' 87 85 83
TORRES 'male' 86 85 88
PETERSON 'female' 75 80 72
GRAY 'female' 89 86 87
RAMIREZ 'female' 96 92 98
JAMES 'male' 78 75 77
WATSON 'female' 91 94 92
BROOKS 'female' 86 83 85
KELLY 'male' 79 76 82
SNEAD 'female' 85 85 85
Note that the grammar for the table constructor function is not particularly flexible. In particular,
string values often need to be wrapped in a cell.
You can use horzcat provided that the tables have the same number of rows and do not have any
variable names in common. But if there are no row names, the names of the first variable can be the
same.
students = TestScores.Properties.RowNames
students =
'HOWARD'
'WARD'
'TORRES'
'PETERSON'
'GRAY'
'RAMIREZ'
'JAMES'
'WATSON'
'BROOKS'
'KELLY'

8
average = mean(TestScores{:, {'Test1', 'Test2', 'Test3'}},2)
average =
90.0000
85.0000
86.3333
75.6667
87.3333
95.3333
76.6667
92.3333
84.6667
79.0000
AverageScores = table(average, 'VariableNames', {'Average'},...
'RowNames', students)
AverageScores =
Average
_______
HOWARD 90
WARD 85
TORRES 86.333
PETERSON 75.667
GRAY 87.333
RAMIREZ 95.333
JAMES 76.667
WATSON 92.333
BROOKS 84.667
KELLY 79
summaryScores = horzcat(TestScores, AverageScores)
summaryScores =
Gender Test1 Test2 Test3 Average
________ _____ _____ _____ _______
HOWARD 'male' 90 87 93 90
WARD 'male' 87 85 83 85
TORRES 'male' 86 85 88 86.333
PETERSON 'female' 75 80 72 75.667
GRAY 'female' 89 86 87 87.333
RAMIREZ 'female' 96 92 98 95.333
JAMES 'male' 78 75 77 76.667
WATSON 'female' 91 94 92 92.333
BROOKS 'female' 86 83 85 84.667
KELLY 'male' 79 76 82 79
You can also use the square bracket notation for horizontal concatenation.
9
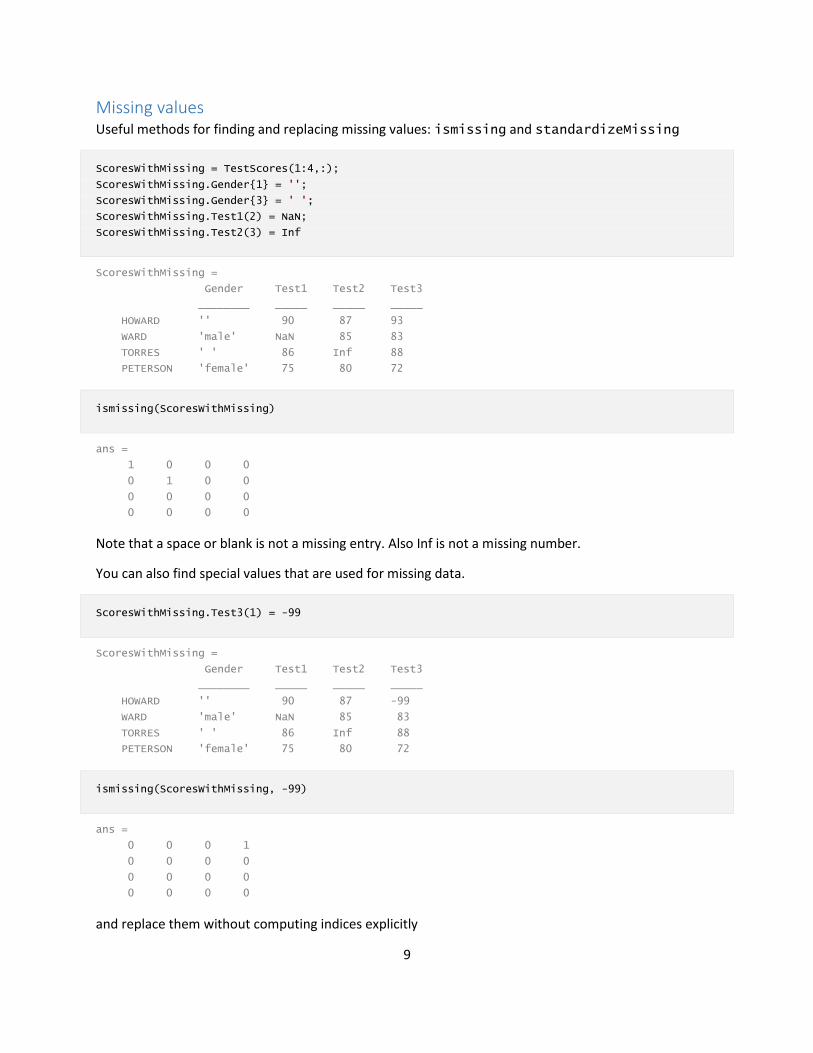
Missing values Useful methods for finding and replacing missing values: ismissing and standardizeMissing
ScoresWithMissing = TestScores(1:4,:);
ScoresWithMissing.Gender{1} = '';
ScoresWithMissing.Gender{3} = ' ';
ScoresWithMissing.Test1(2) = NaN;
ScoresWithMissing.Test2(3) = Inf
ScoresWithMissing =
Gender Test1 Test2 Test3
________ _____ _____ _____
HOWARD '' 90 87 93
WARD 'male' NaN 85 83
TORRES ' ' 86 Inf 88
PETERSON 'female' 75 80 72
ismissing(ScoresWithMissing)
ans =
1 0 0 0
0 1 0 0
0 0 0 0
0 0 0 0
Note that a space or blank is not a missing entry. Also Inf is not a missing number.
You can also find special values that are used for missing data.
ScoresWithMissing.Test3(1) = -99
ScoresWithMissing =
Gender Test1 Test2 Test3
________ _____ _____ _____
HOWARD '' 90 87 -99
WARD 'male' NaN 85 83
TORRES ' ' 86 Inf 88
PETERSON 'female' 75 80 72
ismissing(ScoresWithMissing, -99)
ans =
0 0 0 1
0 0 0 0
0 0 0 0
0 0 0 0
and replace them without computing indices explicitly

10
ScoresWithMissing = standardizeMissing(ScoresWithMissing, -99)
ScoresWithMissing =
Gender Test1 Test2 Test3
________ _____ _____ _____
HOWARD '' 90 87 NaN
WARD 'male' NaN 85 83
TORRES ' ' 86 Inf 88
PETERSON 'female' 75 80 72

11
Joins You can apply join, innerjoin, outerjoin to tables. These methods combine the contents of two
tables using row names or variables as key values. The output is a table.
For an example using join methods, make two partly overlapping tables
Study = readtable('patients.dat');
HeightWeight = Study(1:4, {'LastName', 'Height', 'Weight'})
HeightWeight =
LastName Height Weight
__________ ______ ______
'Smith' 71 176
'Johnson' 69 163
'Williams' 64 131
'Jones' 67 133
BP = Study(2:6, {'LastName', 'Systolic', 'Diastolic'})
BP =
LastName Systolic Diastolic
__________ ________ _________
'Johnson' 109 77
'Williams' 125 83
'Jones' 117 75
'Brown' 122 80
'Davis' 121 70
To get the patients in common
disp(innerjoin(BP, HeightWeight))
LastName Systolic Diastolic Height Weight
__________ ________ _________ ______ ______
'Johnson' 109 77 69 163
'Jones' 117 75 67 133
'Williams' 125 83 64 131
To get all patients
disp(outerjoin(BP, HeightWeight))
LastName_BP Systolic Diastolic LastName_HeightWeight Height
___________ ________ _________ _____________________ ______
'Brown' 122 80 '' NaN
'Davis' 121 70 '' NaN
'Johnson' 109 77 'Johnson' 69
'Jones' 117 75 'Jones' 67
12
'' NaN NaN 'Smith' 71
'Williams' 125 83 'Williams' 64
Weight
______
NaN
NaN
163
133
176
131
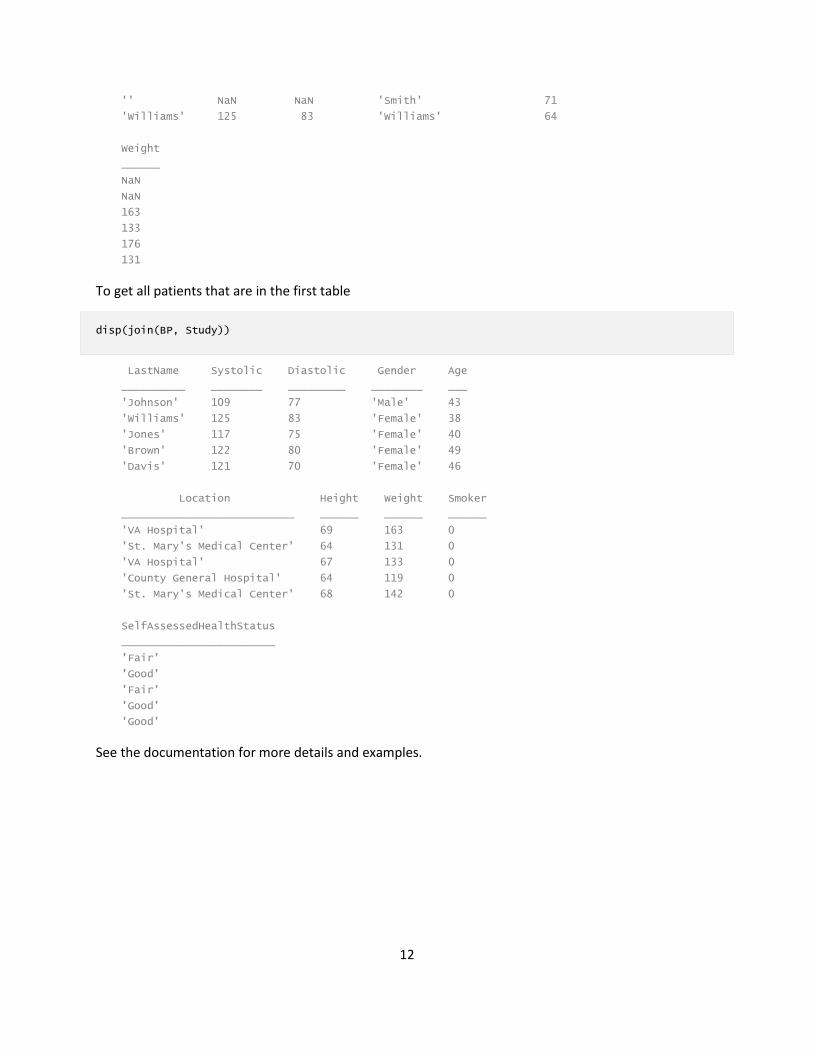
To get all patients that are in the first table
disp(join(BP, Study))
LastName Systolic Diastolic Gender Age
__________ ________ _________ ________ ___
'Johnson' 109 77 'Male' 43
'Williams' 125 83 'Female' 38
'Jones' 117 75 'Female' 40
'Brown' 122 80 'Female' 49
'Davis' 121 70 'Female' 46
Location Height Weight Smoker
___________________________ ______ ______ ______
'VA Hospital' 69 163 0
'St. Mary's Medical Center' 64 131 0
'VA Hospital' 67 133 0
'County General Hospital' 64 119 0
'St. Mary's Medical Center' 68 142 0
SelfAssessedHealthStatus
________________________
'Fair'
'Good'
'Fair'
'Good'
'Good'
See the documentation for more details and examples.

13
Grouping Grouping variables are utility variables used to group or categorize data. Grouping variables are useful
for summarizing or visualizing data by group. You can define groups in your table by specifying one or
more grouping variables.
You can use stack and unstack and aggregation functions (that compute a scalar from a column
vector) to work with data and grouping variables. The results will be in a table.
WeightStudy = Study(1:5, [2 4 6])
WeightStudy =
Gender Location Weight
________ ___________________________ ______
'Male' 'County General Hospital' 176
'Male' 'VA Hospital' 163
'Female' 'St. Mary's Medical Center' 131
'Female' 'VA Hospital' 133
'Female' 'County General Hospital' 119
CategoryWeight = unstack(WeightStudy, 'Weight', 'Location')
Warning: Variable names were modified to make them valid MATLAB identifiers.
CategoryWeight =
Gender CountyGeneralHospital St_Mary_sMedicalCenter VAHospital
________ _____________________ ______________________ __________
'Male' 176 NaN 163
'Female' 119 131 133
It can be useful to apply aggregation with unstack
BiggerWeightStudy = Study(1:25, [2 4 6]);
AverageCategoryWeight = unstack(BiggerWeightStudy, 'Weight', 'Location',...
'AggregationFunction', @mean)
Warning: Variable names were modified to make them valid MATLAB identifiers.
AverageCategoryWeight =
Gender CountyGeneralHospital St_Mary_sMedicalCenter VAHospital
________ _____________________ ______________________ __________
'Male' 175.67 187 180
'Female' 129.6 134.75 132.17
You can use the methods rowfun and varfun to apply aggregation functions to table data. The results
will be in a table. See the documentation for details and examples.
Stats = Study(1:15, [3 5 6])

14
Stats =
Age Height Weight
___ ______ ______
38 71 176
43 69 163
38 64 131
40 67 133
49 64 119
46 68 142
33 64 142
40 68 180
28 68 183
31 66 132
45 68 128
42 66 137
25 71 174
39 72 202
36 65 129
AverageStats = varfun(@mean, Stats)
AverageStats =
mean_Age mean_Height mean_Weight
________ ___________ ___________
38.2 67.4 151.4
Many of the capabilities of grouping variables can be achieved through indexing. Using grouping
variables is generally cleaner when there are more than 2 groups.
See the documentation for details and examples.

15
readtable The readtable function works well for column oriented spreadsheet data. It has a big limitation for
reading text files in that it lacks the ability to treat multiple delimiters as one. This can often be a
problem for space delimited files.
You may need to use textscan, importdata, or convert to spreadsheet using Import Wizard then use
readtable.
writetable The writetable function can write a table to either a comma-delimited text file or an Excel
spreadsheet. It cannot write either a space or a tab delimited text file. It writes numbers to text files in g
format.

16
Conversion functions table2array
scores = table2array(TestScoresNRN(1:8, 3:5))
variables = TestScoresNRN.Properties.VariableNames(3:5)
scores =
90 87 93
87 85 83
86 85 88
75 80 72
89 86 87
96 92 98
78 75 77
91 94 92
variables =
'Test1' 'Test2' 'Test3'
array2table
ScoresOnly = array2table(scores, 'VariableNames', variables)
ScoresOnly =
Test1 Test2 Test3
_____ _____ _____
90 87 93
87 85 83
86 85 88
75 80 72
89 86 87
96 92 98
78 75 77
91 94 92
table2cell
scoreCells = table2cell(TestScoresNRN(:,2:5))
variables = TestScoresNRN.Properties.VariableNames(2:5)
scoreCells =
'male' [90] [87] [93]
'male' [87] [85] [83]
'male' [86] [85] [88]
'female' [75] [80] [72]
'female' [89] [86] [87]
'female' [96] [92] [98]
'male' [78] [75] [77]
'female' [91] [94] [92]
'female' [86] [83] [85]
17
'male' [79] [76] [82]
variables =
'Gender' 'Test1' 'Test2' 'Test3'
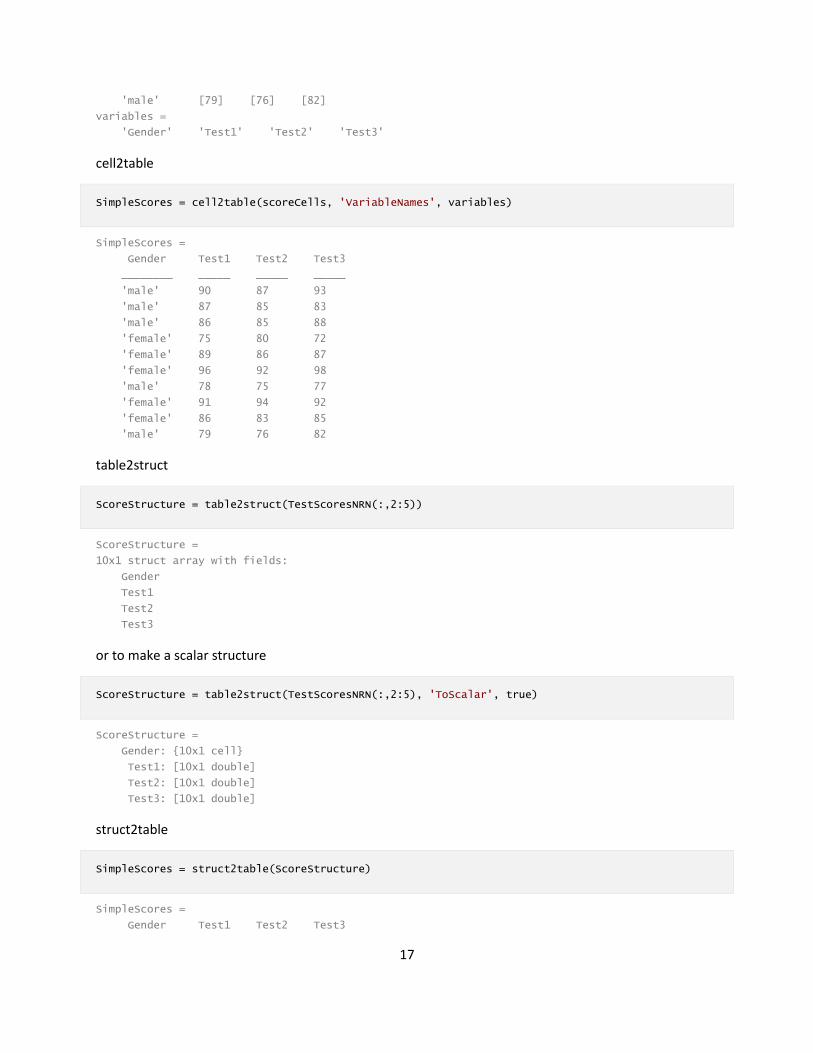
cell2table
SimpleScores = cell2table(scoreCells, 'VariableNames', variables)
SimpleScores =
Gender Test1 Test2 Test3
________ _____ _____ _____
'male' 90 87 93
'male' 87 85 83
'male' 86 85 88
'female' 75 80 72
'female' 89 86 87
'female' 96 92 98
'male' 78 75 77
'female' 91 94 92
'female' 86 83 85
'male' 79 76 82
table2struct
ScoreStructure = table2struct(TestScoresNRN(:,2:5))
ScoreStructure =
10x1 struct array with fields:
Gender
Test1
Test2
Test3
or to make a scalar structure
ScoreStructure = table2struct(TestScoresNRN(:,2:5), 'ToScalar', true)
ScoreStructure =
Gender: {10x1 cell}
Test1: [10x1 double]
Test2: [10x1 double]
Test3: [10x1 double]
struct2table
SimpleScores = struct2table(ScoreStructure)
SimpleScores =
Gender Test1 Test2 Test3

18
________ _____ _____ _____
'male' 90 87 93
'male' 87 85 83
'male' 86 85 88
'female' 75 80 72
'female' 89 86 87
'female' 96 92 98
'male' 78 75 77
'female' 91 94 92
'female' 86 83 85
'male' 79 76 82
19
Other considerations MathWorks recommends that you use tables rather than datasets.
The table class is currently sealed and cannot be used as a superclass.
Review You typically have a choice of using row names or a variable for table operations.
You can rearrange a table using variable names or column numbers.
You can concatenate tables vertically or horizontally.
You can find and replace missing or special values.
You can apply join methods to tables.
You can use grouping variables with tables.
There are conversion functions to and from numerical arrays, cell arrays, and structures.
There are functions to read and write tables. They have some limitations.

20
Exercises 1.
Make a table named "Study" from patients.dat
Plot weight vs. height for males and females.
Write a function that takes the table as an input and plots weight vs. height for males and
females.
2.
Write a function that takes a table as input. It plots the second variable against the first and labels the
axes based on the variable names.
3.
Does self assessed health status correlate with smoking?
4.
Read the Excel file "Weather balloon data 3" into a table.
Replace any missing values.
How many missing values are there?
Display a table of the minimum and maximum values for all variables.
21
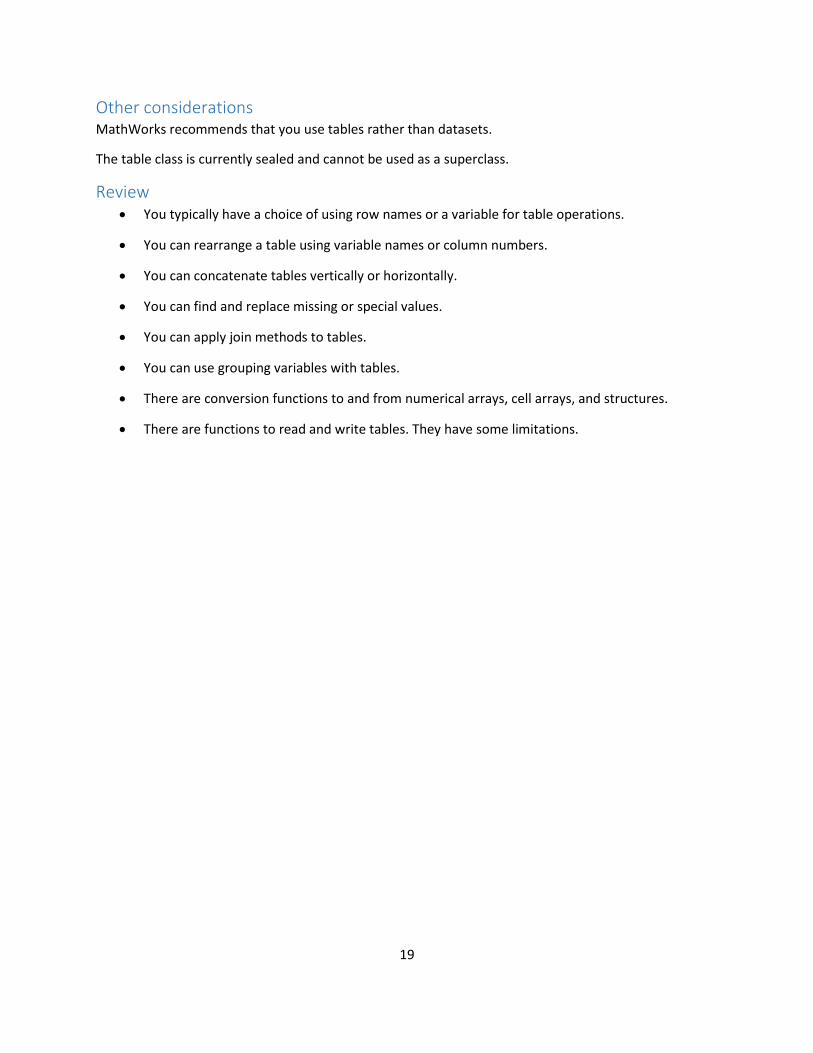
Appendix Data and m files used in the examples and exercises.
importScores.m script
22
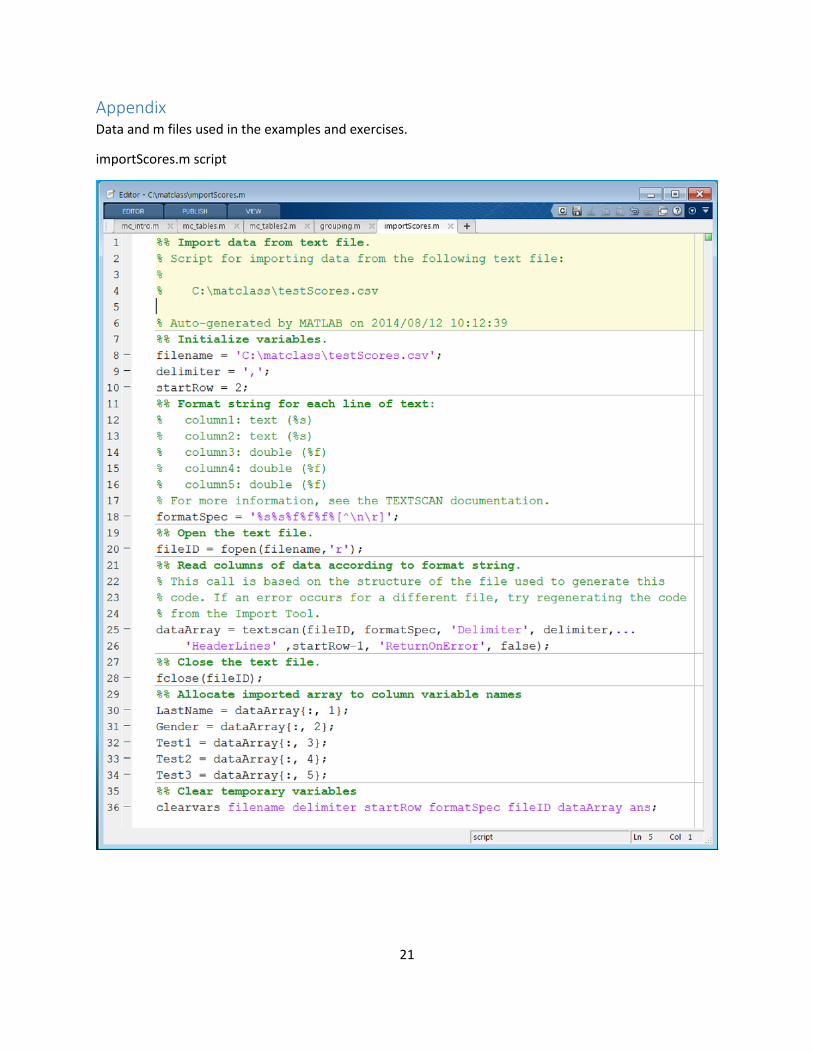
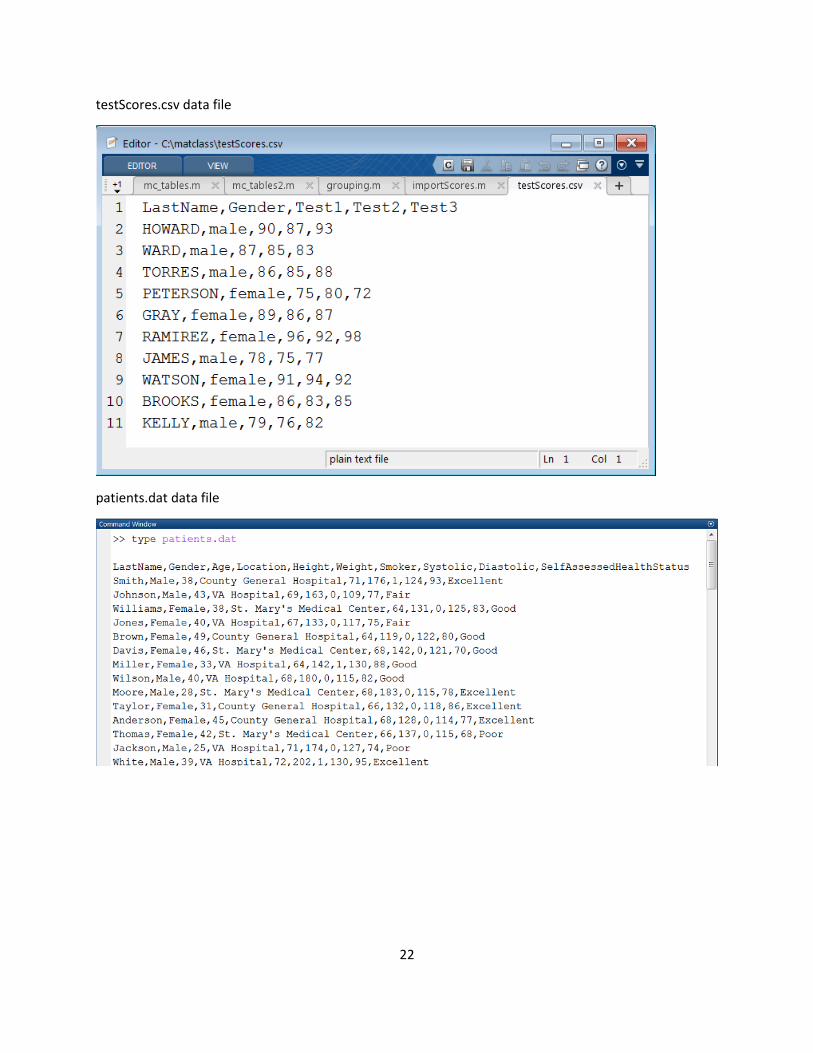
testScores.csv data file
patients.dat data file
23
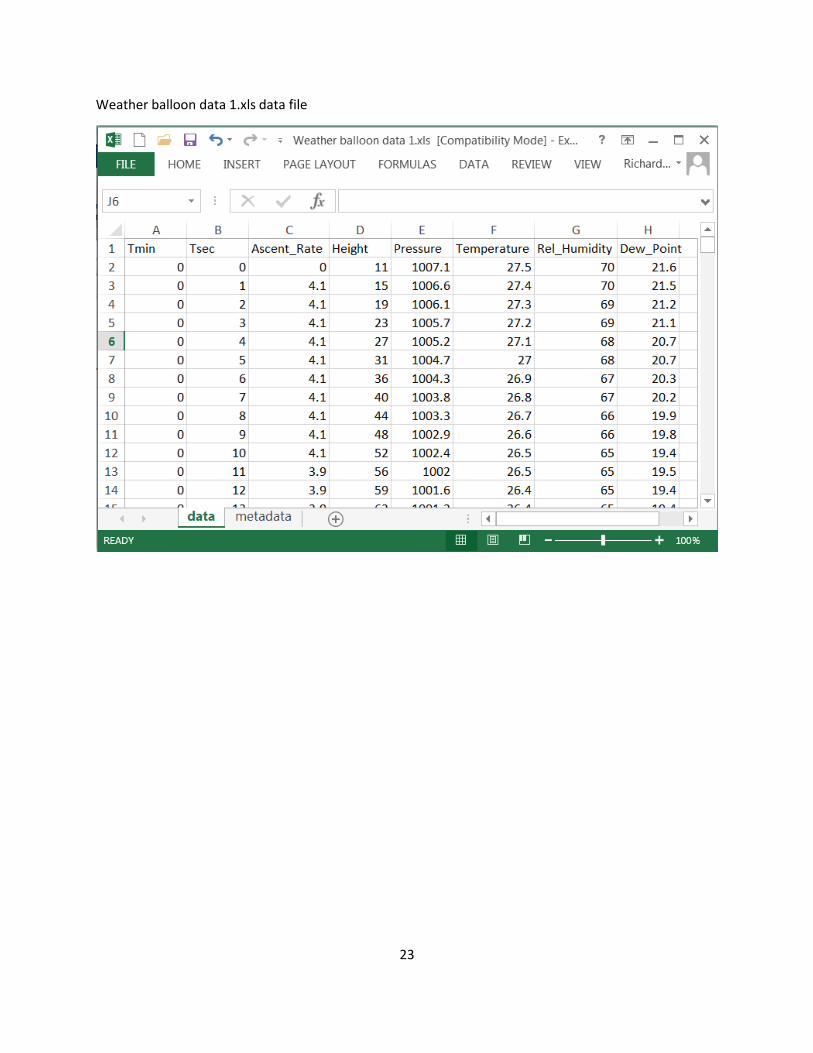
Weather balloon data 1.xls data file