mats; paul-limoges, eugénie; peichl, matthias; pitacco
TRANSCRIPT

Research Collection
Journal Article
Altered energy partitioning across terrestrial ecosystems in theEuropean drought year 2018
Author(s): Graf, Alexander; Klosterhalfen, Anne; Arriga, Nicola; Bernhofer, Christian; Bogena, Heye; Bornet,Frédéric; Brüggemann, Nicolas; Brümmer, Christian; Buchmann, Nina; Chi, Jinshu; Chipeaux, Christophe;Cremonese, Edoardo; Cuntz, Matthias; Dušek, Jiří; El-Madany, Tarek S.; Fares, Silvano; Fischer, Milan;Foltýnová, Lenka; Gharun, Mana; Ghiasi, Shiva; Gielen, Bert; Gottschalk, Pia; Grünwald, Thomas;Heinemann, Günther; Heinesch, Bernard; Heliasz, Michal; Holst, Jutta; Hörtnagl, Lukas; Ibrom, Andreas;Ingwersen, Joachim; Jurasinski, Gerald; Klatt, Janina; Knohl, Alexander; Koebsch, Franziska; Konopka,Jan; Korkiakoski, Mika; Kowalska, Natalia; Kremer, Pascal; Kruijt, Bart; Lafont, Sebastien; Léonard,Joël; De Ligne, Anne; Longdoz, Bernard; Loustau, Denis; Magliulo, Vincenzo; Mammarella, Ivan; Manca,Giovanni; Mauder, Matthias; Migliavacca, Mirco; Mölder, Meelis; Neirynck, Johan; Ney, Patrizia; Nilsson,Mats; Paul-Limoges, Eugénie; Peichl, Matthias; Pitacco, Andrea; Poyda, Arne; Rebmann, Corinna; Roland,Marilyn; Sachs, Torsten; Schmidt, Marius; Schrader, Frederik; Siebicke, Lukas; Šigut, Ladislav; Tuittila,Eeva-Stiina; Varlagin, Andrej; Vendrame, Nadia; Vincke, Caroline; Völksch, Ingo; Weber, Stephan; Wille,Christian; Wizemann, Hans-Dieter; Zeeman, Matthias; Vereecken, Harry
Publication Date: 2020-10-26
Permanent Link: https://doi.org/10.3929/ethz-b-000439997
Originally published in: Philosophical Transactions of the Royal Society B: Biological Sciences 375(1810), http://doi.org/10.1098/
rstb.2019.0524
Rights / License: In Copyright - Non-Commercial Use Permitted
This page was generated automatically upon download from the ETH Zurich Research Collection. For moreinformation please consult the Terms of use.
ETH Library

Graf et al. Altered energy partitioning […] in the European drought year 2018. PTRS-B, 2020
1
This is a post-print (revised author version) of the article
Graf A et al. 2020 Altered energy partitioning across terrestrial ecosystems in the European drought year 2018.
Phil. Trans. R. Soc. B 375: 20190524. http://dx.doi.org/10.1098/rstb.2019.0524
published in Philosophical Transactions of the Royal Society B, theme issue ‘Impacts of the 2018 severe drought
and heatwave in Europe: from site to continental scale’, 2020, DOI https://doi.org/10.1098/rstb.2019.0524. Please
be aware that few details generally not affecting the scientific content may differ towards the fully proof-edited,
official journal version; in particular page numbers are not convertible.
Altered energy partitioning across terrestrial
ecosystems in the European drought year 2018
Alexander Graf1,*, Anne Klosterhalfen2,1, Nicola Arriga3, Christian Bernhofer4, Heye Bogena1,
Frédéric Bornet5, Nicolas Brüggemann1, Christian Brümmer6, Nina Buchmann7, Jinshu Chi2,
Christophe Chipeaux8, Edoardo Cremonese9, Matthias Cuntz10, Jiří Dušek11, Tarek S. El-
Madany12, Silvano Fares13, Milan Fischer11, Lenka Foltýnová11, Mana Gharun7, Shiva Ghiasi7,
Bert Gielen14, Pia Gottschalk15, Thomas Grünwald4, Günther Heinemann16, Bernard
Heinesch17, Michal Heliasz18, Jutta Holst18, Lukas Hörtnagl7, Andreas Ibrom19, Joachim
Ingwersen20, Gerald Jurasinski21, Janina Klatt22, Alexander Knohl23, Franziska Koebsch21, Jan
Konopka24, Mika Korkiakoski25, Natalia Kowalska11, Pascal Kremer20, Bart Kruijt26, Sebastien
Lafont8, Joël Léonard5, Anne De Ligne17, Bernard Longdoz17, Denis Loustau8, Vincenzo
Magliulo27, Ivan Mammarella28, Giovanni Manca3, Matthias Mauder22, Mirco Migliavacca12,
Meelis Mölder18, Johan Neirynck29, Patrizia Ney1, Mats Nilsson2, Eugénie Paul-Limoges30,
Matthias Peichl2, Andrea Pitacco31, Arne Poyda20,32, Corinna Rebmann33, Marilyn Roland14,
Torsten Sachs15, Marius Schmidt1, Frederik Schrader6, Lukas Siebicke23, Ladislav Šigut11,
Eeva-Stiina Tuittila34, Andrej Varlagin35, Nadia Vendrame31, Caroline Vincke36, Ingo
Völksch22, Stephan Weber24, Christian Wille15, Hans-Dieter Wizemann37, Matthias Zeeman22,
Harry Vereecken1
1Institute of Bio- and Geosciences: Agrosphere (IBG-3), Forschungszentrum Jülich, Wilhelm-Johnen-Straße,
52428 Jülich, Germany, correspondence: [email protected]; 2Department of Forest Ecology and Management,
Swedish University of Agricultural Sciences, Skogsmarksgränd 17, 901 83 Umeå, Sweden; 3European
Commission, Joint Research Centre (JRC), Ispra, Italy; 4Chair of Meteorology, Technische Universität Dresden,
Pienner Str. 23, 01737 Tharandt, Germany; 5BioEcoAgro Joint Research Unit, INRAE, Université de Liège,
Université de Lille, Université de Picardie Jules Verne, 02000, Barenton-Bugny, France; 6Thünen Institute of
Climate-Smart Agriculture, Bundesallee 65, 38116 Braunschweig, Germany; 7Department of Environmental
Systems Science, ETH Zurich, Universitaetstrasse 2, 8092 Zurich, Switzerland; 8ISPA, Bordeaux Sciences Agro,
INRAE, F-33140, Villenave d’Ornon, France; 9Climate Change Unit, Environmental Protection Agency of Aosta
Valley, Italy; 10Unité mixte de Recherche Silva, Université de Lorraine, AgroParisTech, INRA, UMR Silva, 54000
Nancy, France; 11Department of Matter and Energy Fluxes, Global Change Research Institute of the Czech
Academy of Sciences, Bělidla 986/4a, 60300 Brno, Czech Republic; 12Max Planck Institute for Biogeochemistry
Department Biogeochemical Integration Hans-Knöll-Str. 10 07745 Jena Germany; 13National Research Council
(CNR), Institute of Bioeconomy, Via dei Taurini 19, 00100 Rome, Italy; 14University of Antwerp, Plants and
Ecosystems, Universiteitsplein 1, 2610 Wilrijk, Belgium; 15Remote Sensing and Geoinformatics, German Research
Centre for Geosciences (GFZ), Telegrafenberg, 14473 Potsdam, Germany; 16Environmental Meteorology,
University of Trier, Behringstr. 21, 54296 Trier, Germany; 17Terra Teaching and Research Centre , University of
Liege – Gembloux Agro-Bio Tech, Avenue de la Faculté, 8, B-5030 Gembloux, Belgium; 18Lund University,
Department of Physical Geography and Ecosystem Science, Sölvegatan 12, 22362 Lund, Sweden; 19Technical
University of Denmark (DTU), Department of Environmental Engineering, Bygningstorvet 115, 2800 Lyngby,
Denmark; 20Institute of Soil Science and Land Evaluation, University of Hohenheim, Emil-Wolff-Str. 27, 70599
Stuttgart, Germany; 21Department for Landscape Ecology and Site Evaluation, University of Rostock, Justus von
Liebig Weg 6, 18059 Rostock, Germany; 22Institute of Meteorology and Climate Research - Atmospheric
Environmental Research, Karlsruhe Institute of Technology, Campus Alpin, Kreuzeckbahnstr. 19, 82467
Garmisch-Partenkirchen; 23Bioclimatology, University of Goettingen, Büsgenweg 2, 37077 Goettingen, Germany;
Graf et al. Altered energy partitioning […] in the European drought year 2018. PTRS-B, 2020
2
24Climatology and Environmental Meteorology, Institute of Geoecology, Technische Universität Braunschweig,
Langer Kamp 19c, 38106 Braunschweig; 25Climate System Research Unit, Finnish Meteorological Institute, PO
Box 503, 00101 Helsinki, Finland; 26Department of Environmental Sciences, Wageningen University and
Research, PO Box 47, 6700 AA Wageningen, The Netherlands; 27CNR - Institute for Agricultural and Forest
Systems, Via Patacca, 85, 80040, Ercolano (Napoli) Italy; 28Institute for Atmospheric and Earth System
Research/Physics, Faculty of Science, University of Helsinki, Gustaf Hällströmin katu 2B, FI-00014 Helsinki,
Finland; 29Department of Geography, University of Zurich, Winterthurerstrasse 190, 8057 Zurich, Switzerland; 29Research Institute for Nature and Forest, INBO, Havenlaan 88 Box 73, 1000 Brussels, Belgium; 31Department
of Agronomy, Food, Natural resources, Animals and Environment, University of Padova, Viale dell’Università
16, 35020 Legnaro, Italy; 32Institute of Crop Science and Plant Breeding, Grass and Forage Science/Organic
Agriculture, Christian-Albrechts-University Kiel, Hermann-Rodewald-Str. 9, 24118 Kiel, Germany; 33Helmholtz
Centre for Environmental Research GmbH - UFZ, Department Computational Hydrosystems, Permoserstraße 15,
04318 Leipzig, Germany; 34University of Eastern Finland, School of Forest Sciences, Yliopistokatu 7, FI-80101
Joensuu, Finland; 35Laboratory of Biocenology, A.N. Severtsov Institute of Ecology and Evolution, Russian
Academy of Sciences, Leninsky pr.33, Moscow 119071, Russia 36Earth and Life Institute, Université catholique de
Louvain, Environmental Sciences, 1348 Louvain-la-Neuve, Belgium; 37Institute of Physics and Meteorology,
University of Hohenheim, 70593 Stuttgart, Germany
ORCIDs: AG, 0000-0003-4870-7622; AKl, 0000-0001-7999-8966; NBr, 0000-0003-3851-2418; CBr, 0000-0001-
6621-5010; NBu, 0000-0003-0826-2980; JC, 0000-0001-5688-8895; CC, 0000-0003-0338-8517; EC, 0000-0002-
6708-8532; MC, 0000-0002-5966-1829; TSE-M, 0000-0002-0726-7141; LF, 0000-0001-8202-955X; MG, 0000-
0003-0337-7367; TG, 0000-0003-2263-0073; GH, 0000-0002-4831-9016; BH, 0000-0001-7594-6341; JH, 0000-
0001-8719-1927; LH, 0000-0002-5569-0761; AI, 0000-0002-1341-921X; GJ, 0000-0002-6248-9388; AKn, 0000-
0002-7615-8870; FK, 0000-0003-1045-7680; MK, 0000-0001-6875-9978; NK, 0000-0002-7366-7231; SL, 0000-
0002-9605-8092; JL, 0000-0002-9907-9104; DL, 0000-0003-3990-400X; VM, 0000-0001-5505-6552; IM, 0000-
0002-8516-3356; MMa, 0000-0002-8789-163X; MMi, 0000-0003-3546-8407; PN, 0000-0001-6821-8661; MP,
0000-0002-9940-5846; APi, 0000-0002-7260-6242; CR, 0000-0002-8665-0375; MR, 0000-0002-5770-3896; TS,
0000-0002-9959-4771; MS, 0000-0001-5292-7092; FS, 0000-0002-5668-3467; LŠ, 0000-0003-1951-4100; AV,
0000-0002-2549-5236; NV, 0000-0002-2772-6755; IV, 0000-0001-9700-2771; SW, 0000-0003-0335-4691; MZ,
0000-0001-9186-2519; HV, 0000-0002-8051-8517
Keywords: eddy-covariance, energy balance, evapotranspiration, heat flux, net carbon
uptake, water-use efficiency
Summary
Drought and heat events, such as the 2018 European drought, interact with the exchange of
energy between the land surface and the atmosphere, potentially affecting albedo, sensible and
latent heat fluxes, as well as CO2 exchange. Each of these quantities may aggravate or mitigate
the drought, heat, their side effects on productivity, water scarcity, and global warming. We
utilized measurements of 56 eddy covariance sites across Europe to examine the response of
fluxes to extreme drought prevailing most of the year 2018 and how the response differed across
various ecosystem types (forests, grasslands, croplands and peatlands). Each component of the
surface radiation and energy balance observed in 2018 was compared to available data per site
during a reference period 2004-2017. Based on anomalies in precipitation and reference
evapotranspiration, we classified 46 sites as drought-affected. These received on average 9% more solar radiation and released 32% more sensible heat to the atmosphere compared to the
mean of the reference period. In general, drought decreased net CO2 uptake by 17.8%, but did
not significantly change net evapotranspiration. The response of these fluxes differed
characteristically between ecosystems; in particular the general increase in evaporative index
was strongest in peatlands and weakest in croplands.
Graf et al. Altered energy partitioning […] in the European drought year 2018. PTRS-B, 2020
3
Introduction
Exceptionally dry and warm periods can serve as a testbed for the future response of the land
surface to climate change, as they represent air temperature, net radiation (Rn), and regionally
also precipitation (P) and incident solar radiation (Rsi) levels that may occur more frequently in
the future. Depending on their severity and duration, heat wave and soil water shortage episodes
have been observed to dramatically reduce plant productivity, ecosystems’ carbon balance and
food, fiber and wood production in Europe, with an increasing frequency during the three last
decades [1-3]. In contrast to distinct summer heat waves, in 2018 unusually warm conditions
throughout most of Europe and dry conditions in its northern half started in spring and persisted
throughout the remainder of the year [4], representing the largest annual soil moisture anomaly
in the period 1979-2019 [5].
Higher Rn enforces an increase in the sum of the turbulent sensible heat flux (H), latent heat flux (λET), heat stored in the ground, vegetation and water bodies (Sl) and energy
converted chemically (Ec), particularly into biomass by photosynthetic CO2 uptake or vice versa
by respiration:
𝐻 + 𝜆𝐸𝑇 + 𝑆l + 𝐸c = 𝑅n = (1 − 𝛼)𝑅si − 𝑅lo + 𝑅li (1.1)
Land surface albedo (α), outgoing longwave radiation from the land surface (Rlo) and
incoming longwave radiation from the atmosphere (Rli) co-determine the relation between Rsi and Rn.
A small increment in Rn can increase any, and likely all, terms on the left-hand side of Equation
1. If sunny and dry conditions prevail, however, changes will be more diverse. The increase in
Ec may diminish as photosynthesis becomes limited by stomatal closure or biochemical
limitations [6]. The same may happen to evapotranspiration (ET) as near-surface water for
evaporation becomes depleted or stomatal closure limits transpiration. As stomatal closure or
soil water shortage continue, plants may develop less green leaf area than usual or initiate
senescence, eventually leading to a decrease in transpiration and Ec, as well as to a change in α and thus Rn. At the same time, soil water shortage can reduce soil respiration in spite of higher
temperature, moderating the decrease in Ec, as shown for the 2003 drought and heat wave [1,
2]. If a warm anomaly is characterized by advection rather than by local production of
atmospheric heat, H might decrease according to the temperature difference between land
surface and atmosphere. Hence, responses on the left-hand side of Equation 1 might differ in
magnitude and sign between fluxes.
The objective of this study was to analyse the response of land surface-atmosphere energy
fluxes to the exceptionally dry and warm conditions during the year 2018 at ecosystem
monitoring sites across Europe. Based on the response mechanisms described above, we
hypothesize that Sl and H are likely to consistently increase across different ecosystems. ET and
Ec, in contrast, may increase in response to increasing Rn and Rsi, respectively, or decrease in
response to soil water depletion. ET and Ec are linked to each other by the drought response of
the vegetation, but can partly decouple due to the role of soil respiration and evaporation. Each
flux has a different effect on the atmosphere, e.g. direct heating through H, local cooling and
nonlocal heating through ET, and long-term global cooling through the greenhouse effect of Ec
on Rli. Examining the ecosystem-dependent variability of ET and Ec responses, and their side
effect on H, may help to understand how land use modulates local and global heating in
response to droughts and heat waves [7]. In this study, we compared fluxes from equation (1.1)
directly measured at 56 eddy-covariance [8] stations across Europe in 2018 to those in a
reference period 2004-2017, discriminating between the ecosystem types forest, grassland,
cropland and peatland.

Graf et al. Altered energy partitioning […] in the European drought year 2018. PTRS-B, 2020
4
Methods
Meteorological data and fluxes [9] were originally provided as half-hourly averages, mostly in the
framework of the ICOS (www.icos-ri.eu) and TERENO (www.tereno.net) networks [10, 11]. A site was
selected for this study when sufficient data of the turbulent fluxes of sensible heat, water vapour, and
CO2 were available for 2018 and at least for one year from the reference period 2004 to 2017. All 14
reference years were available at seven sites, and only one reference year at four sites. The majority of
sites were forest sites, ten were crop sites, nine grassland sites and six peatland sites (cf. supplementary
material a, table S1 for details). Reference years with incomparable land use to 2018 (e.g. different crops
in a crop rotation, or years before wood harvesting) were omitted and are already excluded from the
above numbers.
While all radiation terms of equation (1.1) were measured directly and the turbulent fluxes were
computed from high-frequency raw data [11-13], Sl and Ec were estimated according to:
𝐸c ≈ −0.469𝐽
µ𝑚𝑜𝑙𝑁𝐸𝐸 (2.1)
and
𝑆l ≈ 𝑆𝐻𝐹𝑑 + 𝑑(𝜌��𝑐�� + 𝜃𝑤 𝜌𝑤 𝑐𝑤)
∆𝑇��
∆𝑡+
𝑚𝑐
𝐴𝑐��
∆𝑇𝑐
∆𝑡+ ℎ𝑚 (𝜌𝑎 𝑐𝑝
∆𝑇𝑎
∆𝑡+ 𝜆
∆𝜌𝑣
∆𝑡). (2.2)
Note that in equation (2.1), past studies on energy balance closure (EBC) used different CO2 flux
components such as net ecosystem exchange (NEE), gross primary production (GPP) or overstorey CO2
flux to estimate Ec, which typically contributes << 5% to the budget [14-18]. The measurement or
modelling technique for the different components of Sl (equation 2.2) determines whether heat released
by respiration needs to be excluded, included or partly included in equation (2.1). In most cases
including this study, the unknown fraction of (soil) respiration below level d (equation (2.2)) would need
to be excluded. By estimating Ec from NEE, we avoid overestimating energy balance closure and
inducing further uncertainties from source partitioning. This also implies relative changes in Ec reported
in this study are equivalent to relative changes in net carbon uptake (ecosystem productivity) NEP = -
NEE.
The soil heat flux at depth d (SHFd) is measured by heat flux plates (first term on the right-hand side of
equation (2.2)) and corrected for estimated storage changes over time (Δ/Δt) between plate and soil
surface (second term), in biomass (third term) and air below the flux measurement level (last term).
They depend on temperature (T), density (ρ) and specific heat capacity (c) of the respective medium
soil (s), soil water (w, θw being the volumetric soil water content), plant canopy (c, mc A-1 being wet
biomass per unit area), air (a) and water vapour (v, cp being atmospheric heat capacity at constant
pressure and λ the water vaporisation enthalpy). In each term, the height integral was approximated by
multiplying average available measurement values (indicated by overbars, see supplementary material
(a) for details) with the respective layer thickness d and hm (height of flux level).
The combined inter-annual and spatial variability of the change of a variable in 2018 vs. the reference
period was used to estimate its 95% confidence interval (more details in supplementary material a). We
report only changes that were significant against this variability, unless explicitly stated otherwise.
For the water budget and drought intensity, the potential evapotranspiration (ET in absence of water
stress) is an important characteristic, which can be estimated by the Penman-Monteith equation. To
disentangle atmospheric conditions from site-specific responses and to rely on variables available with
a high temporal coverage and quality at all sites, we used the grass reference evapotranspiration ET0
[19]. A meteorological, atmospheric or potential drought is defined by either the anomaly in
precipitation (ΔP), or in the climatological water balance (P – ET0) [20-22]. Obviously, the latter
definition captures more of the processes that can eventually lead to actual drought stress or soil drought.
However, not all of ET0 leads to actual water loss by ET at each site, and ET0 also correlates with factors
positively affecting plant growth in energy-, temperature- or light-limited regions, such as Rsi or growing
degree days. Therefore, Figures 1 and 2 depict all sites in a two-dimensional coordinate system of both
ΔP and ΔET0.

Graf et al. Altered energy partitioning […] in the European drought year 2018. PTRS-B, 2020
5
Results and Discussion
(a) Meteorological drought conditions
In 2018, most sites (46 of 56) were characterized by a joint negative (“dry”) ΔP, positive (“dry”)
ΔET0, and Δ(P - ET0) below -75 mm (lower right quadrant of figure 1a).
Figure 1: 2018 anomalies in precipitation (P) and grass reference evapotranspiration (ET0); (a) by ecosystem type,
diagonal broken lines correspond to P-ET0 anomalies in steps of 100 mm; (b) by location, colours refer to bins of
P-ET0 anomalies.
This group of sites, which suffered atmospheric drought conditions according to any of these
three definitions on an annual basis, will be referred to as affected sites. It includes 26 forest,
seven crop, seven grassland and six peatland sites. While ΔP in this group spanned a large range
of more than 500 mm, ΔET0 was confined to a narrow band around +100 mm. On average, P
was reduced by 180 mm and ET0 increased by 105 mm. Mean annual temperature across these
sites was 0.82°C higher than in the reference period, with little variability among ecosystem
types except for peatlands, which showed only 0.66 °C average increase and a comparatively
large variability among sites (see supplementary material, table S2). The remaining smaller
group of ten sites, referred to as other, included few sites with a moderate Δ(P - ET0) deficit of
less than 100 mm, and potential drought stress eminent only in ΔP or ΔET0, but not both. The
majority of this group, which may or may not have suffered drought conditions during
subperiods of 2018, exhibited positive (“wet”) annual P anomalies jointly with negative (“wet”)
ET0 anomalies. ΔET0 was thus (negatively) correlated to ΔP (r = -0.60), and by its role in the
Penman-Monteith equation positively to Rsi (r = 0.87), but also to the sum of growing degree
days above 10°C (r = 0.78), which is potentially beneficial for plant growth. Flux site data thus
confirm that over a large region of Europe, 2018 was not a singular rain-deficient, warm, or
sunny year, but showed a combination of these anomalies. Affected sites were located in central
Europe north of the Alps, Scandinavia and Eastern Europe (figure 1b), in general agreement
with other ground-based and remote sensing observations as well as models [21, 23]. In
particular, affected sites are well distributed across the region suffering the strongest annual
reduction in the standardised precipitation-evapotranspiration index SPEI [24].

Graf et al. Altered energy partitioning […] in the European drought year 2018. PTRS-B, 2020
6
(b) Changes in radiation balance and energy balance closure
Incoming shortwave (global solar) radiation (Rsi) across affected sites increased by +360 MJ m-
2 yr-1 (+9%), as opposed to -147 MJ m-2 yr-1 across the other sites. Radiation budget components
other than Rsi were not available with sufficient coverage at all sites, such that the following
results represent sub-datasets (see supplement table S2, minimum 35 affected and six other
sites).
Outgoing shortwave radiation (Rso) was mostly following incoming radiation Rsi, increasing
slightly more (+11.5%), most likely due to a small net albedo change, which was however not
significant, differing in sign between ecosystems and sites.
Incoming longwave radiation at affected sites changed insignificantly (+24 MJ m-2 yr-1,+0.2%,
but +1.6% at other sites), indicating cancelling effects of increased atmosphere temperature
(positive) and reduced cloudiness (negative). Outgoing longwave radiation, in contrast,
reflected the higher land surface temperature at affected sites (148 MJ m-2 yr-1, +1.3%) in
comparison to no significant change at other sites.
Net radiation (Rn) changed by +123 MJ m-2 yr-1 (+6.3%) across affected while not significantly
across other sites, reflecting the dominant role of Rsi and the moderating role of higher outgoing
longwave radiation from the warmer land surface. However, a large variability (95% confidence
interval ±60 MJ m-2 yr-1) might indicate instrumental issues at some sites.
Eddy covariance measurements are known for a gap in the energy balance closure (EBC), i.e.
the sum of H and λET is frequently 15 to 30% smaller than Rn- Sl-Ec [25, 26]. Mean EBC across
sites in this study changed by 3% between the reference period and 2018 (see supplementary
material b for details), indicating that relative changes in the fluxes reported remain independent
of the EBC problem. Due to the ongoing debate about its reasons and implications for any
hypothetical flux correction, absolute fluxes are reported without any correction [27] for the
EBC gap, which was on average 20% in our study.
(c) Sensible heat and evapotranspiration
Among the non-radiative surface energy fluxes (left-hand side of equation 1.1), the sensible
heat flux (H) showed the strongest and most consistent change across affected sites, with
+169 MJ m-2 yr-1 (+32.3%, and no significant change across other sites, figure 2a).
Latent heat flux at affected sites did not change significantly on average (-0.3 MJ m-2 yr-1). We
attribute this to the opposing roles of increased ET0 on the one hand and soil water depletion,
stomatal closure and plant development on the other hand. ET increased where and when
sufficient water was available from recent precipitation or from long-term storage, and later
decreased only at sites where stored soil water was depleted (cf. supplementary material c).
Consequently, among affected sites annual 𝜆𝐸𝑇 typically decreased at those sites with a severe
precipitation deficit, while it frequently increased at sites with the same ET0 surplus but only
moderate precipitation deficit (figure 2b). Figure 2c shows a clearer drought signal in the
evaporative fraction (fraction of H+λET used for ET): even where ET increased, it typically
increased less than proportionally to the larger energy available.
Averages across ecosystems further confirm this hypothesis of ET response depending on stored
water. Affected peatland sites were the only ecosystem type with a significant increase in λET
(+205 MJ m-2 yr-1) and no significant increase in H. Crop sites showed a significant decrease
in λET (-122 MJ m- yr-1), which could have a number of reasons: i) Crop sites are under-
represented among high elevation and high latitude sites, thus water limitation at a given
precipitation deficit is more likely compared to some forest and grassland sites at higher
elevations or latitudes; ii) crop sites typically feature periods of bare soil, during which ET is
Graf et al. Altered energy partitioning […] in the European drought year 2018. PTRS-B, 2020
7
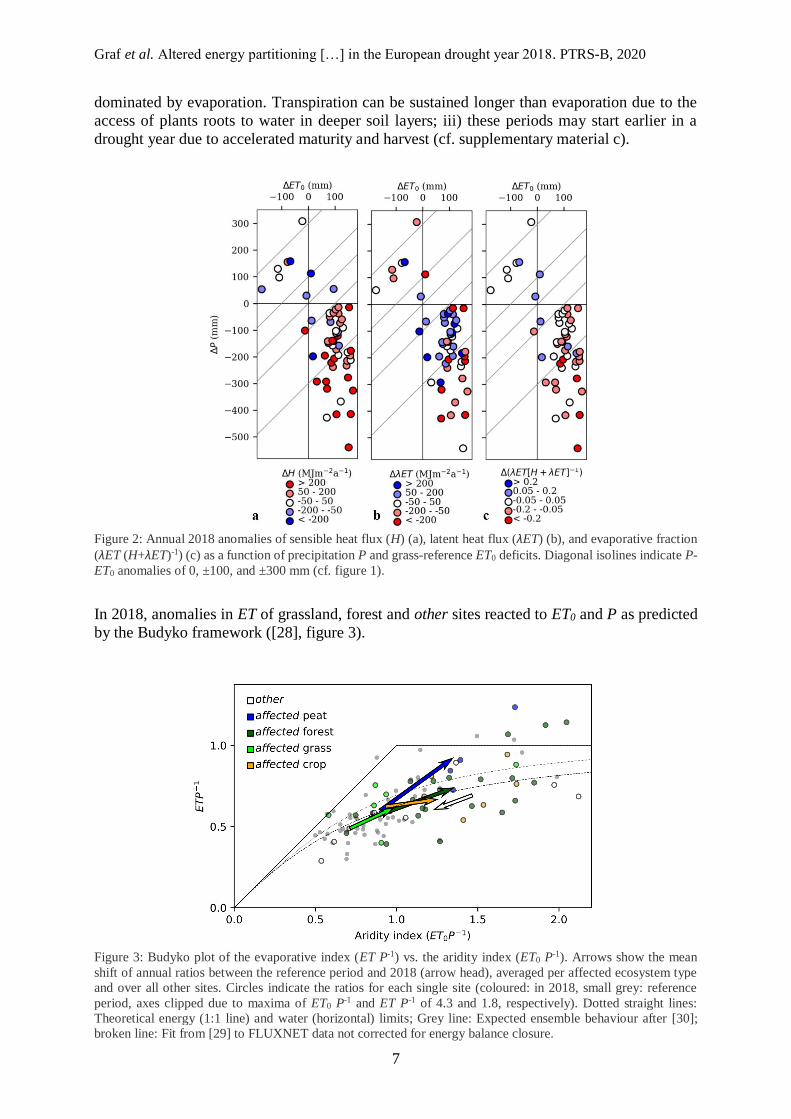
dominated by evaporation. Transpiration can be sustained longer than evaporation due to the
access of plants roots to water in deeper soil layers; iii) these periods may start earlier in a
drought year due to accelerated maturity and harvest (cf. supplementary material c).
Figure 2: Annual 2018 anomalies of sensible heat flux (H) (a), latent heat flux (λET) (b), and evaporative fraction
(λET (H+λET)-1) (c) as a function of precipitation P and grass-reference ET0 deficits. Diagonal isolines indicate P-
ET0 anomalies of 0, ±100, and ±300 mm (cf. figure 1).
In 2018, anomalies in ET of grassland, forest and other sites reacted to ET0 and P as predicted
by the Budyko framework ([28], figure 3).
Figure 3: Budyko plot of the evaporative index (ET P-1) vs. the aridity index (ET0 P
-1). Arrows show the mean
shift of annual ratios between the reference period and 2018 (arrow head), averaged per affected ecosystem type
and over all other sites. Circles indicate the ratios for each single site (coloured: in 2018, small grey: reference
period, axes clipped due to maxima of ET0 P-1 and ET P-1 of 4.3 and 1.8, respectively). Dotted straight lines:
Theoretical energy (1:1 line) and water (horizontal) limits; Grey line: Expected ensemble behaviour after [30];
broken line: Fit from [29] to FLUXNET data not corrected for energy balance closure.
Graf et al. Altered energy partitioning […] in the European drought year 2018. PTRS-B, 2020
8
A small offset may reflect a systematic underestimation of ET due to the EBC, and vanishes
when comparing to the curve fit by Williams et al. [29]. At crop sites, however, the fraction of
P used for ET increased less, as could be expected according to the above reasons. All six
peatland sites showed an increase in ET, which was linearly related to the increase in ET0. One
of them (DE-SfS) is an ombrogenic bog fed only by precipitation, and showed the smallest ET
increase and largest H increase among peatland sites. The remaining fen peatlands can receive
additional inflows from the surrounding landscape and increase ET in response to higher ET0
and lower P for a longer period than other ecosystems. Bogs show a vertical pore space structure
and self-regulatory mechanisms [30] that could lead to an earlier decrease in ET. A few peatland
and forest sites lost more water by ET than they received by P (points above the water limit line
in figure 3). At one peatland site (DE-ZRK), available measurements of the change in water
table depth between the start and the end of 2018 (-0.65 m) would reconcile ET P2018-1 (1.8, not
shown in figure 3 for scaling reasons) with the theoretical water limit. A detailed analysis of
the effect of extractable soil water in forests for selected sites is presented in [6].
On an annual basis, affected forest sites showed a larger average increase in H (+235 MJ m-2 yr-
1) than grassland sites (+79 MJ m-2 yr-1), while the contrast in the insignificant ET changes
between both ecosystems was opposite. For the case of 2003, it was demonstrated [7] that due
to differences in stomatal control and rooting depth, forests show less ET and more H than
grasslands during the early stage of a heatwave. Ultimately, however, the resulting more rapid
depletion of available soil water under grass led to more atmospheric heating than over forests
at the peak of the heatwave 2003 [7]. Evolutionary reasons for such a more conservative
strategy of forests are suggested in [31]. According to our study, the former effect (more heating
over forests) dominated over the latter (more heating over grasslands once soil water is
depleted) on an annual basis in 2018. This may be partly due to the lower albedo and resulting
higher total available energy of forests, partly due to the grassland ensemble including more
humid sites (see figure 3), and partly to the different timescales of the studies. A brief sub-
annual comparison between grasslands and forests largely supporting [7] is presented in
supplementary material c. Also for 2003, an analysis of four example catchments showed a net
increase of ET [32] to amplify the soil drought, which could not be found at the majority of our
sites on an annual basis in 2018. However, as a consequence of more available energy
transferred as H, apart from direct heating of the atmosphere, precipitation can also be reduced
due to a higher and cooler cloud base [33].
(d) Minor energy fluxes, water-use efficiency of CO2 uptake, and soil water content
The increase in heat storage in the soil and the canopy was small (+9 MJ m-2 yr-1 across affected
sites), demonstrating that most of the additional energy during a warm and dry anomaly is
transferred back to the atmosphere. Relative change was large (~300%) due to the fact that net
energy storage was approximately balanced in the reference period.
The change in energy storage in photosynthesis products was even smaller, and highly variable
between sites (-1.6 MJ m-2 yr-1 across affected, insignificant across other sites). However, the
change across affected sites corresponds to 17.8% of reference period CO2 uptake, or 38 g C
m-2 yr-1. The radiative forcing of this amount not removed from the atmosphere in 2018,
estimated according to the methodology of [34] and [35], corresponds to 1.9 MJ m-2 yr-1 during
each year of its atmospheric lifetime, such that the total heating effect due to unused
photosynthetic energy and the greenhouse effect cumulates to, e.g., 3.5 MJ m-2 yr-1 in 2019.
Our observation of a reduced net CO2 uptake across affected sites is in general agreement with
observed changes in atmospheric CO2 concentrations over Europe [36, 37].

Graf et al. Altered energy partitioning […] in the European drought year 2018. PTRS-B, 2020
9
CO2 uptake is typically closely related to ET loss through the concept of water-use efficiency
[40, 41]. Inherent water use efficiency (IWUE*) estimated from annual GPP, vapour pressure
deficit and ET according to Beer et al. [40] increased across affected sites by 3.1 g C hPa kg-
1 H2O (31.4%, no significant change across other sites). For assessing the climatological
response of the land surface to drought, it is worthwhile to also consider the net ecosystem
water use efficiency –NEE ET-1 (WUEeco) or, dimensionless, Ec λET-1. While CO2 uptake adds
to the potential of an ecosystem to mitigate drought and heat waves in any respect (see above),
ET has ambiguous effects, providing a local cooling and moistening of the atmosphere on the
one hand, while on the other hand transferring latent heat to the atmosphere, adding H2O to its
greenhouse gas concentration at least on a short term, and depleting soil water needed for future
productivity. Ec λET-1 decreased across affected sites by -11 · 10-4 (-13.8%, no significant
change across other sites). On average, the affected land surface thus reinforced water scarcity
and global warming during the drought and heat wave. Soil water content measured within the
top 0.3 m of the soil decreased on average by -0.05 cm3 cm-3 (-16.2%), while increasing by 0.03
cm3 cm-3 across other sites. Differences between forest and grassland sites in both IWUE* and
WUEeco (table S2) are in qualitative agreement with a forest – grassland comparison among
Swiss sites, where forest significantly increased water use efficiency [31]. However, figure 4
demonstrates that the relation between smaller CO2 uptake and increased ET water loss [2], was
not universal.
Figure 4: 2018 annual anomalies in energy used for CO2 uptake (Ec), vs. energy used for evapotranspiration (λET)
(r = 0.49, reduced major axis slope = 0.023).
Peatlands typically lost more water via ET than in the reference period without absorbing more
CO2, possibly because of exposure of large amounts of organic carbon in otherwise inundated
soils to aerobic conditions favouring respiration, or an increase in evaporation rather than
transpiration. Some of the affected cropland and forest sites, in contrast, showed increased CO2
uptake with no or little additional water loss. A more detailed future analysis of the site-specific
conditions causing such responses might help to develop more drought- and warming-resilient
land-use strategies.
Conclusions
Among the land surface responses to the 2018 European drought, a considerable relative
increase in sensible heat flux (H) by 32.3% was the most important change in absolute terms,
as well as the most consistent one across ecosystem types and drought intensities. Latent heat
flux (λET) did not change significantly on average but showed a large variability, including

Graf et al. Altered energy partitioning […] in the European drought year 2018. PTRS-B, 2020
10
increases at sites with large water reservoirs (peatlands) or moderate drought intensity and
stronger decreases at crop sites. However, the evaporative fraction (fraction of turbulent heat
transfer used for λET) clearly decreased and the evaporative index (fraction of precipitation
used for λET) clearly increased across ecosystems. Responses in energy used for net CO2 uptake
(Ec) showed a correspondingly large variability and a moderate correlation to λET response, but
a significant average decrease of -17.8%. Heat storage in the ground showed a strong relative
but small absolute increase, and the response of albedo was variable, generally small and as a
result not significant across the assessed sites.
Albedo and Ec potentially cool the land surface – atmosphere system, the latter both through
energy consumption during photosynthesis and greenhouse gas removal, while H has a heating
effect. λET has a large variety of effects including local cooling and nonlocal heating of the
atmosphere, atmospheric humidity and cloud formation, and depletion of water resources
required for productivity and groundwater recharge. Thus an increase or decrease in ET does
not generally mitigate or reinforce drought, but must be assessed considering local priorities
and potential correlations with Ec and albedo. Since H increased consistently, CO2 uptake
decreased on average, and albedo and ET showed no consistent change, the affected European
land surface responded with a clear net heating effect to the drought in 2018.
Data accessibility
This study is mainly based on the dataset: https://doi.org/10.18160/YVR0-4898. Data of additional sites and
missing single variables for some sites have been obtained directly from the institutions and are available from the
data repositories of these institutions. The corresponding author can provide the respective institutional contact or
repository on request.
Author contributions
A.G., A.Kl., C.Br., C.R., F.S. and H.V. conceived the study. A.G. and A.Kl. assembled the database, designed the
scripts and figures, and carried out the analysis, with input from all other authors. A.G. wrote the manuscript with
input from all authors. All authors read, corrected and approved the submitted version of the manuscript. Analysis
of raw data from each site towards half-hourly averages and fluxes, planning and quality assurance of the sites was
provided by all authors. Competing interests. We declare we have no competing interests.
Funding
Authors thank the funders (grant IDs and particularly concerned authors/sites in parentheses) French National
Research Agency ANR (ANR-11-LABX-0002-01, ANR-16-SUMF-0001-01, LabEx ARBRE, M.C.), Alexander
von Humbold Stiftung (MaNiP, T.S.E.-M., M.Mi.), German Federal Ministry of Education and Research BMBF
(01LN1313A, A.G.; ICOS; DE-Geb), German Federal Ministry of Food and Agriculture BMEL (ERA-NET
FACCE ERAGAS, P.G., F.S., C.Br.), German Research Foundation DFG (BE1721/23, C.Be., T.G., DE-Tha; PAK
346; FOR 1695, A.P., J.I., H.W., DE-EC2, DE-EC4; INST 186/1118-1 FUGG, A.Kn., L.S.), GIP Ecofor SOERE
F-ORE-T (M.C.), Finnish Center of Excellence (307331, I.M.), Research Foundation-Flanders FWO (BE-Bra;
G0H3317N, B.G.), Hainich National Park (DE-Hai), Helmholtz Association HGF (TERENO; VH-NG-821, T.S.),
Horizon 2020 (696356, P.G.), ICOS-FINLAND (281255, I.M.), Kempe Foundation (SMK-1743, J.C.), Knut and
Alice Wallenberg Foundation (2015.0047, M.P.), Max-Planck Institute for Biogeochemistry (DE-Geb), Russian
Foundation for Basic Research RFBR (19-04-01234-a, A.V.), Swiss National Science Foundation (ICOS-CH
Phase 2 20FI20_173691, M.G., N.Bu.; InnoFarm 407340_172433, N.Bu.), European Commission (SUPER-G,
S.G.; RINGO, L.H.; ERA-NET Sumforest No. 606803, M.C.), Service Public de Wallonie (DGO6, 1217769,
A.D.L., B.H., B.L., C.V.), SustES (CZ.02.1.01/0.0/0.0/16_019/0000797, L.Š., M.F.), CzeCOS (grant no.
LM2015061, L.F., L.Š., M.F., N.K.), Swedish Research Council FORMAS (2016-01289, M.P.; 942-2015-49, J.C.)
and University of Padua (CDPA148553, 2014, A.Pi.)
Acknowledgements
The authors thank all site collaborators, the Drought 2018 Task Force and the Ecosystem Thematic Centre of the
ICOS Research Infrastructure for data provision, as well as two anonymous referees and guest editor W. Kutsch
for suggestions that greatly helped to improve the manuscript, and senior editor Helen Eaton for multiple support
during the revision and publication process.

Graf et al. Altered energy partitioning […] in the European drought year 2018. PTRS-B, 2020
11
References [1] Ciais, P., Reichstein, M., Viovy, N., Granier, A., Ogee, J., Allard, V., Aubinet, M., Buchmann, N., Bernhofer, C., Carrara, A., et al. 2005 Europe-wide reduction in primary productivity caused by the heat and drought in 2003. Nature
437, 529-533.
[2] Reichstein, M., Ciais, P., Papale, D., Valentini, R., Running, S., Viovy, N., Cramer, W., Granier, A., Ogee, J., Allard, V., et al. 2007 Reduction of ecosystem productivity and respiration during the European summer 2003 climate
anomaly: a joint flux tower, remote sensing and modelling analysis. Global Change Biology 13, 634-651.
[3] Lorenzini, G., Nali, C. & Pellegrini, E. 2014 Summer heat waves, agriculture, forestry and related issues: an
introduction (Editorial). Agrochimica 58, 3-19.
[4] Copernicus Climate Change Service. 2019 European State of the Climate 2018
(https://climate.copernicus.eu/ESOTC/2018).
[5] Copernicus Climate Change Service. 2020 European State of the Climate 2019
(https://climate.copernicus.eu/ESOTC/2019).
[6] Gourlez de la Motte, L., Beauclaire, Q., Heinesch, B., Longdoz, B. & al., e. submitted Stomatal and non-stomatal
limitations of gross primary productivity in forest ecosystems during edaphic drought. Philosophical Transactions of
the Royal Society B, this issue.
[7] Teuling, A. J., Seneviratne, S. I., Stockli, R., Reichstein, M., Moors, E., Ciais, P., Luyssaert, S., van den Hurk, B.,
Ammann, C., Bernhofer, C., et al. 2010 Contrasting response of European forest and grassland energy exchange to
heatwaves. Nat. Geosci. 3, 722-727. (DOI:10.1038/ngeo950).
[8] Swinbank, W. C. 1951 The measurement of vertical transfer of heat and water vapor by eddies in the lower
atmosphere. Journal of Meteorology 8, 135-145. (DOI:10.1175/1520-0469(1951)008<0135:tmovto>2.0.co;2).
[9] Drought 2018 Team and ICOS Ecosystem Thematic Centre 2020: Drought-2018 ecosystem eddy covariance flux
product for 52 stations in FLUXNET-Archive format, doi:10.18160/YVR0-4898 (https://www.icos-cp.eu/).
[10] Franz, D. & Acosta, M. & Altimir, N. & Arriga, N. & Arrouays, D. & Aubinet, M. & Aurela, M. & Ayres, E. & Lopez-Ballesteros, A. & Barbaste, M., et al. 2018 Towards long-term standardised carbon and greenhouse gas
observations for monitoring Europe's terrestrial ecosystems: a review. Int. Agrophys. 32, 439-+. (DOI:10.1515/intag-
2017-0039).
[11] Mauder, M., Cuntz, M., Drüe, C., Graf, A., Rebmann, C., Schmid, H.-P., Schmidt, M. & Steinbrecher, R. 2013 A
quality assessment strategy for long-term eddy-covariance measurements. Agric. For. Meteorol. 169, 122-135.
[12] Sabbatini, S., Mammarella, I., Arriga, N., Fratini, G., Graf, A., Hortriagl, L., Ibrom, A., Longdoz, B., Mauder, M.,
Merbold, L., et al. 2018 Eddy covariance raw data processing for CO2 and energy fluxes calculation at ICOS
ecosystem stations. Int. Agrophys. 32, 495-+. (DOI:10.1515/intag-2017-0043).
[13] Wutzler, T., Lucas-Moffat, A., Migliavacca, M., Knauer, J., Sickel, K., Sigut, L., Menzer, O. & Reichstein, M.
2018 Basic and extensible post-processing of eddy covariance flux data with REddyProc. Biogeosciences 15, 5015-
5030. (DOI:10.5194/bg-15-5015-2018).
[14] Blanken, P. D., Black, T. A., Yang, P. C., Neumann, H. H., Nesic, Z., Staebler, R., den Hartog, G., Novak, M. D.
& Lee, X. 1997 Energy balance and canopy conductance of a boreal aspen forest: Partitioning overstory and
understory components. Journal of Geophysical Research-Atmospheres 102, 28915-28927. (DOI:10.1029/97jd00193).
[15] Meyers, T. P. & Hollinger, S. E. 2004 An assessment of storage terms in the surface energy balance of maize and
soybean. Agric. For. Meteorol. 125, 105-115. (DOI:10.1016/j.agrformet.2004.03.001).
[16] Eshonkulov, R., Poyda, A., Ingwersen, J., Wizemann, H. D., Weber, T. K. D., Kremer, P., Hogy, P., Pulatov, A.
& Streck, T. 2019 Evaluating multi-year, multi-site data on the energy balance closure of eddy-covariance flux measurements at cropland sites in southwestern Germany. Biogeosciences 16, 521-540. (DOI:10.5194/bg-16-521-
2019).
[17] Oncley, S. P., Foken, T., Vogt, R., Kohsiek, W., DeBruin, H. A. R., Bernhofer, C., Christen, A., van Gorsel, E., Grantz, D., Feigenwinter, C., et al. 2007 The Energy Balance Experiment EBEX-2000. Part I: Overview and energy
balance. Bound.-Layer Meteor. 123, 1-28.
[18] Leuning, R., van Gorsel, E., Massman, W. J. & Isaac, P. R. 2012 Reflections on the surface energy imbalance
problem. Agric. For. Meteorol. 156, 65-74.
[19] Allen, R. G., Pereira, L. S., Raes, D. & Smith, M. 1998 Crop evapotranspiration: Guidelines for computing crop
water requirements. Rome, FAO; 300 p.
[20] Thornthwaite, C. W. 1948 An Approach toward a Rational Classification of Climate. Geographical Review 38,
55-94. (DOI:10.2307/210739).
[21] Buras, A., Rammig, A. & Zang, C. S. 2019 Quantifying impacts of the drought 2018 on European ecosystems in
comparison to 2003. Biogeosciences Discuss. 2019, 1-23. (DOI:10.5194/bg-2019-286).
[22] Vicente-Serrano, S. M., Begueria, S., Lorenzo-Lacruz, J., Camarero, J. J., Lopez-Moreno, J. I., Azorin-Molina,
C., Revuelto, J., Moran-Tejeda, E. & Sanchez-Lorenzo, A. 2012 Performance of Drought Indices for Ecological,
Agricultural, and Hydrological Applications. Earth Interact. 16, 27. (DOI:10.1175/2012ei000434.1).

Graf et al. Altered energy partitioning […] in the European drought year 2018. PTRS-B, 2020
12
[23] Bastos, A., Ciais, P., Friedlingstein, P., Sitch, S., Pongratz, J., Fan, L., Wigneron, J. P., Weber, U., Reichstein, M., Fu, Z., et al. submitted Direct and seasonal legacy effects of the 2018 heat and drought on European ecosystem
productivity. Science Advances 6, eaba2724 (doi:10.1126/sciadv.aba2724).
[24] Vicente-Serrano, S. M. & Begueria, S. 2020 SPEI Global Drought Monitor (https://spei.csic.es/map/maps.html).
[25] Stoy, P. C., Mauder, M., Foken, T., Marcolla, B., Boegh, E., Ibrom, A., Arain, M. A., Arneth, A., Aurela, M.,
Bernhofer, C., et al. 2013 A data-driven analysis of energy balance closure across FLUXNET research sites: The role
of landscape scale heterogeneity. Agric. For. Meteorol. 171-172, 137-152.
(DOI:https://doi.org/10.1016/j.agrformet.2012.11.004).
[26] Wilson, K., Goldstein, A., Falge, E., Aubinet, M., Baldocchi, D., Berbigier, P., Bernhofer, C., Ceulemans, R., Dolman, H., Field, C., et al. 2002 Energy balance closure at FLUXNET sites. Agric. For. Meteorol. 113, 223-243.
(DOI:10.1016/s0168-1923(02)00109-0).
[27] Foken, T., Aubinet, M., Finnigan, J. J., Leclerc, M. Y., Mauder, M. & U, K. T. P. 2011 Results of a Panel Discussion About the Energy Balance Closure Correction for Trace Gases. Bulletin of the American Meteorological
Society 92, ES13-ES18.
[28] Budyko, M. I. 1974 Climate and Life, Academic Press.
[29] Williams, C. A., Reichstein, M., Buchmann, N., Baldocchi, D., Beer, C., Schwalm, C., Wohlfahrt, G., Hasler, N.,
Bernhofer, C., Foken, T., et al. 2012 Climate and vegetation controls on the surface water balance: Synthesis of evapotranspiration measured across a global network of flux towers. Water Resources Research 48, W06523
(DOI:10.1029/2011wr011586).
[30] Nijp, J. J., Metselaar, K., Limpens, J., Bartholomeus, H. M., Nilsson, M. B., Berendse, F. & van der Zee, S. 2019 High-resolution peat volume change in a northern peatland: Spatial variability, main drivers, and impact on
ecohydrology. Ecohydrology 12, 17. (DOI:10.1002/eco.2114).
[31] Wolf, S., Eugster, W., Ammann, C., Hani, M., Zielis, S., Hiller, R., Stieger, J., Imer, D., Merbold, L. & Buchmann, N. 2013 Contrasting response of grassland versus forest carbon and water fluxes to spring drought in
Switzerland. Environ. Res. Lett. 8, 12. (DOI:10.1088/1748-9326/8/3/035007).
[32] Teuling, A. J., Van Loon, A. F., Seneviratne, S. I., Lehner, I., Aubinet, M., Heinesch, B., Bernhofer, C.,
Grunwald, T., Prasse, H. & Spank, U. 2013 Evapotranspiration amplifies European summer drought. Geophys. Res.
Lett. 40, 2071-2075. (DOI:10.1002/grl.50495).
[33] Kabat, P., Claussen, M., Dirmeyer, P., Gash, J. H. C., Bravo de Guenni, L., Meybeck, M., Pielke Sr, R.,
Vörösmarty, C. J., Hutjes, R. & Lütkemeier, S. 2004 Vegetation, Water, Humans and the Climate: A New Perspective
on an Interactive System. Dordrecht, The Netherlands: Springer.
[34] Betts, R. A. 2000 Offset of the potential carbon sink from boreal forestation by decreases in surface albedo.
Nature 408, 187-190. (DOI:10.1038/35041545).
[35] Rotenberg, E. & Yakir, D. 2010 Contribution of Semi-Arid Forests to the Climate System. Science 327, 451-454.
(DOI:10.1126/science.1179998).
[36] Ramonet, M., Ciais, P., Apadula, F., Bastos, A., Bergamaschi, P., Blanc, P. E., Brunner, D., Caracciolo di Torchiaro, L., Calzolari, F., Chen, H., et al. submitted The fingerprint of the summer 2018 drought in Europe on
ground-based atmsopheric CO2 measurements. Philosophical Transactions of the Royal Society B, this issue.
[37] Thompson, R. L., Broquet, G., Gerbig, C., Koch, T., Lang, M., Monteil, G., Munassar, S., Nickless, A., Scholze,
M., Ramonet, M., et al. submitted Changes in Net Ecosystem Exchange over Europe During the 2018 Drought Based
on Atmsopheric Observations. Philosophical Transactions of the Royal Society B, this issue.
[38] Wohlfahrt, G., Gerdel, K., Migliavacca, M., Rotenberg, E., Tatarinov, F., Muller, J., Hammerle, A., Julitta, T.,
Spielmann, F. M. & Yakir, D. 2018 Sun-induced fluorescence and gross primary productivity during a heat wave. Sci
Rep 8, 9. (DOI:10.1038/s41598-018-32602-z).
[39] Stoy, P. C., El-Madany, T. S., Fisher, J. B., Gentine, P., Gerken, T., Good, S. P., Klosterhalfen, A., Liu, S. G.,
Miralles, D. G., Perez-Priego, O., et al. 2019 Reviews and syntheses: Turning the challenges of partitioning ecosystem
evaporation and transpiration into opportunities. Biogeosciences 16, 3747-3775. (DOI:10.5194/bg-16-3747-2019).
[40] Beer, C., Ciais, P., Reichstein, M., Baldocchi, D., Law, B. E., Papale, D., Soussana, J. F., Ammann, C.,
Buchmann, N., Frank, D., et al. 2009 Temporal and among-site variability of inherent water use efficiency at the
ecosystem level. Global Biogeochemical Cycles 23, 13. (DOI:10.1029/2008gb003233).

Suppl. material: Graf et al. Altered energy partitioning […] in the European drought year 2018
1
Supplementary material
Table S1: Overview of sites used in this study. Longitude (Lon), Latitude (Lat), long-term mean annual temperature (MAT)
and precipitation (MAP) are according to the European Fluxes Database cluster (http://www.europe-fluxdata.eu) for sites
in this database, and provided by site PIs accordingly otherwise. Ecosystem refers to the simplified Four-type classification
used in this study. Reference years from within the period 2004-2017 were chosen based on data availability and, in case
of crop rotation sites, the same crop being grown as in 2018.
Site Lon Lat IGBP MAT
(°C)
MAP
(mm)
Elevation
(m) Ecosystem Reference years Reference
BE-Bra 4.5 51.3 MF 9.8 750 16 forest 2004-2017 [1]
BE-Lon 4.7 50.6 CRO 10 800 167 crop 2006, 10, 14 [2]
BE-Vie 6.0 50.3 MF 7.8 1062 493 forest 2004-2017 [3]
CH-Aws 9.8 46.6 GRA 2.3 918 1978 grass 2011, 2016,2017 [4]
CH-Cha 8.4 47.2 GRA 9.5 1136 400 grass 2006-2017 [5]
CH-Dav 9.9 46.8 ENF 3.5 1046 1639 forest 2004-2017 [6]
CH-Fru 8.5 47.1 GRA 7.2 1651 982 grass 2006-2017 [4]
CH-Lae 8.4 47.5 MF 8.7 1211 689 forest 2005-2017 [6]
CH-Oe2 7.7 47.3 CRO 9.8 1155 452 crop 2008, 2013 [7]
CZ-BK1 18.5 49.5 ENF 6.7 1316 875 forest 2015-2017 [8]
CZ-Lnz 16.9 48.7 MF 9.3 550 150 forest 2016-2017 [9]
CZ-RAJ 16.7 49.4 ENF 7.1 681 625 forest 2013-2017 [10]
CZ-Stn 18.0 49.0 DBF 8.7 685 550 forest 2015-2017 [11]
CZ-wet 14.8 49.0 WET 7.7 604 425 peatland 2007-2017 [12]
DE-BER 13.3 52.2 URB 9.4 525 61 grass 2016-2017 [13]
DE-EC2 8.7 48.9 CRO 9.4 889 318 crop 2011, 13, 15, 17 [14]
DE-EC4 9.8 48.5 CRO 7.5 1064 687 crop 2011, 14, 15 [15]
DE-Fen 11.1 47.8 GRA 8.4 1081 595 grass 2012- 2017 [16]
DE-Geb 10.9 51.1 CRO 8.5 470 162 crop 2007, 08, 10, 14, 16 [17]
DE-Gri 13.5 51.0 GRA 7.8 901 385 grass 2005-2017 [18]
DE-Hai 10.5 51.1 DBF 8.3 720 440 forest 2004-2017 [19]
DE-HoH 11.2 52.1 DBF 9.1 563 193 forest 2015-2017 [20]
DE-Hte 12.2 54.2 WET 9.2 645 0 peatland 2016-2017 [21]
DE-Kli 13.5 50.9 CRO 7.6 842 478 crop 2007, 2012 [18]
DE-Obe 13.7 50.8 ENF 5.5 996 734 forest 2009-2017 [18]
DE-RbW 11.0 47.7 GRA 9.0 1160 769 grass 2012-2017 [16]
DE-RuR 6.3 50.6 GRA 7.7 1033 515 grass 2012-2017 [22]
DE-RuS 6.4 50.9 CRO 10.2 718 103 crop 2013, 2015 [23].
DE-RuW 6.3 50.5 ENF 7.5 1250 610 forest 2014-2017 [24]
DE-SfS 11.3 47.8 WET 8.6 1127 590 peatland 2013-2017 [25]
DE-Tha 13.6 51.0 ENF 8.2 843 380 forest 2004-2017 [18]
DE-ZRK 12.9 53.9 WET 8.7 584 1 peatland 2016-2017 [26]
DK-Sor 11.6 55.5 DBF 8.2 660 40 forest 2004-2017 [27]
ES-Abr -6.8 38.7 SAV 16 400 280 forest 2016-2017 [28]
ES-LM1 -5.8 39.9 SAV 16 700 265 forest 2016-2017 [29]
ES-LM2 -5.8 39.9 SAV 16 700 270 forest 2016-2017 [29]
FI-Hyy 24.3 61.8 ENF 3.8 709 180 forest 2004-2017 [30]
FI-Let 24.0 60.6 ENF 4.6 627 0 forest 2017 [31]
FI-Sii 24.2 61.8 WET 3.5 701 160 peatland 2016-2017 [32]
FI-Var 29.6 67.8 ENF -0.5 601 395 forest 2017-2017 [33]
FR-Bil -1.0 44.5 ENF 12.8 930 0 forest 2015-2017 [34]
FR-EM2 3.0 49.9 CRO 10.8 680 84 crop 2015, 2018 [35]
FR-Hes 7.1 48.7 DBF 9.2 820 300 forest 2014-2017 [36]
IT-BCi 15.0 40.5 CRO 18 600 15 crop 2017 [37]
IT-Cp2 12.4 41.7 EBF 15.2 805 6 forest 2013-2017 [38]
IT-Lsn 12.8 45.7 OSH 13.1 1083 1 crop 2017-2017 [39]
IT-SR2 10.3 43.7 ENF 14.2 920 4 forest 2014-2017 [40]
IT-Tor 7.6 45.8 GRA 2.9 920 2160 grass 2009-2017 [41]
NL-Loo 5.7 52.2 ENF 9.8 786 25 forest 2004-2017 [42]
RU-Fy2 32.9 56.4 ENF 3.9 711 265 forest 2016-2017 [43]
RU-Fyo 32.9 56.5 ENF 3.9 711 265 forest 2016-2017 [44]
SE-Deg 19.6 64.2 WET 1.2 523 270 peatland 2015-2017 [45]
SE-Htm 13.4 56.1 ENF 7.4 707 115 forest 2016-2017 [46]
SE-Nor 17.5 60.1 ENF 5.5 527 46 forest 2014-2017 [47]
SE-Ros 19.7 64.2 ENF 1.8 614 160 forest 2015-2017 [48]
SE-Svb 19.8 64.3 ENF 1.8 614 270 forest 2015-2016 [49]
Suppl. material: Graf et al. Altered energy partitioning […] in the European drought year 2018
2
(a) Data processing methods
An overview of sites is given in table S1. Raw data measured at 10 or 20 s-1 were processed towards
half-hourly fluxes by each single site operator. Data gaps in fluxes and meteorological time series were
filled, and GPP estimated, according to [50-55]. For sites where raw fluxes were directly provided
within this study, these steps were performed by the authors, including a neighbour-based gap-filling
of meteorological data between close sites [54]. For most sites, provided through the European Fluxes
database cluster (http://www.europe-fluxdata.eu/), processing was performed by the Ecosystem
Thematic Centre of ICOS RI and the intermediate result published [56]. Due to a slightly better
performance on longer gaps than the marginal distribution sampling method implemented in [55], gaps
in λET were filled by regression through the origin against ET0, using an adaptive window as described
in [53]. Subsequently the remaining available energy according to ET0 was used in the same way to fill
gaps in H. A site was used if after these steps turbulent fluxes of sensible and latent heat and CO2 as
well as incoming solar radiation, air temperature, humidity and precipitation were available for at least 80% of the period April to September and at least 60% of the full year, both for 2018 and at least one
year in the period from 2004 to 2017. Data of the available years from this period were averaged to
serve as a reference, with an additional constraint of omitting years with incomparable land use
conditions (e.g. different crops in a crop rotation, or the years before wood harvesting). Remaining
gaps in final variables required as an unbiased annual budget were filled by first applying reduced
major axis [57] regression between the daily time series of 2018 and the reference year and finally, if
required, linear regression. Statistics that do not require gapless annual budgets, but a list of jointly
available variables, such as energy balance closure EBC [58], were computed without this step after
list-wise deletion of input records with missing data. In equation (2.2), due to varying data availability
between sites, we used site-specific values of d and hm, but a global estimate of 1.42 106 J m-3 K-1 for
ρscs. Tc was in most cases approximated by Ta; mc A-1 was either known for a site or approximated
from canopy height hc via regression on all sites with known hc and mc A-1. Grass reference
evapotranspiration according to [59] was computed using the hourly version with solar incoming
radiation (Rsi). The sum parameter of growing-degree days was computed by cumulatively adding all
mean daily temperatures above 10°C per year.
To estimate confidence intervals of changes in fluxes and state variables across groups of sites (i.e.
affected ecosystems or the group of all affected vs. all other sites), we considered both, the inter-annual
variability between multiple reference years at each sites, and the spatial variability between sites in
the same group. Systematic measurement errors were not included given that they likely affect all years
similarly, in line with [60], which is explicitly shown for the energy balance closure gap in the
following section. Random errors in half-hourly measurements [61] strongly decrease in relative
importance during propagation into annual sums [60]. For those sites and variables where estimates on
annually aggregated random errors were available [56, 62], these were considerably smaller than the
measured inter-annual variability, in which they are implicitly included. The mean change across a
group of sites, for each of which a mean reference year was computed beforehand, is equivalent to a
weighted average of differences between 2018 and each single reference year, where the weights are
the inverse of the number of reference years available for the site. The corresponding confidence
interval is given by
CI = 𝑥 ± 𝑡(1−
𝛼
2;𝑁𝑒𝑓𝑓−1)
√𝑠𝑖𝑎
2 +𝑠𝑠𝑝2
𝑁𝑒𝑓𝑓−1, (S1)
where CI is the two-sided confidence interval of the change x at error probability α (0.05 for the 95%
confidence), t student’s t distribution, 𝑠𝑖𝑎2 the biased (uncorrected) inter-annual variance among
reference years at each site, 𝑠𝑠𝑝2 the biased spatial variance of mean changes between the sites of the
group, and the overbar denotes averaging. Note that the root term is the standard error and its product

Suppl. material: Graf et al. Altered energy partitioning […] in the European drought year 2018
3
with √𝑁𝑒𝑓𝑓 the unbiased standard deviation. 𝑁𝑒𝑓𝑓 is the effective sample size of a weighted variance
[63], which is in our case exactly equivalent to
𝑁𝑒𝑓𝑓 =1
(1
𝑁𝑖𝑎)
∙ 𝑁𝑠𝑝. (S2)
The first factor is the harmonic mean of the number of reference years available at the sites in the
group, the second the number of sites. Confidence intervals not including zero indicate a significant
change. Mean and relative changes, their confidence interval, and number of sites with available
measurements of the respective variable are given in table S2. The same approach is used in figure S2
to estimate confidence intervals from the combined variances between days in a rolling window,
reference years and sites. In this case, the number of days in the rolling window contributing to Neff
could lead to erroneously narrow confidence intervals due to correlation (dependence) between
consecutive days. Following autocorrelation analyses of daily flux data, we thus reduced the number
of days contributing to Neff by a factor of four days to arrive at conservative confidence interval
estimates.
Table S2: Overview of absolute and relative changes of discussed variables in 2018 vs. reference period. CI is the 95%
confidence interval of the change (equations S1 and S2), both change and CI in units given to the left. Number of sites is
Nsp entering equation S2.
affected
affected
crop
affected
forest
affected
grass
affected
peat
other
P (mm)
change -180 -125 -207 -169 -140 +100
CI ±28 ±74 ±39 ±68 ±58 ±83
relative -22.9% -15.8% -27.3% -16.9% -21.4% 13.6%
sites 46 7 26 7 6 10
ET0 (mm)
change +105 +91 +109 +103 +107 -48
CI ±8 ±26 ±12 ±15 ±20 ±42
relative 16.0% 12.6% 17.1% 14.4% 17.8% -4.5%
sites 46 7 26 7 6 10
Tair (°C)
change +0.82 +0.92 +0.80 +0.93 +0.66 +0.05
CI ±0.13 ±0.43 ±0.17 ±0.17 ±0.55 ±0.32
sites 46 7 26 7 6 10
Rg (MJ m-2 yr-1)
change +360 +307 +357 +353 +442 -147
CI ±32 ±84 ±45 ±51 ±96 ±95
relative 9.2% 7.4% 9.5% 8.3% 11.9% -2.7%
sites 46 7 26 7 6 10
SWout (MJ m-2 yr-1)
change +69 +32 +49 +103 +148 -29
CI ±21 ±62 ±15 ±63 ±123 ±67
relative 11.5% 4.0% 11.8% 10.5% 25.3% -2.6%
sites 35 5 20 5 5 7
albedo
change +0.004 -0.007 +0.002 +0.003 +0.020 +0.001
CI ±0.005 ±0.014 ±0.004 ±0.015 ±0.026 ±0.014
relative 2.3% -3.4% 2.0% 1.2% 12.1% 0.2%
sites 35 5 20 5 5 7
LWin (MJ m-2 yr-1)
change +24 +87 +32 -29 -17 +155
CI ±30 ±77 ±37 ±52 ±148 ±73
relative 0.2% 0.9% 0.3% -0.3% -0.2% 1.6%
sites 44 6 26 7 5 10
LWout (MJ m-2 yr-1)
change +148 +227 +153 +169 +33 -6
CI ±29 ±85 ±25 ±48 ±204 ±106
relative 1.3% 2.0% 1.4% 1.5% 0.3% 0.0%
sites 35 5 20 5 5 6
Rn (MJ m-2 yr-1)
change +123 +141 +98 +140 +177 +16
CI ±60 ±87 ±100 ±80 ±126 ±53
relative 6.3% 7.8% 4.7% 7.9% 9.6% 0.6%
sites 36 5 20 5 6 7

Suppl. material: Graf et al. Altered energy partitioning […] in the European drought year 2018
4
Table S2 continued
affected
affected
crop
affected
forest
affected
grass
affected
peat
other
EBC (filled)
change +0.02 -0.02 +0.04 +0.00 +0.04 +0.04
CI ±0.02 ±0.05 ±0.03 ±0.03 ±0.07 ±0.13
relative 3.0% -2.7% 4.9% -0.6% 5.2% 4.9%
sites 45 7 25 7 6 9
H (MJ m-2 yr-1)
change +169 +135 +235 +79 +30 -34
CI ±36 ±97 ±52 ±33 ±58 ±120
relative 32.3% 43.5% 34.2% 28.9% 8.2% -3.2%
sites 46 7 26 7 6 10
λET (MJ m-2 yr-1)
change 0 -122 -29 +54 +205 -9
CI ±39 ±118 ±49 ±68 ±94 ±123
relative 0.0% -10.2% -2.8% 4.4% 20.8% -0.7%
sites 46 7 26 7 6 10
λET (H+λET)-1
change -0.07 -0.10 -0.09 -0.05 +0.03 +0.03
CI ±0.02 ±0.08 ±0.03 ±0.04 ±0.05 ±0.04
relative -10.5% -12.4% -14.5% -5.8% 3.3% 5.3%
sites 44 7 26 6 5 10
Sl (MJ m-2 yr-1)
change +9.3 +33.4 +4.8 +17.0 -7.8 -6.8
CI ±4.6 ±26.1 ±2.6 ±9.6 ±13.5 ±17.3
relative 299.2% 1384.2% 256.8% 110.4% -156.9% -63.8%
sites 46 7 26 7 6 10
Ec (MJ m-2 yr-1)
change -1.6 -2.1 -1.0 -2.9 -2.1 +0.4
CI ±1.1 ±5.2 ±1.4 ±1.9 ±2.9 ±3.1
relative -17.8% -32.4% -8.3% -44.0% -74.9% 7.5%
sites 46 7 26 7 6 10
IWUE* (gC hPa kg-1 H2O)
change +3.1 +2.8 +3.8 +2.5 +1.0 +0.1
CI ±0.5 ±1.0 ±0.7 ±0.9 ±0.7 ±1.5
relative 31.4% 32.6% 35.3% 20.7% 21.2% 0.4%
sites 45 6 26 7 6 10
WUEeco
change -0.0011 -0.0015 -0.0002 -0.0027 -0.0023 +0.0004
CI ±0.0009 ±0.0043 ±0.0012 ±0.0013 ±0.0026 ±0.0021
relative -13.8% -27.7% -2.3% -48.7% -88.5% 9.0%
sites 46 7 26 7 6 10
swc (cm3 cm-3)
change -0.051 -0.057 -0.044 -0.073 -0.038 +0.032
CI ±0.010 ±0.049 ±0.014 ±0.011 ±0.034 ±0.028
relative -16.2% -19.8% -17.0% -18.6% -5.5% 15.5%
sites 33 5 20 6 2 9
(b) Energy balance closure
Eddy-Covariance measurements are known for a gap in the energy balance closure (EBC): the sum of
H and λET is frequently about 15 to 30% smaller than Rn - Sl - Ec [58, 64]. Current theory suggests a
number of different reasons including underestimation of the turbulent heat fluxes due to surface
heterogeneity or incomplete correction of spectral losses, or unaccounted energy storage [64-68].
However, there is no consensus yet on the application of a correction, its distribution between H and
λET and its implications for Ec [69, 70]. However, relative changes in turbulent fluxes between years
remain unaffected as long as EBC does not change systematically between respective years. Figure S1
demonstrates there was little average change in EBC, with a closure gap around 20% both in the
reference period and in 2018. EBC slightly improved during the drought, although both increase and
decrease were found for individual sites.

Suppl. material: Graf et al. Altered energy partitioning […] in the European drought year 2018
5
Figure S1: Energy balance closure (EBC), i.e., annual cumulative (H+λET)(Rn-Sl-Ec)-1, compared between 2018 and the
reference period for each site. Large symbols indicate sites where measurements of these variables were jointly available
during both periods, small symbols indicate sites where Rn-Sl was estimated from gap-filled short-wave incoming radiation
according to [59]. Mean EBC across sites changed from 0.77 (reference) to 0.81 (2018) for the high-quality and from 0.77
to 0.80 for the filled records.
(c) Intra-annual temporal dynamics of ET
On average, grassland sites showed higher evapotranspiration losses compared to the reference period
in the early stages of the drought, and lower ones later presumably caused by soil water depletion. As
a result, sensible heat fluxes were particularly high compared to the reference period during late stages
of the drought (figure S2). Forests showed less extreme relative changes, in accordance with [71].
However, it should also be noted that on average forests showed higher sensible heat fluxes than
grasslands both during the reference period and 2018, partly because of having a lower albedo. Any
mitigation strategy by land use change would need to carefully consider this drawback effect. Cropland
sites showed an even stronger tendency of evapotranspiration to decline during later stages of the
drought. Inspection of a single cropland site demonstrates that this effect is at least partly due to earlier
maturity and harvest, and strongly reduced evaporation from the dry topsoil after harvest (figure S2).

Suppl. material: Graf et al. Altered energy partitioning […] in the European drought year 2018
6
Figure S2: Annual course of sensible (H, left column) and latent heat flux (λET, right column, W m-2) averaged across
groups of ecosystems as a 30-day rolling average during 2018 (red) and the reference period (blue). Shaded areas indicate
the 95% confidence interval estimated from variability within the 30-day rolling window, between reference years and
between sites (see supplementary material a). Harvest of winter wheat at DE-RuS took place at Day of Year 197 in 2018,
while in the two reference years it took place at Day 223 and 215, respectively.

Suppl. material: Graf et al. Altered energy partitioning […] in the European drought year 2018
7
References
[1] Gielen B, De Vos B, Campioli M, Neirynck J, Papale D, Verstraeten A, Ceulemans R,Janssens IA. 2013 Biometric and eddy covariance-based assessment of decadal carbon sequestration of a temperate Scots pine forest. Agric. For. Meteorol. 174, 135-
143. (DOI:10.1016/j.agrformet.2013.02.008).
[2] Buysse P, Bodson B, Debacq A, De Ligne A, Heinesch B, Manise T, Moureaux C,Aubinet M. 2017 Carbon budget
measurement over 12 years at a crop production site in the silty-loam region in Belgium. Agric. For. Meteorol. 246, 241-255.
(DOI:10.1016/j.agrformet.2017.07.004).
[3] Aubinet M, Hurdebise Q, Chopin H, Debacq A, De Ligne A, Heinesch B, Manise T,Vincke C. 2018 Inter-annual variability
of Net Ecosystem Productivity for a temperate mixed forest: A predominance of carry-over effects? Agric. For. Meteorol. 262,
340-353. (DOI:10.1016/j.agrformet.2018.07.024).
[4] Zeeman MJ, Hiller R, Gilgen AK, Michna P, Pluss P, Buchmann N,Eugster W. 2010 Management and climate impacts on
net CO2 fluxes and carbon budgets of three grasslands along an elevational gradient in Switzerland. Agric. For. Meteorol. 150,
519-530. (DOI:10.1016/j.agrformet.2010.01.011).
[5] Hortnagl L, Barthel M, Buchmann N, Eugster W, Butterbach-Bahl K, Diaz-Pines E, Zeeman M, Klumpp K, Kiese R, Bahn
M, et al. 2018 Greenhouse gas fluxes over managed grasslands in Central Europe. Global Change Biology 24, 1843-1872.
(DOI:10.1111/gcb.14079).
[6] Haeni M, Zweifel R, Eugster W, Gessler A, Zielis S, Bernhofer C, Carrara A, Grunwald T, Havrankova K, Heinesch B, et
al. 2017 Winter respiratory C losses provide explanatory power for net ecosystem productivity. J. Geophys. Res.-Biogeosci.
122, 243-260. (DOI:10.1002/2016jg003455).
[7] Emmel C, Winkler A, Hortnagl L, Revill A, Ammann C, D'Odorico P, Buchmann N,Eugster W. 2018 Integrated management of a Swiss cropland is not sufficient to preserve its soil carbon pool in the long term. Biogeosciences 15, 5377-
5393. (DOI:10.5194/bg-15-5377-2018).
[8] Krupkova L, Markova I, Havrankova K, Pokorny R, Urban O, Sigut L, Pavelka M, Cienciala E,Marek MV. 2017 Comparison of different approaches of radiation use efficiency of biomass formation estimation in Mountain Norway spruce.
Trees-Struct. Funct. 31, 325-337. (DOI:10.1007/s00468-016-1486-2).
[9] Acosta M, Darenova E, Dusek J,Pavelka M. 2017 Soil carbon dioxide fluxes in a mixed floodplain forest in the Czech
Republic. Eur. J. Soil Biol. 82, 35-42. (DOI:10.1016/j.ejsobi.2017.08.006).
[10] McGloin R, Sigut L, Havrankova K, Dusek J, Pavelka M,Sedlak P. 2018 Energy balance closure at a variety of ecosystems
in Central Europe with contrasting topographies. Agric. For. Meteorol. 248, 418-431. (DOI:10.1016/j.agrformet.2017.10.003).
[11] Krupkova L, Havrankova K, Krejza J, Sedlak P,Marek MV. 2019 Impact of water scarcity on spruce and beech forests. J.
For. Res. 30, 899-909. (DOI:10.1007/s11676-018-0642-5).
[12] Dusek J, Cizkova H, Stellner S, Czerny R,Kvet J. 2012 Fluctuating water table affects gross ecosystem production and
gross radiation use efficiency in a sedge-grass marsh. Hydrobiologia 692, 57-66. (DOI:10.1007/s10750-012-0998-z).
[13] Heusinger J,Weber S. 2017 Surface energy balance of an extensive green roof as quantified by full year eddy-covariance
measurements. Sci. Total Environ. 577, 220-230. (DOI:10.1016/j.scitotenv.2016.10.168).
[14] Poyda A, Wizemann HD, Ingwersen J, Eshonkulov R, Hogy P, Demyan MS, Kremer P, Wulfmeyer V,Streck T. 2019 Carbon fluxes and budgets of intensive crop rotations in two regional climates of southwest Germany. Agriculture Ecosystems
& Environment 276, 31-46. (DOI:10.1016/j.agee.2019.02.011).
[15] Wizemann HD, Ingwersen J, Hogy P, Warrach-Sagi K, Streck T,Wulfmeyer V. 2015 Three year observations of water vapor and energy fluxes over agricultural crops in two regional climates of Southwest Germany. Meteorologische Zeitschrift 24,
39-59. (DOI:10.1127/metz/2014/0618).
[16] Kiese R, Fersch B, Baessler C, Brosy C, Butterbach-Bahl K, Chwala C, Dannenmann M, Fu J, Gasche R, Grote R, et al.
2018 The TERENO Pre-Alpine Observatory: Integrating Meteorological, Hydrological, and Biogeochemical Measurements and
Modeling. Vadose Zone Journal 17, 17. (DOI:10.2136/vzj2018.03.0060).
[17] Anthoni PM, Freibauer A, Kolle O,Schulze ED. 2004 Winter wheat carbon exchange in Thuringia, Germany. Agric. For.
Meteorol. 121, 55-67. (DOI:10.1016/s0168-1923(03)00162-x).
[18] Prescher AK, Grunwald T,Bernhofer C. 2010 Land use regulates carbon budgets in eastern Germany: From NEE to NBP.
Agric. For. Meteorol. 150, 1016-1025. (DOI:10.1016/j.agrformet.2010.03.008).
[19] Knohl A, Schulze ED, Kolle O,Buchmann N. 2003 Large carbon uptake by an unmanaged 250-year-old deciduous forest in
Central Germany. Agric. For. Meteorol. 118, 151-167. (DOI:10.1016/s0168-1923(03)00115-1).
[20] Wollschlager U, Attinger S, Borchardt D, Brauns M, Cuntz M, Dietrich P, Fleckenstein JH, Friese K, Friesen J, Harpke A,
et al. 2017 The Bode hydrological observatory: a platform for integrated, interdisciplinary hydro-ecological research within the
TERENO Harz/Central German Lowland Observatory. Environ. Earth Sci. 76, 25. (DOI:10.1007/s12665-016-6327-5).
[21] Koebsch F, Glatzel S, Hofmann J, Forbrich I,Jurasinski G. 2013 CO2 exchange of a temperate fen during the conversion
from moderately rewetting to flooding. J. Geophys. Res.-Biogeosci. 118, 940-950. (DOI:10.1002/jgrg.20069).
[22] Post H, Franssen HJH, Graf A, Schmidt M,Vereecken H. 2015 Uncertainty analysis of eddy covariance CO2 flux
measurements for different EC tower distances using an extended two-tower approach. Biogeosciences 12, 1205-1221.
(DOI:10.5194/bg-12-1205-2015).
[23] Klosterhalfen A, Moene AF, Schmidt M, Scanlon TM, Vereecken H,Graf A. 2019 Sensitivity analysis of a source
partitioning method for H2O and CO2 fluxes based on high frequency eddy covariance data: Findings from field data and large
eddy simulations. Agric. For. Meteorol. 265, 152 - 170. (DOI:10.1016/j.agrformet.2018.11.003).
[24] Ney P, Graf A, Bogena H, Diekkruger B, Drue C, Esser O, Heinemann G, Klosterhalfen A, Pick K, Putz T, et al. 2019 CO2 fluxes before and after partial deforestation of a Central European spruce forest. Agric. For. Meteorol. 274, 61-74.
(DOI:10.1016/j.agrformet.2019.04.009).
Suppl. material: Graf et al. Altered energy partitioning […] in the European drought year 2018
8
[25] Hommeltenberg J, Schmid HP, Drosler M,Werle P. 2014 Can a bog drained for forestry be a stronger carbon sink than a
natural bog forest? Biogeosciences 11, 3477-3493. (DOI:10.5194/bg-11-3477-2014).
[26] Franz D, Koebsch F, Larmanou E, Augustin J,Sachs T. 2016 High net CO2 and CH4 release at a eutrophic shallow lake on
a formerly drained fen. Biogeosciences 13, 3051-3070. (DOI:10.5194/bg-13-3051-2016).
[27] Wu J, Larsen KS, van der Linden L, Beier C, Pilegaard K,Ibrom A. 2013 Synthesis on the carbon budget and cycling in a
Danish, temperate deciduous forest. Agric. For. Meteorol. 181, 94-107. (DOI:10.1016/j.agrformet.2013.07.012).
[28] Luo YP, El-Madany TS, Filippa G, Ma XL, Ahrens B, Carrara A, Gonzalez-Cascon R, Cremonese E, Galvagno M, Hammer TW, et al. 2018 Using Near-Infrared-Enabled Digital Repeat Photography to Track Structural and Physiological
Phenology in Mediterranean Tree-Grass Ecosystems. Remote Sens. 10, 32. (DOI:10.3390/rs10081293).
[29] El-Madany TS, Reichstein M, Perez-Priego O, Carrara A, Moreno G, Martin MP, Pacheco-Labrador J, Wohlfahrt G, Nieto
H, Weber U, et al. 2018 Drivers of spatio-temporal variability of carbon dioxide and energy fluxes in a Mediterranean savanna
ecosystem. Agric. For. Meteorol. 262, 258-278. (DOI:10.1016/j.agrformet.2018.07.010).
[30] Mammarella I, Launiainen S, Gronholm T, Keronen P, Pumpanen J, Rannik U,Vesala T. 2009 Relative Humidity Effect on
the High-Frequency Attenuation of Water Vapor Flux Measured by a Closed-Path Eddy Covariance System. Journal of
Atmospheric and Oceanic Technology 26, 1856-1866. (DOI:10.1175/2009jtecha1179.1).
[31] Launiainen S, Katul GG, Kolari P, Lindroth A, Lohila A, Aurela M, Varlagin A, Grelle A,Vesala T. 2016 Do the energy
fluxes and surface conductance of boreal coniferous forests in Europe scale with leaf area? Global Change Biology 22, 4096-
4113. (DOI:10.1111/gcb.13497).
[32] Rinne J, Tuittila ES, Peltola O, Li XF, Raivonen M, Alekseychik P, Haapanala S, Pihlatie M, Aurela M, Mammarella I, et
al. 2018 Temporal Variation of Ecosystem Scale Methane Emission From a Boreal Fen in Relation to Temperature, Water
Table Position, and Carbon Dioxide Fluxes. Global Biogeochemical Cycles 32, 1087-1106. (DOI:10.1029/2017gb005747).
[33] Kulmala L, Pumpanen J, Kolari P, Dengel S, Berninger F, Koster K, Matkala L, Vanhatalo A, Vesala T,Back J. 2019 Inter-
and intra-annual dynamics of photosynthesis differ between forest floor vegetation and tree canopy in a subarctic Scots pine
stand. Agric. For. Meteorol. 271, 1-11. (DOI:10.1016/j.agrformet.2019.02.029).
[34] Moreaux V, Lamaud E, Bosc A, Bonnefond JM, Medlyn BE,Loustau D. 2011 Paired comparison of water, energy and carbon exchanges over two young maritime pine stands (Pinus pinaster Ait.): effects of thinning and weeding in the early stage
of tree growth. Tree Physiology 31, 903-921. (DOI:10.1093/treephys/tpr048).
[35] Domeignoz-Horta LA, Spor A, Bru D, Breuil MC, Bizouard F, Leonard J,Philippot L. 2015 The diversity of the N2O reducers matters for the N2O:N-2 denitrification end-product ratio across an annual and a perennial cropping system. Front.
Microbiol. 6, 10. (DOI:10.3389/fmicb.2015.00971).
[36] Granier A, Breda N, Longdoz B, Gross P,Ngao J. 2008 Ten years of fluxes and stand growth in a young beech forest at
Hesse, North-eastern France. Annals of Forest Science 65, 13. (DOI:10.1051/forest:2008052).
[37] Vitale L, Di Tommasi P, Arena C, Riondino M, Forte A, Verlotta A, Fierro A, De Santo AV, Fuggi A,Magliulo V. 2009 Growth and gas exchange response to water shortage of a maize crop on different soil types. Acta Physiol. Plant. 31, 331-341.
(DOI:10.1007/s11738-008-0239-2).
[38] Fares S, Savi F, Muller J, Matteucci G,Paoletti E. 2014 Simultaneous measurements of above and below canopy ozone fluxes help partitioning ozone deposition between its various sinks in a Mediterranean Oak Forest. Agric. For. Meteorol. 198,
181-191. (DOI:10.1016/j.agrformet.2014.08.014).
[39] Tezza L, Vendrame N,Pitacco A. 2019 Disentangling the carbon budget of a vineyard: The role of soil management.
Agriculture Ecosystems & Environment 272, 52-62. (DOI:10.1016/j.agee.2018.11.002).
[40] Hoshika Y, Fares S, Savi F, Gruening C, Goded I, De Marco A, Sicard P,Paoletti E. 2017 Stomatal conductance models for ozone risk assessment at canopy level in two Mediterranean evergreen forests. Agric. For. Meteorol. 234, 212-221.
(DOI:10.1016/j.agrformet.2017.01.005).
[41] Galvagno M, Wohlfahrt G, Cremonese E, Rossini M, Colombo R, Filippa G, Julitta T, Manca G, Siniscalco C, di Cella UM, et al. 2013 Phenology and carbon dioxide source/sink strength of a subalpine grassland in response to an exceptionally
short snow season. Environ. Res. Lett. 8, 10. (DOI:10.1088/1748-9326/8/2/025008).
[42] Elbers JA, Jacobs CMJ, Kruijt B, Jans WWP,Moors EJ. 2011 Assessing the uncertainty of estimated annual totals of net
ecosystem productivity: A practical approach applied to a mid latitude temperate pine forest. Agric. For. Meteorol. 151, 1823-
1830. (DOI:10.1016/j.agrformet.2011.07.020).
[43] Mamkin V, Kurbatova J, Avilov V, Ivanov D, Kuricheva O, Varlagin A, Yaseneva I,Olchev A. 2019 Energy and CO2
exchange in an undisturbed spruce forest and clear-cut in the Southern Taiga. Agric. For. Meteorol. 265, 252-268.
(DOI:10.1016/j.agrformet.2018.11.018).
[44] Kurbatova J, Tatarinov F, Molchanov A, Varlagin A, Avilov V, Kozlov D, Ivanov D,Valentini R. 2013 Partitioning of
ecosystem respiration in a paludified shallow-peat spruce forest in the southern taiga of European Russia. Environ. Res. Lett. 8,
9. (DOI:10.1088/1748-9326/8/4/045028).
[45] Nilsson M, Sagerfors J, Buffam I, Laudon H, Eriksson T, Grelle A, Klemedtsson L, Weslien P,Lindroth A. 2008
Contemporary carbon accumulation in a boreal oligotrophic minerogenic mire - a significant sink after accounting for all C-
fluxes. Global Change Biology 14, 2317-2332. (DOI:10.1111/j.1365-2486.2008.01654.x).
[46] van Meeningen Y, Wang M, Karlsson T, Seifert A, Schurgers G, Rinnan R,Hoist T. 2017 Isoprenoid emission variation of Norway spruce across a European latitudinal transect. Atmospheric Environment 170, 45-57.
(DOI:10.1016/j.atmosenv.2017.09.045).
[47] Lindroth A, Holst J, Heliasz M, Vestin P, Lagergren F, Biermann T, Cai ZZ,Molder M. 2018 Effects of low thinning on
carbon dioxide fluxes in a mixed hemiboreal forest. Agric. For. Meteorol. 262, 59-70. (DOI:10.1016/j.agrformet.2018.06.021).
[48] Jocher G, Marshall J, Nilsson MB, Linder S, De Simon G, Hornlund T, Lundmark T, Nasholm T, Lofvenius MO,
Tarvainen L, et al. 2018 Impact of Canopy Decoupling and Subcanopy Advection on the Annual Carbon Balance of a Boreal
Scots Pine Forest as Derived From Eddy Covariance. J. Geophys. Res.-Biogeosci. 123, 303-325. (DOI:10.1002/2017jg003988).
Suppl. material: Graf et al. Altered energy partitioning […] in the European drought year 2018
9
[49] Chi JS, Nilsson MB, Kljun N, Wallerman J, Fransson JES, Laudon H, Lundmark T,Peichl M. 2019 The carbon balance of a managed boreal landscape measured from a tall tower in northern Sweden. Agric. For. Meteorol. 274, 29-41.
(DOI:10.1016/j.agrformet.2019.04.010).
[50] Reichstein M, Falge E, Baldocchi D, Papale D, Aubinet M, Berbigier P, Bernhofer C, Buchmann N, Gilmanov T, Granier A, et al. 2005 On the separation of net ecosystem exchange into assimilation and ecosystem respiration: review and improved
algorithm. Global Change Biology 11, 1424-1439. (DOI:10.1111/j.1365-2486.2005.001002.x).
[51] Papale D, Reichstein M, Aubinet M, Canfora E, Bernhofer C, Kutsch W, Longdoz B, Rambal S, Valentini R, Vesala T, et al. 2006 Towards a standardized processing of Net Ecosystem Exchange measured with eddy covariance technique: algorithms
and uncertainty estimation. Biogeosciences 3, 571-583. (DOI:10.5194/bg-3-571-2006).
[52] Lasslop G, Reichstein M, Papale D, Richardson AD, Arneth A, Barr A, Stoy P,Wohlfahrt G. 2010 Separation of net
ecosystem exchange into assimilation and respiration using a light response curve approach: critical issues and global
evaluation. Global Change Biology 16, 187-208. (DOI:10.1111/j.1365-2486.2009.02041.x).
[53] Graf A, Bogena HR, Drue C, Hardelauf H, Putz T, Heinemann G,Vereecken H. 2014 Spatiotemporal relations between
water budget components and soil water content in a forested tributary catchment. Water Resources Research 50, 4837-4857.
(DOI:10.1002/2013wr014516).
[54] Graf A. 2017 Gap-filling meteorological variables with Empirical Orthogonal Functions. In EGU 2017 General Assembly
(23 Apr 2017 - 28 Apr 2017, Vienna (Austria).
[55] Wutzler T, Lucas-Moffat A, Migliavacca M, Knauer J, Sickel K, Sigut L, Menzer O,Reichstein M. 2018 Basic and
extensible post-processing of eddy covariance flux data with REddyProc. Biogeosciences 15, 5015-5030. (DOI:10.5194/bg-15-
5015-2018).
[56] Drought 2018 Team and ICOS Ecosystem Thematic Centre. 2020 Drought-2018 ecosystem eddy covariance flux product
for 52 stations in FLUXNET-Archive format (DOI:10.18160/YVR0-4898)
[57] Webster R. 1997 Regression and functional relations. European Journal of Soil Science 48, 557-566.
[58] Wilson K, Goldstein A, Falge E, Aubinet M, Baldocchi D, Berbigier P, Bernhofer C, Ceulemans R, Dolman H, Field C, et
al. 2002 Energy balance closure at FLUXNET sites. Agric. For. Meteorol. 113, 223-243. (DOI:10.1016/s0168-1923(02)00109-
0).
[59] Allen RG, Pereira LS, Raes D,Smith M. 1998 Crop evapotranspiration: Guidelines for computing crop water
requirements. Rome, FAO; 300 p.
[60] Ciais P, Reichstein M, Viovy N, Granier A, Ogee J, Allard V, Aubinet M, Buchmann N, Bernhofer C, Carrara A, et al.
2005 Europe-wide reduction in primary productivity caused by the heat and drought in 2003. Nature 437, 529-533.
[61] Finkelstein PL,Sims PF. 2001 Sampling error in eddy correlation flux measurements. Journal of Geophysical Research-
Atmospheres 106, 3503-3509. (DOI:10.1029/2000jd900731).
[62] Pastorello G,Trotta C,Canfora E,Chu H,Christianson D,Cheah Y-W,Poindexter C,Chen J,Elbashandy A,Humphrey M, et al. 2020 The FLUXNET2015 dataset and the ONEFlux processing pipeline for eddy covariance data. Scientific Data 7, 225.
(DOI:10.1038/s41597-020-0534-3).
[63] Kish L. 1965 Survey sampling. New York, Wiley; 643 p.
[64] Stoy PC, Mauder M, Foken T, Marcolla B, Boegh E, Ibrom A, Arain MA, Arneth A, Aurela M, Bernhofer C, et al. 2013 A
data-driven analysis of energy balance closure across FLUXNET research sites: The role of landscape scale heterogeneity.
Agric. For. Meteorol. 171-172, 137-152. (DOI:10.1016/j.agrformet.2012.11.004).
[65] Eder F, Schmidt M, Damian T, Traumner K,Mauder M. 2015 Mesoscale Eddies Affect Near-Surface Turbulent Exchange:
Evidence from Lidar and Tower Measurements. Journal of Applied Meteorology and Climatology 54, 189-206.
(DOI:10.1175/jamc-d-14-0140.1).
[66] Eshonkulov R, Poyda A, Ingwersen J, Wizemann HD, Weber TKD, Kremer P, Hogy P, Pulatov A,Streck T. 2019
Evaluating multi-year, multi-site data on the energy balance closure of eddy-covariance flux measurements at cropland sites in
southwestern Germany. Biogeosciences 16, 521-540. (DOI:10.5194/bg-16-521-2019).
[67] Kidston J, Brümmer C, Black TA, Morgenstern K, Nesic Z, McCaughey JH,Barr AG. 2010 Energy Balance Closure Using Eddy Covariance Above Two Different Land Surfaces and Implications for CO2 Flux Measurements. Bound.-Layer Meteor.
136, 193-218. (DOI:10.1007/s10546-010-9507-y).
[68] Haverd V, Cuntz M, Leuning R,Keith H. 2007 Air and biomass heat storage fluxes in a forest canopy: Calculation within a
soil vegetation atmosphere transfer model. Agric. For. Meteorol. 147, 125-139. (DOI:10.1016/j.agrformet.2007.07.006).
[69] Foken T. 2008 The energy balance closure problem: An overview. Ecological Applications 18, 1351-1367.
(DOI:10.1890/06-0922.1).
[70] Foken T, Aubinet M, Finnigan JJ, Leclerc MY, Mauder M,U KTP. 2011 Results of a Panel Discussion About the Energy
Balance Closure Correction for Trace Gases. Bulletin of the American Meteorological Society 92, ES13-ES18.
[71] Teuling AJ, Seneviratne SI, Stockli R, Reichstein M, Moors E, Ciais P, Luyssaert S, van den Hurk B, Ammann C,
Bernhofer C, et al. 2010 Contrasting response of European forest and grassland energy exchange to heatwaves. Nat. Geosci. 3,
722-727. (DOI:10.1038/ngeo950).