matthias heinemann - göteborgs universitetemilie/icysb/wp-content/uploads/2011/05/... ·...
TRANSCRIPT

|
faculty of mathematicsand natural sciences
Generation and use of metabolome data
Matthias HeinemannMatthias HeinemannMolecular Systems Biology lab

2
Where is Groningen...?
Groningen

3
• PhD student? Postdoc?• How many years into your PhD?• Bio-background? Computational background?• Working with yeast?• Signaling? Metabolism? Regulation?• Systems Biology?• Academic career? Industrial career?
Who are you?

4
Who am I?University of Stuttgart, Germany
Diploma in Environmental Engineering
University of Western Ontario, CanadaExchange year
Diploma thesis, Bremen, Germany
RWTH Aachen University, Germany, PhD in Biochemical Engineering
ETH Zurich, SwitzerlandPostdoc in Bioprocess Lab
ETH Zurich, SwitzerlandGroup leader at the Institute of Molecular Systems Biology
University of Groningen, NetherlandsProfessor for Molecular Systems Biology

5
Systems biology
Biological knowledge/insight (components, interactions, …)
Insights from molecular biology/biochemistry research
Transcriptomics Proteomics Metabolomics FluxomicsGenome-wideexperimental
data
Systemunderstanding
Computationaltools
Mathematicalmodels
Top-
dow
n br
anch
Bot
tom
-up
bran
ch
environment phenotype

6
Metabolism!

7
Metabolism?
• How can metabolite levels be measured?• What can we learn from metabolite levels?• Where is metabolism in the cellular
hierarchy?

8
The plan for the next hours1st hour: How to generate metabolome data?
2nd hour: How to usemetabolome data?
What is the metabolome?

11
What is the metabolome?
Gene
mRNA
protein structure
regulationDire
ct li
nks
DNA: passive library
RNA: ‘passive’ intermediate
Proteins: active workhorses
substrate product
metabolism
Metabolome
Fluxome
= state
= activity
Metabolites (sugars, hormones, vitamins, amino acids .....)No direct link to the genome
Genome
Transcriptome
Proteome

13
What‘s in a metabolome?
What’s in a metabolome?• Microbes ≈ 1000 species• Single plant species ≈ 5000 in Arabidopsis · • All plant species together ≈ 90,000-200,000• humans 2180 endogenous metabolites from text mining …… ! Wishart et al 2007 Nucl Acid Res 35: D521

15
Metabolomics applications= technique to analyze/determine metabolites
In the following, we will only look into the targeted approach!
Profiling:Screening of all detectable by a selected analytical techniqueTypically >50% of peaks have no name
Targeted analysis:Identification and quantification of predefined compounds
Application: - plant traints- disease state, classification (biomarkers)- mutant, condition discrimination
Application:- Systems biology, modeling

17
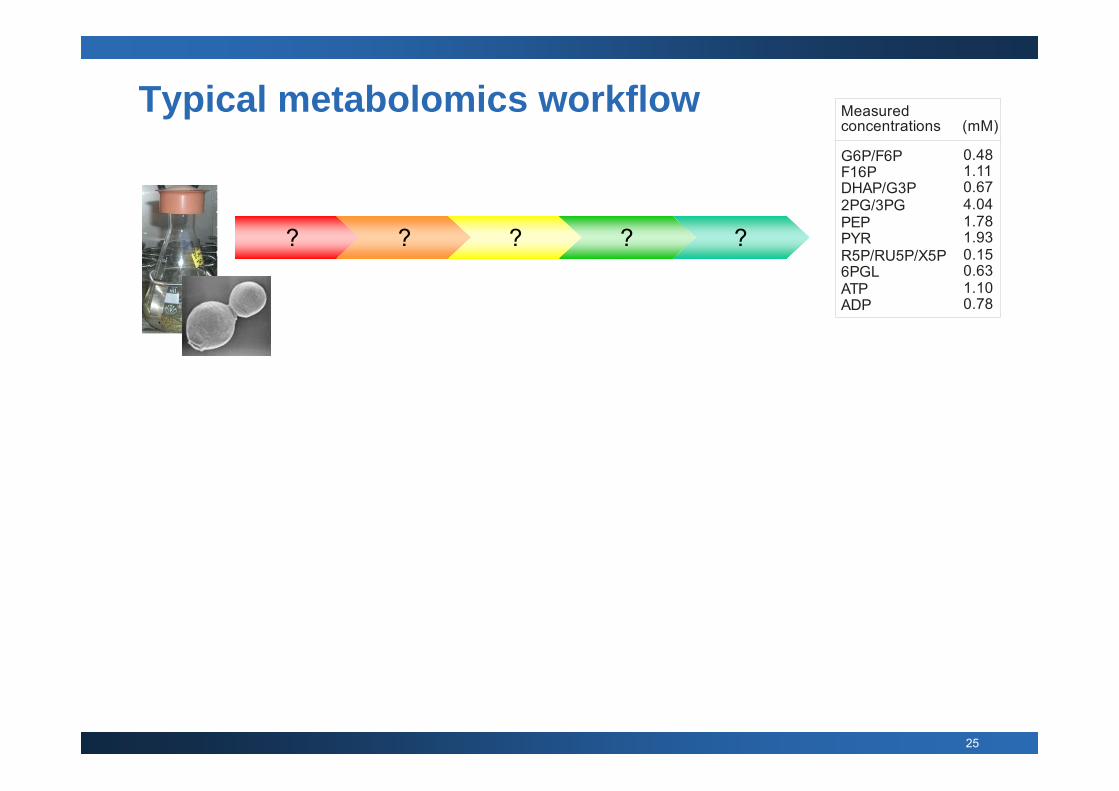
Typical metabolomics workflow
? ? ? ??
interpretation
G6P/F6PF16PDHAP/G3P2PG/3PGPEPPYRR5P/RU5P/X5P6PGLATPADP
Measuredconcentrations (mM)
0.481.110.674.041.781.930.150.631.100.78

19
Challenges for metabolomics in general Metabolic turnover rates on the
order of seconds requires fast cell processing
A B C

20
Challenges for metabolomics in general
t=0.1-1min t ≈ minutest≤1s t≈ hourst≤1min
-Nucleotides-Redox
cofactors
-Central carbon metabolites
-Secondary metabolites
-Free aminoacids
-Storage carbohydrates
-Proteins
Turnover times of metabolic pools in the cell

21
Challenges for metabolomics in general Metabolic turnover rates on the
order of seconds requires fast cell processing
Metabolome is complicated to analyze number of compounds chemical diversity (+ similarity) small molecular weights large concentration differences A B C

22
Challenge: Diversity & Similarity
From ionic inorganic species to hydrophilic carbohydrates and sophisticated secondary natural products to hydrophobic lipids.
In each class, highly similar compounds exist (diastereoisomers)
25
Typical metabolomics workflow
? ? ? ??
G6P/F6PF16PDHAP/G3P2PG/3PGPEPPYRR5P/RU5P/X5P6PGLATPADP
Measuredconcentrations (mM)
0.481.110.674.041.781.930.150.631.100.78

26
QuenchingGoal: Block metabolism before further biotic changes occur
Villa
s-B
oas
2005
MS
Rev
24:
613
Quenching
Heating 80-100 °C protein denaturation
instantaneous arrest of any
metabolic activity

29
Extraction
Goals• Extraction metabolites from cells with ideally 100% recovery• Remove disturbing agents (to avoid interference with separation (salts,
solvents,...) and with detection (lipids, proteins,...)
Technique• Multiple rounds of solvent extraction (boiling ethanol)
Has to be adapted to cells, analytes, and matrix etc.Important: validation for losses and uneven extraction efficiency
Extraction
breaking open the cells, denaturing
protein and extracting the metabolites

30
Analysis with enzymatic assays
Quenching Extraction
Bergmeyer et al. (eds.), Methods of enzymatic analysis. Verlag Chemie, Weinheim
enzyme assays metabolite concentrations
Disadvantages:- Tedious experimental procedure for each metabolite- You only ‚find‘ the metabolites you are looking for
Calls for genericmetabolite detection method!
G6P/F6PF16PDHAP/G3P2PG/3PGPEPPYRR5P/RU5P/X5P6PGLATPADP
Measuredconcentrations (mM)
0.481.110.674.041.781.930.150.631.100.78

31
Which detection method?
Quenching Extraction

32
Solution ...
Separation DetectionQuenching Extraction
chromatography mass spectrometryUV, NMR, ...

33
SeparationGoals• discriminate between analytes based on
physico-chemical properties > resolve in time
• reduce mix complexity before detection > decrease interferences> increase sensitivity
3 major alternatives• Gas chromatography (GC)• Liquid chromatography (LC)• Capillary electrophoresis (CE)
Separation depends on detection and biological question!
There is not a one-fit-all separation method!
Separation

34
Chromatographic separation → characteristic retention time
Separation - chromatogram Separation

36
Detection - principles
• Spectrum– UV – VIS – IR absorption,
fluorescence
• Molecular weight (mass)• Charge, redox potential• Nuclear magnetic resonance• Raman spectroscopy
Main strength of:MS: Sensitivity, speed, flexible separation, cost (per sample), compound identificationNMR: Quantitative, compound identification, non-destructive
Detection relies on physico-chemical properties of analytes, e.g.
Hollywood et al 2006 Proteomics 6: 4716
In metabolomics, detection must contribute to separation.Very often, broad-scope method are very sensitive to the environment/matrix.
Detection

38
Mass spec in a nutshell Detection
Quadrupole
Time-of-flight
Electrosprayionization
ion with instable
trajectory
ion with stable
trajectory
to detect
or
ion beam

39
Mass spec in a nutshell Detection
Tandem (MS-MS) mass spectrometers are instruments that have more than one analyser and so can be used for structural and sequencing studies.
Two, three and four analysers have all been incorporated into commercially available tandem instruments, and the analysers do not necessarily have to be of the same type, in which case the instrument is a hybrid one.
More popular tandem mass spectrometers include those of the quadrupole-quadrupole, magnetic sector-quadrupole , and more recently, the quadrupole-time-of-flight geometries.

43
masses
time
intensity
chromatogram
time
Combining chromatography and mass spec2 dimensional separation

54
Is there a one-fits-all method?Platform
Method met
hoxy
+ T
MS
met
hoxy
+ T
BD
MS
coat
pol
yE32
3co
at p
olyb
rene
bare
d / F
Aba
red
/ PA
RP
-C18
IP-R
P (D
AP
)IP
-RP
(TB
A)
HIL
IC (Z
WIT
TER
ION
IC)
HIL
IC (A
MIN
O)
NP
DIA
MO
ND
Suitable for Profiling Sugars Sugar-P (glycolysis + PPP) Amino acids Organic acids (TCA)
CoA derivatives Nucleotides (Energy) NAD(P)X (Redox)
Purines Pyrimidines
CEGC LCSystematic test- Mix of ~100 analytes (90% anions)- Calibration curves in water and with
13C-yeast extract
Qualify:CoverageChromatographyProblems with biomass Chromatographic problems arisingDetectionsSuppression/amplificationMultimers/adductsRobustnessThroughput
Büscher et al.

55
...
From spectra to results
2D-Spectra[time x mass x intensity] Results
Feature findingPeak findingDeisotopingDeclustering
IntegrationDenoisingSmoothingBaseline subtractionIntegrationNormalization (time, int.)
IdentificationPeak deconvolutionComponent recognition Database search (MS, MSn)Alignment of several runs
QuantitationIS, QCCalibration with standards
Compound XYConcentration
Peak YZArea
time
mol
ecul
ar w
eigh
tDetection

56
LC or GCChromatogram(50-1000 species)
Measured mass spectrum
Library Match: Serine
Calibration for Serine 362
peak
are
a
concentration
Absolute [c] of serine
Sample
Measured mass spectrum
No match in spectral library!
Relative peak area ofunknown compound
measured
library
Quantification
Quantification
Separation
Detection
Quantification

62
Overview: Typical metabolomics workflow
Quenching Extraction Separation QuantificationDetection
gas-chromatographycapillary-electrophoresisliquid-chromatography
mass-spectrometry
instantaneous arrest of any
metabolic activity
interpretation
breaking open the cells,
denaturing protein and
extracting the metabolites

68
Is it possible to measure everything?Microbial metabolomics: Toward a platform with full metabolome coverage, Mariët J. van der Werf, Karin M. Overkamp, Bas Muilwijk, Leon Coulier and Thomas Hankemeier, Anal Biochem 2007
Achieving metabolome data with satisfactory coverage is a formidable challenge in metabolomicsbecause metabolites are a chemically highly diverse group of compounds. Here we present a strategy for the development of an advanced analytical platform that allows the comprehensive analysis of microbial metabolomes. Our approach started with in silico metabolome information from three microorganisms—Escherichia coli, Bacillus subtilis, and Saccharomyces cerevisiae—and resulted in a list of 905 different metabolites. Subsequently, these metabolites were classified based on their physicochemical properties, followed by the development of complementary gas chromatography–mass spectrometry and liquid chromatography–mass spectrometry methods, each of which analyzes different metabolite classes. This metabolomicsplatform, consisting of six different analytical methods, was applied for the analysis of the metabolites for which commercial standards could be purchased (399 compounds). Of these 399 metabolites, 380 could be analyzed with the platform. To demonstrate the potential of this metabolomics platform, we report on its application to the analysis of the metabolomecomposition of mid-logarithmic E. coli cells grown on a mineral salts medium using glucose as the carbon source. Of the 431 peaks detected, 235 (=176 unique metabolites) could be identified. These include 61 metabolites that were not previously identified or annotated in existing E. coli databases.
Out of the 176 detectable/identifiable, 90% can be quantified with 2 (3) platforms only.

72
Ongoing research and outlook
• Improve sensitivity• Improve coverage (separation, extraction)• Improve quantitation• Improve precision• Improve identification of unknown compounds• Improve throughput

79
Cell populations are often heterogeneousSources for heterogeneity Genetic differences Different microenvironments Different cell cycle stages ....

80
Metabolic changes during cell cycle
MurrayDB, BeckmannM, KitanoH: Regulation of yeast oscillatory dynamics. Proc NatlAcadSciUSA 2007, 104:2241-2246.

81
Metabolic changes during cell age
Lesur I,Campbell JL: The transcriptome of prematurely aging yeast cells is similar to that of telomerase-deficient cells. Mol Biol Cell 2004, 15:1297-1312.
Lin SS,Manchester JK,Gordon JI: Enhanced gluconeogenesis and increased energy storage as hallmarks of aging in Saccharomyces cerevisiae. J BiolChem 2001, 276:36000-36007.
Koc A,Gasch AP,Rutherford JC,Kim HY,Gladyshev VN: Methionine sulfoxide reductase regulation of yeast lifespan reveals reactive oxygen species-dependent and-independent components of aging. Proc NatlAcadSciUSA 2004, 101:7999-8004.
Replicative aging

82
Cell populations are often heterogeneousSources for heterogeneity Genetic differences Different microenvironments Different cell cycle stages Different cell ages ....
Another source of heterogeneity:stochasticity-induced phenotypic heterogeneity
low copy numbers
Stochastic fluctuation of intracellularmolecules (‘noise‘)
Positive feedback circuits
yx
Kussell & Leibler, Science, 2005 - Balaban et al., Science, 2004 -Ozbudak et al., Nature, 2004 Elowitz et al., Science, 2002 -Thattai & van Oudenaarden, PNAS, 2001
Single-cell-analysis techniques required for Systems Biology(Most current “omics“ techniques average over populations)

86
Single-cell measurement on different levels
DNA
mRNA
proteins enzymes
metabolite metabolite
Single-cell DNA analysis / genomics(lysis, dielectrophores. (DEP), chromatogr., electrophoresis, PCR, sequencing)Quake group, Stanford (E. coli, microbes), Sturm group, Princeton (E.coli)
Single-cell transcription analysis / transcriptomics(lysis, separation and isolation (e.g. beads), cDNA, fluorescence)Quake group, Stanford (mouse fibrobl., hum. stem cells), Potier group, Paris (mouse neurons)
Single-cell protein analysis / proteomics(lysis, electrophoresis, fluorescence) Zare group, Stanford (insect cells, bacteria), Dovichi group, U Washington (cancer cells), Xie group, Harvard (E. coli), Sweedler group, Urbana, IL (neurons, MS) , Ramsey group, UNC, microfluidics/MS,Toner group, MIT (lymphoblasts), Cooper group, Glasgow, UK (cancer), Anselmetti group, Bielefeld (insects, sf9), Single Cell Proteomics and Lipidomics project, UCL, London (started 2006)
Single-cell metabolite analysis / metabolomics(electrophoresis, partly fluorescence, MS)Masujima group, Hiroshima University, mast cells,pipette, suck out cell, ESI-MS, Fang group, Northeastern Univ. Shenjang, China (oxygen, glutathione), Netherlands Metabolomics Center (SCM projected)

87
Single-cell metabolomics
Single-cell metabolomics challenges large number of compounds chemical diversity (+ similarity) low metabolite quantities low molecular weights: fluorescent
labeling practically impossible fast metabolic turnover rates
(< 1 sec)
Single-cell metabolite analysis / metabolomics(electrophoresis, partly fluoresence) Masujima group, Hiroshima University, mast cells, pipette, suck out cell, ESI-MS, Fang group, Northeastern Univ. Shenjang, China (oxygen, glutathione), Netherlands Metabolomics Center (SCM projected)
DNA
mRNA
proteins enzymes
metabolite metabolite

88
Challenge of low metabolite abundance
Challenge: sampling and processing of single cells without loss
Challenge: transfer to detector without loss
1 attomol = 10-18 mol
attomoles number of molecules
attomoles number of molecules
ATP 1 600'000 140 85'000'000
F16BP 2 1'300'000 10 7'500'000G6P 2 1'300'000 200 120'000'000PEP 1.5 900'000 90 50'000'000PYR 1.5 900'000 5 3'000'000
E. coli S. cerevisiae
89
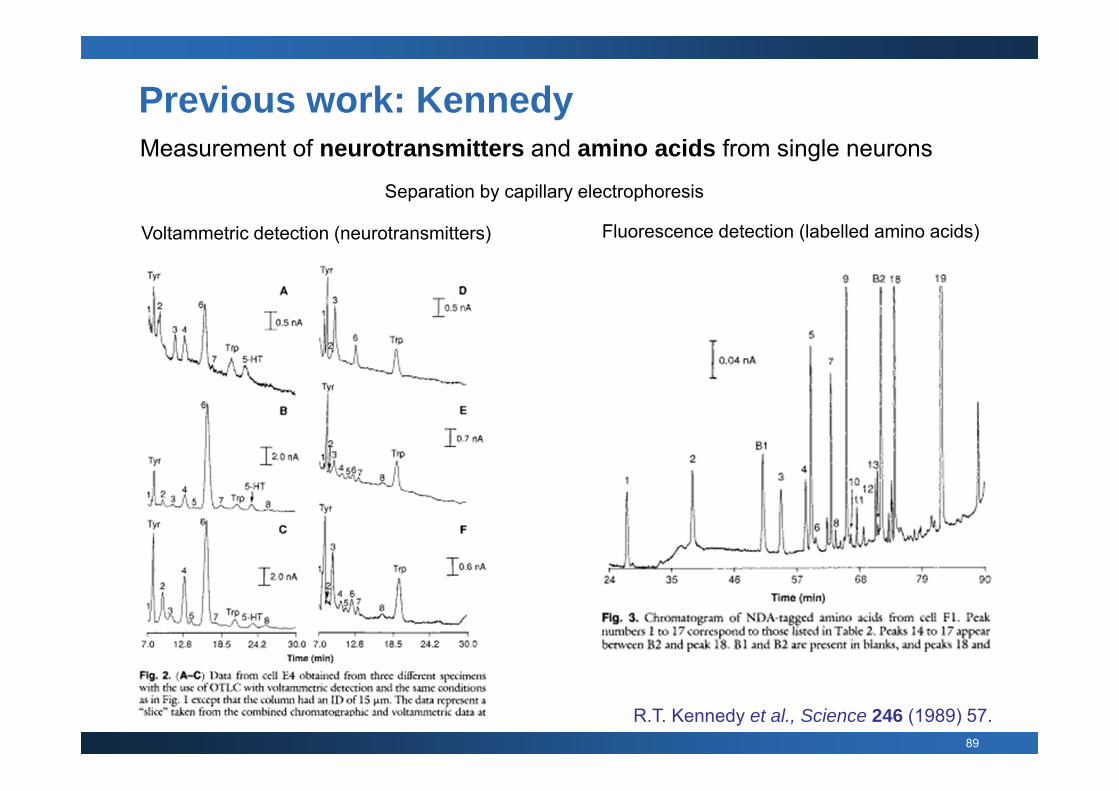
Measurement of neurotransmitters and amino acids from single neurons
R.T. Kennedy et al., Science 246 (1989) 57.
Voltammetric detection (neurotransmitters)
Previous work: Kennedy
Fluorescence detection (labelled amino acids)
Separation by capillary electrophoresis

90
Single cell metabolomics (SCM)
Cur
rent
Opi
nion
in B
iote
chno
logy
, 201
0, 2
2: 2
6-32

91
Mass-spec based technologies for SCM

92
M. Shimizu et al., Anal. Sci. 19 (2003) 49.
Aspiration of a single mast cells(mast cells = rich in histamine and heparin)
Embedded in DHB MALDI matrix
Development of histaminesignal during maturation ofa mast cell
Previous work: Masujima

93
Mass-spec based technologies for SCM

94
Microfluidics + MALDI-MS
Cooling
Cell suspensionCell
sizingCell
focusingCelllysis
Cellfragment
separation
Chip-to-MS
interface
Massspectrometer
Cell culture Microfluidic cell handling Chip-to-MS MS
highly efficient interface to mass-spectrometer
microfluidic platform for processing single cells
highly sensitive mass-spectrometric method

97
Microfluidic platformsSet-up for prototyping:Three-layerglass/PDMS hybridmicrodevice forprototyping
Set-up for final chip:Glass/SU-8/glass sandwichwith opposing electrodes

98
Functions of the microfluidic device
differentialimpedance
measurement
electricfield
pulses
MS

99
Cell sizing: differential impedance measurementDifferential impedance measurement with opposing electrodes to achieve evenly distributed E-field
Amplitude and phase can be correlated with cell size.
electronics and software for signal acquisition, amplification and analysis
peak
am
plitu
de a
.u.
velocity of the beads
4 µm
6 µm
8 µm polystyrene beads
101
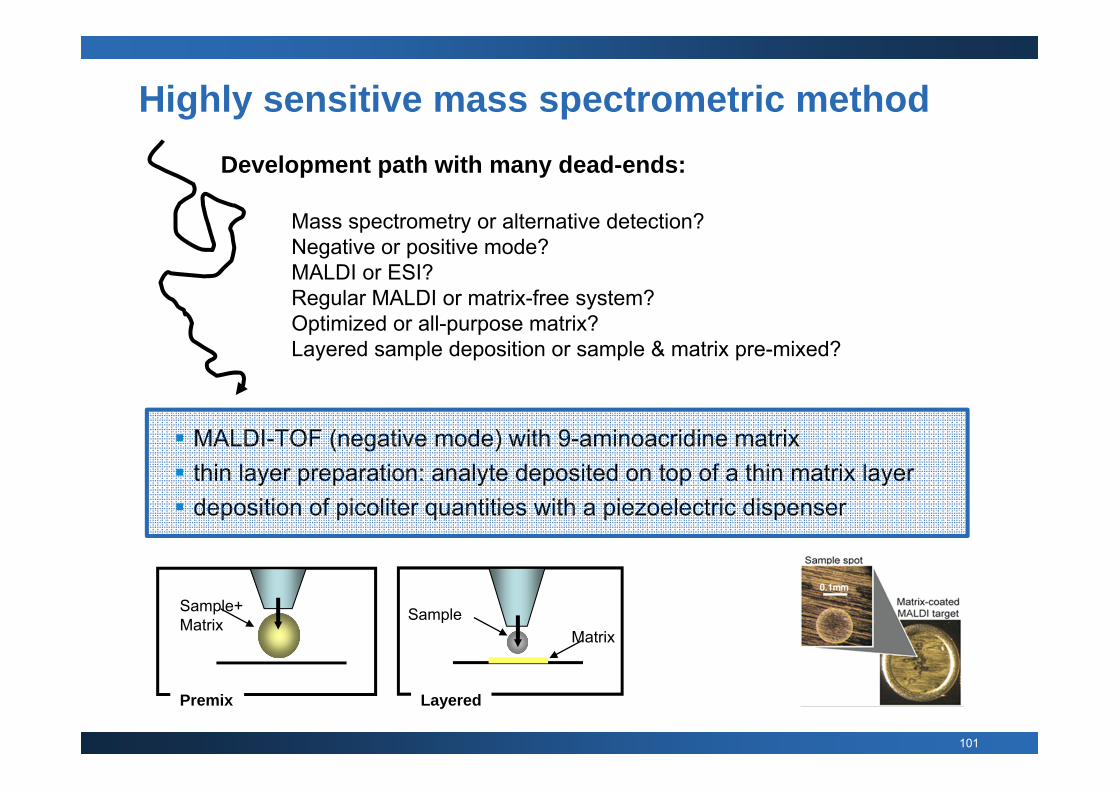
Highly sensitive mass spectrometric method
Sample+Matrix
Premix
SampleMatrix
Layered
MALDI-TOF (negative mode) with 9-aminoacridine matrix thin layer preparation: analyte deposited on top of a thin matrix layer deposition of picoliter quantities with a piezoelectric dispenser
Development path with many dead-ends:
Mass spectrometry or alternative detection?Negative or positive mode?MALDI or ESI?Regular MALDI or matrix-free system?Optimized or all-purpose matrix?Layered sample deposition or sample & matrix pre-mixed?

102
Analyte is co-crystallized with an excess of a solid matrix material. This mixture isdeposited on a substrate. Laser irradiation evaporates material and creates a plumeconsisting of 99.9% neutrals and only 0.1% ions, both positive and negative.
Substrate SubstrateSubstrate
Analyte
MatrixLaser
++
-
-
Matrix-Assisted Laser Desorption/ Ionization (MALDI)
106
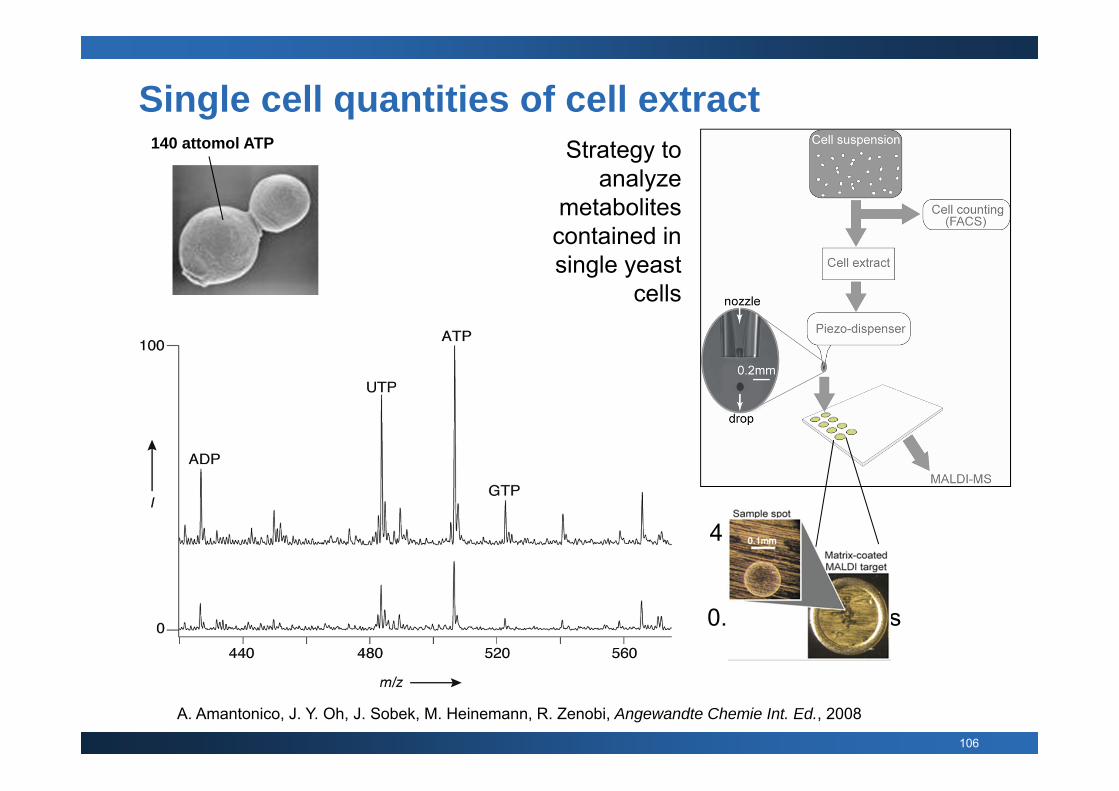
Single cell quantities of cell extract
4 nL ~ 6 cells
0.39 nL ~ 0.6 cells
A. Amantonico, J. Y. Oh, J. Sobek, M. Heinemann, R. Zenobi, Angewandte Chemie Int. Ed., 2008
Strategy to analyze
metabolites contained in single yeast
cells
140 attomol ATP
107
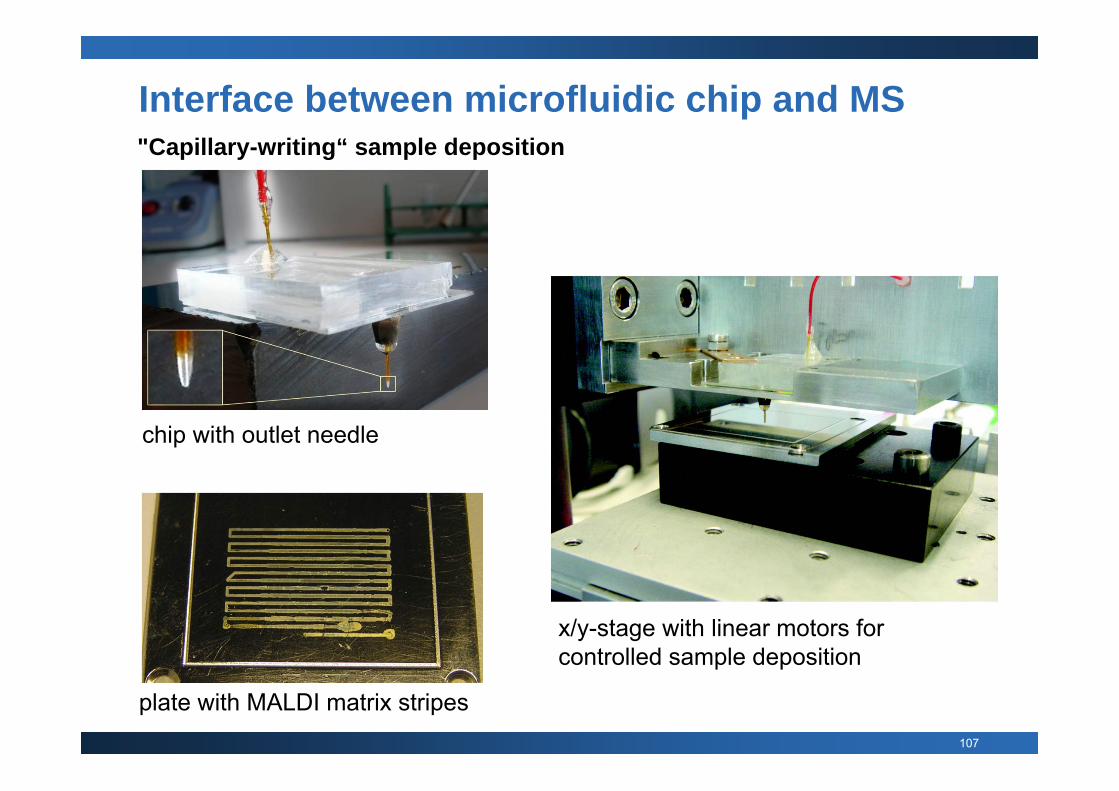
Interface between microfluidic chip and MS
x/y-stage with linear motors forcontrolled sample deposition
"Capillary-writing“ sample deposition
chip with outlet needle
plate with MALDI matrix stripes

108
Interface between microfluidic chip and MS"Capillary-writing“ sample deposition

109
Mass-spec based technologies for SCM

110
Micro-arrays for SCM
Urban et. al. Lab Chip. 2010 Dec 7;10(23):3206-9.