maximizing deep learning performance using intel software ... · fast deep learning on intel...
TRANSCRIPT

Using Intel Software Development Tools For Maximizing Deep Learning Performance
Alaa Eltablawy, Colfax International
Intel AI DevCon 2018
Create an account on the Intel AI DevCloud:https://colfaxresearch.com/aidevcon18
Passcode: AG7WNN92

Connect to the Intel® AI DevCloud 1. Account: colfaxresearch.com/aidevcon18
Passcode: AG7WNN922. Follow the link in the invitation email3. From the options on the top right, choose connect4. Follow the link in Connect via Jupyter Hub section5. From the New dropdown menu on the top right
choose Terminal, and run command “devcon18”6. Open “Human_Segmentation/Hands-on.ipynb”
Need a 30-day account? Go here after the workshop:

Agenda
● What you will learn ● Deep Learning on Intel Architecture● Intel Parallel Studio XE tools● Motivating DL example: Human segmentation● Conclusion and Q&A

What You Will Learn
1. Why and how to use performance analysis tools like Intel VTune Amplifier
2. Measure the computational efficiency of your deep learning application on an Intel CPU
3. Use the guidance of the analysis tools to turn the appropriate “tuning knob”
4. Take advantage of optimizations in DL frameworks for Intel architecture

Deep Learning on Intel Architecture
● Deep learning (DL) applications on Intel Architecture● Intel-optimized DL frameworks
○ DNN Primitives in Intel MKL○ TensorFlow, Caffe, etc..○ Optimizations for CPU

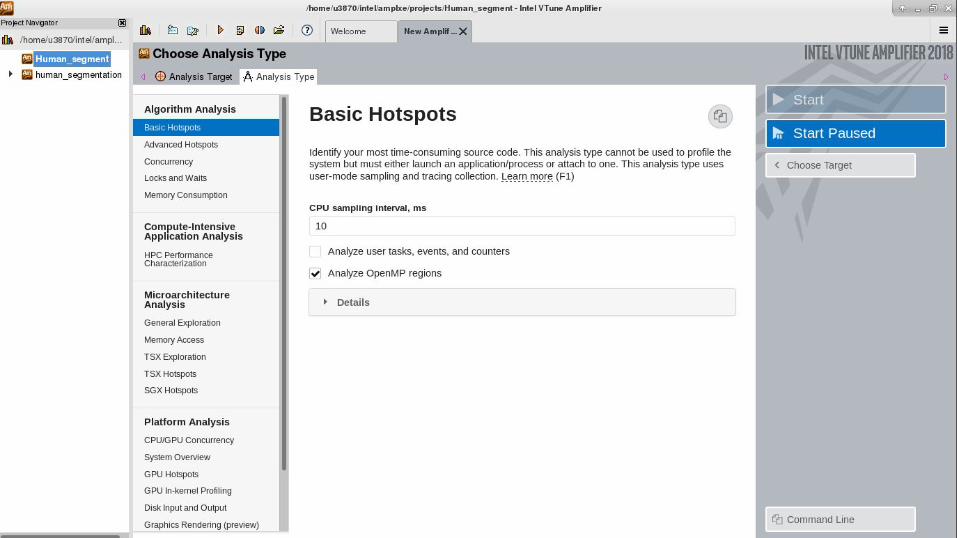
Intel VTune Amplifier
● Statistical performance analysis tool○ Hardware events○ User-mode sampling
● Results:○ Hotspots○ General issues (memory, cache, I/O, arithmetics,...)
● Getting started with VTune Amplifier


Application Performance Snapshot
● Part of VTune Amplifier
● Analyze CPU usage, OpenMP imbalance, Memory access efficiency, FPU usage
● Automatic guidance to recommended tools
● Getting started with Application Performance Snapshot


Motivating example: Human segmentation
● Image semantic segmentation problem● Applications using semantic segmentation:
○ Autonomous driving○ Augmented and virtual reality○ Indoor navigation
Conv5x5+
Pool
Conv5x5+
Pool
Conv3x3
Conv3x3
Conv3x3
Conv3x3
Conv3x3
Conv3x3+
Pool
FC1 FC2 FC3
48x48x3 48x48
Code based on Song et al. (2015) — http://ieeexplore.ieee.org/abstract/document/7486548/

Connect to the Intel® AI DevCloud 1. Account: colfaxresearch.com/aidevcon18
Passcode: AG7WNN922. Follow the link in the invitation email3. From the options on the top right, choose connect4. Follow the link in Connect via Jupyter Hub section5. From the New dropdown menu on the top right
choose Terminal, and run command “devcon18”6. Open “Human_Segmentation/Hands-on.ipynb”
Need a 30-day account? Go here after the workshop:

Tensorflow Optimizations for Intel architectureTensorFlow* Optimizations for the Intel® Xeon® Scalable Processor
Intel Optimized TensorFlow* Installation Guide
TensorFlow* Optimizations on Modern Intel® Architecture
TensorFlow Performance Guide
Intel distribution for Python

Fast Deep Learning on Intel Architecture
● Intel Software development tools for fine tuning:○ Application performance snapshot (APS) to diagnose global issues○ Intel VTune Amplifier to detect hotspots and for platform analysis
● Programming practices for high performance:○ Input data serialization○ Environment control for efficient computing ○ Parallelism optimization (see Intel AI Academy)