may 20, 2010 savannah, ga - tappi · global urea demand vs. supply urea price drivers effect on gas...
TRANSCRIPT

May 20, 2010Savannah, GA
Raw Materials(Methanol and Urea) Review and Outlook
Reed Singleton
TAPPI’s B&IM CommitteeSpring Meeting

2
Review

3
Pete WallacePete Wallace

4
MethanolFOB US Gulf Coast - $/gal
$0.00
$0.50
$1.00
$1.50
$2.00
$2.50
$3.00
Q107 Q207 Q307 Q407 Q108 Q208 Q308 Q408 Q109 Q209 Q309 Q409 Q110
Pete's Forecast Actual Price

5
UreaNOLA - $/ST
$0
$100
$200
$300
$400
$500
$600
$700
$800
$900
Q107 Q207 Q307 Q407 Q108 Q208 Q308 Q408 Q109 Q209 Q309 Q409 Q110
Pete's Forecast Actual Price

6
Urea/FormaldehydeResin Review
• To make a 45,000 lb tank truck of a typical 65% UF resin requires:
– Approximately 31,500 lbs of 50% formaldehyde (requi res approximately 19,000 lbs of methanol)
– Approximately 20,000 lbs of granular urea, or 10 sh ort tons.

7
Formaldehyde

8
Supply Chain for Methanol/Formaldehyde
• Natural Gas (Methane)
• Natural Gas Reacted to form Methanol.
• Methanol Reacted to form Formaldehyde.– The driver on formaldehyde pricing is methanol.

9
Methanol Overview
• Production & Uses
• Supply/Demand
– Global
– North America
– Expansion and Rationalization
• Price History and Outlook

10
Methanol production

11
Methanol
• Feedstock
– Natural Gas and Coal
• Primary Markets
– Formaldehyde, widely used to make resins and other chemicals
– Methyl-tert-butyl-ether (MTBE), used as a gasoline oxygenate
– Acetic Acid
– Methyl Amines
– Windshield washer fluid
– Energy applications
– Other chemicals
• Primary Cost Drivers
– Supply/Demand
– Energy Costs

12
Methanol and Its Uses
M
e
t
h
a
n
o
l
Methylamines
Methyl Methacrylate
Dimethyl terephthalate (DMT)
Methanethiol (Methyl Mercaptan)
Methyl tertary-Butyl Ether (MTBE)
Acetic Acid
Formaldehyde
Methanol to Olefins
Fuel Cells
Alternative Fuels
Methyl Chloride (Chloromethane)
Many Other Uses
Caffeine; Sevin/carbaryl; Various insecticides,
herbicides, pesticides; Analgesics; +
Polymethylmethacrylate (PMMA);
Methacrylate/Acrylate Co Polymers
Polyesters
Chlorine Dioxide;
DL-Methionine (amino acid)
Vinyl Acetate; Acetic Anhydride;
Terephthalic Acid
Phenol, Urea, Melamine Resins;
Polyoxymethylene; Polyois; Butanediol; +
Methylene Chloride (CH2Cl2)
Gasoline Additive
DME/Gasoline Blending

13
Global Supply & Demand
• Global demand is returning from the 2009 low
• Supply still growing, but potential exists for significant rationalization of high-cost production
• Biggest demand
– Construction applications
– Automotive
– Energy applications increasing in importance

14
0
10,000
20,000
30,000
40,000
50,000
60,000
70,000
80,000
2006 2007 2008 2009 2010E 2011E 2012E 2013E
Total Capacity Total DemandJim Jordan & Associates
(000) Tonnes per Year
World Methanol Capacity vs Demand

15
0
10,000
20,000
30,000
40,000
50,000
60,000
70,000
80,000
2006 2007 2008 2009 2010E 2011E 2012E 2013E
FORMALDEHYDE MTBE ACETIC ACID M.METHACRYLATE
DMT GASOLINE/FUELS SOLVENTS MISCELLANEOUS
Methanol Demand in the World
(000) Tonnes per Year
Jim Jordan & Associates
Total Capacity

16
Marketing leaders(exclusive of China)
Methanex
SABIC
Mitsubishi Gas Chemical (MGC)
Methanol Holdings Trinidad Limited (MHTL)
Atlantic Methanol Company (AMPCO)
StatoilMitsubishi Corp
Company
Marketing capacity(mm mt)
Primary supply region
Methanex 6 GlobalSABIC 3.4 Europe and AsiaMitsubishi Gas Chemical (MGC) 3.0 GlobalMethanol Holdings Trinidad Limited (MHTL) 5.0 GlobalAtlantic Methanol Company (AMPCO) 1.4 NA and EuropeStatoil 0.9 EuropeMitsubishi Corp 0.8 NA and Europe
29%
17%15%
24%
17%

17
0
1,000
2,000
3,000
4,000
5,000
6,000
7,000
8,000
2006 2007 2008 2009 2010E 2011E 2012E 2013E
FORMALDEHYDE MTBE ACETIC ACID M.METHACRYLATE
DMT GASOLINE/FUELS SOLVENTS MISCELLANEOUS
Methanol Demand in North America
(000) Tonnes per Year
Jim Jordan & Associates

18
Southern Chemicals (MHTL)
38%
Methanex25%
AMPCO9%
Lyondell9%
Mitsubishi Corp4%
Mistui4%
ENI4%
Sabic3%
Other19%
MGC4%
C om panyN A sup ply
(mm mt)Southern Chemic a ls (MH TL) 2.35Methanex 1.55AMPCO 0.55Lyondell 0.53MG C 0.25Mitsub ish i Corp 0.25Mis tu i 0.25ENI 0.25Sabic 0.20
North American Methanol Supply (major)

19
Capacity Expansions

20
Methanol pricing

21
Methanol price posting agencies*
• Jim Jordan & Associates (JJ&A)
• Chemical Market Associates, Inc (CMAI)
• Chemical Data (ChemData)
• ICIS
*Third party, unbiased agencies

22
Energy Factor Relationship

23

24
Methanol Price Forecast(US Gulf Coast Estimated Actual Contract in Barges)
JJ&A US Cents per Gallon 22-Apr-102009 2010 2011 2012 2013 2014 2015
1st Quarter $0.58 $0.942nd Quarter $0.54 $0.883rd Quarter $0.61 $0.704th Quarter $0.86 $0.60AVERAGE FORECAST $0.65 $0.78 $0.70 $1.10 $1.30 $1.20 $1.10
Upside Forecast $0.86 $0.77 $1.21 $1.43 $1.32 $1.21
Downside Forecast $0.70 $0.63 $0.99 $1.17 $1.08 $0.99
US Gulf Coast Estimated Contract in Barges

25
Conclusions
• Methanol is a building block for many products
• North American supply controlled by 2-3 suppliers
• Current oversupply of methanol
• Entering extended period of price stability
• Energy applications increasingly important

26
Urea

27
Urea Basics
• Synthesized from Ammonia and Carbon Dioxide
• High Nitrogen Content (46%)
• Used as Prills, Granular, or in Solution
• Globally traded (ease of transport)
• Main trading Hubs – The Black Sea and the Middle East
• Long-term Demand Growth
• Energy Intensive Production (energy = approx. 90% of production cash costs)

28
Urea
• Feedstock– Natural Gas
• Primary Markets– 90% of urea is used in the fertilizer industry
– Used to make melamine and urea formaldehyde resins
– Used in the reduction of Nitrogen Oxide emissions
• Primary Cost Driver– Natural Gas
• Supply and Demand– World production approximately 140 million MT’s
– Traded material approximately 33 million MT’s

29
� Supply-driven price for urea
� Urea demand
� Urea supply
� Urea price (above floor)
� Most other nitrogenfertilizer prices
Nitrogen Fertilizer/Urea Market Drivers
US / European gas prices
Grain inventories/prices
New urea capacity vs. closures
Global urea demand vs. supply
Urea price
Drivers Effect on
� Gas cost in Europe
� Fixed cost
� Unit cost
Oil product prices
Manning and maintenance
Productivity and economies of scale
RevenueDrivers
CostDrivers

30
Urea Demand

31
Drivers for Increased Nitrogen/Urea Consumption
• Fertilizer consumption
– Population growth
– Economic growth
• More meat consumption in developing countries
• Focus on diets rich in proteins
• More fruit and vegetables
• Reduce hunger
– Biofuels (continues to grow)

32
0.0
0.1
0.2
0.3
0.4
0.5
1960 1970 1980 1990 2000 2010E 2020E
Hec
tare
s/pe
rson
0
2
4
6
8
10 Population (billion)
Hectares/person Population
Increasing population and reduced land available for food production per capita
Source: IFA, Worldmarkets.com
�Very limited potential toincrease farmable land
� Improved living standards increase protein consumption per person, requiring more grain for animal feed
The only solution is to increase agricultural
productivity

33
Higher demand for meat requires more feed grain
0 20 40 60 80 100 120 140
Africa
Asia
Latin America
North America
EU
World
Kg/capita/year
Source: FAO
Significant potential for increasingmeat consumption in emerging countries
0 1 2 3 4 5 6 7 8 9
Beef
Pork
Poultry
Kg’s of grain to produce 1kg of meat
Feed grain multipliersfor meat production
2X
4X
7X

34
Solution (as I see it)
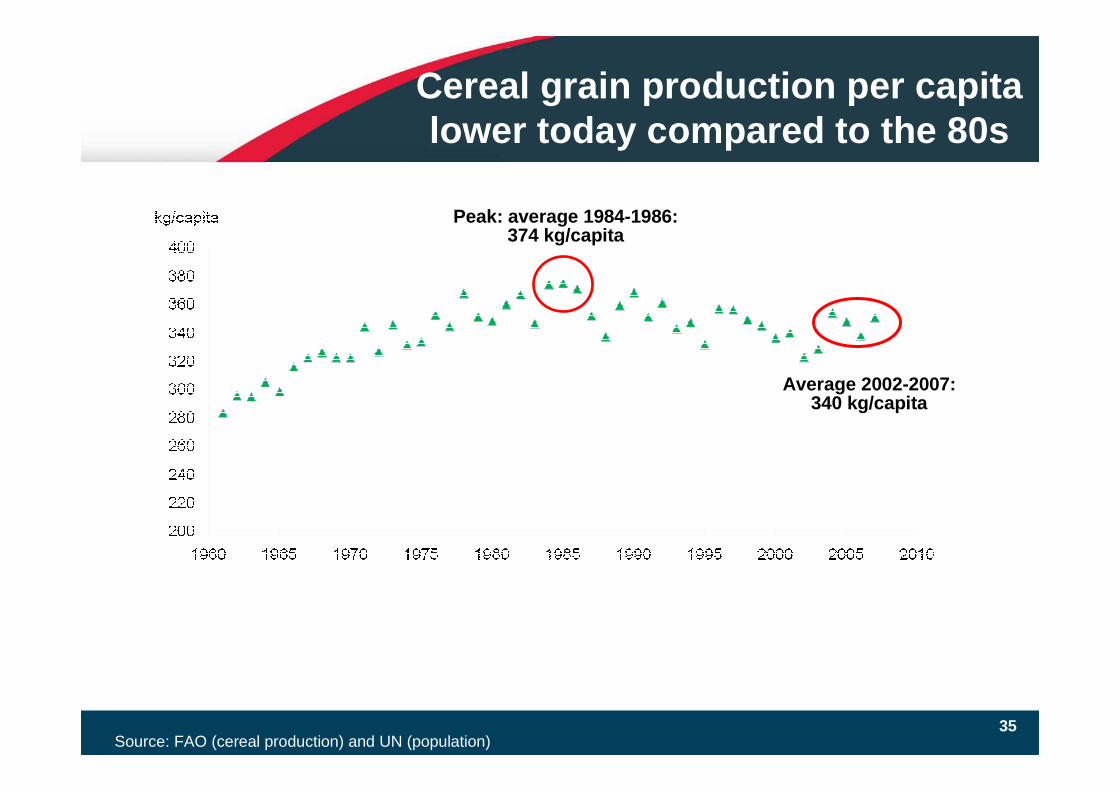
35Source: FAO (cereal production) and UN (population)
Cereal grain production per capita lower today compared to the 80s
Peak: average 1984-1986:374 kg/capita
Average 2002-2007:340 kg/capita

36
Current grain stocks up last two years, but still low
Consumption Production
Source: USDA, September 2009
75 days inventory
115 days inventory
Mt
1996-2001: 0.8% growth/year
2001-2008: 1.8% growth/year

37
U.S. Renewable Fuels Standard
0
5
10
15
20
25
2007actual
2008 2009 2010 2011 2012 2013 2014 2015
Billio
n G
allo
ns
0
1
2
3
4
5
6
Conventional Biofuel Advanced/Cellulosic BiofuelCorn Use for Ethanol
• Corn used for ethanol in 2010/2011 crop year, 4.3 b illion bu. vs. 3.63 billion bu. In 2009/2010 crop year (per U.S.D.A.)
Source: Renewable Fuels Association

38
U.S. Historic Grain Prices

39
Nitrogen consumption in key regions
0
5
10
15
20
25
30
35
40
1993 1995 1997 1999 2001 2003 2005 2007 2009F 2011F 2013F
Mil
lio
n t
on
s n
itro
ge
n
China: 1.1% per year
Europe: 1.8% per yearNorth America: 1.7% per year
Latin America: 3.0% per year
Source: IFA
Rest of Asia: 3.8% per year
India: 2.6% per year

40
Urea Supply

41
2H 2010 – Trade Balance

42
Expected New Capacity
YearGlobal Urea Capacity
Growth Estimate*Driving Regions
World Excluding China World Ex. China
2008 2.2% 1.6% China 55%
Iran 25%
Iran 56%
Egypt 26%
2009 5.9% 2.2% China 77%
Oman 7%
Oman 30%
Turkmen. 17%
2010 7.6% 4.5% China 65%
Iran 8%
Iran 23%
Pakistan 21%
2011 5.0% 2.8% China 68%
Qatar 12%
Qatar 37%
Pakistan 21%
2012 3.9% 4.7% China 32%
Algeria 22%
Algeria 32%
Vietnam 27%

43
Long-term S/D Outlook

44
Plant Operating Rates

45
Forecast

46
• Supply
–Spot prices are falling globally as Supply overcome s Demand.
–Over 11mm mt of new capacity is expected in 2010; 7 mm mt in China and
4mm mt outside China. China is expected to absorb i ts domestic supply, leaving a signficant excess supply in other regions .
–Three new plants (Brunei, Egypt, and Venezuela) are scheduled to start-up by mid 2010.
– There is no significant new capacity scheduled to s tart from 2011 through 2012
• Demand
–Demand continues to increase in most markets.
–Demand is expected to steadily increase through the forecast period.
Methanol Forecast Methanol Forecast Comments

47
Methanol forecastMethanol forecast(FOB US Gulf Coast)(FOB US Gulf Coast)
0.650
0.600
0.732
1.003
1.080
0.970
0.853
1.017
0.850
0.917
1.1071.083
0.500
0.600
0.700
0.800
0.900
1.000
1.100
1.200
Q1
200
9
Q2
200
9
Q3
200
9
Q4
200
9
Q1
2010
Q2
20
10
Q3
20
10
Q4
20
10
Q1
201
1
Q2
201
1
Q3
201
1
Q4
201
1
Period
Me
OH
pric
e (
US
$/ga
l)

48
Bullish
• Current Black Sea prices ($ 235/MT FOB) are already near low of past 2 years ($ 225/MT FOB). Can they go much lower before production curtailed?
• 2010 U.S. corn plantings to increase 3% from levels of past 2 years. Rice up 9% from 2009. Rice is a large consumer of urea.
UreaShort Term Market Factors

49
Bearish• Chinese urea stocks high.
�Q110 exports up 95% from Q109
• Chinese export tax to revert down to 7% effective Jul y 1st. Given high stocks and domestic weather problems cutti ng into demand, exports are expected to remain strong.
• New capacity (Iran, Pakistan, China) to come on-strea m.
• Second half 2010 trade balance is showing a slight u rea surplus.
• Early Midwest field activity may have favored other nitrogen products (ammonia, UAN) at expense of urea demand.
• Current NOLA values above current international levels.
• Forward paper market trading at a price discount.
UreaShort Term Market Factors

50
Uncertainties
• Chinese export volumes could be negatively impacted should China allow the Yuan to appreciate against the dollar.
• Will recently negotiated lower Ukrainian gas import prices from Russia flow through to nitrogen producers? Ukraine is under pressure to remove gas subsidies to industrials.
UreaShort Term Market Factors

51
Short-term Outlook (12 months)• Prices declining through spring and summer before
stabilizing and moving higher through fall and wint er.
• Overall, expect prices to trade in a relatively nar row range (+/- $ 30/ST) from current NOLA value of US$ 270 per ST, as global supply/demand fundamentals are relatively balanced.
Urea Market Forecast

52
Urea Market Forecast
Longer Term (2-3 years)• Agricultural fundamentals to support continued incr ease
in urea demand.
• Agricultural demand and higher energy costs resulti ng from the economic recovery will keep prices from fa lling to levels experienced in the early 2000’s.
• Investments in capacity should result in moderate surplus capacity in 2012/2013 and limit any strong upward price movement.
• Prices should remain above long-term (10 year) aver age ($ 240/ST), and relatively close to the past 5 year average of $ 320 per ST (basis NOLA).

53
UREA
NOLA
0
100
200
300
400
500
600
700
800
Q108 Q208 Q308 Q408 Q109 Q209 Q309 Q409 Q110 Q210 Q310 Q410 Q111
US
$ pe
r S
T
54
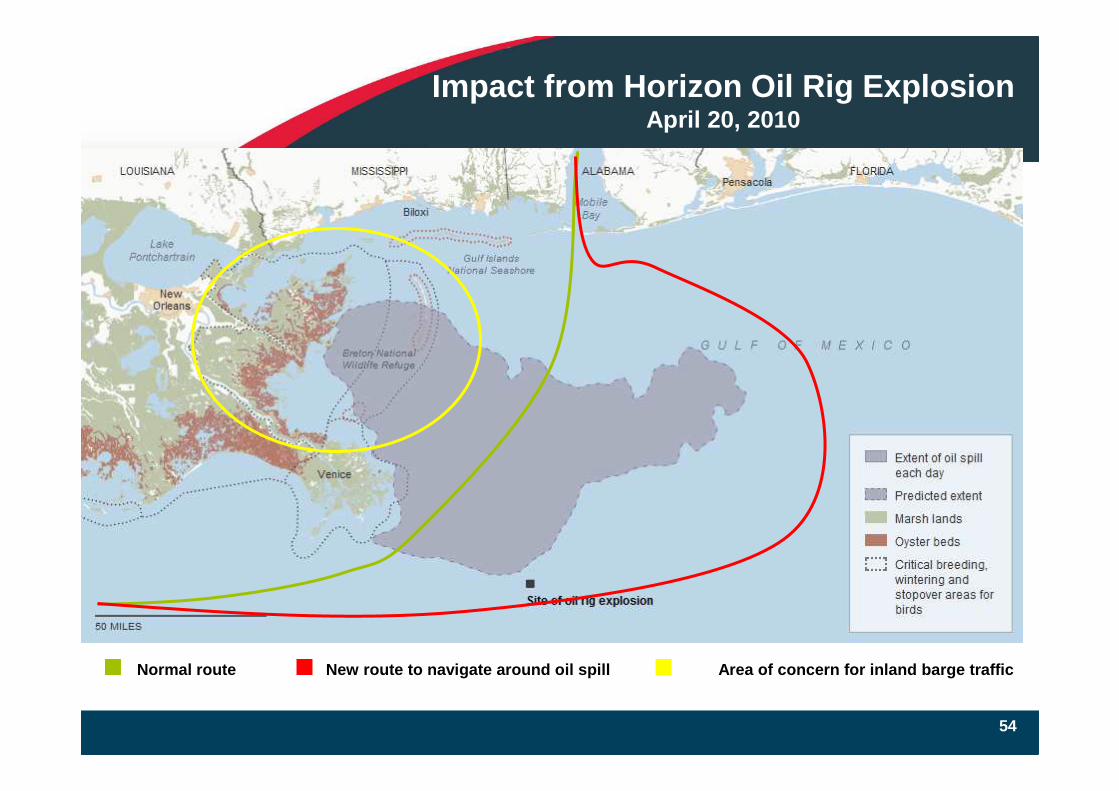
Normal route New route to naviga te around oil spill Area of c oncern for inland barge traffic
Impact from Horizon Oil Rig ExplosionApril 20, 2010

Special Thanks
• To YOU, for your attention!!
• To Ralf Yobp & Michael Curtin
…of the Arclin Procurement Team for their personal insights and help gathering information for this presentation.