may, 2019 commercialising east coast australia’s …gas consumption actual and forecast, 2010-38...
TRANSCRIPT

COMMERCIALISING EAST COAST AUSTRALIA’S LARGEST UNCONTRACTED2P RESERVE
MAY, 2019
Leigh Creek Energy Limited
For
per
sona
l use
onl
y

This presentation has been prepared by, or for Leigh Creek Energy Limited (LCK). It contains, and we may make other written or verbal forward looking statements with respect to certain of LCK’s plans, current goals and expectations relating to future financial condition, performance, results, strategic initiatives and objectives. By their nature, all forward-looking statements involve risk and uncertainty and are subject to factors that could cause actual results to differ materially from those indicated in this presentation and/or any statement, including forward-looking statements. Some of the factors that could cause actual results or trends to differ materially, include but are not limited to: price fluctuations; actual demand; currency fluctuations; drilling & production results; reserve estimates; loss of market; industry competition; market developments and government actions; environmental risks, physical risks, legislative, fiscal & regulatory developments; local, regional and international political, regulatory, economic & financial market conditions; political risks; the effect of losses due to defaults by counterparties or restructurings, on the value of our investments; changes in interest rates or inflation; changes in equity and/or prices on our investment portfolio; the impact of natural and man-made catastrophic events on our business activities and results of operations; our reliance on information and technology and third-party service providers for certain of our operations and systems; legal proceedings and regulatory investigations; the impact of operational risks, including inadequate or failed internal and external processes, systems and human error or from external events (including cyber attack); risks associated with arrangements with third parties, including joint ventures; the failure to attract or retain the necessary key personnel; systems errors or regulatory changes; the effect of fluctuations in share price as a result of general market conditions or otherwise; the effect of simplifying our operating st ructure and activities; the effect of a decline in any ratings or recommendations on our standing among customers, broker-dealers, shareholders, agents, wholesalers and/or other distributors of our products and/or services; changes to our brand / reputation; changes in government regulations or tax laws in jurisdictions where we conduct business; the inability to protect our intellectual property; the effect of undisclosed liabilities; the timing of any regulatory approvals, integration risk, and other uncertainties, such as non-realisation of expected benefits or diversion of management attention and other resources, relating to future acquisitions and/or pending disposals; project delays or advancement; approvals & cost estimates amongst other items & the cumulative impact of items.
While we try to ensure that the information we provide is accurate and complete, LCK advises you to verify the accuracy of an y information and/or statement, including a forward-looking statement before relying on it. LCK has no obligation to update the forward-looking statements in this presentation or any other forward-looking statements we may make. Forward-looking statements in this presentation are current only as of the date on which such statements are made.
This presentation may also contain non-IFRS measures that are unaudited, but are derived from & reconciled to the audited accounts. These should only be considered in addition to, and not as a substitute for, or superior to, our IFRS financial measures. All references to dollars, cents or $ in this presentation are to Australian currency, unless otherwise stated.
Gas Resources Compliance StatementThe PRMS resources estimates stated herein are based on, and fairly represent, information and supporting documentation prepa red by Timothy Hower of MHA Petroleum Consulting, Denver USA. Mr Hower is a member of the Society of Petroleum Engineers and has consented to the use of the Resource estimates and supporting information contained herein in the from and context in which it appears. All estimates are based on the deterministic method for estimation of petroleum resources.
Mineral Resource Compliance StatementEstimates of Mineral Resources reported in this announcement are based on the latest information and data available. The recently updated Geological Model and JORC Resource Estimation report, prepared by Warwick Smyth & Lynne Banwell of GeoConsult Pty Ltd during March 2019 was used in this latest PRMS estimation. A copy of the GeoConsult report on the updated Geological Model and JORC Resource Estimation is available to view at www.lcke.com.au.
LCK is not aware of any new information or data that materially affects this information & all the material assumptions & technical parameters underpinning the estimates continue to apply & have not materially changed.
DisclaimerF
or p
erso
nal u
se o
nly
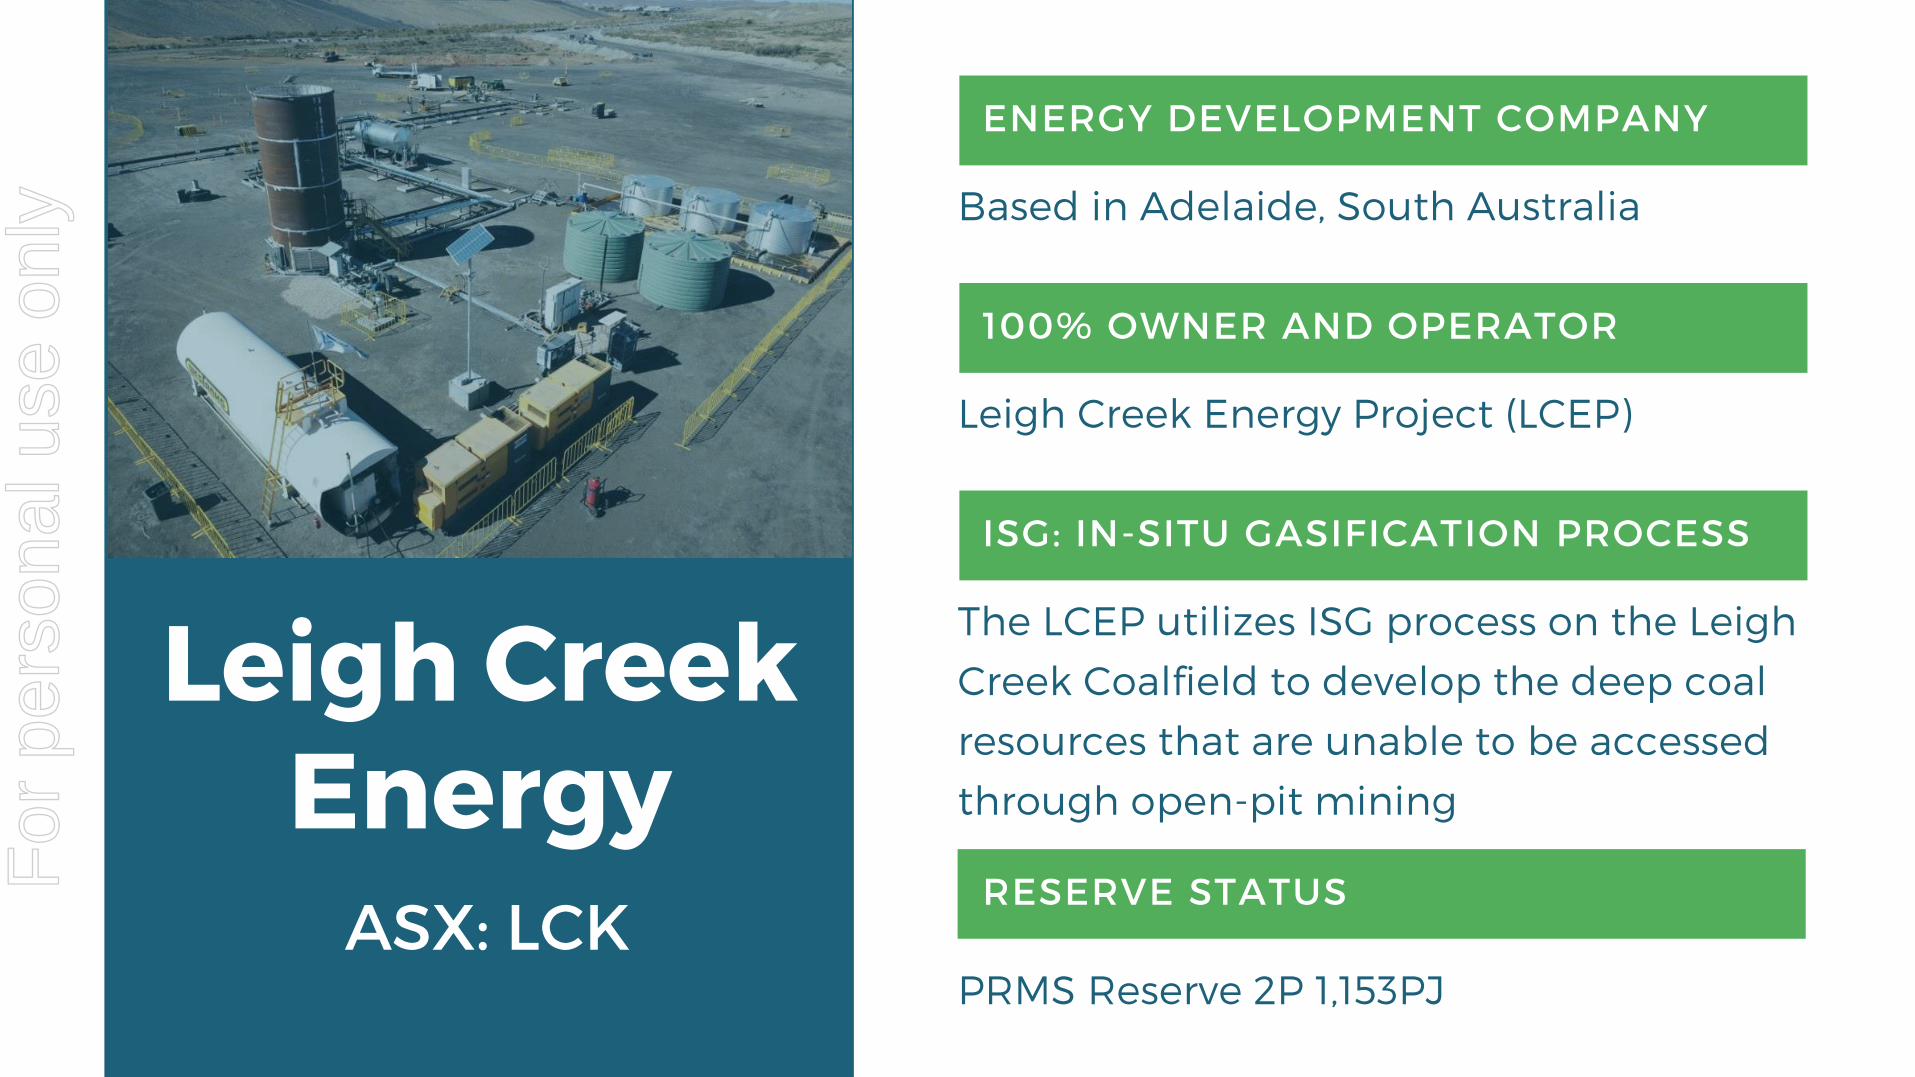
ENERGY DEVELOPMENT COMPANY
100% OWNER AND OPERATOR
ISG: IN-SITU GASIFICATION PROCESS
Based in Adelaide, South Australia
Leigh Creek Energy Project (LCEP)
The LCEP utilizes ISG process on the Leigh Creek Coalfield to develop the deep coal resources that are unable to be accessed through open-pit mining
Leigh Creek Energy
ASX: LCKRESERVE STATUS
PRMS Reserve 2P 1,153PJ
For
per
sona
l use
onl
y

ISG PROCESSConverts underground coal to
Syngas, Contains hydrogen, methane,
and carbon monoxide.
RESERVESThe Company holds a larger
2P reserve than the Otway, Bass, Gunnedah, Clarence-
Moreton, Sydney and Galilee
Basins COMBINED.(1)
SHAREHOLDERSAustralia, US institutions as
well as Chinese strategic partners.
INFRASTRUCTUREPower, road, rail, airport,
suitable geology, and fair diligent regulatory process.
SYNGASCan be processed for
conversion into natural gas, petrochemical products, or
agricultural products, like
Urea
Leigh Creek Energy (ASX:LCK)
LCEP is Australia’s largest uncontracted 2P gas reserve serving the East Coast market
Reserves (PJ)
2P
1,153
3P
1,608
Resources (PJ)2C
1,469
3C
2,127 (1) Australian Competition & Consumer Commission analysis of data obtained from gas producers
LCEP
For
per
sona
l use
onl
y

Next Milestones
• Completion of operations and decommissioning of
PCD
• Commercial agreements, Approvals
• Full Feasibility Study
Milestones Achieved
• Apr 2018 - South Australian Environmental approval received
• Oct 2018 - LCEP Operations achieved "First Gas"
• Feb 2019 - PCD successfully met its design parameters
• Mar 2019 - 2P reserve certified
The LCEP has received a PRMS certification of 1,153 PJ 2P and is now Australia’s largest uncontracted 2P gas reserve serving the East Coast
market!
For
per
sona
l use
onl
y

Capital Structure
Environmental Approval
PCD Construction Commences
ApprovalPCD OperationsCCCC Ltd visit
First Syngas
Pre-Commercial Demonstration
Success
2P Reserve Status
ASX:LCKA$0.29 per share
548.1 million sharesMC A$159 million
Top shareholdersChina New Energy Group
136.3m - 24.9%
Crown Ascent45.8 - 8.4%
HSBC Custody Noms Australia14.5m - 2.7 %
CITIC Australia17.2m - 3.2%
Rubi Holdings Pty Ltd 13.5m - 2.5%
Note: Data taken from Bloomberg on 4/9/19
Total 548.1m - 100%
For
per
sona
l use
onl
y

3,000
2,000
1,000
0
2P Reserves comparables by basin
Quantity of reserves and resources in the East Coast Gas Market as of June 2018 (PJ). Excludes Surat/Bowen Basin.Source: Australian Competition & Consumer Commission analysis of data obtained from gas producers
(PJ)
For
per
sona
l use
onl
y

6,000
4,000
2,000
0
Australian East Coast Gas 2P Reserves
Australian East Coast Reserve Comparables
These gas reserves are primarily contracted to LNG export projects
Source: Leigh Creek Energy
2P R
eser
ves
(PJ)
Source: Leigh Creek Energy Limited
For
per
sona
l use
onl
y

LCK Senex Blue Energy Central Petroleum Cooper Energy Beach Energy
$3
$2
$1
$0
$1.79 per GJ transaction price set by sale of the Ironbark gas project to APLNG on (Feb. 19, 2019)
Peer group average $1.43 per GJ
0.13
0.67
0.92
1.33
2.692.86
Enterprise Value per 2P Reserve Comparables (GJ)
Australian Pacific LNGOrigin
ConocoPhillipsSinopec
Source: Leigh Creek Energy, Bloomberg as of March 25th, 2019
A$
per
GJ
For
per
sona
l use
onl
y

Milestones
CHARACTERSATION PHASE
Environmental Approval
PCD Construction Commences
Surface Plant Construction
Q2
Construction and Commissioning
Completed
ISG WellInstallation
2019
Initiation of PCD Operations
ISG Well Pair Completed
Commercial Gas at the PCD Plant
PRMS Upgrade to 2P
Completion of PCD Operations
Decommissioning of PCD
Q3 Q1 Q22018
DEMONSTRATION PHASE
For
per
sona
l use
onl
y

Pathway to commercial
2019-H2 2020 2021+ 2022 2023+
Complete options analysis,Geotechnical investigation, Commercial arrangements
settled
EIS approval, FEED, Feasibility completed
Commercial Project Operation
EIS submitted, Pre-feasibility study completed
FID & Commence Commercial Project
Construction
PCD Operations 2P Reserve Fertiliser Production and/or Gas Sales
For
per
sona
l use
onl
y

LCEP’s gas resource has multiple commercialisation options in Australia.
Fertiliser vs Natural Gas
TARGET MARKET
Fertiliser
(highest value long term)
Domestic natural gas sales
Urea price is recovering from a cyclical low and prices are forecast to fundamentally improve vs. domestic gas prices in
Australia, which are a function of public policy, existing supply constraints and new demand from LNG export terminals.
For
per
sona
l use
onl
y

Strong MarketDynamics
Gas Demand
$10GJ norm
Contract certainty/term
FertilizerDemand
Supply Factors
Restriction on gas exploration due to politics
95% Imported
Australian producer under pressure
LNG Gladstone
For
per
sona
l use
onl
y

Source:“2018 Gas Statement of Opportunities”, AEMO, June 2018
Gas consumption actual and forecast, 2010-38
• LNG exports have increased demand 3x since 2014
2,250
2,000
1,750
1,500
1,250
1,000
750
500
250
0
Industrial
LNG
Residential / Commercial GPG
NGFR 2016 2017 GSOO September Update
For
per
sona
l use
onl
y

Supply Response -
Constrained
Environmental liabilities increased to include
shareholders+
Coal seam gas wells under performing
Developmentsrestricted
Ban on new onshore oil and gas exploration
Early stage regulatory framework
LCEP
For
per
sona
l use
onl
y

Gas Market
• East Coast demand tripled: LNG exports = price
• Major suppliers need more gas!
• Regulator predicts growing gas shortage
from 2018/19+
Source – ASX Gas Futures 15 May 2019
$/G
JF
or p
erso
nal u
se o
nly

AMMONIA AND UREAHIGH DEMAND PRODUCTS
2NH3 + CO2
Primarily used for fertiliser (primary production)
UREA
Value added products with diverse range of downstream products
NH3
Primarily used in chemical/industrial, minerals processing, explosives, etc
AMMONIA
For
per
sona
l use
onl
y
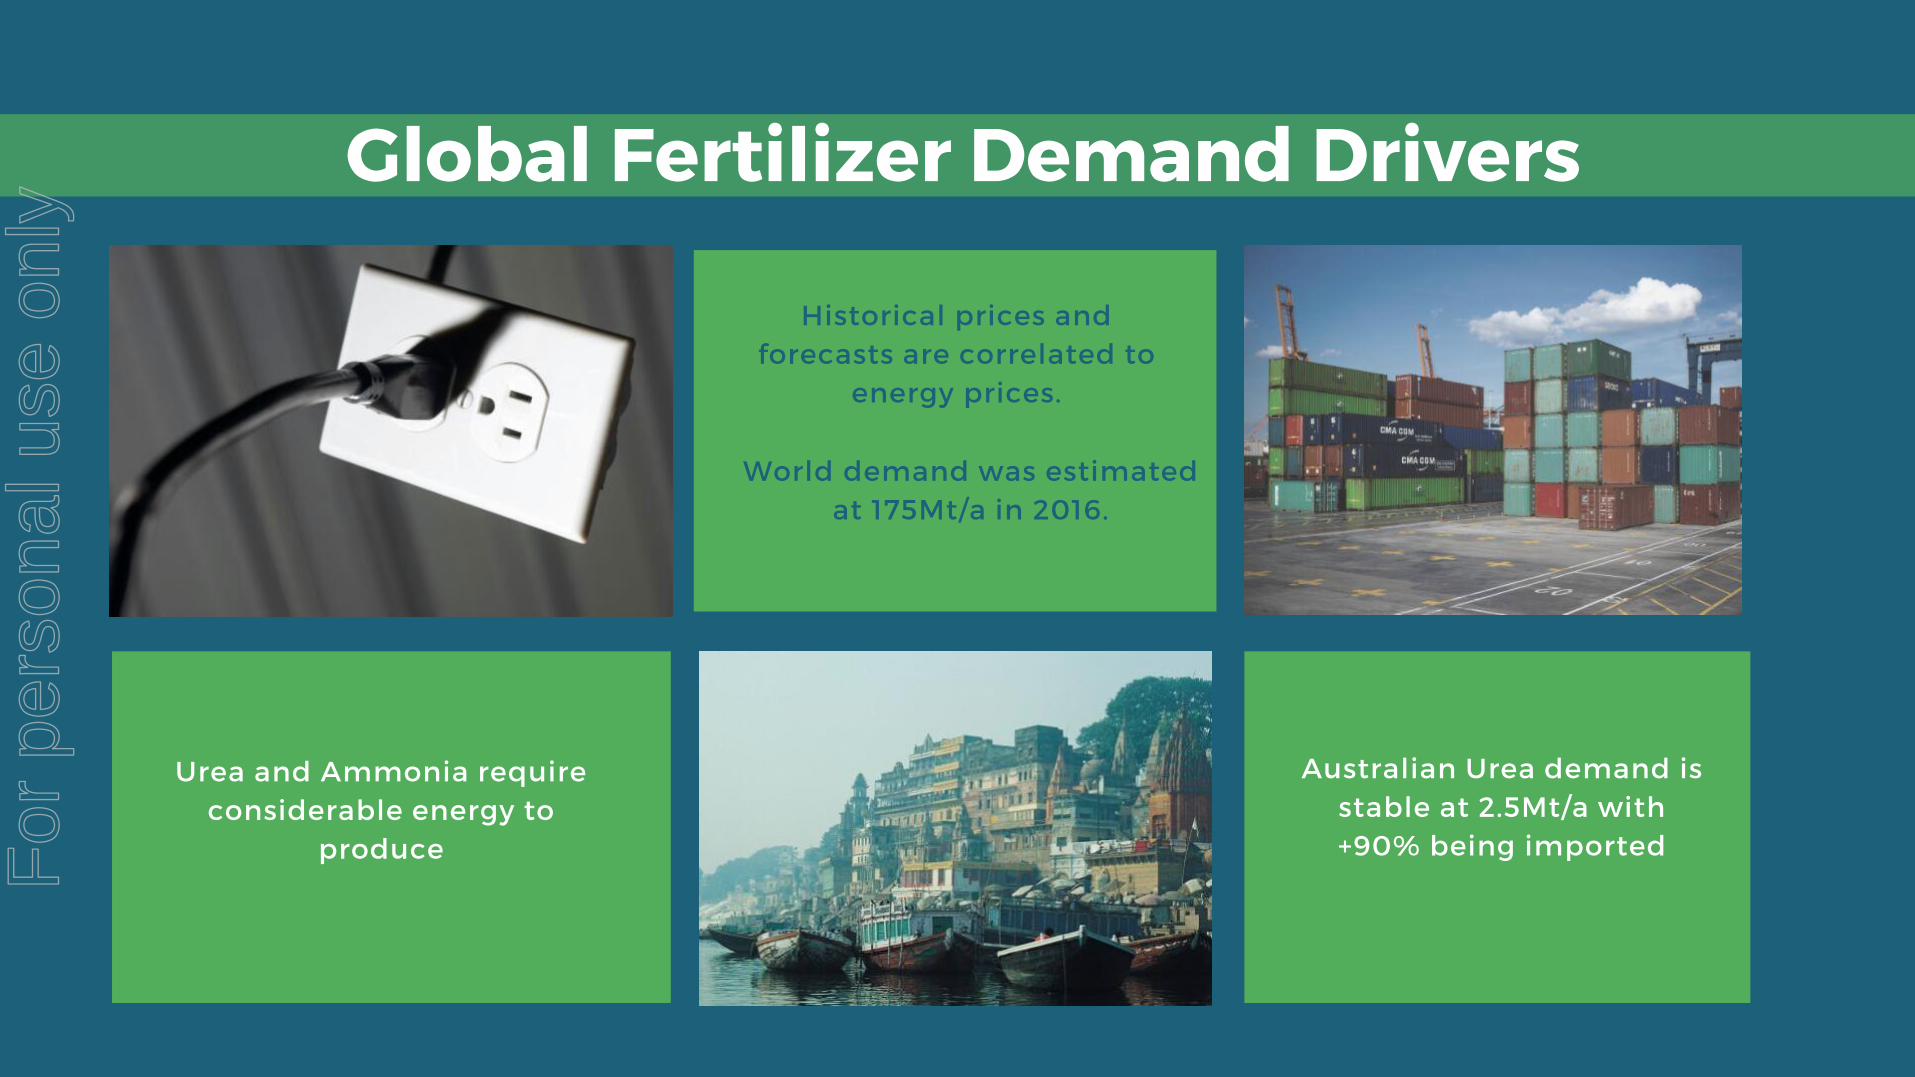
Historical prices and forecasts are correlated to
energy prices.
Urea and Ammonia require considerable energy to
produce
World demand was estimated at 175Mt/a in 2016.
Australian Urea demand is stable at 2.5Mt/a with +90% being imported
Global Fertilizer Demand Drivers
For
per
sona
l use
onl
y

Australia Fertilizer Market
Urea & Ammonia
Australia imports 95% of fertilizer products, especiallyUrea.
Australian fertilizer producer buys methane and convertto syngas
The Middle East remains a major supplier of Urea andAmmonia globally, however shipping these fertilizerstakes ~24 days to reach Australia.
Foreign exchange fluctuations impact the profits ofdomestic suppliers of fertilizer
• Saudi Arabia
• Bangladesh• China
• Kuwait
Main countries of origin for Urea imported to Australia:
• Malaysia
• Qatar• USA
Source: Profercy Urea Outlook to 2030, January 2018 (Copyright 2018 Profercy Ltd)
Middle East: Granular Urea to 2030 (spot, nominal A$)F
or p
erso
nal u
se o
nly

UREA VS NATURAL GAS
LCEP benefits from geographic advantages
• Urea and Ammonia can be produced on site
• No need for expensive methane feedstock
• LCEP is located near a large agricultural
demand centre, South Australia, and can be
delivered anywhere domestically by existing
rail infrastructure
• LCK feedstock price at significant advantageFor
per
sona
l use
onl
y

Ammonia is made by a series of chemical reactions
Urea production requires (consumes) CO2
Excess CO2 can be sequestered in underground chamber
Carbon Budget
Ammonia (2NH3) + CO2 = Urea
For
per
sona
l use
onl
y

UREA60PJ per year
GAS2Mt per year
$2.60B NPV$4.25B NPV
14.3% IRR15.1% IRR
6.9 Year payback6.3 Year payback
30+ year life30+ year life
$2.85B Capex$3.21B Capex
2023+ Start Date2023+ Start DateBased on TK report 2018 Based on Prudentia report 2018
For
per
sona
l use
onl
y

JUSTYN PETERS
Executive Chairman
PHIL STAVELEY
Managing Director
NOEL WHITCHER
Chief Financial Officer
The people behind this
The TeamCRISTIAN BOLDA
General Manager Operations
For
per
sona
l use
onl
y
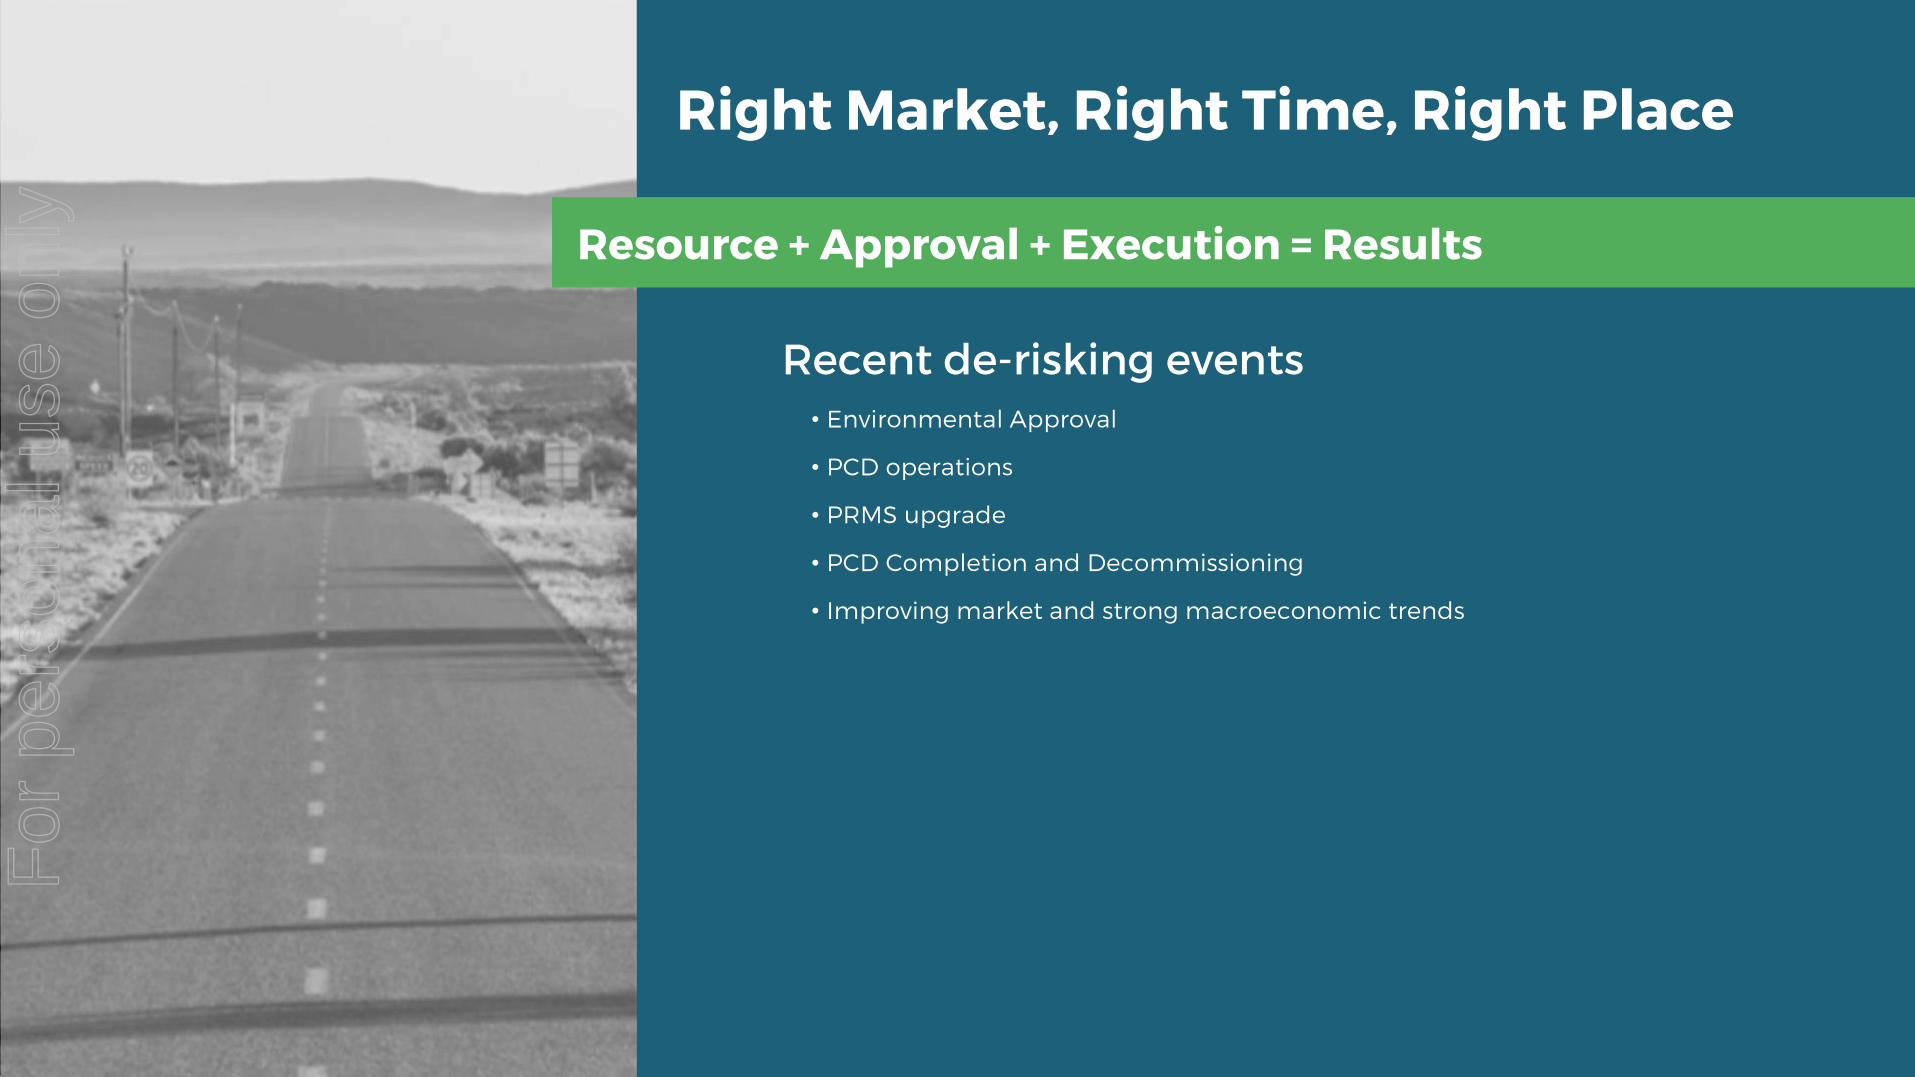
• Environmental Approval
• PCD operations
• PRMS upgrade
• PCD Completion and Decommissioning
• Improving market and strong macroeconomic trends
Right Market, Right Time, Right Place
Recent de-risking events
Resource + Approval + Execution = Results
For
per
sona
l use
onl
y

CONTACT US
LEIGH CREEK ENERGY
Level 11 - 19 Grenfell StreetAdelaide SA 5000 - AustraliaPhone +61 (8) 8132 9100Facsimile +61 (8) 8231 7574
Leigh Creek Energy Limited
For
per
sona
l use
onl
y