may 2021 top 50 north america distributors report 2021
TRANSCRIPT
AN MMG PUBLISHING TITLE
MAY 2021
DISTRIBUTION STABILIZESSUPPLY CHAIN
page 24
SUPPLY CHAIN WINS AND
OPPORTUNITIES page 38
TOP 50 DISTRIBUTOR
SURVEY RESULTSpage 46
MAY 2021
TOP 50NORTH AMERICA
DISTRIBUTORSREPORT 2021

Since becoming a city dweller, my car spends most of its life gathering dust. I tend to cycle, walk, use public transport, then take the car. When I do drive, it’s typically single day, long-distance, freeway journeys.
Based on this usage and depending on which research one chooses, the best thing I can do for the planet is to keep my car. The logic is that the energy required to manufacture a comparable new electric vehicle would be disproportionately high compared with the energy consumed using my existing car.
Naturally, I need to ensure the vehicle remains safe, reliable and efficient. Given the car is approaching eight years old, this places me in obsolescence management mode.
The secret, hardly surprisingly, lies in part numbers. Often concealed under a film of oil or plastic cover and hidden amongst a plethora of other manufacturing data, the part number beats any other search method. A recent hunt for a battery nearly resulted in a Googlewhack: a search returning a single result. Likewise, my search for a replacement camera module located one in Korea.
At the time of writing the part would have been with me. However, I’ve had to accommodate a slight delay due to a rather large ship blocking a somewhat narrow canal.
So, cherish your part numbers. Record them accurately and safely. You never know when in the future they will become the lifesaver you need.
Contents
Cherished part numbers
Editor's Word
Articles appearing in this magazine do not necessarily express the views of the Editor or the publishers. Every effort is made to ensure the accuracy of information published. No legal responsibility will be accepted by the publishers for loss arising from articles / information contained and published. All rights reserved. No part of this publication may be reproduced or stored in a retrieval system or transmitted in any form without the written consent of the publishers.
Issue 104, Vol.12 No.05
Published 12 times per year by MMG Publishing US Ltd
MMG PUBLISHING US LtdNormandale Lake Center8400 Normandale Lake BoulevardSuite 920, Bloomington MN 55437Tel: 866.364.0951Fax: 952.378.2770
@Electrosourcing
Printed in the United States© 2021 MMG Publishing US Ltd
AN MMG PUBLISHING TITLE
MAY 2021
DISTRIBUTION STABILIZESSUPPLY CHAIN
page 24
SUPPLY CHAIN WINS AND
OPPORTUNITIES page 38
TOP 50 DISTRIBUTOR
SURVEY RESULTSpage 46
MAY 2021
TOP 50NORTH AMERICA
DISTRIBUTORSREPORT 2021
210409_11-8_Mill_ELECSRG_NA_Snipe.indd 1 4/8/21 11:15 AM
On the cover – May 2021Top 50 distributors report 2021
ELECTRONICS SOURCINGIS INDEPENDENTLYABC AUDITED2005/2020
EDITORIALManaging Editor: Jon [email protected] Editor: Amy [email protected] Editorial & Production: Thomas [email protected]
ADVERTISINGAdvertisement Manager: Emma Poole [email protected]
DESIGNGraphic Designer: Josh [email protected]
CIRCULATIONCirculation Manager: Vicky Leary [email protected] Account Manager: Liz Poole [email protected]
PUBLISHERMark Leary [email protected] Manager: Denise Pattenden [email protected]
Contact
08Harsh EnvironmentsMore configurable than ever
10Distribution Market Watch 5G will boost business for years
Independent Distributors
04News Demand far outpaces capacity
May 2021 | Top 50 Authorized Distributor Report 2021 edition 03
24
Top 10 Independent Distributors Report 2021
66The Top 50 Authorized Distributors Report 2021North America Top 50
MAY
2021
Ensure your productsare 100% authenticMouser was the first SAE AS6496 accredited distributor
Widest selection of electroniccomponents in stockmouser.com/authentic-products
C
M
Y
CM
MY
CY
CMY
K
ai161368505314_Authentic Products 8.375x2.6.pdf 1 2/18/21 3:50 PM
NORTH AMERICA

Distribution minimizes 2020 losses as it stabilizes supply chain
Supply chain imbalances and extending lead times
Amid pandemic turbulence North American distributors see revenues slide for second straight year but contain decline to -5.9% in volatile supply chain environment
T he electronics component industry and participants up and
down the electronics supply chain were put through an extreme stress test throughout 2020 and continuing into 2021. The typical fluctuations experienced in a cyclical industry with its ebbs and flows were amplified to an extraordinary degree by the COVID-19 pandemic that has reshaped the world, including the electronics industry and supply chain.
Every stage of the supply chain, ranging from raw
material supply to component & system manufacturing, shipping & logistics, and end-market demand experienced convulsions as workforces transitioned to a new operating environment, traditional shipping solutions were literally dead in the water and consumers were focused on adapting to a new world with unanticipated changes to lifestyle, social interactions, family life and work requirements. In the midst of a world in transition, distribution played a vital stabilizing role
in many areas as the ability to forecast and anticipate supply/demand changes required a mix of traditional and innovative solutions in supply chain management. After battling the challenges of 2020, the Top 50 Authorized North America Distributors experienced a decline of 5.9% in North American sales. However, this same group combined to achieve worldwide sales growth of 4.5% as demand in Asia more than compensated for losses in the North America market.
Leading distribution executives have been able to draw on their wealth of experience to provide insightful analysis of the events of the past year and identify key areas of concern, opportunity and needed modifications that will prove valuable in managing the way forward.
The snap back in electronics demand in the 2nd half of 2020 following the severe slump in the economy and electronics markets earlier in the year resulted in the need for a sudden shift in supply chain management. The automotive
industry has captured headlines due to its V-shaped decline/recovery and the failure of automotive companies to manage their electronics component supply chains. While automotive electronics only account for approximately 8% of global semiconductor revenues, the inability to source even low-cost components shut down auto production lines around the world and attracted the attention of top government officials as the ripples from these shutdowns spread through the economy.
However, Don Akery, President, Americas TTI, explains the wider impact of the recovery in electronics demand on the supply chain, “The automotive rebound from lost production during the COVID shutdown in April and May of 2020 started the constraints. But the demand is much wider than just automotive.
“The defense segment continues strong as most programs have been funded. The broadest segment, Industrial, continues
Continue on page 28 >
Top 50 North America Authorized Distributors 2021 Report
Produced by Dale Ford, Chief Analyst at Electronic Components Industry
Association (ECIA)
24 May 2021 | Top 50 Authorized Distributor Report 2021 edition • www.electronics-sourcing.com
Don Akery, President, Americas TTI

Top 50 North America Authorized Distributors 2021
to grow at faster than seasonal rates at mid to high single digit growth. Normal would be 2-3%. EMS companies are seeing some of the strongest growth.”
Tony Roybal, President Avnet Americas, has explained the combination of forces that has
exacerbated the supply/demand imbalance for automotive components, “One of the most significant factors in the issue is that few considered that the demand for automotive chips was already rising prior to the onset of COVID-19, or why that was the case. Demand for electric vehicles (EVs) and other advanced automotive technologies was steadily increasing ahead of the pandemic because of end-consumers’ preferences for vehicles leveraging those technologies. Those consumer preferences did not change. So, when demand for autos picked up again, it was naturally much higher.”
Did the industry learn from prior challenges that it was able to apply to the crises of 2020? Akery explains that, “Some customers adjusted their focus to assurance of supply vs PPV (piece price variance) after the MLCC constraints in 2018. These customers who
adjusted are best positioned to keep production running at full capacity. The customers who reverted to primarily price will have struggles for the next few months.”
Chris Beeson, Group Senior Vice President – Electronics, Allied Electronics/RS Components, emphasizes the issues that have been illuminated and the lessons we should learn from the current crisis. He expresses that, “We should feel fortunate that we are in an area of business that has prevailed and done fairly well. Did it change our workstyle and thinking? Yes. Now there is a strong recognition for potential risk. We all use the word “disruptive.” But have we really gone through the process of dissecting what it means?”
In extrapolating on what is being learned from the automotive supply chain crisis, Roybal points out that, “In industries where the end-user preference is driving the overarching demand—where the pandemic’s impact was purely situational—we will need to prepare for similar V-shaped recoveries, it is always wise to do thorough work to ensure capacity matches true demand. That is where a truly end-to-end supply chain, and the visibility and transparency that provides, will prove beneficial as companies look to navigate what’s ahead.”
Typical guidance from the executives interviewed for this article points to demand outstripping supply through the
end of 2021 and possibly into 2022. Roybal’s outlook provides a summary of common sentiment among industry executives. He states, “The current demand, forecast and backlog trends would say that we will continue to see strength in the market and these segments through 2021. It also appears that the supply side will take until later this calendar year to catch up to demand levels.”
In addressing the expected length of the imbalance in the supply chain David Loftus, ECIA CEO, explained, “The rebound was put on hold for six months. There was a delayed response to the recovery. What we are experiencing is a perfect storm with the rebound of the market and everything roaring back in Q3. There was also a problem with people not seeing the signs of the uptick and waiting until late in the cycle to place orders or even cancelling and pressuring suppliers to take returns. It will take 9 to 12 months to clear the backlog but then should settle into a steady state.”
Regarding efforts to increase supply, Loftus goes on to explain that the actions to add additional supply capacity will be moderated by long-term expectations. He notes that, “The way the cycles run there will never be a time when lead times do not slip out when there is a surge in demand. There is just not enough capacity to handle these inflection points - especially with leading edge technologies. Nobody is going to build for the ramp rate that we see now. They will build for sustained activity on the long term. Semiconductor suppliers will not bring new fabs online just to keep lead times consistent during the current surge.”
Continue on page 30 >
28 May 2021 | Top 50 Authorized Distributor Report 2021 edition • www.electronics-sourcing.com
Tony Roybal, President Avnet Americas
David Loftus, ECIA CEO
Chris Beeson, Group Senior Vice President – Electronics, Allied Electronics/RS Components

Top 50 North America Authorized Distributors 2021 Report
30 May 2021 | Top 50 Authorized Distributor Report 2021 edition • www.electronics-sourcing.com
Reshaping markets in the near and long-termIn discussing the impact of the pandemic, executives point to the way it has reshaped the market in the near-term and will continue to influence it in the long term. Looking at the big picture of market trends, Loftus notes, “It has left world economies struggling a bit. Actually, we are not seeing the full impact yet because of stimulus that has been injected. The stimulus is not sustainable. Maybe the cycle will overshoot, and the downside will be a bit worse due to stimulus working through and wind up at a lower steady state.
I am concerned about the base level of commerce – jobs and the economy may come back to a steady state that is not as robust as it was three years ago.”
In the near-term, Akery highlights exciting growth directions in a wide range of markets including automotive, communications, medical, defense, and even the smaller markets in North America of consumer electronics and computing. He also makes some important observations related to the contrasting
developments in aerospace and space. Regarding aerospace he observes that, “Commercial air has been the segment hit the hardest. While this segment started to decline with the Boeing 737 MAX issues, the pandemic brought production stops to the broader market. Commercial air will take years to fully recover.” On the bright side, looking higher he sees, “Space or the commercialization of space exploration and, soon to be space travel, has driven spending in this segment to record levels. SpaceX and
Blue Origin get the most publicity but there are many others doing amazing things in space. We believe that the spend in this segment will increase in many multiples over the next few years.” Looking at long-term market prospects, Akery summarizes his outlook in one word, “Increase.” He expects that the 2020s will see soaring electronics demand and that the pandemic simply delayed things a little.
That’s Performance with Purpose.
Higher densi t y. Lower losses. Higher data rates.I t ’s precise performance, delivered.
CarlisleIT.com
DESIGN | BUILD | TEST | CERTIFY
Our CoreHC product family, Card Edge Contact systems, and Gen-Z solutions offer high-density interconnects
with lower insertion and return losses at densities as high as 2.5 mm. CarlisleIT leads the way with high-performance
interconnect solutions by offering unmatched signal integrity for today’s faster and more complex communication
systems operating up to 70 GHz.

May 2021 | Top 50 Authorized Distributor Report 2021 edition 31
Positronic believes in the people advancing our world to make it a better place, those who are realizing new discoveries, developing technologies that help humans connect, and expanding commerce to advance economies. That is why Positronic is serious about developing high reliability interconnect solutions – because failure is not an option for critical systems, they must perform.
From deep space discovery to medical breakthroughs, Positronic delivers The Science of Certainty. Learn more at connectpositronic.com
THE SCIENCEOF CERTAINTY®
an Amphenol company
Top 50 North America Authorized Distributors 2021 Report
Shipping, logistics and freight – oh my!With many modes of transportation and shipping shut down, scaled back, or delayed, the flow of electronics products around the world was seriously disrupted. The frightening scene confronting distributors was captured by Jim Ricciardelli, Executive Vice President, Sales & Marketing at Digi-Key, when he described the experience of, “Waking up every morning and looking at how much product is sitting at different ports around the country.” Ricciardelli notes the transition that has taken place in the relationship between distributors and freight providers. In the past these relationships could be taken for granted. Now the engagement with shippers is moving
closer to the sales team. He notes that, “Like any other relationship you learn who you can rely on in difficult times. You learn who can handle these peaks. It is a big deal that the planes arrive every day.”
Chris Beeson points to the opportunity created by the pandemic to look for more collaboration/partnerships in the development of solutions. He notes that the types of questions that are being asked now are, “How do you get there? How many companies can do it all? How do you reduce risks through diversification?” Elaborating on successfully managing supply solutions during the pandemic, Tony Roybal shares
that, “One way that we have seen companies navigate this challenge is by leveraging globalized, regional resources. Instead of a singular hub for production and distribution, there has been a growing emphasis on globalizing supply chains where possible to help ensure assurance of supply.”
In addressing the sustainability of these changes Roybal states, “Companies respond to periods of crisis or disruption in a multitude of ways. Some are quick-fixes or band aids like chartering a private jet to fly product overnight to avert a line-down situation. Then there are no-regret moves like adjusting processes that couldn’t
withstand disruption. In between you have a plethora of tweaks, upgrades, revamps, and all-out transformations. The degree to which any of these changes sustain is wholly dependent on the risk-reward and cost-benefit analysis of each.” He goes on to note that, “Necessity is indeed the mother of invention and we will most certainly see that the moves made to streamline processes, improve labeling and packaging to minimize customs delays, sharing trucking/warehouse capacity to reduce cost and other moves will likely make their way into many standard logistics providers’ toolboxes.”
Continue on page 34 >
Jim Ricciardelli, Executive Vice President, Sales & Marketing at Digi-Key

Top 50 North America Authorized Distributors 2021 Report
The quickly evolving nature and spread of COVID-19 required all companies to make significant changes to their accommodations and
support of their employees. Don Wagner, CEO of Bisco Industries, recalls that, “In a two-week period we completely revamped our
operations to enable all of our employees to work in home/remote locations. Eventually we transitioned to a 3 & 3 schedule and 50/50
work remote vs. in the office.” Bisco also transitioned to play a key role in providing personal protective equipment (PPE) during the crisis. They stepped in to leverage their local presence to deliver facemasks and sanitizers that were critical in battling the pandemic.
Wagner also explains how the pandemic resulted in significant modification in how they interact with and support customers. Like all companies they moved from travel to client locations to employing Zoom with their sales and support teams. Bisco now has aggressive goals for how they will leverage Zoom even though Wagner expects a moderate return to travel in the future. There have been benefits of the changes that were implemented. He discusses how, “Bisco has been a North American company for 46 years. We started an office in the Philippines six months ago but had to pull back. We returned to pursuing the Asian market again in July. In the past, Zoom calls were not the norm in Asia. However, with the support of interpreters, we are able to pursue the Asian market. We probably do 5 to 7 percent of our overall business in Asia. But it is all done from the U.S.”
Distribution executives noted that in many cases the response to the pandemic gave a boost to earlier efforts. For example, Don Akery shares, “We were moving toward a more virtual interface before COVID, but the pandemic pushed us there much quicker. This is probably the most helpful change that has occurred, and it will definitely continue. It is significantly more cost effective. I have also found the virtual meetings to be more effective as people seem to be better prepared.” Reinforcing Don’s statement, Ernie Schilling, Powell Electronics CEO, comments that, “All of the teams have been much more effective at collaborating and solving problems from afar. The technology has existed for quite some
Continue on page 38 >
34 May 2021 | Top 50 Authorized Distributor Report 2021 edition • www.electronics-sourcing.com
Transformations in workplaces and workforce support

Top 50 North America Authorized Distributors 2021 Report
time, but the universal adoption was the missing component.”
Of course, in all of this the human element must be considered and how companies support their teams has moved to the front of executive and manager responsibilities and priorities. Jim Ricciardelli observes that, “Work from home is a huge shift. It is now a way of life. Making sure people have the right tools including communication tools is critical. This new environment requires that
companies place confidence in their employees.” Ricciardelli also highlights how companies must change their recruiting processes. He notes benefits in recruiting, “We have to look for people who are motivated and can work from home. We take the added perspective of opening our minds to people who can be productive at home but flexible for those who want to work in office. It also widens the recruiting pool. We can recruit anywhere in the world. It is a wonderful thing for the industry.” Chris Beeson adds, “We must now modify
the onboarding process for employees working from home. We also must explore how new employees learn things such as company culture, processes, expectations, etc. All of this means that a mindset of wellness—psychological and sociological—kick in.
Digital technology – Supply Chain wins and opportunitiesWhile electronics component suppliers play a central role in technologies enabling the adoption of enhanced digital technologies, the industry itself has lagged in the adoption of digital technology in its own operations beyond sales. Don Akery summarizes the benefits that have been derived from the adoption
of digital technology so far, “Internet websites have become critical in the electronics B2B supply chain. The growth of Digi-Key and Mouser to multiple billion-dollar businesses is evidence of the value. A distributor’s or a supplier’s website must provide so much more than just the opportunity to buy electronic components.
Content is king. From the actual business transaction, computer to computer sharing of information with our customer and supplier partners via EDI and API technologies are probably the most advanced but still need to go further.”
Tony Roybal looks at expected adoption of digital
technology and opportunities to move forward, “Intelligent automation technologies are seeing a particular rise in investment - IDC predicts that by 2023, 65% of warehousing activities will use robots and situational data analytics to optimize storage, increase capacity and reduce the amount of time it takes to process
Ernie Schilling, Powell Electronics CEO
AGM2222 SeriesHigh-efficiency Power Inductors
• Current ratings up to 110 Amps with very low DCR • 75% smaller than previous generation for greater power density• Ideal for Bi-directional 12 – 48 V DC-DC converters• Qualified to AEC-Q200 Grade 1 (−40°C to +125°C)
Free Samples @ coilcraft.com

orders by as much as 50%. In the components supply chain in particular, Tier 1 and Tier 2 players in the component industry have been fast followers in digitization and the strides made by B2B players in the industry over the past five years have been monumental. Still, digitizing the collection and assessment of data from even the smallest, most localized players would be a monumental step towards greater supply chain responsiveness and resilience.”
Continuing Roybal states, “Still, much of the early implementation of these digital technologies has been driven by a desire to increase efficiency and reduce operational costs. While many companies
have successfully achieved these outcomes, this is low-hanging fruit. Once companies have further institutionalized digital technologies, they will be able to focus more on customer-driven business imperatives. This is where we will begin to fully realize the long-term benefits. Data quality, long-term commitment and open-dialogue change management will be the key to this.”
Multiple executives mentioned the exciting opportunities that will be facilitated by advances in other areas such as machine learning/artificial intelligence (AI), sensors, and blockchain.
May 2021 | Top 50 Authorized Distributor Report 2021 edition 39
The value of distribution highlightedO ne major outcome
of the impact of the pandemic on the
electronics component supply chain is the elevation of the value of distribution. ECIA’s David Loftus has taken a prominent role in delivering this message with a major statement and letter to the editor in the Wall Street Journal about the critical value of distribution and how it is a solution to the crisis that many companies, especially automotive companies, are experiencing.
By enabling visibility and transparency, distributors deliver critical value to both component suppliers and equipment manufacturers. Roybal emphasizes that, “It is much more difficult for [customers] to have the end-to-end visibility needed to sense, triangulate across the supply chain and respond to shifting market demand in this situation.
Continue on page 42 >
Top 50 North America Authorized Distributors 2021 Report
AGM2222 SeriesHigh-efficiency Power Inductors
• Current ratings up to 110 Amps with very low DCR • 75% smaller than previous generation for greater power density• Ideal for Bi-directional 12 – 48 V DC-DC converters• Qualified to AEC-Q200 Grade 1 (−40°C to +125°C)
Free Samples @ coilcraft.com
Top 50 North America Authorized Distributors 2021 Report
Authorized distributors have that, whereas suppliers and customers often have a more limited view. As noted in the ECIA statement, distributors are logistics experts that can manage inventory based on both supply and demand to ensure appropriate volumes.”
In addition, Roybal notes that, “Technology’s rate of change is rapid. As we learned these last two years, so too can be the outside influences on technology supply. This has underscored the importance of visibility and transparency in the supply chain, therefore increasing the benefits
of working with an authorized distributor. New, more technology-naive entrants are starting to succeed in the field by leveraging distribution for not just sourcing, but design and operations support as well. This is enabling those emerging brands to be much nimbler and more competitive, especially in this environment.”
Ernie Schilling of Powell Electronics is a strong advocate for the value of distribution. He explains that “Distribution lives at the front and back of the manufacturing curve. Distribution smooths demand cycles for both the vendors and the
customer. They empower ramp up and end of life and fill shortage gaps.” Schilling summarizes the vital role distributors play in the specifying process by offering the following resources to an OEM:
1. Offer technical insight because they are familiar with the broad range of product specifications available in today’s market.
2. Provide customization services of standard products that enable the specifier to take advantage of lower base product costs.
3. Guarantee integration and compatibility of discrete components in the finished product.
4. Help select products that are compatible with the specifier’s production system, ensuring that the most efficient method is always given primary consideration.
5. Supply valuable industry survey services that enable a specifier to cut product “search” time to a minimum.
42 May 2021 | Top 50 Authorized Distributor Report 2021 edition • www.electronics-sourcing.com
Securing the supply chain becomes a top priorityGlobal trade, tariffs, supply chain resiliency and security have been topics of intense discussion over the past few years with attention and focus being generated at the highest levels of business and government. This has included proposed legislation and executive orders for supply chain assessments. While participants in the supply chain are already taking proactive steps to improve the strength and security of supply chains, many powerful forces are advocating for a more assertive role from the government.
Highlighting the steps industry players are also taking, Roybal states, “Companies are making
location decisions based on a broader range of factors beyond labor cost. This trend is reflective of growing awareness of the total cost of sourcing in various regions, a desire for more local production to increase responsiveness and a greater sensitivity to the economic, ethical and climate-related risks intertwined with sourcing.” The areas of increased emphasis Roybal mentions are encapsulated in the new buzzword that started gaining traction in business in 2019 – ESG. This is an abbreviation for Environmental Social Governance (ESG) and the term became mainstream in 2020. Company strategy and investment
decisions are increasingly influenced by these priorities.
Ernie Schilling points to beneficial actions he believes the government could take. “Utilizing nothing more than government’s purchasing power and ‘Buy American” model we can and must preserve domestic capabilities. Whether it is infrastructure, military, medical or energy, government inspired programs must have a parallel goal of strengthening our self-reliant manufacturing capabilities. We must include production programs in reciprocal treaties with our most trusted democratic partner nations.”
On the other hand, Ricciardelli points out that, “We will not control the government. So, we need to be ready to adjust and adapt.” He points to the creation of large “free trade” zones in the US as a recognition of the benefits of free trade and the need to adapt to government interventions such as tariffs.
Chris Beeson makes an important point when he states that, “A topic like government intervention must be embedded into strategic planning. Companies have to plan for the ‘what ifs.’ There needs to be consideration for risks. A distributor represents a lot of suppliers, so they are subjected to the outcome of a wide range of government policies.” Beeson mentions a potential senior position in companies, “Do you have a “Chief Worry Officer” or Chief Risk Officer?”
Continue on page 46 >

46 May 2021 | Top 50 Authorized Distributor Report 2021 edition • www.electronics-sourcing.com
Top 50 North America Authorized Distributors 2021 Report
Industry growth drivers – Beyond technologyThere are many powerful forces that drive growth in the electronics and electronics component industries beyond technology and innovation. Economic, social, political, environmental, and wider business forces all play a role in shaping the future of the industry. Recognizing the growing emphasis on the principals of ESG, Tony Roybal states, “We tend to think of innovation in terms of technological progress, but innovation is also about creating opportunity out of disruption. After the past year’s events—a global pandemic, the consequences of climate change and the urgent need for more diversity and inclusion in business and society—we must deploy new approaches to enable everyone to access
the opportunity for a better quality of life. Meeting some of these standards will empower new consumers with more spending capacity, significantly improving the gross domestic product and enabling new opportunities for growth. As a result, our actions as socially responsible global citizens promoting equity, diversity and inclusion can translate into real economic value.”
Industry Growth Drivers – Back to TechnologyHowever… The importance of technology in driving growth opportunities cannot be overlooked. In the recent survey to identify the Top 50 North America Authorized Distributors survey participants were asked to rate the technologies
that will have the greatest impact on growth in 2021. The results of their inputs are shown below. Not
surprisingly, electric vehicles, 5G and IoT emerge at the top followed by “green” and energy efficient technologies.
B efore presenting the results for 2020 it is important
to highlight three key changes made this year compared to research published in surveys from prior years.
1. Only “Authorized Distributors” are included in the research and rankings. This is consistent with ECIA’s mission to support the Authorized Channel. As a result, brokers and others are no longer included and they have been replaced by 13 authorized distributors that are new to the Top 50 rankings.
2. The revenues for Arrow Electronics
have been restated to include only their revenues associated with electronic component distribution. For Arrow Electronics this corresponds to their “Electronic Components” division.
3. In some cases, companies have not provided inputs in all areas of the survey. Where companies did not provide inputs for worldwide or Americas total revenues, estimates have been developed based on inputs from various sources including D&B. Where splits for revenues by component category or end market were not
provided, estimates were developed based on various inputs and models.
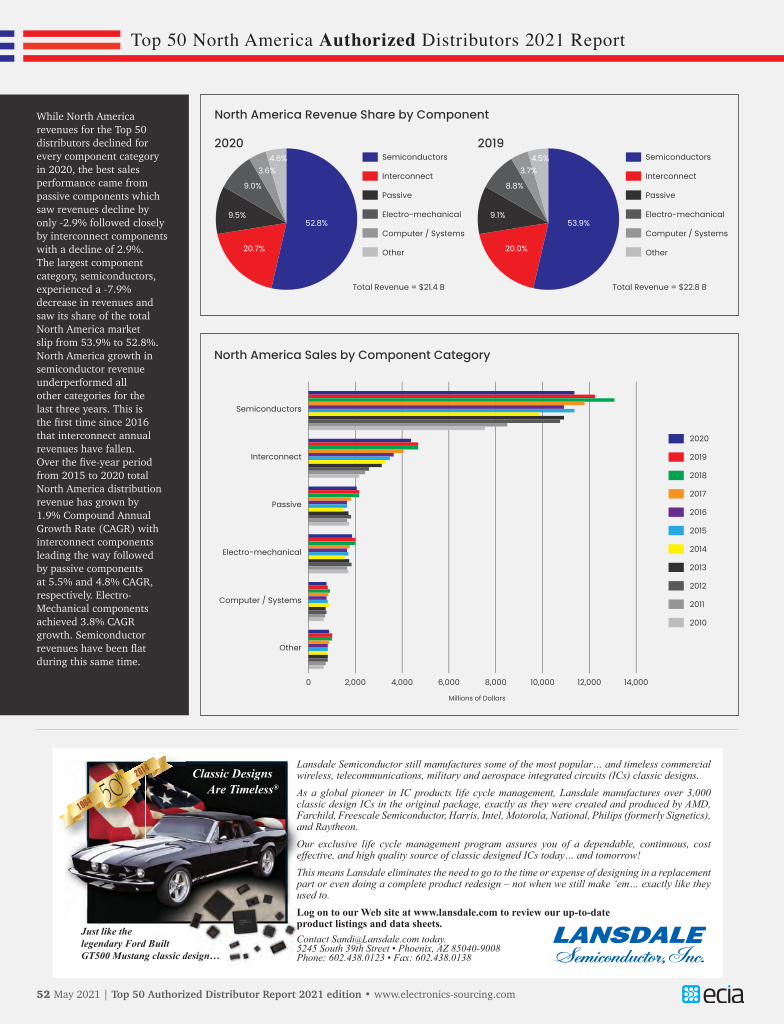
Total North America revenue for the Top 50 authorized distributors in 2020 fell by 5.9% to $21.4 B from $22.8 B. This same group of Top 50 companies grew their combined worldwide revenue from $75.3 B to $78.6 B between 2019 and 2020. With sales growth in Asia boosting overall global sales, the share of worldwide revenue accounted for by sales to Asia expanded from 47.2% of the total to 52.4% between 2019 and 2020. The share from North America sales slipped by 3% from 30.3% to 27.3.
The Top 50 North America Authorized Distributor Survey Results

May 2021 | Top 50 Authorized Distributor Report 2021 edition 47
Top 50 North America Authorized Distributors 2021 Report
Top 50 North America Authorized Distributors 2021 Report
While North America revenues for the Top 50 distributors declined for every component category in 2020, the best sales performance came from passive components which saw revenues decline by only -2.9% followed closely by interconnect components with a decline of 2.9%. The largest component category, semiconductors, experienced a -7.9% decrease in revenues and saw its share of the total North America market slip from 53.9% to 52.8%. North America growth in semiconductor revenue underperformed all other categories for the last three years. This is the first time since 2016 that interconnect annual revenues have fallen. Over the five-year period from 2015 to 2020 total North America distribution revenue has grown by 1.9% Compound Annual Growth Rate (CAGR) with interconnect components leading the way followed by passive components at 5.5% and 4.8% CAGR, respectively. Electro-Mechanical components achieved 3.8% CAGR growth. Semiconductor revenues have been flat during this same time.
52 May 2021 | Top 50 Authorized Distributor Report 2021 edition • www.electronics-sourcing.com
Classic Designs Are Timeless®
Just like thelegendary Ford BuiltGT500 Mustang classic design…
Lansdale Semiconductor still manufactures some of the most popular… and timeless commercial wireless, telecommunications, military and aerospace integrated circuits (ICs) classic designs.As a global pioneer in IC products life cycle management, Lansdale manufactures over 3,000 classic design ICs in the original package, exactly as they were created and produced by AMD, Farchild, Freescale Semiconductor, Harris, Intel, Motorola, National, Philips (formerly Signetics), and Raytheon.Our exclusive life cycle management program assures you of a dependable, continuous, cost effective, and high quality source of classic designed ICs today… and tomorrow!This means Lansdale eliminates the need to go to the time or expense of designing in a replacement part or even doing a complete product redesign – not when we still make ‘em… exactly like they used to.Log on to our Web site at www.lansdale.com to review our up-to-dateproduct listings and data sheets.Contact [email protected] today.5245 South 39th Street • Phoenix, AZ 85040-9008Phone: 602.438.0123 • Fax: 602.438.0138

May 2021 | Top 50 Authorized Distributor Report 2021 edition 53
The top two North America Distributors, Arrow Electronics and Avnet, both saw a significant decline in their North America revenues in 2020. Arrow Electronics saw the steepest decline at -13.7% with Avnet’s decline less than half that on a percentage basis at -6.2%. However, on the global stage their fortunes reversed. Arrow Electronics
actually grew their revenue by 1.2% and Avnet limited its decline to -3.7%. Among the Top 50 distributors it was good to be relatively small in 2020. The Top 10 companies with revenues of nearly $20 B and a combined revenue share of 88.5% saw their revenues fall by -7.2%. By contrast, companies ranked between 11 and 50 with combined
revenues of less than $2.5 B and combined market share of 11.5% saw their revenues grow by 4.9%. Average 2020 revenue for the Top 10 companies in 2020 was $1.9 B while average revenue for companies ranked 11 through 50 was $61 M.
Continue to page 56 for Arrow & Avnet
Component Revenues >
Top 50 North America Authorized Distributors 2021 Report
“”Among the Top 50 distributors it was good to be relatively small
in 2020

Top 50 North America Authorized Distributors 2021 Report
56 May 2021 | Top 50 Authorized Distributor Report 2021 edition • www.electronics-sourcing.com
“”Arrow Electronics and Avnet, both saw a
significant decline in their North America
revenues in 2020
The largest end-market segments for North America distributors in 2020 were industrial automation, aerospace/military, and automotive accounting for 29.5%, 15.7%, and 10.7% of the market, respectively. However, the market is
fairly diversified with even the smallest segment, building & home control/security driving $736 M in revenues in 2020. OEMs continued to be the largest customers of distributors with 59% of total North America revenue.

Looking toward 2020, distributors saw “New Products” representing their best opportunities for growth with 91% expecting this area to be the most significant driver of growth. 71% of distributors saw “Value-Added Services” and “New Markets” as growth drivers. Acquisition activity represented only modest expectations for growth with 17% identifying this as an opportunity. 26 of the Top 50 companies offer design services while 37 support online sales.
May 2021 | Top 50 Authorized Distributor Report 2021 edition 57
Top 50 North America Authorized Distributors 2021 Report

58 May 2021 | Top 50 Authorized Distributor Report 2021 edition • www.electronics-sourcing.com
* ECIA Estimate
Top 50 North America Authorized Distributors 2021 Report
1 Arrow Electronics, Inc. (1) 4,699.2 41.55 2 Avnet (1) 3,541.7 31.31 3 Future Electronics (1) 1,400.0 12.38 4 Digi-Key 578.4 5.11 5 Mouser Electronics 424.2 3.75 6 Master Electronics (1) 208.1 1.84 7 WPG Americas Inc. 150.0 1.33 8 RFMW 56.0 0.50 9 Symmetry Electronics 53.9 0.48 10 Richardson Electronics (1) 45.4 0.40
1 Allied Electronics/RS Components 209.2 10.86 2 Digi-Key 187.0 9.70 3 Avnet (1) 158.4 8.22 4 Arrow Electronics, Inc. (1) 147.2 7.64 5 DAC / Heilind 126.2 6.55 6 Mouser Electronics 103.7 5.38 7 Future Electronics (1) 102.0 5.29 8 Bisco Industries Inc. 87.5 4.54 9 TTI 80.2 4.16 10 Flame Enterprises 74.8 3.88
1 Area51 Electronics 51.2 46.6 30.8 2 Flip Electronics 42.0 21.3 15.0 3 Bluff City Electronics 41.9 22.7 16.0 4 WPG Americas Inc. 33.3 200.0 150.0 5 BJG Electronics, Inc. 27.7 123.6 96.8 6 Brevan Electronics 16.7 32.1 27.5 7 RFMW 15.5 112.0 97.0 8 NASCO Aerospace & Electronics 13.6 25.0 22.0 9 CDM Electronics (1) 13.3 34.0 30.0 10 Master Electronics (1) 11.3 285.0 256.0
1 Falcon Electronics 38.5 18 2.14 2 WPG Americas Inc. 200.0 110 1.82 3 RFMW 112.0 65 1.72 4 Sherburn 16.9 12 1.41 5 Flame Enterprises 77.3 56 1.38 6 Edge Electronics (1) 46.2 35 1.32 7 Arrow Electronics, Inc. (1) 6,183.1 5,055 1.22 8 Avnet 4,660.1 3,869 1.20 9 DAC / Heilind (1) 796.0 735 1.08 10 Brevan Electronics 32.1 32 1.00
1 Arrow Electronics, Inc. (1) 494.6 64.31 2 Avnet (1) 116.5 15.15 3 Allied Electronics/RS Components 55.0 7.15 4 Digi-Key 54.3 7.07 5 WPG Americas Inc. 20.0 2.60 6 Master Electronics (1) 14.3 1.85 7 Steven Engineering 5.3 0.68 8 Bisco Industries Inc. 2.2 0.28 9 Sherburn 1.7 0.22 10 Brevan Electronics 1.6 0.21
1 TTI 701.2 34.60 2 Digi-Key 337.1 16.63 3 Avnet (1) 237.7 11.73 4 Arrow Electronics, Inc. (1) 207.8 10.25 5 Mouser Electronics 160.2 7.91 6 Future Electronics (1) 144.0 7.10 7 RFMW 44.8 2.21 8 Bisco Industries Inc. 43.8 2.16 9 Hughes Peters 27.0 1.33 10 Kensington Electronics 17.4 0.86
1 DAC / Heilind 669.8 15.13 2 TTI 668.6 15.10 3 Avnet (1) 535.9 12.10 4 Arrow Electronics, Inc. (1) 510.7 11.53 5 Digi-Key 408.9 9.24 6 Future Electronics 354.0 7.99 7 Mouser Electronics 207.4 4.68 8 Powell Electronics 181.9 4.11 9 PEI-Genesis (1) 180.0 4.07 10 Allied Electronics/RS Components 140.1 3.16
Company
Company
Company
CompanyCompany
Company
Company
2020 North America ($ Millions)
2020 North America ($ Millions)
2020 North America
Sales($ Millions)
North America
Employees
Sales Growth
2020/2019 (Percentage)
2020 North America
Sales($ Millions)
2020 North America ($ Millions)
2020 North America ($ Millions)
2020 North America ($ Millions)
Share ofTop 50
Total Sales(Percent)
Share ofTop 50
Total Sales(Percent)
2019 North America
Sales($ Millions)
Sales per Employee($ Millions)
Share ofTop 50
Total Sales(Percent)
Share ofTop 50
Total Sales(Percent)
Share ofTop 50
Total Sales(Percent)
Rank
202
0Ra
nk 2
020
Rank
202
0
Rank
202
0
Rank
202
0
Rank
202
0Ra
nk 2
020
Top 10 Semiconductor (Active) Sales
Top 10 Electro-Mechanical Sales
Top 10 Distributors By Sales Growth
Top 10 Computer/System Product Sales
Top 10 Passive Component Sales
Top 10 Interconnect Sales
Top 10 Sales per Employee
The final tables of this report present the complete list of Top 50 North America Authorized Distributors for 2020 along with Top 10 rankings for individual component categories, top sales growth, and top revenue per employee.

May 2021 | Top 50 Authorized Distributor Report 2021 edition 59
Top 50 North America Authorized Distributors 2021 Report
The Top 50 North America Authorized Distributors
* Type of Distributor: 1 = Broadline; 2 = Specialized; 3 = High Service/E-Catalog • (1) ECIA Estimate for Total North America Sales and Sales Breakdown • (2) ECIA Estimate for Sales Breakdown • (3) ECIA Estimate for Total North America Sales
1 1 Arrow Electronics, Inc. (2) 6,183.1 -13.7 28.84 30.2 1 76.0 3.4 2.4 8.3 8.0 2.0 5,055 1.22 2 2 Avnet (Includes Farnell) (2) 4,660.1 -6.2 21.74 26.1 1 76.0 5.1 3.4 11.5 2.5 1.5 3,869 1.20 3 3 Future Electronics (1) 2,000.0 -5.9 9.33 39.2 1 70.0 7.2 5.1 17.7 - - 2,725 0.73 4 4 Digi-Key 1,700.1 -3.7 7.93 59.2 3 34.0 19.8 11.0 24.1 3.2 7.9 3,760 0.45 5 5 TTI 1,450.0 0.0 6.76 50.1 2 - 48.4 5.5 46.1 - - 1,906 0.76 6 6 Mouser Electronics 942.6 7.2 4.40 46.4 3 45.0 17.0 11.0 22.0 - 5.0 1,850 0.51 7 7 DAC / Heilind 796.0 -4.4 3.71 82.7 2 - - 15.9 84.2 - - 735 1.08 8 8 Allied Electronics/RS Components 634.0 -5.9 2.96 26.5 1 0.7 0.8 33.0 22.1 8.7 34.7 800 0.79 9 9 Sager 313.0 -2.2 1.46 100.0 2 - - 14.0 22.0 - 64.0 377 0.83 10 10 Master Electronics (1) 285.0 11.3 1.33 83.3 1 73.0 4.0 6.0 9.0 5.0 3.0 425 0.67 11 11 Bisco Industries, Inc. 218.8 -0.8 12.00 97.5 1 1.0 20.0 40.0 20.0 1.0 18.0 510 0.43 12 14 WPG Americas Inc.WPG Americas Inc. 200.0 33.3 0.93 1.0 2 75.0 3.0 2.0 5.0 10.0 5.0 110 1.82 13 12 Powell Electronics 190.0 6.7 0.89 93.1 1 - - 4.3 95.7 - - 204 0.93 14 13 PEI-Genesis (3) 180.0 5.9 0.84 61.9 1 - - - 100.0 - - 330 0.55 15 15 Electro Enterprises 146.8 0.4 0.68 87.2 1 - - 30.0 70.0 - - 290 0.51 16 19 BJG Electronics, Inc. 123.6 27.7 0.58 95.7 2 - - 10.8 81.5 - 7.7 360 0.34 17 18 RFMW 112.0 15.5 0.52 57.7 2 50.0 40.0 10.0 - - - 65 1.72 18 16 Carlton-Bates 100.0 -7.4 0.47 100.0 1 - - 70.0 15.0 - 15.0 211 0.47 19 17 Hughes Peters 90.0 -10.9 0.42 100.0 1 3.0 30.0 40.0 25.0 - 2.0 160 0.56 20 20 Flame Enterprises 77.3 -13.1 0.36 84.8 2 - - 96.8 3.2 - - 56 1.38 21 21 Steven Engineering 75.1 -3.6 0.35 90.8 2 - - 35.0 35.0 7.0 23.0 113 0.66 22 22 Peerless Electronics (1) 71.5 -5.0 0.33 100.0 1 4.0 4.0 75.0 8.0 - 9.0 105 0.68 23 23 NEP Electronics (1) 65.8 -3.0 0.31 100.0 1 10.0 10.0 60.0 10.0 - 10.0 125 0.53 24 24 Marsh Electronics, Inc. 58.5 -5.3 0.27 100.0 1 - 11.0 26.0 5.0 - 58.0 118 0.50 25 25 Richardson Electronics (2) 58.2 4.1 0.27 23.9 2 78.0 17.0 5.0 - - - 191 0.30 26 26 Symmetry Electronics 55.0 10.0 0.26 85.9 2 98.0 - - - 2 - 70 0.79 27 32 Area51 Electronics 46.6 51.2 0.22 96.6 1 22.9 28.0 21.4 15.2 2.7 9.8 61 0.76 28 28 Edge Electronics (1) 46.2 10.0 0.22 100.0 1 70.0 10.0 10.0 5.0 - 5.0 35 1.32 29 27 SMD, Inc. 38.8 -8.7 0.18 97.0 2 5.2 12.9 15.5 66.5 - - 52 0.75 30 31 Falcon Electronics 38.5 7.4 0.18 96.8 2 99.9 - 0.1 - - - 18 2.14 31 29 Agility EMS (Gopher Electronics) (1) 36.5 -5.8 0.17 100.0 2 - - 100.0 - - - 45 0.81 32 30 Fuses Unlimited (1) 34.8 -5.3 0.16 100.0 2 5.0 5.0 90.0 - - - 56 0.62 33 34 CDM Electronics (1) 34.0 13.3 0.16 100.0 1 - - 6.0 94.0 - - 120 0.28 34 35 Brevan Electronics 32.1 16.7 0.15 100.0 1 20.0 30.0 25.0 15.0 5.0 5.0 32 1.00 35 33 Beyond Components (1) 29.1 -4.5 0.14 100.0 2 4.0 4.0 75.0 7.0 - 10.0 70 0.42 36 39 Diverse Electronics 26.3 6.9 0.12 87.1 1 20.0 28.0 13.0 25.0 - 14.0 45 0.58 37 37 Powertech Controls (1) 25.2 -2.1 0.12 100.0 2 15.0 - 70.0 - - 15.0 47 0.54 38 41 NASCO Aerospace & Electronics 25.0 13.6 0.12 100.0 1 15.0 5.0 35.0 40.0 5.0 - 30 0.83 39 36 PCX (1) 25.0 -5.4 0.12 98.8 2 - - 81 15.0 - 4.0 40 0.62 40 38 Masline Electronics (1) 24.7 -3.6 0.12 100.0 1 5.0 10.0 65.0 10.0 - 10.0 37 0.67 41 47 Bluff City Electronics 22.7 41.9 0.11 100.0 1 10.0 10.0 70.0 5.0 - 5.0 35 0.65 42 40 Cumberland Electronics (1) 22.1 -4.1 0.10 100.0 2 - - 75 - - 25.0 52 0.42 43 49 Flip Electronics 21.3 42.0 0.10 60.9 2 100.0 - - - - - 30 0.71 44 44 Microwave Components, LLC 19.5 8.9 0.09 98.0 2 - 10.0 10.0 80.0 - - 25 0.78 45 42 Kensington Electronics 19.0 -6.2 0.09 94.8 2 - - - 92.0 - 8.0 26 0.73 46 43 PUI (Projections Unlimited, Inc.) 18.8 -4.7 0.09 100.0 2 13.0 22.0 54.0 11.0 - - 31 0.61 47 45 Benchmark Connector Corporation 18.0 5.9 0.08 94.7 2 - - 100.0 - - - 45 0.40 48 48 Sherburn 16.9 6.5 0.08 100.0 2 10.0 15.0 25.0 40.0 10.0 - 12 1.41 49 46 March Electronics (1) 15.8 -3.3 0.07 88.7 2 - 3.0 7.0 90.0 - - 39 0.40 50 50 East Coast Microwave (1) 14.8 9.6 0.07 98.7 2 3.0 - 75.0 5.0 - 17.0 21 0.70 TOTAL TOP 50 21,438 -5.9 100.00 27.2 52.8 9.5 9 20.7 3.6 4.6 25,524 0.84
Rank
202
0
Rank
201
9
Type
*
Company
Sales Breakdown by Percent
2020
Nor
th
Amer
ica
($ M
illio
ns)
Gro
wth
20
20/2
019
(%)
Shar
e of
To
p 50
Tot
al
Sale
s (%
)
Tota
l Em
ploy
ees
Sale
s pe
r Em
ploy
ee
($ M
illio
ns)
Nort
h Am
eric
a Sa
les
Shar
e of
W
orld
wid
e (%
)
Activ
e
Pass
ive
Elec
tro
Inte
rcon
nect
Com
pute
r Pr
oduc
ts
Oth
er