may 25, 2017 sumitomo life insurance … classified as net assets in the statutory financial report,...
TRANSCRIPT

1
May 25, 2017 SUMITOMO LIFE INSURANCE COMPANY
Disclosure of European Embedded Value (summary) as of March 31, 2017
This is the summarized translation of the European Embedded Value (“EEV”) of Sumitomo Life Insurance Company (hereinafter “Sumitomo Life”), Medicare Life Insurance Co. (hereinafter “Medicare Life”) and Symetra Financial Corporation (hereinafter “Symetra”) (collectively, the “Group”) as of March 31, 2017. We calculate EV based on European Embedded Value Principles. In the calculation of EEV,
the Group has mainly adopted a market-consistent approach. More specifically, the EEV for Sumitomo Life and Medicare Life are calculated based on a market-consistent approach, while the EEV for Symetra is calculated based on a top-down approach. Both approaches are permitted under the EEV Principles. As a mutual life insurance company, Sumitomo Life regarded the surplus after policyholder
dividends as the value attributable to the company in calculating its EEV. Also, foundation funds, classified as net assets in the statutory financial report, were classified as liabilities in the calculation of EEV.

2
1. EEV Results a. EEV Results of the Group (1) EEV Results
(Note1) The EEV as of March 31, 2016 and the value of new business for the year ended March 31, 2016 are
restated based on a method using an ultimate forward rate to extrapolate beyond the last liquid data point of Japanese interest rates.
(Note2) The Group EEV is calculated as follows: Sumitomo Life’s EEV plus Medicare Life’s EEV and Symetra’s EEV less Sumitomo Life’s carrying amount of equity of Medicare Life and Symetra.
(Note3) Sumitomo Life’s carrying amount of Medicare Life‘s equity was ¥55.0 billion as of March 31, 2016, and ¥80.0 billion as of March 31, 2017. Sumitomo Life’s carrying amount of Symetra‘s equity was ¥466.5 billion as of March 31, 2016 and as of March 31, 2017.
(Note4) Symetra became a wholly owned subsidiary of Sumitomo Life on February 1, 2016. The Group EEV as of March 31, 2016 and as of March 31, 2017 includes Symetra’s EEV as of February 1, 2016 and as of December 31, 2016, respectively, in accordance with Symetra’s closing date for the Group’s consolidated financial statements. The Group’s value of new business for the year ended March 31, 2017 includes Symetra’s value of new business for the eleven months ended December 31, 2016. The Group’s value of new business for the year ended March 31, 2016 does not include Symetra’s value of new business.
(Billions of yen)
March 31,2016
(Restated)
March 31,2017
Increase(Decrease)
EEV 2,936.6 3,523.8 587.2
Adjusted net worth 3,850.5 3,558.5 (291.9)
Value of in-force business (913.9) (34.7) 879.2
Year endedMarch 31,2016
(Restated)
Year endedMarch 31,2017
Increase(Decrease)
Value of new business 167.6 8.8 (158.7)

3
(Reference)
As life insurance products are long term liabilities, Sumitomo Life is investing primarily in yen-denominated interest-bearing assets such as long-term bonds and loans in our ALM strategy.
When interest rates reduce, value of in-force business is decreased reflecting lower expected future prospects of investment return. On the other hand, adjusted net worth is increased by unrealized gains on assets.
The sum of unrealized gains and value of in-force business represents expected future profits from in-force business.
Breakdown of Group EEV based on this idea is as follows.
(Note1) The sum of the total net assets on balance sheet, the retained earnings in liabilities (after tax) of
Group, consolidation adjustment regarding Medicare Life and Symetra and deferred tax assets of Symetra is reported.
(Note2) The sum of value of in-force business of Group and unrealized gains (losses) on yen-denominated interest-bearing assets of Sumitomo Life and Medicare Life is reported. Yen-denominated interest-bearing assets include JPY bonds, hedged foreign bonds and (industrial and consumer) loans and so on.
(Note3) The sum of unrealized gains (losses) on securities and loans (after tax) (excluding yen-denominated interest-bearing assets), unrealized gains (losses) on estate and liabilities (after tax), unfunded retirement benefit obligations (after tax).
(Billions of yen)
March 31,2016
(Restated)
March 31,2017
Increase(Decrease)
EEV 2,936.6 3,523.8 587.2
Total net asset on the balance sheet +Retained earnings liabilities(after tax) (Note1)
934.4 1,061.1 126.6
Value of in-force business +Unrealized gains (losses) on Yen-denominated interest-bearing assets(after tax) (Note2)
1,433.7 1,747.4 313.6
Unrealized gains (losses) of assets other than Yen-denominated interest-bearing assets(after tax) (Note3)
568.3 715.3 146.9

4
(2) Adjusted Net Worth
(Note1) The adjusted net worth as of March 31, 2016 is restated based on a method using an ultimate
forward rate to extrapolate beyond the last liquid data point of Japanese interest rates.
(Note2) Figures do not include foundation funds, net unrealized gains (losses) on available-for-sale securities and expected disbursements from capital outside the company. In addition, this item includes an adjustment for shareholder dividends Symetra paid to Sumitomo Life in February 2017.
(Note3) Deduction consists of the carrying amount of the equity of Medicare Life held by Sumitomo Life, which is recorded under “Total net assets on the balance sheets” in the table above.
(Note4) Deduction consists of the carrying amount of the equity of Symetra held by Sumitomo Life, which is recorded under “Total net assets on the balance sheets” in the table above.
(Billions of yen)
March 31,2016
(Restated)
March 31,2017
Increase(Decrease)
Adjusted net worth (Note1) 3,850.5 3,558.5 (291.9)
Total net asset on the balance sheet (Note2) 944.8 976.0 31.2
Retained earnings in liabilities (after tax) 519.5 645.0 125.4Unrealized gains (losses) on securities andmiscellaneous items (after tax) 2,833.6 2,398.3 (435.2)
Unrealized gains (losses) on loans (after tax) 82.4 66.9 (15.4)
Unrealized gains (losses) on real estate (after tax) (0.2) 13.8 14.0
Unrealized gains (losses) on liabilities (after tax) (11.0) (10.4) 0.6
Unfunded retirement benefit obligation (after tax) 11.2 28.7 17.4Consolidation adjustment regarding Medicare Life (Note3) (55.0) (80.0) (25.0)Adjustment for deferred tax assets in Symetra andmiscellaneous items
(8.3) (13.3) (5.0)
Consolidation adjustment regarding Symetra (Note4) (466.5) (466.5) 0.0

5
(3) Reconciliation of total net assets to adjusted net worth
(Note1) Figures do not include foundation funds, net unrealized gains (losses) on available-for-sale securities
and expected disbursements from capital outside the company.
(Note2) The difference between net assets based on statutory accounting and US-GAAP is shown because Symetra’s EEV is calculated based on its statutory accounting while the Group’s consolidated balance sheet is prepared based on Symetra’s US-GAAP balance sheet.
(Note3) There are no subsidiaries and affiliate companies which are deducted from covered business.
(4) Value of In-force Business (VIF)
(Note1) The value of in-force business as of March 31, 2016 is restated based on a method using an ultimate forward rate to extrapolate beyond the last liquid data point of Japanese interest rates.
(Note2) Includes the certainty equivalent present value of future profits for business valued using a market-consistent approach and present value of future profits for business valued using a top-down approach.
(Note3) Includes the cost of holding required capital for business valued using a market-consistent approach and the cost of capital for business valued using a top-down approach.
(Billions of yen)
March 31,2016
(Restated)
March 31,2017
Increase(Decrease)
Total Net Assets of consolidated base (Note1) 666.2 683.0 16.7PLUS Retained earnings in liabilities (After tax) 519.5 645.0 125.4PLUS Unrealized gains (losses) (After tax) 2,898.6 2,470.3 (428.3)
(8.3) (13.3) (5.0)
(225.5) (226.4) (0.8)
LESS Book value of businesses not covered (Note3) - - - Adjusted net worth 3,850.5 3,558.5 (291.9)
PLUS Adjustment for deferred tax assets in Symetra andmiscellaneous itemsPLUS Difference between Symetra’s net assets based on itsstatutory accounting and US-GAAP (Note2)
(Billions of yen)
March 31,2016
(Restated)
March 31,2017
Increase(Decrease)
Value of in-force business (Note1) (913.9) (34.7) 879.2
Present value of future profits (Note2) (399.1) 481.6 880.7
Time value of financial options and guarantees (150.6) (125.7) 24.8
Cost of holding required capital (Note3) (101.5) (137.7) (36.2)
Cost of non-hedgeable risks (262.5) (252.7) 9.8

6
(5) Value of New Business (VNB)
(Note1) The value of new business for the year ended March 31, 2016 is restated based on a method using an ultimate forward rate to extrapolate beyond the last liquid data point of Japanese interest rates.
(Note2) Symetra became a wholly owned subsidiary of Sumitomo Life on February 1, 2016. The Group’s value of new business for the year ended March 31, 2017 includes Symetra’s value of new business for the eleven months ended December 31, 2016. The Group’s value of new business for the year ended March 31, 2016 does not include Symetra’s value of new business.
The new business margin (the ratio of the value of new business to the present value of
premium income) is as follows:
(Note) Future premium income (as for Symetra, based on the statutory accounting) is discounted by the
risk-free rate or the risk discount rate used for the calculation of the value of new business.
(Billions of yen)
Year endedMarch 31,2016
(Restated)
Year endedMarch 31,2017
Increase(Decrease)
Value of new business (Note1,2) 167.6 8.8 (158.7)
Present value of future profits 198.7 48.5 (150.1)
Time value of financial options and guarantees (10.6) (11.1) (0.4)
Cost of holding required capital (4.1) (9.6) (5.5)
Cost of non-hedgeable risks (16.3) (18.8) (2.5)
(Billions of yen)
Year endedMarch 31,2016
(Restated)
Year endedMarch 31,2017
Increase(Decrease)
Value of new business (a) 167.6 8.8 (158.7)
Present value of premium income (b) (Note) 2,469.9 4,149.8 1,679.8
New business Margin (a)÷(b) 6.8 % 0.2 % (6.6) points

7
(Reference)
The VNB is calculated based on a market consistent method using risk neutral valuation techniques, where the expected excess return of investments over risk free rates is offset by allowing for the price that market participants require for taking on the investment risks. This is achieved by assuming the investment return for all assets will be equal to the risk free rates.
However, Sumitomo Life actually invests in corporate bonds, foreign bonds, and equities, in addition to Japanese government bonds, and expects to achieve investment returns in excess of risk-free returns. If Sumitomo Life achieves investment returns in excess of risk-free returns, its embedded value will increase over the term of the policy.
When Sumitomo Life assumes excess returns on investments over risk-free rates, Group’s VNB, on the reference basis, will be as set out in the following table. In order to reflect some uncertainty of realizing the expected excess return, discount rates are assumed to be the same as the return on investments.
Please note that this reference basis differs from the risk neutral valuation which is used for Sumitomo Life’s EEV and VNB. Further, the VNB in following table is not the VNB which forms part of Sumitomo Life’s EEV.
(Note) Sumitomo Life’s expected investment return in FY2016 is 1.9%. Sumitomo Life assumes the excess
return on investments over risk-free rates is 1.0%.
(Billions of yen)
Year endedMarch 31,2017
183.9 Value of new business assuming excess return,on the reference basis (Note)

8
b. EEV Results by company (1) Sumitomo Life
(Note1) The EEV as of March 31, 2016 and the value of new business for the year ended March 31, 2016 are
restated based on a method using an ultimate forward rate to extrapolate beyond the last liquid data point of Japanese interest rates.
(Note2) The shares of Medicare Life and Symetra held by Sumitomo Life are valued on a book value basis for purposes of calculating the embedded value of Sumitomo Life on a stand-alone basis. For purposes of calculating the embedded value of the Group, consolidation adjustments are required.
(Note3) Figures do not include foundation funds, net unrealized gains (losses) on available-for-sale securities and expected disbursements from capital outside the company.
(Billions of yen)
March 31,2016
(Restated)
March 31,2017
Increase(Decrease)
EEV (Note1,2) 3,093.1 3,720.3 627.2
Adjusted net worth 4,081.7 3,819.5 (262.1)
Total net asset on the balance sheet (Note3) 699.2 730.9 31.7
Retained earnings in liabilities (after tax) 486.9 603.4 116.4Unrealized gains (losses) on securities and miscellaneousitems (after tax)
2,813.0 2,386.1 (426.9)
Unrealized gains (losses) on loans (after tax) 82.4 66.9 (15.4)
Unrealized gains (losses) on real estate (after tax) (0.2) 13.8 14.0
Unrealized gains (losses) on liabilities (after tax) (11.0) (10.4) 0.6
Unfunded retirement benefit obligation (after tax) 11.2 28.7 17.4
Value of in-force business (988.6) (99.2) 889.3
Certainty equivalent present value of future profits (557.6) 312.0 869.6
Time value of financial options and guarantees (146.7) (117.0) 29.6
Cost of holding required capital (41.7) (65.2) (23.4)
Cost of non-hedgeable risks (242.5) (229.0) 13.4
(Billions of yen)
Year endedMarch 31,2016
(Restated)
Year endedMarch 31,2017
Increase(Decrease)
Value of new business (Note1) 159.5 14.3 (145.2)
Certainty equivalent present value of future profits 187.6 39.7 (147.9)
Time value of financial options and guarantees (10.6) (9.8) 0.7
Cost of holding required capital (4.0) (2.8) 1.2Cost of non-hedgeable risks (13.4) (12.6) 0.7

9
The new business margin (the ratio of the value of new business to the present value of
premium income) is as follows:
(Note) Future premium income is discounted by the risk-free rate used for the calculation of the value of new
business.
(2) Medicare Life
(Billions of yen)
Year endedMarch 31,2016
(Restated)
Year endedMarch 31,2017
Increase(Decrease)
Value of new business (a) 159.5 14.3 (145.2)
Present value of premium income (b) (Note) 2,398.8 3,538.3 1,139.4
New business Margin (a)÷(b) 6.7 % 0.4 % (6.2) points
(Billions of yen)
March 31,2016
(Restated)
March 31,2017
Increase(Decrease)
EEV (Note1) 91.0 125.6 34.6
Adjusted net worth 48.1 58.2 10.0
Total net asset on the balance sheet (Note2) 26.6 44.5 17.9
Retained earnings in liabilities (after tax) 1.0 1.4 0.3Unrealized gains (losses) on securities and miscellaneousitems (after tax)
20.5 12.2 (8.2)
Unrealized gains (losses) on loans (after tax) - - -
Unrealized gains (losses) on real estate (after tax) - - -
Unrealized gains (losses) on liabilities (after tax) - - -
Unfunded retirement benefit obligation (after tax) - - -
Value of in-force business 42.8 67.4 24.6
Certainty equivalent present value of future profits 63.7 92.3 28.5
Time value of financial options and guarantees (0.5) (0.6) (0.0)
Cost of holding required capital (0.3) (0.6) (0.2)
Cost of non-hedgeable risks (20.0) (23.6) (3.6)

10
(Note1) The EEV as of March 31, 2016 and the value of new business for the year ended March 31, 2016 are
restated based on a method using an ultimate forward rate to extrapolate beyond the last liquid data point of Japanese interest rates.
(Note2) Figures do not include net unrealized gains (losses) on available-for-sale securities.
The new business margin (the ratio of the value of new business to the present value of
premium income) is as follows:
(Note) Future premium income is discounted by the risk-free rate used for the calculation of the value of new
business.
(3) Symetra (Note1)
(Billions of yen)
Year endedMarch 31,2016
(Restated)
Year endedMarch 31,2017
Increase(Decrease)
Value of new business (Note1) 8.0 5.9 (2.1)
Certainty equivalent present value of future profits 11.0 12.2 1.1Time value of financial options and guarantees (0.0) (0.0) 0.0
Cost of holding required capital (0.0) (0.1) (0.0)Cost of non-hedgeable risks (2.9) (6.1) (3.2)
(Billions of yen)
Year endedMarch 31,2016
(Restated)
Year endedMarch 31,2017
Increase(Decrease)
Value of new business (a) 8.0 5.9 (2.1)
Present value of premium income (b) (Note) 71.0 107.3 36.2
New business Margin (a)÷(b) 11.4 % 5.5 % (5.9) points
(Billions of yen) February 1,
2016December 31,
2016Increase
(Decrease)
EEV 274.0 244.5 (29.4)
Adjusted net worth 242.1 247.4 5.2
Total net asset on the balance sheet (Note2) 219.0 220.7 1.7
Retained earnings in liabilities (after tax) (Note3) 31.5 40.0 8.5Adjustment for deferred tax assets and miscellaneousitems
(8.3) (13.3) (5.0)
Value of in-force business 31.8 (2.8) (34.7)
Present value of future profits 94.7 77.2 (17.5)
Time value of financial options and guarantees (3.3) (8.1) (4.7)
Cost of capital (59.4) (71.9) (12.4)

11
(Note1) Symetra became a wholly owned subsidiary of Sumitomo Life on February 1, 2016. The Group EEV
as of March 31, 2016 and as of March 31, 2017 includes Symetra’s EEV as of February 1, 2016 and as of December 31, 2016, respectively, in accordance with Symetra’s closing date for the Group’s consolidated financial statements. The Group’s value of new business for the year ended March 31, 2017 includes Symetra’s value of new business for the eleven months ended December 31, 2016.
(Note2) The sum of net assets based on statutory capital and surplus, value of non-life entities and holding company’s equity.
(Note3) Asset valuation reserve is reported.
The new business margin (the ratio of the value of new business to the present value of
premium income) is as follows:
(Note) Future premium income (based on the statutory accounting) is discounted by the risk discount rate used for the value of new business calculation.
(Billions of yen)Eleven months
endedDecember
31,2016Value of new business (11.3)
Present value of future profits (3.3)
Time value of financial options and guarantees (1.2)
Cost of capital (6.7)
(Billions of yen)Eleven months
endedDecember
31,2016 Value of new business (a) (11.3)
Present value of premium income (b) (Note) 504.1
New business Margin (a)÷(b) (2.2) %

12
(Reference) Symetra’s EEV in US Dollar
(Millions of USD)
February 1,2016
December 31,2016
Increase(Decrease)
EEV 2,267 2,099 (167)
Adjusted net worth 2,003 2,123 120
Total net asset on the balance sheet 1,811 1,894 82
Retained earnings in liabilities (after tax) 260 344 83Adjustment for deferred tax assets and miscellaneousitems
(69) (114) (45)
Value of in-force business 263 (24) (288)
Present value of future profits 783 662 (120)
Time value of financial options and guarantees (27) (69) (42)
Cost of capital (492) (617) (125)
(Millions of USD)Eleven months
endedDecember
31,2016Value of new business (97)
Present value of future profits (28)
Time value of financial options and guarantees (10)
Cost of capital (57)

13
2. Statement of changes in EEV a. Statement of changes in EEV of the Group
(Note1) Effects of changing the extrapolation method beyond the last liquid data point of Japanese interest
rates from a method taking into account the shape of the Japanese yen swap rates to a method using an ultimate forward rate. Note that this change does not affect the EEV of Symetra.
(Note2) This item represents the effects of the foreign exchange variance, because the EEV of Symetra is converted into yen.
(Billions of yen)
Adjustednet worth
Value of in-force
businessEEV
Values as of March 31, 2016 3,850.7 (1,345.5) 2,505.1Change in the extrapolation method ofinterest rates (Note1)
(0.1) 431.5 431.4
Values as of March 31, 2016 (Restated) 3,850.5 (913.9) 2,936.6Adjustments to the values as of March31,2016 (Note2)
(8.7) (1.1) (9.9)
Adjusted values as of March 31, 2016 3,841.7 (915.1) 2,926.6Value of new business - 8.8 8.8Expected existing business contribution(market-consistent approach)
57.1 329.8 386.9
Risk-free rate (4.6) 18.5 13.9 In excess of risk-free rate 61.7 311.3 373.0Expected existing business contribution(top-down approach)
(0.7) 18.2 17.5
Expected transfer from VIF to adjusted networth
95.4 (95.4) -
on in-force at beginning of year 283.8 (283.8) - on new business (188.4) 188.4 - Non-economic experience variances (37.9) 25.2 (12.6)Non-economic assumptions changes - 81.3 81.3Economic variances (397.1) 512.2 115.1
Values as of March 31, 2017 3,558.5 (34.7) 3,523.8

14
b.Statement of changes in EEV by Company (1) Sumitomo Life
(Billions of yen)
Adjustednet worth
Value of in-force
businessEEV
Values as of March 31, 2016 4,081.8 (1,400.7) 2,681.1
(0.1) 412.1 411.9
Values as of March 31, 2016 (Restated) 4,081.7 (988.6) 3,093.1- 14.3 14.3
56.2 327.1 383.4
Risk-free rate (4.5) 17.6 13.1In excess of risk-free rate 60.8 309.5 370.3
87.3 (87.3) - on in-force at beginning of year 251.6 (251.6) - on new business (164.3) 164.3 -
(30.3) 30.5 0.1- 86.9 86.9
(375.4) 517.6 142.2Values as of March 31, 2017 3,819.5 (99.2) 3,720.3
Change in the extrapolation method of interest rates
Economic variances
Value of new business
Expected transfer from VIF to adjusted net worth
Non-economic experience variancesNon-economic assumptions changes
Expected existing business contribution(market-consistent approach)

15
(2) Medicare Life
(Note) During the year ended March 31, 2017, Medicare Life received ¥25.0 billion as additional capital from
Sumitomo Life. The capital injection represents an intragroup transaction, thus has no impact on the Group EEV.
(Billions of yen)
Adjustednet worth
Value of in-force
businessEEV
Values as of March 31, 2016 48.1 23.3 71.5
- 19.4 19.4
Values as of March 31, 2016 (Restated) 48.1 42.8 91.025.0 - 25.0
Adjusted values as of March 31, 2016 73.1 42.8 116.0- 5.9 5.9
0.8 2.7 3.5
Risk-free rate (0.1) 0.9 0.8In excess of risk-free rate 0.9 1.7 2.7
(9.0) 9.0 - on in-force at beginning of year 0.5 (0.5) - on new business (9.6) 9.6 -
(2.0) (0.9) (3.0)- 1.6 1.6
(4.6) 6.2 1.5Values as of March 31, 2017 58.2 67.4 125.6
Change in the extrapolation method of interest rates
Non-economic assumptions changesEconomic variances
Capital injection by Sumitomo Life (Note)
Value of new business
Expected transfer from VIF to adjusted net worth
Non-economic experience variances
Expected existing business contribution(market-consistent approach)

16
(3) Symetra
(Billions of yen)
Adjustednet worth
Value of in-force
businessEEV
Values as of February 1, 2016 242.1 31.8 274.0(8.7) (1.1) (9.9)
Adjusted values as of February 1, 2016 233.3 30.7 264.0- (11.3) (11.3)
(0.7) 18.2 17.5
17.1 (17.1) - on in-force as of February 1, 2016 31.5 (31.5) - on new business (14.4) 14.4 -
(5.5) (4.3) (9.8)- (7.3) (7.3)
3.1 (11.6) (8.5)Values as of December 31, 2016 247.4 (2.8) 244.5
Non-economic experience variancesNon-economic assumptions changesEconomic variances
Adjustments to the values as of February 1, 2016
Value of new businessExpected existing business contribution(top-down approach)Expected transfer from VIF to adjusted net worth

17
3. Sensitivity Analysis a. Sensitivity Analysis of EEV of the Group
The following table shows the effect of sensitivities 1 through 3 and 8 on adjusted net worth. Only the value of in-force business is affected in sensitivities 4 through 7, 9 and 10.
(Billions of yen)
EEV Increase(Decrease)
EEV as of March 31, 2017 3,523.8 -
Sensitivity 1: 50bp upward parallel shift in risk-freeyield curve
4,062.0 538.1
Sensitivity 2: 50bp downward parallel shift in risk-freeyield curve
3,003.5 (520.2)
Sensitivity 3: 10% decline in equity and real estatevalues
3,347.2 (176.5)
Sensitivity 4: 10% decline in maintenance expenses 3,631.1 107.3Sensitivity 5: 10% decline in surrender and lapse rate 3,664.3 140.4
Sensitivity 6: 5% decline in mortality and morbidityrates for life insurance products
3,769.2 245.3
Sensitivity 7: 5% decline in mortality and morbidityrates for annuities
3,515.0 (8.8)
Sensitivity 8: Setting required capital at statutoryminimum level
3,619.0 95.1
Sensitivity 9: 25% increase in implied volatilities ofequity and real estate values
3,522.8 (1.0)
Sensitivity 10: 25% increase in implied volatilities ofswaptions
3,475.4 (48.3)
(Billions of yen)
Increase(Decrease)
Sensitivity 1: 50bp upward parallel shift in risk-freeyield curve
(734.6)
Sensitivity 2: 50bp downward parallel shift in risk-freeyield curve
354.0
Sensitivity 3: 10% decline in equity and real estatevalues
(163.8)
Sensitivity 8: Setting required capital at statutoryminimum level
1.8

18
Sensitivity analysis of the Group’s value of new business
(Billions of yen)
Value ofnew business
Increase(Decrease)
8.8 -
Sensitivity 1: 50bp upward parallel shift in risk-freeyield curve
110.5 101.6
Sensitivity 2: 50bp downward parallel shift in risk-freeyield curve
(78.0) (86.9)
Sensitivity 3: 10% decline in equity and real estatevalues
9.4 0.5
Sensitivity 4: 10% decline in maintenance expenses 18.3 9.4Sensitivity 5: 10% decline in surrender and lapse rate 16.9 8.0
Sensitivity 6: 5% decline in mortality and morbidityrates for life insurance products
20.1 11.2
Sensitivity 7: 5% decline in mortality and morbidityrates for annuities
8.9 0.0
Sensitivity 8: Setting required capital at statutoryminimum level
15.6 6.7
Sensitivity 9: 25% increase in implied volatilities ofequity and real estate values
8.8 (0.0)
Sensitivity 10: 25% increase in implied volatilities ofswaptions
4.8 (4.0)
Value of new business for the fiscal year endedMarch 31,2017

19
b. Sensitivity Analysis of EEV by Company (1) Sumitomo Life
The following table shows the effect of sensitivities 1 through 3 on adjusted net worth. Only the value of in-force business is affected in sensitivities 4 through 10.
(Billions of yen)
EEV Increase(Decrease)
EEV as of March 31, 2017 3,720.3 -
Sensitivity 1: 50bp upward parallel shift in risk-freeyield curve
4,255.4 535.1
Sensitivity 2: 50bp downward parallel shift in risk-freeyield curve
3,211.5 (508.7)
Sensitivity 3: 10% decline in equity and real estatevalues
3,553.4 (166.9)
Sensitivity 4: 10% decline in maintenance expenses 3,815.9 95.5Sensitivity 5: 10% decline in surrender and lapse rate 3,857.8 137.5
Sensitivity 6: 5% decline in mortality and morbidityrates for life insurance products
3,953.8 233.5
Sensitivity 7: 5% decline in mortality and morbidityrates for annuities
3,713.8 (6.4)
Sensitivity 8: Setting required capital at statutoryminimum level
3,759.4 39.1
Sensitivity 9: 25% increase in implied volatilities ofequity and real estate values
3,719.3 (1.0)
Sensitivity 10: 25% increase in implied volatilities ofswaptions
3,672.1 (48.1)
(Billions of yen)
Increase(Decrease)
Sensitivity 1: 50bp upward parallel shift in risk-freeyield curve
(727.2)
Sensitivity 2: 50bp downward parallel shift in risk-freeyield curve
350.4
Sensitivity 3: 10% decline in equity and real estatevalues
(163.8)
20
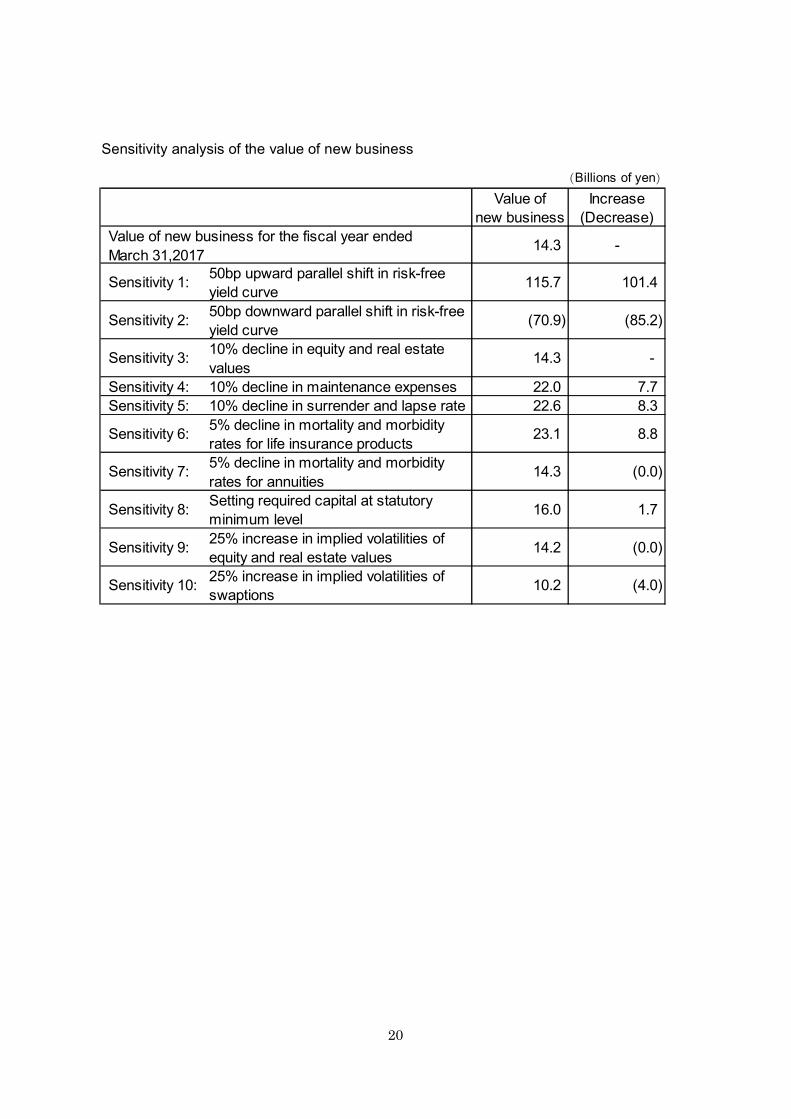
Sensitivity analysis of the value of new business
(Billions of yen)
Value ofnew business
Increase(Decrease)
14.3 -
Sensitivity 1: 50bp upward parallel shift in risk-freeyield curve
115.7 101.4
Sensitivity 2: 50bp downward parallel shift in risk-freeyield curve
(70.9) (85.2)
Sensitivity 3: 10% decline in equity and real estatevalues
14.3 -
Sensitivity 4: 10% decline in maintenance expenses 22.0 7.7Sensitivity 5: 10% decline in surrender and lapse rate 22.6 8.3
Sensitivity 6: 5% decline in mortality and morbidityrates for life insurance products
23.1 8.8
Sensitivity 7: 5% decline in mortality and morbidityrates for annuities
14.3 (0.0)
Sensitivity 8: Setting required capital at statutoryminimum level
16.0 1.7
Sensitivity 9: 25% increase in implied volatilities ofequity and real estate values
14.2 (0.0)
Sensitivity 10: 25% increase in implied volatilities ofswaptions
10.2 (4.0)
Value of new business for the fiscal year endedMarch 31,2017

21
(2) Medicare Life
The following table shows the effect of sensitivities 1 through 3 on adjusted net worth. Only the value of in-force business is affected in sensitivities 4 through 10.
(Billions of yen)
EEV Increase(Decrease)
EEV as of March 31, 2017 125.6 -
Sensitivity 1: 50bp upward parallel shift in risk-freeyield curve
127.1 1.4
Sensitivity 2: 50bp downward parallel shift in risk-freeyield curve
120.5 (5.1)
Sensitivity 3: 10% decline in equity and real estatevalues
125.6 -
Sensitivity 4: 10% decline in maintenance expenses 128.2 2.5Sensitivity 5: 10% decline in surrender and lapse rate 123.6 (2.0)
Sensitivity 6: 5% decline in mortality and morbidityrates for life insurance products
132.0 6.3
Sensitivity 7: 5% decline in mortality and morbidityrates for annuities
125.6 -
Sensitivity 8: Setting required capital at statutoryminimum level
126.0 0.3
Sensitivity 9: 25% increase in implied volatilities ofequity and real estate values
125.6 -
Sensitivity 10: 25% increase in implied volatilities ofswaptions
125.4 (0.1)
(Billions of yen)
Increase(Decrease)
Sensitivity 1: 50bp upward parallel shift in risk-freeyield curve
(7.3)
Sensitivity 2: 50bp downward parallel shift in risk-freeyield curve
3.5
Sensitivity 3: 10% decline in equity and real estatevalues
-

22
Sensitivity analysis of the value of new business
(Billions of yen)
Value ofnew business
Increase(Decrease)
5.9 -
Sensitivity 1: 50bp upward parallel shift in risk-freeyield curve
6.7 0.8
Sensitivity 2: 50bp downward parallel shift in risk-freeyield curve
4.5 (1.3)
Sensitivity 3: 10% decline in equity and real estatevalues
5.9 -
Sensitivity 4: 10% decline in maintenance expenses 6.6 0.7Sensitivity 5: 10% decline in surrender and lapse rate 5.4 (0.4)
Sensitivity 6: 5% decline in mortality and morbidityrates for life insurance products
7.6 1.7
Sensitivity 7: 5% decline in mortality and morbidityrates for annuities
5.9 -
Sensitivity 8: Setting required capital at statutoryminimum level
5.9 0.0
Sensitivity 9: 25% increase in implied volatilities ofequity and real estate values
5.9 -
Sensitivity 10: 25% increase in implied volatilities ofswaptions
5.9 (0.0)
Value of new business for the fiscal year endedMarch 31,2017

23
(3) Symetra
The following table shows the effect on the adjusted net worth of sensitivities 8. The effect
on the adjusted net worth of sensitivities 1 and 2 are not calculated as they are not material. Only the value of in-force business is affected in sensitivities 3 through 7 and 9 through 11 in the above table.
(Billions of yen)
EEV Increase(Decrease)
EEV as of December 31, 2016 244.5 -
Sensitivity 1: 50bp upward parallel shift in risk-freeyield curve
246.0 1.5
Sensitivity 2: 50bp downward parallel shift in risk-freeyield curve
238.1 (6.3)
Sensitivity 3: 10% decline in equity and real estatevalues
234.8 (9.6)
Sensitivity 4: 10% decline in maintenance expenses 253.7 9.1Sensitivity 5: 10% decline in surrender and lapse rate 249.5 5.0
Sensitivity 6: 5% decline in mortality and morbidityrates for life insurance products
250.0 5.4
Sensitivity 7: 5% decline in mortality and morbidityrates for annuities
242.1 (2.3)
Sensitivity 8: Setting required capital at statutoryminimum level
300.2 55.7
Sensitivity 9: 1% increase in equity and real estateyield
250.9 6.4
Sensitivity 10: 50bp upward shift in risk discount rate 238.3 (6.1)
Sensitivity 11: 50bp downward shift in risk discountrate
251.1 6.6
(Billions of yen)
Increase(Decrease)
Sensitivity 8: Setting required capital at statutoryminimum level
1.8

24
Sensitivity analysis of the value of new business
For the business valued using a top-down approach, sensitivity 1 is calculated based on simultaneous upward parallel shift of 50bp in both the investment yields and the risk discount rate. (sensitivity 2 too)
Sensitivity 10 represents the effect on EEV of an upward shift of 50bp of the risk discount rate for a top-down approach. (sensitivity 11 too) 4. Note
The calculation of EEV requires numerous assumptions regarding future projections that are subject to risks and uncertainties. Future results may differ from those assumptions used in the calculation of EEV.
(Billions of yen)
Value ofnew business
Increase(Decrease)
(11.3) -
Sensitivity 1: 50bp upward parallel shift in risk-freeyield curve (11.9) (0.5)
Sensitivity 2: 50bp downward parallel shift in risk-freeyield curve (11.6) (0.2)
Sensitivity 3: 10% decline in equity and real estatevalues
(10.8) 0.5
Sensitivity 4: 10% decline in maintenance expenses (10.3) 0.9Sensitivity 5: 10% decline in surrender and lapse rate (11.1) 0.2
Sensitivity 6: 5% decline in mortality and morbidityrates for life insurance products (10.6) 0.6
Sensitivity 7: 5% decline in mortality and morbidityrates for annuities (11.3) 0.0
Sensitivity 8: Setting required capital at statutoryminimum level (6.3) 4.9
Sensitivity 9: 1% increase in equity and real estateyield (10.1) 1.2
Sensitivity 10: 50bp upward shift in risk discount rate (12.6) (1.2)
Sensitivity 11: 50bp downward shift in risk discountrate (10.0) 1.2
Value of new business for the eleven months endedDecember 31,2016

25
Appendix A: Principal EEV Assumptions (Sumitomo Life and Medicare Life) 1. Economic assumptions a. Risk-free rate
In the certainty equivalent calculation and the interest rate model calibration, Japanese Government Bonds (JGBs) are used as a proxy for risk-free rates.
As the term of life insurance policies is generally longer than financial instruments in the market, the ultra-long term rate data which is not available in the market should be set. Because of low liquidity of more than 30 years long-term Japanese Government Bond (JGB) in the market, we extrapolated the risk-free rates beyond 30 years.
In the extrapolation method using an ultimate forward rate, interest rate, which is not available in the market, converges to an ultimate forward rate which is future forward rate based on macro-economic analysis. The extrapolation method using an ultimate forward rate is used in EU Solvency II and is permitted in the MCEV Principles and is considered to be used in the Insurance Capital Standard (ICS) being developed by the International Association of Insurance Supervisors.
For Japanese yen risk-free rates (forward rates), the ultimate forward rate is set at 3.5% in the 60th year. We extrapolate the yield curve to the ultimate forward rate by using the Smith-Wilson method.
The table below shows, for selected terms, the risk-free rates (spot rates) which are used in the calculations.

26
TermMarch 31,
2016(Restated)
March 31,2017
1 year (0.154)% (0.254)%2 year (0.206)% (0.204)%3 year (0.229)% (0.179)%4 year (0.205)% (0.148)%5 year (0.190)% (0.124)%10 year (0.048)% 0.068 %15 year 0.209 % 0.375 %20 year 0.454 % 0.663 %25 year 0.601 % 0.828 %30 year 0.571 % 0.881 %35 year 0.736 % 1.044 %40 year 0.997 % 1.278 %45 year 1.244 % 1.498 %50 year 1.458 % 1.688 %
(Source:Ministry of Finance (after interpolation/extrapolation))

27
b. Principal dynamic assumption (1) Interest rate model As an interest rate model, Sumitomo Life has adopted a single-factor Hull-White model, in
which interest rates associated with Japanese yen, U.S. dollars, Euros and British pounds are calculated. The model has been adjusted to be in line with a risk-neutral approach in which Japanese yen is set as a base currency, and correlations between the interest rates have also been taken into account. The interest rate model has been calibrated to be consistent with the market environment as of each reporting date, and parameters used are estimated from the yield curve and implied volatilities of interest rate swaptions with various maturities. 5,000 scenarios are used in calculating the time value of financial options and guarantees through the stochastic method.
A summary of implied volatilities of interest rate swaptions used to calibrate the scenarios is as follows:
Interest rate swaptions
(bp)
OptionTerm
SwapTerm JPY USD EUR GBP JPY USD EUR GBP
5 year 10 year 39.7 86.9 74.1 80.7 31.7 79.9 70.8 76.07 year 10 year 40.8 82.4 74.7 76.0 33.3 76.7 71.4 73.410 year 10 year 42.3 77.9 73.3 71.0 35.7 71.8 69.6 69.515 year 10 year 42.9 67.2 68.4 62.8 38.8 62.1 64.0 62.720 year 10 year 42.9 59.5 - 55.9 41.4 54.9 58.4 57.9
(Source:Bloomberg (adjusted))
March 31,2016 March 31,2017

28
(2) Implied volatilities of equities and currencies Volatilities of major equity indices and currencies are calibrated based on implied volatilities
of options traded in the market. Implied volatilities used to calibrate the scenarios are as follows:
Stock options
Currency options
March 31,2016
March 31,2017
JPY Nikkei225 3 year 20.2% 19.4%4 year 19.9% 19.4%5 year 19.8% 19.4%
USD S&P 500 3 year 18.8% 17.1%4 year 20.1% 18.4%5 year 21.3% 19.7%
EUR Euro 3 year 20.1% 18.6%Stoxx50 4 year 20.1% 19.1%
5 year 20.2% 19.6%GBP FTSE 100 3 year 18.7% 16.1%
4 year 19.2% 17.1%5 year 19.7% 18.0%
VolatilityCurrency
UnderlyingAssset
OptionTerm
(Source:Markit (af ter interpolation/extrapolation) )
March 31,2016
March 31,2017
USD 5 year 10.8% 9.9%EUR 5 year 12.7% 11.0%GBP 5 year 16.2% 12.4%
(Source:Bloomberg)
VolatilityCurrency
OptionTerm

29
(3) Correlations In addition to the implied volatilities described above, each company has calculated implied
volatilities reflecting its asset portfolio and correlation factors. The share of each asset is assumed to be unchanged over the projection periods.
With regard to correlation factors, market-consistent data from exotic options with sufficient liquidity have not been observed in the market. Therefore, Sumitomo Life estimated correlation factors based on historical market data. Specifically, the monthly data from March 31, 2007 to March 31, 2017 have been used. The following table shows correlation factors between major variables.
1yearRate/JPY
1yearRate/USD
1yearRate/EUR
1yearRate/GBP
USD/JPY EUR/JPY GBP/JPY NIKKEI225 S&P500 EuroStoxx
50 FTSE100
1year Rate/JPY 1.00 0.53 0.48 0.49 0.40 0.27 0.41 0.40 0.24 0.25 0.15
1year Rate/USD 0.53 1.00 0.68 0.73 0.53 0.35 0.52 0.45 0.33 0.31 0.23
1year Rate/EUR 0.48 0.68 1.00 0.72 0.30 0.46 0.44 0.35 0.36 0.34 0.29
1year Rate/GBP 0.49 0.73 0.72 1.00 0.33 0.30 0.46 0.35 0.26 0.22 0.14
USD/JPY 0.40 0.53 0.30 0.33 1.00 0.64 0.77 0.62 0.24 0.29 0.16
EUR/JPY 0.27 0.35 0.46 0.30 0.64 1.00 0.79 0.68 0.56 0.47 0.43
GBP/JPY 0.41 0.52 0.44 0.46 0.77 0.79 1.00 0.70 0.46 0.44 0.25
NIKKEI225 0.40 0.45 0.35 0.35 0.62 0.68 0.70 1.00 0.71 0.71 0.63
S&P500 0.24 0.33 0.36 0.26 0.24 0.56 0.46 0.71 1.00 0.83 0.84
EuroStoxx50 0.25 0.31 0.34 0.22 0.29 0.47 0.44 0.71 0.83 1.00 0.84
FTSE100 0.15 0.23 0.29 0.14 0.16 0.43 0.25 0.63 0.84 0.84 1.00
(Source:Ministry of Finance (1year Rate/JPY) and Bloomberg(the others))

30
c. Assumed investment yield used for the calculation of expected returns
Assumed investment yields on major asset categories used for the calculation of “Expected existing business contribution (the sum of risk-free rate and excess of risk-free rate)” in “2. Statement of changes in EEV” are as follows. The Weighted-average assumed investment yield (annual rate) is based on the asset portfolio at the beginning of the year. The yield for Sumitomo Life is 1.9% and, for Medicare Life, is 1.2%.
2. Non-economic assumptions
All cash flows (premiums, operating expenses, benefits and claims, cash surrender value, tax, etc.) are projected applying the best estimate assumptions, by product, referring to past, current and expected future experience. a. Operating expenses
Operating expenses are set based on the experience of each company. The look-through basis is applied in terms of operating expenses of insurance business.
For Medicare Life, operating expenses are assumed to decrease for a certain period of time, because it has operated for only a short period of time and the improvement of operating efficiency is expected in the future. Therefore, the assumption for operating expenses incorporates recent developments, and decrease of unit-cost (by approximately 5% per annum on average) until the fiscal year ending March 31, 2020 is assumed.
Future inflation rates are assumed to be zero. The rise of consumption tax rate after October 2019 is considered.
b. Policyholder dividends (1) Sumitomo Life
Policyholder dividend rates are based on the current dividend policy, and set according to market-consistent, risk-neutral scenarios.
(2) Medicare Life No assumption of policyholder dividend rate is set, as it sells only non-participating
policies.
Assumedinvestment yield
(annual rate)
Fixed income assets 1.2%Foreign bonds 3.1%
Stocks 6.1%

31
c. Effective tax rate
In the projection of future profits, effective tax rate is set at the following rates, reflecting the change in corporate tax rates.
Sumitomo Life : FY2016-2017 28.20% FY2018- 27.96% Medicare Life : FY2016-2017 28.24% FY2018- 28.00%

32
Appendix B: Principal EEV Assumptions (Symetra) 1. Economic Assumptions and Risk Discount Rate a. Economic assumptions
Investment cash flows for the top-down approach are based on current and expected asset allocations and the economic environment on the reporting date. Key economic assumptions include the level of government bond rates, credit spreads, default rates and investment expenses. Government bond rates and credit spreads were set equal to the levels of the reporting date.
Existing yields are as follows:
(Note) Statutory basis, before default, excluding investment costs
Reinvestment yields vary by liability group, in accordance with the characteristics of the liabilities and actual practice, and are determined based on the current and expected future reinvestment strategy.
Reinvestment rates by main liability group are as follows:
(Note1) VA is not included (Note2) Separate account (Note3) Before default, excluding investment costs (Note4) Rates vary by product type
Current yield(%)
February 1,2016 December 31,2016
Corporate Bonds 4.60% 4.43%
Grand Total 4.58% 4.39%
Reinvestment rates (Note3,4)
February 1,2016 December 31,2016
Life 3.46-4.22% 3.70-4.33%
Annuities (Note1) 3.45-4.26% 3.65-4.37%
Benefits 4.38% 3.72%
VA (Note2) 7.50% 7.50%
Main Products

33
Default rates, which apply to existing assets and reinvestments, are determined by asset type and rating, where applicable, based on historical studies.
Expected default cost net of recovery are as follows:
b. Risk discount rate The risk discount rate is set using a weighted average cost of capital approach (WACC)
taking into account the cost of equity and cost of debt. Risk discount rate are as follows:
(Note)10 year U.S. government bond yield
2. Non-economic assumptions All cash flows (premium, operating expense, benefits and claims, cash surrender value, tax,
etc.) are projected each insurance, applying the best estimate assumptions into the future, by product, referring to past, current and expected future experience.
For interest sensitive business, future credited rates are based on current credited rate setting methods and are consistent with the projected economic assumptions. Dynamic policyholder behavior is applied where appropriate.
The future inflation rate is assumed to be 2.0% p.a. and is applied to the best estimate unit
expense assumptions. The tax rate is set at 35% and is applied to the projected taxable income.
Default cost (bp)
February 1,2016 December 31,2016
Existing Assets
AAA-A 10 10
BBB 19 19
Reinvestment Assets
AAA-A 13 13
BBB 21 21
In-force business New business
February 1,2016 December 31,2016Five months
ended June 30,2016
Six months ended December 31,
2016
Risk discount rate 7.00% 7.75% 6.50% 7.75%
Risk-free rate (Note) 1.94% 2.45% 1.49% 2.45%
Risk margin 5.06% 5.30% 5.01% 5.30%

34
3. Exchange rate The EEV of Symetra is calculated in local currency and converted into JPY using the
following rate:
January 31,2016 December 31,2016
USD1.00 JPY120.87 JPY116.49