maybank philippines, incorporated€¦ · *sgvfs016291* - 2 - opinion in our opinion, the financial...
TRANSCRIPT

Maybank Philippines, Incorporated
Financial StatementsDecember 31, 2015 and 2014
and
Independent Auditors’ Report

*SGVFS016291*
INDEPENDENT AUDITORS’ REPORT
The Stockholders and the Board of DirectorsMaybank Philippines, Incorporated
Report on the Financial Statements
We have audited the accompanying financial statements of Maybank Philippines, Incorporated whichcomprise the statements of financial position as at December 31, 2015 and 2014, and the statements ofincome, statements of comprehensive income, statements of changes in equity and statements of cashflows for the years then ended, and a summary of significant accounting policies and other explanatoryinformation.
Management’s Responsibility for the Financial Statements
Management is responsible for the preparation and fair presentation of the financial statements inaccordance with Philippine Financial Reporting Standards, and for such internal control asmanagement determines is necessary to enable the preparation of financial statements that are freefrom material misstatement, whether due to fraud or error.
Auditors’ Responsibility
Our responsibility is to express an opinion on these financial statements based on our audits. Weconducted our audits in accordance with Philippine Standards on Auditing. Those standards requirethat we comply with ethical requirements and plan and perform the audit to obtain reasonableassurance about whether the financial statements are free from material misstatement.
An audit involves performing procedures to obtain audit evidence about the amounts and disclosuresin the financial statements. The procedures selected depend on the auditor’s judgment, including theassessment of the risks of material misstatement of the financial statements, whether due to fraud orerror. In making those risk assessments, the auditor considers internal control relevant to the entity’spreparation and fair presentation of the financial statements in order to design audit procedures that areappropriate in the circumstances, but not for the purpose of expressing an opinion on the effectivenessof the entity’s internal control. An audit also includes evaluating the appropriateness of accountingpolicies used and the reasonableness of accounting estimates made by management, as well asevaluating the overall presentation of the financial statements.
We believe that the audit evidence we have obtained is sufficient and appropriate to provide a basis forour audit opinion.
SyCip Gorres Velayo & Co.6760 Ayala Avenue1226 Makati CityPhilippines
Tel: (632) 891 0307Fax: (632) 819 0872ey.com/ph
BOA/PRC Reg. No. 0001, December 14, 2015, valid until December 31, 2018SEC Accreditation No. 0012-FR-4 (Group A), November 10, 2015, valid until November 9, 2018
A member firm of Ernst & Young Global Limited
*SGVFS016291*
- 2 -
Opinion
In our opinion, the financial statements present fairly, in all material respects, the financial position ofMaybank Philippines, Incorporated as at December 31, 2015 and 2014, and its financial performanceand its cash flows for the years then ended in accordance with Philippine Financial ReportingStandards.
Report on the Supplementary Information Required Under Revenue Regulation 15-2010
Our audits were conducted for the purpose of forming an opinion on the basic financial statementstaken as a whole. The supplementary information required under Revenue Regulation 15-2010 inNote 32 to the financial statements is presented for purposes of filing with the Bureau of InternalRevenue and is not a required part of the basic financial statements. Such information is theresponsibility of the management of Maybank Philippines, Incorporated. The information has beensubjected to the auditing procedures applied in our audit of the basic financial statements. In ouropinion, the information is fairly stated in all material respects in relation to the basic financialstatements taken as a whole.
SYCIP GORRES VELAYO & CO.
Janet A. ParaisoPartnerCPA Certificate No. 92305SEC Accreditation No. 0778-AR-2 (Group A), May 1, 2015, valid until April 30, 2018Tax Identification No. 193-975-241BIR Accreditation No. 08-001998-62-2015, February 27, 2015, valid until February 26, 2018PTR No. 5321602, January 4, 2016, Makati City
March 29, 2016
A member firm of Ernst & Young Global Limited
*SGVFS016291*
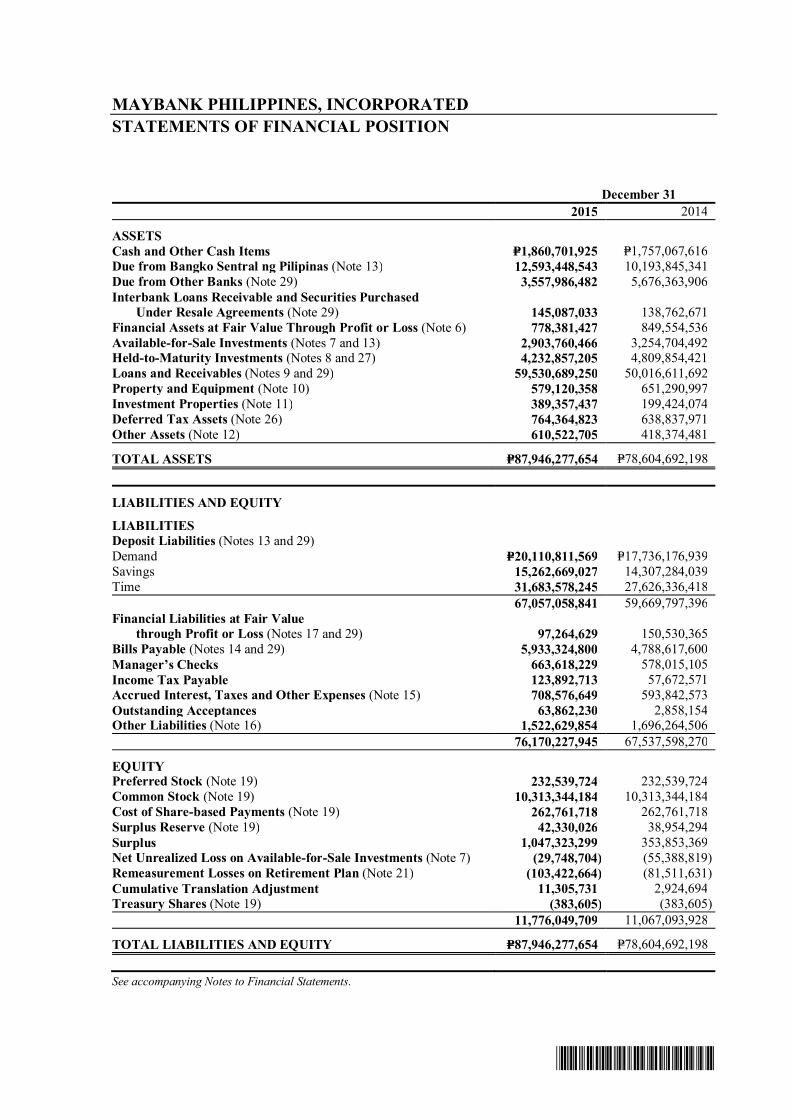
MAYBANK PHILIPPINES, INCORPORATEDSTATEMENTS OF FINANCIAL POSITION
December 312015 2014
ASSETSCash and Other Cash Items P=1,860,701,925 P=1,757,067,616Due from Bangko Sentral ng Pilipinas (Note 13) 12,593,448,543 10,193,845,341Due from Other Banks (Note 29) 3,557,986,482 5,676,363,906Interbank Loans Receivable and Securities Purchased Under Resale Agreements (Note 29) 145,087,033 138,762,671Financial Assets at Fair Value Through Profit or Loss (Note 6) 778,381,427 849,554,536Available-for-Sale Investments (Notes 7 and 13) 2,903,760,466 3,254,704,492Held-to-Maturity Investments (Notes 8 and 27) 4,232,857,205 4,809,854,421Loans and Receivables (Notes 9 and 29) 59,530,689,250 50,016,611,692Property and Equipment (Note 10) 579,120,358 651,290,997Investment Properties (Note 11) 389,357,437 199,424,074Deferred Tax Assets (Note 26) 764,364,823 638,837,971Other Assets (Note 12) 610,522,705 418,374,481
TOTAL ASSETS P=87,946,277,654 P=78,604,692,198
LIABILITIES AND EQUITY
LIABILITIESDeposit Liabilities (Notes 13 and 29)Demand P=20,110,811,569 P=17,736,176,939Savings 15,262,669,027 14,307,284,039Time 31,683,578,245 27,626,336,418
67,057,058,841 59,669,797,396Financial Liabilities at Fair Value through Profit or Loss (Notes 17 and 29) 97,264,629 150,530,365Bills Payable (Notes 14 and 29) 5,933,324,800 4,788,617,600Manager’s Checks 663,618,229 578,015,105Income Tax Payable 123,892,713 57,672,571Accrued Interest, Taxes and Other Expenses (Note 15) 708,576,649 593,842,573Outstanding Acceptances 63,862,230 2,858,154Other Liabilities (Note 16) 1,522,629,854 1,696,264,506
76,170,227,945 67,537,598,270
EQUITYPreferred Stock (Note 19) 232,539,724 232,539,724Common Stock (Note 19) 10,313,344,184 10,313,344,184Cost of Share-based Payments (Note 19) 262,761,718 262,761,718Surplus Reserve (Note 19) 42,330,026 38,954,294Surplus 1,047,323,299 353,853,369Net Unrealized Loss on Available-for-Sale Investments (Note 7) (29,748,704) (55,388,819)Remeasurement Losses on Retirement Plan (Note 21) (103,422,664) (81,511,631)Cumulative Translation Adjustment 11,305,731 2,924,694Treasury Shares (Note 19) (383,605) (383,605)
11,776,049,709 11,067,093,928
TOTAL LIABILITIES AND EQUITY P=87,946,277,654 P=78,604,692,198
See accompanying Notes to Financial Statements.

*SGVFS016291*
MAYBANK PHILIPPINES, INCORPORATEDSTATEMENTS OF INCOME
Years Ended December 312015 2014
INTEREST INCOME ONLoans and receivables (Notes 9 and 29) P=4,520,890,491 P=3,582,449,891Financial investments (Note 20) 371,252,991 404,070,254Due from Bangko Sentral ng Pilipinas and other banks (Note 29) 79,616,599 157,589,957Interbank loans receivable and securities purchased under resale agreements (Note 29) 6,813,087 36,695,540
4,978,573,168 4,180,805,642
INTEREST EXPENSE ONDeposit liabilities (Notes 13 and 29) 818,686,368 633,064,380Financial liabilities at fair value through profit or loss (Notes 17 and 29) 71,075,307 111,884,865Bills payable and other borrowings (Notes 14 and 29) 31,316,731 44,699,092
921,078,406 789,648,337
NET INTEREST INCOME 4,057,494,762 3,391,157,305
OTHER INCOME AND CHARGESService charges, fees and commissions (Notes 23 and 29) 627,066,341 574,504,348Net trading gains (Note 22) 161,114,065 42,323,063Gain on sale of properties 54,223,359 68,274,978Foreign exchange gains - net 3,645,100 94,988,319Loss on foreclosures (24,109,517) (28,428,621)Miscellaneous (Note 24) 105,230,169 46,885,461
TOTAL OPERATING INCOME 4,984,664,279 4,189,704,853
OTHER EXPENSES AND CHARGESCompensation and fringe benefits (Notes 21 and 29) 1,271,852,022 1,085,645,608Provision for impairment and credit losses (Notes 9, 11 and 12) 602,674,091 410,683,063Taxes and licenses 444,707,187 326,823,784Depreciation and amortization (Notes 10, 11 and 12) 307,776,396 260,810,482Occupancy (Note 25) 276,791,839 271,829,227Security, messengerial and janitorial 168,070,886 166,457,765Miscellaneous (Note 24) 956,624,413 906,731,448
TOTAL OPERATING EXPENSES 4,028,496,834 3,428,981,377
INCOME BEFORE INCOME TAX 956,167,445 760,723,476
PROVISION FOR (BENEFIT FROM)INCOME TAX (Note 26) 259,321,783 (244,368,529)
NET INCOME P=696,845,662 P=1,005,092,005
See accompanying Notes to Financial Statements.
*SGVFS016291*
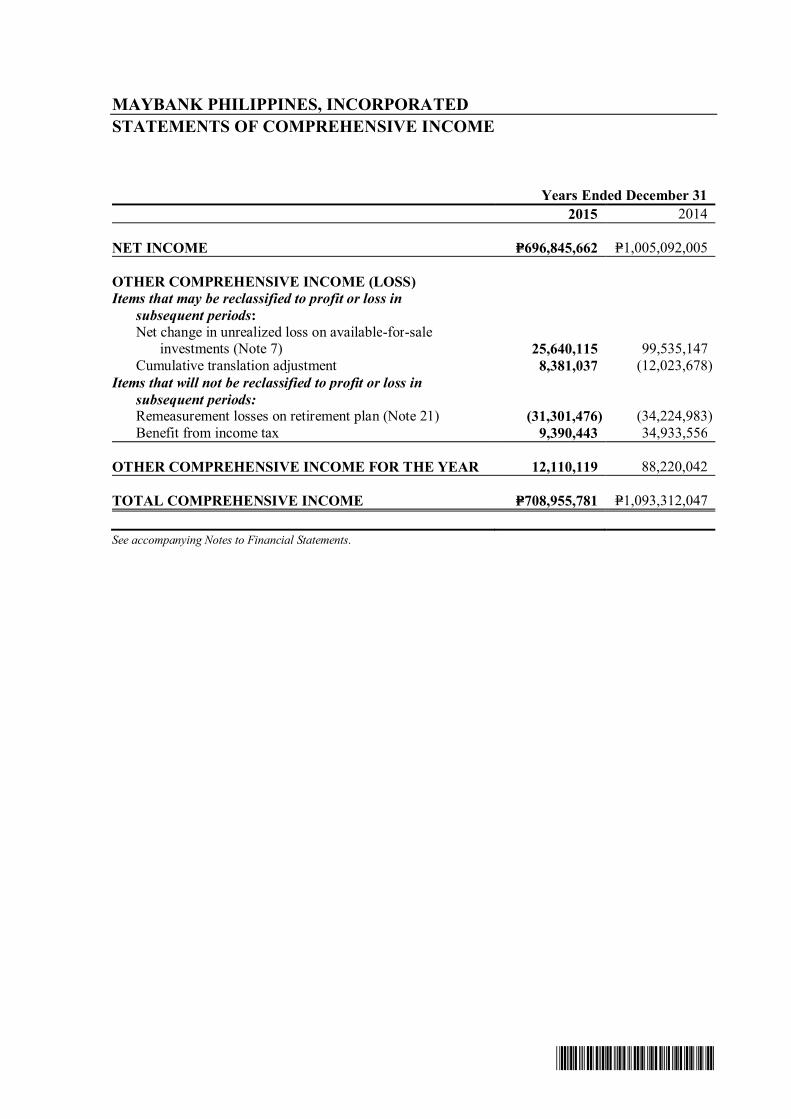
MAYBANK PHILIPPINES, INCORPORATEDSTATEMENTS OF COMPREHENSIVE INCOME
Years Ended December 312015 2014
NET INCOME P=696,845,662 P=1,005,092,005
OTHER COMPREHENSIVE INCOME (LOSS)Items that may be reclassified to profit or loss in subsequent periods:
Net change in unrealized loss on available-for-sale investments (Note 7) 25,640,115 99,535,147
Cumulative translation adjustment 8,381,037 (12,023,678)Items that will not be reclassified to profit or loss in subsequent periods:
Remeasurement losses on retirement plan (Note 21) (31,301,476) (34,224,983)Benefit from income tax 9,390,443 34,933,556
OTHER COMPREHENSIVE INCOME FOR THE YEAR 12,110,119 88,220,042
TOTAL COMPREHENSIVE INCOME P=708,955,781 P=1,093,312,047
See accompanying Notes to Financial Statements.
*SGVFS016291*
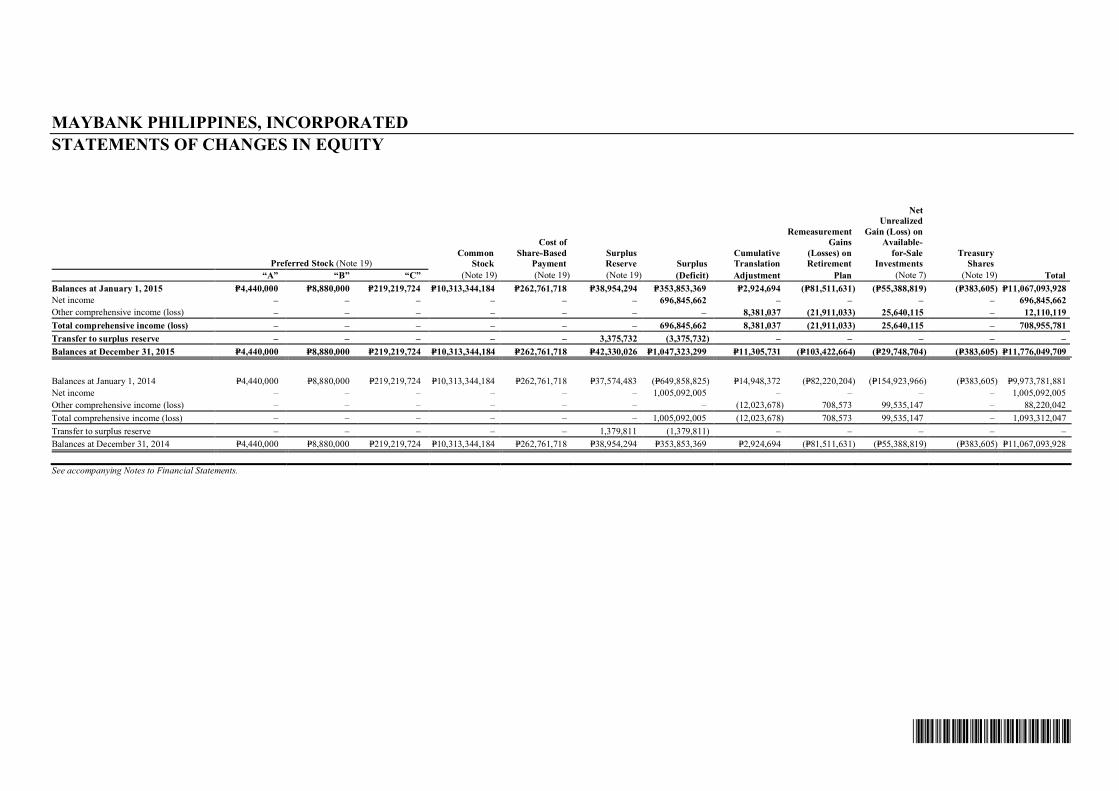
MAYBANK PHILIPPINES, INCORPORATEDSTATEMENTS OF CHANGES IN EQUITY
Preferred Stock (Note 19)Common
Stock
Cost ofShare-Based
PaymentSurplusReserve Surplus
CumulativeTranslation
RemeasurementGains
(Losses) onRetirement
NetUnrealized
Gain (Loss) onAvailable-
for-SaleInvestments
TreasuryShares
“A” “B” “C” (Note 19) (Note 19) (Note 19) (Deficit) Adjustment Plan (Note 7) (Note 19) TotalBalances at January 1, 2015 P=4,440,000 P=8,880,000 P=219,219,724 P=10,313,344,184 P=262,761,718 P=38,954,294 P=353,853,369 P=2,924,694 (P=81,511,631) (P=55,388,819) (P=383,605) P=11,067,093,928Net income – – – – – – 696,845,662 – – – – 696,845,662Other comprehensive income (loss) – – – – – – – 8,381,037 (21,911,033) 25,640,115 – 12,110,119Total comprehensive income (loss) – – – – – – 696,845,662 8,381,037 (21,911,033) 25,640,115 – 708,955,781Transfer to surplus reserve – – – – – 3,375,732 (3,375,732) – – – – –Balances at December 31, 2015 P=4,440,000 P=8,880,000 P=219,219,724 P=10,313,344,184 P=262,761,718 P=42,330,026 P=1,047,323,299 P=11,305,731 (P=103,422,664) (P=29,748,704) (P=383,605) P=11,776,049,709
Balances at January 1, 2014 P=4,440,000 P=8,880,000 P=219,219,724 P=10,313,344,184 P=262,761,718 P=37,574,483 (P=649,858,825) P=14,948,372 (P=82,220,204) (P=154,923,966) (P=383,605) P=9,973,781,881Net income – – – – – – 1,005,092,005 – – – – 1,005,092,005Other comprehensive income (loss) – – – – – – – (12,023,678) 708,573 99,535,147 – 88,220,042Total comprehensive income (loss) – – – – – – 1,005,092,005 (12,023,678) 708,573 99,535,147 – 1,093,312,047Transfer to surplus reserve – – – – – 1,379,811 (1,379,811) – – – – –Balances at December 31, 2014 P=4,440,000 P=8,880,000 P=219,219,724 P=10,313,344,184 P=262,761,718 P=38,954,294 P=353,853,369 P=2,924,694 (P=81,511,631) (P=55,388,819) (P=383,605) P=11,067,093,928
See accompanying Notes to Financial Statements.
*SGVFS016291*
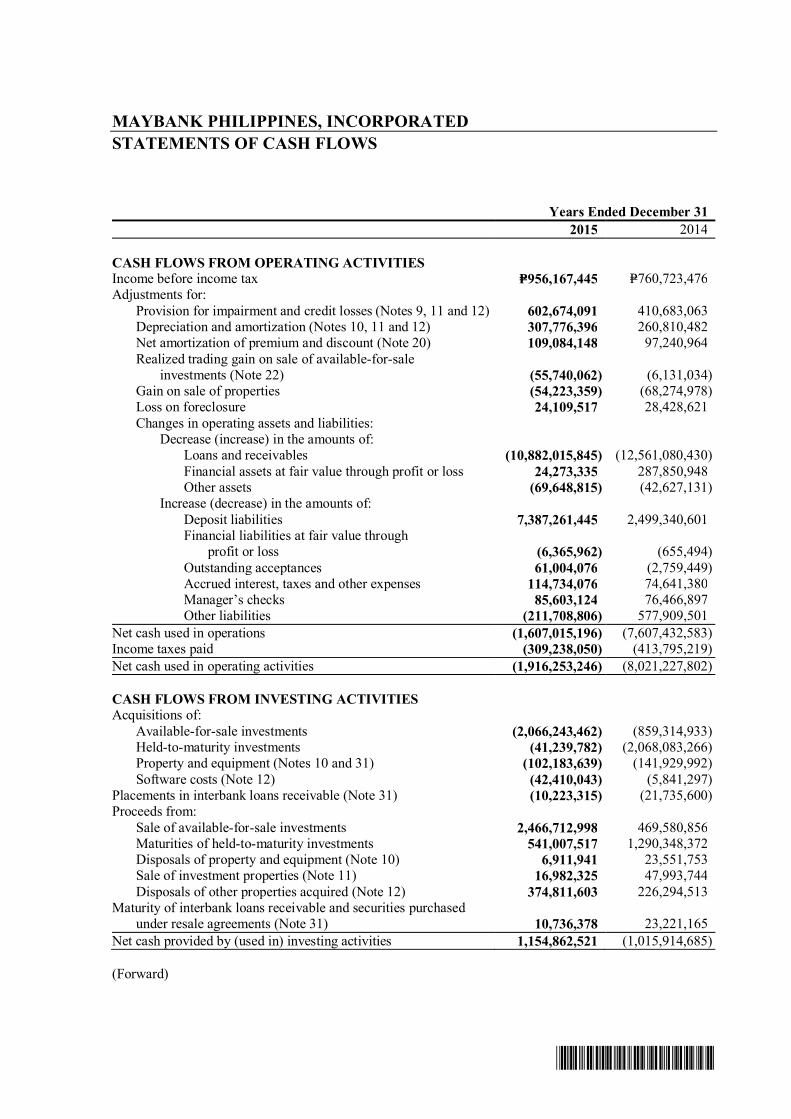
MAYBANK PHILIPPINES, INCORPORATEDSTATEMENTS OF CASH FLOWS
Years Ended December 312015 2014
CASH FLOWS FROM OPERATING ACTIVITIESIncome before income tax P=956,167,445 P=760,723,476Adjustments for:
Provision for impairment and credit losses (Notes 9, 11 and 12) 602,674,091 410,683,063Depreciation and amortization (Notes 10, 11 and 12) 307,776,396 260,810,482Net amortization of premium and discount (Note 20) 109,084,148 97,240,964Realized trading gain on sale of available-for-sale investments (Note 22) (55,740,062) (6,131,034)Gain on sale of properties (54,223,359) (68,274,978)Loss on foreclosure 24,109,517 28,428,621Changes in operating assets and liabilities:
Decrease (increase) in the amounts of:Loans and receivables (10,882,015,845) (12,561,080,430)Financial assets at fair value through profit or loss 24,273,335 287,850,948Other assets (69,648,815) (42,627,131)
Increase (decrease) in the amounts of:Deposit liabilities 7,387,261,445 2,499,340,601Financial liabilities at fair value through
profit or loss (6,365,962) (655,494)Outstanding acceptances 61,004,076 (2,759,449)Accrued interest, taxes and other expenses 114,734,076 74,641,380Manager’s checks 85,603,124 76,466,897Other liabilities (211,708,806) 577,909,501
Net cash used in operations (1,607,015,196) (7,607,432,583)Income taxes paid (309,238,050) (413,795,219)Net cash used in operating activities (1,916,253,246) (8,021,227,802)
CASH FLOWS FROM INVESTING ACTIVITIESAcquisitions of:
Available-for-sale investments (2,066,243,462) (859,314,933)Held-to-maturity investments (41,239,782) (2,068,083,266)Property and equipment (Notes 10 and 31) (102,183,639) (141,929,992)Software costs (Note 12) (42,410,043) (5,841,297)
Placements in interbank loans receivable (Note 31) (10,223,315) (21,735,600)Proceeds from:
Sale of available-for-sale investments 2,466,712,998 469,580,856Maturities of held-to-maturity investments 541,007,517 1,290,348,372Disposals of property and equipment (Note 10) 6,911,941 23,551,753Sale of investment properties (Note 11) 16,982,325 47,993,744Disposals of other properties acquired (Note 12) 374,811,603 226,294,513
Maturity of interbank loans receivable and securities purchasedunder resale agreements (Note 31) 10,736,378 23,221,165
Net cash provided by (used in) investing activities 1,154,862,521 (1,015,914,685)
(Forward)
*SGVFS016291*
- 2 -
Years Ended December 312015 2014
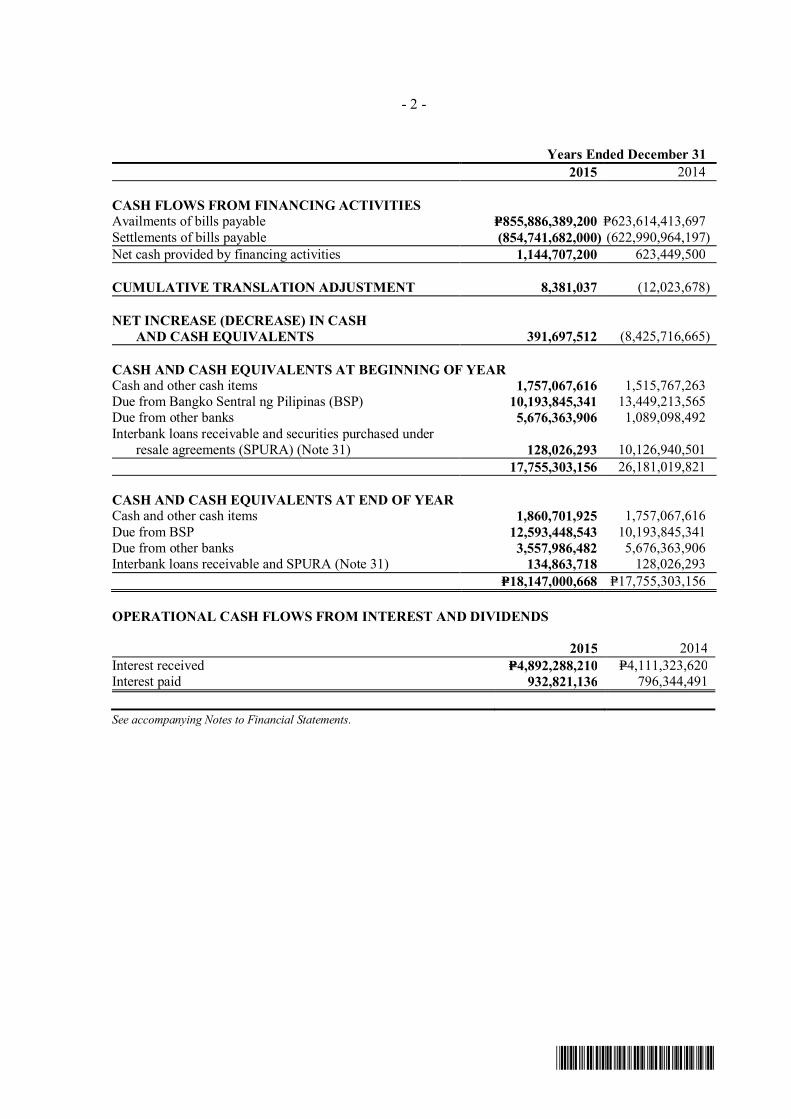
CASH FLOWS FROM FINANCING ACTIVITIESAvailments of bills payable P=855,886,389,200 P=623,614,413,697Settlements of bills payable (854,741,682,000) (622,990,964,197)Net cash provided by financing activities 1,144,707,200 623,449,500
CUMULATIVE TRANSLATION ADJUSTMENT 8,381,037 (12,023,678)
NET INCREASE (DECREASE) IN CASHAND CASH EQUIVALENTS 391,697,512 (8,425,716,665)
CASH AND CASH EQUIVALENTS AT BEGINNING OF YEARCash and other cash items 1,757,067,616 1,515,767,263Due from Bangko Sentral ng Pilipinas (BSP) 10,193,845,341 13,449,213,565Due from other banks 5,676,363,906 1,089,098,492Interbank loans receivable and securities purchased under
resale agreements (SPURA) (Note 31) 128,026,293 10,126,940,50117,755,303,156 26,181,019,821
CASH AND CASH EQUIVALENTS AT END OF YEARCash and other cash items 1,860,701,925 1,757,067,616Due from BSP 12,593,448,543 10,193,845,341Due from other banks 3,557,986,482 5,676,363,906Interbank loans receivable and SPURA (Note 31) 134,863,718 128,026,293
P=18,147,000,668 P=17,755,303,156
OPERATIONAL CASH FLOWS FROM INTEREST AND DIVIDENDS
2015 2014Interest received P=4,892,288,210 P=4,111,323,620Interest paid 932,821,136 796,344,491
See accompanying Notes to Financial Statements.

*SGVFS016291*
MAYBANK PHILIPPINES, INCORPORATEDNOTES TO FINANCIAL STATEMENTS
1. Corporate Information
Maybank Philippines, Incorporated (the Bank) is a commercial bank incorporated in thePhilippines on January 3, 1953 to provide banking services such as deposit products, loans andtrade finance, domestic and foreign fund transfers, treasury, foreign exchange and trust servicesthrough its 79 branches as of December 31, 2015 and 2014.
On October 12, 1999, the Securities and Exchange Commission (SEC) approved the extension ofthe corporate term of the Bank for another 50 years. The Bank is 99.97% owned by MalayanBanking Berhad (the “Parent Company”) incorporated in Malaysia.
The Bank’s principal and registered place of business is Maybank Corporate Centre, 7th Avenuecorner 28th Street, Bonifacio Global City, Taguig City.
The accompanying financial statements of the Bank were approved and authorized for issue by theBank’s Board of Directors (BOD) on March 29, 2016.
2. Summary of Significant Accounting Policies
Basis of PreparationThe accompanying financial statements have been prepared on a historical cost basis except forfinancial assets and financial liabilities at fair value through profit or loss (FVPL) and available-for-sale (AFS) investments that have been measured at fair value.
The financial statements of the Bank reflect the accounts maintained in the Regular Banking Unit(RBU) and Foreign Currency Deposit Unit (FCDU).
The functional currency of the RBU and FCDU is Philippine peso (PHP) and United States dollar(US$), respectively. For financial reporting purposes, FCDU accounts and foreign currency-denominated accounts in the RBU are translated into their equivalents in PHP (Note 2). Thefinancial statements of these units are combined after eliminating inter-unit accounts.
Amounts are presented to the nearest PHP unless otherwise stated.
Statement of ComplianceThe financial statements of the Bank have been prepared in compliance with Philippine FinancialReporting Standards (PFRS).
Presentation of Financial StatementsThe Bank presents its statement of financial position broadly in order of liquidity. An analysisregarding recovery (asset) or settlement (liability) within 12 months after the reporting date(current) and more than 12 months after the reporting date (non-current) is presented in Note 18.
- 2 -
*SGVFS016291*
Changes in Accounting Policies and DisclosuresThe accounting policies adopted are consistent with those of the previous financial year except forthe adoption of the following new and amended standards effective January 1, 2015. Unlessotherwise indicated, the adoption of the following new and amended standards and interpretationsdid not have an impact on the Bank’s financial statements.
PAS 19, Employee Benefits - Defined Benefit Plans: Employee Contributions (Amendments)PAS 19 requires an entity to consider contributions from employees or third parties whenaccounting for defined benefit plans. Where the contributions are linked to service, they should beattributed to periods of service as a negative benefit. These amendments clarify that, if the amountof the contributions is independent of the number of years of service, an entity is permitted torecognize such contributions as a reduction in the service cost in the period in which the service isrendered, instead of allocating the contributions to the periods of service. This amendment iseffective for annual periods beginning on or after July 1, 2014.
Annual Improvements to PFRSs (2010-2012 cycle)
PFRS 2, Share-based Payment - Definition of Vesting Condition
This improvement is applied prospectively and clarifies various issues relating to the definitions ofperformance and service conditions which are vesting conditions, including:
· A performance condition must contain a service condition· A performance target must be met while the counterparty is rendering service· A performance target may relate to the operations or activities of an entity, or to those of
another entity in the same group· A performance condition may be a market or non-market condition· If the counterparty, regardless of the reason, ceases to provide service during the vesting
period, the service condition is not satisfied.
PFRS 3, Business Combinations - Accounting for Contingent Consideration in a BusinessCombinationThe amendment is applied prospectively for business combinations for which the acquisition dateis on or after July 1, 2014. It clarifies that a contingent consideration that is not classified asequity is subsequently measured at fair value through profit or loss whether or not it falls withinthe scope of PAS 39, Financial Instruments: Recognition and Measurement .
PFRS 8, Operating Segments - Aggregation of Operating Segments and Reconciliation of the Totalof the Reportable Segments’ Assets to the Entity’s AssetsThe amendments are applied retrospectively and clarify that:
· An entity must disclose the judgments made by management in applying the aggregationcriteria in the standard, including a brief description of operating segments that have beenaggregated and the economic characteristics (e.g., sales and gross margins) used to assesswhether the segments are ‘similar’.
· The reconciliation of segment assets to total assets is only required to be disclosed if thereconciliation is reported to the chief operating decision maker, similar to the requireddisclosure for segment liabilities.
- 3 -
*SGVFS016291*
PAS 16, Property, Plant and Equipment, and PAS 38, Intangible Assets - Revaluation Method -Proportionate Restatement of Accumulated Depreciation and AmortizationThe amendment is applied retrospectively and clarifies in PAS 16 and PAS 38 that the asset maybe revalued by reference to the observable data on either the gross or the net carrying amount. Inaddition, the accumulated depreciation or amortization is the difference between the gross andcarrying amounts of the asset.
PAS 24, Related Party Disclosures - Key Management PersonnelThe amendment is applied retrospectively and clarifies that a management entity, which is anentity that provides key management personnel services, is a related party subject to the relatedparty disclosures. In addition, an entity that uses a management entity is required to disclose theexpenses incurred for management services.
Annual Improvements to PFRSs (2011-2013 cycle)
PFRS 3, Business Combinations - Scope Exceptions for Joint ArrangementsThe amendment is applied prospectively and clarifies the following regarding the scope exceptionswithin PFRS 3:
· Joint arrangements, not just joint ventures, are outside the scope of PFRS 3.· This scope exception applies only to the accounting in the financial statements of the joint
arrangement itself.
PFRS 13, Fair Value Measurement - Portfolio ExceptionThe amendment is applied prospectively and clarifies that the portfolio exception in PFRS 13 canbe applied not only to financial assets and financial liabilities, but also to other contracts within thescope of PAS 39.
PAS 40, Investment PropertyThe amendment is applied prospectively and clarifies that PFRS 3, and not the description ofancillary services in PAS 40, is used to determine if the transaction is the purchase of an asset orbusiness combination. The description of ancillary services in PAS 40 only differentiates betweeninvestment property and owner-occupied property (i.e., property, plant and equipment).
Significant Accounting Policies
Foreign Currency TranslationTransactions and balancesThe books of accounts of the RBU are maintained in PHP, while those of the FCDU aremaintained in US$. For financial reporting purposes, the foreign currency-denominated accountsin the RBU are translated into their equivalents in PHP based on the Philippine Dealing System(PDS) closing rate prevailing at the end of the year (for assets and liabilities) and at the exchangerates prevailing at transaction dates (for income and expenses). Foreign exchange differencesarising from foreign currency translation and revaluation of foreign currency-denominated assetsand liabilities in the RBU, except for nonmonetary assets, are credited to or charged againstoperations in the year in which the rates change.
Non-monetary items that are measured in terms of historical cost in a foreign currency aretranslated using the exchange rates as at the dates of the initial transactions. Non-monetary itemsmeasured at fair value in a foreign currency are translated using the exchange rates at the datewhen the fair value was determined.
- 4 -
*SGVFS016291*
FCDUAs at the reporting date, the assets and liabilities of the FCDU are translated into the Bank’spresentation currency at the PDS closing rate prevailing at the reporting date, and its income andexpenses are translated at the exchange rates prevailing at transaction dates. Exchange differencesarising on translation are taken directly to other comprehensive income (OCI) under ‘Cumulativetranslation adjustment’ in the statement of comprehensive income.
Fair Value MeasurementFair value is the price that would be received to sell an asset or paid to transfer a liability in anorderly transaction between market participants at the measurement date. The fair valuemeasurement is based on the presumption that the transaction to sell the asset or transfer theliability takes place either:
· in the principal market for the asset or liability, or· in the absence of a principal market, in the most advantageous market for the asset or liability.
The principal or the most advantageous market must be accessible to the Bank. The fair value ofan asset or a liability is measured using the assumptions that market participants would use whenpricing the asset or liability, assuming that market participants act in their economic best interest.A fair value measurement of a non-financial asset takes into account a market participant's abilityto generate economic benefits by using the asset in its highest and best use or by selling it toanother market participant that would use the asset in its highest and best use.
The Bank uses valuation techniques that are appropriate in the circumstances and for whichsufficient data are available to measure fair value, maximizing the use of relevant observableinputs and minimizing the use of unobservable inputs.
All assets and liabilities for which fair value is measured or disclosed in the financial statementsare categorized within the fair value hierarchy, described as follows, based on the lowest levelinput that is significant to the fair value measurement as a whole:
· Level 1 - Quoted (unadjusted) market prices in active markets for identical assets or liabilities.· Level 2 - Valuation techniques for which the lowest level input that is significant to the fair
value measurement is directly or indirectly observable.· Level 3 - Valuation techniques for which the lowest level input that is significant to the fair
value measurement is unobservable.
For assets and liabilities that are recognized in the financial statements on a recurring basis, theBank determines whether transfers have occurred between Levels in the hierarchy by re-assessingcategorization (based on the lowest level input that is significant to the fair value measurement as awhole) at the end of each reporting period.
Cash and Cash EquivalentsFor purposes of reporting cash flows, cash and cash equivalents include cash and other cash items,foreign currency notes and coins, petty cash fund, due from BSP and other banks, interbank loansreceivable and securities purchased under resale agreements (SPURA) with the BSP that areconvertible to known amounts of cash with original maturities of three months or less from datesof placements and that are subject to an insignificant risk of changes in value.
- 5 -
*SGVFS016291*
Financial Instruments - Initial Recognition and Subsequent MeasurementDate of recognitionRegular way purchases and sales of financial assets that require delivery of assets within the timeframe established by regulation or convention in the marketplace are recognized on settlementdate. Settlement date accounting refers to (a) the recognition of an asset on the day it is receivedby the Bank, and (b) the derecognition of an asset and recognition of any gain or loss on disposalon the day that it is delivered by the Bank. Any change in fair value of financial asset isrecognized in the statement of income for financial assets at FVPL and it is recognized in OCI forassets classified as AFS investments. Deposits, amounts due to banks and customers and loansand receivables are recognized when cash is received by the Bank or advanced to the borrowers.
Derivatives are recognized on trade date basis. Trade date is the date that an entity commits itselfto purchase or sell an asset. Trade date accounting refers to (a) the recognition of an asset to bereceived or the liability to be paid on the trade date, and (b) the derecognition of an asset that issold, recognition of any gain or loss on disposal and the recognition of a receivable from the buyerfor payment on the trade date.
Initial recognition of financial instrumentsAll financial assets and financial liabilities are recognized initially at fair value plus, in the case offinancial assets and financial liabilities not at FVPL, any directly attributable cost of acquisition orissue. The Bank classifies its financial assets in the following categories: financial assets at FVPL,AFS investments, held-to-maturity (HTM) investments and loans and receivables. Theclassification depends on the purpose for which the investments were acquired and whether theyare quoted in an active market. Financial liabilities are categorized into financial liabilities atFVPL and other financial liabilities carried at amortized cost. Management determines theclassification of its investments at initial recognition and, where allowed and appropriate, re-evaluates such designation at every reporting date.
Reclassification of financial assetsThe Bank may choose to reclassify a non-derivative trading financial asset out of the held-for-trading (HFT) category if the financial asset is no longer held for purposes of selling it in the nearterm and only in rare circumstances arising from a single event that is unusual and highly unlikelyto recur in the near term. In addition, the Bank may choose to reclassify financial assets thatwould meet the definition of loans and receivables out of the HFT or AFS investments categoriesif the Bank has the intention and ability to hold these financial assets for the foreseeable future oruntil maturity at the date of reclassification.
The Bank may also reclassify certain AFS investments to HTM investments when there is achange of intention and the Bank has the ability to hold the financial instruments to maturity.
For a financial asset reclassified out of the AFS category, any previous gain or loss on that assetthat has been recognized in equity is amortized to profit or loss over the remaining life of theinvestment using the effective interest rate (EIR). Any difference between the new amortized costand the expected cash flows is also amortized over the remaining life of the asset using the EIR. Ifthe asset is subsequently determined to be impaired then the amount recorded directly in equity isrecycled to the statement of income.
Reclassifications are made at fair value as of the reclassification date. Fair value becomes the newcost or amortized cost as applicable, and no reversals of fair value gains or losses recorded beforereclassification date are subsequently made. EIR for financial assets reclassified to loans andreceivables and HTM categories is determined at the reclassification date. Further increases inestimates of cash flows adjust EIR prospectively.
- 6 -
*SGVFS016291*
‘Day 1’ differenceWhere the transaction price in a non-active market is different from the fair value based on otherobservable current market transactions in the same instrument or based on a valuation techniquewhose variables include only data from observable market, the Bank recognizes the differencebetween the transaction price and the fair value (a ‘Day 1’ difference) in the statement of incomein ‘Net trading gains (losses)’ unless it qualifies for recognition as some other type of asset. Incases where transaction price used is made of data which is not observable, the difference betweenthe transaction price and model value is only recognized in the statement of income when theinputs become observable or when the instrument is derecognized. For each transaction, the Bankdetermines the appropriate method of recognizing the ‘Day 1’ difference amount.
HFT investmentsHFT investments represent government securities purchased and held principally with theintention of selling them in the near term. These securities are classified under financial assets atFVPL and are carried at fair market value. Realized and unrealized gains and losses on theseinstruments are recognized as ‘Net trading gains (losses)’ in the statement of income. Interestearned on HFT investments is reported under ‘Interest income on financial investments’ in thestatement of income. Quoted market prices are used to determine the fair value of these financialinstruments.
Derivative instrumentsThe Bank enters into derivative contracts such as interest rate swaps and currency forwards asmeans of reducing or managing their respective interest and foreign exchange exposures. Suchderivative instruments classified as financial assets at FVPL are initially recorded at fair value onthe date at which the derivative contract is entered into and are subsequently remeasured at fairvalue. Any gains or losses arising from changes in fair value on derivative instruments that do notqualify for hedge accounting are taken directly to the statement of income under ‘Net trading gains(losses)’. Derivative instruments are carried as financial assets when the fair value is positive andas financial liabilities when the fair value is negative.
The Bank assesses the existence of an embedded derivative on the date it first becomes a party tothe contract, and performs re-assessment where there is a change to the contract that significantlymodifies the cash flows.
Embedded derivatives are bifurcated from their host contracts and carried at fair value with fairvalue changes being reported through profit or loss, when the entire hybrid contracts (composed ofboth the host contract and the embedded derivative) are not accounted for as financial instrumentsdesignated at FVPL; when their economic risks and characteristics are not clearly and closelyrelated to those of their respective host contracts; and when a separate instrument with the sameterms as the embedded derivative would meet the definition of a derivative.
As of December 31, 2015 and 2014, the Bank has no outstanding embedded derivatives.
Financial instruments designated at FVPLFinancial instruments classified in this category are designated by management on initialrecognition when any of the following criteria is met:
· The designation eliminates or significantly reduces the inconsistent treatment that wouldotherwise arise from measuring the assets or liabilities or recognizing gains or losses on themon a different basis; or
- 7 -
*SGVFS016291*
· The assets and liabilities are part of a group of financial assets, financial liabilities or bothwhich are managed and their performance are evaluated on a fair value basis, in accordancewith a documented risk management or investment strategy; or
· The financial instrument contains an embedded derivative, unless the embedded derivativedoes not significantly modify the cash flows or it is clear, with little or no analysis, that itwould not be separately recorded.
Financial instruments designated at FVPL are initially recognized in the statement of financialposition at fair value. Changes in fair value on financial instruments designated at FVPL arerecorded in ‘Net trading gains (losses)’ in the statement of income. Interest earned or incurred isrecognized as ‘Interest income’ or ‘Interest expense’, respectively, in the statement of income.
HTM investmentsHTM investments are quoted non-derivative financial assets with fixed or determinable paymentsand fixed maturities that the Bank’s management has the positive intention and ability to hold tomaturity. Where the Bank sells other than an insignificant amount of HTM investments, the entirecategory would be tainted and reclassified as ‘AFS investments’. The Bank would then be unableto categorize financial instruments as HTM investments for the next two years.
After initial measurement, these investments are subsequently measured at amortized cost usingthe EIR method, less any impairment in value. Amortized cost is calculated by taking into accountany discount or premium on acquisition and fees that are an integral part of the EIR. Theamortization is included in the statement of income under ‘Interest income on financialinvestments’. The losses arising from impairment of such investments, if any, and effects ofrevaluation of foreign currency-denominated HTM investments are recognized in the statement ofincome.
Loans and receivablesThis category includes amounts due from BSP and other banks, interbank loans receivable andSPURA and loans and receivables. These are financial assets with fixed or determinable paymentsand fixed maturities that are not quoted in an active market. They are not entered into with theintention of immediate or short-term resale and are not designated as ‘Financial assets at FVPL’ or‘AFS investments’.
After initial measurement, ‘Loans and receivables’, ‘Due from BSP’, ‘Due from other banks’, and‘Interbank loans receivable and SPURA’ are subsequently measured at amortized cost using theEIR method, less allowance for impairment and credit losses. Amortized cost is calculated bytaking into account any discount or premium on acquisition and fees and costs that are an integralpart of the EIR. The amortization is included in ‘Interest income on loans and receivables’ in thestatement of income. The losses arising from impairment are recognized in ‘Provision forimpairment and credit losses’ in the statement of income.
When the estimated cash flows from the financial assets are revised, the carrying amount of thefinancial asset shall be adjusted to reflect the actual and revised estimated cash flows. Thecarrying amount shall be computed as the present value of estimated future cash flows at thefinancial instrument's original EIR or, when applicable, the revised EIR. Any difference shall berecognized in profit or loss as gain or loss on restructuring.
AFS investmentsAFS investments are those which are designated as such or do not qualify to be classified asdesignated as financial assets at FVPL, HTM investments or loans and receivables. They arepurchased and held indefinitely, and may be sold in response to liquidity requirements or changes
- 8 -
*SGVFS016291*
in market conditions. They include equity investments, money market papers, governmentsecurities and other debt securities.
After initial measurement, AFS investments are subsequently measured at fair value. The effectiveyield component of AFS debt securities, as well as the impact of revaluation on foreign currency-denominated AFS debt securities, is reported in the statement of income. The unrealized gains andlosses arising from the fair valuation of AFS investments are excluded, net of tax, from reportedincome and are reported as ‘Net change in unrealized gain (loss) on AFS investments’ in OCI.
When the security is disposed of, the cumulative gain or loss previously recognized in OCI isrecycled to the statement of income under ‘Net trading gains (losses)’. Where the Bank holdsmore than one investment in the same security, these are deemed to be disposed of on a first-in-first-out basis. Interest earned on holding AFS debt securities are reported as ‘Interest income onfinancial investments’ in the statement of income using the EIR method. Dividends earned onholding AFS equity securities are recognized in the statement of income as ‘Miscellaneousincome’ when the right to receive payment has been established. The losses arising fromimpairment of such investments are recognized as ‘Provision for impairment and credit losses’ inthe statement of income.
Financial liabilities at amortized costIssued financial instruments or their components, which are not designated at FVPL, are classifiedas liabilities under deposit liabilities, bills payable and other payables, where the substance of thecontractual arrangement results in the Bank having an obligation either to deliver cash or anotherfinancial asset to the holder, or to satisfy the obligation other than by the exchange of a fixedamount of cash or another financial asset for a fixed number of own equity shares. Thecomponents of issued financial instruments that contain both liability and equity elements areaccounted for separately, with the equity component being assigned the residual amount afterdeducting from the instrument as a whole the amount separately determined as the fair value of theliability component on the date of issue.
After initial measurement, deposit liabilities, bills payable and other payables not qualified as andnot designated as FVPL, are subsequently measured at amortized cost using the EIR method.Amortized cost is calculated by taking into account any discount or premium on the issue and feesthat are an integral part of the EIR.
Derecognition of Financial InstrumentsFinancial assetA financial asset (or, where applicable a part of a financial asset or part of a group of financialassets) is derecognized when:
· the rights to receive cash flows from the asset have expired;· the Bank retains the right to receive cash flows from the asset, but has assumed an obligation
to pay them in full without material delay to a third party under a “pass-through” arrangement;or
· the Bank has transferred its rights to receive cash flows from the asset and either (a) hastransferred substantially all the risks and rewards of the asset, or (b) has neither transferred norretained the risks and rewards of the asset but has transferred control over the asset.
When the Bank has transferred its rights to receive cash flows from an asset or has entered into apass-through arrangement, and has neither transferred nor retained substantially all the risks andrewards of the asset nor transferred control over the asset, the asset is recognized to the extent ofthe Bank’s continuing involvement in the asset. Continuing involvement that takes the form of a

- 9 -
*SGVFS016291*
guarantee over the transferred asset is measured at the lower of original carrying amount of theasset and the maximum amount of consideration that the Bank could be required to repay.
Financial liabilityA financial liability is derecognized when the obligation under the liability is discharged, cancelledor has expired. When an existing financial liability is replaced by another from the same lender onsubstantially different terms, or the terms of existing liability are substantially modified, such anexchange or modification is treated as derecognition of the original liability and the recognition ofa new liability, and the difference in the respective carrying amounts is recognized in the statementof income.
Repurchase and reverse repurchase agreementsSecurities sold under agreements to repurchase at a specified future date (‘repos’) are notderecognized from the statement of financial position. The corresponding cash received, includingaccrued interest, is recognized in the statement of financial position as a loan to the Bank,reflecting the economic substance of such transaction. The Bank had no outstanding repurchaseagreements as of December 31, 2015 and 2014.
Conversely, securities purchased under agreements to resell at a specified future date (‘reverserepos’) are not recognized in the statement of financial position. The Bank is not permitted to sellor repledge the securities in the absence of default by the owner of the collateral. Thecorresponding cash paid, including accrued interest, is recognized in the statement of financialposition as SPURA, and is considered a loan to the counterparty. The difference between thepurchase price and resale price is treated as interest income and is accrued over the life of theagreement using the EIR amortization method.
Impairment of Financial AssetsThe Bank assesses at each reporting date whether there is objective evidence that a financial assetor group of financial assets is impaired. A financial asset or a group of financial assets is deemedto be impaired if, and only if, there is objective evidence of impairment as a result of one or moreevents that has occurred after the initial recognition of the asset (an incurred ‘loss event’) and thatloss event (or events) has an impact on the estimated future cash flows of the financial asset or thegroup of financial assets that can be reliably estimated. Evidence of impairment may includeindications that the borrower or a group of borrowers is experiencing significant financialdifficulty, default or delinquency in interest or principal payments, the probability that they willenter bankruptcy or other financial reorganization and where observable data indicate that there ismeasurable decrease in the estimated future cash flows, such as changes in arrears or economicconditions that correlate with defaults.
Financial assets at amortized costFor loans and receivables, due from BSP, due from other banks and interbank loans receivable andSPURA, the Bank first assesses whether objective evidence of impairment exists individually forfinancial assets that are individually significant, or collectively for financial assets that are notindividually significant.
If there is objective evidence that an impairment loss has been incurred, the amount of the loss ismeasured as the difference between the assets’ carrying amount and the present value of theestimated future cash flows (excluding future credit losses that have not been incurred). Thecarrying amount of the asset is reduced through the use of an allowance account and the amount ofloss is charged against the statement of income. Interest income continues to be recognized basedon the original EIR of the asset. The financial assets, together with the associated allowanceaccounts, are written-off when there is no realistic prospect of future recovery and all collateral has

- 10 -
*SGVFS016291*
been realized. Subsequently, the amount of the estimated impairment loss decreases because of anevent occurring after the impairment was recognized, the previously recognized impairment loss isreduced by adjusting the allowance account. If a future write-off is later recovered, any amountsformerly charged are credited to the ‘Provision for impairment and credit losses’ account.
The present value of the estimated future cash flows is discounted at the financial asset’s originalEIR. If a financial asset has a variable interest rate, the discount rate for measuring anyimpairment loss is the current EIR, adjusted for the original credit risk premium. The calculationof the present value of the estimated future cash flows of a collateralized financial asset reflects thecash flows that may result from foreclosure less costs for obtaining and selling the collateral,whether or not foreclosure is probable.
If the Bank determines that no objective evidence of impairment exists for individually assessedfinancial asset, whether significant or not, it includes the asset in a group of financial assets withsimilar credit risk characteristics and collectively assesses them for impairment. Thosecharacteristics are relevant to the estimation of future cash flows for groups of such assets by beingindicative of the debtors’ ability to pay all amounts due according to the contractual terms of theassets being evaluated. Assets that are individually assessed for impairment and for which animpairment loss is, or continues to be, recognized are not included in a collective assessment forimpairment.
For the purpose of a collective impairment evaluation, financial assets are grouped on the basis ofsuch credit risk characteristics as industry, collateral type, past due status and term. Future cashflows in a group of financial assets that are collectively evaluated for impairment are estimated onthe basis of historical loss experience for assets with credit risk characteristics similar to those inthe Bank. Historical loss experience is adjusted on the basis of current observable data to reflectthe effects of current conditions that did not affect the period on which the historical lossexperience is based and to remove the effects of conditions in the historical period that do not existcurrently. Estimates of changes in future cash flows reflect, and are directionally consistent withchanges in related observable data from period to period (such as changes in property prices,payment status, or other factors that are indicative of incurred losses in the Bank and theirmagnitude).
The methodology and assumptions used for estimating future cash flows are reviewed regularly bythe Bank to reduce any differences between loss estimates and actual loss experience.
Restructured loansWhere possible, the Bank seeks to restructure loans rather than to take possession of collateral.This may involve extending the payment arrangements and the agreement of new loan conditions.Once the terms have been renegotiated, the loan is no longer considered past due. Managementcontinuously reviews restructured loans to ensure that all criteria are met and that future paymentsare likely to occur. The loans continue to be subjected to an individual or collective impairmentassessment, calculated using the loan’s original EIR. The difference between the recorded valueof the original loan and the present value of the restructured cash flows, discounted at the originalEIR, is recognized in ‘Provision for impairment and credit losses’ in the statement of income.
AFS investmentsFor AFS investments, the Bank assesses at each reporting date whether there is objective evidencethat a financial asset or group of financial assets is impaired.
In the case of equity securities classified as AFS investments, this would include a significant orprolonged decline in the fair value of the investments below its cost. When there is evidence of

- 11 -
*SGVFS016291*
impairment, the cumulative loss - measured as the difference between the acquisition cost and thecurrent fair value, less any impairment loss on that financial asset previously recognized in thestatement of income - is removed from OCI and recognized in the statement of income.Impairment losses on equity investments are not reversed through the statement of income.Increases in fair value after impairment are recognized directly in OCI.
In the case of debt instruments classified as AFS investments, impairment is assessed based on thesame criteria as financial assets carried at amortized cost. Future interest income is based on thereduced carrying amount and is accrued based on the rate of interest used to discount future cashflows for the purpose of measuring impairment loss. Such accrual is recorded as part of ‘Interestincome on financial investments’ in the statement of income. Subsequently, if the fair value of adebt instrument increased and the increase can be objectively related to an event occurring afterthe impairment loss was recognized in the statement of income, the impairment loss is reversedthrough the statement of income.
HTM investmentsFor HTM investments, the Bank assesses whether there is objective evidence of impairment ateach reporting date. If there is objective evidence that an impairment loss has been incurred, theamount of the loss is measured as the difference between the asset’s carrying amount and thepresent value of estimated future cash flows (excluding future expected credit losses that have notyet been incurred). The carrying amount of the asset is reduced through the use of an allowanceaccount and the amount of loss is charged to the statement of income. Interest income continues tobe recognized based on the original EIR of the asset. Subsequently, the amount of the estimatedimpairment loss decreases because of an event occurring after the impairment was recognized, anyamounts formerly charged are credited to ‘Provision for impairment and credit losses’ account inthe statement of income and the allowance account is reduced.
The HTM investments, together with the associated allowance accounts, are written-off whenthere is no realistic prospect of future recovery and all collateral has been realized.
Offsetting Financial InstrumentsFinancial assets and liabilities are offset and the net amount is reported in the statement offinancial position if, and only if, there is a currently enforceable legal right to set off therecognized amounts and there is an intention to settle on a net basis, or to realize the asset andsettle the liability simultaneously. This is not generally the case with master-netting agreements,and the related assets and liabilities are presented gross in the statement of financial position.
Financial GuaranteesIn the ordinary course of business, the Bank gives financial guarantees consisting of letters ofcredit, letters of guarantees, and acceptances. Financial guarantees are initially recognized in thefinancial statements at fair value under ‘Other liabilities’. Subsequent to initial recognition, theBank’s liabilities under such guarantees are each measured at the higher of the initial fair valueless, when appropriate, cumulative amortization calculated to recognize the fee in the statement ofincome in ‘Service charges, fees and commissions’, over the term of the guarantee, and the bestestimate of the expenditure required to settle any financial obligation arising as a result of theguarantee.
Any increase in the liability relating to financial guarantees is taken to the statement of income in‘Provision for impairment and credit losses’. Any financial guarantee liability remaining isrecognized in the statement of income in ‘Service charges, fees and commissions’, when theguarantee is discharged, cancelled or has expired.

- 12 -
*SGVFS016291*
Property and EquipmentDepreciable properties, including condominium units, furniture, fixtures and equipment andleasehold improvements, are stated at cost less accumulated depreciation and amortization, andany impairment in value. Such cost includes the cost of replacing part of the equipment if therecognition criteria are met, but excludes repairs and maintenance cost.
The initial cost of property and equipment consists of its purchase price, including taxes and anydirectly attributable costs of bringing the asset to its working condition and location for itsintended use. Expenditures incurred after the property and equipment have been put intooperation, such as repairs and maintenance are normally charged against operations in the year inwhich the costs are incurred. In situations where it can be clearly demonstrated that theexpenditures have resulted in an increase in the future economic benefits expected to be obtainedfrom the use of an item of property and equipment beyond its originally assessed standard ofperformance, the expenditures are capitalized as additional costs of property and equipment.
Depreciation and amortization are computed using the straight-line method over the estimateduseful life (EUL) of the assets.
The EUL of property and equipment are as follows:
Condominium units 50 yearsFurniture, fixtures and equipment 5-7 yearsLeasehold improvements 5 years or term of the lease,
whichever is shorter
Construction in progress (CIP) represents furniture, fixtures and equipment and leaseholdimprovements under construction or purchased by the Bank but not yet used in operations. CIP isnot depreciated until such time that the relevant assets become completed and ready for use inoperations.
The EUL and the depreciation and amortization method are reviewed periodically to ensure thatthe period and the method of depreciation and amortization are consistent with the expectedpattern of economic benefits from items of property and equipment.
The carrying values of property and equipment are reviewed for impairment when events orchanges in circumstances indicate the carrying value may not be recoverable. If any suchindication exists and where the carrying values exceed the estimated recoverable amount, animpairment loss is recognized in the statement of income (see accounting policy on Impairment ofNonfinancial Assets).
An item of property and equipment is derecognized upon disposal or when no future economicbenefits are expected from its use or disposal. Any gain or loss arising on derecognition of theasset (calculated as the difference between the net disposal proceeds and the carrying amount ofthe asset) is included in the statement of income in the year the asset is derecognized.

- 13 -
*SGVFS016291*
Investment PropertiesInvestment properties are measured initially at cost, including transaction costs. An investmentproperty acquired through an exchange transaction is measured at the fair value of the assetacquired unless the fair value of such an asset cannot be measured, in which case the investmentproperty acquired is measured at the fair value of the asset given up. Foreclosed properties areclassified under ‘Investment properties’ upon:
a. entry of judgment in case of judicial foreclosure;b. execution of the Sheriff’s Certificate of Sale in case of extra-judicial foreclosure; orc. notarization of the Deed of Dacion in case of payment in kind (dacion en pago).
The difference between the fair value of the foreclosed properties and the carrying value of therelated receivables given up is recognized in ‘Gain or loss on foreclosures’ account in thestatement of income.
Expenditures incurred after the investment properties have been put into operations, such asrepairs and maintenance costs, are normally charged to profit or loss in the year in which the costsare incurred.
Subsequent to initial recognition, land is carried at cost less any impairment in value whiledepreciable investment properties are carried at cost less accumulated depreciation and anyimpairment in value.
Depreciation is calculated on a straight-line basis over 5-10 years. The EUL and the depreciationmethod are reviewed periodically to ensure that the period and the method of depreciation areconsistent with the expected pattern of economic benefits from items of investment properties.
The carrying values of investment properties are reviewed for impairment when events or changesin circumstances indicate that the carrying value may not be recoverable. If any such indicationexists and where the carrying values exceed the estimated recoverable amount, the assets arewritten down to their recoverable amounts (see accounting policy on Impairment of NonfinancialAssets).
Transfers are made to investment properties when, and only when, there is a change in useevidenced by ending of owner occupation, commencement of an operating lease to another partyor ending construction or development. Transfers are made from investment properties when, andonly when, there is a change in use evidenced by commencement of owner occupation ordevelopment with a view to sale.
Investment properties are derecognized when they have either been disposed of or when theinvestment property is permanently withdrawn from use and no future benefit is expected from itsdisposal. Any gains or losses on the retirement or disposal of an investment property arerecognized in the statement of income under ‘Gain on sale of properties’ in the year of retirementor disposal.
Other Properties AcquiredOther properties acquired include chattel mortgage properties acquired in settlement of loanreceivables. These are carried at cost, which is the fair value at recognition date, less accumulateddepreciation and any impairment in value.

- 14 -
*SGVFS016291*
The Bank applies the cost model in accounting for other properties acquired. Depreciation iscomputed on a straight-line basis over the EUL of three years. The EUL and the depreciationmethod are reviewed periodically to ensure that the period and the method of depreciation areconsistent with the expected pattern of economic benefits from items of other properties acquired.
The carrying values of other properties acquired are reviewed for impairment when events orchanges in circumstances indicate that the carrying value may not be recoverable. If any suchindication exists and where the carrying values exceed the estimated recoverable amount, theassets are written down to their recoverable amounts (see accounting policy on Impairment ofNonfinancial Assets).
Intangible AssetsThe Bank’s intangible assets included under ‘Other assets’ in the statement of financial positionconsist of software costs.
Software costsCosts associated with developing or maintaining computer software programs are recognized asexpense as incurred. Costs that are directly associated with identifiable and unique softwarecontrolled by the Bank and will generate economic benefits beyond one year, are capitalized.Expenditure which enhances or extends the performance of computer software programs beyondtheir original specifications is recognized as capital improvements and added to the original cost ofthe software. Capitalized computer software costs are amortized on a straight-line basis over fouryears.
Impairment of Nonfinancial AssetsProperty and equipment, Investment properties, Other properties acquired and Software costsAt each reporting date, the Bank assesses whether there is any indication that its property andequipment, investment properties, other properties acquired and software costs may be impaired.When an indicator of impairment exists or when an annual impairment testing for an asset isrequired, the Bank makes a formal estimate of recoverable amount. Recoverable amount is thegreater of its fair value less costs to sell and value in use and is determined for an individual asset,unless the asset does not generate cash inflows that are largely independent of those from otherassets or groups of assets, in which case the recoverable amount is assessed as part of the cashgenerating unit to which it belongs. Where the carrying amount of an asset exceeds its recoverableamount, the asset is considered impaired and is written down to its recoverable amount. Inassessing value in use, the estimated future cash flows are discounted to their present value using apre-tax discount rate that reflects current market assessments of the time value of money and therisks specific to the asset. An impairment loss is charged to operations in the year in which itarises.
An assessment is made at each reporting date as to whether there is any indication that previouslyrecognized impairment losses may no longer exist or may have decreased. If such indicationexists, the recoverable amount is estimated. A previously recognized impairment loss is reversedonly if there has been a change in the estimates used to determine the asset’s recoverable amountsince the last impairment loss was recognized. If that is the case, the carrying amount of the assetis increased to its recoverable amount. That increased amount cannot exceed the carrying amountthat would have been determined, net of depreciation, had no impairment loss been recognized forthe asset in prior years. Such reversal is recognized in the statement of income. After such areversal, the depreciation expense is adjusted in future years to allocate the asset’s revised carryingamount, less any residual value, on a systematic basis over its remaining life.

- 15 -
*SGVFS016291*
Income TaxesIncome tax on profit or loss for the year comprises current and deferred tax. Income tax isdetermined in accordance with Philippine Tax Law. Income tax is recognized in the statement ofincome, except to the extent that it relates to items directly in OCI.
Current taxCurrent tax assets and liabilities for the current and prior periods are measured at the amountexpected to be recovered from or paid to the taxation authorities. The tax rates and tax laws usedto compute the amount are those that are enacted or substantively enacted at the reporting date.
Deferred taxDeferred tax is provided using the balance sheet liability method on all temporary differences atthe reporting date between the tax bases of assets and liabilities and their carrying amounts forfinancial reporting purposes.
Deferred tax liabilities are recognized for all taxable temporary differences, with certainexceptions. Deferred tax assets are recognized for all deductible temporary differences,carryforward of unused tax credits from excess minimum corporate income tax (MCIT) overregular corporate income tax (RCIT) and unused net operating loss carryover (NOLCO), to theextent that it is probable that taxable income will be available against which the deductibletemporary differences and carryforward of unused MCIT over RCIT and unused NOLCO can beutilized. Deferred tax, however, is not recognized when it arises from the initial recognition of anasset or liability in a transaction that is not a business combination and, at the time of thetransaction, affects neither the accounting income nor taxable income.
The carrying amount of deferred tax assets is reviewed at each reporting date and reduced to theextent that it is no longer probable that sufficient taxable income will be available to allow all orpart of the deferred tax asset to be utilized. Unrecognized deferred tax assets are reassessed ateach reporting date and are recognized to the extent that it has become probable that future taxableincome will allow the deferred tax asset to be recovered.
Deferred tax assets and liabilities are measured at the tax rates that are applicable to the periodwhen the asset is realized or the liability is settled, based on tax rates (and tax laws) that have beenenacted or substantively enacted at the reporting date.
Deferred tax relating to items recognized directly in OCI is also recognized in OCI and not in thestatement of income.
Share-Based Payment TransactionsEmployees of the Bank receive remuneration in the form of share-based payment transactions,whereby employees render services as consideration for equity instruments.
Equity-settled transactionsThe cost of equity-settled transactions with employees is measured by reference to the fair value atthe date on which they are granted. The fair value is determined by an external valuation expertusing a binomial model. In valuing equity-settled transactions, no account is taken of anyperformance conditions, other than conditions linked to the price of the shares of the ParentCompany.
The cost of equity-settled transactions is recognized in the statement of income together with acorresponding increase in equity, over the period in which the performance and/or serviceconditions are fulfilled, ending on the vesting date. The cumulative expense recognized for
- 16 -
*SGVFS016291*
equity-settled transactions at each reporting date until the vesting date reflects the extent to whichthe vesting period has expired and the Bank’s best estimate of the number of equity instrumentsthat will ultimately vest.
No expense is recognized for awards that do not ultimately vest.
Where the terms of an equity-settled award are modified, as a minimum, an expense is recognizedas if the terms had not been modified. In addition, an expense is recognized for any modification,which increases the total fair value of the share-based payment arrangement, or is otherwisebeneficial to the employee as measured at the date of modification.
Where an equity-settled award is cancelled, it is treated as if it had vested on the date ofcancellation, and any expense not yet recognized for the award is recognized immediately.
Treasury SharesOwn equity instruments which are acquired (treasury shares) are deducted from equity andaccounted for at weighted average cost. No gain or loss is recognized in the statement of incomeon the purchase and sale of the Bank’s own equity instruments.
Borrowing CostsBorrowing costs are recognized as expense in the year in which these costs are incurred using theEIR method.
Revenue RecognitionRevenue is recognized to the extent that it is probable that the economic benefits will flow to theBank and the revenue can be reliably measured. The Bank assesses its revenue arrangementsagainst specific criteria in order to determine if it is acting as principal or agent. The Bank hasconcluded that it is acting as a principal in all of its revenue arrangements. The following specificrecognition criteria must also be met before revenue is recognized:
Interest incomeFor all financial instruments measured at amortized cost and interest-bearing financial instrumentsclassified as AFS investments, interest income is recorded at the EIR, which is the rate that exactlydiscounts estimated future cash payments or receipts through the expected life of the financialinstrument or a shorter period, where appropriate, to the net carrying amount of the financial assetor financial liability. When calculating the EIR, the Bank estimates cash flows from the financialinstrument (for example, prepayment options), and includes any fees or incremental costs that aredirectly attributable to the instrument and are an integral part of the EIR, but not future creditlosses. The adjusted carrying amount is calculated based on the original EIR. The change incarrying amount is recorded as ‘Interest income’ in the statement of income.
Unearned discounts on loans are recognized as income over the terms of the loans using the EIR.Once the recorded value of a financial asset or a group of similar financial assets has been reduceddue to an impairment loss, interest income continues to be recognized using the original EIRapplied to the new carrying amount.
Gain (loss) on sale of propertiesGains or losses arising from the disposal of property and equipment, investment properties andother properties acquired shall be determined as the difference between the net disposal proceedsand the carrying amount of the asset and shall be recognized in profit or loss in the period of thedisposal.
- 17 -
*SGVFS016291*
Service chargesService charges are recognized only upon collection or accrued when there is reasonable degree ofcertainty as to its collectability.
Fees and commissionsFees earned for the provision of services over a period of time are accrued over that period. Loancommitment fees are recognized as earned over the term of the credit lines granted to eachborrower. However, loan commitment fees for loans that are likely to be drawn down are deferred(together with any incremental costs) and recognized as an adjustment to the EIR on the loan.Loan syndication fees are recognized in the statement of income when the syndication has beencompleted and the Bank retains no part of the loans for itself or retains part at the same EIR as forthe other participants.
Net trading gains (losses)Net trading gain (loss) represents results arising from trading activities including all gains andlosses from changes in fair value of financial assets and liabilities at FVPL and gains and lossesfrom disposal of financial assets at FVPL and AFS investments.
Rental incomeRental income arising on leased premises is accounted for on a straight-line basis over the leaseterms on ongoing leases and is recorded in the statement of income under ‘Miscellaneous income’.
Dividend incomeDividend income is recognized when the Bank’s right to receive payment is established.
Other incomeCredit-related income due to late payments and other loan-related fees are recognized in the periodthey are earned.
ExpensesExpenses encompass losses as well as those expenses that arise in the course of the ordinaryactivities of the Bank. Expenses are recognized when incurred.
LeasesThe determination of whether an arrangement is, or contains a lease is based on the substance ofthe arrangement and requires an assessment of whether the fulfillment of the arrangement isdependent on the use of a specific asset or assets and the arrangement conveys a right to use theasset. A reassessment is made after inception of the lease only if one of the following applies:
a. There is a change in contractual terms, other than a renewal or extension of the arrangement;b. A renewal option is exercised or extension granted, unless that term of the renewal or
extension was initially included in the lease term;c. There is a change in the determination of whether fulfillment is dependent on a specified asset;
ord. There is a substantial change to the asset.
Where a reassessment is made, lease accounting shall commence or cease from the date when thechange in circumstances gave rise to the reassessment for scenarios a, c or d above, and at the dateof renewal or extension period for scenario b.

- 18 -
*SGVFS016291*
Bank as lesseeLeases where the lessor retains substantially all the risks and benefits of ownership of the asset areclassified as operating leases. Operating lease payments are recognized as an expense under‘Occupancy’ in the statement of income on a straight-line basis over the lease term.
Bank as lessorLeases where the Bank does not transfer substantially all the risks and rewards of ownership of theassets are classified as operating lease. Lease payments received are recognized as an income inthe statement of income on a straight-line basis over the lease term.
Retirement CostDefined benefit planThe Bank has a funded, noncontributory defined benefit plan administered by a trustee. A definedbenefit plan is a pension plan that defines an amount of pension benefit that an employee willreceive upon retirement, usually dependent on one or more factors such as age, years of serviceand compensation. The Bank’s retirement cost is determined using the projected unit creditmethod. The retirement cost is generally funded through payments to a trustee-administered fund,determined by periodic actuarial calculations.
The net defined benefit liability or asset is the aggregate of the present value of the defined benefitobligation at the end of the reporting period reduced by the fair value of plan assets (if any),adjusted for any effect of limiting a net defined benefit asset to the asset ceiling. The asset ceilingis the present value of any economic benefits available in the form of refunds from the plan orreductions in future contributions to the plan.
The cost of providing benefits under the defined benefit plans is actuarially determined using theprojected unit credit method.
Defined benefit costs comprise the following:
· Service cost· Net interest on the net defined benefit liability or asset· Remeasurements of net defined benefit liability or asset
Service costs which include current service costs, past service costs and gains or losses on non-routine settlements are recognized as expense in the statement of income. Past service costs arerecognized when plan amendment or curtailment occurs.
Net interest on the net defined benefit liability or asset is the change during the period in the netdefined benefit liability or asset that arises from the passage of time which is determined byapplying the discount rate based on government bonds to the net defined benefit liability or asset.Net interest on the net defined benefit liability or asset is recognized as expense or income in thestatement of income.
Remeasurements comprising actuarial gains and losses, return on plan assets (excluding netinterest on defined benefit asset) and any change in the effect of the asset ceiling (excluding netinterest on defined benefit liability) are recognized immediately in other comprehensive income inthe period in which they arise. Remeasurements are not reclassified to profit or loss in subsequentperiods. All remeasurements recognized in the other comprehensive income account‘Remeasurement gains (losses) on retirement plan’ are not reclassified to another equity account insubsequent periods.

- 19 -
*SGVFS016291*
Plan assets are assets that are held by a long-term employee benefit fund or qualifying insurancepolicies. Plan assets are not available to the creditors of the Bank, nor can they be paid directly tothe Bank. Fair value of plan assets is based on market price information. When no market price isavailable, the fair value of plan assets is estimated by discounting expected future cash flows usinga discount rate that reflects both the risk associated with the plan assets and the maturity orexpected disposal date of those assets (or, if they have no maturity, the expected period until thesettlement of the related obligations).
The Bank’s right to be reimbursed of some or all of the expenditure required to settle a definedbenefit obligation is recognized as a separate asset at fair value when and only whenreimbursement is virtually certain.
Defined contribution planThe Bank also contributes to its contributory, defined-contribution type staff provident plan basedon a fixed percentage of the employees’ salaries as defined in the plan. The contribution payableto a defined contribution plan is in proportion to the services rendered to the Bank by theemployees and is recorded as an expense under ‘Compensation and fringe benefits’ in thestatement of income. Unpaid contributions, if any, are recorded as a liability.
Termination benefitTermination benefits are employee benefits provided in exchange for the termination of anemployee’s employment as a result of either an entity’s decision to terminate an employee’semployment before the normal retirement date or an employee’s decision to accept an offer ofbenefits in exchange for the termination of employment.
A liability and expense for a termination benefit is recognized at the earlier of when the entity canno longer withdraw the offer of those benefits and when the entity recognizes the relatedrestructuring costs. Initial recognition and subsequent changes to termination benefits aremeasured in accordance with the nature of the employee benefit, as either post-employmentbenefits, short-term employee benefits, or other long-term employee benefits.
Employee leave entitlementEmployee entitlement to annual leave is recognized as a liability when the employees render theservices that increases their annual leave entitlement. The cost of accumulating annual leave aremeasured as the additional amount that the Bank expects to pay as a result of the unusedentitlement that has accumulated at the end of the reporting period.
ProvisionsProvisions are recognized when the Bank has a present obligation (legal or constructive) as a resultof a past event and it is probable that an outflow of assets embodying economic benefits will berequired to settle the obligation and a reliable estimate can be made of the amount of theobligation. When the Bank expects some or all of a provision to be reimbursed, for example,under an insurance contract, the reimbursement is recognized as a separate asset but only when thereimbursement is virtually certain. The expense relating to any provision is presented in thestatement of income, net of any reimbursement. If the effect of the time value of money ismaterial, provisions are determined by discounting the expected future cash flows at a pre-tax ratethat reflects current market assessments of the time value of money and, where appropriate, therisks specific to the liability. Where discounting is used, the increase in the provision due to thepassage of time is recognized as an ‘Interest expense’.
- 20 -
*SGVFS016291*
Contingent Liabilities and Contingent AssetsContingent liabilities are not recognized but are disclosed in the financial statements unless thepossibility of an outflow of assets embodying economic benefits is remote. Contingent assets arenot recognized but are disclosed in the notes to the financial statements when an inflow ofeconomic benefits is probable.
Events after the Reporting DatePost-year-end events that provide additional information about the Bank’s position at the reportingdate (adjusting event) is reflected in the financial statements. Post-year-end events that are notadjusting events, if any, are disclosed when material to the financial statements.
Fiduciary ActivitiesAssets and income arising from fiduciary activities together with related undertakings to returnsuch assets to customers are excluded from the financial statements where the Bank acts in afiduciary capacity such as nominee, trustee or agent.
EquityCapital stock (preferred stock and common stock) is measured at par value for all shares issuedand outstanding. When the shares are sold at a premium, the difference between the proceeds andthe par value is credited to ‘Capital Paid in Excess of Par Value’ account.
Deposit for stock subscription represents payment made on subscription of shares which cannot bedirectly credited to capital stock pending approval of the SEC of the increase in the authorizedcapital stock of the Bank.
‘Surplus’ represents accumulated earnings of the Bank.
Dividends on Common SharesDividends on common shares are recognized as a liability and deducted from equity whenapproved by the BOD. Dividends for the period that are approved after the reporting date are dealtwith as an event after the reporting date.
Future Changes in Accounting PoliciesThe Bank will adopt the new and amended standards and interpretations enumerated below whenthese become effective. Except as otherwise indicated, the Bank does not expect the adoption ofthese new and amended standards and interpretations to have significant impact on its financialstatements.
Philippine Interpretation IFRIC 15, Agreements for the Construction of Real EstateThis interpretation covers accounting for revenue and associated expenses by entities thatundertake the construction of real estate directly or through subcontractors. The interpretationrequires that revenue on construction of real estate be recognized only upon completion, exceptwhen such contract qualifies as construction contract to be accounted for under PAS 11 orinvolves rendering of services in which case revenue is recognized based on stage of completion.Contracts involving provision of services with the construction materials and where the risks andreward of ownership are transferred to the buyer on a continuous basis will also be accounted forbased on stage of completion.
The Securities and Exchange Commission (SEC) and the Financial Reporting Standards Council(FRSC) have deferred the effectivity of this interpretation until the final Revenue standard isissued by the International Accounting Standards Board (IASB) and an evaluation of the
- 21 -
*SGVFS016291*
requirements of the final Revenue standard against the practices of the Philippine real estateindustry is completed.
Annual Improvements to PFRSs (2011-2013 cycle)Effective January 1, 2016:
PAS 1, Presentation of Financial Statements - Disclosure Initiative (Amendments)The amendments are intended to assist entities in applying judgment when meeting thepresentation and disclosure requirements in PFRS. They clarify the following:
· That entities shall not reduce the understandability of their financial statements by eitherobscuring material information with immaterial information; or aggregating material itemsthat have different natures or functions
· That specific line items in the statement of income and OCI and the statement of financialposition may be disaggregated
· That entities have flexibility as to the order in which they present the notes to financialstatements
· That the share of OCI of associates and joint ventures accounted for using the equity methodmust be presented in aggregate as a single line item, and classified between those items thatwill or will not be subsequently reclassified to profit or loss
Early application is permitted and entities do not need to disclose the fact as the amendments areconsidered to be clarifications that do not affect an entity’s accounting policies or accountingestimates. The Bank is currently assessing the impact of these amendments in the financialstatements.
PAS 16, Property, Plant and Equipment, and PAS 38, Intangible Assets - Clarification ofAcceptable Methods of Depreciation and Amortization (Amendments)The amendments clarify the principle in PAS 16 and PAS 38 that revenue reflects a pattern ofeconomic benefits that are generated from operating a business (of which the asset is part) ratherthan the economic benefits that are consumed through use of the asset. As a result, a revenue-based method cannot be used to depreciate property, plant and equipment and may only be used invery limited circumstances to amortize intangible assets. The amendments are effectiveprospectively for annual periods beginning on or after January 1, 2016, with early adoptionpermitted.
PAS 16, Property, Plant and Equipment, and PAS 41, Agriculture - Bearer Plants (Amendments)The amendments change the accounting requirements for biological assets that meet the definitionof bearer plants. Under the amendments, biological assets that meet the definition of bearer plantswill no longer be within the scope of PAS 41. Instead, PAS 16 will apply. After initialrecognition, bearer plants will be measured under PAS 16 at accumulated cost (before maturity)and using either the cost model or revaluation model (after maturity). The amendments alsorequire that produce that grows on bearer plants will remain in the scope of PAS 41 measured atfair value less costs to sell. For government grants related to bearer plants, PAS 20, Accountingfor Government Grants and Disclosure of Government Assistance, will apply. The amendmentsare retrospectively effective for annual periods beginning on or after January 1, 2016, with earlyadoption permitted.
- 22 -
*SGVFS016291*
PAS 27, Separate Financial Statements - Equity Method in Separate Financial Statements(Amendments)The amendments will allow entities to use the equity method to account for investments insubsidiaries, joint ventures and associates in their separate financial statements. Entities alreadyapplying PFRS and electing to change to the equity method in its separate financial statements willhave to apply that change retrospectively.
For first-time adopters of PFRS electing to use the equity method in its separate financialstatements, they will be required to apply this method from the date of transition to PFRS. Theamendments are effective for annual periods beginning on or after January 1, 2016, with earlyadoption permitted.
PFRS 10, Consolidated Financial Statements and PAS 28, Investments in Associates and JointVentures - Sale or Contribution of Assets between an Investor and its Associate or Joint VentureThese amendments address an acknowledged inconsistency between the requirements in PFRS 10and those in PAS 28 (2011) in dealing with the sale or contribution of assets between an investorand its associate or joint venture. The amendments require that a full gain or loss is recognizedwhen a transaction involves a business (whether it is housed in a subsidiary or not).
A partial gain or loss is recognized when a transaction involves assets that do not constitute abusiness, even if these assets are housed in a subsidiary. These amendments are effective fromannual periods beginning on or after January 1, 2016.
PFRS 11, Joint Arrangements - Accounting for Acquisitions of Interests in Joint Operations(Amendments)The amendments to PFRS 11 require that a joint operator accounting for the acquisition of aninterest in a joint operation, in which the activity of the joint operation constitutes a business mustapply the relevant PFRS 3 principles for business combinations accounting. The amendments alsoclarify that a previously held interest in a joint operation is not remeasured on the acquisition of anadditional interest in the same joint operation while joint control is retained. In addition, a scopeexclusion has been added to PFRS 11 to specify that the amendments do not apply when theparties sharing joint control, including the reporting entity, are under common control of the sameultimate controlling party.
The amendments apply to both the acquisition of the initial interest in a joint operation and theacquisition of any additional interests in the same joint operation and are prospectively effectivefor annual periods beginning on or after January 1, 2016, with early adoption permitted.
PFRS 14, Regulatory Deferral AccountsPFRS 14 is an optional standard that allows an entity, whose activities are subject to rate-regulation, to continue applying most of its existing accounting policies for regulatory deferralaccount balances upon its first-time adoption of PFRS. Entities that adopt PFRS 14 must presentthe regulatory deferral accounts as separate line items on the statement of financial position andpresent movements in these account balances as separate line items in the statement of profit orloss and other comprehensive income. The standard requires disclosures on the nature of, andrisks associated with, the entity’s rate-regulation and the effects of that rate-regulation on itsfinancial statements. PFRS 14 is effective for annual periods beginning on or afterJanuary 1, 2016.
- 23 -
*SGVFS016291*
Annual Improvements to PFRSs (2012-2014 cycle)Effective January 1, 2016:
PFRS 5, Non-current Assets Held for Sale and Discontinued Operations - Changes in Methods ofDisposalThe amendment is applied prospectively and clarifies that changing from a disposal through sale toa disposal through distribution to owners and vice-versa should not be considered to be a new planof disposal, rather it is a continuation of the original plan. There is, therefore, no interruption ofthe application of the requirements in PFRS 5. The amendment also clarifies that changing thedisposal method does not change the date of classification.
PFRS 7, Financial Instruments: Disclosures - Servicing ContractsPFRS 7 requires an entity to provide disclosures for any continuing involvement in a transferredasset that is derecognized in its entirety. The amendment clarifies that a servicing contract thatincludes a fee can constitute continuing involvement in a financial asset. An entity must assess thenature of the fee and arrangement against the guidance in PFRS 7 in order to assess whether thedisclosures are required. The amendment is to be applied such that the assessment of whichservicing contracts constitute continuing involvement will need to be done retrospectively.However, comparative disclosures are not required to be provided for any period beginning beforethe annual period in which the entity first applies the amendments.
PFRS 7, Applicability of the Amendments to PFRS 7 to Condensed Interim Financial StatementsThis amendment is applied retrospectively and clarifies that the disclosures on offsetting offinancial assets and financial liabilities are not required in the condensed interim financial reportunless they provide a significant update to the information reported in the most recent annualreport.
PAS 19, Employee Benefits - regional market issue regarding discount rateThis amendment is applied prospectively and clarifies that market depth of high quality corporatebonds is assessed based on the currency in which the obligation is denominated, rather than thecountry where the obligation is located. When there is no deep market for high quality corporatebonds in that currency, government bond rates must be used.
PAS 34, Interim Financial Reporting - disclosure of information ‘elsewhere in the interimfinancial report’The amendment is applied retrospectively and clarifies that the required interim disclosures musteither be in the interim financial statements or incorporated by cross-reference between the interimfinancial statements and wherever they are included within the greater interim financial report(e.g., in the management commentary or risk report).
Effective January 1, 2018:
PFRS 9, Financial Instruments (2014 or final version)In July 2014, the final version of PFRS 9, Financial Instruments, was issued. PFRS 9 reflects allphases of the financial instruments project and replaces PAS 39, Financial Instruments:Recognition and Measurement, and all previous versions of PFRS 9. The standard introduces newrequirements for classification and measurement, impairment, and hedge accounting. PFRS 9 iseffective for annual periods beginning on or after January 1, 2018, with early applicationpermitted. Retrospective application is required, but comparative information is not compulsory.For hedge accounting, the requirements are generally applied prospectively, with some limitedexceptions. Early application of previous versions of PFRS 9 is permitted if the date of initial
- 24 -
*SGVFS016291*
application is before February 1, 2015. The Bank is currently assessing the impact of adopting thisstandard.
In addition, the International Accounting Standards Board (IASB) has issued the followingstandards that have not yet been adopted by the SEC and FRSC. The Bank is currently assessingthe impact of these new standards and plans to adopt them on their required effective dates onceadopted locally:
IFRS 15, Revenue from Contracts with CustomersIFRS 15 was issued in May 2014 and establishes a new five-step model that will apply to revenuearising from contracts with customers. Under IFRS 15 revenue is recognized at an amount thatreflects the consideration to which an entity expects to be entitled in exchange for transferringgoods or services to a customer. The principles in IFRS 15 provide a more structured approach tomeasuring and recognizing revenue.
The new revenue standard is applicable to all entities and will supersede all current revenuerecognition requirements under IFRS. Either a full or modified retrospective application isrequired for annual periods beginning on or after January 1, 2018 with early adoption permitted.
IFRS 16, LeasesOn January 13, 2016, the IASB issued its new standard, IFRS 16, Leases, which replacesInternational Accounting Standards (IAS) 16, the current lease standard, and the relatedInterpretations.
Under the new standard, lessees will no longer classify their leases as either operating or financeleases in accordance with IAS 16. Rather, lessees will apply the single-asset model. Under thismodel, lessees will recognize the asset and the related liabilities for most leases on their balancesheets, and subsequently, will depreciate the lease assets and recognize the interest on the leaseliabilities in their profit or loss. Leases with a term of 12 months or less or for which underlyingasset is of low value are exempted from these requirements.
The accounting for lessors is substantially unchanged as the new standard carries forward theprinciple of lessor accounting under IAS 17. Lessors, however will be required to disclose moreinformation in their financial statements, particularly on the risk exposure to residual value.
The new standard is effective for annual periods beginning on or after January 1, 2019. Entitiesmay early adopt IFRS 16 but only if they have also adopted IFRS 15. When adopting IFRS 16, anentity is permitted to use either a full retrospective or a modified retrospective approach, withoptions to use certain transition reliefs.
3. Significant Accounting Judgments and Estimates
The preparation of the financial statements in compliance with PFRS requires the Bank to makejudgments and estimates that affect the reported amounts of assets, liabilities, income andexpenses and disclosure of contingent assets and contingent liabilities. Future events may occurwhich will cause the judgments and assumptions used in arriving at the estimates to change. Theeffects of any change in judgments and estimates are reflected in the financial statements as theybecome reasonably determinable.

- 25 -
*SGVFS016291*
Judgments and estimates are continually evaluated and are based on historical experience andother factors, including expectations of future events that are believed to be reasonable under thecircumstances.
Judgmentsa. HTM investments
The Bank classifies quoted non-derivative financial assets with fixed or determinablepayments and fixed maturities as HTM investments. This classification requires significantjudgment. In making this judgment, the Bank evaluates its intention and ability to hold suchinvestments to maturity. If the Bank fails to keep these investments to maturity other than forspecific circumstances (such as selling an insignificant amount close to maturity), it will berequired to reclassify the entire class as ‘AFS investments’. The investments would thereforebe remeasured at fair value and not at amortized cost.
b. Fair value of financial instrumentsWhere the fair values of financial assets and financial liabilities recorded in the statements offinancial position cannot be derived from active markets, they are determined using a varietyof valuation techniques that include the use of mathematical models. The input to thesemodels is taken from observable markets where possible, but where this is not feasible, adegree of judgment is required in establishing fair values. The judgments includeconsiderations of liquidity and model inputs such as correlation and volatility for longer datedderivatives.
c. Functional currencyPAS 21, Effects of Changes in Foreign Exchange Rates, requires management to use itsjudgment to determine the FCDU’s functional currency such that it most faithfully representsthe economic effects of the underlying transactions, events and conditions that are relevant tothe Bank. In making this judgment, the Bank considers the following:
a. the currency that mainly influences sales prices for financial instruments and services (thiswill often be the currency in which prices for its financial instruments and services aredenominated and settled);
b. the currency in which funds from financing activities are generated; andc. the currency in which receipts from operating activities are usually retained.
d. Operating leasesBank as lesseeThe Bank has entered into leases on premises it uses for its operations. The Bank hasdetermined based on the evaluation of terms and conditions of the arrangements (i.e., the leasedoes not transfer the ownership of the asset to the lessee by the end of the lease term, thelessee has no option to purchase the asset at a price that is expected to be sufficiently lowerthan the fair value at the date the option is exercisable and the lease term is not for the majorpart of the asset’s economic life), that the lessor has retained all the significant risks andrewards of ownership of these properties which are leased out as operating leases.
e. Financial assets not quoted in an active marketThe Bank classifies financial assets by evaluating, among others, whether the asset is quotedor not in an active market. Included in the evaluation on whether a financial asset is quoted inan active market is the determination on whether quoted prices are readily and regularlyavailable, and whether those prices represent actual and regularly occurring markettransactions on an arm’s length basis.
- 26 -
*SGVFS016291*
f. ContingenciesThe Bank is currently involved in various legal proceedings. The estimate of the probablecosts for the resolution of these claims has been developed in consultation with outsidecounsel handling the Bank’s defense in these matters and is based upon an analysis ofpotential results. It is possible, however, that future results of operations could be materiallyaffected by changes in the estimates or in the effectiveness of the strategies relating to theseproceedings (see Note 28).
Estimatesa. Fair values of derivatives
The fair values of derivatives that are not quoted in active markets are determined usingvaluation techniques. Where valuation techniques are used to determine fair values, they arevalidated and periodically reviewed by qualified personnel independent of the area that createdthem.
To the extent practical, valuation models use only market observable data, however areas suchas credit risk (both own and counterparty) require management to make estimates. Changes inassumptions about these factors could affect the reported fair value of derivative instruments.
As of December 31, 2015 and 2014, the fair value of the Bank’s derivative assets amounted toP=50.4 million and P=24.4 million, respectively (see Notes 6 and 17). As of December 31, 2015and 2014, the fair value of the Bank’s derivative liabilities amounted to P=97.3 million andP=150.5 million, respectively (see Note 17).
b. Impairment of AFS debt securitiesThe Bank reviews its debt securities classified as AFS investments at each reporting date toassess whether they are impaired. This requires similar judgment as applied to the individualassessment of loans and receivables.
As of December 31, 2015 and 2014, the Bank’s AFS debt securities amounted to P=2.9 billionand P=3.2 billion, respectively. No allowance for impairment losses was recognized on AFSdebt securities (see Note 7).
c. Credit losses on loans and receivablesThe Bank reviews its loan portfolio to assess impairment at each reporting date. Indetermining whether an impairment loss should be recorded in the statements of income, inparticular, judgment by management is required in the estimation of the amount and timing offuture cash flows when determining the level of allowance required. Such estimates are basedon assumptions about a number of factors and actual results may differ, resulting in futurechanges to the allowance.
In addition to specific allowance against individually significant loans and receivables, theBank also makes a collective impairment assessment on exposures which, although notspecifically identified as requiring a specific allowance, have a greater risk of default thanwhen originally granted. This collective allowance is based on historical loss experience forassets with similar credit risk characteristics.
The carrying amount of the Bank’s loans and receivables as of December 31, 2015 and 2014amounted to P=59.5 billion and P=50.0 billion, respectively (see Note 9).
- 27 -
*SGVFS016291*
d. Impairment of property and equipment, investment properties, chattel properties acquired andsoftware costsThe Bank assesses impairment on assets whenever events or changes in circumstances indicatethat the carrying amount of an asset may not be recoverable. The factors that the Bankconsiders important which could trigger an impairment review include the following:
· significant underperformance relative to expected historical or projected future operatingresults;
· significant changes in the manner of use of the acquired assets or the strategy for overallbusiness; and
· significant negative industry or economic trends.
An impairment loss is recognized whenever the carrying amount of an asset exceeds itsrecoverable amount. The recoverable amount is determined based on the asset’s fair value lesscosts to sell and are estimated for individual assets.
As of December 31, 2015 and 2014, the carrying amount of the Bank’s property andequipment, investment properties, chattel properties acquired and software costs follow:
2015 2014Property and equipment (Note 10) P=579,120,358 P=651,290,997Investment properties (Note 11) 389,357,437 199,424,074Chattel properties acquired (Note 12) 309,174,604 215,167,621Software costs (Note 12) 53,501,892 25,009,466
e. Recognition of deferred tax assetsDeferred tax assets are recognized for all unused tax losses and temporary differences to theextent that it is probable that taxable income will be available against which losses can beutilized. Significant management judgment is required to determine the amount of deferredtax assets that can be recognized, based upon the likely timing and level of future taxableincome together with future tax planning strategies.
As of December 31, 2015 and 2014, the Bank recognized deferred tax assets amounting toP=764.4 million and P=638.8 million, respectively (see Note 26).
f. Estimated useful lives of property and equipment, investment properties, chattel propertiesacquired and software costsThe Bank reviews on an annual basis the EUL of property and equipment, investmentproperties, chattel properties acquired and software costs based on expected asset utilization asanchored on business plans and strategies that also consider expected future technologicaldevelopments and market behavior. It is possible that future results of operations could bematerially affected by changes in these estimates brought about by changes in the factorsmentioned. A reduction in the EUL of property and equipment, investment properties, chattelproperties acquired and software costs would decrease their respective balances and increasethe recorded depreciation and amortization expense.
The EUL of property and equipment, investment properties, chattel properties acquired andsoftware costs are discussed in Note 2.
- 28 -
*SGVFS016291*
g. Defined benefit retirement planThe cost of the defined benefit retirement plan as well as the present value of the definedbenefit obligation is determined using actuarial valuation. The actuarial valuation involvesmaking various assumptions. These include the determination of the discount rates, futuresalary increases and mortality rates. Due to the complexity of the valuation, the underlyingassumptions and its long-term nature, defined benefit obligations are highly sensitive tochanges in these assumptions. All assumptions are reviewed at each reporting date.
In determining the appropriate single weighted average discount rate, management considersthe interest rates of government securities, with extrapolated maturities corresponding to theexpected duration of the defined benefit obligation.
The mortality rate is based on publicly available mortality tables for the Philippines and ismodified accordingly with estimates of mortality improvements. Future salary increases arebased on expected future inflation rates. The details of the assumptions used in the actuarialvaluation are provided in Note 21.
The Bank’s net pension liability as of December 31, 2015 and 2014 amounted toP=386.9 million and P=343.1 million, respectively (see Note 21).
4. Financial Risk Management Objectives and Policies
General Risk Management StructureRisk Management structure within the Bank consists of three lines of defense consisting of risktaking units, risk control units, and Internal Audit. The Board of Directors (BOD), through theRisk Management Committee (RMC) performs overall supervision of risk management. Loanproposals and other transactions beyond the approval level of the management committees,particularly those involving directors, officers, stockholders and related interests (DOSRI), areelevated to the BOD, which is the highest authority within the Bank. The RMC is a Board-levelCommittee that is responsible for setting the Bank’s corporate risk policy and strategies. It ensuresthe adequacy of the risk management infrastructure of the Bank to address the risks it faces in itsbanking activities including credit, market and liquidity risks.
Senior Management also plays an integral role in ensuring proper implementation of risk policiesand strategies. The Bank has the following committees that manage the Bank’s key risk areas:· Credit Committee (CC) is responsible for the approval of credit facilities as well as policies,
frameworks and methodologies pertaining to credit risk.
· The CC has a maximum approving limit of P=250.0 million for secured and P=100.0 million forunsecured loans. Proposals beyond this level have to be escalated to Parent Bank’s GroupManagement’s Credit Committee (GMCC) for endorsement to BOD for approval.
· Asset and Liability Committee (ALCO) is responsible for recommending strategies, policiesand frameworks to identify, measure, control, monitor and manage market and liquidity risks,as well as balance sheet and capital management to the RMC/Board for approval.
· Management Committee is responsible for directing and reviewing the Bank’s overalloperations to achieve its objectives and targets.
- 29 -
*SGVFS016291*
Risk Management is functionally independent of risk-taking units within the Bank. It is composedof Regional Group Credit Management (RGCM), Credit Risk Management (CRM), Market RiskManagement (MRM), Operational Risk Management (ORM) and Enterprise Risk Management(ERM), Credit Risk Review, Credit Investigation and Appraisal, and Credit Risk PortfolioAnalytics (CRPA). It is responsible for the development of measures to ensure that the riskinherent in the Bank’s activities are properly identified, measured, controlled and reported.
Risk Management has the following general objectives:
· To promote risk management culture and philosophy of risk awareness
· To assist risk-taking business and operating units in understanding and measuring risk/returnprofiles
· To develop risk and control infrastructure
· To develop, disseminate, and maintain formalized risk policies, frameworks, methodologiesand tools
· To provide effective means of differentiating the degree of risk in the various businessportfolio of the Bank
Internal Audit provides independent assurance of the effectiveness of the risk managementapproach. The Audit Committee, which is a Board-level committee, is responsible for the overallsupervision of the audit function within the organization.
Risk Measurement and ReportingTo measure risk of default for corporate and commercial loans, the Bank makes use of theInternational Risk Rating System (IRRS) which consists of 25 risk grades that are mapped toexternal ratings, as well as risk classification according to BSP guidelines. The IRRS is used as atool for decision making as well as in determining appropriate pricing for loan accounts. The keyrisk indicators measures the Bank’s credit risk position against targets, historical performance orindustry average in selected areas as of a given period.
In terms of measuring the Bank’s ability to withstand the impact of stress conditions, stress testingmethodology is used. Through stress testing, the impact of exceptional events on the Bank’s assetquality, profitability and capital adequacy is measured.
In terms of reporting, CRPA prepares regular loan portfolio reports covering areas such asbusiness growth, asset quality, concentration of exposures and compliance to applicable regulatoryand internal guidelines. These reports are submitted to the CC, RMC, BOD and other end-users.
Risk MitigationAs part of its risk management, the Bank uses derivatives and other treasury products to manageexposures resulting from changes in interest rates.
Where appropriate, the Bank requires a second way out in the form of eligible collaterals orguarantee/surety to mitigate credit risk.
Credit RiskCredit risk comprises bulk of the Bank’s risk capital. Credit risk is managed through a two-pronged approach: the credit risk management and credit portfolio management.
- 30 -
*SGVFS016291*
Credit risk management undertakes the improvement and implementation of Group riskframeworks, tools, and methodologies for the identification, measurement, monitoring, control andpricing of credit risk in accordance to the Bank’s risk appetite and lending direction and strategies.Methodologies are implemented in coordination with the Parent Company to ensure consistency ofrisk management approach across the Maybank Group. Where applicable, methodologies andtools are adopted from the Parent Company and customized to the local operating environment.
Credit risk management is responsible for setting concentration limits and monitoring exposuresagainst these limits. The newly created CRPA Unit also prepares various credit risk reportssubmitted to Management, RMC, and the BOD. All loan products, policy and framework arecoursed through the Regional Group Credit Management and Credit Risk Management for review.
Part of the Bank’s Credit Risk Management processes are to develop and implement variousmechanisms to support business generation, capital optimization, portfolio management, andBasel III implementation. It ensures that credit approval structures follow the “four eyes policy”for appropriate check and balance. The Credit Review Unit undertakes the post-approval reviewof selected loan accounts.
Collateral and other credit enhancementsThere are various collaterals and securities that are acceptable to the Bank. In evaluatingacceptability of collateral, three factors are considered: control, disposability and margin.
The Account Officer is primarily responsible in ensuring the acceptability of collaterals/securityobtained to secure the loan based on established minimum acceptance criteria and maximummargin of financing.
The Account Officer is responsible in ensuring that the collaterals are duly and regularly inspectedand appraised; adequately insured where necessary; and payment of applicable taxes are updated.
The Account Officer also ensures that the approved margin of financing is maintained throughoutthe life of the loan.
Loans or portions thereof that are covered by collateral/security including but not limited to thefollowing are considered secured:
· Registered First Real Estate Mortgage over eligible real estate properties with road right ofway
· Peso or US Dollar-denominated deposits that are maintained with the Bank· Government securities· Motor vehicles· Machinery and equipment· Publicly-traded shares of stocks
Direct and indirect borrowings of the Philippine government is treated as non-risk and consideredas secured.
Borrowings secured by guarantees/collateral issued by the Parent Company, Maybank Branchesand subsidiaries are considered secured.
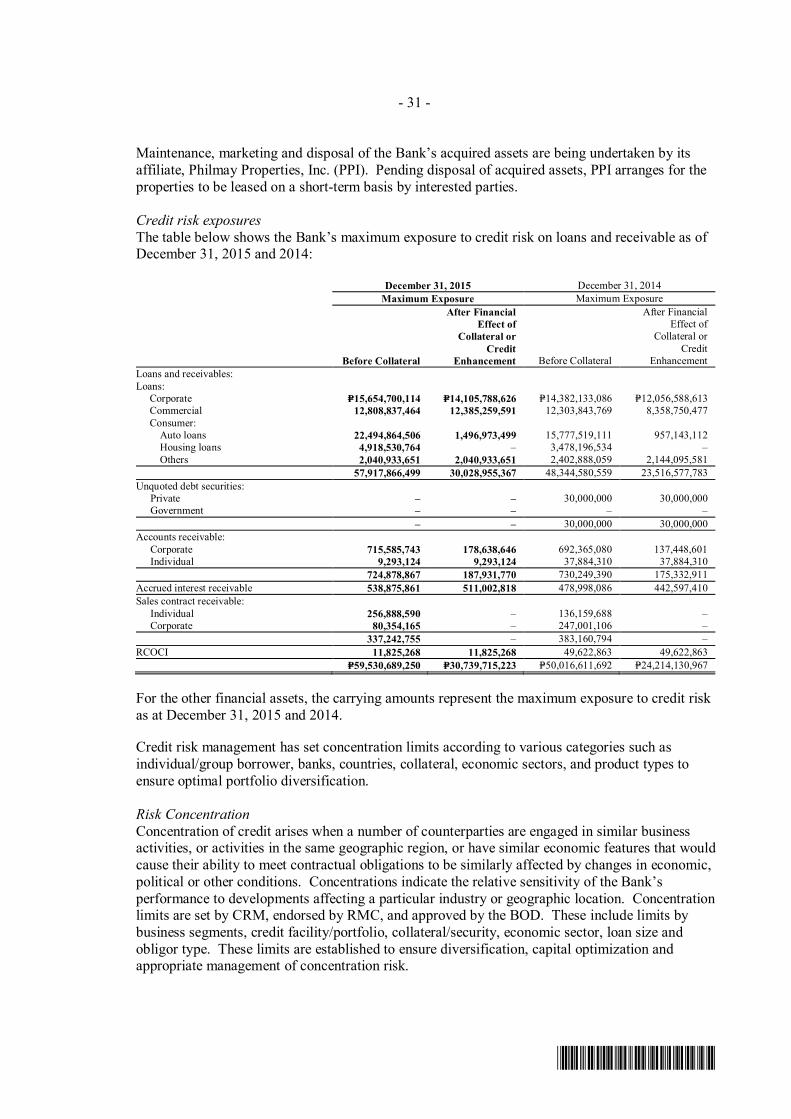
- 31 -
*SGVFS016291*
Maintenance, marketing and disposal of the Bank’s acquired assets are being undertaken by itsaffiliate, Philmay Properties, Inc. (PPI). Pending disposal of acquired assets, PPI arranges for theproperties to be leased on a short-term basis by interested parties.
Credit risk exposuresThe table below shows the Bank’s maximum exposure to credit risk on loans and receivable as ofDecember 31, 2015 and 2014:
December 31, 2015 December 31, 2014Maximum Exposure Maximum Exposure
Before Collateral
After FinancialEffect of
Collateral orCredit
Enhancement Before Collateral
After FinancialEffect of
Collateral orCredit
EnhancementLoans and receivables:Loans: Corporate P=15,654,700,114 P=14,105,788,626 P=14,382,133,086 P=12,056,588,613 Commercial 12,808,837,464 12,385,259,591 12,303,843,769 8,358,750,477 Consumer: Auto loans 22,494,864,506 1,496,973,499 15,777,519,111 957,143,112 Housing loans 4,918,530,764 – 3,478,196,534 – Others 2,040,933,651 2,040,933,651 2,402,888,059 2,144,095,581
57,917,866,499 30,028,955,367 48,344,580,559 23,516,577,783Unquoted debt securities: Private – – 30,000,000 30,000,000 Government – – – –
– – 30,000,000 30,000,000Accounts receivable: Corporate 715,585,743 178,638,646 692,365,080 137,448,601 Individual 9,293,124 9,293,124 37,884,310 37,884,310
724,878,867 187,931,770 730,249,390 175,332,911Accrued interest receivable 538,875,861 511,002,818 478,998,086 442,597,410Sales contract receivable: Individual 256,888,590 – 136,159,688 – Corporate 80,354,165 – 247,001,106 –
337,242,755 – 383,160,794 –RCOCI 11,825,268 11,825,268 49,622,863 49,622,863
P=59,530,689,250 P=30,739,715,223 P=50,016,611,692 P=24,214,130,967
For the other financial assets, the carrying amounts represent the maximum exposure to credit riskas at December 31, 2015 and 2014.
Credit risk management has set concentration limits according to various categories such asindividual/group borrower, banks, countries, collateral, economic sectors, and product types toensure optimal portfolio diversification.
Risk ConcentrationConcentration of credit arises when a number of counterparties are engaged in similar businessactivities, or activities in the same geographic region, or have similar economic features that wouldcause their ability to meet contractual obligations to be similarly affected by changes in economic,political or other conditions. Concentrations indicate the relative sensitivity of the Bank’sperformance to developments affecting a particular industry or geographic location. Concentrationlimits are set by CRM, endorsed by RMC, and approved by the BOD. These include limits bybusiness segments, credit facility/portfolio, collateral/security, economic sector, loan size andobligor type. These limits are established to ensure diversification, capital optimization andappropriate management of concentration risk.
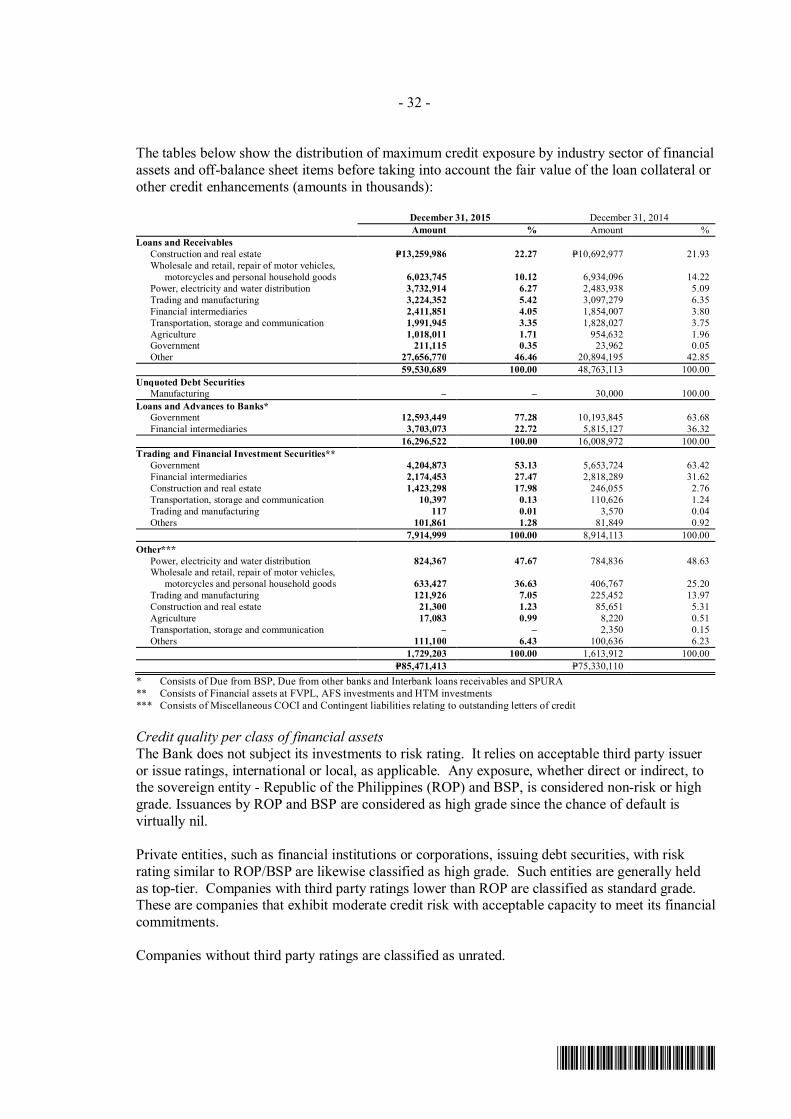
- 32 -
*SGVFS016291*
The tables below show the distribution of maximum credit exposure by industry sector of financialassets and off-balance sheet items before taking into account the fair value of the loan collateral orother credit enhancements (amounts in thousands):
December 31, 2015 December 31, 2014Amount % Amount %
Loans and Receivables Construction and real estate P=13,259,986 22.27 P=10,692,977 21.93 Wholesale and retail, repair of motor vehicles,
motorcycles and personal household goods 6,023,745 10.12 6,934,096 14.22 Power, electricity and water distribution 3,732,914 6.27 2,483,938 5.09 Trading and manufacturing 3,224,352 5.42 3,097,279 6.35 Financial intermediaries 2,411,851 4.05 1,854,007 3.80 Transportation, storage and communication 1,991,945 3.35 1,828,027 3.75 Agriculture 1,018,011 1.71 954,632 1.96 Government 211,115 0.35 23,962 0.05 Other 27,656,770 46.46 20,894,195 42.85
59,530,689 100.00 48,763,113 100.00Unquoted Debt Securities Manufacturing – – 30,000 100.00Loans and Advances to Banks* Government 12,593,449 77.28 10,193,845 63.68 Financial intermediaries 3,703,073 22.72 5,815,127 36.32
16,296,522 100.00 16,008,972 100.00Trading and Financial Investment Securities** Government 4,204,873 53.13 5,653,724 63.42 Financial intermediaries 2,174,453 27.47 2,818,289 31.62 Construction and real estate 1,423,298 17.98 246,055 2.76 Transportation, storage and communication 10,397 0.13 110,626 1.24 Trading and manufacturing 117 0.01 3,570 0.04 Others 101,861 1.28 81,849 0.92
7,914,999 100.00 8,914,113 100.00Other*** Power, electricity and water distribution 824,367 47.67 784,836 48.63 Wholesale and retail, repair of motor vehicles,
motorcycles and personal household goods 633,427 36.63 406,767 25.20 Trading and manufacturing 121,926 7.05 225,452 13.97 Construction and real estate 21,300 1.23 85,651 5.31 Agriculture 17,083 0.99 8,220 0.51 Transportation, storage and communication – – 2,350 0.15 Others 111,100 6.43 100,636 6.23
1,729,203 100.00 1,613,912 100.00P=85,471,413 P=75,330,110
* Consists of Due from BSP, Due from other banks and Interbank loans receivables and SPURA** Consists of Financial assets at FVPL, AFS investments and HTM investments*** Consists of Miscellaneous COCI and Contingent liabilities relating to outstanding letters of credit
Credit quality per class of financial assetsThe Bank does not subject its investments to risk rating. It relies on acceptable third party issueror issue ratings, international or local, as applicable. Any exposure, whether direct or indirect, tothe sovereign entity - Republic of the Philippines (ROP) and BSP, is considered non-risk or highgrade. Issuances by ROP and BSP are considered as high grade since the chance of default isvirtually nil.
Private entities, such as financial institutions or corporations, issuing debt securities, with riskrating similar to ROP/BSP are likewise classified as high grade. Such entities are generally heldas top-tier. Companies with third party ratings lower than ROP are classified as standard grade.These are companies that exhibit moderate credit risk with acceptable capacity to meet its financialcommitments.
Companies without third party ratings are classified as unrated.

- 33 -
*SGVFS016291*
For loans and receivables, the following are subject to risk rating.
· Corporate and commercial loans (except those fully secured by hold-out on deposits)· Contract-to-sell financing (risk rating on the developer)
Accounts which are not subjected to risk rating, such as consumer loans, are considered unrated.
Loan Grades· Performing Grade is from Grade 1 to 21. - Grade 1 (i.e. lowest probability of default) is the
best grade while Grade 21 (i.e. highest probability of default) is the worst grade.a.) High grade (accounts with risk grade of 1 to 10)
Accounts falling within this classification have good to highly exceptional capacity tomeet its financial commitments with very low to low credit risk.
b.) Standard grade (accounts with risk grade of 11 to 15)Accounts falling within this classification have fairly good to fairly acceptable capacity tomeet their financial commitments with moderate credit risk.
c.) Substandard grade (accounts with risk grade of 16 to 21)Accounts under this category exhibit high credit or default risk with impairmentcharacteristics that are neither classified under ‘past due but not impaired’ nor‘individually impaired’.
· Non-Performing Grade is from Grade 22 to 25 which is under past due or impaired.a.) Grade 22 is a non-performing grade assigned to borrowers classified as Loans Especially
Mentioned/Special Mention accounts. These are loans which have potential weaknessesthat deserve Management’s close attention. These potential weaknesses, if leftuncorrected, may affect the repayment of the loan and thus increase credit risk to theBank.
b.) Grade 23 is a non-performing grade assigned to borrowers classified as Substandardaccounts. These are loans or portions thereof which appear to involve substantial andunreasonable degree or risk to the institution because of unfavorable record orunsatisfactory characteristics. There exists in such loan the possibility of future loss to theinstitution unless given closer supervision. These loans classified as Substandard musthave a well-defined weaknesses that jeopardize their liquidation. Such well-definedweaknesses may include adverse trends of development or development of financial,managerial, economic or political nature or a significant weakness in collateral. Theirbasic characteristics are:
· Current loans to borrowers whose audited financial statements show impaired ornegative net worth except start-up firms which should be evaluated on case to casebasis.
· Current loan of borrowers with unfavorable results of operations for 2 consecutiveyears or with impaired/negative net worth except start - up firms which should beevaluated on case to case basis.
· Loans past due for more than 90 days.· Loans without latest audited financial statement to determine repayment capacity.

- 34 -
*SGVFS016291*
c.) Grade 24 is a non-performing grade assigned to borrowers classified as Doubtful accounts.These are loans or proportions thereof which have weaknesses inherent in those classifiedas Substandard with the added characteristics that existing facts, conditions and valuesmake collections or liquidation in full highly improbable and in which substantial loss isprobable. Example, past due loans wherein the possibility of loss is extremely high butbecause of certain important and reasonably specific pending factors that may work to theadvantage and strengthening of asset, its classification as an estimated loss is deferreduntil a more exact status is determined.
d.) Grade 25 is a non-performing grade assigned to borrowers classified as Loss.These are loans or portions thereof which are considered uncollectible or worthless.
· Start-up companies, regardless of the strength of their percentage have default grade cap of 19.
The tables below show the credit quality by class of financial assets (gross of allowance for creditlosses and unearned interest and discounts and other deferred income) of the Bank (in thousands):
December 31, 2015Neither Past Due nor Impaired
Standard Substandard Past Due orHigh Grade Grade Grade Unrated Impaired Total
Due from BSP P=12,593,449 P=– P=– P=– P=– P=12,593,449Due from other banks 3,557,986 – – – – 3,557,986Interbank loans receivable and
SPURA 145,087 – – – – 145,08716,296,522 – – – – 16,296,522
Financial assets at FVPL:HFT investments: Government securities 728,003 – – – – 728,003 Derivative assets 50,378 – – – – 50,378
778,381 – – – – 778,381AFS investments: Government securities 1,104,529 – – – – 1,104,529 Private debt securities − 202,016 − 1,583,662 − 1,785,678 Quoted equity securities − – – 10,390 – 10,390 Unquoted equity securities − – – 3,163 – 3,163
1,104,529 202,016 − 1,597,215 – 2,903,760HTM investments: Government securities 2,372,341 – – – – 2,372,341 Private debt securities − – – 1,860,516 – 1,860,516
2,372,341 – – 1,860,516 – 4,232,857Loans and receivables: Corporate 4,383,038 10,245,752 1,006,190 5,500 323,264 15,963,744 Commercial 3,350,254 6,676,767 1,566,660 868,035 882,419 13,344,135 Consumer: Auto loans – – – 22,141,414 559,369 22,700,783 Housing loans – – – 4,631,010 298,894 4,929,904 Others – – – 1,984,020 259,973 2,243,993
7,733,292 16,922,519 2,572,850 29,629,979 2,323,919 59,182,559Unquoted debt securities: Government – – – – 189,167 189,167
– – – – 189,167 189,167Accounts receivables: Corporate 612,968 – – 101,588 89,501 804,057 Individual – – – 5,821 94,919 100,740
612,968 – – 107,409 184,420 904,797Accrued interest receivable 123,604 76,323 33,665 296,243 60,401 590,236Sales contracts receivable:
Corporate – – – 264,957 1,327 266,284Individual – – – 63,617 36,580 100,197
– – – 328,574 37,907 366,481
(Forward)
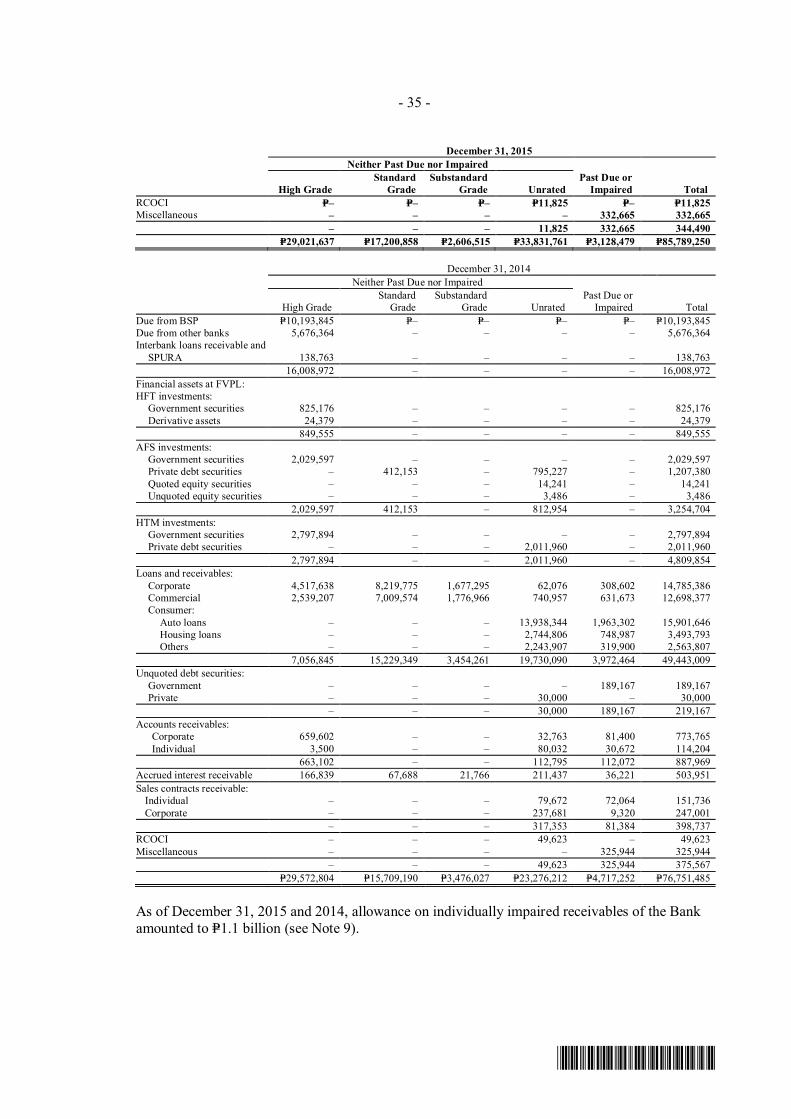
- 35 -
*SGVFS016291*
December 31, 2015Neither Past Due nor Impaired
Standard Substandard Past Due orHigh Grade Grade Grade Unrated Impaired Total
RCOCI P=– P=– P=– P=11,825 P=– P=11,825Miscellaneous – – – – 332,665 332,665
– – – 11,825 332,665 344,490P=29,021,637 P=17,200,858 P=2,606,515 P=33,831,761 P=3,128,479 P=85,789,250
December 31, 2014Neither Past Due nor Impaired
Standard Substandard Past Due orHigh Grade Grade Grade Unrated Impaired Total
Due from BSP P=10,193,845 P=– P=– P=– P=– P=10,193,845Due from other banks 5,676,364 – – – – 5,676,364Interbank loans receivable and
SPURA 138,763 – – – – 138,76316,008,972 – – – – 16,008,972
Financial assets at FVPL:HFT investments: Government securities 825,176 – – – – 825,176 Derivative assets 24,379 – – – – 24,379
849,555 – – – – 849,555AFS investments: Government securities 2,029,597 – – – – 2,029,597 Private debt securities – 412,153 – 795,227 – 1,207,380 Quoted equity securities – – – 14,241 – 14,241 Unquoted equity securities – – – 3,486 – 3,486
2,029,597 412,153 – 812,954 – 3,254,704HTM investments: Government securities 2,797,894 – – – – 2,797,894 Private debt securities – – – 2,011,960 – 2,011,960
2,797,894 – – 2,011,960 – 4,809,854Loans and receivables: Corporate 4,517,638 8,219,775 1,677,295 62,076 308,602 14,785,386 Commercial 2,539,207 7,009,574 1,776,966 740,957 631,673 12,698,377 Consumer: Auto loans – – – 13,938,344 1,963,302 15,901,646 Housing loans – – – 2,744,806 748,987 3,493,793 Others – – – 2,243,907 319,900 2,563,807
7,056,845 15,229,349 3,454,261 19,730,090 3,972,464 49,443,009Unquoted debt securities: Government – – – – 189,167 189,167 Private – – – 30,000 – 30,000
– – – 30,000 189,167 219,167Accounts receivables: Corporate 659,602 – – 32,763 81,400 773,765 Individual 3,500 – – 80,032 30,672 114,204
663,102 – – 112,795 112,072 887,969Accrued interest receivable 166,839 67,688 21,766 211,437 36,221 503,951Sales contracts receivable:
Individual – – – 79,672 72,064 151,736Corporate – – – 237,681 9,320 247,001
– – – 317,353 81,384 398,737RCOCI – – – 49,623 – 49,623Miscellaneous – – – – 325,944 325,944
– – – 49,623 325,944 375,567P=29,572,804 P=15,709,190 P=3,476,027 P=23,276,212 P=4,717,252 P=76,751,485
As of December 31, 2015 and 2014, allowance on individually impaired receivables of the Bankamounted to P=1.1 billion (see Note 9).
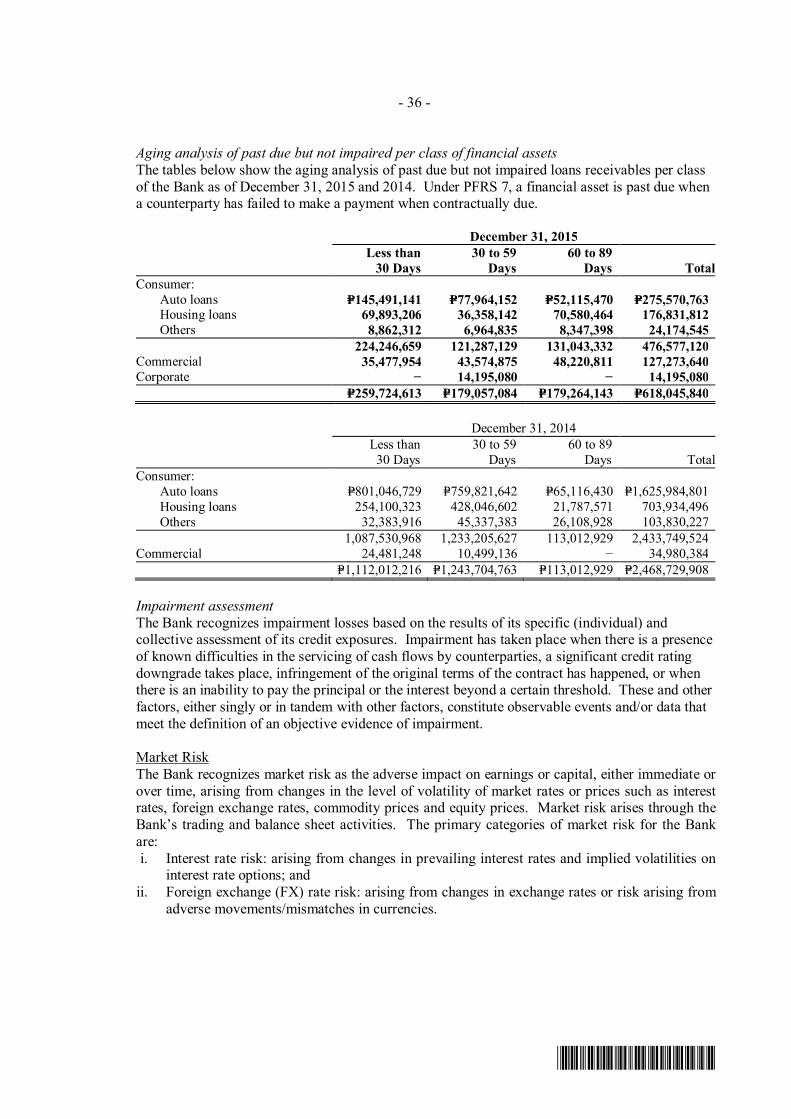
- 36 -
*SGVFS016291*
Aging analysis of past due but not impaired per class of financial assetsThe tables below show the aging analysis of past due but not impaired loans receivables per classof the Bank as of December 31, 2015 and 2014. Under PFRS 7, a financial asset is past due whena counterparty has failed to make a payment when contractually due.
December 31, 2015Less than
30 Days30 to 59
Days60 to 89
Days TotalConsumer:
Auto loans P=145,491,141 P=77,964,152 P=52,115,470 P=275,570,763Housing loans 69,893,206 36,358,142 70,580,464 176,831,812Others 8,862,312 6,964,835 8,347,398 24,174,545
224,246,659 121,287,129 131,043,332 476,577,120Commercial 35,477,954 43,574,875 48,220,811 127,273,640Corporate − 14,195,080 − 14,195,080
P=259,724,613 P=179,057,084 P=179,264,143 P=618,045,840
December 31, 2014Less than
30 Days30 to 59
Days60 to 89
Days TotalConsumer:
Auto loans P=801,046,729 P=759,821,642 P=65,116,430 P=1,625,984,801Housing loans 254,100,323 428,046,602 21,787,571 703,934,496Others 32,383,916 45,337,383 26,108,928 103,830,227
1,087,530,968 1,233,205,627 113,012,929 2,433,749,524Commercial 24,481,248 10,499,136 − 34,980,384
P=1,112,012,216 P=1,243,704,763 P=113,012,929 P=2,468,729,908
Impairment assessmentThe Bank recognizes impairment losses based on the results of its specific (individual) andcollective assessment of its credit exposures. Impairment has taken place when there is a presenceof known difficulties in the servicing of cash flows by counterparties, a significant credit ratingdowngrade takes place, infringement of the original terms of the contract has happened, or whenthere is an inability to pay the principal or the interest beyond a certain threshold. These and otherfactors, either singly or in tandem with other factors, constitute observable events and/or data thatmeet the definition of an objective evidence of impairment.
Market RiskThe Bank recognizes market risk as the adverse impact on earnings or capital, either immediate orover time, arising from changes in the level of volatility of market rates or prices such as interestrates, foreign exchange rates, commodity prices and equity prices. Market risk arises through theBank’s trading and balance sheet activities. The primary categories of market risk for the Bankare:i. Interest rate risk: arising from changes in prevailing interest rates and implied volatilities on
interest rate options; andii. Foreign exchange (FX) rate risk: arising from changes in exchange rates or risk arising from
adverse movements/mismatches in currencies.
- 37 -
*SGVFS016291*
The RMC is the overall risk oversight body. Management of market and liquidity risks isdelegated to the ALCO. ALCO is responsible for the establishment of appropriate risk policiesand limits, duly approved by the RMC; and execution of both strategic and tactical actions tomaintain the exposure within the set tolerances and meet the risk and reward objectives of theBank.
The Bank established the MRM to assist the BOD, RMC, ALCO in monitoring and managing theBank’s market risk exposures independently from the risk taking units. MRM also acts asbusiness partners with Global Markets in the daily monitoring of its positions against approvedrisk measures. MRM’s roles include the following:
· Ensure that the market and liquidity risk management objectives of the Bank are achievedthrough the development, implementation, maintenance and enhancement of a comprehensiverisk management process that comprises of qualitative and quantitative methodologies toidentify, measure, control and monitor, among others, the following:- Market risks, which covers the risk of loss of earnings arising from changes in interest rates,foreign exchange rates, equity and commodity prices and their implied volatilities
- Liquidity risks, which covers liquidity crisis, funding structure, fund raising policies andstrategies, diversification of funding sources, gap analysis and management
· Provide support functions to the ALCO to facilitate informed strategic management decisionmaking
· Provide consultative services and support functions to all relevant units within the Bank onmatters pertaining to market and liquidity risks management and treasury operations
· Participate, in collaboration with other risk management units within the Bank, to identify andaddress various risks inherent in new treasury and core banking products prior to productintroduction
· Provide revaluation prices of relevant treasury products transacted by various business unitswithin the Bank
· Carry out daily independent oversight of the Treasury operations
An Integrated Risk Management Framework is in place to provide a set of general principles toguide the Bank to identify, measure, control and monitor the various risks the Bank is undertakingas well as roles and responsibility in managing these risks. All market risk policies being issuedare reviewed at least annually to ensure compliance with regulatory requirements and up to parwith international best practices.
The Bank’s traded market risk exposures are primarily from proprietary trading, client servicingand market making. Various risk measurement techniques are used by the Bank to monitor andmanage market risk, such as Price-Value-of-a-Basis-Point (PV01), FX net open position (NOP),Value-at-Risk (VaR), Stop Loss, Earnings-at-Risk (EaR), Impact on Economic Value (IEV) andStop loss limits. In addition, a variety of stress testing techniques are performed to complementthe reporting to Management.
Interest rate riskThe Bank is exposed to various risks associated with the effects of fluctuations in the prevailinglevels of market interest rates on the financial position and cash flows. Interest rate risk exposureis identified, measured, monitored and controlled through limits and procedures set by theManagement to protect total net interest income from changes in market interest rates.

- 38 -
*SGVFS016291*
Trading: PV01PV01 measures the change in the value of the portfolio with 1 basis point increase in the yieldcurve and is applicable for the trading portfolio. Limits are set annually to re-assess the Bank’srisk appetite and strategy. The PV01 is computed and reported daily to Global Markets andmonthly to ALCO.
Shown in the table below is the Interest Rate Sensitivities (PV01) Report - By Portfolio as atDecember 31, 2015 and 2014 (amounts expressed in USD equivalents).
Rates TradingDesk 2015 2014PHP (3,090) (2,047)USD 0.074 1.26NET (3,090) (2,046)
Interest Rate DerivativesDesk 2015 2014PHP (3,225) 650USD 0.005 (0.001)NET (3,225) 650
Non-Trading: PV01PV01 measures the change in the value of the portfolio with 1 basis point increase in the yieldcurve and is applicable to the AFS portfolio.
Shown in the table below is the Interest Rate Sensitivities (PV01) Report of GM’s Rates BankingBook Investments as at December 31, 2015 and 2014 (amounts expressed in USD equivalents).
Rates BankingDesk 2015 2014PHP (36,357) (38,660)USD (13,482) (39,298)NET (49,839) (77,958)
Non-trading: EaR and IEVThe Bank emphasizes the importance of managing interest rate risk in the banking book as most ofthe balance sheet items of the Bank generate interest income and interest expense, which areindexed to interest rates. Volatility of earnings can pose a threat to the Bank’s profitability whileeconomic value provides a more comprehensive view of the potential long-term effects on theBank’s overall capital adequacy.
With this, the Bank utilizes EaR to measure the sensitivity of the Bank’s Net Interest Income (NII)due to a 100 basis points (bps) change in the underlying interest rates over a period of one year.IEV, on the other hand, shows the sensitivity of economic value on the long term to a 100 bpschange in the market yield curve.
EaR and IEV are calculated based on the repricing gaps, or the difference between the amounts ofrate sensitive assets and the amounts of rate sensitive liabilities. A gap is considered negativewhen the amount of interest rate sensitive liabilities exceeds the amount of interest rate sensitiveassets. A gap is considered positive when the amount of interest rate sensitive assets exceeds the
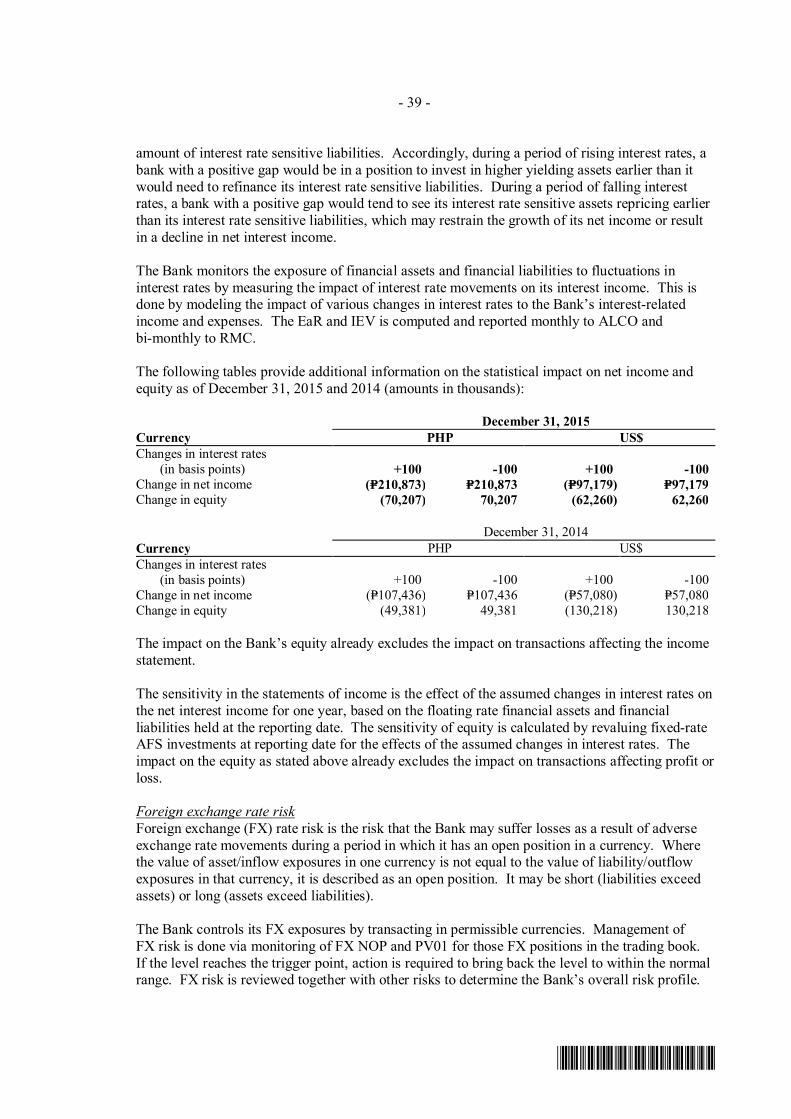
- 39 -
*SGVFS016291*
amount of interest rate sensitive liabilities. Accordingly, during a period of rising interest rates, abank with a positive gap would be in a position to invest in higher yielding assets earlier than itwould need to refinance its interest rate sensitive liabilities. During a period of falling interestrates, a bank with a positive gap would tend to see its interest rate sensitive assets repricing earlierthan its interest rate sensitive liabilities, which may restrain the growth of its net income or resultin a decline in net interest income.
The Bank monitors the exposure of financial assets and financial liabilities to fluctuations ininterest rates by measuring the impact of interest rate movements on its interest income. This isdone by modeling the impact of various changes in interest rates to the Bank’s interest-relatedincome and expenses. The EaR and IEV is computed and reported monthly to ALCO andbi-monthly to RMC.
The following tables provide additional information on the statistical impact on net income andequity as of December 31, 2015 and 2014 (amounts in thousands):
December 31, 2015Currency PHP US$Changes in interest rates
(in basis points) +100 -100 +100 -100Change in net income (P=210,873) P=210,873 (P=97,179) P=97,179Change in equity (70,207) 70,207 (62,260) 62,260
December 31, 2014Currency PHP US$Changes in interest rates
(in basis points) +100 -100 +100 -100Change in net income (P=107,436) P=107,436 (P=57,080) P=57,080Change in equity (49,381) 49,381 (130,218) 130,218
The impact on the Bank’s equity already excludes the impact on transactions affecting the incomestatement.
The sensitivity in the statements of income is the effect of the assumed changes in interest rates onthe net interest income for one year, based on the floating rate financial assets and financialliabilities held at the reporting date. The sensitivity of equity is calculated by revaluing fixed-rateAFS investments at reporting date for the effects of the assumed changes in interest rates. Theimpact on the equity as stated above already excludes the impact on transactions affecting profit orloss.
Foreign exchange rate riskForeign exchange (FX) rate risk is the risk that the Bank may suffer losses as a result of adverseexchange rate movements during a period in which it has an open position in a currency. Wherethe value of asset/inflow exposures in one currency is not equal to the value of liability/outflowexposures in that currency, it is described as an open position. It may be short (liabilities exceedassets) or long (assets exceed liabilities).
The Bank controls its FX exposures by transacting in permissible currencies. Management ofFX risk is done via monitoring of FX NOP and PV01 for those FX positions in the trading book.If the level reaches the trigger point, action is required to bring back the level to within the normalrange. FX risk is reviewed together with other risks to determine the Bank’s overall risk profile.
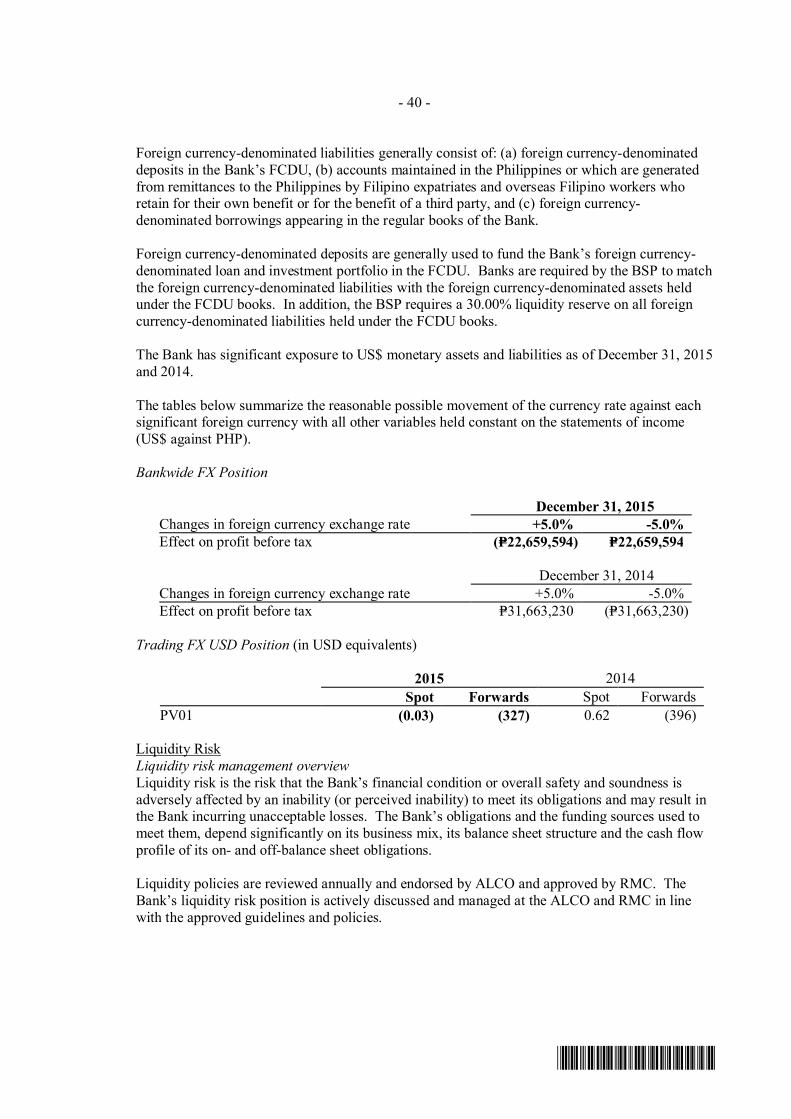
- 40 -
*SGVFS016291*
Foreign currency-denominated liabilities generally consist of: (a) foreign currency-denominateddeposits in the Bank’s FCDU, (b) accounts maintained in the Philippines or which are generatedfrom remittances to the Philippines by Filipino expatriates and overseas Filipino workers whoretain for their own benefit or for the benefit of a third party, and (c) foreign currency-denominated borrowings appearing in the regular books of the Bank.
Foreign currency-denominated deposits are generally used to fund the Bank’s foreign currency-denominated loan and investment portfolio in the FCDU. Banks are required by the BSP to matchthe foreign currency-denominated liabilities with the foreign currency-denominated assets heldunder the FCDU books. In addition, the BSP requires a 30.00% liquidity reserve on all foreigncurrency-denominated liabilities held under the FCDU books.
The Bank has significant exposure to US$ monetary assets and liabilities as of December 31, 2015and 2014.
The tables below summarize the reasonable possible movement of the currency rate against eachsignificant foreign currency with all other variables held constant on the statements of income(US$ against PHP).
Bankwide FX Position
December 31, 2015Changes in foreign currency exchange rate +5.0% -5.0%Effect on profit before tax (P=22,659,594) P=22,659,594
December 31, 2014Changes in foreign currency exchange rate +5.0% -5.0%Effect on profit before tax P=31,663,230 (P=31,663,230)
Trading FX USD Position (in USD equivalents)
2015 2014Spot Forwards Spot Forwards
PV01 (0.03) (327) 0.62 (396)
Liquidity RiskLiquidity risk management overviewLiquidity risk is the risk that the Bank’s financial condition or overall safety and soundness isadversely affected by an inability (or perceived inability) to meet its obligations and may result inthe Bank incurring unacceptable losses. The Bank’s obligations and the funding sources used tomeet them, depend significantly on its business mix, its balance sheet structure and the cash flowprofile of its on- and off-balance sheet obligations.
Liquidity policies are reviewed annually and endorsed by ALCO and approved by RMC. TheBank’s liquidity risk position is actively discussed and managed at the ALCO and RMC in linewith the approved guidelines and policies.
- 41 -
*SGVFS016291*
The Bank, in line with the Group, has implemented leading practices as a foundation to manageand measure its liquidity risk exposure. The Bank uses a range of tools to monitor and controlliquidity risk exposure such as liquidity gap, early warning signals/liquidity indicators and stresstesting. The liquidity positions of the Bank are monitored regularly against the establishedpolicies, procedures and limits.
Management of liquidity riskFor day to day liquidity management, Global Markets will ensure sufficient funding to meet theBank’s intraday payment and settlement obligations on a timely basis. In addition, the process ofmanaging liquidity risk includes:
· Maintaining an adequate portfolio that can easily be liquidated as protection against anyunforeseen interruption in cashflows;
· Maintaining a stable funding to support illiquid assets and business activities;· Daily and monthly monitoring of liquidity ratios against internal and regulatory requirements;· Monthly monitoring of gaps arising from mismatched maturity of assets and liabilities;· Monthly monitoring and managing of concentration ratios of deposits;· Conducting monthly liquidity stress testing under various scenarios as part of prudent liquidity
control;· Maintaining a robust contingency funding plan that includes strategies, decision-making
authorities, internal and external communication and courses of action to be taken underdifferent liquidity crisis scenarios; and
· Conducting Contingency Funding Plan (CFP) testing to examine the effectiveness androbustness of the plans.
Stress testing and Contingency Funding PlanThe Bank uses stress testing and scenario analysis to evaluate the impact of sudden stress eventson liquidity position. Scenarios are based on hypothetical events that include bank specific crisisand general market crisis scenarios. The stress test result provides an insight of the Bank’sfunding requirements during different levels of stress environments and is closely linked to theBank’s CFP, which provides a systemic approach in handling any unexpected liquiditydisruptions. The plan encompasses strategies, decision-making authorities, internal and externalcommunication and courses of action to be taken under different liquidity crisis scenarios.
The Bank also conducts CFP tests to ensure the effectiveness and operational feasibility of theCFP. The key aspects of the testing are to focus on the preparedness of key senior managementand their respective alternate in handling a simulated distress funding situation. It also providesexposure and develops capabilities on how to respond to a liquidity crisis situation and operateeffectively with each other under challenging circumstances.

- 42 -
*SGVFS016291*
Analysis of financial assets and financial liabilities by remaining contractual maturitiesThe tables below show the maturity profile of the Bank’s financial assets and financial liabilitiesbased on contractual undiscounted cash flows (amount in thousands).
December 31, 2015Up to 1Month
1 to 3Months
3 to 6Months
6 to 12Months
Beyond1 year Total
Financial AssetsCash and other cash items P=1,860,702 P=– P=– P=– P=– P=1,860,702Due from BSP 12,593,449 – – – – 12,593,449Due from other banks 3,557,986 – – – – 3,557,986Interbank loans receivable and
SPURA 134,864 – – 10,223 – 145,087Financial assets at FVPL:
HFT investments:Government securities 1,562 3,124 4,685 9,371 827,120 845,862Derivative assets 36,282 9,232 1,504 1,558 1,802 50,378
37,844 12,356 6,189 10,929 828,922 896,240AFS investments:
Government 4,163 8,325 12,488 24,976 1,338,771 1,388,723Private debt securities 8,796 17,592 26,388 52,775 2,171,330 2,276,881Quoted equity − – – – 10,390 10,390Unquoted − – – – 3,164 3,164
HTM investments:Government 581,114 51,378 46,995 646,276 1,471,860 2,797,623Private 8,346 16,692 25,039 50,077 2,328,934 2,429,088
Loans and receivables:Loans:
Corporate 3,426,751 1,974,428 2,292,136 496,460 10,372,757 18,562,532Commercial 2,937,347 1,535,432 1,266,177 269,546 12,735,487 18,743,989Consumer:
Auto loans 65,892 72,972 219,575 900,832 30,900,504 32,159,775Housing loans 1,449 – 1,298 6,953 8,876,421 8,886,121Others 1,047,707 23,873 47,258 203,357 1,456,581 2,778,776
7,479,146 3,606,705 3,826,444 1,877,148 64,341,750 81,131,193Unquoted debt securities:
Government 189,167 – – – – 189,167189,167 – – – – 189,167
Sales contract receivable:Individual 8 142 3,977 36,580 89,243 129,950Corporate 1,327 – 31,811 – 297,442 330,580
1,335 142 35,788 36,580 386,685 460,530Accounts receivable:
Corporate 238,420 62 – 50 565,525 804,057Individual 98,118 1,684 6 932 – 100,740
336,538 1,746 6 982 565,525 904,797Accrued interest receivable 518,303 54,103 17,830 – – 590,236RCOCI 11,825 – – – – 11,825
P=27,323,578 P=3,769,039 P=3,997,167 P=2,709,966 P=73,447,331 P=111,247,081Financial LiabilitiesDeposit liabilities:
Demand P=20,110,812 P=– P=– P=– P=– P=20,110,812Savings 14,070,835 1,125,058 58,327 8,450 – 15,262,670Time 12,799,036 10,197,655 1,490,803 1,149,269 6,954,906 32,591,669
46,980,683 11,322,713 1,549,130 1,157,719 6,954,906 67,965,151Financial liabilities at FVPL:
Interest rate swaps 663 − − 9,788 71,678 82,129Derivative liabilities 15,136 − − − − 15,136
Bills payable 4,894,689 1,043,255 – – – 5,937,944Manager’s checks 663,618 – – – – 663,618Accrued interest payable 34,527 19,180 6,117 5,099 26,833 91,756
(Forward)
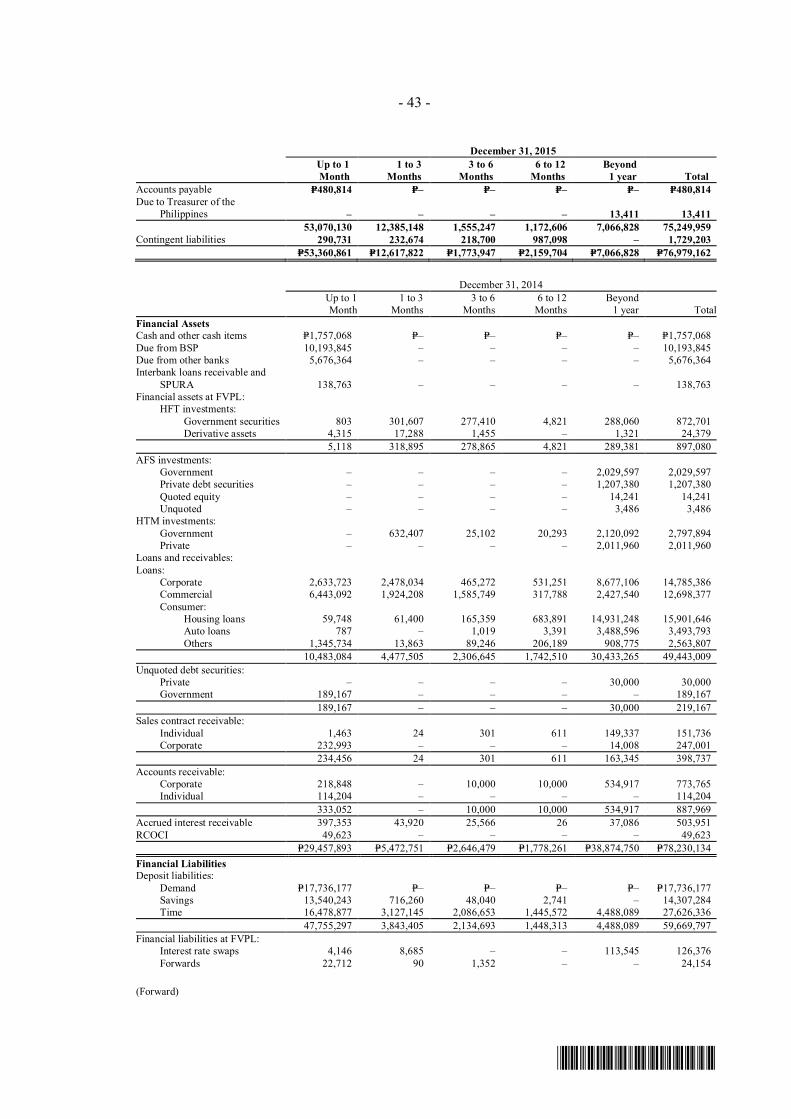
- 43 -
*SGVFS016291*
December 31, 2015Up to 1Month
1 to 3Months
3 to 6Months
6 to 12Months
Beyond1 year Total
Accounts payable P=480,814 P=– P=– P=– P=– P=480,814Due to Treasurer of the
Philippines – – – – 13,411 13,41153,070,130 12,385,148 1,555,247 1,172,606 7,066,828 75,249,959
Contingent liabilities 290,731 232,674 218,700 987,098 – 1,729,203P=53,360,861 P=12,617,822 P=1,773,947 P=2,159,704 P=7,066,828 P=76,979,162
December 31, 2014Up to 1Month
1 to 3Months
3 to 6Months
6 to 12Months
Beyond1 year Total
Financial AssetsCash and other cash items P=1,757,068 P=– P=– P=– P=– P=1,757,068Due from BSP 10,193,845 – – – – 10,193,845Due from other banks 5,676,364 – – – – 5,676,364Interbank loans receivable and
SPURA 138,763 – – – – 138,763Financial assets at FVPL:
HFT investments:Government securities 803 301,607 277,410 4,821 288,060 872,701Derivative assets 4,315 17,288 1,455 – 1,321 24,379
5,118 318,895 278,865 4,821 289,381 897,080AFS investments:
Government – – – – 2,029,597 2,029,597Private debt securities – – – – 1,207,380 1,207,380Quoted equity – – – – 14,241 14,241Unquoted – – – – 3,486 3,486
HTM investments:Government – 632,407 25,102 20,293 2,120,092 2,797,894Private – – – – 2,011,960 2,011,960
Loans and receivables:Loans:
Corporate 2,633,723 2,478,034 465,272 531,251 8,677,106 14,785,386Commercial 6,443,092 1,924,208 1,585,749 317,788 2,427,540 12,698,377Consumer:
Housing loans 59,748 61,400 165,359 683,891 14,931,248 15,901,646Auto loans 787 – 1,019 3,391 3,488,596 3,493,793Others 1,345,734 13,863 89,246 206,189 908,775 2,563,807
10,483,084 4,477,505 2,306,645 1,742,510 30,433,265 49,443,009Unquoted debt securities:
Private – – – – 30,000 30,000Government 189,167 – – – – 189,167
189,167 – – – 30,000 219,167Sales contract receivable:
Individual 1,463 24 301 611 149,337 151,736Corporate 232,993 – – – 14,008 247,001
234,456 24 301 611 163,345 398,737Accounts receivable:
Corporate 218,848 – 10,000 10,000 534,917 773,765Individual 114,204 – – – – 114,204
333,052 – 10,000 10,000 534,917 887,969Accrued interest receivable 397,353 43,920 25,566 26 37,086 503,951RCOCI 49,623 – – – – 49,623
P=29,457,893 P=5,472,751 P=2,646,479 P=1,778,261 P=38,874,750 P=78,230,134Financial LiabilitiesDeposit liabilities:
Demand P=17,736,177 P=– P=– P=– P=– P=17,736,177Savings 13,540,243 716,260 48,040 2,741 – 14,307,284Time 16,478,877 3,127,145 2,086,653 1,445,572 4,488,089 27,626,336
47,755,297 3,843,405 2,134,693 1,448,313 4,488,089 59,669,797Financial liabilities at FVPL:
Interest rate swaps 4,146 8,685 – – 113,545 126,376Forwards 22,712 90 1,352 – – 24,154
(Forward)
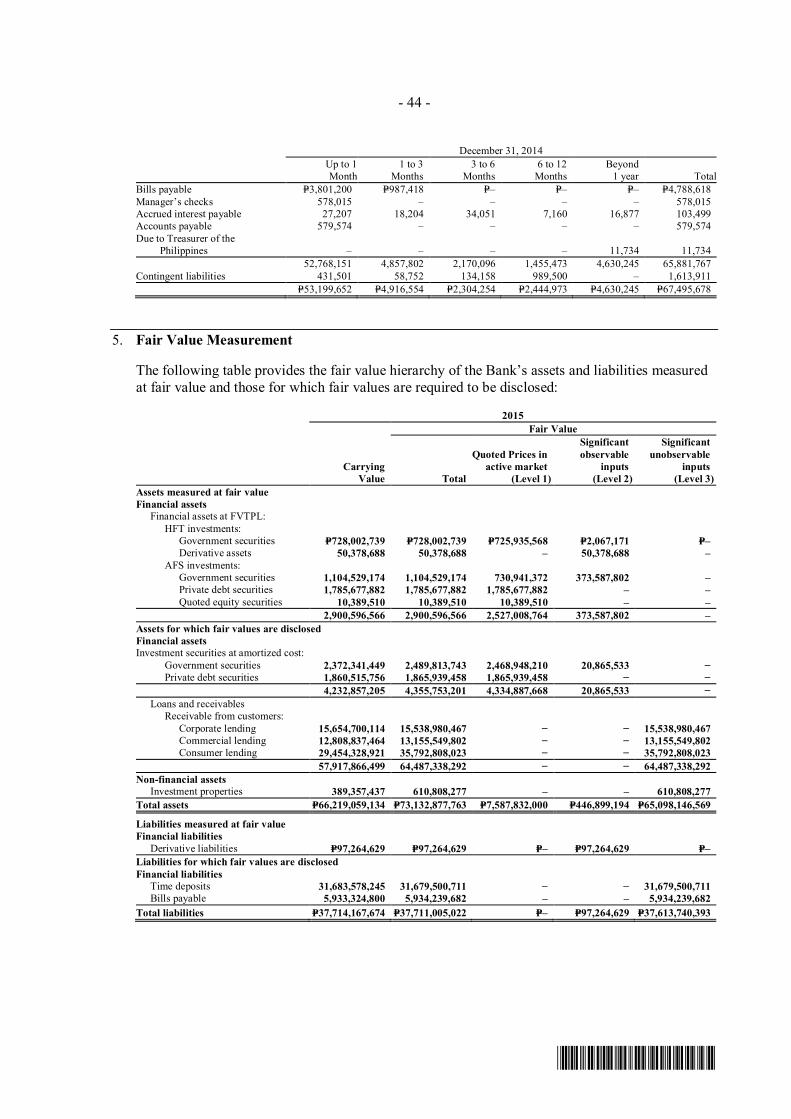
- 44 -
*SGVFS016291*
December 31, 2014Up to 1Month
1 to 3Months
3 to 6Months
6 to 12Months
Beyond1 year Total
Bills payable P=3,801,200 P=987,418 P=– P=– P=– P=4,788,618Manager’s checks 578,015 – – – – 578,015Accrued interest payable 27,207 18,204 34,051 7,160 16,877 103,499Accounts payable 579,574 – – – – 579,574Due to Treasurer of the
Philippines – – – – 11,734 11,73452,768,151 4,857,802 2,170,096 1,455,473 4,630,245 65,881,767
Contingent liabilities 431,501 58,752 134,158 989,500 – 1,613,911P=53,199,652 P=4,916,554 P=2,304,254 P=2,444,973 P=4,630,245 P=67,495,678
5. Fair Value Measurement
The following table provides the fair value hierarchy of the Bank’s assets and liabilities measuredat fair value and those for which fair values are required to be disclosed:
2015Fair Value
CarryingValue Total
Quoted Prices inactive market
(Level 1)
Significantobservable
inputs(Level 2)
Significantunobservable
inputs(Level 3)
Assets measured at fair valueFinancial assets
Financial assets at FVTPL: HFT investments: Government securities P=728,002,739 P=728,002,739 P=725,935,568 P=2,067,171 P=– Derivative assets 50,378,688 50,378,688 – 50,378,688 – AFS investments: Government securities 1,104,529,174 1,104,529,174 730,941,372 373,587,802 – Private debt securities 1,785,677,882 1,785,677,882 1,785,677,882 – – Quoted equity securities 10,389,510 10,389,510 10,389,510 – –
2,900,596,566 2,900,596,566 2,527,008,764 373,587,802 –Assets for which fair values are disclosedFinancial assetsInvestment securities at amortized cost:
Government securities 2,372,341,449 2,489,813,743 2,468,948,210 20,865,533 − Private debt securities 1,860,515,756 1,865,939,458 1,865,939,458 − −
4,232,857,205 4,355,753,201 4,334,887,668 20,865,533 −Loans and receivables Receivable from customers: Corporate lending 15,654,700,114 15,538,980,467 − − 15,538,980,467 Commercial lending 12,808,837,464 13,155,549,802 − − 13,155,549,802 Consumer lending 29,454,328,921 35,792,808,023 − − 35,792,808,023
57,917,866,499 64,487,338,292 − − 64,487,338,292Non-financial assets
Investment properties 389,357,437 610,808,277 – – 610,808,277Total assets P=66,219,059,134 P=73,132,877,763 P=7,587,832,000 P=446,899,194 P=65,098,146,569
Liabilities measured at fair valueFinancial liabilities
Derivative liabilities P=97,264,629 P=97,264,629 P=– P=97,264,629 P=–Liabilities for which fair values are disclosedFinancial liabilities
Time deposits 31,683,578,245 31,679,500,711 − − 31,679,500,711Bills payable 5,933,324,800 5,934,239,682 – – 5,934,239,682
Total liabilities P=37,714,167,674 P=37,711,005,022 P=– P=97,264,629 P=37,613,740,393
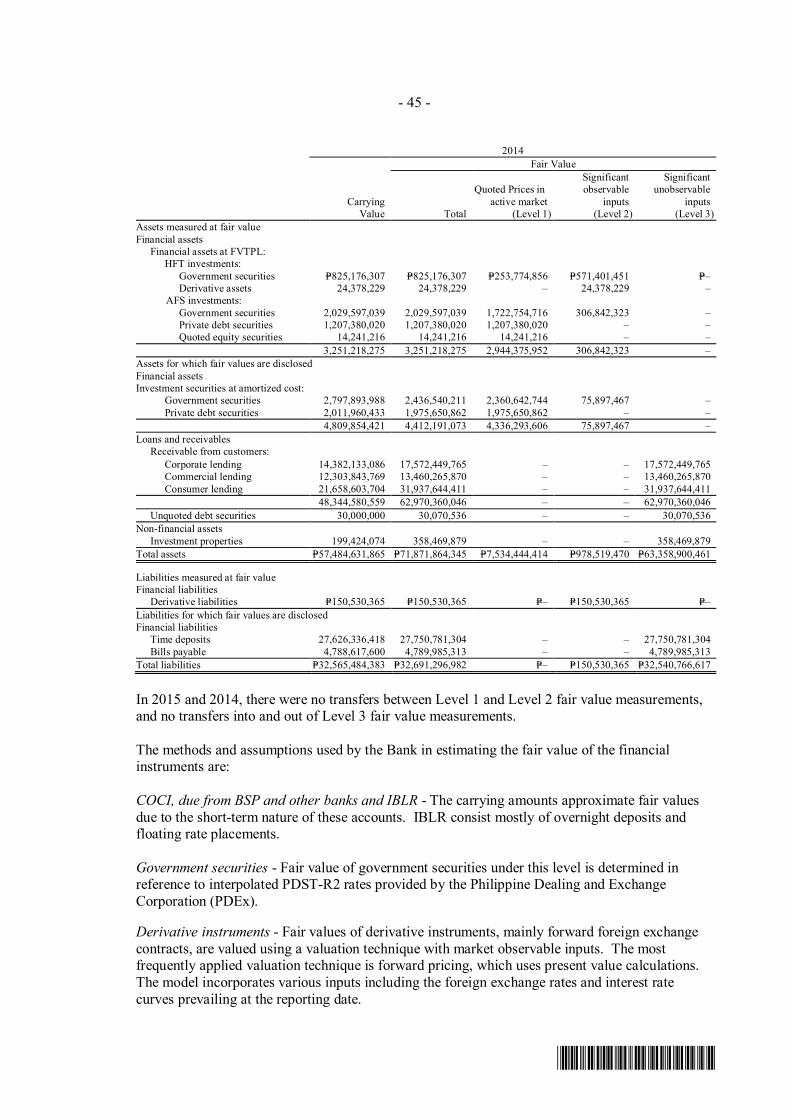
- 45 -
*SGVFS016291*
2014Fair Value
CarryingValue Total
Quoted Prices inactive market
(Level 1)
Significantobservable
inputs(Level 2)
Significantunobservable
inputs(Level 3)
Assets measured at fair valueFinancial assets
Financial assets at FVTPL: HFT investments: Government securities P=825,176,307 P=825,176,307 P=253,774,856 P=571,401,451 P=– Derivative assets 24,378,229 24,378,229 – 24,378,229 –
AFS investments: Government securities 2,029,597,039 2,029,597,039 1,722,754,716 306,842,323 – Private debt securities 1,207,380,020 1,207,380,020 1,207,380,020 – – Quoted equity securities 14,241,216 14,241,216 14,241,216 – –
3,251,218,275 3,251,218,275 2,944,375,952 306,842,323 –Assets for which fair values are disclosedFinancial assetsInvestment securities at amortized cost:
Government securities 2,797,893,988 2,436,540,211 2,360,642,744 75,897,467 – Private debt securities 2,011,960,433 1,975,650,862 1,975,650,862 – –
4,809,854,421 4,412,191,073 4,336,293,606 75,897,467 –Loans and receivables Receivable from customers: Corporate lending 14,382,133,086 17,572,449,765 – – 17,572,449,765 Commercial lending 12,303,843,769 13,460,265,870 – – 13,460,265,870 Consumer lending 21,658,603,704 31,937,644,411 – – 31,937,644,411
48,344,580,559 62,970,360,046 – – 62,970,360,046 Unquoted debt securities 30,000,000 30,070,536 – – 30,070,536Non-financial assets Investment properties 199,424,074 358,469,879 – – 358,469,879Total assets P=57,484,631,865 P=71,871,864,345 P=7,534,444,414 P=978,519,470 P=63,358,900,461
Liabilities measured at fair valueFinancial liabilities Derivative liabilities P=150,530,365 P=150,530,365 P=– P=150,530,365 P=–Liabilities for which fair values are disclosedFinancial liabilities Time deposits 27,626,336,418 27,750,781,304 – – 27,750,781,304 Bills payable 4,788,617,600 4,789,985,313 – – 4,789,985,313Total liabilities P=32,565,484,383 P=32,691,296,982 P=– P=150,530,365 P=32,540,766,617
In 2015 and 2014, there were no transfers between Level 1 and Level 2 fair value measurements,and no transfers into and out of Level 3 fair value measurements.
The methods and assumptions used by the Bank in estimating the fair value of the financialinstruments are:
COCI, due from BSP and other banks and IBLR - The carrying amounts approximate fair valuesdue to the short-term nature of these accounts. IBLR consist mostly of overnight deposits andfloating rate placements.
Government securities - Fair value of government securities under this level is determined inreference to interpolated PDST-R2 rates provided by the Philippine Dealing and ExchangeCorporation (PDEx).
Derivative instruments - Fair values of derivative instruments, mainly forward foreign exchangecontracts, are valued using a valuation technique with market observable inputs. The mostfrequently applied valuation technique is forward pricing, which uses present value calculations.The model incorporates various inputs including the foreign exchange rates and interest ratecurves prevailing at the reporting date.
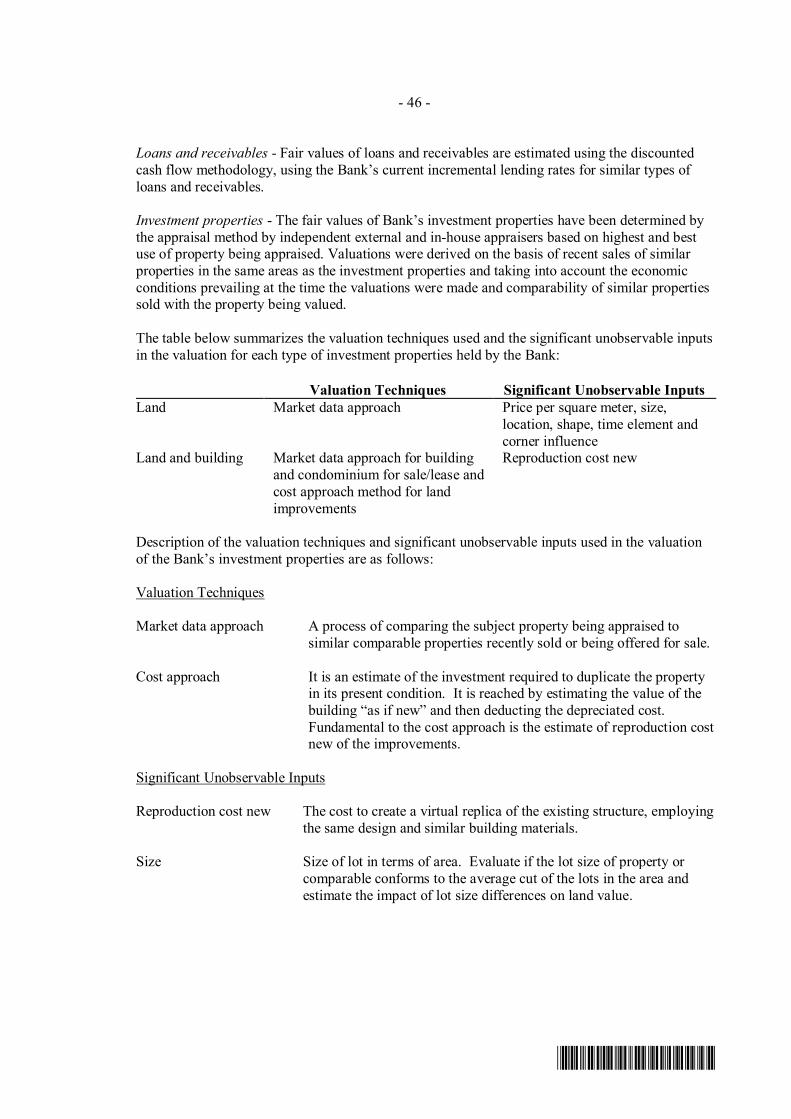
- 46 -
*SGVFS016291*
Loans and receivables - Fair values of loans and receivables are estimated using the discountedcash flow methodology, using the Bank’s current incremental lending rates for similar types ofloans and receivables.
Investment properties - The fair values of Bank’s investment properties have been determined bythe appraisal method by independent external and in-house appraisers based on highest and bestuse of property being appraised. Valuations were derived on the basis of recent sales of similarproperties in the same areas as the investment properties and taking into account the economicconditions prevailing at the time the valuations were made and comparability of similar propertiessold with the property being valued.
The table below summarizes the valuation techniques used and the significant unobservable inputsin the valuation for each type of investment properties held by the Bank:
Valuation Techniques Significant Unobservable InputsLand Market data approach Price per square meter, size,
location, shape, time element andcorner influence
Land and building Market data approach for buildingand condominium for sale/lease andcost approach method for landimprovements
Reproduction cost new
Description of the valuation techniques and significant unobservable inputs used in the valuationof the Bank’s investment properties are as follows:
Valuation Techniques
Market data approach A process of comparing the subject property being appraised tosimilar comparable properties recently sold or being offered for sale.
Cost approach It is an estimate of the investment required to duplicate the propertyin its present condition. It is reached by estimating the value of thebuilding “as if new” and then deducting the depreciated cost.Fundamental to the cost approach is the estimate of reproduction costnew of the improvements.
Significant Unobservable Inputs
Reproduction cost new The cost to create a virtual replica of the existing structure, employingthe same design and similar building materials.
Size Size of lot in terms of area. Evaluate if the lot size of property orcomparable conforms to the average cut of the lots in the area andestimate the impact of lot size differences on land value.

- 47 -
*SGVFS016291*
Shape Particular form or configuration of the lot. A highly irregular shapelimits the usable area whereas an ideal lot configuration maximizesthe usable area of the lot which is associated in designing animprovement which conforms with the highest and best use of theproperty.
Location Location of comparative properties whether on a main road, orsecondary road. Road width could also be a consideration if data isavailable. As a rule, properties located along a main road are superiorto properties located along a secondary road.
Time Element An adjustment for market conditions is made if general propertyvalues have appreciated or depreciated since the transaction dates dueto inflation or deflation or a change in investors’ perceptions of themarket over time. In which case, the current data is superior tohistoric data.
Discount Generally, asking prices in ads posted for sale are negotiable.Discount is the amount the seller or developer is willing to deductfrom the posted selling price if the transaction will be in cash orequivalent.
Corner influence Bounded by two (2) roads.
Liabilities - The fair values of liabilities approximate their carrying amounts due to either thedemand nature or the relatively short term maturities of these liabilities except for time depositliabilities and bills payable whose fair values are estimated using the discounted cash flowmethodology using the Bank’s incremental borrowing rates for similar borrowings with maturitiesconsistent with those remaining for the liability being valued.
6. Financial Assets at Fair Value Through Profit or Loss
This account consists of:
2015 2014Government securities P=728,002,739 P=825,176,307Derivative assets (Note 17) 50,378,688 24,378,229
P=778,381,427 P=849,554,536
As of December 31, 2015 and 2014, financial assets at FVPL include net unrealized loss ofP=3.6 million and P=0.5 million, respectively.
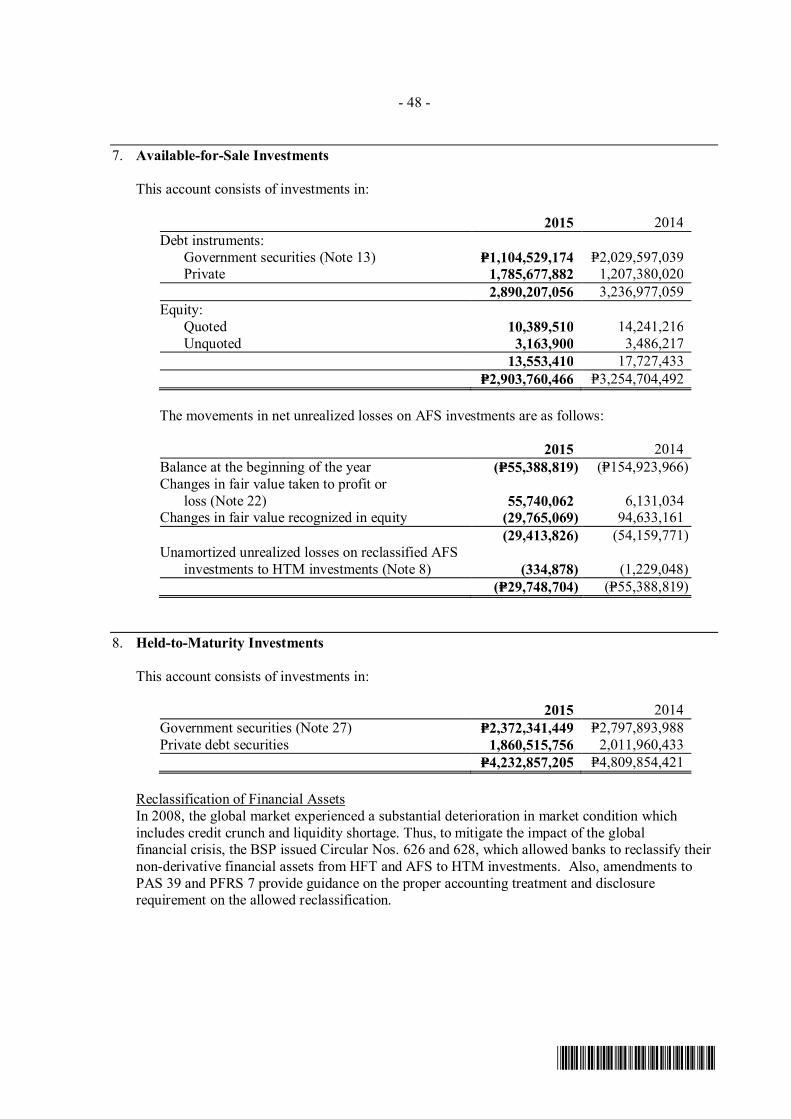
- 48 -
*SGVFS016291*
7. Available-for-Sale Investments
This account consists of investments in:
2015 2014Debt instruments:
Government securities (Note 13) P=1,104,529,174 P=2,029,597,039Private 1,785,677,882 1,207,380,020
2,890,207,056 3,236,977,059Equity:
Quoted 10,389,510 14,241,216Unquoted 3,163,900 3,486,217
13,553,410 17,727,433P=2,903,760,466 P=3,254,704,492
The movements in net unrealized losses on AFS investments are as follows:
2015 2014Balance at the beginning of the year (P=55,388,819) (P=154,923,966)Changes in fair value taken to profit or
loss (Note 22) 55,740,062 6,131,034Changes in fair value recognized in equity (29,765,069) 94,633,161
(29,413,826) (54,159,771)Unamortized unrealized losses on reclassified AFS
investments to HTM investments (Note 8) (334,878) (1,229,048)(P=29,748,704) (P=55,388,819)
8. Held-to-Maturity Investments
This account consists of investments in:
2015 2014Government securities (Note 27) P=2,372,341,449 P=2,797,893,988Private debt securities 1,860,515,756 2,011,960,433
P=4,232,857,205 P=4,809,854,421
Reclassification of Financial AssetsIn 2008, the global market experienced a substantial deterioration in market condition whichincludes credit crunch and liquidity shortage. Thus, to mitigate the impact of the globalfinancial crisis, the BSP issued Circular Nos. 626 and 628, which allowed banks to reclassify theirnon-derivative financial assets from HFT and AFS to HTM investments. Also, amendments toPAS 39 and PFRS 7 provide guidance on the proper accounting treatment and disclosurerequirement on the allowed reclassification.

- 49 -
*SGVFS016291*
HTM investments amounting to US$6.0 million that were reclassified from AFS investments havethe following PHP balances as of the relevant reporting period:
December 31, 2015
Face value
Cost as atreclassification
dateCarrying
Value Fair value
Netunrealized
lossAmortization
of premium EIRGovernment securities P=141,180,000 P=170,630,944 P=141,827,028 P=144,240,782 P=334,878 P=2,544,285 6.78%-6.89%
December 31, 2014
Face value
Cost as atreclassification
dateCarrying
Value Fair value
Netunrealized
lossAmortization
of premium EIRGovernment securities P=268,320,000 P=317,919,827 P=271,352,630 P=283,223,387 P=1,229,048 P=4,404,238 6.69%-6.92%
Had these securities not been reclassified to HTM investments as of December 31, 2015, theinvestments’ carrying value would have increased by P=2.4 million and net unrealized loss wouldhave decreased by P=2.7 million.
Had these securities not been reclassified to HTM investments as of December 31, 2014, theinvestments’ carrying value would have increased by P=11.9 million and net unrealized loss wouldhave decreased by P=13.7 million.
9. Loans and Receivables
This account consists of:
2015 2014Loans:Corporate (Note 29) P=15,963,743,927 P=14,785,386,311Commercial (Note 29) 13,344,134,813 12,698,377,565Consumer:
Auto loans 22,700,783,451 15,901,645,919Housing loans 4,929,903,860 3,493,792,844Others 2,243,993,140 2,563,806,819
59,182,559,191 49,443,009,458Less unearned discounts and other deferred income 32,790,464 35,407,216
59,149,768,727 49,407,602,242Unquoted debt securities:
Government 189,167,130 189,167,130Private – 30,000,000
189,167,130 219,167,130Accounts receivable:
Corporate (Note 29) 804,056,507 773,764,654Individual 100,740,066 114,204,047
904,796,573 887,968,701Less unearned discounts and other deferred income 9,851,544 9,851,544
894,945,029 878,117,157Accrued interest receivable (Note 29) 590,236,283 503,951,325
(Forward)

- 50 -
*SGVFS016291*
2015 2014Sales contract receivable:
Individual P=100,197,264 P=151,735,938Corporate 266,283,663 247,001,106
366,480,927 398,737,044RCOCI 11,825,268 49,622,863Miscellaneous 332,665,295 325,943,536
344,490,563 375,566,39961,535,088,659 51,783,141,297
Less allowance for credit losses 2,004,399,409 1,766,529,605P=59,530,689,250 P=50,016,611,692
Loans consist of:
2015 2014Loans and discounts P=55,670,466,379 P=45,556,177,986Customers’ liabilities and other loans 2,710,474,624 2,892,170,433Bills purchased (Note 16) 440,407,885 634,349,036Restructured loans 357,810,303 330,778,759Agrarian and other agricultural credit loans 3,400,000 29,533,244
P=59,182,559,191 P=49,443,009,458

- 51 -
*SGVFS016291*
Movements in the allowance for credit losses follow:
December 31, 2015Corporate
LoansCommercial
Loans Housing Loans Auto LoansAccounts
ReceivableSales Contract
ReceivableUnquoted Debt
Securities Miscellaneous* TotalBalances at beginning of period P=392,310,069 P=385,152,766 P=14,615,641 P=124,126,808 P=147,867,767 P=15,576,250 P=189,167,130 P=497,713,174 P=1,766,529,605Provision for (recovery from) impairment
and credit losses 16,894,508 134,728,137 (3,242,545) 130,813,891 22,413,032 13,661,922 – 287,153,039 602,421,984Accounts written off (103,881,237) – – (49,021,754) (214,637) – – (211,434,552) (364,552,180)Balances at end of period 305,323,340 519,880,903 11,373,096 205,918,945 170,066,162 29,238,172 189,167,130 573,431,661 2,004,399,409Individual impairment 267,380,499 256,503,623 – – – 17,569,297 189,167,130 332,665,295 1,063,285,844Collective impairment 37,942,841 263,377,280 11,373,096 205,918,945 170,066,162 11,668,875 – 240,766,366 941,113,565
P=305,323,340 P=519,880,903 P=11,373,096 P=205,918,945 P=170,066,162 P=29,238,172 P=189,167,130 P=573,431,661 P=2,004,399,409Gross amount of loans and receivables
individually determined to beimpaired before deducting anyindividually assessed impairmentallowance P=309,068,764 P=532,331,774 P=– P=– P=– P=37,906,408 P=189,167,130 P=349,413,164 P=1,417,887,240
December 31, 2014Corporate
LoansCommercial
Loans Housing Loans Auto LoansAccounts
ReceivableSales Contract
ReceivableUnquoted Debt
Securities Miscellaneous* TotalBalances at beginning of period P=348,924,810 P=293,689,434 P=7,519,222 P=114,211,693 P=115,220,752 P=15,091,338 P=189,167,130 P=434,278,945 P=1,518,103,324Provision for impairment and credit losses 43,385,259 91,463,332 7,096,419 35,511,752 38,917,820 484,912 – 206,560,911 423,420,405Accounts written off – – – (25,596,637) (6,270,805) – – (143,126,682) (174,994,124)Balances at end of period 392,310,069 385,152,766 14,615,641 124,126,808 147,867,767 15,576,250 189,167,130 497,713,174 1,766,529,605Individual impairment 321,699,597 198,609,860 – – – 15,576,250 189,167,130 348,007,191 1,073,060,028Collective impairment 70,610,472 186,542,906 14,615,641 124,126,808 147,867,767 – – 149,705,983 693,469,577
P=392,310,069 P=385,152,766 P=14,615,641 P=124,126,808 P=147,867,767 P=15,576,250 P=189,167,130 P=497,713,174 P=1,766,529,605Gross amount of loans and receivables
individually determined to be impairedbefore deducting any individuallyassessed impairment allowance P=393,408,652 P=385,778,009 P=– P=– P=– P=60,943,022 P=189,167,130 P=348,007,191 P=1,377,304,004
*Allowance for credit losses - miscellaneous includes allowance for accrued interest receivable, consumer loan - others and miscellaneous receivables.
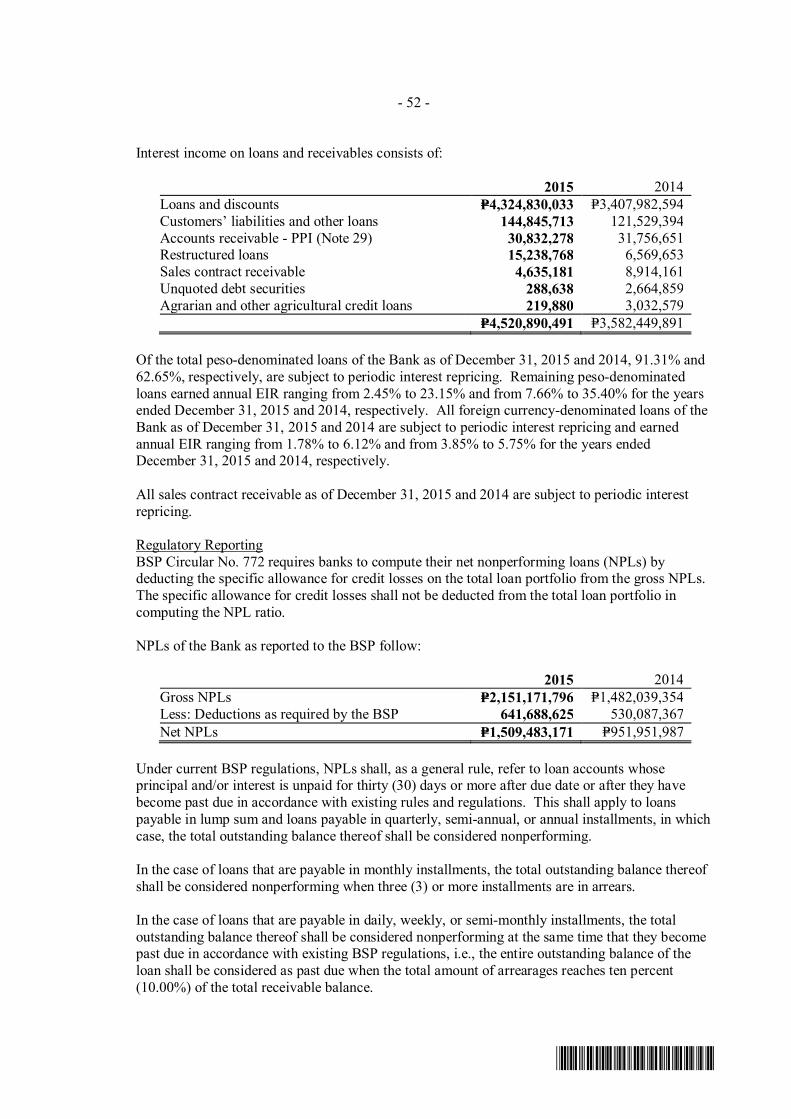
- 52 -
*SGVFS016291*
Interest income on loans and receivables consists of:
2015 2014Loans and discounts P=4,324,830,033 P=3,407,982,594Customers’ liabilities and other loans 144,845,713 121,529,394Accounts receivable - PPI (Note 29) 30,832,278 31,756,651Restructured loans 15,238,768 6,569,653Sales contract receivable 4,635,181 8,914,161Unquoted debt securities 288,638 2,664,859Agrarian and other agricultural credit loans 219,880 3,032,579
P=4,520,890,491 P=3,582,449,891
Of the total peso-denominated loans of the Bank as of December 31, 2015 and 2014, 91.31% and62.65%, respectively, are subject to periodic interest repricing. Remaining peso-denominatedloans earned annual EIR ranging from 2.45% to 23.15% and from 7.66% to 35.40% for the yearsended December 31, 2015 and 2014, respectively. All foreign currency-denominated loans of theBank as of December 31, 2015 and 2014 are subject to periodic interest repricing and earnedannual EIR ranging from 1.78% to 6.12% and from 3.85% to 5.75% for the years endedDecember 31, 2015 and 2014, respectively.
All sales contract receivable as of December 31, 2015 and 2014 are subject to periodic interestrepricing.
Regulatory ReportingBSP Circular No. 772 requires banks to compute their net nonperforming loans (NPLs) bydeducting the specific allowance for credit losses on the total loan portfolio from the gross NPLs.The specific allowance for credit losses shall not be deducted from the total loan portfolio incomputing the NPL ratio.
NPLs of the Bank as reported to the BSP follow:
2015 2014Gross NPLs P=2,151,171,796 P=1,482,039,354Less: Deductions as required by the BSP 641,688,625 530,087,367Net NPLs P=1,509,483,171 P=951,951,987
Under current BSP regulations, NPLs shall, as a general rule, refer to loan accounts whoseprincipal and/or interest is unpaid for thirty (30) days or more after due date or after they havebecome past due in accordance with existing rules and regulations. This shall apply to loanspayable in lump sum and loans payable in quarterly, semi-annual, or annual installments, in whichcase, the total outstanding balance thereof shall be considered nonperforming.
In the case of loans that are payable in monthly installments, the total outstanding balance thereofshall be considered nonperforming when three (3) or more installments are in arrears.
In the case of loans that are payable in daily, weekly, or semi-monthly installments, the totaloutstanding balance thereof shall be considered nonperforming at the same time that they becomepast due in accordance with existing BSP regulations, i.e., the entire outstanding balance of theloan shall be considered as past due when the total amount of arrearages reaches ten percent(10.00%) of the total receivable balance.

- 53 -
*SGVFS016291*
Restructured loans which do not meet the requirements to be treated as performing loans shall alsobe considered as NPLs.
As of December 31, 2015 and 2014, secured and unsecured NPLs of the Bank, as reported to theBSP follow:
2015 2014Secured P=1,066,431,601 P=599,889,324Unsecured 1,084,740,195 882,150,030
P=2,151,171,796 P=1,482,039,354
The following table shows the breakdown of loans as to secured and unsecured and the breakdownof secured loans as to type of security (amounts in thousands):
December 31, 2015 December 31, 2014Amount % Amount %
Secured by: Chattel P=20,997,891 35.48 P=15,901,646 32.16 Real estate 6,190,672 10.46 7,245,516 14.65 Deposits hold-out 722,416 1.22 10,334,476 20.90 Others 935,798 1.58 – –
28,846,777 48.74 33,481,638 67.71Unsecured 30,335,782 51.26 15,961,371 32.29
P=59,182,559 100.00 P=49,443,009 100.00
Information on the concentration of credit as to industry on loans follows (amounts in thousands):
December 31, 2015 December 31, 2014Amount % Amount %
Consumer P=29,874,680 50.48 P=21,636,884 43.76Real estate, renting and business services 6,981,991 11.80 7,842,921 15.86Wholesale and retail trade 6,140,744 10.37 6,947,883 14.05Electric, gas and water 3,703,346 6.26 2,473,882 5.00Manufacturing (various industries) 3,390,699 5.73 3,094,046 6.26Financial intermediaries 2,469,254 4.17 1,834,411 3.71Transportation, storage and
communication 1,993,624 3.37 1,822,800 3.70Agriculture, hunting and forestry 1,098,422 1.86 886,193 1.79Mining and quarrying 941,432 1.59 975,552 1.97Hotel and restaurant 935,695 1.58 954,841 1.93Construction 652,284 1.10 351,794 0.71Other community, social and personal activities 592,425 1.00 305,749 0.62Education 308,490 0.52 272,772 0.55Public administration and defense 75,456 0.13 23,577 0.05Health and social work 24,017 0.04 19,704 0.04
P=59,182,559 100.00 P=49,443,009 100.00
The BSP considers that concentration of credit exists when total loan exposure to a particularindustry or economic sector exceeds 30.00% of total loan portfolio.
Receivable from PPI (AR-PPI)As of December 31, 2015 and 2014, receivable from PPI (included under Accounts Receivable -Corporate) had a carrying value of P=565.5 million and P=554.9 million, respectively. Thereceivable bears an interest rate based on one month PDST-F plus 1.00%, repriceable everymonth. Under the Memorandum of Agreement dated September 15, 2009 between the Bank and

- 54 -
*SGVFS016291*
PPI, PPI undertakes to settle the receivable within 10 years beginning October 1, 2009 untilSeptember 30, 2019.
The receivable from PPI is secured by deposit hold-out agreement, executed by the ParentCompany, amounting to US$20.0 million. In the event that PPI fails to perform its obligationunder the Memorandum of Agreement, and that the same is not cured or corrected within a periodof thirty (30) days from notice by the Bank, the Bank is authorized by the Parent Company toimmediately offset and apply the deposit as partial or full payment of the obligation without needof demand.
10. Property and Equipment
The composition of and movements in this account follow:
December 31, 2015
CondominiumUnits
Furniture,Fixtures and
EquipmentLeasehold
ImprovementsConstruction-
in-Progress TotalCostBalances at beginning of year P=262,553,193 P=726,014,886 P=514,483,506 P=– P=1,503,051,585Additions – 79,916,248 29,040,069 – 108,956,317Disposals/write-off – (24,055,565) (744,510) – (24,800,075)Balances at end of year 262,553,193 781,875,569 542,779,065 – 1,587,207,827
Accumulated Depreciation and AmortizationBalances at beginning of year 104,487,978 480,964,530 266,308,080 – 851,760,588Depreciation and amortization 16,601,911 78,055,756 79,998,540 – 174,656,207Disposals/write-off – (18,329,326) – – (18,329,326)Balances at end of year 121,089,889 540,690,960 346,306,620 – 1,008,087,469Net Book Value at end of year P=141,463,304 P=241,184,609 P=196,472,445 P=– P=579,120,358
December 31, 2014
CondominiumUnits
Furniture,Fixtures and
EquipmentLeasehold
ImprovementsConstruction-
in-Progress TotalCostBalances at beginning of year P=294,032,193 P=658,812,748 P=443,898,645 P=1,672,918 P=1,398,416,504Additions – 87,055,295 68,911,943 – 155,967,238Disposals/write-off (31,479,000) (19,853,157) – – (51,332,157)Reclassification – – 1,672,918 (1,672,918) –Balances at end of year 262,553,193 726,014,886 514,483,506 – 1,503,051,585
Accumulated Depreciation and AmortizationBalances at beginning of year 99,690,691 426,603,963 190,613,275 – 716,907,929Depreciation and amortization 18,850,413 72,705,054 75,694,805 – 167,250,272Disposals/write-off (14,053,126) (18,344,487) – – (32,397,613)Balances at end of year 104,487,978 480,964,530 266,308,080 – 851,760,588Net Book Value at end of year P=158,065,215 P=245,050,356 P=248,175,426 P=– P=651,290,997
Depreciation and amortization consist of:
2015 2014Property and equipment P=174,656,207 P=167,250,272Other properties acquired (Note 12) 108,610,488 80,074,709Software costs (Note 12) 13,917,617 8,776,971Investment properties (Note 11) 10,592,084 4,708,530
P=307,776,396 P=260,810,482

- 55 -
*SGVFS016291*
As of December 31, 2015 and 2014, the cost of fully depreciated property and equipment still inuse by the Bank amounted to P=564.8 million and P=434.6 million, respectively.
In 2014, transfers from construction-in-progress account to leasehold improvements amounted toP=1.7 million.
11. Investment Properties
The composition of and movements in this account follow:
December 31, 2015Land Building Total
CostBalances at beginning of year P=174,383,662 P=106,797,829 P=281,181,491Additions (Note 31) 108,795,904 150,213,065 259,008,969Disposals (39,486,400) (20,108,080) (59,594,480)Balances at end of year 243,693,166 236,902,814 480,595,980Accumulated DepreciationBalances at beginning of year – 60,187,406 60,187,406Depreciation – 10,592,084 10,592,084Disposals – (466,480) (466,480)Balances at end of year – 70,313,010 70,313,010Accumulated Impairment LossBalances at beginning of year 17,043,354 4,526,657 21,570,011Provision 157,682 85,200 242,882Disposals (887,360) – (887,360)Balances at end of year 16,313,676 4,611,857 20,925,533Net Book Value at end of year P=227,379,490 P=161,977,947 P=389,357,437
December 31, 2014Land Building Total
CostBalances at beginning of year P=180,437,966 P=87,230,549 P=267,668,515Additions (Note 31) 22,417,424 33,413,472 55,830,896Disposals (28,471,728) (13,846,192) (42,317,920)Balances at end of year 174,383,662 106,797,829 281,181,491Accumulated DepreciationBalances at beginning of year – 65,629,433 65,629,433Depreciation – 4,708,530 4,708,530Disposals – (10,150,557) (10,150,557)Balances at end of year – 60,187,406 60,187,406Accumulated Impairment LossBalances at beginning of year 30,928,136 4,598,697 35,526,833Disposals (1,279,480) – (1,279,480)Reversal (12,605,302) (72,040) (12,677,342)Balances at end of year 17,043,354 4,526,657 21,570,011Net Book Value at end of year P=157,340,308 P=42,083,766 P=199,424,074
Annually, the management reviews the recoverable amount of investment properties. Severalfactors are considered such as real estate prices and physical condition of properties. The fairvalue of the investment properties as of December 31, 2015 and 2014 amounted to P=0.6 billionand P=0.4 billion, respectively, as determined by independent and/or in-house appraisers.Valuations were derived on the basis of recent sales of similar properties in the same areas as theinvestment properties taking into account the economic conditions prevailing at the time thevaluations were made.
The Bank recognized rental income from investment properties, which are leased out underoperating leases, amounting to P=0.9 million and P=19.7 million for the years ended

- 56 -
*SGVFS016291*
December 31, 2015 and 2014, respectively. Direct operating expenses, included in the ‘Litigationand assets acquired expenses’ in the statements of income arising from investment propertiesamounted to P=26.8 million and P=32.0 million for the years ended December 31, 2015 and 2014,respectively.
In 2015, the Bank recognized impairment loss amounting to P=0.2 million. In 2014, the Bankreversed allowance for impairment losses amounting to P=12.7 million.
12. Other Assets
This account consists of:
2015 2014Chattel properties acquired P=309,174,604 P=215,167,621Security deposits 74,598,102 65,157,361Software costs 53,501,892 25,009,466Prepaid expenses 53,376,139 48,098,889Documentary stamps 49,124,472 20,045,744Sundry debits 30,022,323 20,403,744Prepaid interest 6,244,962 5,824,696Miscellaneous 34,480,211 18,666,960
P=610,522,705 P=418,374,481
Prepaid interest as of December 31, 2015 and 2014 represents advance interest payments oncertain time deposit product.
Movements in chattel properties acquired follow:
2015 2014CostBalances at beginning of year P=305,068,723 P=202,137,390Additions (Note 31) 512,397,817 321,079,280Disposals (386,613,969) (218,147,947)Balances at end of year 430,852,571 305,068,723Accumulated DepreciationBalances at beginning of year 89,901,102 47,959,463Depreciation 108,610,488 80,074,709Disposals (76,842,848) (38,133,070)Balances at end of year 121,668,742 89,901,102Accumulated Impairment LossBalances at beginning of year – 332,272Disposals – (272,272)Provision (reversal) 9,225 (60,000)Balances at end of year 9,225 –Net Book Value at end of year P=309,174,604 P=215,167,621
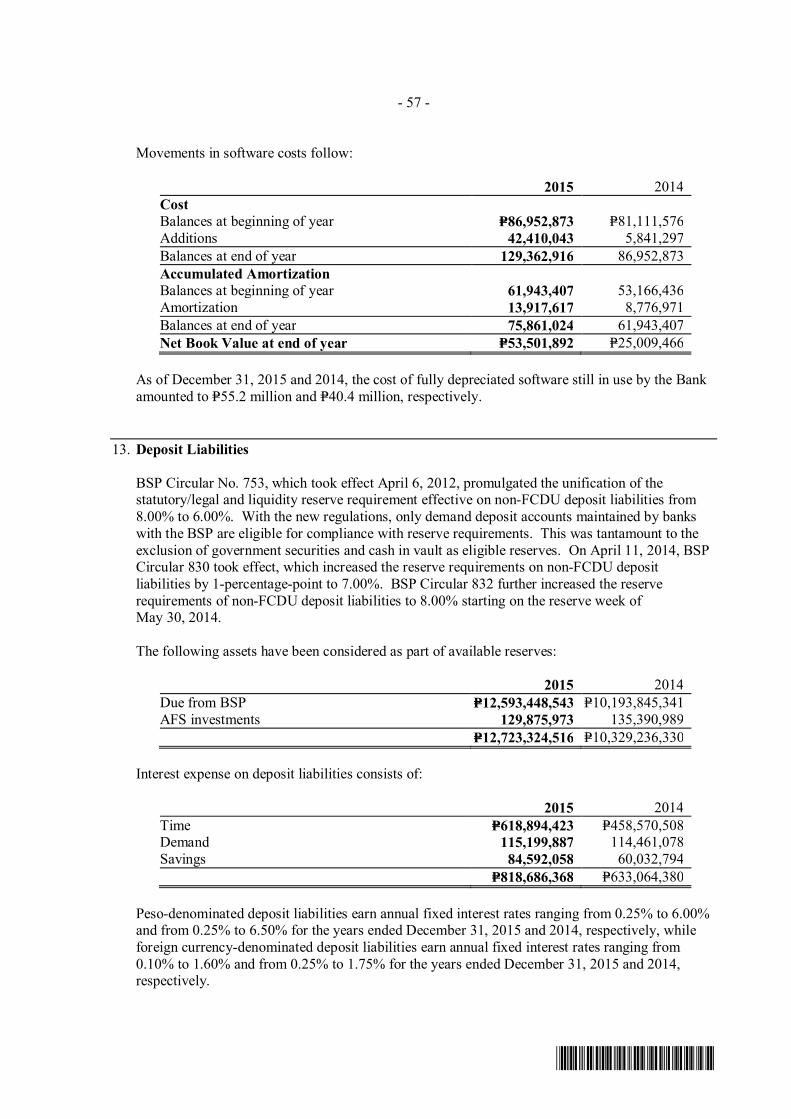
- 57 -
*SGVFS016291*
Movements in software costs follow:
2015 2014CostBalances at beginning of year P=86,952,873 P=81,111,576Additions 42,410,043 5,841,297Balances at end of year 129,362,916 86,952,873Accumulated AmortizationBalances at beginning of year 61,943,407 53,166,436Amortization 13,917,617 8,776,971Balances at end of year 75,861,024 61,943,407Net Book Value at end of year P=53,501,892 P=25,009,466
As of December 31, 2015 and 2014, the cost of fully depreciated software still in use by the Bankamounted to P=55.2 million and P=40.4 million, respectively.
13. Deposit Liabilities
BSP Circular No. 753, which took effect April 6, 2012, promulgated the unification of thestatutory/legal and liquidity reserve requirement effective on non-FCDU deposit liabilities from8.00% to 6.00%. With the new regulations, only demand deposit accounts maintained by bankswith the BSP are eligible for compliance with reserve requirements. This was tantamount to theexclusion of government securities and cash in vault as eligible reserves. On April 11, 2014, BSPCircular 830 took effect, which increased the reserve requirements on non-FCDU depositliabilities by 1-percentage-point to 7.00%. BSP Circular 832 further increased the reserverequirements of non-FCDU deposit liabilities to 8.00% starting on the reserve week ofMay 30, 2014.
The following assets have been considered as part of available reserves:
2015 2014Due from BSP P=12,593,448,543 P=10,193,845,341AFS investments 129,875,973 135,390,989
P=12,723,324,516 P=10,329,236,330
Interest expense on deposit liabilities consists of:
2015 2014Time P=618,894,423 P=458,570,508Demand 115,199,887 114,461,078Savings 84,592,058 60,032,794
P=818,686,368 P=633,064,380
Peso-denominated deposit liabilities earn annual fixed interest rates ranging from 0.25% to 6.00%and from 0.25% to 6.50% for the years ended December 31, 2015 and 2014, respectively, whileforeign currency-denominated deposit liabilities earn annual fixed interest rates ranging from0.10% to 1.60% and from 0.25% to 1.75% for the years ended December 31, 2015 and 2014,respectively.
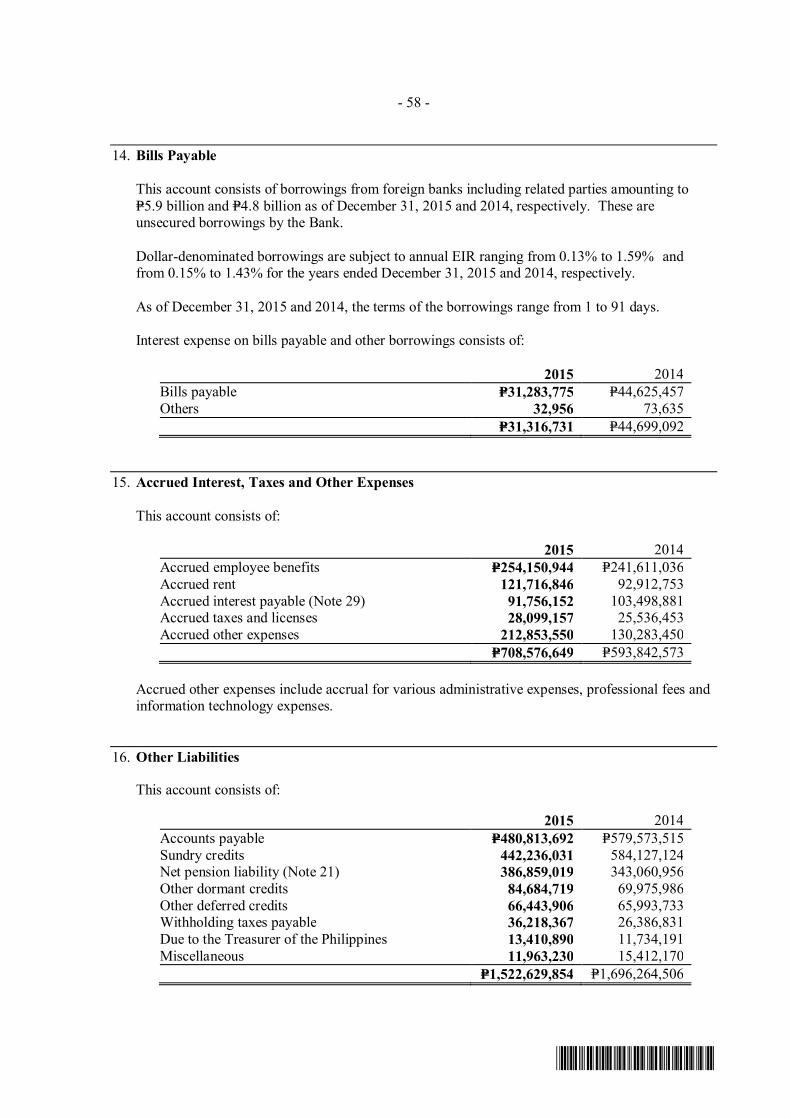
- 58 -
*SGVFS016291*
14. Bills Payable
This account consists of borrowings from foreign banks including related parties amounting toP=5.9 billion and P=4.8 billion as of December 31, 2015 and 2014, respectively. These areunsecured borrowings by the Bank.
Dollar-denominated borrowings are subject to annual EIR ranging from 0.13% to 1.59% andfrom 0.15% to 1.43% for the years ended December 31, 2015 and 2014, respectively.
As of December 31, 2015 and 2014, the terms of the borrowings range from 1 to 91 days.
Interest expense on bills payable and other borrowings consists of:
2015 2014Bills payable P=31,283,775 P=44,625,457Others 32,956 73,635
P=31,316,731 P=44,699,092
15. Accrued Interest, Taxes and Other Expenses
This account consists of:
2015 2014Accrued employee benefits P=254,150,944 P=241,611,036Accrued rent 121,716,846 92,912,753Accrued interest payable (Note 29) 91,756,152 103,498,881Accrued taxes and licenses 28,099,157 25,536,453Accrued other expenses 212,853,550 130,283,450
P=708,576,649 P=593,842,573
Accrued other expenses include accrual for various administrative expenses, professional fees andinformation technology expenses.
16. Other Liabilities
This account consists of:
2015 2014Accounts payable P=480,813,692 P=579,573,515Sundry credits 442,236,031 584,127,124Net pension liability (Note 21) 386,859,019 343,060,956Other dormant credits 84,684,719 69,975,986Other deferred credits 66,443,906 65,993,733Withholding taxes payable 36,218,367 26,386,831Due to the Treasurer of the Philippines 13,410,890 11,734,191Miscellaneous 11,963,230 15,412,170
P=1,522,629,854 P=1,696,264,506
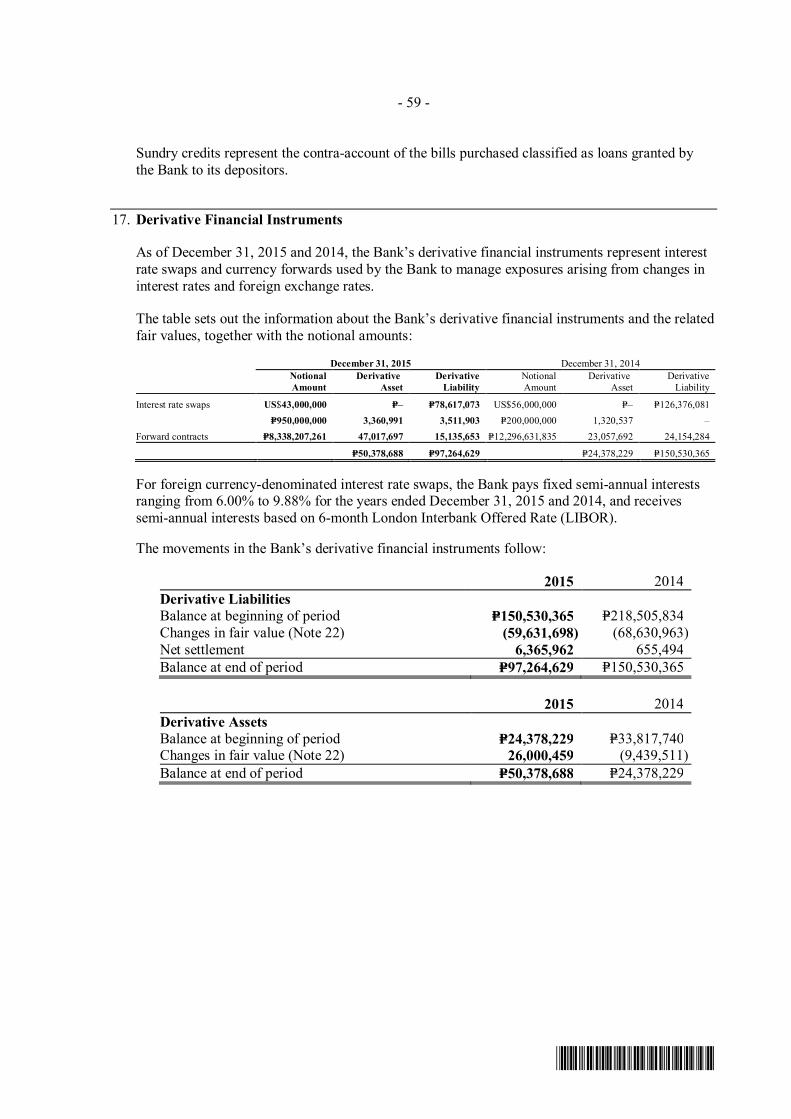
- 59 -
*SGVFS016291*
Sundry credits represent the contra-account of the bills purchased classified as loans granted bythe Bank to its depositors.
17. Derivative Financial Instruments
As of December 31, 2015 and 2014, the Bank’s derivative financial instruments represent interestrate swaps and currency forwards used by the Bank to manage exposures arising from changes ininterest rates and foreign exchange rates.
The table sets out the information about the Bank’s derivative financial instruments and the relatedfair values, together with the notional amounts:
December 31, 2015 December 31, 2014NotionalAmount
DerivativeAsset
DerivativeLiability
NotionalAmount
DerivativeAsset
DerivativeLiability
Interest rate swaps US$43,000,000 P=– P=78,617,073 US$56,000,000 P=– P=126,376,081P=950,000,000 3,360,991 3,511,903 P=200,000,000 1,320,537 –
Forward contracts P=8,338,207,261 47,017,697 15,135,653 P=12,296,631,835 23,057,692 24,154,284
P=50,378,688 P=97,264,629 P=24,378,229 P=150,530,365
For foreign currency-denominated interest rate swaps, the Bank pays fixed semi-annual interestsranging from 6.00% to 9.88% for the years ended December 31, 2015 and 2014, and receivessemi-annual interests based on 6-month London Interbank Offered Rate (LIBOR).
The movements in the Bank’s derivative financial instruments follow:
2015 2014Derivative LiabilitiesBalance at beginning of period P=150,530,365 P=218,505,834Changes in fair value (Note 22) (59,631,698) (68,630,963)Net settlement 6,365,962 655,494Balance at end of period P=97,264,629 P=150,530,365
2015 2014Derivative AssetsBalance at beginning of period P=24,378,229 P=33,817,740Changes in fair value (Note 22) 26,000,459 (9,439,511)Balance at end of period P=50,378,688 P=24,378,229
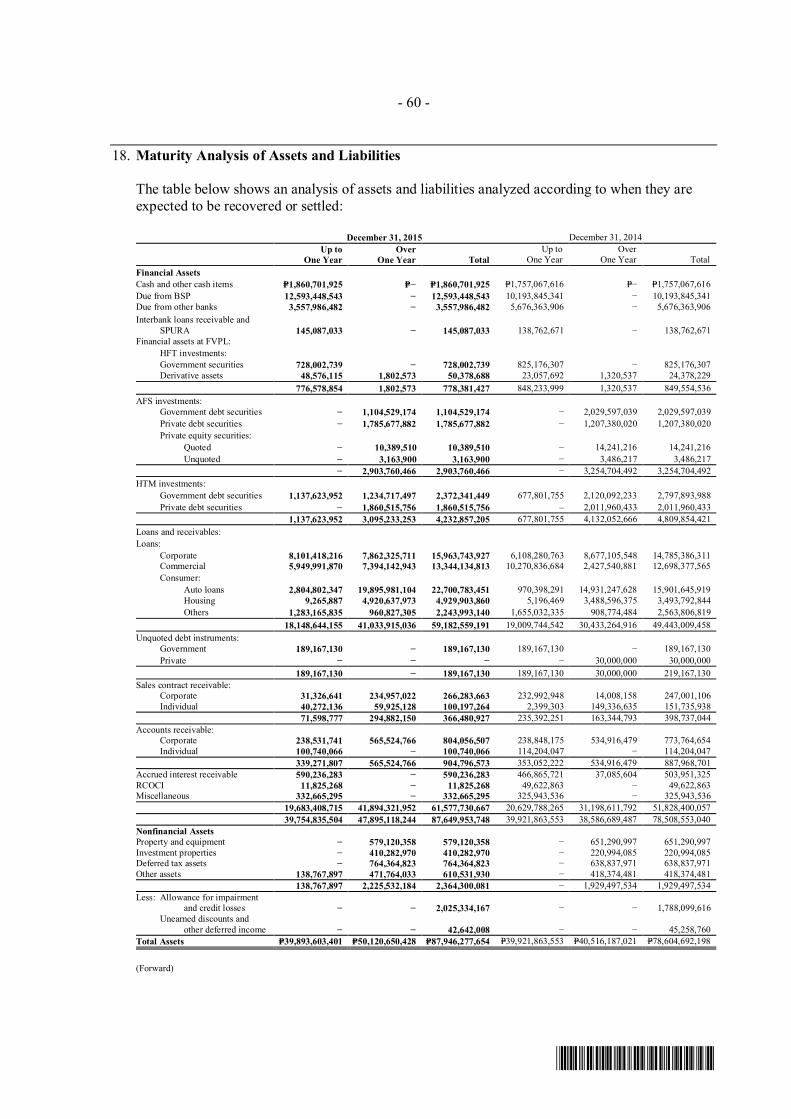
- 60 -
*SGVFS016291*
18. Maturity Analysis of Assets and Liabilities
The table below shows an analysis of assets and liabilities analyzed according to when they areexpected to be recovered or settled:
December 31, 2015 December 31, 2014Up to
One YearOver
One Year TotalUp to
One YearOver
One Year TotalFinancial AssetsCash and other cash items P=1,860,701,925 P=− P=1,860,701,925 P=1,757,067,616 P=− P=1,757,067,616Due from BSP 12,593,448,543 − 12,593,448,543 10,193,845,341 − 10,193,845,341Due from other banks 3,557,986,482 − 3,557,986,482 5,676,363,906 − 5,676,363,906Interbank loans receivable and
SPURA 145,087,033 − 145,087,033 138,762,671 − 138,762,671Financial assets at FVPL:
HFT investments:Government securities 728,002,739 − 728,002,739 825,176,307 − 825,176,307Derivative assets 48,576,115 1,802,573 50,378,688 23,057,692 1,320,537 24,378,229
776,578,854 1,802,573 778,381,427 848,233,999 1,320,537 849,554,536AFS investments:
Government debt securities − 1,104,529,174 1,104,529,174 − 2,029,597,039 2,029,597,039Private debt securities − 1,785,677,882 1,785,677,882 − 1,207,380,020 1,207,380,020Private equity securities:
Quoted − 10,389,510 10,389,510 − 14,241,216 14,241,216Unquoted − 3,163,900 3,163,900 − 3,486,217 3,486,217
− 2,903,760,466 2,903,760,466 − 3,254,704,492 3,254,704,492HTM investments:
Government debt securities 1,137,623,952 1,234,717,497 2,372,341,449 677,801,755 2,120,092,233 2,797,893,988Private debt securities − 1,860,515,756 1,860,515,756 – 2,011,960,433 2,011,960,433
1,137,623,952 3,095,233,253 4,232,857,205 677,801,755 4,132,052,666 4,809,854,421Loans and receivables:Loans:
Corporate 8,101,418,216 7,862,325,711 15,963,743,927 6,108,280,763 8,677,105,548 14,785,386,311Commercial 5,949,991,870 7,394,142,943 13,344,134,813 10,270,836,684 2,427,540,881 12,698,377,565Consumer:
Auto loans 2,804,802,347 19,895,981,104 22,700,783,451 970,398,291 14,931,247,628 15,901,645,919Housing 9,265,887 4,920,637,973 4,929,903,860 5,196,469 3,488,596,375 3,493,792,844Others 1,283,165,835 960,827,305 2,243,993,140 1,655,032,335 908,774,484 2,563,806,819
18,148,644,155 41,033,915,036 59,182,559,191 19,009,744,542 30,433,264,916 49,443,009,458Unquoted debt instruments:
Government 189,167,130 − 189,167,130 189,167,130 − 189,167,130Private − − − − 30,000,000 30,000,000
189,167,130 − 189,167,130 189,167,130 30,000,000 219,167,130Sales contract receivable:
Corporate 31,326,641 234,957,022 266,283,663 232,992,948 14,008,158 247,001,106Individual 40,272,136 59,925,128 100,197,264 2,399,303 149,336,635 151,735,938
71,598,777 294,882,150 366,480,927 235,392,251 163,344,793 398,737,044Accounts receivable:
Corporate 238,531,741 565,524,766 804,056,507 238,848,175 534,916,479 773,764,654Individual 100,740,066 − 100,740,066 114,204,047 − 114,204,047
339,271,807 565,524,766 904,796,573 353,052,222 534,916,479 887,968,701Accrued interest receivable 590,236,283 − 590,236,283 466,865,721 37,085,604 503,951,325RCOCI 11,825,268 − 11,825,268 49,622,863 − 49,622,863Miscellaneous 332,665,295 − 332,665,295 325,943,536 − 325,943,536
19,683,408,715 41,894,321,952 61,577,730,667 20,629,788,265 31,198,611,792 51,828,400,05739,754,835,504 47,895,118,244 87,649,953,748 39,921,863,553 38,586,689,487 78,508,553,040
Nonfinancial AssetsProperty and equipment − 579,120,358 579,120,358 − 651,290,997 651,290,997Investment properties − 410,282,970 410,282,970 − 220,994,085 220,994,085Deferred tax assets − 764,364,823 764,364,823 − 638,837,971 638,837,971Other assets 138,767,897 471,764,033 610,531,930 − 418,374,481 418,374,481
138,767,897 2,225,532,184 2,364,300,081 − 1,929,497,534 1,929,497,534Less: Allowance for impairment
and credit losses − − 2,025,334,167 − − 1,788,099,616Unearned discounts and
other deferred income − − 42,642,008 − − 45,258,760Total Assets P=39,893,603,401 P=50,120,650,428 P=87,946,277,654 P=39,921,863,553 P=40,516,187,021 P=78,604,692,198
(Forward)
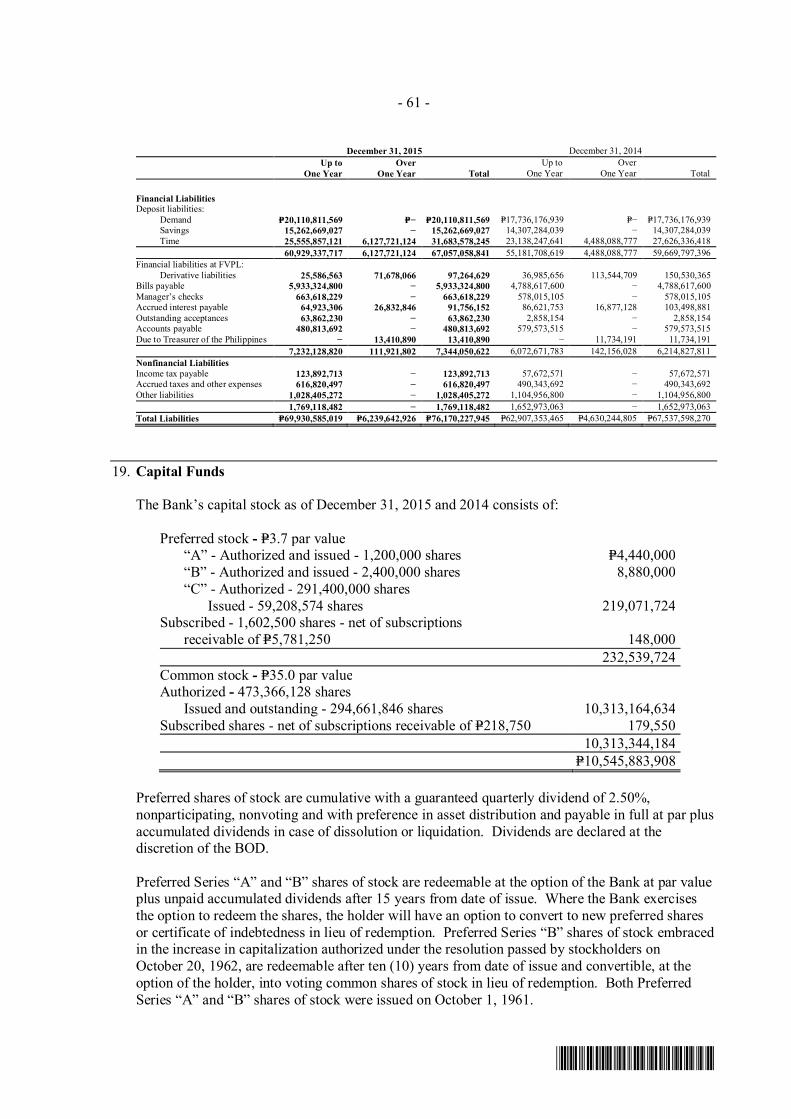
- 61 -
*SGVFS016291*
December 31, 2015 December 31, 2014Up to
One YearOver
One Year TotalUp to
One YearOver
One Year Total
Financial LiabilitiesDeposit liabilities:
Demand P=20,110,811,569 P=− P=20,110,811,569 P=17,736,176,939 P=− P=17,736,176,939Savings 15,262,669,027 − 15,262,669,027 14,307,284,039 − 14,307,284,039Time 25,555,857,121 6,127,721,124 31,683,578,245 23,138,247,641 4,488,088,777 27,626,336,418
60,929,337,717 6,127,721,124 67,057,058,841 55,181,708,619 4,488,088,777 59,669,797,396Financial liabilities at FVPL:
Derivative liabilities 25,586,563 71,678,066 97,264,629 36,985,656 113,544,709 150,530,365Bills payable 5,933,324,800 − 5,933,324,800 4,788,617,600 − 4,788,617,600Manager’s checks 663,618,229 − 663,618,229 578,015,105 − 578,015,105Accrued interest payable 64,923,306 26,832,846 91,756,152 86,621,753 16,877,128 103,498,881Outstanding acceptances 63,862,230 − 63,862,230 2,858,154 − 2,858,154Accounts payable 480,813,692 − 480,813,692 579,573,515 − 579,573,515Due to Treasurer of the Philippines − 13,410,890 13,410,890 − 11,734,191 11,734,191
7,232,128,820 111,921,802 7,344,050,622 6,072,671,783 142,156,028 6,214,827,811Nonfinancial LiabilitiesIncome tax payable 123,892,713 − 123,892,713 57,672,571 − 57,672,571Accrued taxes and other expenses 616,820,497 − 616,820,497 490,343,692 − 490,343,692Other liabilities 1,028,405,272 − 1,028,405,272 1,104,956,800 − 1,104,956,800
1,769,118,482 − 1,769,118,482 1,652,973,063 − 1,652,973,063Total Liabilities P=69,930,585,019 P=6,239,642,926 P=76,170,227,945 P=62,907,353,465 P=4,630,244,805 P=67,537,598,270
19. Capital Funds
The Bank’s capital stock as of December 31, 2015 and 2014 consists of:
Preferred stock - P=3.7 par value“A” - Authorized and issued - 1,200,000 shares P=4,440,000“B” - Authorized and issued - 2,400,000 shares 8,880,000“C” - Authorized - 291,400,000 shares
Issued - 59,208,574 shares 219,071,724Subscribed - 1,602,500 shares - net of subscriptions receivable of P=5,781,250 148,000
232,539,724Common stock - P=35.0 par valueAuthorized - 473,366,128 shares
Issued and outstanding - 294,661,846 shares 10,313,164,634Subscribed shares - net of subscriptions receivable of P=218,750 179,550
10,313,344,184P=10,545,883,908
Preferred shares of stock are cumulative with a guaranteed quarterly dividend of 2.50%,nonparticipating, nonvoting and with preference in asset distribution and payable in full at par plusaccumulated dividends in case of dissolution or liquidation. Dividends are declared at thediscretion of the BOD.
Preferred Series “A” and “B” shares of stock are redeemable at the option of the Bank at par valueplus unpaid accumulated dividends after 15 years from date of issue. Where the Bank exercisesthe option to redeem the shares, the holder will have an option to convert to new preferred sharesor certificate of indebtedness in lieu of redemption. Preferred Series “B” shares of stock embracedin the increase in capitalization authorized under the resolution passed by stockholders onOctober 20, 1962, are redeemable after ten (10) years from date of issue and convertible, at theoption of the holder, into voting common shares of stock in lieu of redemption. Both PreferredSeries “A” and “B” shares of stock were issued on October 1, 1961.
- 62 -
*SGVFS016291*
Preferred Series “C” shares of stock have preference in payment of dividends over other preferredor common shares which have unpaid accumulated and accrued dividends, and are convertibleinto voting common stock at the option of the holder thereof, provided that such conversion bemade only after 7-1/2 years from date of issue. Preferred Series “C” shares of stock were issuedon September 14, 1974.
As of December 31, 2015 and 2014, dividends in arrears on cumulative preferred shares amountedto P=961.9 million and P=938.5 million, respectively.
Treasury shares consist of 5,130 common shares, 38,000 Preferred Series “A” shares of stock and17,150 Preferred Series “B” shares of stock, which are carried at cost.
On July 23, 1997, the Monetary Board (MB) in its Resolution No. 924 approved the quasi-reorganization of the Bank subject to certain conditions which include, among others, restrictionon declaration of dividends until such time that the amount of capital stock differential amountingto P=285.2 million arising from the reduction in the par value closed to deficit is recovered throughearnings.
Employee Stock Option Scheme (ESOS)Prior to August 25, 2009, all employees of the Bank are entitled to a grant of stock options fromthe Parent Company once they have been in service for two years. Options awarded to anemployee that are made available immediately, with no vesting period, are expensed outright.Options which are exercisable based on the schedule in ESOS over a period of five years from thedate of grant are expensed over the vesting period. The exercise price of the options is equal tothe weighted average market price of the shares subject to a discount within the limit allowed bythe relevant authorities but shall, in no event, be less than the par value of the shares. The optionhas a maximum contractual life of five years and has no cash settlement alternatives. The stockoption plan has expired on August 25, 2009.
The cost of the share-based payments arising from this stock option plan from the ParentCompany was recognized as an equity-settled award in the Bank’s financial statements and wasrecognized in equity.
Capital ManagementThe Bank manages its capital to ensure it complies with externally imposed capital requirementsand maintains healthy capital ratios to support business growth and maximize shareholder value.
Regulatory Qualifying CapitalBSP, as the Bank’s lead regulator, sets and monitors capital requirements. Under current bankingregulations, the Bank’s compliance with regulatory requirements and ratios is based on the“unimpaired capital” (regulatory net worth) reported to the BSP, which is determined on the basisof regulatory policies, which differ from PFRS in some respects. Moreover, the risk-based capitalratio of a bank, expressed as a percentage of qualifying capital to risk-weighted assets, should notbe less than ten percent (10.00%). Qualifying capital and risk-weighted assets are computed basedon BSP regulations. The Bank is also required to meet the minimum capital of P=2.4 billion.
Effective January 1, 2014, the Bank complied with BSP Circular No. 781, Basel III ImplementingGuidelines on Minimum Capital Requirements, which provides the implementing guidelines onthe revised risk-based capital adequacy framework particularly on the minimum capital anddisclosure requirements for universal banks and commercial banks, as well as their subsidiarybanks and quasi-banks, in accordance with the Basel III standards.

- 63 -
*SGVFS016291*
The Circular sets out a minimum Common Equity Tier 1 (CET1) ratio of 6.00% and Tier 1 capitalratio of 7.50%. It also introduces a capital conservation buffer of 2.50% comprised of CET1capital. The BSP’s existing requirement for Total CAR remains unchanged at 10.00% and theseratios shall be maintained at all times.
Further, existing capital instruments as of December 31, 2010 which do not meet the eligibilitycriteria for capital instruments under the revised capital framework shall no longer be recognizedas capital upon the effectivity of Basel III. Capital instruments issued under BSP CircularNos. 709 and 716 (the circulars amending the definition of qualifying capital particularly onHybrid Tier 1 and Lower Tier 2 capitals), starting January 1, 2011 and before the effectivity ofBSP Circular No. 781, shall be recognized as qualifying capital until December 31, 2015. Inaddition to changes in minimum capital requirements, this Circular also requires variousregulatory adjustments in the calculation of qualifying capital.
The BSP prescribes certain sanctions for non-compliance with the minimum capital requirementsdepending on the degree of capital deficiency incurred by the Bank such as suspension ofauthority to invest in allied undertakings, branching privileges and declaration of dividends,among others.
On June 27, 2014, the BSP issued Circular No. 839, REST Limit for Real Estate Exposures whichprovides the implementing guidelines on the prudential REST limit for universal, commercial, andthrift banks on their aggregate real estate exposures. The Bank should maintain CET1 and CARlevels at the regulatory prescribed minimums, on a solo and consolidated basis, even after thesimulated results of a 25.00% write-off to the Bank’s real estate exposures. These shall becomplied with at all times.
The table below summarizes the Capital Adequacy Ratio (CAR) of the Bank as reported to theBSP as of December 31, 2015 and 2014 (amounts in thousands):
2015 2014Tier 1 capital P=10,687,471 P=10,167,187Tier 2 capital 801,152 703,854Total Qualifying Capital 11,488,623 P=10,871,041Risk-Weighted Assets P=73,721,327 P=65,238,522Tier 1 capital ratio 14.50% 15.58%Total capital ratio 15.58% 16.66%

- 64 -
*SGVFS016291*
Presented below are the composition of qualifying capital and the related deductions as reported tothe BSP (amounts in millions):
2015 2014Tier 1 Capital:
Paid up common stock P=10,313 P=10,313Additional paid-in capital 263 263Retained earnings 366 (634)Undivided profits 620 354Other Comprehensive Income (134) (101)
Core Tier 1 Capital 11,428 10,195Deductions from Tier 1 capital:
Deferred tax assets 684 –Goodwill and other intangible assets 54 25Other equity investments in non-financial allied undertakings 3 3
Total Deductions 741 28Total Tier 1 Capital 10,687 10,167Tier 2 Capital:
Instruments issued by the bank 569 472General loan loss provision 232 232
Total Tier 2 Capital 801 704Qualifying Capital:
Net Tier 1 capital 10,687 10,167Net Tier 2 capital 801 704
Total Qualifying Capital 11,488 10,871Capital requirements:
Credit risk 66,842 59,327Market risk 1,020 1,181Operational risk 5,859 4,731
Total Capital Requirements P=73,721 P=65,239Common equity Tier 1 ratio 14.50% 15.58%Tier 1 capital ratio 14.50% 15.58%Total capital ratio 15.58% 16.66%
Qualifying capital and risk-weighted assets (RWA) are computed based on BSP regulations.Under Basel III, the regulatory Gross Qualifying Capital of the Bank consists of Tier 1 (core),composed of Common Equity Tier 1 and Additional Tier 1, and Tier 2 (supplementary) capital.Tier 1 capital comprises share capital, retained earnings (including current year profit) and non-controlling interest less required deductions such as deferred income tax and unsecured creditaccommodations to DOSRI. Tier 2 capital includes unsecured subordinated debts, revaluationreserves and general loan loss provision. Certain items are deducted from the regulatory GrossQualifying Capital, such as but not limited to, equity investments in unconsolidated subsidiarybanks and other financial allied undertakings, but excluding investments in debt capitalinstruments of unconsolidated subsidiary banks and equity investments in subsidiary and non-financial allied undertakings.
Risk-weighted assets are determined by assigning defined risk weights to the statements offinancial position exposure and to the credit equivalent amounts of off-balance sheet exposures.Certain items are deducted from risk-weighted assets, such as the excess of general loan lossprovision over the amount permitted to be included in Tier 2 capital. The risk weights vary from
- 65 -
*SGVFS016291*
0.00% to 150.00% depending on the type of exposure, with the risk weights of off-balance sheetexposures being subjected further to credit conversion factors. Below is a summary of riskweights and selected exposure types:
Risk weight Exposure/Asset type*0.00% Cash on hand; claims collateralized by securities issued by the national
government, BSP; loans covered by the Trade and InvestmentDevelopment Corporation of the Philippines; real estate mortgages coveredby the Home Guarantee Corporation
20.00% COCI, claims guaranteed by Philippine incorporated banks/quasi-bankswith the highest credit quality; claims guaranteed by foreign incorporatedbanks with the highest credit quality; loans to exporters to the extentguaranteed by Small Business Guarantee and Finance Corporation
50.00% Housing loans fully secured by first mortgage on residential property;Local Government Unit (LGU) bonds which are covered by Deed ofAssignment of Internal Revenue allotment of the LGU and guaranteed bythe LGU Guarantee Corporation
75.00% Direct loans of defined Small Medium Enterprise (SME) and microfinanceloans portfolio; nonperforming housing loans fully secured by firstmortgage
100.00% All other assets (e.g., real estate assets) excluding those deducted fromcapital (e.g., deferred income tax)
150.00% All nonperforming loans (except nonperforming housing loans fullysecured by first mortgage) and all nonperforming debt securities
* Not all inclusive
With respect to off-balance sheet exposures, the exposure amount is multiplied by a creditconversion factor (CCF), ranging from 0.00% to 100.00%, to arrive at the credit equivalentamount, before the risk weight factor is multiplied to arrive at the risk-weighted exposure. Directcredit substitutes (e.g., guarantees) have a CCF of 100.00%, while items not involving credit riskhas a CCF of 0.00%.
In the case of derivatives, the credit equivalent amount (against which the risk weight factor ismultiplied to arrive at the risk-weighted exposure) is generally the sum of the current creditexposure or replacement cost (the positive fair value or zero if the fair value is negative or zero)and an estimate of the potential future credit exposure or add-on. The add-on ranges from 0.00%to 1.50% (interest rate-related) and from 1.00% to 7.50% (exchange rate-related), depending onthe residual maturity of the contract. For credit-linked notes and similar instruments, the risk-weighted exposure is the higher of the exposure based on the risk weight of the issuer’s collateralor the reference entity or entities.
The risk-weighted CAR is calculated by dividing the sum of its Tier 1 and Tier 2 capital, asdefined under BSP regulations, by its risk-weighted assets. The risk-weighted assets, as definedby the BSP regulations, consist of all of the assets on the balance sheet at their respective bookvalues, together with certain other off-balance sheet items, weighted by certain percentagesdepending on the risks associated with the type of assets. The determination of compliance withregulatory requirements and ratios is based on the amount of the Bank’s ‘unimpaired capital’
- 66 -
*SGVFS016291*
(regulatory net worth) as reported to the BSP, which is determined on the basis of regulatoryaccounting practices which differ from PFRS in some respects.
As of December 31, 2015 and 2014, the Bank has complied with the CAR requirement of theBSP.
Internal Capital Adequacy Assessment Process (ICAAP)In 2009, the BSP issued Circular No. 639 covering the ICAAP which supplements the BSP’s risk-based capital adequacy framework under BSP Circular No. 538. The Bank has a Board-approvedICAAP Framework with areas that cover Capital Management, Pillar 1 and Pillar 2 RiskMeasurement, Minimum Internal Capital Requirement Calculation, Use of the ICAAP,Governance Structure, and Reporting Framework. The Bank complies with the required annualsubmission of updated ICAAP.
Surplus reserves of the Bank consist of reserve for:
2015 2014Self-insurance P=25,070,000 P=25,070,000Trust business 13,760,026 10,384,294Contingencies 3,500,000 3,500,000
P=42,330,026 P=38,954,294
In compliance with existing BSP regulations, 10.00% of the net profits realized by the Bank fromits trust business are appropriated to surplus reserve. The yearly appropriation is required until thesurplus reserve for trust business equals 20.00% of the Bank’s regulatory capital.
Reserve for self-insurance represents the amount set aside to cover losses due to fire, defalcationby and other unlawful acts of the Bank’s personnel or third parties.
Financial PerformanceThe following basic ratios measure the financial performance of the Bank:
2015 2014Return on average equity 6.10% 9.55%Return on average assets 0.84% 1.32%Net interest margin 5.37% 5.01%
20. Interest Income on Financial Investments
This account consists of interest income on:
2015 2014Financial assets at FVPL P=33,602,167 P=53,751,027AFS investments 118,891,109 112,693,498HTM investments 218,759,715 237,625,729
P=371,252,991 P=404,070,254
Peso-denominated HFT investments bear nominal interest rates ranging from 2.12% to 9.12% andfrom 1.63% to 12.38% for the years ended December 31, 2015 and 2014, respectively.
- 67 -
*SGVFS016291*
Peso-denominated AFS investments bear nominal interest rates ranging from 3.50% to 7.88% andfrom 5.75% to 7.38% for the years ended December 31, 2015 and 2014, respectively. Foreigncurrency-denominated AFS investments bear nominal interest rates ranging from 3.95% to 7.38%and from 4.38% to 7.75% for the years ended December 31, 2015 and 2014, respectively.
Peso-denominated HTM investments bear nominal interest rates ranging from 5.20% to 9.12%and from 5.20% to 12.38% for the years ended December 31, 2015 and 2014, respectively.Foreign currency-denominated HTM investments bear nominal interest rates ranging from 5.50%to 9.88% and from 5.25% to 9.88% for the years ended December 31, 2015 and 2014,respectively.
Interest income on AFS debt securities is net of premium and discount amortization amounting toP=31.9 million and P=31.4 million for the years ended December 31, 2015 and 2014, respectively.
Interest income on HTM investments is net of premium and discount amortization amounting toP=77.2 million and P=65.8 million for the years ended December 31, 2015 and 2014, respectively.
21. Retirement Plan
The Bank has a funded noncontributory defined benefit retirement plan (the Plan) coveringsubstantially all of its officers and regular employees. Under the Plan, all covered officers andemployees are entitled to cash benefits (equivalent to 120% and 110%, respectively, of the finalmonthly salary for every year of service) after satisfying certain age and service requirements.The Bank’s retirement plan is in the form of a trust administered by the Bank’s Trust Divisionunder the supervision of the Staff Committee.
Under the existing regulatory framework, Republic Act 7641 requires companies with at least ten(10) employees to pay retirement benefits to qualified private sector employees in the absence ofany retirement plan in the entity, provided however that the employee’s retirement benefits underany collective bargaining and other agreements shall not be less than those provided under thelaw. The law does not require minimum funding of the plan.
The net pension liability included in ‘Other liabilities’ in the statements of financial position is asfollows:
2015 2014Present value of the defined benefit obligation P=509,211,254 P=430,683,283Fair value of plan assets (122,352,235) (87,622,327)Net pension liability P=386,859,019 P=343,060,956

- 68 -
*SGVFS016291*
Changes in the present value of the defined benefit obligation as of December 31, 2015 and 2014recognized in the statements of financial position follow:
2015 2014Balance at beginning of year P=430,683,283 P=369,960,700Current service cost 68,441,334 56,400,939Interest cost 20,155,978 16,082,650Remeasurement loss (gain):
Actuarial loss (gain) arising from changes in financial assumptions (20,821,391) 86,996Actuarial gain arising from changes in demographic assumptions (11,388,475) −Actuarial loss arising from experience adjustment 57,505,906 28,948,406
Benefits paid (35,365,381) (40,796,408)Balance at end of year P=509,211,254 P=430,683,283
Changes in fair value of plan assets are as follows:
2015 2014Balance at beginning of year P=87,622,327 P=105,097,106Contributions 72,000,000 24,124,900Interest income 4,100,725 4,386,310Remeasurements (6,005,436) (5,189,581)Benefits paid (35,365,381) (40,796,408)Balance at end of year P=122,352,235 P=87,622,327
The fair value of plan assets by each class is as follows:
2015 2014Cash and cash equivalents P=81,034,572 P=49,926,293Accrued interest and other receivables 564,714 7,825,095Debt instruments
Government securities 183,891 6,213,451Private securities 19,170,058 4,643,288
Equity instrumentsManufacturing 17,493,000 13,924,200Wholesale and Retail 3,906,000 5,090,000
Fair value of plan assets P=122,352,235 P=87,622,327
The Bank’s plan assets are carried at fair value. All equity and debt instruments held have quotedprices in active market. The fair value of cash and cash equivalents, accrued interest and otherreceivables approximates its carrying amount due to the short-term nature of these accounts.Each year, an Asset-Liability Matching Study (ALM) is performed with the result being analyzedin terms of risk-and-return profiles. The portfolio mix of the Bank’s plan assets as ofDecember 31, 2015 and 2014 was approved by the Staff Committee.
The Bank expects to contribute P=97.2 million to the plan in 2016.

- 69 -
*SGVFS016291*
The cost of defined benefit retirement plans as well as the present value of the benefit obligation isdetermined using actuarial valuations. The actuarial valuation involves making variousassumptions. The principal assumptions used are shown below:
2015 2014Discount rate
At January 1 4.68% 4.68%At December 31 5.09% 4.68%
Future salary increase rate 6.50% 6.50%Average remaining working life 11 14
The sensitivity analysis below has been determined based on reasonably possible changes of eachsignificant assumption on the defined benefit obligation as of December 31, 2015 and 2014,assuming all other assumptions were held constant.
2015 2014Increase in discount rate by 1% (P=49,588,596) (P=2,947,250)Decrease in discount rate by 1% 58,642,272 67,246,553Increase in salary increase rate by 1% 55,420,872 62,999,215Decrease in salary increase rate by 1% (47,998,255) (53,263,107)
The amounts included in ‘Compensation and fringe benefits’ expense in the statements of incomeare as follows:
2015 2014Current service cost P=68,441,334 P=56,400,939Net interest income 16,055,253 11,696,340Expense recognized during the year P=84,496,587 P=68,097,279
The Bank also has a defined contribution plan for certain employees. The pension expenserecognized under this plan amounting to P=19.1 million and P=17.2 million for the years endedDecember 31, 2015 and 2014, respectively, is included in ‘Compensation and fringe benefits’ inthe statements of income.
The average duration of the retirement liability is 19.71 years in 2015. Maturity analysis of theundiscounted benefit payments follow:
NormalRetirement
Other than NormalRetirement Total
Less than one year P=19,555,188 P=16,752,877 P=36,308,065More than one to five years 90,983,209 128,387,838 219,371,047More than five to 10 years 72,731,865 180,080,886 252,812,751More than 10 to 15 years 479,178,463 185,098,976 664,277,339More than 15 to 20 years 626,186,569 143,162,060 769,348,629More than 20 years 1,437,766,804 195,563,687 1,633,330,491
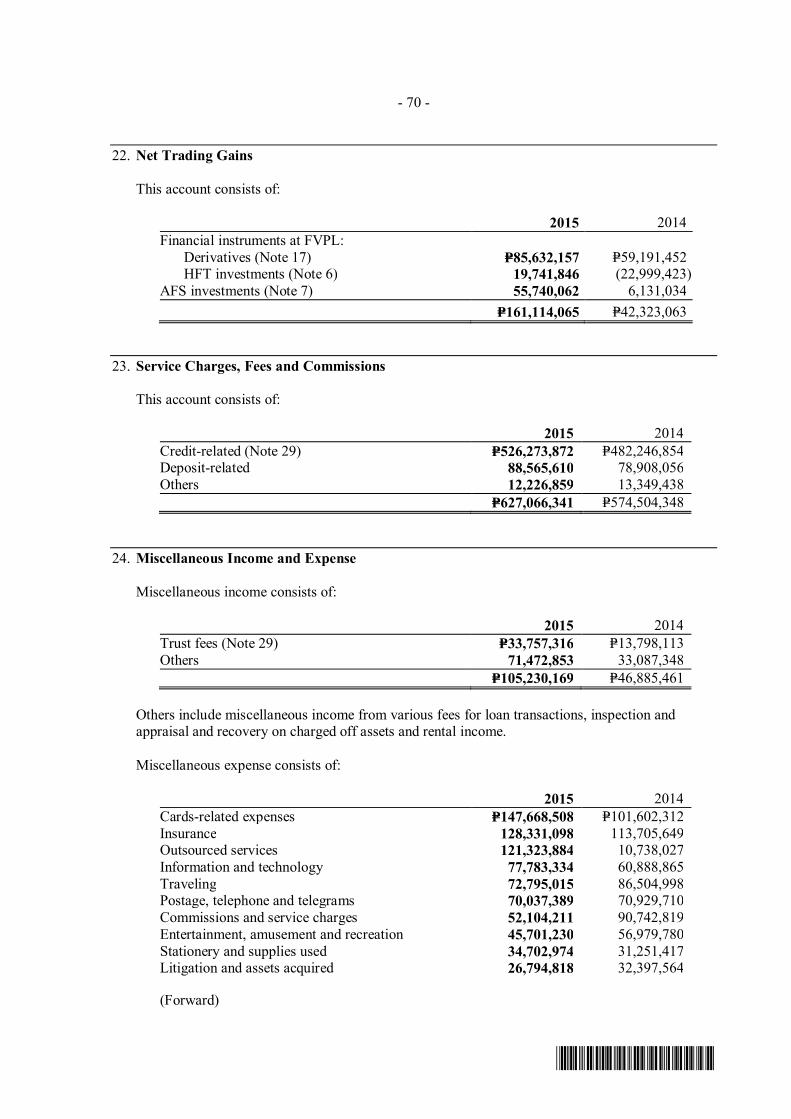
- 70 -
*SGVFS016291*
22. Net Trading Gains
This account consists of:
2015 2014Financial instruments at FVPL:
Derivatives (Note 17) P=85,632,157 P=59,191,452HFT investments (Note 6) 19,741,846 (22,999,423)
AFS investments (Note 7) 55,740,062 6,131,034P=161,114,065 P=42,323,063
23. Service Charges, Fees and Commissions
This account consists of:
2015 2014Credit-related (Note 29) P=526,273,872 P=482,246,854Deposit-related 88,565,610 78,908,056Others 12,226,859 13,349,438
P=627,066,341 P=574,504,348
24. Miscellaneous Income and Expense
Miscellaneous income consists of:
2015 2014Trust fees (Note 29) P=33,757,316 P=13,798,113Others 71,472,853 33,087,348
P=105,230,169 P=46,885,461
Others include miscellaneous income from various fees for loan transactions, inspection andappraisal and recovery on charged off assets and rental income.
Miscellaneous expense consists of:
2015 2014Cards-related expenses P=147,668,508 P=101,602,312Insurance 128,331,098 113,705,649Outsourced services 121,323,884 10,738,027Information and technology 77,783,334 60,888,865Traveling 72,795,015 86,504,998Postage, telephone and telegrams 70,037,389 70,929,710Commissions and service charges 52,104,211 90,742,819Entertainment, amusement and recreation 45,701,230 56,979,780Stationery and supplies used 34,702,974 31,251,417Litigation and assets acquired 26,794,818 32,397,564
(Forward)
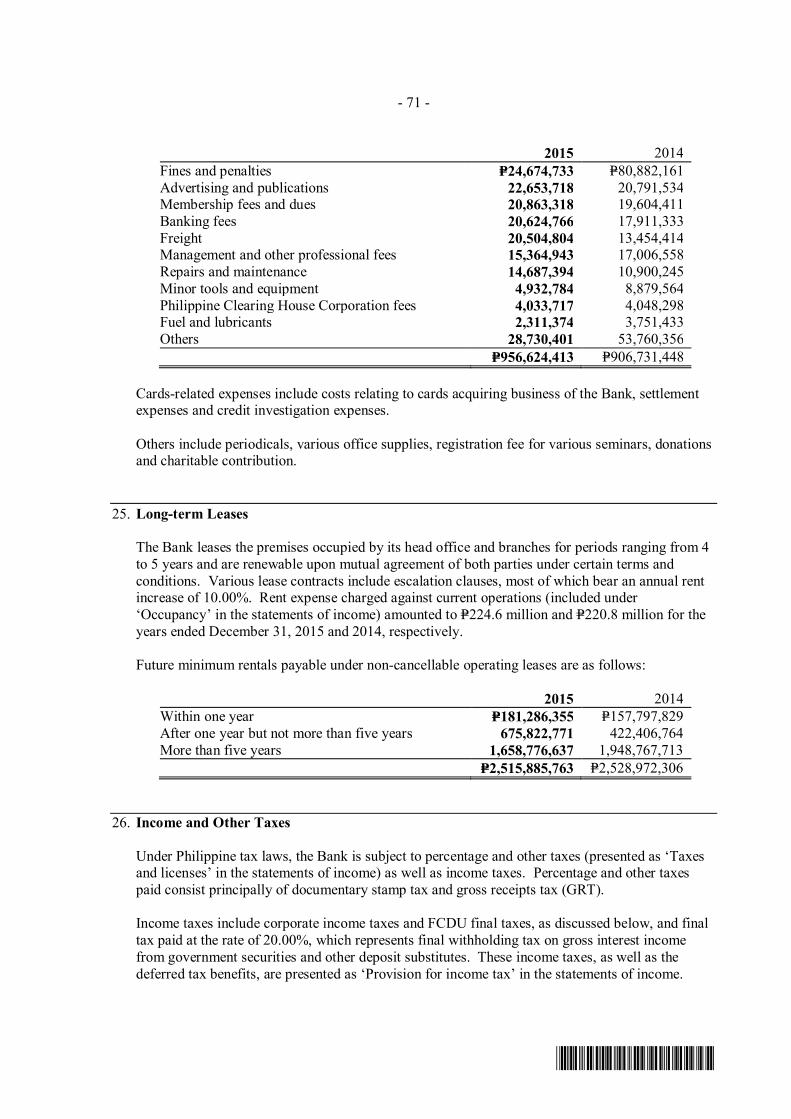
- 71 -
*SGVFS016291*
2015 2014Fines and penalties P=24,674,733 P=80,882,161Advertising and publications 22,653,718 20,791,534Membership fees and dues 20,863,318 19,604,411Banking fees 20,624,766 17,911,333Freight 20,504,804 13,454,414Management and other professional fees 15,364,943 17,006,558Repairs and maintenance 14,687,394 10,900,245Minor tools and equipment 4,932,784 8,879,564Philippine Clearing House Corporation fees 4,033,717 4,048,298Fuel and lubricants 2,311,374 3,751,433Others 28,730,401 53,760,356
P=956,624,413 P=906,731,448
Cards-related expenses include costs relating to cards acquiring business of the Bank, settlementexpenses and credit investigation expenses.
Others include periodicals, various office supplies, registration fee for various seminars, donationsand charitable contribution.
25. Long-term Leases
The Bank leases the premises occupied by its head office and branches for periods ranging from 4to 5 years and are renewable upon mutual agreement of both parties under certain terms andconditions. Various lease contracts include escalation clauses, most of which bear an annual rentincrease of 10.00%. Rent expense charged against current operations (included under‘Occupancy’ in the statements of income) amounted to P=224.6 million and P=220.8 million for theyears ended December 31, 2015 and 2014, respectively.
Future minimum rentals payable under non-cancellable operating leases are as follows:
2015 2014Within one year P=181,286,355 P=157,797,829After one year but not more than five years 675,822,771 422,406,764More than five years 1,658,776,637 1,948,767,713
P=2,515,885,763 P=2,528,972,306
26. Income and Other Taxes
Under Philippine tax laws, the Bank is subject to percentage and other taxes (presented as ‘Taxesand licenses’ in the statements of income) as well as income taxes. Percentage and other taxespaid consist principally of documentary stamp tax and gross receipts tax (GRT).
Income taxes include corporate income taxes and FCDU final taxes, as discussed below, and finaltax paid at the rate of 20.00%, which represents final withholding tax on gross interest incomefrom government securities and other deposit substitutes. These income taxes, as well as thedeferred tax benefits, are presented as ‘Provision for income tax’ in the statements of income.
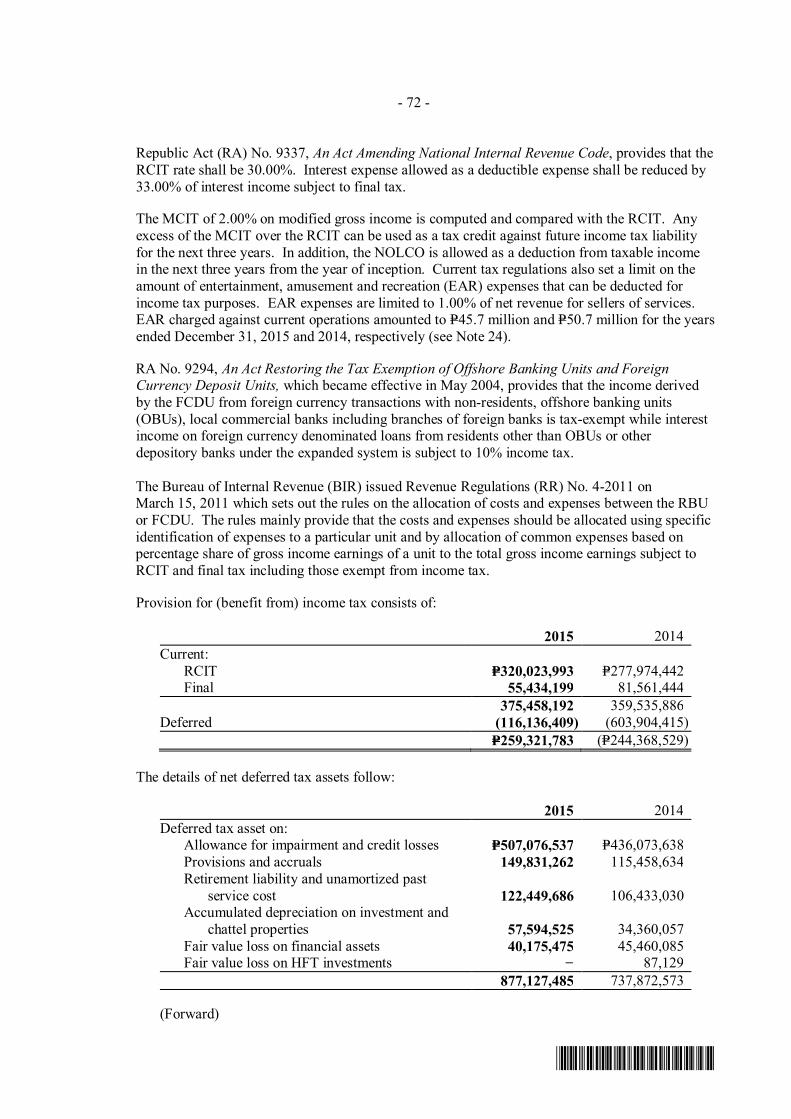
- 72 -
*SGVFS016291*
Republic Act (RA) No. 9337, An Act Amending National Internal Revenue Code, provides that theRCIT rate shall be 30.00%. Interest expense allowed as a deductible expense shall be reduced by33.00% of interest income subject to final tax.
The MCIT of 2.00% on modified gross income is computed and compared with the RCIT. Anyexcess of the MCIT over the RCIT can be used as a tax credit against future income tax liabilityfor the next three years. In addition, the NOLCO is allowed as a deduction from taxable incomein the next three years from the year of inception. Current tax regulations also set a limit on theamount of entertainment, amusement and recreation (EAR) expenses that can be deducted forincome tax purposes. EAR expenses are limited to 1.00% of net revenue for sellers of services.EAR charged against current operations amounted to P=45.7 million and P=50.7 million for the yearsended December 31, 2015 and 2014, respectively (see Note 24).
RA No. 9294, An Act Restoring the Tax Exemption of Offshore Banking Units and ForeignCurrency Deposit Units, which became effective in May 2004, provides that the income derivedby the FCDU from foreign currency transactions with non-residents, offshore banking units(OBUs), local commercial banks including branches of foreign banks is tax-exempt while interestincome on foreign currency denominated loans from residents other than OBUs or otherdepository banks under the expanded system is subject to 10% income tax.
The Bureau of Internal Revenue (BIR) issued Revenue Regulations (RR) No. 4-2011 onMarch 15, 2011 which sets out the rules on the allocation of costs and expenses between the RBUor FCDU. The rules mainly provide that the costs and expenses should be allocated using specificidentification of expenses to a particular unit and by allocation of common expenses based onpercentage share of gross income earnings of a unit to the total gross income earnings subject toRCIT and final tax including those exempt from income tax.
Provision for (benefit from) income tax consists of:
2015 2014Current:
RCIT P=320,023,993 P=277,974,442Final 55,434,199 81,561,444
375,458,192 359,535,886Deferred (116,136,409) (603,904,415)
P=259,321,783 (P=244,368,529)
The details of net deferred tax assets follow:
2015 2014Deferred tax asset on:
Allowance for impairment and credit losses P=507,076,537 P=436,073,638Provisions and accruals 149,831,262 115,458,634Retirement liability and unamortized past service cost 122,449,686 106,433,030Accumulated depreciation on investment and
chattel properties 57,594,525 34,360,057Fair value loss on financial assets 40,175,475 45,460,085Fair value loss on HFT investments − 87,129
877,127,485 737,872,573
(Forward)
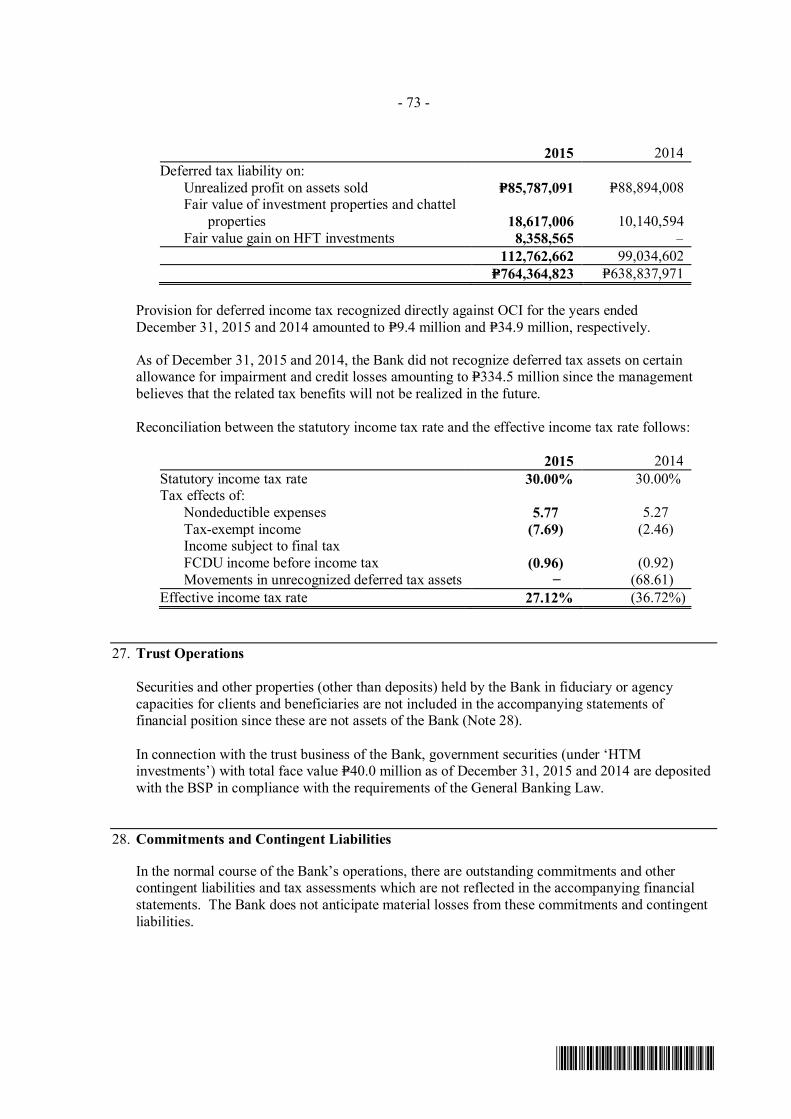
- 73 -
*SGVFS016291*
2015 2014Deferred tax liability on:
Unrealized profit on assets sold P=85,787,091 P=88,894,008Fair value of investment properties and chattel
properties 18,617,006 10,140,594Fair value gain on HFT investments 8,358,565 –
112,762,662 99,034,602P=764,364,823 P=638,837,971
Provision for deferred income tax recognized directly against OCI for the years endedDecember 31, 2015 and 2014 amounted to P=9.4 million and P=34.9 million, respectively.
As of December 31, 2015 and 2014, the Bank did not recognize deferred tax assets on certainallowance for impairment and credit losses amounting to P=334.5 million since the managementbelieves that the related tax benefits will not be realized in the future.
Reconciliation between the statutory income tax rate and the effective income tax rate follows:
2015 2014Statutory income tax rate 30.00% 30.00%Tax effects of:
Nondeductible expenses 5.77 5.27Tax-exempt income (7.69) (2.46)Income subject to final taxFCDU income before income tax (0.96) (0.92)Movements in unrecognized deferred tax assets − (68.61)
Effective income tax rate 27.12% (36.72%)
27. Trust Operations
Securities and other properties (other than deposits) held by the Bank in fiduciary or agencycapacities for clients and beneficiaries are not included in the accompanying statements offinancial position since these are not assets of the Bank (Note 28).
In connection with the trust business of the Bank, government securities (under ‘HTMinvestments’) with total face value P=40.0 million as of December 31, 2015 and 2014 are depositedwith the BSP in compliance with the requirements of the General Banking Law.
28. Commitments and Contingent Liabilities
In the normal course of the Bank’s operations, there are outstanding commitments and othercontingent liabilities and tax assessments which are not reflected in the accompanying financialstatements. The Bank does not anticipate material losses from these commitments and contingentliabilities.

- 74 -
*SGVFS016291*
Reg ulatory ReportingThe following is a summary of the Bank’s commitments and contingent liabilities at theirequivalent peso contractual amounts:
2015 2014Forward exchange bought P=8,353,523,611 P=12,285,377,285Forward exchange sold 8,326,223,261 12,290,668,335Trust department accounts (Note 27) 5,207,487,243 832,229,385Interest rate swap payable 2,973,580,000 2,704,320,000Interest rate swap receivable 2,973,580,000 2,704,320,000Unused commercial letters of credit 1,729,203,096 1,613,911,030Export letters of credit-confirmed 854,220,646 819,355,230Outstanding guarantees 643,923,251 496,580,545Deficiency claims receivable 371,913,034 336,804,531Spot exchange sold 306,485,000 2,146,750,000Spot exchange bought 230,173,319 2,146,875,000Broker customer securities account 119,848,355 −Late deposits and payments received 29,602,364 43,391,143Outward bills for collection 29,094,359 23,596,343Inward bills for collection 21,776,338 522,515,450Items held for safekeeping 18,847 25,119Items held as collateral 7,599 8,548Others − 86
29. Related Party Transactions
Parties are considered to be related if one party has the ability, directly or indirectly, to control theother party or exercise significant influence over the other party in making financial and operatingdecisions or if they are subject to common control or common significant influence such assubsidiaries and associates of subsidiaries or other related parties. Related parties may beindividuals or corporate entities.
The Bank has several business relationships with related parties. Transactions with such partiesare made in the ordinary course of business and on substantially same terms, including interest andcollateral, as those prevailing at the time for comparable transactions with other parties. Thesetransactions also did not involve more than the normal risk of collectability or present otherunfavorable conditions.
Transactions with Retirement PlanThe retirement fund of the Bank’s employees with a fair value amounting to P=122.4 million andP=87.6 million as of December 31, 2015 and 2014, respectively, is being managed by the Bank’sTrust Department. The transaction was made substantially on the same terms as with otherindividuals and businesses of comparable risks. Other than deposits with the Bank and trust fees,there were no other material transactions between the retirement fund and the Bank in 2015 and2014. Deposits with the Bank amounted to P=21.0 million and P=49.9 million as ofDecember 31, 2015 and 2014, respectively. The Bank earned P=1.2 million and P=1.4 million astrust fees for the years ended December 31, 2015 and 2014, respectively.
Refer to Note 21 for the details of the assets and investments of the retirement fund. Theretirement fund of the Bank does not have investments in the shares of stock of the Bank.
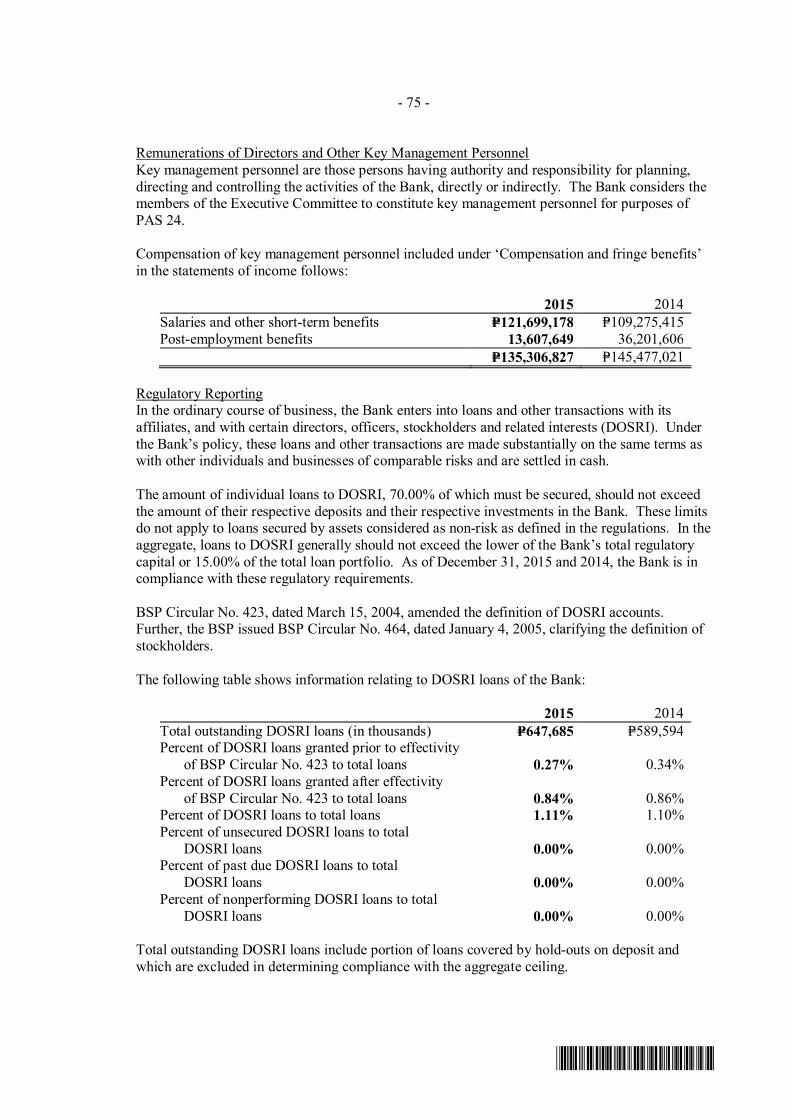
- 75 -
*SGVFS016291*
Remunerations of Directors and Other Key Management PersonnelKey management personnel are those persons having authority and responsibility for planning,directing and controlling the activities of the Bank, directly or indirectly. The Bank considers themembers of the Executive Committee to constitute key management personnel for purposes ofPAS 24.
Compensation of key management personnel included under ‘Compensation and fringe benefits’in the statements of income follows:
2015 2014Salaries and other short-term benefits P=121,699,178 P=109,275,415Post-employment benefits 13,607,649 36,201,606
P=135,306,827 P=145,477,021
Regulatory ReportingIn the ordinary course of business, the Bank enters into loans and other transactions with itsaffiliates, and with certain directors, officers, stockholders and related interests (DOSRI). Underthe Bank’s policy, these loans and other transactions are made substantially on the same terms aswith other individuals and businesses of comparable risks and are settled in cash.
The amount of individual loans to DOSRI, 70.00% of which must be secured, should not exceedthe amount of their respective deposits and their respective investments in the Bank. These limitsdo not apply to loans secured by assets considered as non-risk as defined in the regulations. In theaggregate, loans to DOSRI generally should not exceed the lower of the Bank’s total regulatorycapital or 15.00% of the total loan portfolio. As of December 31, 2015 and 2014, the Bank is incompliance with these regulatory requirements.
BSP Circular No. 423, dated March 15, 2004, amended the definition of DOSRI accounts.Further, the BSP issued BSP Circular No. 464, dated January 4, 2005, clarifying the definition ofstockholders.
The following table shows information relating to DOSRI loans of the Bank:
2015 2014Total outstanding DOSRI loans (in thousands) P=647,685 P=589,594Percent of DOSRI loans granted prior to effectivity
of BSP Circular No. 423 to total loans 0.27% 0.34%Percent of DOSRI loans granted after effectivity
of BSP Circular No. 423 to total loans 0.84% 0.86%Percent of DOSRI loans to total loans 1.11% 1.10%Percent of unsecured DOSRI loans to total
DOSRI loans 0.00% 0.00%Percent of past due DOSRI loans to total
DOSRI loans 0.00% 0.00%Percent of nonperforming DOSRI loans to total
DOSRI loans 0.00% 0.00%
Total outstanding DOSRI loans include portion of loans covered by hold-outs on deposit andwhich are excluded in determining compliance with the aggregate ceiling.
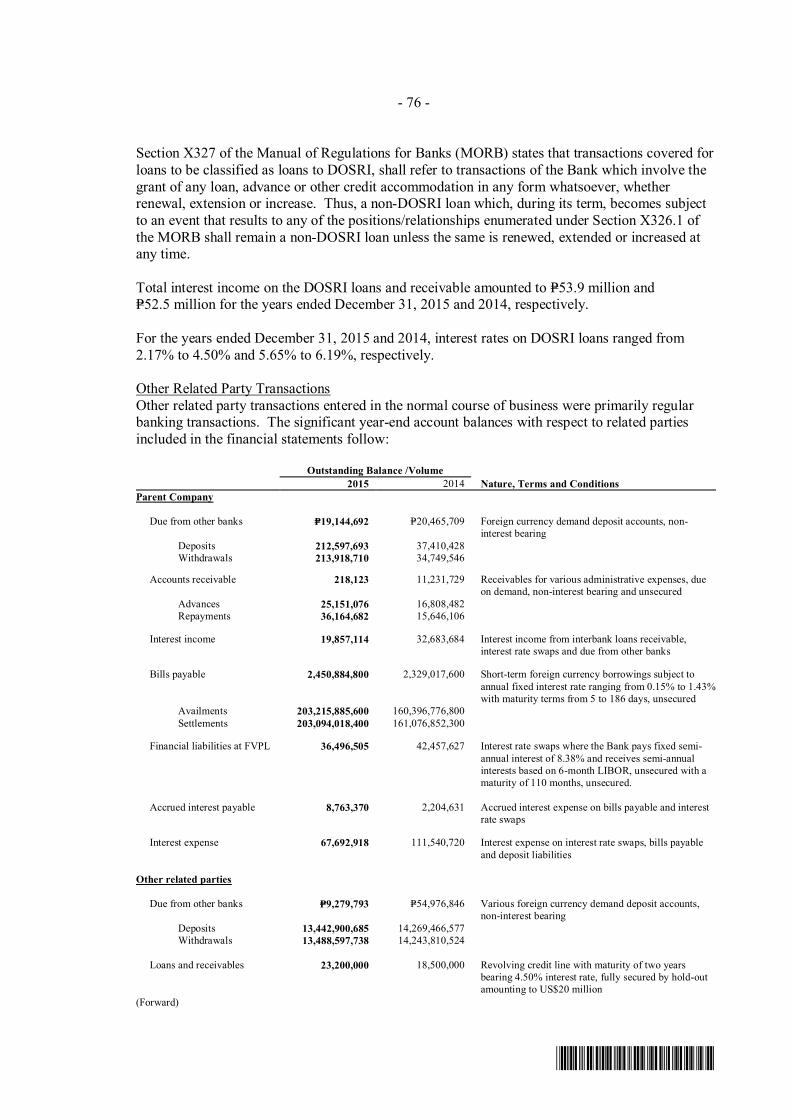
- 76 -
*SGVFS016291*
Section X327 of the Manual of Regulations for Banks (MORB) states that transactions covered forloans to be classified as loans to DOSRI, shall refer to transactions of the Bank which involve thegrant of any loan, advance or other credit accommodation in any form whatsoever, whetherrenewal, extension or increase. Thus, a non-DOSRI loan which, during its term, becomes subjectto an event that results to any of the positions/relationships enumerated under Section X326.1 ofthe MORB shall remain a non-DOSRI loan unless the same is renewed, extended or increased atany time.
Total interest income on the DOSRI loans and receivable amounted to P=53.9 million andP=52.5 million for the years ended December 31, 2015 and 2014, respectively.
For the years ended December 31, 2015 and 2014, interest rates on DOSRI loans ranged from2.17% to 4.50% and 5.65% to 6.19%, respectively.
Other Related Party TransactionsOther related party transactions entered in the normal course of business were primarily regularbanking transactions. The significant year-end account balances with respect to related partiesincluded in the financial statements follow:
Outstanding Balance /Volume2015 2014 Nature, Terms and Conditions
Parent Company
Due from other banks P=19,144,692 P=20,465,709 Foreign currency demand deposit accounts, non-interest bearing
Deposits 212,597,693 37,410,428Withdrawals 213,918,710 34,749,546
Accounts receivable 218,123 11,231,729 Receivables for various administrative expenses, dueon demand, non-interest bearing and unsecured
Advances 25,151,076 16,808,482Repayments 36,164,682 15,646,106
Interest income 19,857,114 32,683,684 Interest income from interbank loans receivable,interest rate swaps and due from other banks
Bills payable 2,450,884,800 2,329,017,600 Short-term foreign currency borrowings subject toannual fixed interest rate ranging from 0.15% to 1.43%with maturity terms from 5 to 186 days, unsecured
Availments 203,215,885,600 160,396,776,800Settlements 203,094,018,400 161,076,852,300
Financial liabilities at FVPL 36,496,505 42,457,627 Interest rate swaps where the Bank pays fixed semi-annual interest of 8.38% and receives semi-annualinterests based on 6-month LIBOR, unsecured with amaturity of 110 months, unsecured.
Accrued interest payable 8,763,370 2,204,631 Accrued interest expense on bills payable and interestrate swaps
Interest expense 67,692,918 111,540,720 Interest expense on interest rate swaps, bills payableand deposit liabilities
Other related parties
Due from other banks P=9,279,793 P=54,976,846 Various foreign currency demand deposit accounts,non-interest bearing
Deposits 13,442,900,685 14,269,466,577Withdrawals 13,488,597,738 14,243,810,524
Loans and receivables 23,200,000 18,500,000 Revolving credit line with maturity of two yearsbearing 4.50% interest rate, fully secured by hold-outamounting to US$20 million
(Forward)
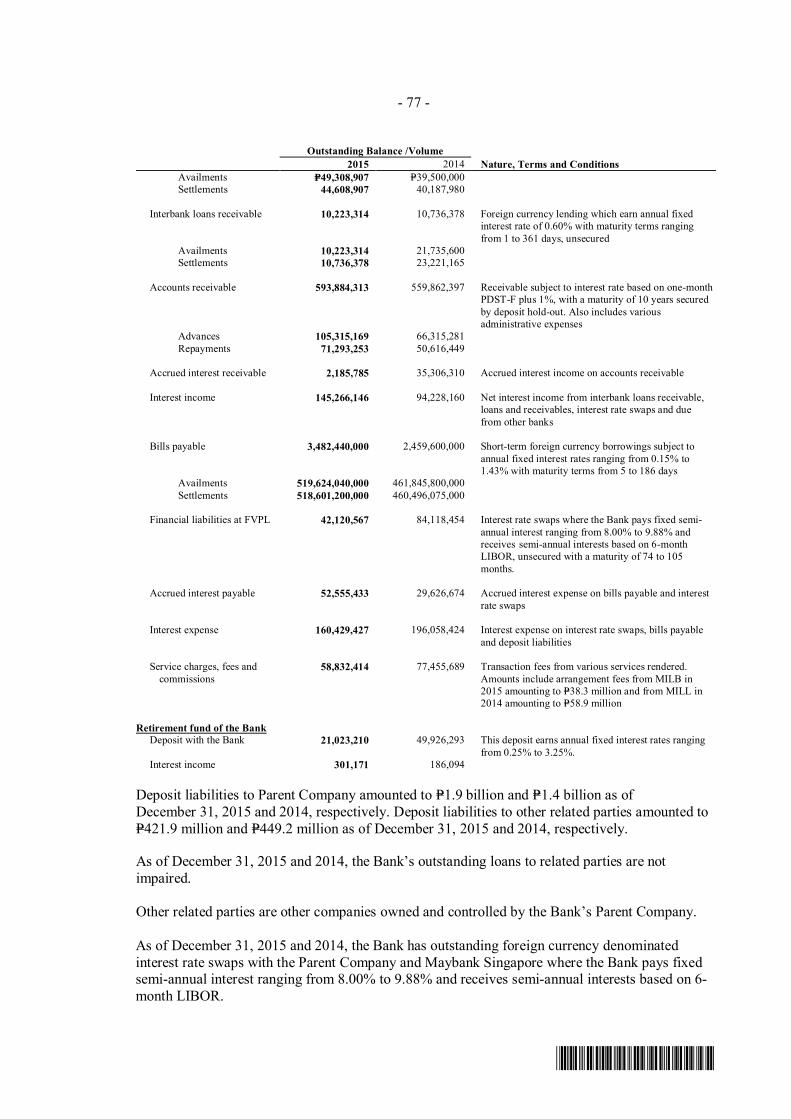
- 77 -
*SGVFS016291*
Outstanding Balance /Volume2015 2014 Nature, Terms and Conditions
Availments P=49,308,907 P=39,500,000Settlements 44,608,907 40,187,980
Interbank loans receivable 10,223,314 10,736,378 Foreign currency lending which earn annual fixedinterest rate of 0.60% with maturity terms rangingfrom 1 to 361 days, unsecured
Availments 10,223,314 21,735,600Settlements 10,736,378 23,221,165
Accounts receivable 593,884,313 559,862,397 Receivable subject to interest rate based on one-monthPDST-F plus 1%, with a maturity of 10 years securedby deposit hold-out. Also includes variousadministrative expenses
Advances 105,315,169 66,315,281Repayments 71,293,253 50,616,449
Accrued interest receivable 2,185,785 35,306,310 Accrued interest income on accounts receivable
Interest income 145,266,146 94,228,160 Net interest income from interbank loans receivable,loans and receivables, interest rate swaps and duefrom other banks
Bills payable 3,482,440,000 2,459,600,000 Short-term foreign currency borrowings subject toannual fixed interest rates ranging from 0.15% to1.43% with maturity terms from 5 to 186 days
Availments 519,624,040,000 461,845,800,000Settlements 518,601,200,000 460,496,075,000
Financial liabilities at FVPL 42,120,567 84,118,454 Interest rate swaps where the Bank pays fixed semi-annual interest ranging from 8.00% to 9.88% andreceives semi-annual interests based on 6-monthLIBOR, unsecured with a maturity of 74 to 105months.
Accrued interest payable 52,555,433 29,626,674 Accrued interest expense on bills payable and interestrate swaps
Interest expense 160,429,427 196,058,424 Interest expense on interest rate swaps, bills payableand deposit liabilities
Service charges, fees andcommissions
58,832,414 77,455,689 Transaction fees from various services rendered.Amounts include arrangement fees from MILB in2015 amounting to P=38.3 million and from MILL in2014 amounting to P=58.9 million
Retirement fund of the Bank Deposit with the Bank 21,023,210 49,926,293 This deposit earns annual fixed interest rates ranging
from 0.25% to 3.25%. Interest income 301,171 186,094
Deposit liabilities to Parent Company amounted to P=1.9 billion and P=1.4 billion as ofDecember 31, 2015 and 2014, respectively. Deposit liabilities to other related parties amounted toP=421.9 million and P=449.2 million as of December 31, 2015 and 2014, respectively.
As of December 31, 2015 and 2014, the Bank’s outstanding loans to related parties are notimpaired.
Other related parties are other companies owned and controlled by the Bank’s Parent Company.
As of December 31, 2015 and 2014, the Bank has outstanding foreign currency denominatedinterest rate swaps with the Parent Company and Maybank Singapore where the Bank pays fixedsemi-annual interest ranging from 8.00% to 9.88% and receives semi-annual interests based on 6-month LIBOR.

- 78 -
*SGVFS016291*
On December 15, 2010, the Bank entered into an agreement with Maybank International LabuanLimited (MILL) whereby the Bank shall perform account management in its favor. This willinclude the conduct of annual review on the account and collection. The Bank shall charge MILLa service fee of 0.30% of the average US$ value of loans and investments booked by MILL perannum beginning July 1, 2010 until such time that the agreement shall be terminated. Service feesearned from MILL amounted to P=20.5 million and P=18.5 million for the years endedDecember 31, 2015 and 2014, respectively.
In September 2014, MILL entered into a syndicated term loan facility agreement with a Philippineclient. The Bank acted as the arranger for this loan facility on behalf of MILL. The servicesprovided by the Bank to MILL include, but not limited to, the conduct of the necessary duediligence for the loan application and provide the appropriate recommendation. The Bankreceived a total of P=58.9 million (US$1.3 million) of fees from MILL, as consideration forarranging the loan.
In November 2015, Maybank International Labuan Branch (MILB) entered into a syndicated termloan facility agreement with a Philippine client. The Bank acted as the arranger for this loanfacility on behalf of MILB. The services provided by the Bank to MILB include, but not limitedto, the conduct of the necessary due diligence for the loan application and provide the appropriaterecommendation. The Bank received a total of P=11.8 million (US$252,000) of fees from MILB,as consideration for arranging the loan.
On December 29, 2015, a facility agreement was executed between a borrower and various banksto finance the development of a power plant. The Bank and MILB are part of the term lendersunder the agreement having loan commitments amounting to US$15.0 million and US$30.0million, respectively. On the same date, an agreement was executed between the Bank and MILBwhereby both parties agreed that MILB will take on the Bank’s loan commitment ofUS$15.0 million. In exchange for the Bank arranging the loan, the Bank and MILB also agreedthat the Bank will be entitled to the total front end fees due to MILB and the Bank totalingP=26.5 million (US$562,500), as consideration for arranging the loan.
30. Offsetting of Financial Assets and Liabilities
The amendments to PFRS 7, which is effective January 1, 2013, require the Bank to discloseinformation about rights of offset and related arrangements (such as collateral postingrequirements) for financial instruments under an enforceable master netting agreements or similararrangements. The effects of these arrangements are disclosed in the succeeding tables (amountsin thousands):
Financial instruments
December 31, 2015
Financial assetsrecognized at
end of reportingperiod by type
Gross carryingamounts (before
offsetting)
Gross amountsoffset in
accordance withthe offsetting
criteria
Net amountpresented instatements of
financialposition
[a-b]
Effect of remaining rights ofset-off (including rights to setoff financial collateral) that
do not meet PAS 32 offsettingcriteria
Financialinstruments
Fair value offinancialcollateral
Net exposure[c-d]
[a] [b] [c] [d] [e]Derivative assets (Note 17) P=50,379 P=– P=50,379 P=– P=– P=50,379Derivative liabilities (Note 17) 97,265 – 97,265 – – 97,265
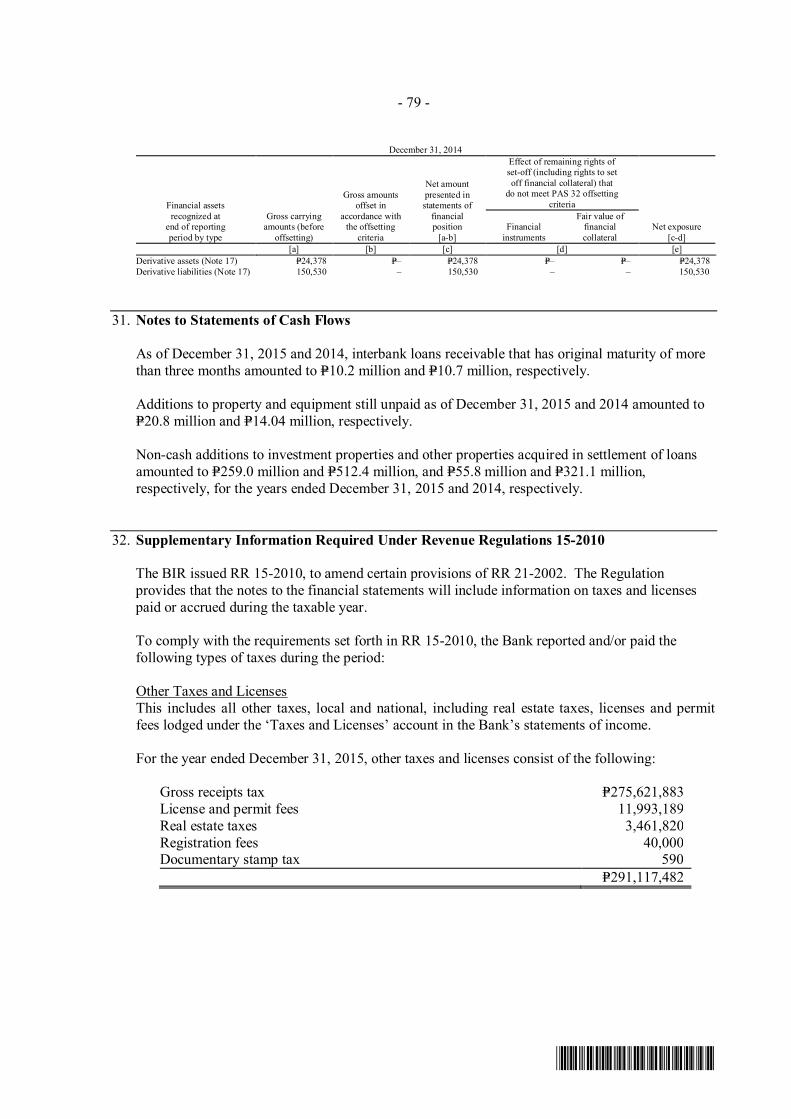
- 79 -
*SGVFS016291*
December 31, 2014
Financial assetsrecognized at
end of reportingperiod by type
Gross carryingamounts (before
offsetting)
Gross amountsoffset in
accordance withthe offsetting
criteria
Net amountpresented instatements of
financialposition
[a-b]
Effect of remaining rights ofset-off (including rights to setoff financial collateral) that
do not meet PAS 32 offsettingcriteria
Financialinstruments
Fair value offinancialcollateral
Net exposure[c-d]
[a] [b] [c] [d] [e]Derivative assets (Note 17) P=24,378 P=– P=24,378 P=– P=– P=24,378Derivative liabilities (Note 17) 150,530 – 150,530 – – 150,530
31. Notes to Statements of Cash Flows
As of December 31, 2015 and 2014, interbank loans receivable that has original maturity of morethan three months amounted to P=10.2 million and P=10.7 million, respectively.
Additions to property and equipment still unpaid as of December 31, 2015 and 2014 amounted toP=20.8 million and P=14.04 million, respectively.
Non-cash additions to investment properties and other properties acquired in settlement of loansamounted to P=259.0 million and P=512.4 million, and P=55.8 million and P=321.1 million,respectively, for the years ended December 31, 2015 and 2014, respectively.
32. Supplementary Information Required Under Revenue Regulations 15-2010
The BIR issued RR 15-2010, to amend certain provisions of RR 21-2002. The Regulationprovides that the notes to the financial statements will include information on taxes and licensespaid or accrued during the taxable year.
To comply with the requirements set forth in RR 15-2010, the Bank reported and/or paid thefollowing types of taxes during the period:
Other Taxes and LicensesThis includes all other taxes, local and national, including real estate taxes, licenses and permitfees lodged under the ‘Taxes and Licenses’ account in the Bank’s statements of income.
For the year ended December 31, 2015, other taxes and licenses consist of the following:
Gross receipts tax P=275,621,883License and permit fees 11,993,189Real estate taxes 3,461,820Registration fees 40,000Documentary stamp tax 590
P=291,117,482

- 80 -
*SGVFS016291*
Withholding TaxesDetails of withholding taxes for the year ended December 31, 2015 are as follows:
Total AmountRemitted
Balance as atDecember 31
Withholding taxes on compensation and benefits P=219,955,479 P=13,035,542Final withholding taxes 116,158,921 11,475,475Expanded withholding taxes 91,860,340 11,014,588Final withholding VAT 3,253,576 692,762
P=431,228,316 P=36,218,367
The Bank has no outstanding assessments from the BIR as of December 31, 2015.