mayne pharma group limited · this presentation contains forward-looking statements that involve...
TRANSCRIPT

1
Mayne Pharma Group Limited1HFY18 Results Presentation 23 February 2018
Scott Richards, Chief Executive OfficerNick Freeman, Group Chief Financial Officer

2
Disclaimer
● The information provided is general in nature and is in summary form only. It is not complete and should be read in conjunction with the company’s audited Financial Statements and market disclosures. This material is not intended to be relied upon as advice to investors or potential investors.
Non-IFRS information
● Other than as indicated, the financial information contained in this document is directly extracted or calculated from the audited Financial Statements. Throughout this document some non-IFRS financial information is stated excluding certain specified expenses. Results excluding such expenses are considered by the Directors to provide a meaningful basis for comparison from period to period.
● Earnings before interest, tax, depreciation and amortisation (EBITDA) is considered by Directors to be a meaningful measure of the operating earnings and performance of the Group and that this information maybe useful for investors and is a non-IFRS term.
● The non-IFRS financial information has not been audited by the Group’s auditors.
Forward looking statements
● This presentation contains forward-looking statements that involve subjective judgement and analysis and are subject to significant uncertainties, risks and contingencies, many of which are outside the control of, and are unknown to the Company.No representation, warranty or assurance (express or implied) is given or made in relation to any forward looking statement by any person (including the Company). Actual future events may vary materially from the forward looking statements and the assumptions on which the forward looking statements are based. Given these uncertainties, readers are cautioned not to place undue reliance on such forward looking statements. The factors that may affect the Company’s future performance include, among others: changes in economic conditions and changes in the legal and regulatory regimes in which the Company operates, changes in behaviour of major customers, suppliers and competitors.
Glossary
● A glossary of industry terminology is contained in the Mayne Pharma Annual Report which can be accessed at www.maynepharma.com/investor-relations/results-reports and product descriptions are detailed at www.maynepharma.com/us-products and www.maynepharma.com/australian-products.
3
Executive summary
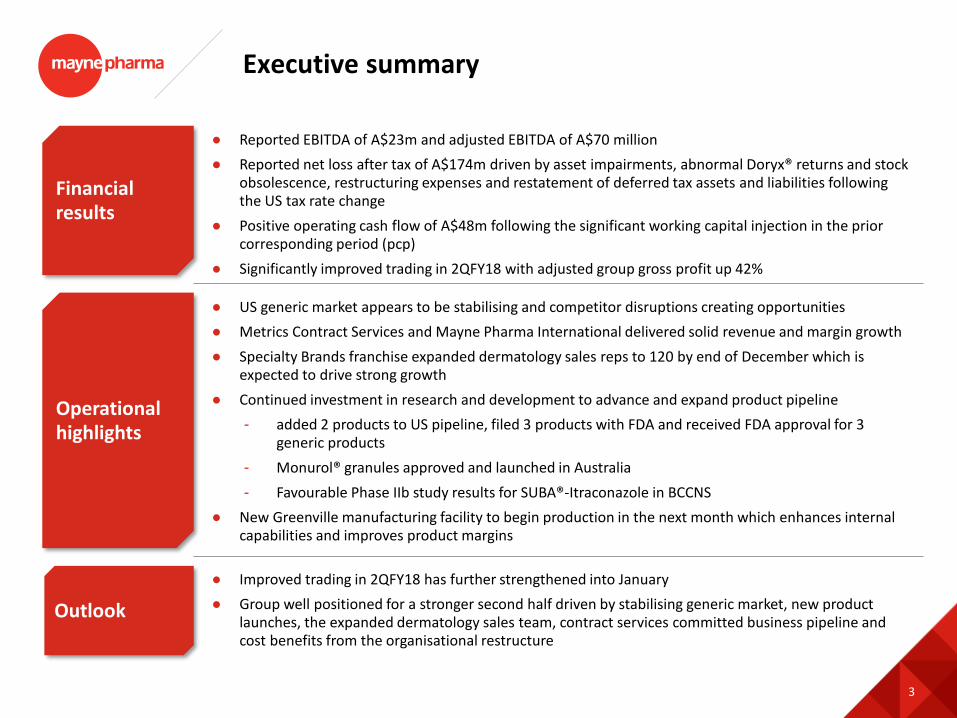
● Reported EBITDA of A$23m and adjusted EBITDA of A$70 million
● Reported net loss after tax of A$174m driven by asset impairments, abnormal Doryx® returns and stock obsolescence, restructuring expenses and restatement of deferred tax assets and liabilities following the US tax rate change
● Positive operating cash flow of A$48m following the significant working capital injection in the prior corresponding period (pcp)
● Significantly improved trading in 2QFY18 with adjusted group gross profit up 42%
● US generic market appears to be stabilising and competitor disruptions creating opportunities
● Metrics Contract Services and Mayne Pharma International delivered solid revenue and margin growth
● Specialty Brands franchise expanded dermatology sales reps to 120 by end of December which is expected to drive strong growth
● Continued investment in research and development to advance and expand product pipeline
- added 2 products to US pipeline, filed 3 products with FDA and received FDA approval for 3 generic products
- Monurol® granules approved and launched in Australia
- Favourable Phase IIb study results for SUBA®-Itraconazole in BCCNS
● New Greenville manufacturing facility to begin production in the next month which enhances internal capabilities and improves product margins
Financial results
Operational highlights
Outlook
● Improved trading in 2QFY18 has further strengthened into January
● Group well positioned for a stronger second half driven by stabilising generic market, new product launches, the expanded dermatology sales team, contract services committed business pipeline and cost benefits from the organisational restructure

4
2018 half-year results
Reported results Adjusted results1
A$million 1HFY18 1HFY172 1HFY18 1HFY172
Revenue 243.3 294.8 255.6 294.8
Gross Profit 95.9 171.2 128.7 171.2
Gross Profit % 39% 58% 50% 58%
EBITDA 23.0 129.2 70.2 109.9
Net income/(loss)
(174.2) 72.7 16.1 59.5
1HFY18 results (attributable to members)
A$million 1HFY18 1HFY17
Cash flow from operations 48.0 (67.1)
R&D spend 23.2 15.6
Capex 39.5 47.9
1HFY18 cash flow items
● Reduced revenue and gross profit reflects GPD price deflation and a number of abnormal one-off items including extraordinary stock obsolescence, abnormal Doryx® returns and restructuring costs
● Underlying adjustments to EBITDA and NPAT of A$47m and A$190m respectively (refer to page 5 for details)
● Positive operating cash flow following significant working capital injection in the prior period for the Teva portfolio acquisition
● Continued investment in facilities and pipeline to drive future growth
(1) Excludes asset impairment, abnormal stock adjustments and Doryx® returns, restructuring expenses and US tax items(2) 1HFY17 restated to exclude HPPI losses attributable to members
5
Adjustments to earnings1 – 1HFY18
A$millionEBITDA
adjustmentsNPAT
adjustmentsComments
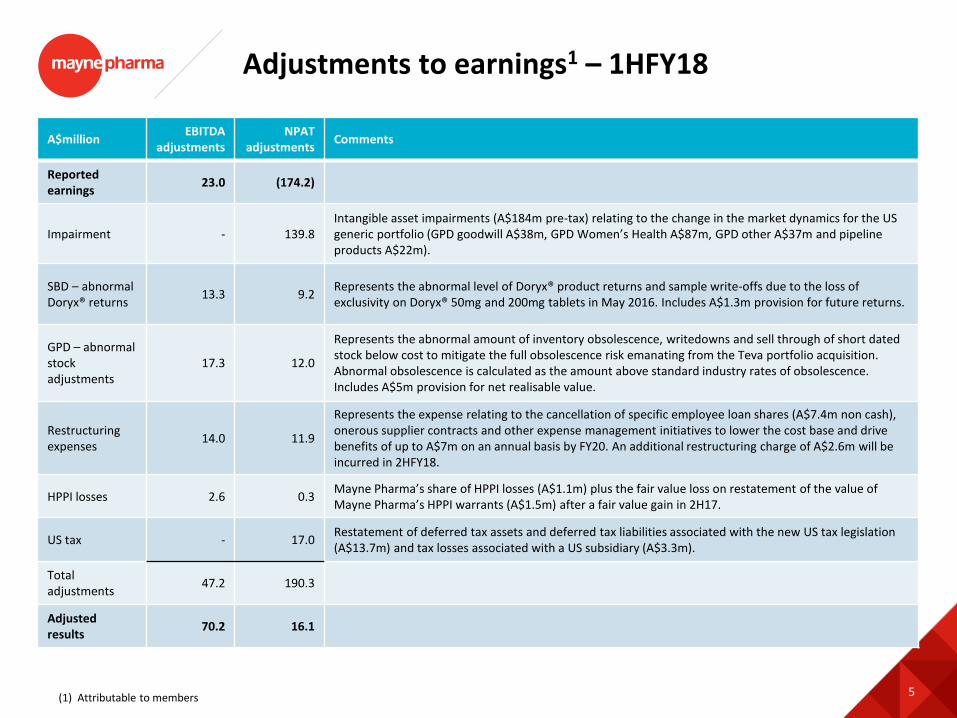
Reported earnings
23.0 (174.2)
Impairment - 139.8Intangible asset impairments (A$184m pre-tax) relating to the change in the market dynamics for the US generic portfolio (GPD goodwill A$38m, GPD Women’s Health A$87m, GPD other A$37m and pipeline products A$22m).
SBD – abnormal Doryx® returns
13.3 9.2Represents the abnormal level of Doryx® product returns and sample write-offs due to the loss of exclusivity on Doryx® 50mg and 200mg tablets in May 2016. Includes A$1.3m provision for future returns.
GPD – abnormal stock adjustments
17.3 12.0
Represents the abnormal amount of inventory obsolescence, writedowns and sell through of short dated stock below cost to mitigate the full obsolescence risk emanating from the Teva portfolio acquisition. Abnormal obsolescence is calculated as the amount above standard industry rates of obsolescence. Includes A$5m provision for net realisable value.
Restructuring expenses
14.0 11.9
Represents the expense relating to the cancellation of specific employee loan shares (A$7.4m non cash), onerous supplier contracts and other expense management initiatives to lower the cost base and drive benefits of up to A$7m on an annual basis by FY20. An additional restructuring charge of A$2.6m will be incurred in 2HFY18.
HPPI losses 2.6 0.3Mayne Pharma’s share of HPPI losses (A$1.1m) plus the fair value loss on restatement of the value of Mayne Pharma’s HPPI warrants (A$1.5m) after a fair value gain in 2H17.
US tax - 17.0Restatement of deferred tax assets and deferred tax liabilities associated with the new US tax legislation (A$13.7m) and tax losses associated with a US subsidiary (A$3.3m).
Total adjustments
47.2 190.3
Adjusted results
70.2 16.1
(1) Attributable to members
6
Q1 and Q2 performance
Reported Adjusted1
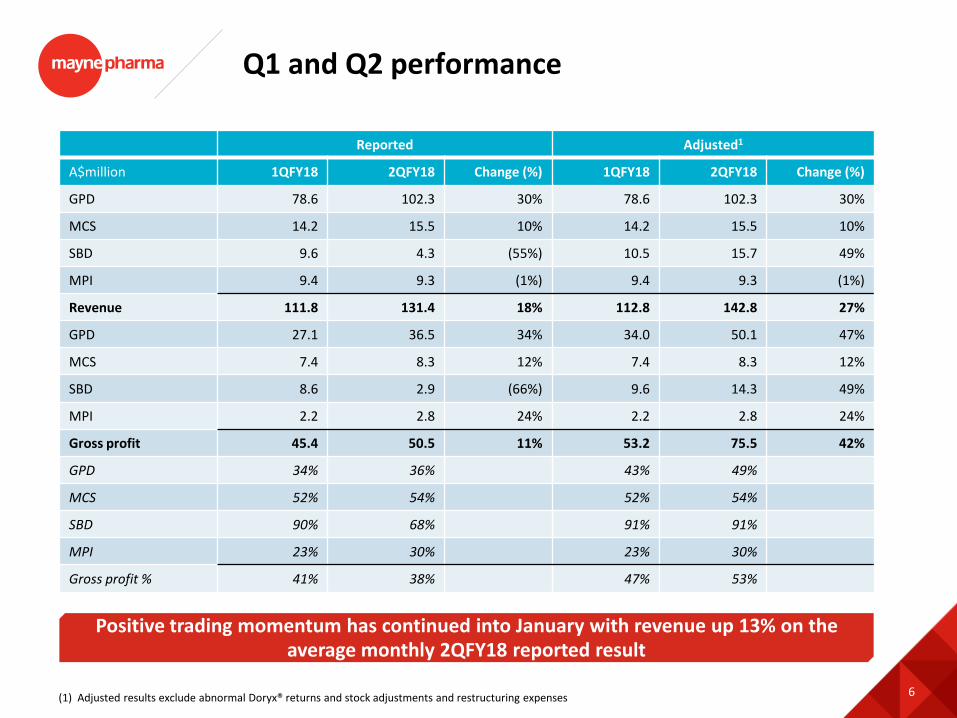
A$million 1QFY18 2QFY18 Change (%) 1QFY18 2QFY18 Change (%)
GPD 78.6 102.3 30% 78.6 102.3 30%
MCS 14.2 15.5 10% 14.2 15.5 10%
SBD 9.6 4.3 (55%) 10.5 15.7 49%
MPI 9.4 9.3 (1%) 9.4 9.3 (1%)
Revenue 111.8 131.4 18% 112.8 142.8 27%
GPD 27.1 36.5 34% 34.0 50.1 47%
MCS 7.4 8.3 12% 7.4 8.3 12%
SBD 8.6 2.9 (66%) 9.6 14.3 49%
MPI 2.2 2.8 24% 2.2 2.8 24%
Gross profit 45.4 50.5 11% 53.2 75.5 42%
GPD 34% 36% 43% 49%
MCS 52% 54% 52% 54%
SBD 90% 68% 91% 91%
MPI 23% 30% 23% 30%
Gross profit % 41% 38% 47% 53%
Positive trading momentum has continued into January with revenue up 13% on the average monthly 2QFY18 reported result
(1) Adjusted results exclude abnormal Doryx® returns and stock adjustments and restructuring expenses
7
Mayne Pharma business units
Metrics Contract Services (MCS)
Specialty Brands Division (SBD)
Mayne Pharma International (MPI)
OV
ERV
IEW
Generic Products Division (GPD)
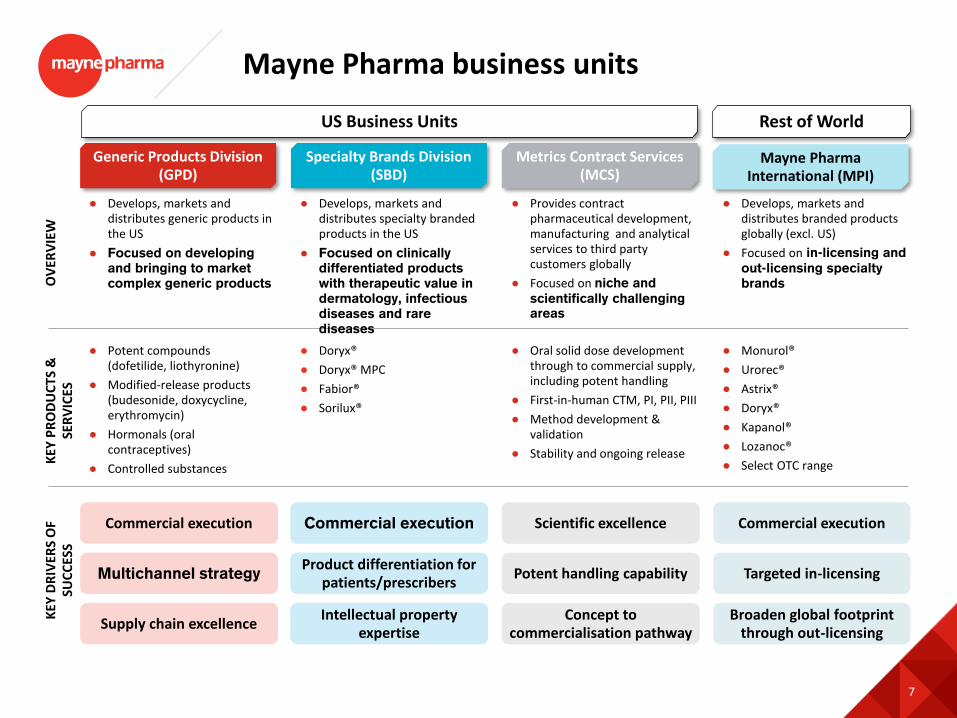
● Develops, markets and distributes generic products in the US
● Focused on developing and bringing to market complex generic products
● Develops, markets and distributes specialty branded products in the US
● Focused on clinically differentiated products with therapeutic value in dermatology, infectious diseases and rare diseases
● Provides contract pharmaceutical development, manufacturing and analytical services to third party customers globally
● Focused on niche and scientifically challenging areas
● Develops, markets and distributes branded products globally (excl. US)
● Focused on in-licensing and out-licensing specialty brands
US Business Units Rest of World
KEY
PR
OD
UC
TS &
SE
RV
ICES
● Oral solid dose development through to commercial supply, including potent handling
● First-in-human CTM, PI, PII, PIII
● Method development & validation
● Stability and ongoing release
● Doryx®
● Doryx® MPC
● Fabior®
● Sorilux®
● Monurol®
● Urorec®
● Astrix®
● Doryx®
● Kapanol®
● Lozanoc®
● Select OTC range
● Potent compounds (dofetilide, liothyronine)
● Modified-release products (budesonide, doxycycline, erythromycin)
● Hormonals (oral contraceptives)
● Controlled substances
Commercial execution
Multichannel strategy
Supply chain excellence
Commercial execution
Product differentiation for patients/prescribers
Intellectual property expertise
Scientific excellence
Potent handling capability
Concept to commercialisation pathway
Commercial execution
Targeted in-licensing
Broaden global footprint through out-licensing
KEY
DR
IVER
S O
F SU
CC
ESS
8
US generic industry dynamics update
(1) IQVIA, McKinsey
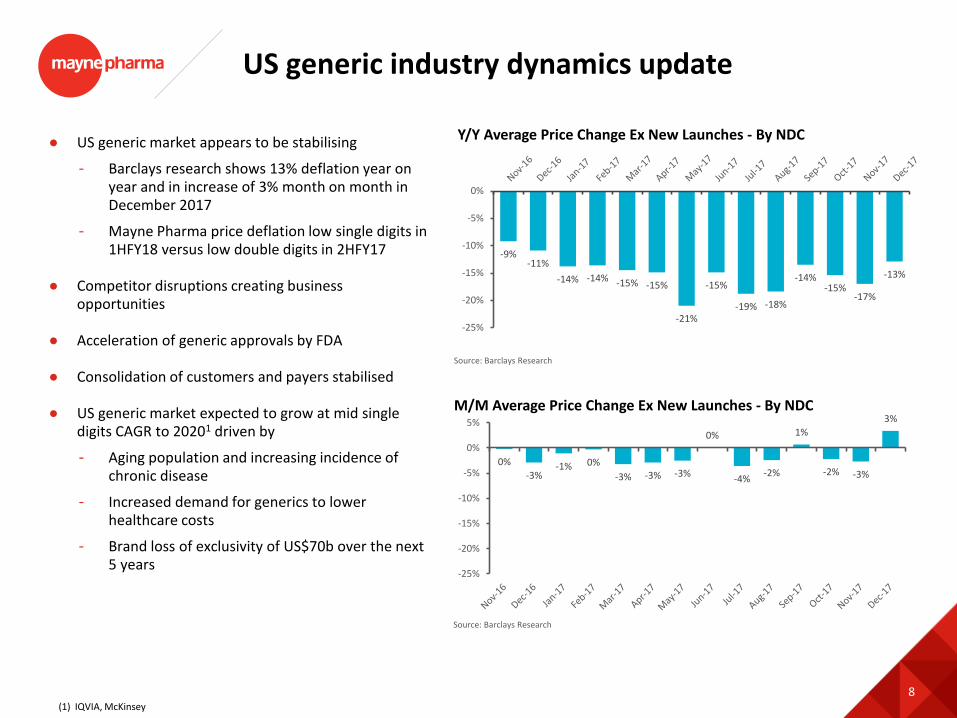
● US generic market appears to be stabilising
- Barclays research shows 13% deflation year on year and in increase of 3% month on month in December 2017
- Mayne Pharma price deflation low single digits in 1HFY18 versus low double digits in 2HFY17
● Competitor disruptions creating business opportunities
● Acceleration of generic approvals by FDA
● Consolidation of customers and payers stabilised
● US generic market expected to grow at mid single digits CAGR to 20201 driven by
- Aging population and increasing incidence of chronic disease
- Increased demand for generics to lower healthcare costs
- Brand loss of exclusivity of US$70b over the next 5 years
-9%-11%
-14% -14% -15% -15%
-21%
-15%
-19% -18%
-14%-15%
-17%
-13%
-25%
-20%
-15%
-10%
-5%
0%
Source: Barclays Research
Y/Y Average Price Change Ex New Launches - By NDC
0%
-3%-1% 0%
-3% -3% -3%
0%
-4%-2%
1%
-2% -3%
3%
-25%
-20%
-15%
-10%
-5%
0%
5%
Source: Barclays Research
M/M Average Price Change Ex New Launches - By NDC
9
Generic Products Division (GPD)
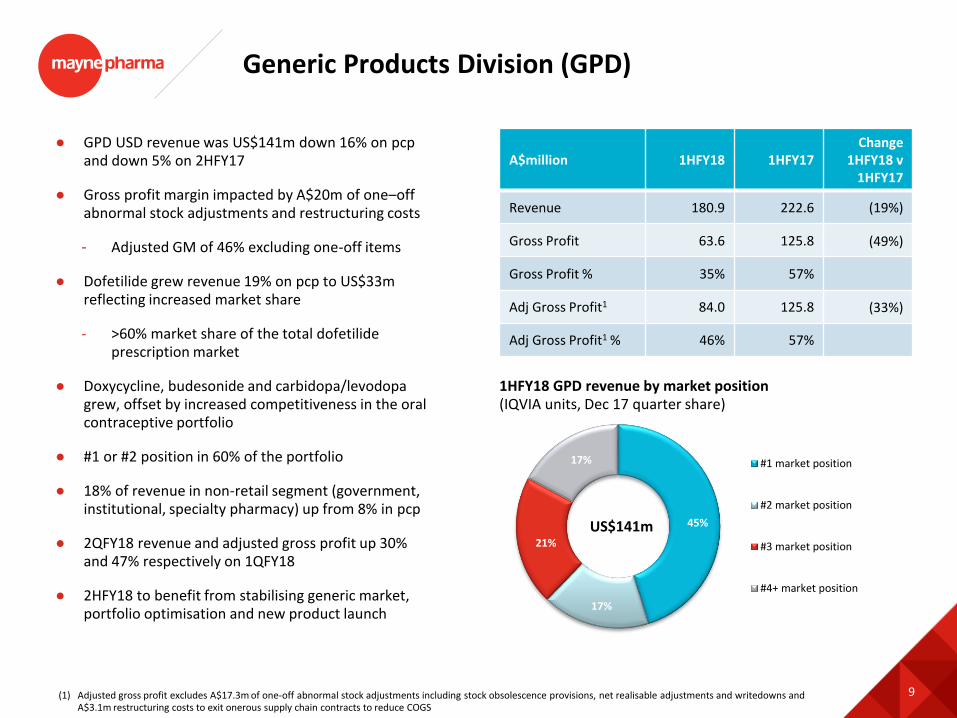
● GPD USD revenue was US$141m down 16% on pcpand down 5% on 2HFY17
● Gross profit margin impacted by A$20m of one–off abnormal stock adjustments and restructuring costs
- Adjusted GM of 46% excluding one-off items
● Dofetilide grew revenue 19% on pcp to US$33m reflecting increased market share
- >60% market share of the total dofetilideprescription market
● Doxycycline, budesonide and carbidopa/levodopa grew, offset by increased competitiveness in the oral contraceptive portfolio
● #1 or #2 position in 60% of the portfolio
● 18% of revenue in non-retail segment (government, institutional, specialty pharmacy) up from 8% in pcp
● 2QFY18 revenue and adjusted gross profit up 30% and 47% respectively on 1QFY18
● 2HFY18 to benefit from stabilising generic market, portfolio optimisation and new product launch
A$million 1HFY18 1HFY17Change
1HFY18 v 1HFY17
Revenue 180.9 222.6 (19%)
Gross Profit 63.6 125.8 (49%)
Gross Profit % 35% 57%
Adj Gross Profit1 84.0 125.8 (33%)
Adj Gross Profit1 % 46% 57%
45%
17%
21%
17% #1 market position
#2 market position
#3 market position
#4+ market position
1HFY18 GPD revenue by market position(IQVIA units, Dec 17 quarter share)
US$141m
(1) Adjusted gross profit excludes A$17.3m of one-off abnormal stock adjustments including stock obsolescence provisions, net realisable adjustments and writedowns and A$3.1m restructuring costs to exit onerous supply chain contracts to reduce COGS

10
11.2 13.5 13.1
5.8
7.7 10.1
-
4.0
8.0
12.0
16.0
20.0
24.0
28.0
1H16 1H17 1H18
Analytical services Formulation development
MCS sales by service area (US$m)
Metrics Contract Services (MCS)
● MCS revenue was US$23.2m, up 9% on pcp
● Growth in revenue and gross profit has been driven by repeat business with existing clients and increased late-stage development work
- Facility expansion and investment in new production equipment is attracting new business
● Added 7 new clients and 13 new projects over the half
● Supported registration batch manufacture for 3 programs in 1HFY18 and completed manufacturing process validation for the first full service MCS program which is now awaiting FDA approval and launch in 2018
● Key performance indicators trending favourably
- Committed business pipeline up 30% from 12 months ago1
- Quotes dollars won up 45% in 1HFY18 versus 1HFY17
● Growing commercial manufacturing pipeline with 18 potential products and peak aggregate annual unit demand of 200m units
A$million 1HFY18 1HFY17Change
1HFY18 v 1HFY17
Revenue 29.7 28.1 6%
Gross Profit 15.8 15.4 2%
Gross Profit % 53% 55%
(1) Committed business pipeline is the next 6 months of signed purchase orders / statements of work
11
Specialty Brands Division (SBD)
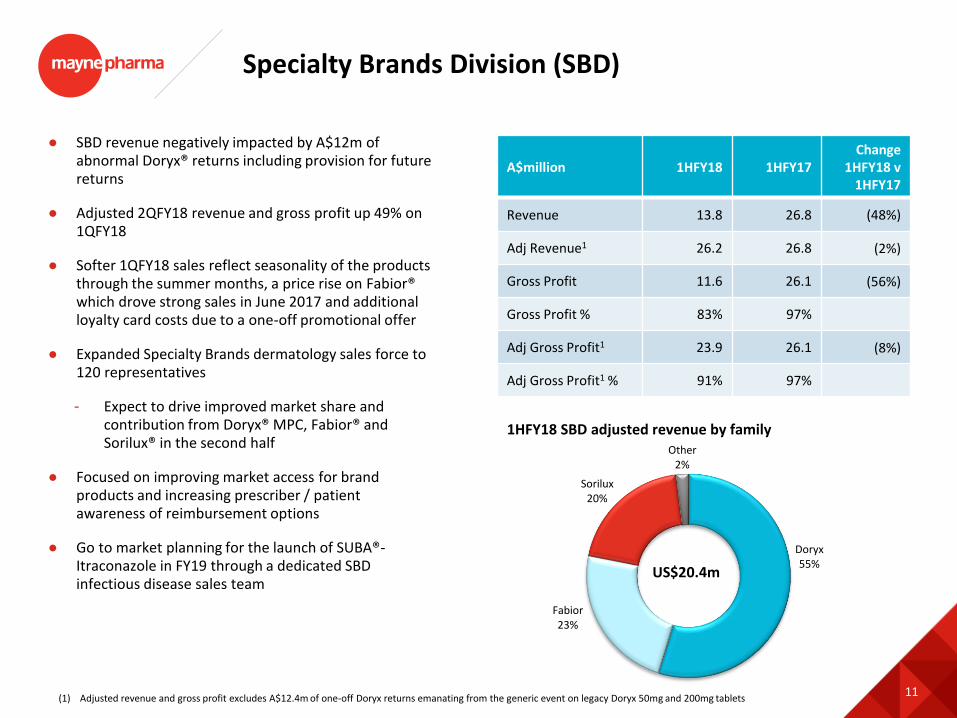
● SBD revenue negatively impacted by A$12m of abnormal Doryx® returns including provision for future returns
● Adjusted 2QFY18 revenue and gross profit up 49% on 1QFY18
● Softer 1QFY18 sales reflect seasonality of the products through the summer months, a price rise on Fabior® which drove strong sales in June 2017 and additional loyalty card costs due to a one-off promotional offer
● Expanded Specialty Brands dermatology sales force to 120 representatives
- Expect to drive improved market share and contribution from Doryx® MPC, Fabior® and Sorilux® in the second half
● Focused on improving market access for brand products and increasing prescriber / patient awareness of reimbursement options
● Go to market planning for the launch of SUBA®-Itraconazole in FY19 through a dedicated SBD infectious disease sales team
A$million 1HFY18 1HFY17Change
1HFY18 v 1HFY17
Revenue 13.8 26.8 (48%)
Adj Revenue1 26.2 26.8 (2%)
Gross Profit 11.6 26.1 (56%)
Gross Profit % 83% 97%
Adj Gross Profit1 23.9 26.1 (8%)
Adj Gross Profit1 % 91% 97%
Doryx55%
Fabior23%
Sorilux20%
Other2%
1HFY18 SBD adjusted revenue by family
US$20.4m
(1) Adjusted revenue and gross profit excludes A$12.4m of one-off Doryx returns emanating from the generic event on legacy Doryx 50mg and 200mg tablets

12
-
1,000
2,000
3,000
4,000
5,000
6,000
Sorilux Fabior Doryx MPC
Expanded sales team expected to drive prescription demand growth
Second sales team in the fieldLaunch of Fabior
and Sorilux
Weekly prescriptions (TRx)
Source: IQVIA, weekly TRx as at 9 February 2018

13
12.9 12.7 14.1
2.8 4.6
4.7
-
4.0
8.0
12.0
16.0
20.0
1H16 1H17 1H18
Australia ROW
MPI sales by region (A$m)
Mayne Pharma International (MPI)
● Aspirin, itraconazole and the injectables portfolio grew strongly
● Stronger gross profit reflects improving
business mix and renegotiation of supply
contracts
● Monurol® (fosfomycin) granules and Urorec® (silodosin)capsules launched in Australia in 1HFY18 and performing well
● Australian operations focused on promotion responsive products in dermatology, infectious disease, urology and women’s health
A$million 1HFY18 1HFY17Change
1HFY18 v 1HFY17
Revenue 18.8 17.3 8%
Gross Profit 5.0 3.8 31%
Gross Profit % 27% 22%
14
IR tablet14%
Potent tablet
6%
ER tablet / capsule
40%Capsule / soft gel
6%
Topical / transdermal
15%
Hormonal device16%
Other3%
R&D update
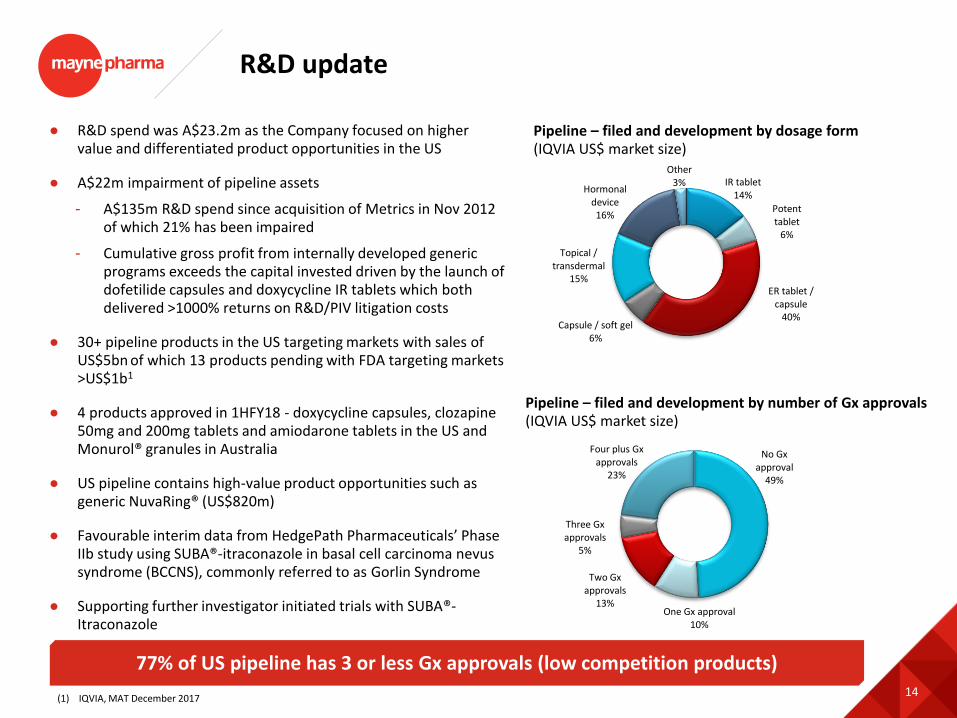
● R&D spend was A$23.2m as the Company focused on higher value and differentiated product opportunities in the US
● A$22m impairment of pipeline assets
- A$135m R&D spend since acquisition of Metrics in Nov 2012 of which 21% has been impaired
- Cumulative gross profit from internally developed generic programs exceeds the capital invested driven by the launch of dofetilide capsules and doxycycline IR tablets which both delivered >1000% returns on R&D/PIV litigation costs
● 30+ pipeline products in the US targeting markets with sales of US$5bn of which 13 products pending with FDA targeting markets >US$1b1
● 4 products approved in 1HFY18 - doxycycline capsules, clozapine 50mg and 200mg tablets and amiodarone tablets in the US and Monurol® granules in Australia
● US pipeline contains high-value product opportunities such as generic NuvaRing® (US$820m)
● Favourable interim data from HedgePath Pharmaceuticals’ Phase IIb study using SUBA®-itraconazole in basal cell carcinoma nevus syndrome (BCCNS), commonly referred to as Gorlin Syndrome
● Supporting further investigator initiated trials with SUBA®-Itraconazole
Pipeline – filed and development by dosage form(IQVIA US$ market size)
77% of US pipeline has 3 or less Gx approvals (low competition products)
No Gx approval
49%
One Gx approval 10%
Two Gx approvals
13%
Three Gx approvals
5%
Four plus Gx approvals
23%
Pipeline – filed and development by number of Gx approvals(IQVIA US$ market size)
(1) IQVIA, MAT December 2017
15
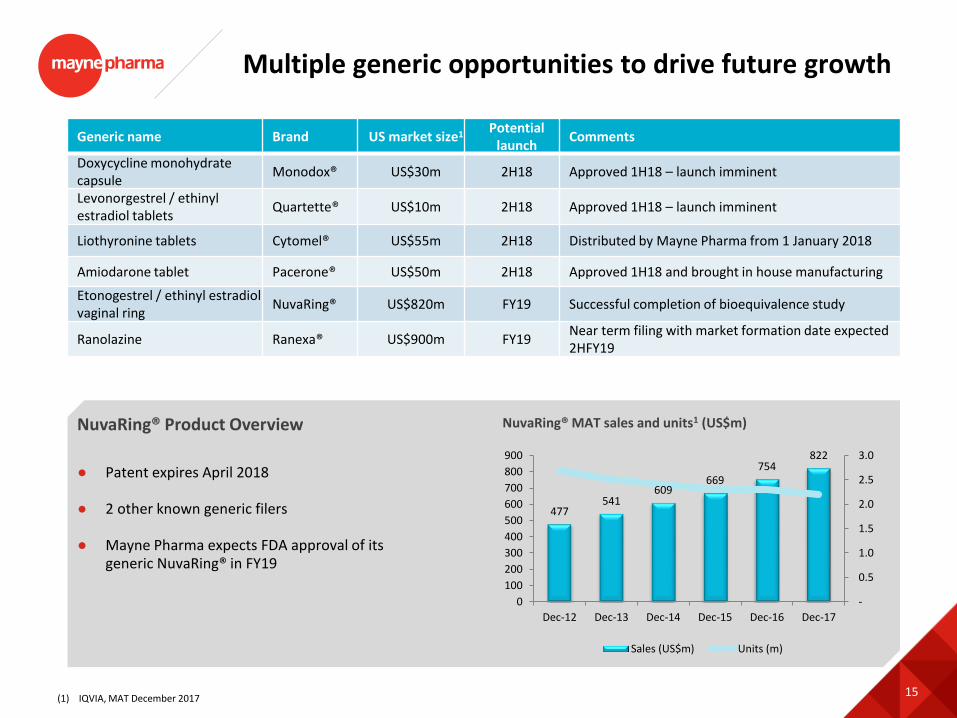
Multiple generic opportunities to drive future growth
Generic name Brand US market size1Potential
launchComments
Doxycycline monohydrate capsule
Monodox® US$30m 2H18 Approved 1H18 – launch imminent
Levonorgestrel / ethinyl estradiol tablets
Quartette® US$10m 2H18 Approved 1H18 – launch imminent
Liothyronine tablets Cytomel® US$55m 2H18 Distributed by Mayne Pharma from 1 January 2018
Amiodarone tablet Pacerone® US$50m 2H18 Approved 1H18 and brought in house manufacturing
Etonogestrel / ethinyl estradiolvaginal ring
NuvaRing® US$820m FY19 Successful completion of bioequivalence study
Ranolazine Ranexa® US$900m FY19Near term filing with market formation date expected 2HFY19
● Patent expires April 2018
● 2 other known generic filers
● Mayne Pharma expects FDA approval of its generic NuvaRing® in FY19
477541
609669
754822
-
0.5
1.0
1.5
2.0
2.5
3.0
0
100
200
300
400
500
600
700
800
900
Dec-12 Dec-13 Dec-14 Dec-15 Dec-16 Dec-17
Sales (US$m) Units (m)
NuvaRing® MAT sales and units1 (US$m)NuvaRing® Product Overview
(1) IQVIA, MAT December 2017
16
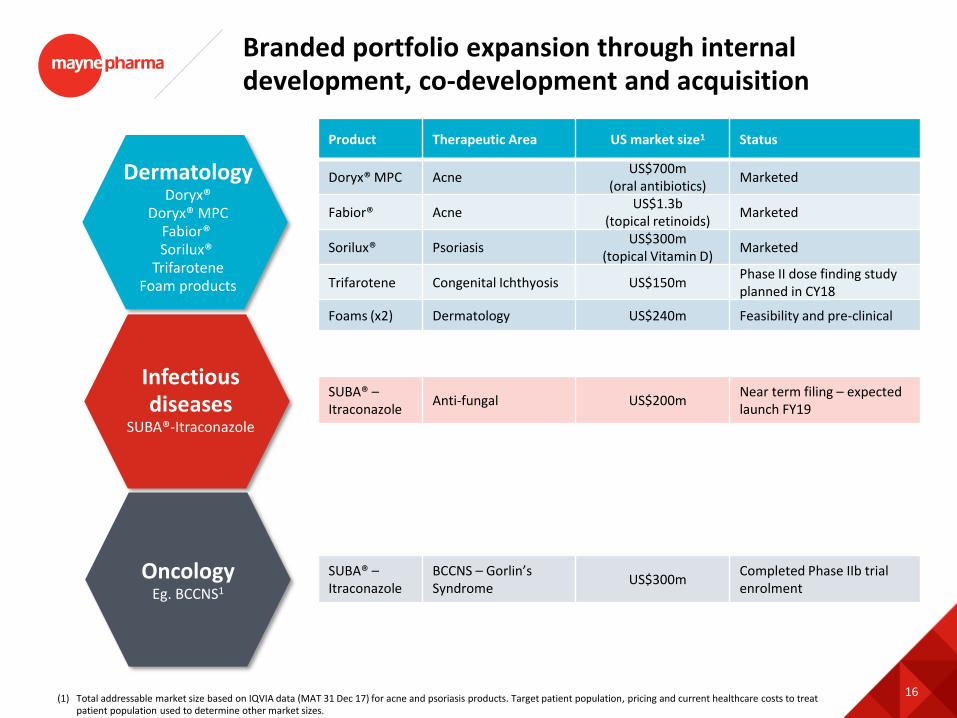
Branded portfolio expansion through internal development, co-development and acquisition
Infectious diseases
SUBA®-Itraconazole
OncologyEg. BCCNS1
DermatologyDoryx®
Doryx® MPCFabior® Sorilux®
TrifaroteneFoam products
Product Therapeutic Area US market size1 Status
Doryx® MPC AcneUS$700m
(oral antibiotics)Marketed
Fabior® AcneUS$1.3b
(topical retinoids)Marketed
Sorilux® PsoriasisUS$300m
(topical Vitamin D)Marketed
Trifarotene Congenital Ichthyosis US$150mPhase II dose finding study planned in CY18
Foams (x2) Dermatology US$240m Feasibility and pre-clinical
SUBA® –Itraconazole
Anti-fungal US$200mNear term filing – expected launch FY19
SUBA® –Itraconazole
BCCNS – Gorlin’sSyndrome
US$300mCompleted Phase IIb trial enrolment
(1) Total addressable market size based on IQVIA data (MAT 31 Dec 17) for acne and psoriasis products. Target patient population, pricing and current healthcare costs to treat patient population used to determine other market sizes.
17
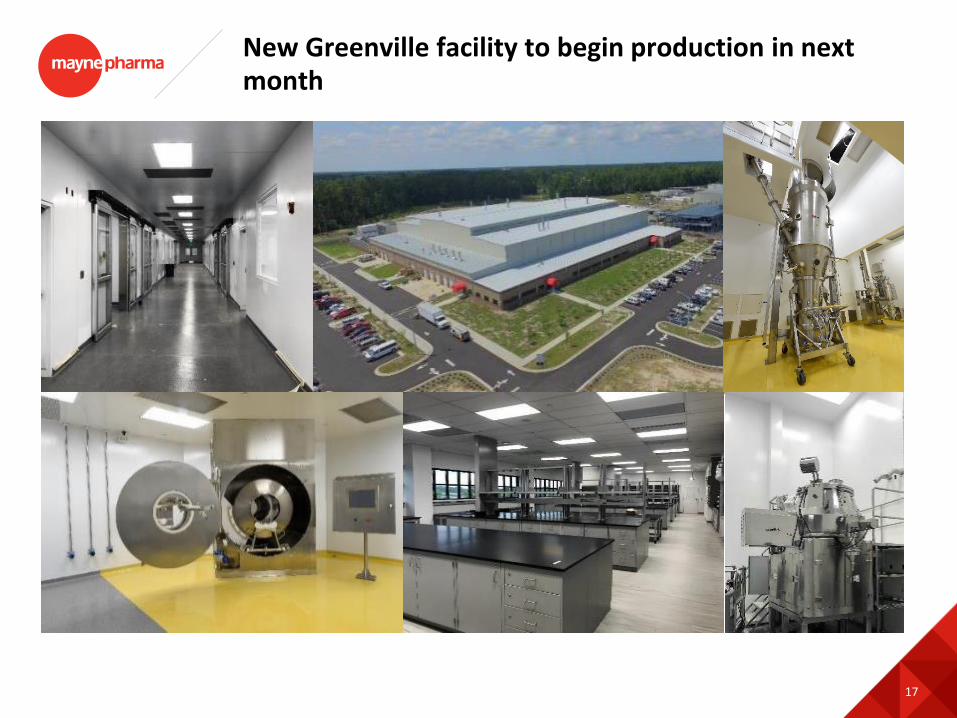
New Greenville facility to begin production in next month
18
Specialty Brands expansion
US Generic Products
expansionOperational
efficiency
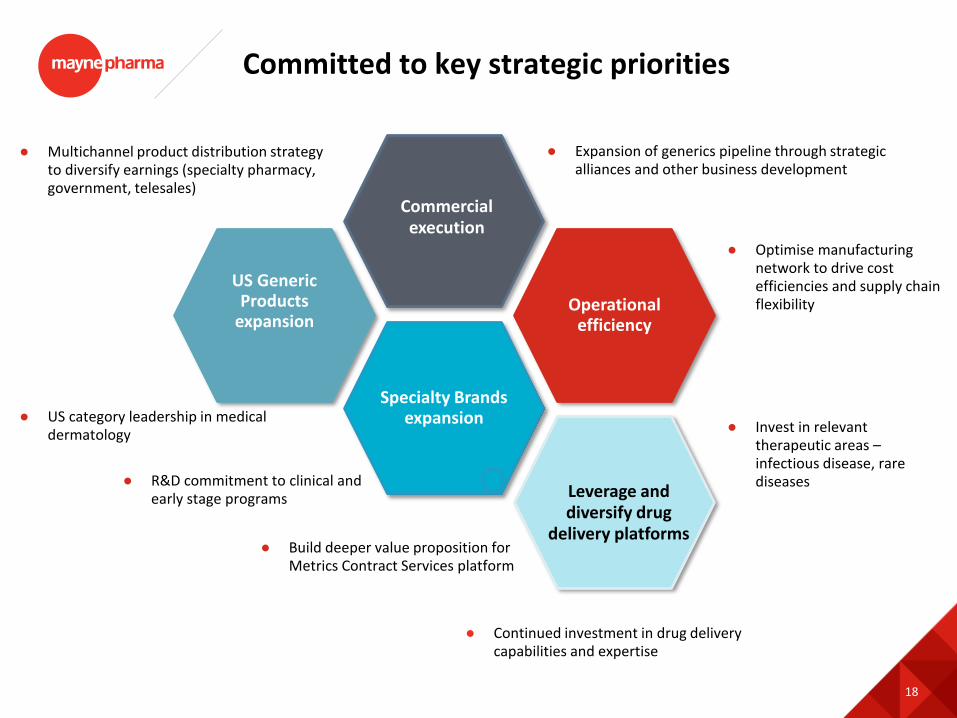
Committed to key strategic priorities
● Expansion of generics pipeline through strategic alliances and other business development
● Invest in relevant therapeutic areas –infectious disease, rare diseases
● Optimise manufacturing network to drive cost efficiencies and supply chain flexibility
● Continued investment in drug delivery capabilities and expertise
● Multichannel product distribution strategy to diversify earnings (specialty pharmacy, government, telesales)
Commercial execution
Leverage and diversify drug
delivery platforms
● R&D commitment to clinical and early stage programs
● US category leadership in medical dermatology
● Build deeper value proposition for Metrics Contract Services platform

19
Outlook
● Positive trading momentum in 2QFY18 which has continued into January 2018
● Growth in the 2HFY18 driven by product launches, expanding channels to market, portfolio optimisation and market share gains
● US$12m of expected cost savings from optimising supply network by FY20 with up to 50% in FY19
● Key performance indicators such as the value of quotes issued and the committed business pipeline trending favourably (committed business pipeline up 30% from twelve months ago and quote dollars won up 45% in 1HFY18 versus 1HFY17)
● First commercial manufacturing revenues expected 2H18
● Expanded sales team in place to accelerate growth, market share and contribution of the dermatology brands as well as supporting any future brands that are added to the dermatology portfolio
● FY19 planned launch of SUBA®-Itraconazole capsules to treat certain fungal infections
Generic Products
Specialty Brands
Metrics Contract Services
Mayne Pharma International
● MPI continues to focus on key brand franchises of Astrix® (aspirin), Lozanoc®(itraconazole), Monurol® (fosfomycin) and Urorec® (silodosin)
● Facility expansion on schedule for completion in 2HFY18 supporting Teva acquired product transfers

1HFY18 financial information
21
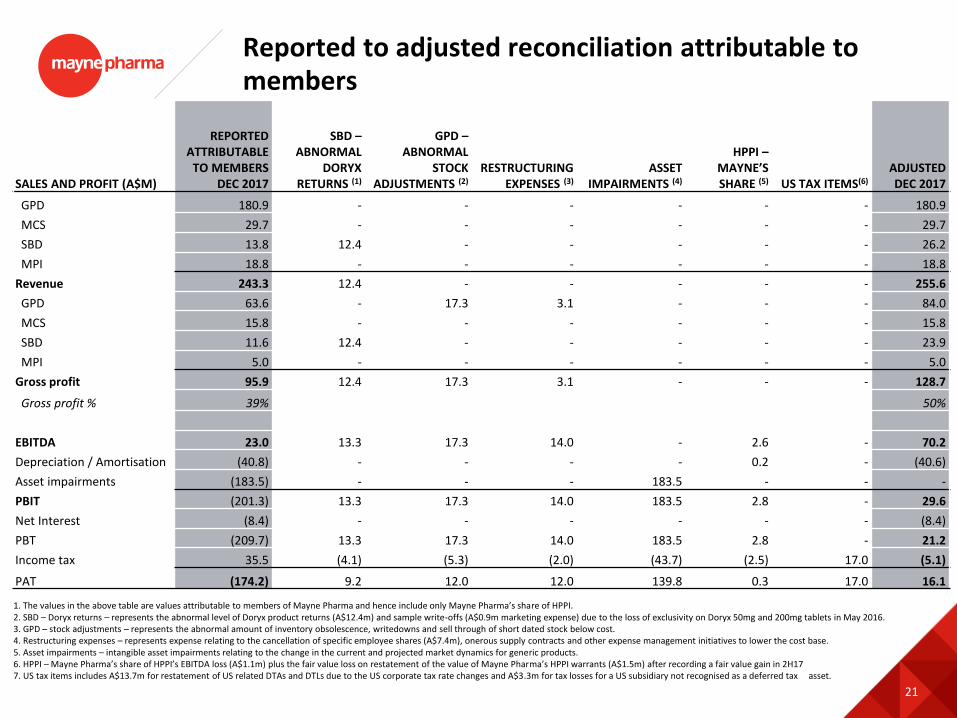
Reported to adjusted reconciliation attributable to members
SALES AND PROFIT (A$M)
REPORTED ATTRIBUTABLE
TO MEMBERS DEC 2017
SBD –ABNORMAL
DORYX RETURNS (1)
GPD –ABNORMAL
STOCK ADJUSTMENTS (2)
RESTRUCTURING EXPENSES (3)
ASSET IMPAIRMENTS (4)
HPPI –MAYNE’S SHARE (5) US TAX ITEMS(6)
ADJUSTED DEC 2017
GPD 180.9 - - - - - - 180.9
MCS 29.7 - - - - - - 29.7
SBD 13.8 12.4 - - - - - 26.2
MPI 18.8 - - - - - - 18.8
Revenue 243.3 12.4 - - - - - 255.6
GPD 63.6 - 17.3 3.1 - - - 84.0
MCS 15.8 - - - - - - 15.8
SBD 11.6 12.4 - - - - - 23.9
MPI 5.0 - - - - - - 5.0
Gross profit 95.9 12.4 17.3 3.1 - - - 128.7
Gross profit % 39% 50%
EBITDA 23.0 13.3 17.3 14.0 - 2.6 - 70.2
Depreciation / Amortisation (40.8) - - - - 0.2 - (40.6)
Asset impairments (183.5) - - - 183.5 - - -
PBIT (201.3) 13.3 17.3 14.0 183.5 2.8 - 29.6
Net Interest (8.4) - - - - - - (8.4)
PBT (209.7) 13.3 17.3 14.0 183.5 2.8 - 21.2
Income tax 35.5 (4.1) (5.3) (2.0) (43.7) (2.5) 17.0 (5.1)
PAT (174.2) 9.2 12.0 12.0 139.8 0.3 17.0 16.1
1. The values in the above table are values attributable to members of Mayne Pharma and hence include only Mayne Pharma’s share of HPPI.2. SBD – Doryx returns – represents the abnormal level of Doryx product returns (A$12.4m) and sample write-offs (A$0.9m marketing expense) due to the loss of exclusivity on Doryx 50mg and 200mg tablets in May 2016.3. GPD – stock adjustments – represents the abnormal amount of inventory obsolescence, writedowns and sell through of short dated stock below cost.4. Restructuring expenses – represents expense relating to the cancellation of specific employee shares (A$7.4m), onerous supply contracts and other expense management initiatives to lower the cost base.5. Asset impairments – intangible asset impairments relating to the change in the current and projected market dynamics for generic products.6. HPPI – Mayne Pharma’s share of HPPI’s EBITDA loss (A$1.1m) plus the fair value loss on restatement of the value of Mayne Pharma’s HPPI warrants (A$1.5m) after recording a fair value gain in 2H17 7. US tax items includes A$13.7m for restatement of US related DTAs and DTLs due to the US corporate tax rate changes and A$3.3m for tax losses for a US subsidiary not recognised as a deferred tax asset.

22
Profit and Loss – attributable to members
Half year ending Change
A$million 31 Dec 17 31 Dec 16 $m
Revenue 243.3 294.8 (51.5)
Gross profit 95.9 171.2 (75.3)
Gross profit % 39% 58%
EBITDA - adjusted 70.2 109.9 (39.7)
Adjustments (47.2) 19.3 (66.5)
EBITDA – reported 23.0 129.2 (106.2)
Depreciation / amortisation (40.8) (31.8) (9.0)
Impairment (183.5) - (183.5)
Net interest (8.4) (5.1) (3.3)
Tax 35.5 (19.6) 55.1
Net income/(loss) - reported (174.2) 72.7 (246.9)
Net income/(loss) - underlying 16.1 59.5 (43.4)
Average USD:AUD FX rate 0.779 0.754
23
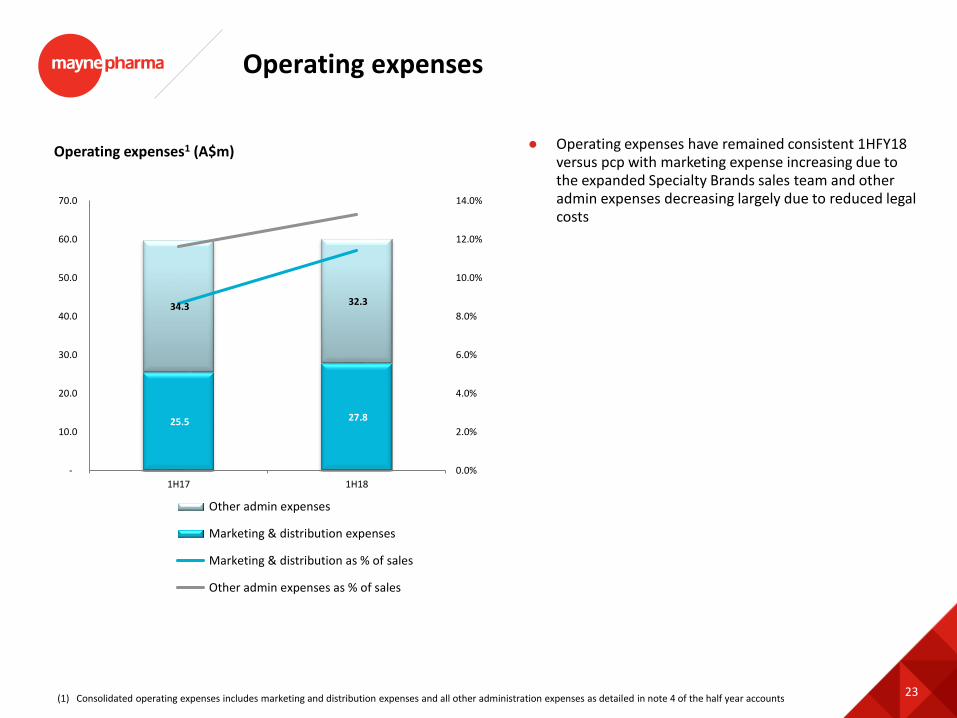
Operating expenses
● Operating expenses have remained consistent 1HFY18 versus pcp with marketing expense increasing due to the expanded Specialty Brands sales team and other admin expenses decreasing largely due to reduced legal costs
Operating expenses1 (A$m)
(1) Consolidated operating expenses includes marketing and distribution expenses and all other administration expenses as detailed in note 4 of the half year accounts
25.5 27.8
34.3 32.3
0.0%
2.0%
4.0%
6.0%
8.0%
10.0%
12.0%
14.0%
-
10.0
20.0
30.0
40.0
50.0
60.0
70.0
1H17 1H18
Other admin expenses
Marketing & distribution expenses
Marketing & distribution as % of sales
Other admin expenses as % of sales

24
Consolidated Balance Sheet Position
As at As at Change
A$million 31 Dec 17 30 Jun 17 $m
Cash 56.0 63.0 (7.0)
Inventory 88.6 106.4 (17.8)
Receivables 238.0 232.7 5.3
PP&E 212.2 189.3 22.9
Intangibles & goodwill 1,018.6 1,235.4 (216.8)
Other assets 116.7 88.1 28.6
Total assets 1,730.0 1,914.9 (184.9)
Payables 163.7 154.5 9.2
Interest-bearing debt 359.1 340.2 18.8
Other financial liabilities 23.3 41.0 (17.7)
Other liabilities 50.8 66.8 (16.0)
Equity 1,131.1 1,312.4 (179.3)
Equity (attributable to shareholders) 1,123.6 1,303.8 (180.3)
Net debt (bank debt less cash) 303.1 277.2 25.9
USD:AUD FX rate 0.781 0.769
25
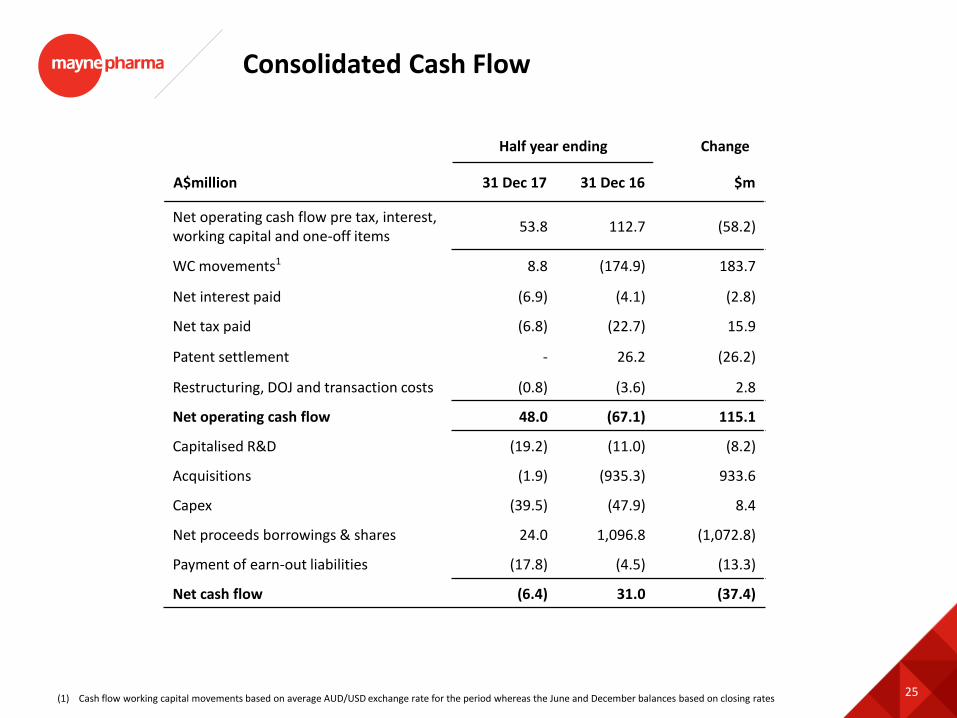
Consolidated Cash Flow
Half year ending Change
A$million 31 Dec 17 31 Dec 16 $m
Net operating cash flow pre tax, interest, working capital and one-off items
53.8 112.7 (58.2)
WC movements1 8.8 (174.9) 183.7
Net interest paid (6.9) (4.1) (2.8)
Net tax paid (6.8) (22.7) 15.9
Patent settlement - 26.2 (26.2)
Restructuring, DOJ and transaction costs (0.8) (3.6) 2.8
Net operating cash flow 48.0 (67.1) 115.1
Capitalised R&D (19.2) (11.0) (8.2)
Acquisitions (1.9) (935.3) 933.6
Capex (39.5) (47.9) 8.4
Net proceeds borrowings & shares 24.0 1,096.8 (1,072.8)
Payment of earn-out liabilities (17.8) (4.5) (13.3)
Net cash flow (6.4) 31.0 (37.4)
(1) Cash flow working capital movements based on average AUD/USD exchange rate for the period whereas the June and December balances based on closing rates
26
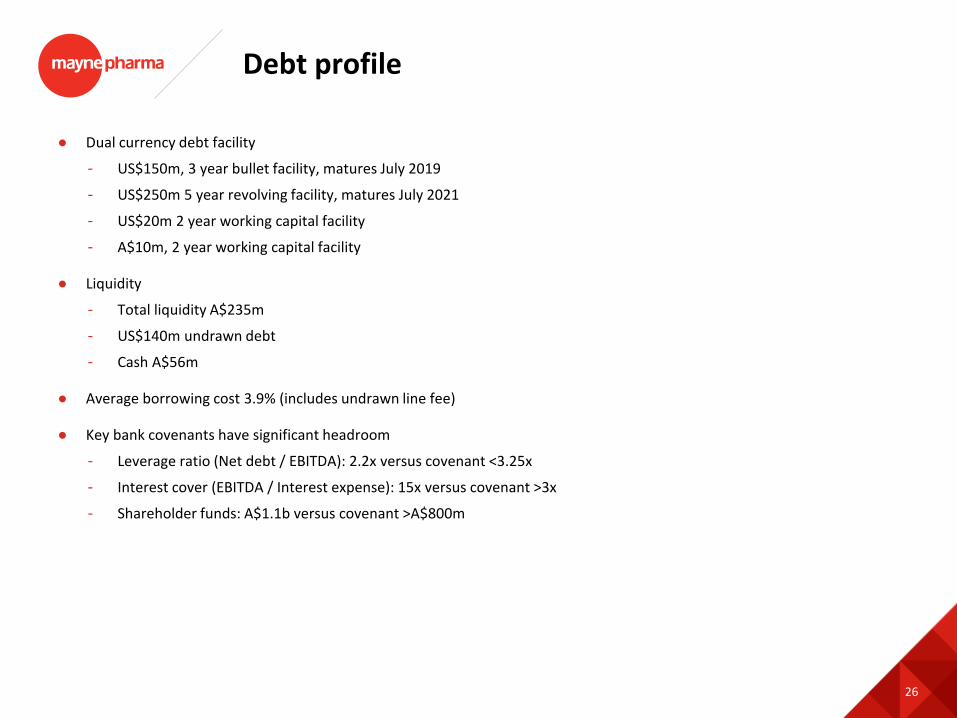
Debt profile
● Dual currency debt facility
- US$150m, 3 year bullet facility, matures July 2019
- US$250m 5 year revolving facility, matures July 2021
- US$20m 2 year working capital facility
- A$10m, 2 year working capital facility
● Liquidity
- Total liquidity A$235m
- US$140m undrawn debt
- Cash A$56m
● Average borrowing cost 3.9% (includes undrawn line fee)
● Key bank covenants have significant headroom
- Leverage ratio (Net debt / EBITDA): 2.2x versus covenant <3.25x
- Interest cover (EBITDA / Interest expense): 15x versus covenant >3x
- Shareholder funds: A$1.1b versus covenant >A$800m

27
US tax reform
● US Federal Corporate tax rate will fall from 35% to 21%
- FY18 rate dropped from 35.0% to 28.1%
- FY19 rate will drop to 21.0%
● Rate restatement expense (net DTA) in 1H18 of A$11m (consolidated) and further adjustment expected at June 2018
● Expected underlying effective tax rate <25% by FY20