mb0034 i & ii
TRANSCRIPT

8/8/2019 MB0034 I & II
http://slidepdf.com/reader/full/mb0034-i-ii 1/32
P a g e
1 5
Question 1:- What do you mean by research? Explain its significance in social andbusiness sciences.
Answer: - Research simply means a search for facts – answers to questions and solutions to
problems. It is a purposive investigation. It is an organized inquiry. It seeks to find explanations tounexplained phenomenon to clarify the doubtful facts and to correct the misconceived facts.
The search for facts may be made through either:
• Arbitrary (or unscientific) Method: It’s a method of seeking answers to question consists of
imagination, opinion, blind belief or impression. E.g. it was believed that the shape of the earth
was flat; a big snake swallows sun or moon causing solar or lunar eclipse. It is subjective; the
finding will vary from person to person depending on his impression or imagination. It is vague
and inaccurate. Or
• Scientific Method: this is a systematic rational approach to seeking facts. It eliminates the
drawbacks of the arbitrary method. It is objective, precise and arrives at conclusions on the basis
of verifiable evidences.
Therefore, search of facts should be made by scientific method rather than by arbitrary method. Then
only we may get verifiable and accurate facts. Hence research is a systematic and logical study of an issue
or problem or phenomenon through scientific method.
Young defines Research as “a scientific undertaking which, by means of logical and systematic
techniques, aims to:
a) Discover of new facts or verify and test old facts,
b) Analyze their sequences, interrelationships and causal explanations,
c) Develop new scientific tools, concepts and theories which would facilitate reliable and valid
study of human behaviour.
d) Kerlinger defines research as a “systematic, controlled, empirical and critical investigation of
hypothetical propositions about the presumed relations among natural phenomena.
Significance of Research in Social and Business Sciences
According to a famous Hudson Maxim, “All progress is born of inquiry. Doubt is often better than
overconfidence, for it leads to inquiry, and inquiry leads to invention”. It brings out the significance of
research, increased amounts of which makes progress possible. Research encourages scientific and
inductive thinking, besides promoting the development of logical habits of thinking and organization.
The role of research in applied economics in the context of an economy or business is greatly increasing
in modern times. The increasingly complex nature of government and business has raised the use of
research in solving operational problems. Research assumes significant role in formulation of economic policy, for both the government and business. It provides the basis for almost all government policies of
an economic system. Government budget formulation, for example, depends particularly on the analysis
of needs and desires of the people, and the availability of revenues, which requires research. Research

8/8/2019 MB0034 I & II
http://slidepdf.com/reader/full/mb0034-i-ii 2/32
P a g e
1 5
helps to formulate alternative policies, in addition to examining the consequences of these alternatives.
Thus, research also facilitates the decision making of policy-makers, although in itself it is not a part of
research. In the process, research also helps in the proper allocation of a country’s scare resources.
Research is also necessary for collecting information on the social and economic structure of an economy
to understand the process of change occurring in the country. Collection of statistical information though
not a routine task, involves various research problems. Therefore, large staff of research technicians or
experts is engaged by the government these days to undertake this work. Thus, research as a tool of
government economic policy formulation involves three distinct stages of operation which are as follows:
• Investigation of economic structure through continual compilation of facts
• Diagnoses of events that are taking place and the analysis of the forces underlying them; and
• The prognosis, i.e., the prediction of future developments
Research also assumes a significant role in solving various operational and planning problems associated
with business and industry. In several ways, operations research, market research, and motivational
research are vital and their results assist in taking business decisions. Market research is refers to the
investigation of the structure and development of a market for the formulation of efficient policiesrelating to purchases, production and sales. Operational research relates to the application of logical,
mathematical, and analytical techniques to find solution to business problems such as cost minimization
or profit maximization, or the optimization problems. Motivational research helps to determine why
people behave in the manner they do with respect to market characteristics. More specifically, it is
concerned with the analyzing the motivations underlying consumer behaviour. All these researches are
very useful for business and industry, which are responsible for business decision making.
Research is equally important to social scientist for analyzing social relationships and seeking
explanations to various social problems. It gives intellectual satisfaction of knowing things for the sake of
knowledge. It also possesses practical utility for the social scientist to gain knowledge so as to be able to
do something better or in a more efficient manner. This, research in social sciences is concerned with bothknowledge for its own sake, and knowledge for what it can contribute to solve practical problems.
Question 2:- What is meant by research problem? And what are the characteristics of a good research problem.
Answer: - Research really begins when the researcher experiences some difficulty, i.e., a
problem demanding a solution within the subject-are of his discipline. This general area of interest,however, defines only the range of subject-matter within which the researcher would see and pose a
specific problem for research. Personal values play an important role in the selection of a topic for
research. Social conditions do often shape the preference of investigators in a subtle and imperceptible
way.
The formulation of the topic into a research problem is, really speaking the first step in a scientific
enquiry. A problem in simple words is some difficulty experienced by the researcher in a theoretical or
practical situation. Solving this difficulty is the task of research.
R.L. Ackoffs analysis affords considerable guidance in identifying problem for research. He visualizes
five components of a problem.
1. Research-consumer: There must be an individual or a group which experiences some difficulty.

8/8/2019 MB0034 I & II
http://slidepdf.com/reader/full/mb0034-i-ii 3/32
P a g e
1 5
2. Research-consumer’s Objectives: The research-consumer must have available, alternative means
for achieving the objectives he desires.
3. Alternative Means to Meet the Objectives: The research-consumer must have available, alternative
means for achieving the objectives he desires.
4. Doubt in Regard to Selection of Alternatives: The existence of alternative courses of action in not
enough; in order to experience a problem, the research consumer must have some doubt as to
which alternative to select.
5. There must be one or More Environments to which the Difficulty or Problem Pertains: A change
in environment may produce or remove a problem. A research-consumer may have doubts as to
which will be the most efficient means in one environment but would have no such doubt in
another.
Criteria of Good research Problem
Horton and Hunt have given following characteristics of scientific research:
1. Verifiable evidence: That is factual observations which other observers can see and check.
2. Accuracy: That is describing what really exists. It means truth or correctness of a statement or
describing things exactly as they are and avoiding jumping to unwarranted conclusions either by
exaggeration or fantasizing.
3. Precision: That is making it as exact as necessary, or giving exact number or measurement. This
avoids colourful literature and vague meanings.
4. Systematization: That is attempting to find all the relevant data, or collecting data in a systematic
and organized way so that the conclusions drawn are reliable. Data based on casual recollections
are generally incomplete and give unreliable judgments and conclusions.
5. Objectivity: That is free being from all biases and vested interests. It means observation isunaffected by the observer’s values, beliefs and preferences to the extent possible and he is able to
see and accept facts as they are, not as he might wish them to be.
6. Recording: That is jotting down complete details as quickly as possible. Since human memory is
fallible, all data collected are recorded.
7. Controlling conditions: That is controlling all variables except one and then attempting to
examine what happens when that variable is varied. This is the basic technique in all scientific
experimentation – allowing one variable to vary while holding all other variables constant.
8. Training investigators: That is imparting necessary knowledge to investigators to make them
understand what to look for, how to interpret in and avoid inaccurate data collection.
Question 3:- What is hypothesis? Examine the procedures for testinghypothesis.
Answer: - A hypothesis is an assumption about relations between variables. It is a tentative
explanation of the research problem or a guess about the research outcome. Before starting the
research, the researcher has a rather general, diffused, even confused notion of the problem. It may
take long time for the researcher to say what questions he had been seeking answers to. Hence, an
adequate statement about the research problem is very important. What is a good problemstatement? It is an interrogative statement that asks: what relationship exists between two or more
variables? It then further asks questions like: Is A related to B or not? How are A and B related to

8/8/2019 MB0034 I & II
http://slidepdf.com/reader/full/mb0034-i-ii 4/32
P a g e
1 5
C? Is A related to B under conditions X and Y? Proposing a statement pertaining to relationship
between A and B is called a hypothesis.
According to Theodorson and Theodorson, “a hypothesis is a tentative statement asserting a relationship
between certain facts. Kerlinger describes it as “a conjectural statement of the relationship
between two or more variables”. Black and Champion have described it as “a tentative statementabout something, the validity of which is usually unknown”. This statement is intended to be
tested empirically and is either verified or rejected. It the statement is not sufficiently established,
it is not considered a scientific law. In other words, a hypothesis carries clear implications for
testing the stated relationship, i.e., it contains variables that are measurable and specifying how
they are related. A statement that lacks variables or that does not explain how the variables are
related to each other is no hypothesis in scientific sense.
Testing of Hypothesis
The hypothesis testing determines the validity of the assumption (technically described as null
hypothesis) with a view to choose between the conflicting hypotheses about the value of the population
hypothesis about the value of the population of a population parameter. Hypothesis testing helps to secede
on the basis of a sample data, whether a hypothesis about the population is likely to be true or false.
Statisticians have developed several tests of hypothesis (also known as tests of significance) for the
purpose of testing of hypothesis which can be classified as:
• Parametric tests or standard tests of hypothesis ;
• Non Parametric test or distribution – free test of the hypothesis.
Parametric tests usually assume certain properties of the parent population from which we draw samples.Assumption like observations come from a normal population, sample size is large, assumptions about the
population parameters like mean, variants etc must hold good before parametric test can be used. But
there are situation when the researcher cannot or does not want to make assumptions. In such situations
we use statistical methods for testing hypothesis which are called non parametric tests because such tests
do not depend on any assumption about the parameters of parent population. Besides, most non-
parametric test assumes only nominal or original data, where as parametric test require measurement
equivalent to at least an interval scale. As a result non-parametric test needs more observation than a
parametric test to achieve the same size of Type I & Type II error.
Important Parametric Tests
The important parametric tests are:
• z-test
• t-test
• x2-test
• f-test
All these tests are based on the assumption of normality i.e., the source of data is considered to be
normally distributed. In some cases the population may not be normally distributed, yet the test will be
8/8/2019 MB0034 I & II
http://slidepdf.com/reader/full/mb0034-i-ii 5/32
P a g e
1 5
applicable on account of the fact that we mostly deal with samples and the sampling distributions closely
approach normal distributions.
Z-test is based on the normal probability distribution and is used for judging the significance of several
statistical measures, particularly the mean. The relevant test statistic is worked out and compared with its
probable value (to be read from the table showing area under normal curve) at a specified level of
significance for judging the significance of the measure concerned. This is a most frequently used test in
research studies. This test is used even when binomial distribution or t-distribution is applicable on the
presumption that such a distribution tends to approximate normal distribution as ‘n’ becomes larger. Z-
test is generally used for comparing the mean of a sample to some hypothesis mean for the population in
case of large sample, or when population variance is known as z-test is also used for judging the
significance of difference between means to of two independent samples in case of large samples or when
population variance is known z-test is generally used for comparing the sample proportion to a theoretical
value of population proportion or for judging the difference in proportions of two independent samples
when happens to be large. Besides, this test may be used for judging the significance of median, mode,
co-efficient of correlation and several other measures
T-test is based on t-distribution and is considered an appropriate test for judging the significance of
sample mean or for judging significance of difference between the two means of the two samples in case
of samples when population variance is not known (in which case we use variance of the sample as an
estimate the population variance). In case two samples are related, we use paired t-test (difference test) for
judging the significance of their mean of difference between the two related samples. It can also be used
for judging the significance of co-efficient of simple and partial correlations. The relevant test statistic, t,
is calculated from the sample data and then compared with its probable value based on t-distribution at a
specified level of significance for concerning degrees of freedom for accepting or rejecting the null
hypothesis it may be noted that t-test applies only in case of small sample when population variance is
unknown.
X2-test is based on chi-square distribution and as a parametric test is used for comparing a sample
variance to a theoretical population variance is unknown.
F-test is based on f-distribution and is used to compare the variance of the two-independent samples. This
test is also used in the context of variance (ANOVA) for judging the significance of more than two
sample means at one and the same time. It is also used for judging the significance of multiple correlation
coefficients. Test statistic, f, is calculated and compared with its probable value for accepting or rejecting
the H0.
Question 4:- Write an essay on the need for research design and explain theprinciples of experimental design?
Answer: - The research designer understandably cannot hold all his decisions in his head.
Even if he could, he would have difficulty in understanding how these are inter-related. Therefore, he
records his decisions on paper or record disc by using relevant symbols or concepts. Such a symbolic
construction may be called the research design or model. A research design is a logical and systematic
plan prepared for directing a research study. It specifies the objectives of the study, the methodology and
techniques to be adopted for achieving the objectives. It constitutes the blue print for the collection,
measurement and analysis of data. It is the plan, structure and strategy of investigation conceived so as to
obtain answers to research questions. The plan is the overall scheme or program of research. A research

8/8/2019 MB0034 I & II
http://slidepdf.com/reader/full/mb0034-i-ii 6/32
P a g e
1 5
design is the program that guides the investigator in the process of collecting, analyzing and interpreting
observations. It provides a systematic plan of procedure for the researcher to follow Elltiz, Jahoda and
Destsch and Cook describe, “A research design is the arrangement of conditions for collection and
analysis of data in a manner that aims to combine relevance to the research purpose with economy in
procedure.”
Needs of Research Design
The need for the methodologically designed research:
a- In many a research inquiry, the researcher has no idea as to how accurate the results of his study
ought to be in order to be useful. Where such is the case, the researcher has to determine how much
inaccuracy may be tolerated. In a quite few cases he may be in a position to know how much
inaccuracy his method of research will produce. In either case he should design his research if he
wants to assure himself of useful results.
b- In many research projects, the time consumed in trying to ascertain what the data mean after theyhave been collected is much greater than the time taken to design a research which yields data whose
meaning is known as they are collected.
c- The idealized design is concerned with specifying the optimum research procedure that could be
followed were there no practical restrictions.
Principles of Experimental Designs
Professor Fisher has enumerated three principles of experimental designs:
1. The principle of replication: The experiment should be reaped more than once. Thus, each
treatment is applied in many experimental units instead of one. By doing so, the statistical accuracy of
the experiments is increased. For example, suppose we are to examine the effect of two varieties of
rice. For this purpose we may divide the field into two parts and grow one variety in one part and the
other variety in the other part. We can compare the yield of the two parts and draw conclusion on that
basis. But if we are to apply the principle of replication to this experiment, then we first divide the
field into several parts, grow one variety in half of these parts and the other variety in the remaining
parts. We can collect the data yield of the two varieties and draw conclusion by comparing the same.
The result so obtained will be more reliable in comparison to the conclusion we draw withoutapplying the principle of replication. The entire experiment can even be repeated several times for
better results. Consequently replication does not present any difficulty, but computationally it does.
However, it should be remembered that replication is introduced in order to increase the precision of a
study; that is to say, to increase the accuracy with which the main effects and interactions can be
estimated.
2. The principle of randomization: It provides protection, when we conduct an experiment,
against the effect of extraneous factors by randomization. In other words, this principle indicates that
we should design or plan the ‘experiment in such a way that the variations caused by extraneous
factors can all be combined under the general heading of “chance”. For instance if we grow one
variety of rice say in the first half of the parts of a field and the other variety is grown in the other half,then it is just possible that the soil fertility may be different in the first half in comparison to the other
half. If this is so, our results would not be realistic. In such a situation, we may assign the variety of
rice to be grown in different parts of the field on the basis of some random sampling technique i.e., we
8/8/2019 MB0034 I & II
http://slidepdf.com/reader/full/mb0034-i-ii 7/32
P a g e
1 5
may apply randomization principle and protect ourselves against the effects of extraneous factors. As
such, through the application of the principle of randomization, we can have a better estimate of the
experimental error.
3. Principle of local control: It is another important principle of experimental designs. Under it the
extraneous factors, the known source of variability, is made to vary deliberately over as wide a range
as necessary and this needs to be done in such a way that the variability it causes can be measured and
hence eliminated from the experimental error. This means that we should plan the experiment in a
manner that we can perform a two-way analysis of variance, in which the total variability of the data
is divided into three components attributed to treatments, the extraneous factor and experimental
error. In other words, according to the principle of local control, we first divide the field into several
homogeneous parts, known as blocks, and then each such block is divided into parts equal to the
number of treatments. Then the treatments are randomly assigned to these parts of a block. In general,
blocks are the levels at which we hold an extraneous factors fixed, so that we can measure its
contribution to the variability of the data by means of a two-way analysis of variance. In brief,
through the principle of local control we can eliminate the variability due to extraneous factors from
the experimental error.
Question 5:- Distinguish between primary and secondary data collection.Explain the features, uses, advantages and limitations f secondary data. Whichis the best way of collecting the data for research “Primary or secondary”?Support your answer.
Answer: - Primary research entails the use of immediate data in determining the survival of the market. The popular ways to collect primary data consist of surveys, interviews and focus groups,
which shows that direct relationship between potential customers and the companies. Whereas secondary
research is a means to reprocess and reuse collected information as an indication for betterments of the
service or product. Both primary and secondary data are useful for businesses but both may differ from
each other in various aspects.
In secondary data, information relates to a past period. Hence, it lacks aptness and therefore, it has
unsatisfactory value. Primary data is more accommodating as it shows latest information.
Secondary data is obtained from some other organization than the one instantaneously interested with
current research project. Secondary data was collected and analyzed by the organization to convene the
requirements of various research objectives. Primary data is accumulated by the researcher particularly to
meet up the research objective of the subsisting project.
Secondary data though old may be the only possible source of the desired data on the subjects, which
cannot have primary data at all. For example, survey reports or secret records already collected by a
business group can offer information that cannot be obtained from original sources.
Firm in which secondary data are accumulated and delivered may not accommodate the exact needs and
particular requirements of the current research study. Many a time, alteration or modifications to the exact
needs of the investigator may not be sufficient. To that amount usefulness of secondary data will be lost.Primary data is completely tailor-made and there is no problem of adjustments.

8/8/2019 MB0034 I & II
http://slidepdf.com/reader/full/mb0034-i-ii 8/32
P a g e
1 5
Secondary data is available effortlessly, rapidly and inexpensively. Primary data takes a lot of time and
the unit cost of such data is relatively high.
The search for answers to research questions is called collection of data. Data are facts, and other relevant
materials, past and present, serving as bases for study and analyses. The data needed for a social
science research may be broadly classified into (a) Data pertaining to human beings, (b) Data
relating to organization and (c) Data pertaining to territorial areas.
Personal data or data related to human beings consist of:
1. Demographic and socio-economic characteristics of individuals: Age, sex, race, social class,
religion, marital status, education, occupation income, family size, location of the household life
style etc.
2. Behavioural variables: Attitudes, opinions, awareness, knowledge, practice, intentions, etc.
3. Organizational data consist of data relating to an organizations origin, ownership, objectives,
resources, functions, performance and growth.4. Territorial data are related to geo-physical characteristics, resource endowment, population,
occupational pattern infrastructure degree of development, etc. of spatial divisions like villages,
cities, talluks, districts, state and the nation.
The data serve as the bases or raw materials for analysis. Without an analysis of factual data, no specific
inferences can be drawn on the questions under study. Inferences based on imagination or guess work
cannot provide correct answers to research questions. The relevance, adequacy and reliability of data
determine the quality of the findings of a study.
Data form the basis for testing the hypothesis formulated in a study. Data also provide the facts and
figures required for constructing measurement scales and tables, which are analyzed with statisticaltechniques. Inferences on the results of statistical analysis and tests of significance provide the answers to
research questions. Thus, the scientific process of measurements, analysis, testing and inferences depends
on the availability of relevant data and their accuracy. Hence, the importance of data for any research
studies.
The sources of data may be classified into (a) primary sources and (b) secondary sources.
Primary Sources of Data
Primary sources are original sources from which the researcher directly collects data that have not been previously collected e.g.., collection of data directly by the researcher on brand awareness, brand
preference, brand loyalty and other aspects of consumer behaviour from a sample of consumers by
interviewing them,. Primary data are first hand information collected through various methods such as
observation, interviewing, mailing etc.
Advantage of Primary Data
• It is original source of data
• It is possible to capture the changes occurring in the course of time.
• It flexible to the advantage of researcher.
• Extensive research study is based on primary data
Disadvantage of Primary Data

8/8/2019 MB0034 I & II
http://slidepdf.com/reader/full/mb0034-i-ii 9/32

8/8/2019 MB0034 I & II
http://slidepdf.com/reader/full/mb0034-i-ii 10/32
P a g e
1 5
Finally, secondary data may be used as the sole source of information for a research project. Such studies
as securities Market Behaviour, Financial Analysis of companies, Trade in credit allocation in
commercial banks, sociological studies on crimes, historical studies, and the like, depend primarily on
secondary data. Year books, statistical reports of government departments, report of public organizations
of Bureau of Public Enterprises, Censes Reports etc, serve as major data sources for such research studies.
Advantages of Secondary Data
Secondary sources have some advantages:
1. Secondary data, if available can be secured quickly and cheaply. Once their source of documents
and reports are located, collection of data is just matter of desk work. Even the tediousness of
copying the data from the source can now be avoided, thanks to Xeroxing facilities.
2. Wider geographical area and longer reference period may be covered without much cost. Thus, the
use of secondary data extends the researcher’s space and time reach.3. The use of secondary data broadens the data base from which scientific generalizations can be
made.
4. Environmental and cultural settings are required for the study.
5. The use of secondary data enables a researcher to verify the findings bases on primary data. It
readily meets the need for additional empirical support. The researcher need not wait the time
when additional primary data can be collected.
Disadvantages of Secondary Data
The use of a secondary data has its own limitations.
1. The most important limitation is the available data may not meet our specific needs. The
definitions adopted by those who collected those data may be different; units of measure may not
match; and time periods may also be different.
2. The available data may not be as accurate as desired. To assess their accuracy we need to know
how the data were collected.
3. The secondary data are not up-to-date and become obsolete when they appear in print, because of
time lag in producing them. For example, population census data are published two or three years
later after compilation and no new figures will be available for another ten years.
4. Finally, information about the whereabouts of sources may not be available to all social scientists.Even if the location of the source is known, the accessibility depends primarily on proximity. For
example, most of the unpublished official records and compilations are located in the capital city,
and they are not within the easy reach of researchers based in far off places.
Primary Data is the best way of collecting the data for research. Primary data is important for all areas
of research because it is unvarnished information about the results of an experiment or observation. It is
like the eye witness testimony at a trial which is admissible as evidence. No one has tarnished it or spun it
by adding their own opinion or bias so it can form the basis of objective conclusions.
1) Identification

8/8/2019 MB0034 I & II
http://slidepdf.com/reader/full/mb0034-i-ii 11/32
P a g e
1 5
Primary data is the specific information collected by the person who is doing the research. It can be
obtained through clinical trials, case studies, true experiments and randomized controlled studies. This
information can be analyzed by other experts who may decide to test the validity of the data by repeating
the same experiments.
2) SignificanceSuppose that you are researching the effects of a certain new substance on the nervous system of mice.
Because yours will be the first such experiment, the data that you collect will be considered prospective in
nature. It can be used to establish a base-line from which other follow-up experiments can be devised. In
the education context, prospective primary data about the kindergarteners in a school district might be to
collect the actual test results from the first day of school showing how many could write their names,
count to 20, and retell a simple story in a logical way. The information forms the base-line from which the
district must move their students so that they can meet the state standards for entering first graders within
the next 180 days.
3) TypesPrimary data can also be retrospective, interventional and observational in nature. Retrospective primary
data gathers information about past conditions or behaviours. The researcher may be investigating a cause
of a preventable disease, for instant as in the connection between smoking and lung cancer. Interventional
primary data may be gathered to see the effect of a new drug or therapy. A recent study reported in the
Journal of Ophthalmology, for example, described an interventional study about treatments for
convergence insufficiency. Patients with this diagnosis received one of three treatments over a 12-week
period to determine which intervention would be the most effective. Observational studies gather primary
data by means of case studies such as the work done by naturalists like Jane Good all on chimpanzees in
the wild.
4) Features
Two strategies are commonly employed when researchers gather primary data: randomizing and blinding.
Both of these strategies serve to keep the results objective. Both involve limiting the information given
either to the researcher or the subject about which test group to which a subject has been assigned. The
researcher is prevented from imposing her bias on the data so she may be a more careful observer. The
subject is prevented from becoming either encouraged or discouraged by any previous opinions about the
treatment, in a drug trial for example, that he may have started with.
5) Potential
Once the primary data has been gathered, analysts study it using other research methods. They look for
relationships between factors that may suggest the designs for new studies. When they combine the
primary data from more than one study, they are using integrative methods. Their findings present
secondary data, a synthesis of several streams of primary data.
Question 6:-
Describe interview method of collecting data. State the conditionsunder which it is considered most suitable. You have been assigned to conduct a
8/8/2019 MB0034 I & II
http://slidepdf.com/reader/full/mb0034-i-ii 12/32
P a g e
1 5
survey on the reading habits of the house wives in the middle class family. Design asuitable questionnaire consisting of 20 questions you propose to use in the survey.
Answer: - Interviewing is one of the prominent methods of data collection. It may be definedas a two way systematic conversation between an investigator and an informant, initiated for obtaining
information relevant to a specific study. It involves not only conversation, but also learning from the
respondent’s gesture, facial expressions and pauses, and his environment. Interviewing requires face to
face contact or contact over telephone and calls for interviewing skills. It is done by using a structured
schedule or an unstructured guide.
Interviewing may be used either as a main method or as a supplementary one in studies of persons.
Interviewing is the only suitable method for gathering information from illiterate or less educated
respondents. It is useful for collecting a wide range of data from factual demographic data to highly
personal and intimate information relating to a person’s opinions, attitudes, values, beliefs past experience
and future intentions. When qualitative information is required or probing is necessary to draw out fully,
and then interviewing is required. Where the area covered for the survey is a compact, or when a
sufficient number of qualified interviewers are available, personal interview is feasible.
Interview is often superior to other data-gathering methods. People are usually more willing to talk than
to write. Once report is established, even confidential information may be obtained. It permits probing
into the context and reasons for answers to questions.
Interview can add flesh to statistical information. It enables the investigator to grasp the behavioural
context of the data furnished by the respondents.
Types of Interviews
The interview may be classified into: (a) structured or directive interview, (b) unstructured or non-
directive interview, (c) focused interview, (d) clinical interview and (e) depth interview.
1) Structured Directive Interview
This is an interview made with a detailed standardized schedule. The same questions are put to all the
respondents and in the same order. Each question is asked in the same way in each interview, promoting
measurement reliability. This type of interview is used for large-scale formalized surveys.
Advantages: This interview has certain advantages. First, data from one interview to the next one are
easily comparable. Second, recording and coding data do not pose any problem, and greater precision is
achieved. Lastly, attention is not diverted to extraneous, irrelevant and time consuming conversation.
Limitation: However, this type of interview suffers from some limitations. First, it tends to lose the
spontaneity of natural conversation. Second, the way in which the interview is structured may be such that
the respondent’s views are minimized and the investigator’s own biases regarding the problem under
study are inadvertent introduced. Lastly, the scope for exploration is limited.

8/8/2019 MB0034 I & II
http://slidepdf.com/reader/full/mb0034-i-ii 13/32
P a g e
1 5
2) Unstructured or Non-Directive Interview
This is the least structured one. The interviewer encourages the respondent to talk freely about a give
topic with a minimum of prompting or guidance. In this type of interview, a detailed pre-planned schedule
is not used. Only a broad interview guide is used. The interviewer avoids channelling the interview
directions. Instead he develops a very permissive atmosphere. Questions are not standardized and ordered
in a particular way.
This interviewing is more useful in case studies rather than in surveys. It is particularly useful in
exploratory research where the lines of investigations are not clearly defined. It is also useful for
gathering information on sensitive topics such as divorce, social discrimination, class conflict, generation
gap, drug-addiction etc. It provides opportunity to explore the various aspects of the problem in an
unrestricted manner.
Advantages: This type of interview has certain special advantages. It can closely approximate the
spontaneity of a natural conversation. It is less prone to interviewer’s bias. It provides greater opportunity
to explore the problem in an unrestricted manner.
Limitations: Though the unstructured interview is a potent research instrument, it is not free from
limitations. One of its major limitations is that the data obtained from one interview is not comparable to
the data from the next. Hence, it is not suitable for surveys. Time may be wasted in unproductive
conversations. By not focusing on one or another facet of a problem, the investigator may run the risk of
being led up blind alley. As there is no particular order or sequence in this interview, the classification of
responses and coding may required more time. This type of informal interviewing calls for greater skill
than the formal survey interview.
3) Focused Interview
This is a semi-structured interview where the investigator attempts to focus the discussion on the actual
effects of a given experience to which the respondents have been exposed. It takes place with the
respondents known to have involved in a particular experience, e.g., seeing a particular film, viewing a
particular program on TV. involved in a train/bus accident, etc. The situation is analysed prior to the
interview. An interview guide specifying topics relating to the research hypothesis used. The interview is
focused on the subjective experiences of the respondent, i.e., his attitudes and emotional responses
regarding the situation under study. The focused interview permits the interviewer to obtain details of
personal reactions, specific emotions and the like.
Merits: This type of interview is free from the inflexibility of formal methods, yet gives the interview a
set form and insured adequate coverage of all the relevant topics. The respondent is asked for certain
information, yet he has plenty of opportunity to present his views. The interviewer is also free to choose
the sequence of questions and determine the extent of probing,
4) Clinical Interview
This is similar to the focused interview but with a subtle difference. While the focused interview is
concerned with the effects of specific experience, clinical interview is concerned with broad underlying
feelings or motivations or with the course of the individual’s life experiences.
The ‘personal history’ interview used in social case work, prison administration, psychiatric clinics and in
individual life history research is the most common type of clinical interview. The specific aspects of the

8/8/2019 MB0034 I & II
http://slidepdf.com/reader/full/mb0034-i-ii 14/32
P a g e
1 5
individual’s life history to be covered by the interview are determined with reference to the purpose of the
study and the respondent is encouraged to talk freely about them.
5) Depth Interview
This is an intensive and searching interview aiming at studying the respondent’s opinion, emotions or
convictions on the basis of an interview guide. This requires much more training on inter-personal skills
than structured interview. This deliberately aims to elicit unconscious as well as extremely personal
feelings and emotions.
This is generally a lengthy procedure designed to encourage free expression of affectively charged
information. It requires probing. The interviewer should totally avoid advising or showing disagreement.
Of course, he should use encouraging expressions like “uh-huh” or “I see” to motivate the respondent to
continue narration. Sometimes the interviewer has to face the problem of affections, i.e. the respondent
may hide expressing affective feelings. The interviewer should handle such situation with great care.
6) Approaches to Interview
Interviewing as a method of data collection has certain features. They are:
The Participants: The interviewer and the respondent – are strangers. Hence, the investigator has to get
him introduced to the respondent in an appropriate manner.
The Relationship between the Participants is a Transitory one: It has a fixed beginning and
termination points. The interview proper is a fleeting, momentary experience for them.
Interview is not a mere casual conversational exchange: Interview is a conversation with a specific
purpose, viz., obtaining information relevant to a study.
Interview is a mode of obtaining verbal answers to questions put verbally: The interaction between
the interviewer and the respondent need not necessarily be on a face-to-face basis, because interview can
be conducted over the telephone also. Although interview is usually a conversation between two persons,
it need not be limited to a single respondent. It can also be conducted with a group of persons, such as
family members, or a group of children or a group of customers, depending on the requirements of the
study.
Interview is an inter-actionable process: The interaction between the interviewer and the respondentdepends upon how they perceive each other.
The respondent reacts to the interviewer’s appearance, behaviour, gestures, facial expression and
intonation, his perception of the thrust of the questions and his own personal needs. As far as possible, the
interviewer should try to be closer to the social-economic level of the respondents. Moreover, he should
realize that his respondents are under no obligations to extend response.
One should, therefore, be tactful and be alert to such reactions of the respondents as lame-excuse,
suspicion, reluctance or indifference, and deal with them suitably. One should not also argue or dispute.
One should rather maintain an impartial and objective attitude. Information furnished by the respondent in
the interview is recorded by the investigator. This poses a problem of seeing that recording does not
interfere with the tempo of conversation.
8/8/2019 MB0034 I & II
http://slidepdf.com/reader/full/mb0034-i-ii 15/32
P a g e
1 5
Interviewing is not a standardized process: Like that of a chemical technician; it is rather a flexible
psychological process. The implication of this feature is that the interviewer cannot apply unvarying
standardized technique, because he is dealing with respondents with varying motives and diverse
perceptions. The extent of his success as an interviewer is very largely dependent upon his insight and
skill in dealing with varying socio-physiological situations.
7) Qualities of Interviews
The requirements or conditions necessary for a successful interview are:
Data availability: The needed information should be available with the respondent. He should be able to
conceptualize it in terms to the study, and be capable of communicating it.
Role perception: The respondent should understand his role and know what is required of him. He
should know what is a relevant and how complete it should be. He can learn much of this from theinterviewer’s introduction, explanations and questioning procedure.
The interviewer should also know his role: He should establish a permissive atmosphere and encourage
frank and free conversation. He should not affect the interview situation through subjective attitude and
argumentation.
Respondent’s motivation: The respondent should be willing to respond and give accurate answer. This
depends partly on the interviewer’s approach and skill. The interview has interest in it for the purpose of
his research, but the respondent has no personal interest in it. Therefore, the interviewer should establish a
friendly relationship with the respondent, and create in him an interest in the subject-matter of the study.
The interviewer should try to reduce the effect of demotivating factors like desire to get on with other activities, embarrassment at ignorance, dislike of the interview content, suspicious about the interviewer,
and fear of consequence, He should also try to build up the effect of motivating actors like curiosity,
loneliness, politeness, sense of duty, respect of the research agency and liking for the interviewer.
The above requirement reminds that the interview is an interaction process. The investigator should keep
this in mind and take care to see that his appearance and behaviour do not distort the interview situation.
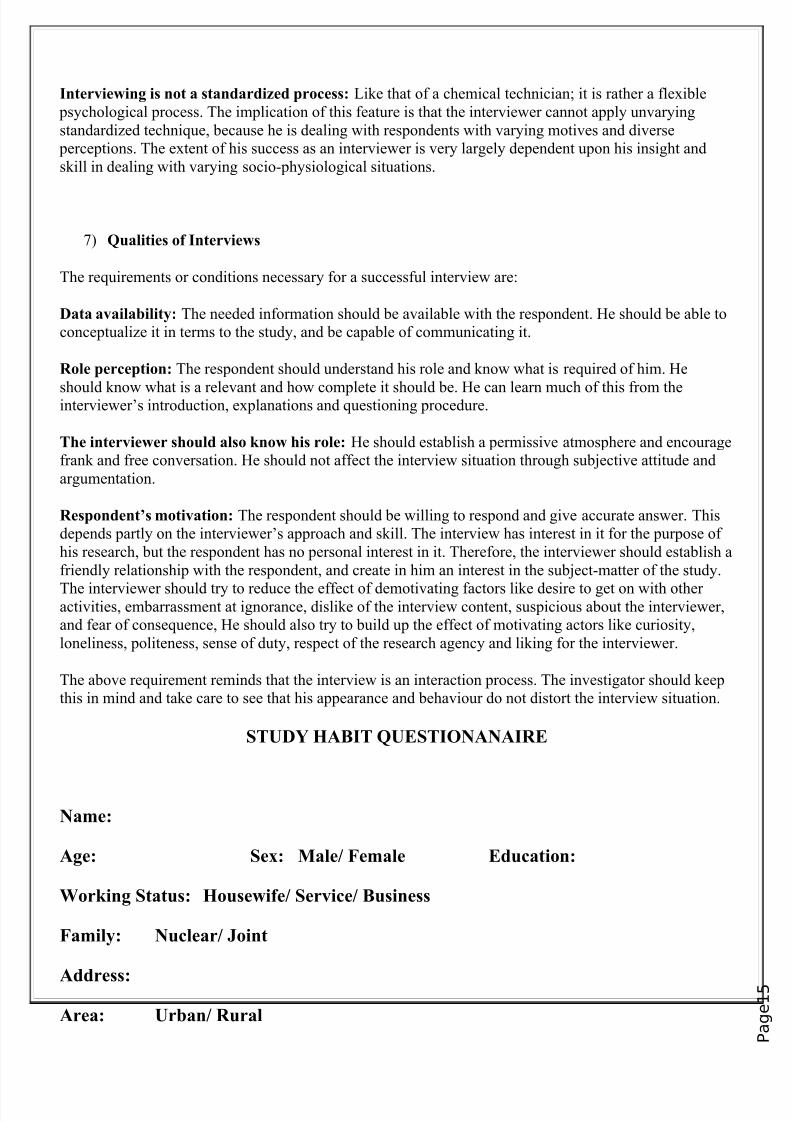
STUDY HABIT QUESTIONANAIRE
Name:
Age: Sex: Male/ Female Education:
Working Status: Housewife/ Service/ Business
Family: Nuclear/ Joint
Address:Area: Urban/ Rural

8/8/2019 MB0034 I & II
http://slidepdf.com/reader/full/mb0034-i-ii 16/32
P a g e
1 5
1. Do you read books? Yes / No
2. Which type of books you read? Novel / Literature / Familymagazine / Any otherSpecify
3. Do you read the whole book? Yes / No
4. Do you have a reading time every day? Yes / No
5. Do you make your reading time as the favourite
time of the day?
Yes / No
6. Do you do other activities like watching T.V. orsnacking while reading
Yes / No
7. Do you read newspaper? Yes / No
8. Do you read only head lines or go throughwhole contents?
Only headline / Wholecontent
9. What kind of news you like to read? Political / Games /Advertisement / Local
news/ Any other specify
10.
Do you subscribe only one news paper or more? One / More

8/8/2019 MB0034 I & II
http://slidepdf.com/reader/full/mb0034-i-ii 17/32
P a g e
1 5
11.
Do you subscribe only Hindi news paper or of other language also?
Only Hindi / Other language
1
2.
If you subscribe news paper of other language, it
is of English or of your mother language?
English / Mother language
13.
Do you need to read the newspaper compulsorilybefore starting your routine daily activities?
Yes / No
14.
Do you subscribe any magazine? Yes / No
15.
If yes, specify which magazine?
16.
Do you keep your books and magazine safe forfuture reference?
Yes / No
17.
Which content of the magazine attracts you themost?
18.
Do you look for forecasting features of newspaper and magazine?
Yes / No
19.
Do you carry any book/ magazine when youtravel?
Yes / No
20.
Do you feel your book a good friend? Yes / No

8/8/2019 MB0034 I & II
http://slidepdf.com/reader/full/mb0034-i-ii 18/32
P a g e
1 5
SET – 2
Question 1:- Write short notes on the following:
(a) Null Hypothesis
(b) What is exploratory research?
(b) What is Random Sampling?
(c) Rank Order Correlation
Answer: - Null Hypothesis: - The null hypothesis is a hypothesis about a population
parameter. The purpose of hypothesis testing is to test the viability of the null hypothesis in the
light of experimental data. Depending on the data, the null hypothesis either will or will not be
rejected as a viable possibility.
Consider a researcher interested in whether the time to respond to a tone is affected by the
consumption of alcohol. The null hypothesis is that µ1 - µ2 = 0 where µ1 is the mean time to
respond after consuming alcohol and µ2 is the mean time to respond otherwise. Thus, the null
hypothesis concerns the parameter µ1 - µ2 and the null hypothesis is that the parameter equals zero.
The null hypothesis is often the reverse of what the experimenter actually believes; it is put
forward to allow the data to contradict it. In the experiment on the effect of alcohol, the
experimenter probably expects alcohol to have a harmful effect. If the experimental data show a
sufficiently large effect of alcohol, then the null hypothesis that alcohol has no effect can berejected.

8/8/2019 MB0034 I & II
http://slidepdf.com/reader/full/mb0034-i-ii 19/32
P a g e
1 5
It should be stressed that researchers very frequently put forward a null hypothesis in the hope that
they can discredit it. For a second example, consider an educational researcher who designed a
new way to teach a particular concept in science, and wanted to test experimentally whether this
new method worked better than the existing method. The researcher would design an experiment
comparing the two methods. Since the null hypothesis would be that there is no difference
between the two methods, the researcher would be hoping to reject the null hypothesis and
conclude that the method he or she developed is the better of the two.
The symbol H0 is used to indicate the null hypothesis. For the example just given, the null
hypothesis would be designated by the following symbols:
H0: µ1 - µ2 = 0
or by
H0: μ1 = μ2.
The null hypothesis is typically a hypothesis of no difference as in this example where it is the
hypothesis of no difference between population means. That is why the word "null" in "null
hypothesis" is used -- it is the hypothesis of no difference.
Despite the "null" in "null hypothesis," there are occasions when the parameter is not hypothesized
to be 0. For instance, it is possible for the null hypothesis to be that the difference between
population means is a particular value. Or, the null hypothesis could be that the mean SAT score
in some population is 600. The null hypothesis would then be stated as: H0: μ = 600. Although the
null hypotheses discussed so far have all involved the testing of hypotheses about one or more
population means, null hypotheses can involve any parameter. An experiment investigating the
correlation between job satisfaction and performance on the job would test the null hypothesis thatthe population correlation (ρ) is 0. Symbolically, H0: ρ = 0.
Some possible null hypotheses are given below:
H0: μ=0
H0: μ=10
H0: μ1 - μ2 = 0
H0: π = .5
H0: π1 - π2 = 0
H0: μ1 = μ2 = μ3
H0: ρ1- ρ2= 0
When a one-tailed test is conducted, the null hypothesis includes the direction of the effect. A one-
tailed test of the differences between means might test the null hypothesis that μ1 - μ 2 ≥ 0. If M1 -
M2 were much less than 0 then the null hypothesis would be rejected in favour of the alternative
hypothesis: μ1 - μ2 < 0.
Exploratory Research: - It is also known as formulative research. It is preliminary
study of an unfamiliar problem about which the researcher has little or no knowledge. It is ill-
structured and much less focused on pre-determined objectives. It usually takes the form of a pilotstudy. The purpose of this research may be to generate new ideas, or to increase the researcher’s
familiarity with the problem or to make a precise formulation of the problem or to gather
information for clarifying concepts or to determine whether it is feasible to attempt the study. Katz

8/8/2019 MB0034 I & II
http://slidepdf.com/reader/full/mb0034-i-ii 20/32
P a g e
1 5
conceptualizes two levels of exploratory studies. “At the first level is the discovery of the
significant variable in the situations; at the second, the discovery of relationships between
variables.”
Random Sampling: - Probability sampling is based on the theory of probability. It is also
known as random sampling. It provides a known nonzero chance of selection for each population
element. It is used when generalization is the objective of study, and a greater degree of accuracy of
estimation of population parameters is required. The cost and time required is high hence the benefit
derived from it should justify the costs.
The following are the types of probability sampling:
i. Simple Random Sampling: This sampling technique gives each element an equal and
independent chance of being selected. An equal chance means equal probability of selection. An
independent chance means that the draw of one element will not affect the chances of other elements being selected. The procedure of drawing a simple random sample consists of enumeration
of all elements in the population.
1. Preparation of a List of all elements, giving them numbers in serial order 1, 2, B, and so
on, and
2. Drawing sample numbers by using (a) lottery method, (b) a table of random numbers or (c)
a computer.
Suitability: This type of sampling is suited for a small homogeneous population.
Advantages: The advantage of this is that it is one of the easiest methods, all the elements in the population have an equal chance of being selected, simple to understand, does not require prior
knowledge of the true composition of the population.
Disadvantages: It is often impractical because of non-availability of population list or of difficulty
in enumerating the population, does not ensure proportionate representation and it may be expensive
in time and money. The amount of sampling error associated with any sample drawn can easily be
computed. But it is greater than that in other probability samples of the same size, because it is less
precise than other methods.
ii. Stratified Random Sampling: This is an improved type of random or probability sampling. Inthis method, the population is sub-divided into homogenous groups or strata, and from each stratum,
random sample is drawn. E.g., university students may be divided on the basis of discipline, and
each discipline group may again be divided into juniors and seniors. Stratification is necessary for
increasing a sample’s statistical efficiency, providing adequate data for analyzing the various sub-
populations and applying different methods to different strata. The stratified random sampling is
appropriate for a large heterogeneous population. Stratification process involves three major
decisions. They are stratification base or bases, number of strata and strata sample sizes.
Stratified random sampling may be classified into:
a) Proportionate stratified sampling: This sampling involves drawing a sample from eachstratum in proportion to the latter’s share in the total population. It gives proper representation to
each stratum and its statistical efficiency is generally higher. This method is therefore very

8/8/2019 MB0034 I & II
http://slidepdf.com/reader/full/mb0034-i-ii 21/32
P a g e
1 5
popular. E.g., if the Management Faculty of a University consists of the following specialization
groups:
Specialization stream No. of students Proportion of each stream
Production
Finance
Marketing
Rural development
40
20
30
10
0.4
0.2
0.3
0.1
100 1.0
The research wants to draw an overall sample of 30. Then the strata sample sizes would be:
Strata Sample size
Production
Finance
Marketing
Rural development
30 x 0.4
30 x 0.2
30 x 0.3
30 x 0.1
12
6
9
3
30
Advantages: Stratified random sampling enhances the representativeness to each sample, gives
higher statistical efficiency, easy to carry out, and gives a self-weighing sample.
Disadvantages: A prior knowledge of the composition of the population and the distribution of
the population, it is very expensive in time and money and identification of the strata may lead
to classification of errors.
b) Disproportionate stratified random sampling: This method does not give proportionate
representation to strata. It necessarily involves giving over-representation to some strata and
under-representation to others. The desirability of disproportionate sampling is usually
determined by three factors, viz, (a) the sizes of strata, (b) internal variances among strata, and
(c) sampling costs.
Suitability: This method is used when the population contains some small but importantsubgroups, when certain groups are quite heterogeneous, while others are homogeneous and
when it is expected that there will be appreciable differences in the response rates of the
subgroups in the population.

8/8/2019 MB0034 I & II
http://slidepdf.com/reader/full/mb0034-i-ii 22/32
P a g e
1 5
Advantages: The advantages of this type is it is less time consuming and facilitates giving
appropriate weighing to particular groups which are small but more important.
Disadvantages: The disadvantage is that it does not give each stratum proportionate
representation, requires prior knowledge of composition of the population, is subject to
classification errors and its practical feasibility is doubtful.
iii. Systematic Random Sampling: This method of sampling is an alternative to random selection.
It consists of taking k th item in the population after a random start with an item from 1 to k. It is also
known as fixed interval method. E.g., 1st, 11th, 21st ……… Strictly speaking, this method of
sampling is not a probability sampling. It possesses characteristics of randomness and some non-
probability traits.
Suitability: Systematic selection can be applied to various populations such as students in a class,
houses in a street, telephone directory etc.
Advantages: The advantages are it is simpler than random sampling, easy to use, easy to instruct,requires less time, it’s cheaper, easier to check, sample is spread evenly over the population, and it is
statistically more efficient.
Disadvantages: The disadvantages are it ignores all elements between two k th elements selected,
each element does not have equal chance of being selected, and this method sometimes gives a
biased sample.
Rank Order Correlation: - When we are dealing with data at the ordinal level, such as
ranks, we must use a measure of correlation that is designed to handle ordinal data. The Spearman Rank Order Correlation Coefficient was developed by Spearman to use with this type of data. The Symbol for
the Spearman Rank Order Correlation Coefficient is , r sub s, or the Greek letter rho ( ).
The formula for the Spearman Correlation Coefficient is:
Where 6 is a constant (it is always used in the formula),
D refers to the difference between subjects ranks on the two variables,
and N is the number of subjects.
Question 2:- Elaborate the format of a research report touching briefly on themechanics of writing.

8/8/2019 MB0034 I & II
http://slidepdf.com/reader/full/mb0034-i-ii 23/32
P a g e
1 5
Answer: - Research report is a means for communicating research experience to others. A
research report is a formal statement of the research process and it results. It narrates the problem
studied, methods used for studying it and the findings and conclusions of the study.
Contents of the Research Report
The outline of a research report is given below:
I. Prefatory Items
• Title page
• Declaration
• Certificates
• Preface/ acknowledgements
• Table of contents
• List of tables
•
List of graphs/ figures/ charts• Abstract or synopsis
II. Body of the Report
• Introduction
• Theoretical background of the topic
• Statement of the problem
• Review of literature
• The scope of the study
• The objectives of the study
• Hypothesis to be tested• Definition of the concepts
• Models if any
• Design of the study
• Methodology
• Method of data collection
• Sources of data
• Sampling plan
• Data collection instruments
• Field work
• Data processing and analysis plan
• Overview of the report
• Limitation of the study
• Results: findings and discussions
• Summary, conclusions and recommendations
III. Reference Material
• Bibliography
• Appendix
• Copies of data collection instruments
•
Technical details on sampling plan• Complex tables
• Glossary of new terms used.

8/8/2019 MB0034 I & II
http://slidepdf.com/reader/full/mb0034-i-ii 24/32
P a g e
1 5
Styles of Reporting
Communicate to a Specific Audience
The first step is to know the audience, its background, and its objectives. Most effective presentations
seem live conversations or memos to a particular person as opposed to an amorphous group. Audience
identification affects presentation decisions such as selecting the material to be included and the level of
presentation. Excessive detail or material presented at too low a level can be boring. The audience can
become irritated when material perceived as relevant is excluded or the material is presented at too high
level. In an oral presentation, the presenter can ask audience whether they already know some of the
material.
Frequently, a presentation must be addressed to two or more different audiences. There are ways to deal
with such a problem. In a written presentation, an executive summary at the outset can provide an
overview of the conclusions for the benefit of those in the audience who are not interested in details. The presentation must respect the audience’s time constraints. An appendix can be used to reach some people
selectively, without distracting the others. Sometimes introduction to a chapter or a section can convey
the nature of the contents, which certain audiences may bypass. In an oral presentation, the presence of
multiple audiences should be recognized.
Structure the Presentation
Each piece of presentation should fit into the whole, just as individual pieces fit into a jigsaw puzzle. The
audience should not be muttering. The solution to this is to provide a well-defined structure. The structure
should include an introduction, a body, and a summary. Further, each of the major sections should be
structured similarly. The precept is to tell the audience what you are going to say, say it and then tell themwhat you said. Sometimes you want to withhold the conclusion to create interest.
Introduction should play several roles. First, it should provide audience interest. A second function is to
identify the presentation’s central idea or objective. Third, it should provide a road map to the rest of the
presentation so that the audience can picture its organisation and flow.
It is better to divide the body of the presentation into two to five parts. The audience will be able to absorb
only so much information. If that information can be aggregated into chunks, it will be easier to
assimilate. Sometimes the points to be made cannot be combined easily or naturally. In that case, it is
necessary to use a longer list. One way to structure the presentation is by the research questions. Another
method that is often useful when presenting the research proposal is to base it on the research process.The most useful presentations will include a statement of implications and recommendations relevant to
the research purpose. However, when researcher lacks information about the total situation because the
research study addresses only a limited aspect of it, the ability to generate recommendations may be
limited.
The purpose of the presentation summary is to identify and underline the important points of the
presentations and to provide some repetition of their content. The summary should support the
presentation communication objectives by helping the audience to retain the key parts of the content. The
audience should feel that there is a natural flow from one section to another.
Create Audience Interest

8/8/2019 MB0034 I & II
http://slidepdf.com/reader/full/mb0034-i-ii 25/32
P a g e
1 5
The audience should be motivated to read or listen to the presentation’s major parts and to the individual
elements of each section the audience should know why the presentation is relevant to them and why each
section was included. A section that cannot hold interest should be excluded or relegated to appendix.
The research purpose and objectives are good vehicles to provide motivation. The research purpose
should specify decisions to be made and should relate to the research questions. A presentation that
focuses on those research questions and their associated hypothesis will naturally be tied to relevant
decisions and hold audience interest. In contrast, a presentation that attempts to report on all the questions
that were included in the survey and in the cross-tabulations often will be long, uninteresting and of little
value.
As the analysis proceeds and presentation is being prepared, the researcher should be on the lookout for
results that are exceptionally persuasive, relevant, interesting, and unusual. Sometimes, the deviant
respondent with strange answers can provide the most insight in his or her responses that are pursued and
not discarded.
Be Specific and VisualAvoid taking or writing in the abstract. If different members of the audience have different or vague
understandings of important concepts, there is a potential problem. Terms that are ambiguous or not well
known should be defined and illustrated or else omitted. The most interesting presentations usually use
specific stories, anecdotes, studies, or incidents to make points.
Address Validity and Reliability Issues
The presentation should help the audience avoid misinterpreting the results. The wording of the questions,
the order in which they are asked, and the sampling design are among the design dimensions that can lead
to biased results and misinterpretations. The presentation should not include an exhaustive description of all the design considerations. Nobody is interested in a textbook discussion of the advantages of telephone
over mail surveys, or how you locate homes in an area sampling design.
The presentation should include some indication of the reliability of the results. At the minimum, it
always should be clear what sample size was involved. The key results should be supported by more
precise information in the form of interval estimates or a hypothesis test. The hypothesis test basically
indicates, given the sample size, what probability exists that the results were merely an accident of
sampling. If the probability of the latter is not low, then the results probably would not be repeated. Do
not imply more precision than is warranted.
Steps in Drafting the Research Report
Along with the related skill of working with and motivating people, the ability to communicate effectively
is undoubtedly the most important attribute a manager can have. Effective communication between
research users and research professional is extremely important to the research process. The formal
presentation usually plays a key role in the communication effort. Generally, presentations are made twice
during the research process. First, there is the research proposal presentation. Second, there is the
presentation of the research results.
Guidelines for successful presentations
In general a presenter should:
• Communicate to a specific audience.
8/8/2019 MB0034 I & II
http://slidepdf.com/reader/full/mb0034-i-ii 26/32
P a g e
1 5
• Structure the presentation.
• Create audience interest
• Be specific and visual
• Address validity and reliability issues
Editing the Final draft
A research report requires clear organisation. Each chapter may be divided into two or more sections with
appropriate headings and in each section margin headings and paragraph headings may be used to
indicate subject shifts. Physical presentation is another aspect of organisation. A page should not be fully
filled in from top to bottom. Wider margins should be provided on both sides and on top and bottom as
well.
Centred section heading is provided in the centre of the page and is usually in solid font size. It is
separated from other textual material by two or three line space.
Marginal heading is used for a subdivision in each section. It starts from the left side margin without
leaving any space.
Paragraph heading is used to head an important aspect of the subject matter discussed in a subdivision.
There is some space between the margin and this heading.
Presentation should be free from spelling and grammar errors. If the writer is not strong in grammar, get
the manuscript corrected by a language expert.
Use the rules of punctuations.
Use present tense for presenting the findings of the study and for stating generalizations.
Do not use masculine nouns and pronouns when the content refers to both the genders. Do not abbreviate
words in the text; spell out them in full. Footnote citation is indicated by placing an index number, i.e., a
superscript or numeral, at the point of reference. Reference style should have a clear format and used
consistently.
Evaluating the Final Draft
The general guidelines discussed so far are applicable to both written and oral presentations. However, it
is important to generate a research report that will be interesting to read. Most researchers are not trained
in effective report writing. In their enthusiasm for research, they often overlook the need for a good
writing style. In writing a report, long sentences should be reconsidered and the critical main points
should stand out.
Here are some hints for effective report writing.
• Use main heading and subheadings to communicate the content of the material discussed.
• Use the present tense as much as possible to communicate information.
• Whether the presentation is written or oral, use active voice construction to make it lively and
interesting, passive voice is wordy and dull.
8/8/2019 MB0034 I & II
http://slidepdf.com/reader/full/mb0034-i-ii 27/32
P a g e
1 5
• Use computer-generated tables and graphs for effective presentations.
• Use informative headings.
• Use double-sided presentation if possible. For example, tables or graphs could be presented on the
left side of an open report and their descriptions on the right side.
Question3:- Discuss the importance of case study method.
Answer: - Case study is a method of exploring and analyzing the life of a social unit or entity,
be it a person, a family, an institution or a community. The aim of case study method is to locate or
identify the factors that account for the behaviour patterns of a given unit, and its relationship with the
environment. The case data are always gathered with a view to attracting the natural history of the social
unit, and its relationship with the social factors and forces operative and involved in this surrounding
milieu. In short, the social researcher tries, by means of the case study method, to understand the complex
of factors that are working within a social unit as an integrated totality. Looked at from another angle, thecase study serves the purpose similar to the clue-providing function of expert opinion. It is most
appropriate when one is trying to find clues and ideas for further research.
The major credit for introducing case study method into social investigation goes to Frederick Leplay.
Herbert Spencer was the first social philosopher who used case study in comparative studies of different
cultures. William Healey used case study in his study of juvenile delinquency. Anthropologists and
ethnologists have liberally utilized cast study in the systematic description of primitive cultures.
Historians have used this method for portraying some historical character or particular historical period
and describing the developments within a national community.
Making Case Study Effective
Let us discuss the criteria for evaluating the adequacy of the case history or life history which is of central
importance for case study. John Dollard has proposed seven criteria for evaluating such adequacy as
follows:
i) The subject must be viewed as a specimen in a cultural series. That is, the case drawn out from its total
context for the purposes of study must be considered a member of the particular cultural group or
community. The scrutiny of the life histories of persons must be done with a view to identify the
community values, standards and their shared way of life.
ii) The organic motto of action must be socially relevant. That is, the action of the individual cases must
be viewed as a series of reactions to social stimuli or situation. In other words, the social meaning of
behaviour must be taken into consideration.
iii) The strategic role of the family group in transmitting the culture must be recognized. That is, in case
of an individual being the member of a family, the role of family in shaping his behaviour must never be
overlooked.
iv) The specific method of elaboration of organic material onto social behaviour must be clearly shown.
That is case histories that portray in detail how basically a biological organism, the man, gradually
blossoms forth into a social person, are especially fruitful.

8/8/2019 MB0034 I & II
http://slidepdf.com/reader/full/mb0034-i-ii 28/32
P a g e
1 5
v) The continuous related character of experience for childhood through adulthood must be stressed. In
other words, the life history must be a configuration depicting the inter-relationships between the person’s
various experiences.
vi) Social situation must be carefully and continuously specified as a factor. One of the important criteria
for the life history is that a person’s life must be shown as unfolding itself in the context of and partly
owing to specific social situations.
vii) The life history material itself must be organised according to some conceptual framework, this in
turn would facilitate generalizations at a higher level.
Question 4:- Give the importance of frequency tables and discuss the principles
of table construction, frequency distribution and class intervals determination
Answer: - Frequency tables provide a “shorthand” summary of data. The importance of
presenting statistical data in tabular form needs no emphasis. Tables facilitate comprehending masses of
data at a glance; they conserve space and reduce explanations and descriptions to a minimum. They give a
visual picture of relationships between variables and categories. They facilitate summation of item and
the detection of errors and omissions and provide a basis for computations.
It is important to make a distinction between the general purpose tables and specific tables. The general
purpose tables are primary or reference tables designed to include large amount of source data inconvenient and accessible form. The special purpose tables are analytical or derivate ones that
demonstrate significant relationships in the data or the results of statistical analysis. Tables in reports of
government on population, vital statistics, agriculture, industries etc., are of general purpose type. They
represent extensive repositories and statistical information. Special purpose tables are found in
monographs, research reports and articles and reused as instruments of analysis. In research, we are
primarily concerned with special purpose.
Principles of Table Construction
There are certain generally accepted principles of rules relating to construction of tables. They are:
1. Every table should have a title. The tile should represent a succinct description of the contents of
the table. It should be clear and concise. It should be placed above the body of the table.
2. A number facilitating easy reference should identify every table. The number can be centred
above the title. The table numbers should run in consecutive serial order. Alternatively tables in
chapter 1 be numbered as 1.1, 1.2, 1….., in chapter 2 as 2.1, 2.2, 2.3…. and so on.
3. The captions (or column headings) should be clear and brief.
4. The units of measurement under each heading must always be indicated.
5. Any explanatory footnotes concerning the table itself are placed directly beneath the table and in
order to obviate any possible confusion with the textual footnotes such reference symbols as theasterisk (*) DAGGER (+) and the like may be used.
6. If the data in a series of tables have been obtained from different sources, it is ordinarily advisable
to indicate the specific sources in a place just below the table.
8/8/2019 MB0034 I & II
http://slidepdf.com/reader/full/mb0034-i-ii 29/32
P a g e
1 5
7. Usually lines separate columns from one another. Lines are always drawn at the top and bottom of
the table and below the captions.
8. The columns may be numbered to facilitate reference.
9. All column figures should be properly aligned. Decimal points and “plus” or “minus” signs should
be in perfect alignment.
10. Columns and rows that are to be compared with one another should be brought closed together.
11. Totals of rows should be placed at the extreme right column and totals of columns at the bottom.
12. In order to emphasize the relative significance of certain categories, different kinds of type,
spacing and identifications can be used.
13. The arrangement of the categories in a table may be chronological, geographical, alphabetical or
according to magnitude. Numerical categories are usually arranged in descending order of
magnitude.
14. Miscellaneous and exceptions items are generally placed in the last row of the table.
15. Usually the larger number of items is listed vertically. This means that a table’s length is more
than its width.
16. Abbreviations should be avoided whenever possible and ditto marks should not be used in a table.
17. The table should be made as logical, clear, accurate and simple as possible.
Text references should identify tables by number, rather than by such expressions as “the table above” or
“the following table”. Tables should not exceed the page size by photo stating. Tables those are too wide
for the page may be turned sidewise, with the top facing the left margin or binding of the script. Where
tables should be placed in research report or thesis? Some writers place both special purpose and general
purpose tables in an appendix and refer to them in the text by numbers. This practice has the
disadvantages of inconveniencing the reader who wants to study the tabulated data as the text is read. A
more appropriate procedure is to place special purpose tables in the text and primary tables, if needed at
all, in an appendix.
Question 5:- Write short notes on the following:
(a) Type I error and type II error.
(b) One tailed and two tailed test
(c) Selecting the significance level
Answer: - Type I error and type II error:-
In the context of testing of hypothesis there are basically two types of errors that researchers make. We
may reject H0 when H0 is true & we may accept H0 when it is not true. The former is known as Type I &
the later is known as Type II. In other words, Type I error mean rejection of hypothesis which should
have been accepted & Type II error means accepting of hypothesis which should have been rejected.
Type I error is donated by α (alpha), also called as level of significance of test; and Type II error is
donated by β(beta).
Decision
Accept H0 Reject H0

8/8/2019 MB0034 I & II
http://slidepdf.com/reader/full/mb0034-i-ii 30/32
P a g e
1 5
H0 (true) Correct decision Type I error (α error)
Ho (false) Type II error (β error) Correct decision
The probability of Type I error is usually determined in advance and is understood as the level of
significance of testing the hypothesis. If type I error is fixed at 5%, it means there are about chances in
100 that we will reject H0 when H0 is true. We can control type I error just by fixing it at a lower level.For instance, if we fix it at 1%, we will say that the maximum probability of committing type I error
would only be 0.01.
But with a fixed sample size, n when we try to reduce type I error, the probability of committing type II
error increases. Both types of errors cannot be reduced simultaneously. There is a trade-off in business
situations, decision-makers decide the appropriate level of type I error by examining the costs of penalties
attached to both types of errors. If type I error involves time & trouble of reworking a batch of chemicals
that should have been accepted, where as type II error means taking a chance that an entire group of users
of this chemicals compound will be poisoned, then in such a situation one should prefer a type I error to a
type II error means taking a chance that an entire group of users of this chemicals compound will be
poisoned, then in such a situation one should prefer a type II error. As a result one must set very highlevel for type I error in one’s testing techniques of a given hypothesis. Hence, in testing of hypothesis,
one must make all possible effort to strike an adequate balance between Type I & Type II error.
Two Tailed Test & One Tailed Test
In the context of hypothesis testing these two terms are quite important and must be clearly understood. A
two-tailed test rejects the null hypothesis if, say, the sample mean is significantly higher or lower than the
hypnotized value of the mean of the population. Such a test inappropriate when we haveH0: µ= µ H0 and
Ha: µ≠µ H0 which may µ>µ H0 or µ<µ H0. If significance level is % and the two-tailed test to be applied,
the probability of the rejection area will be 0.05 (equally split on both tails of curve as 0.025) and that of the acceptance region will be 0.95. If we take µ = 100 and if our sample mean deviates significantly from
µ, in that case we shall accept the null hypothesis. But there are situations when only one-tailed test is
considered appropriate. A one-tailed test would be used when we are to test, say, whether the population
mean in either lower than or higher than some hypothesized value.
The Level of Significance
In statistics, a number that expresses the probability that the result of a given experiment or study could
have occurred purely by chance. This number can be a margin of error (“The results of this public opinion
poll are accurate to five percent”), or it can indicate a confidence level (“If this experiment were repeated,
there is a probability of ninety-five percent that our conclusions would be substantiated”).
In hypothesis testing, the significance level is the criterion used for rejecting the null hypothesis. The
significance level is used in hypothesis testing as follows: First, the difference between the results of the
experiment and the null hypothesis is determined. Then, assuming the null hypothesis is true; the
probability of a difference that large or larger is computed. Finally, this probability is compared to the
significance level. If the probability is less than or equal to the significance level, then the null hypothesis
is rejected and the outcome is said to be statistically significant. Traditionally, experimenters have used
either the 0.05 level (sometimes called the 5% level) or the 0.01 level (1% level), although the choice of levels is largely subjective. The lower the significance level, the more the data must diverge from the null
hypothesis to be significant. Therefore, the 0.01 level is more conservative than the 0.05 level. The Greek

8/8/2019 MB0034 I & II
http://slidepdf.com/reader/full/mb0034-i-ii 31/32
P a g e
1 5
letter alpha (α) is sometimes used to indicate the significance level. See also: Type I error and
significance test.
This is a very important concept in the context of hypothesis testing. It is always some percentage
(usually 5%) which should be chosen with great care, thought and reason. In case we take the significance
level at 5%, then this implies that H0 will be rejected when the sampling result (i.e., observed evidence)
has a less than 0.05 probability of occurring if H0 is true. In other words, the 5% level of significance
means that researcher is willing to take as much as 5% risk rejecting the null hypothesis when it (H 0)
happens to be true. Thus the significance level is the maximum value of the probability of rejecting H 0
when it is true and is usually determined in advance before testing the
Decision Rule of Test of Hypothesis:
Given a hypothesis H0 and an alternative hypothesis H0 we make rule which is known as decision rule
according to which we accept H0 (i.e., reject Ha) or reject H0 (i.e., accept a). For instance, if (H0 is that a
certain lot is good (there are very few defective items in it) against H a that the lot is not good (there are
many defective items in it), that we must decide the number of items to be tested and the criterion for accepting or rejecting the hypothesis. We might test 10 items in the lot and plan our decision saying that if
there are none or only 1 defective item among the 10, we will accept H 0 otherwise we will reject H0 (or
accept Ha). This sort of basis is known as decision rule.
Question6:- Explain Karl Pearson Co-efficient of correlation. Calculate KarlPearson coefficient for the following data:
X(height-cm)
174 175 176 177 178 182 183 186 189 193
Y(weight-kg)
61 65 67 68 72 74 80 87 92 95
Answer: -
X Y x x2 y y2 xy
174 61 -7.3 53.29 -15.1 228.01 110.23
175 65 -6.3 39.69 -11.1 123.21 69.93
176 67 -5.3 28.09 -9.1 82.81 48.23
177 68 -4.3 18.49 -8.1 65.61 34.83
178 72 -3.3 10.89 -4.1 16.81 13.53
182 74 0.7 0.49 -2.1 4.41 -1.47
183 80 1.7 2.89 3.9 15.21 6.63
186 87 4.7 22.09 10.9 118.81 51.23
189 92 7.7 59.29 15.9 252.81 122.43
193 95 11.7 136.89 18.9 357.21 221.13

8/8/2019 MB0034 I & II
http://slidepdf.com/reader/full/mb0034-i-ii 32/32
e 1 5
∑x 1813 ∑y 761 ∑x1 0 ∑x2 372.1 ∑ y 0 1264.9 676.7
Mx 18530 My 76.1
∑ xy
r=
√ ∑ x 2 × ∑ y 2
676.70
r=
√ 372.10 × ∑ 1264.90
676.70
r=
√ 470669.29
676.70
r=
686.05
= 0.986
= 0.97
Very high correlation