mbbs, md, dnb, pgdhhm, pgdmls ceo & director, hod a shah.pdf · 2016-01-11 · 2011–12 for...
TRANSCRIPT

NETHRADHAMA Super Speciality Eye Hospital
DR. SUMAN SHREE R.MBBS, MD, DNB, PGDHHM, PGDMLS
CEO & DIRECTOR, HOD ANESTHESIA DEPT.

ECONOMIC ORDER QUANTITY (EOQ)
Order quantity that minimizes total
inventory holding costs & ordering
costs
One of the oldest classical production
scheduling models
The framework used is the Wilson
EOQ Model or Wilson Formula
Customer & Quality Focus
o Following ABC analysis the Purchase & Stores Department (Voice of Internal Customer) highlighted the shift of non-clinical inventory item patient file from Category B to Category A
Factors critical to quality (CTQ) –
- Quality of patient file (design, thickness, patient & eco- friendly etc)
-Providing necessary hospital information (scope of services etc)
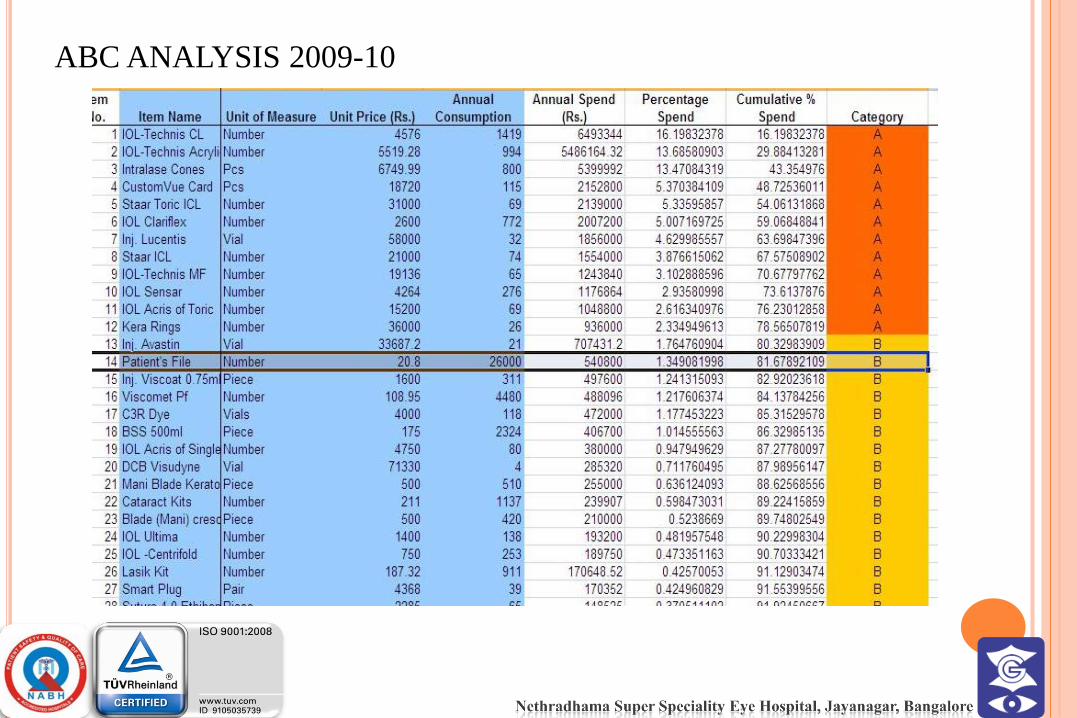
ABC ANALYSIS 2009-10
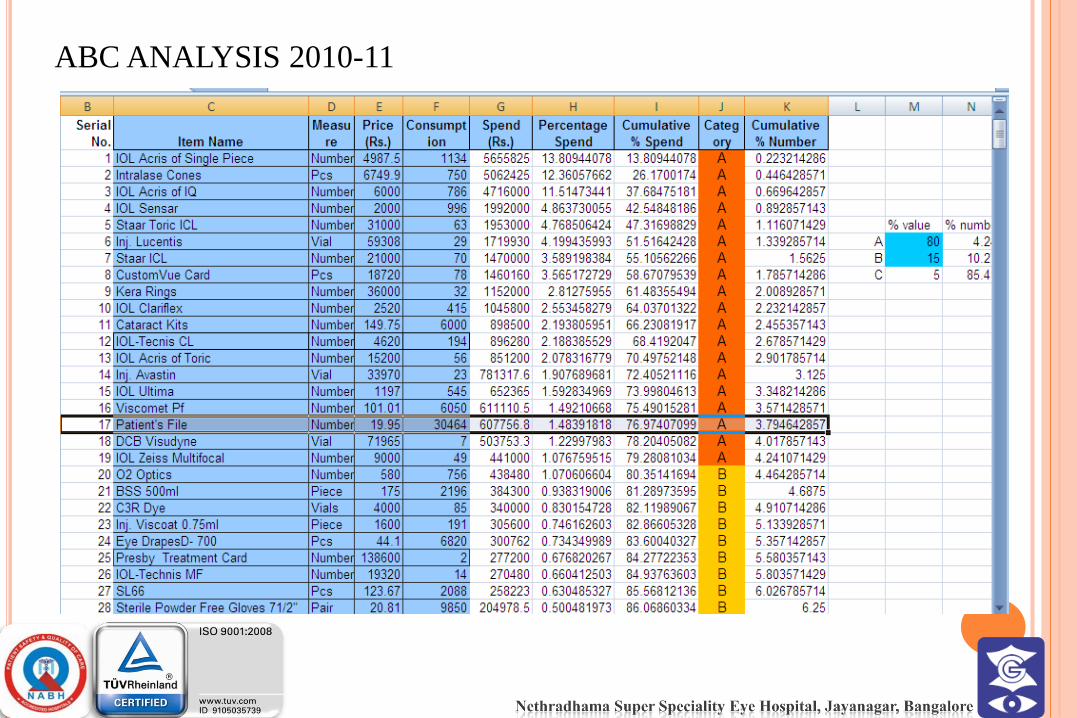
ABC ANALYSIS 2010-11
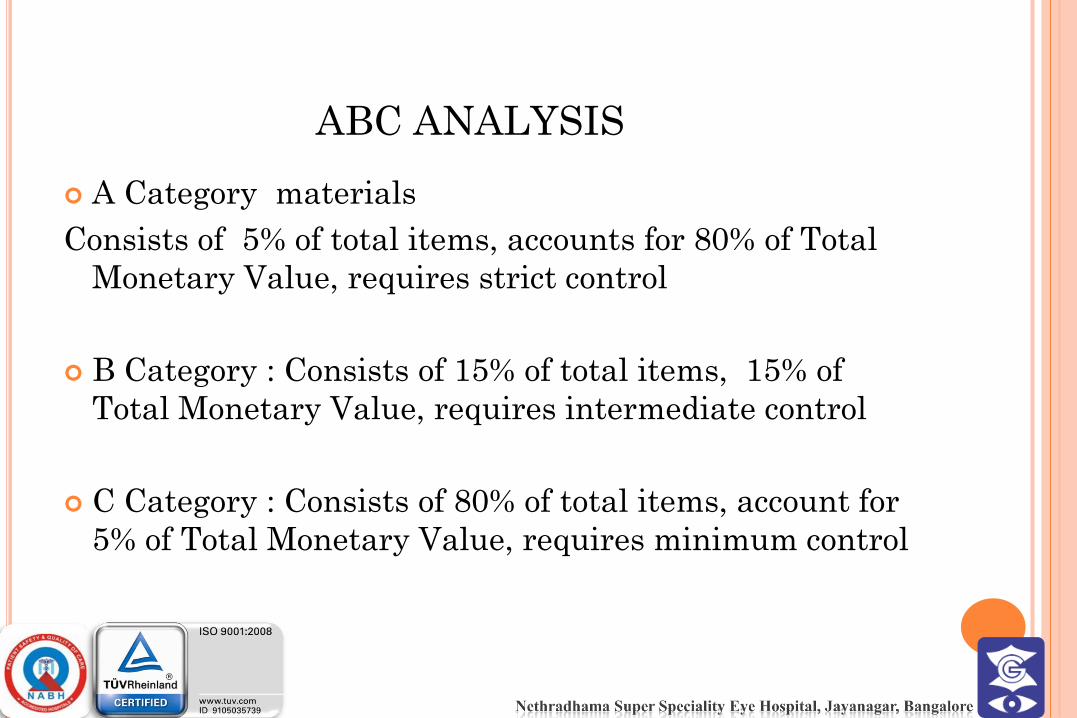
ABC ANALYSIS
A Category materials
Consists of 5% of total items, accounts for 80% of Total
Monetary Value, requires strict control
B Category : Consists of 15% of total items, 15% of
Total Monetary Value, requires intermediate control
C Category : Consists of 80% of total items, account for
5% of Total Monetary Value, requires minimum control
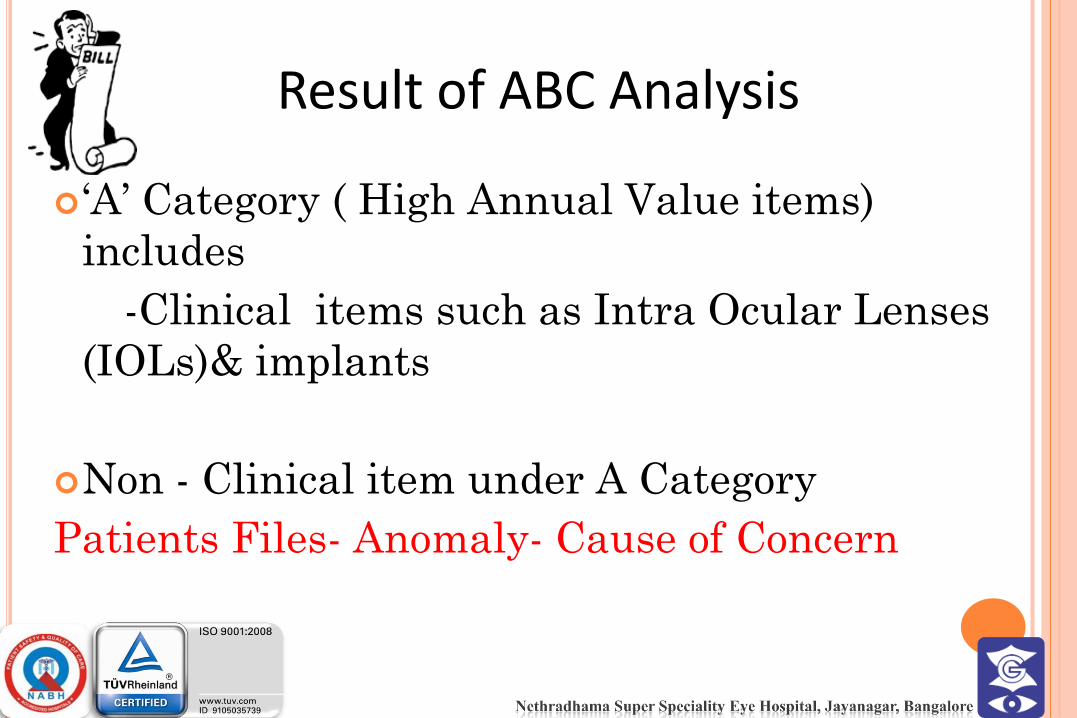
Result of ABC Analysis
„A‟ Category ( High Annual Value items)
includes
-Clinical items such as Intra Ocular Lenses
(IOLs)& implants
Non - Clinical item under A Category
Patients Files- Anomaly- Cause of Concern
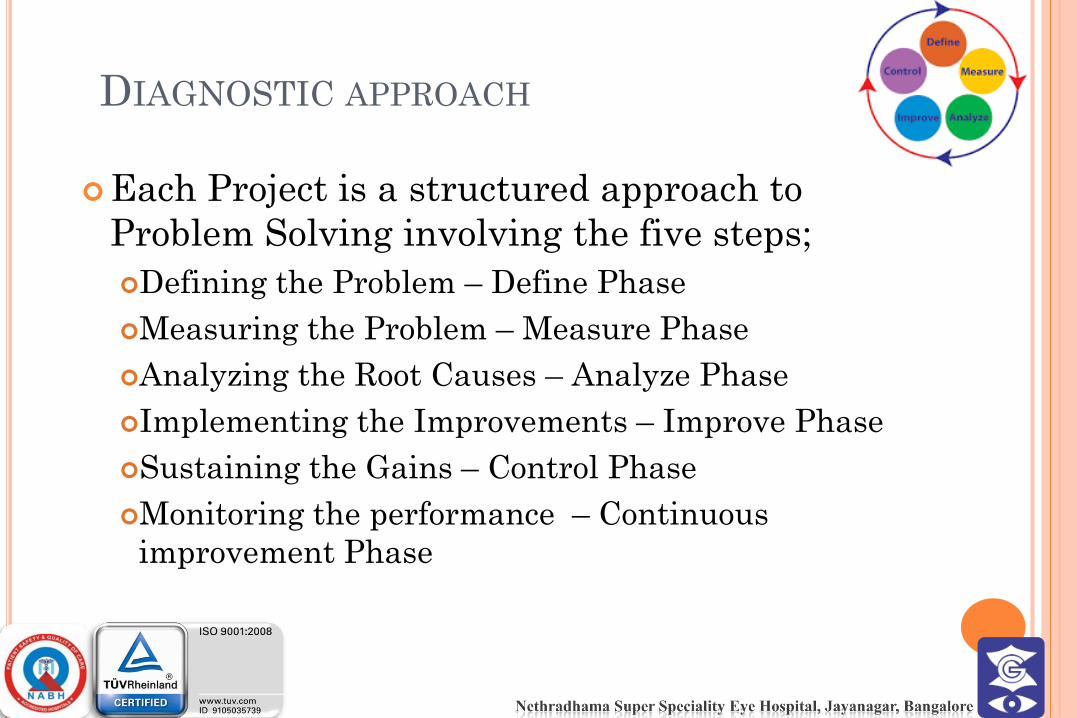
DIAGNOSTIC APPROACH
Each Project is a structured approach to
Problem Solving involving the five steps;
Defining the Problem – Define Phase
Measuring the Problem – Measure Phase
Analyzing the Root Causes – Analyze Phase
Implementing the Improvements – Improve Phase
Sustaining the Gains – Control Phase
Monitoring the performance – Continuous
improvement Phase
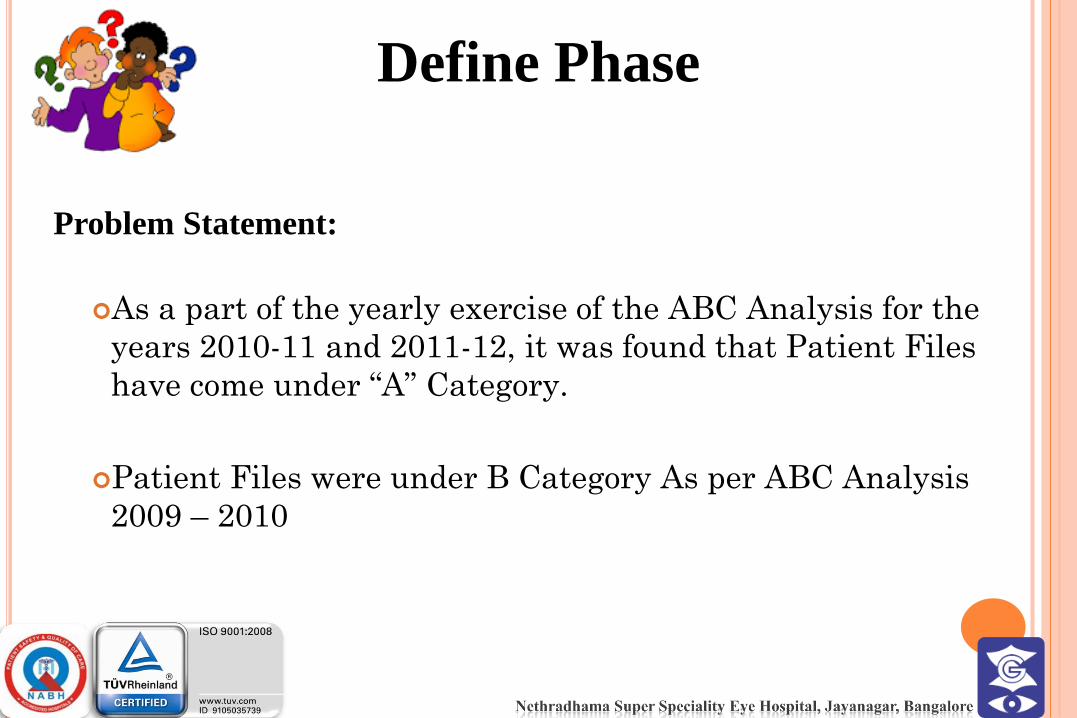
Problem Statement:
As a part of the yearly exercise of the ABC Analysis for the
years 2010-11 and 2011-12, it was found that Patient Files
have come under “A” Category.
Patient Files were under B Category As per ABC Analysis
2009 – 2010
Define Phase
Project Charter
Business Case
Material Costs
30 – 40% of the total hospital Costs.
Containment has a tremendous potential in making the hospital costs bearable to patients.
Management expects
Procurement with economical prices without compromising quality & patient satisfaction.
Increased savings enhances financial viability
Money blocked in dead / slow moving stock to be avoided.
Project Charter
Project Goals:
Strive to bring Patient Files from A Category to B Category
(ABC Analysis)
Quantity of Files to be ordered in most economic way (EOQ)
Continuous cost reduction programme without compromising
the quality of Files
Project Charter-Scope
Process Boundaries
Process Start Point: Receiving Indent for Patient Files
Process Stop Point: Issue of Material (Patient Files) to the
Internal Customer
Impacted Functions
Registration
Stores & Purchase
Finance & Accounts
Assumptions
Ordering cost is constant
Rate of demand is known
Lead time is fixed
Purchase price is constant
Replenishment is instantaneous
Only one product is involved
SCOPE
Measure Phase
Data Source
Annual Consumption, Price of Material and
Material Receipt Records
Tally Software Application
HR Payroll Software
Summary of Collected Data
Data Characteristics
The Data Observed were for 2009–10, 2010–11 and
2011–12 for ABC Analysis
For EOQ Calculations, Patient File data was analyzed
for 2011-12
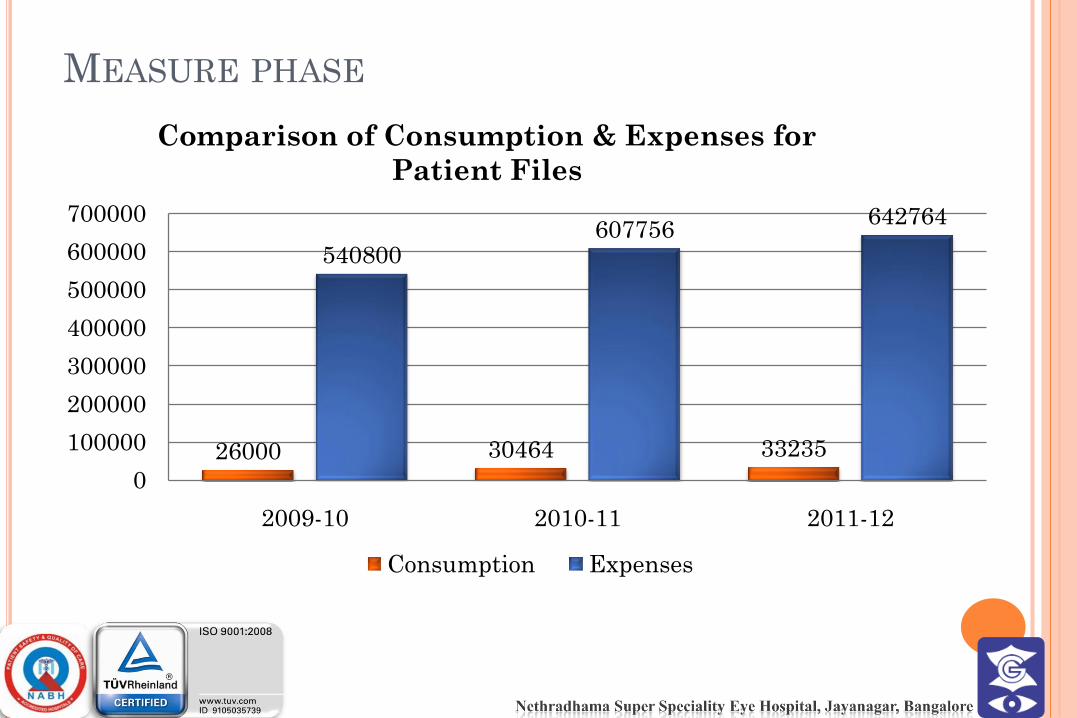
MEASURE PHASE
26000 30464 33235
540800607756
642764
0
100000
200000
300000
400000
500000
600000
700000
2009-10 2010-11 2011-12
Comparison of Consumption & Expenses for
Patient Files
Consumption Expenses
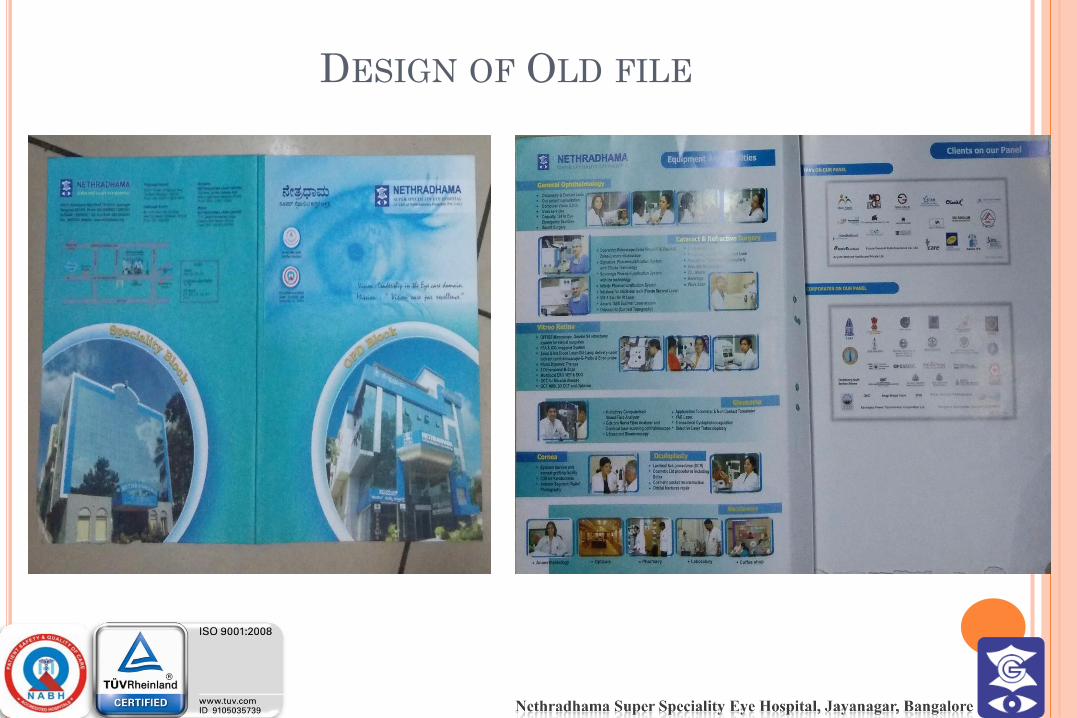
DESIGN OF OLD FILE
ANALYSIS PHASE
Brainstorming Exercise
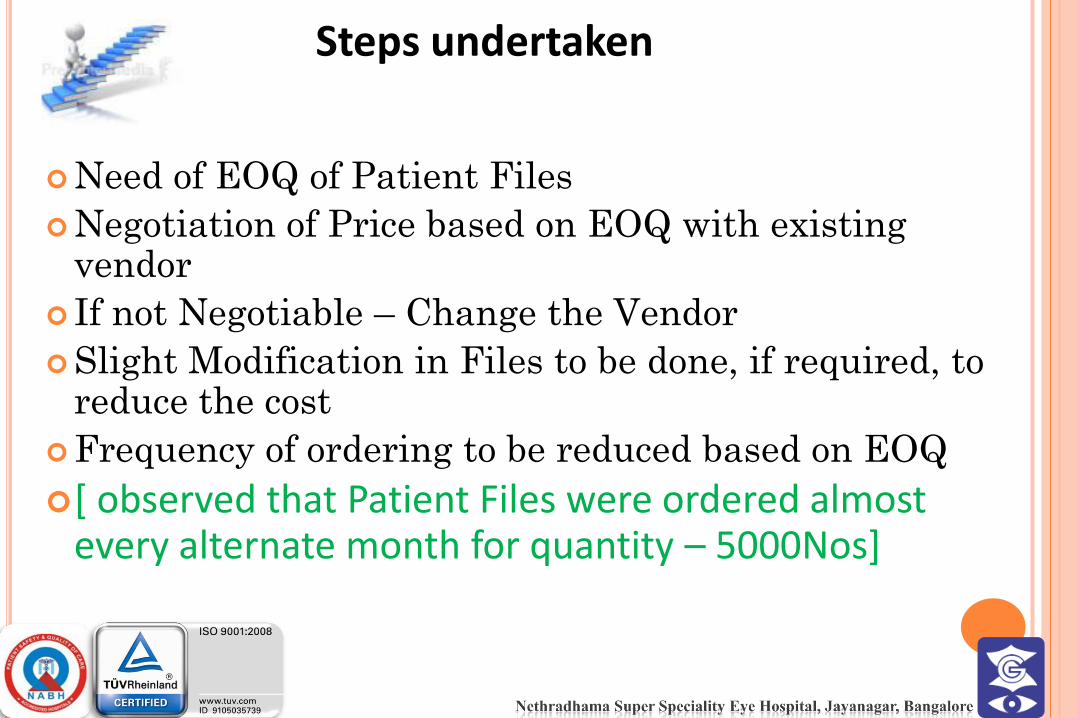
Steps undertaken
Need of EOQ of Patient Files
Negotiation of Price based on EOQ with existing vendor
If not Negotiable – Change the Vendor
Slight Modification in Files to be done, if required, to reduce the cost
Frequency of ordering to be reduced based on EOQ
[ observed that Patient Files were ordered almost every alternate month for quantity – 5000Nos]
EOQ Model
Tool adopted for calculation of EOQ
Classical Wilson Model was adopted to calculate EOQ
Quantity to be ordered in order to minimize total inventory cost.
EOQ MODEL = Annual Ordering Cost + Annual Inventory Holding Cost = minimal
Methodology For Deployment
Steps Undertaken:
Calculation of EOQ of Patient Files was done
Quotations were invited from multiple vendors
Negotiations was done for best price
Slight Modification in design of file was done
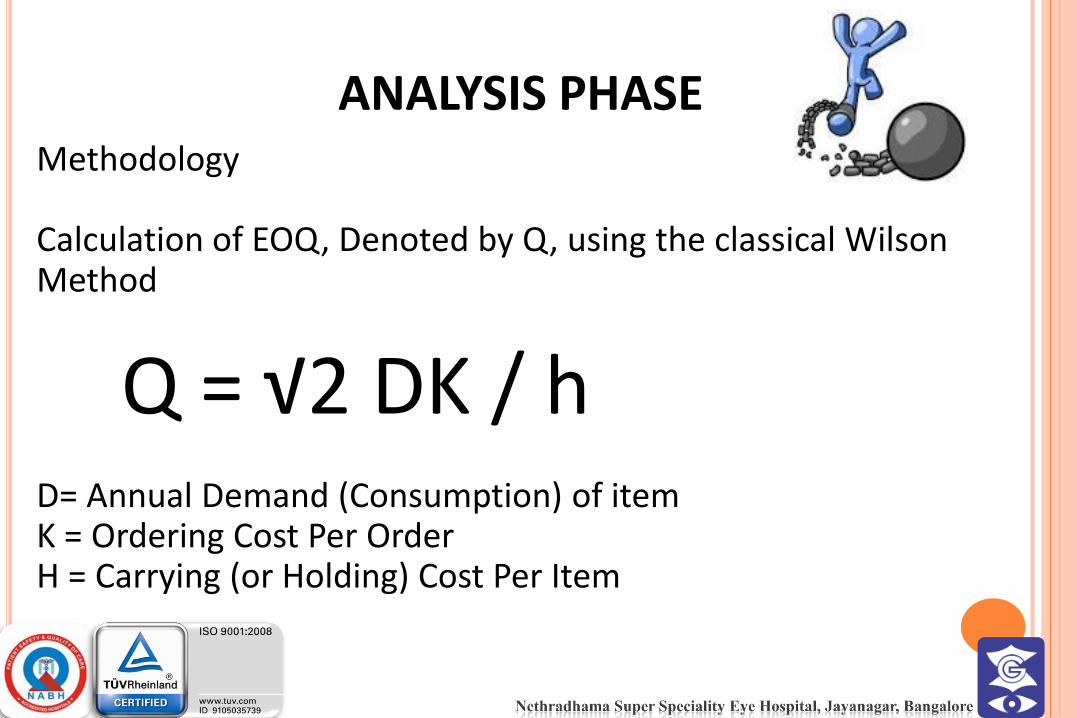
ANALYSIS PHASEMethodology
Calculation of EOQ, Denoted by Q, using the classical Wilson Method
Q = √2 DK / h D= Annual Demand (Consumption) of itemK = Ordering Cost Per Order H = Carrying (or Holding) Cost Per Item
Calculation of EOQ
Annual Demand (D)
Annual Demand(D) of Patient Files for the year 2011-12 is 33,235 Nos
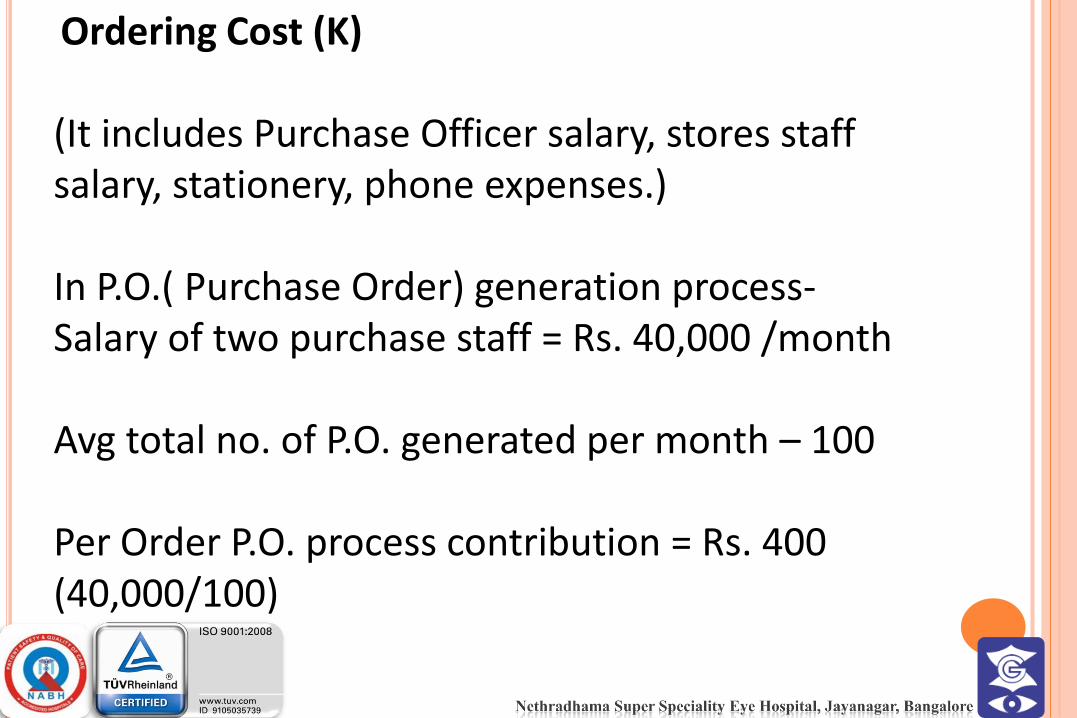
Ordering Cost (K)
(It includes Purchase Officer salary, stores staff salary, stationery, phone expenses.)
In P.O.( Purchase Order) generation process-Salary of two purchase staff = Rs. 40,000 /month
Avg total no. of P.O. generated per month – 100
Per Order P.O. process contribution = Rs. 400 (40,000/100)
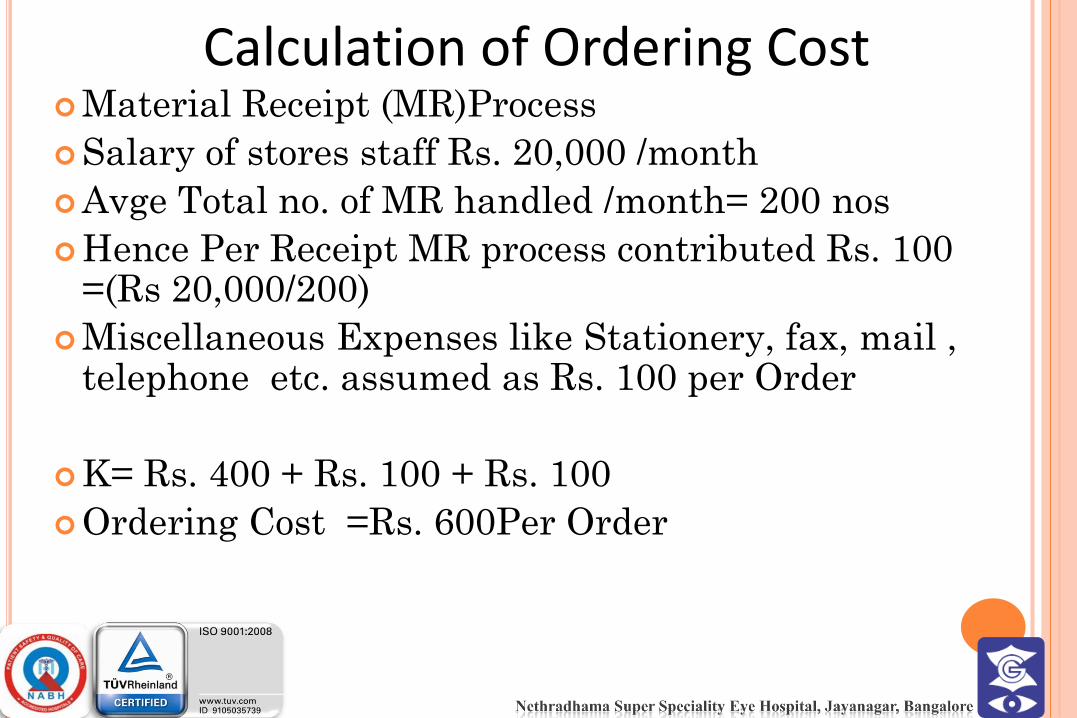
Calculation of Ordering CostMaterial Receipt (MR)Process
Salary of stores staff Rs. 20,000 /month
Avge Total no. of MR handled /month= 200 nos
Hence Per Receipt MR process contributed Rs. 100 =(Rs 20,000/200)
Miscellaneous Expenses like Stationery, fax, mail , telephone etc. assumed as Rs. 100 per Order
K= Rs. 400 + Rs. 100 + Rs. 100
Ordering Cost =Rs. 600Per Order
Carrying Cost
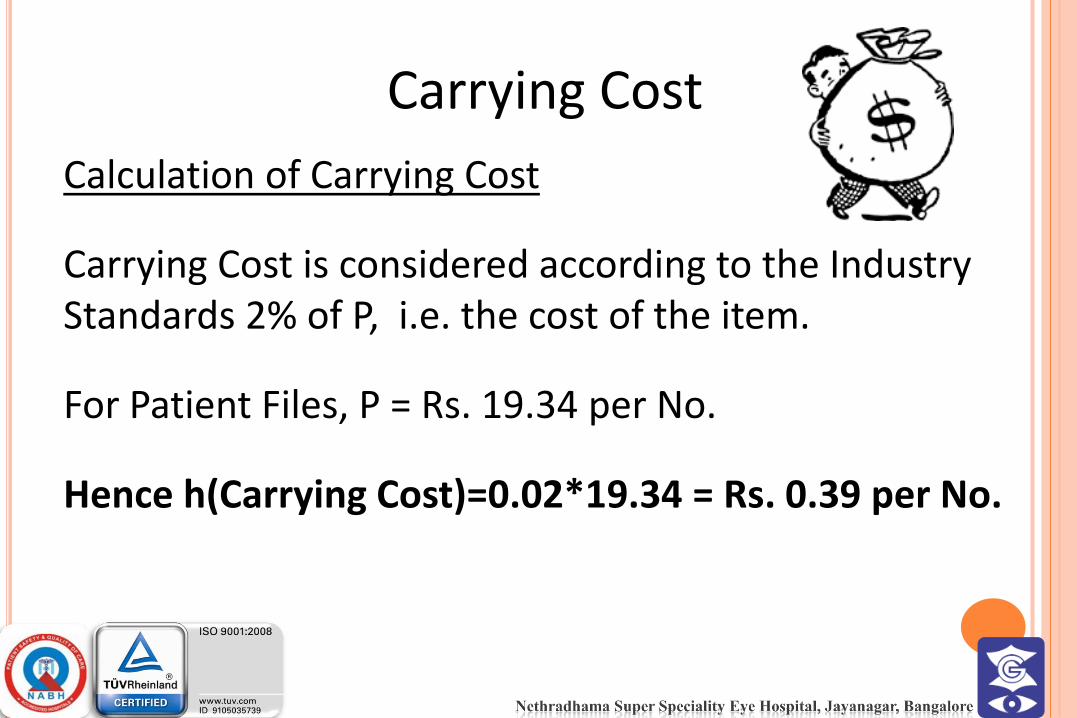
Calculation of Carrying Cost
Carrying Cost is considered according to the Industry Standards 2% of P, i.e. the cost of the item.
For Patient Files, P = Rs. 19.34 per No.
Hence h(Carrying Cost)=0.02*19.34 = Rs. 0.39 per No.

Final Calculation of EOQ
Final Calculation of EOQ
Q= √2*33235*600/.39
Hence Q = 10112 Pieces
Approximately 10,000 pieces (rounded off) per order is the Economic Order Quantity for Patient Files.
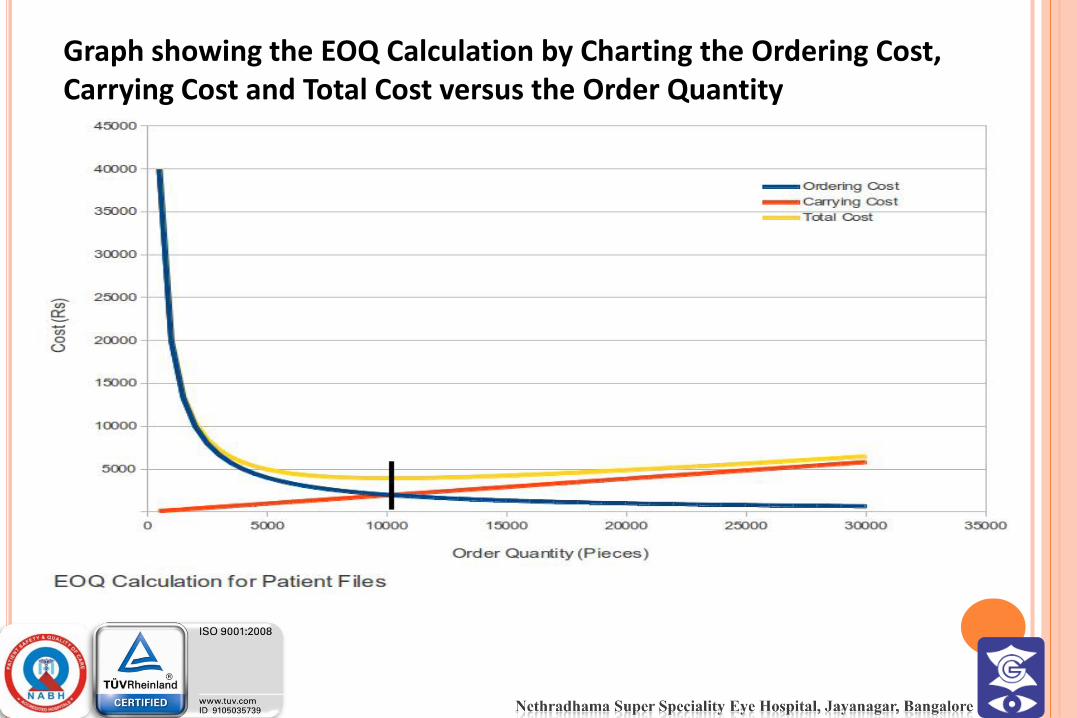
Graph showing the EOQ Calculation by Charting the Ordering Cost, Carrying Cost and Total Cost versus the Order Quantity
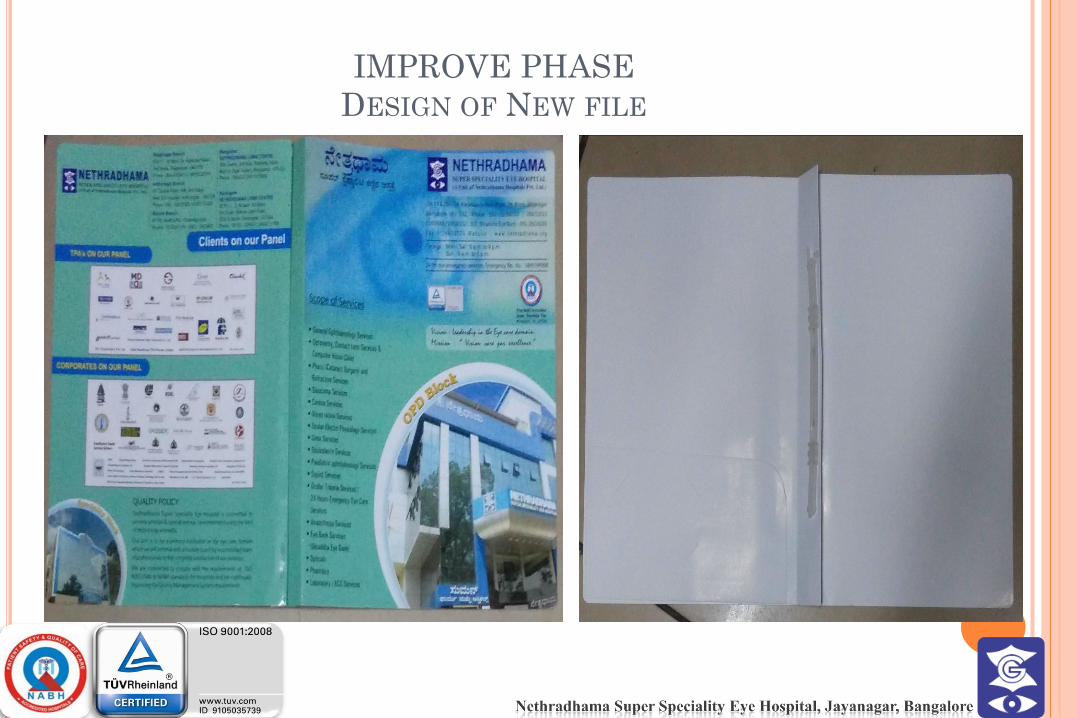
IMPROVE PHASE
DESIGN OF NEW FILE
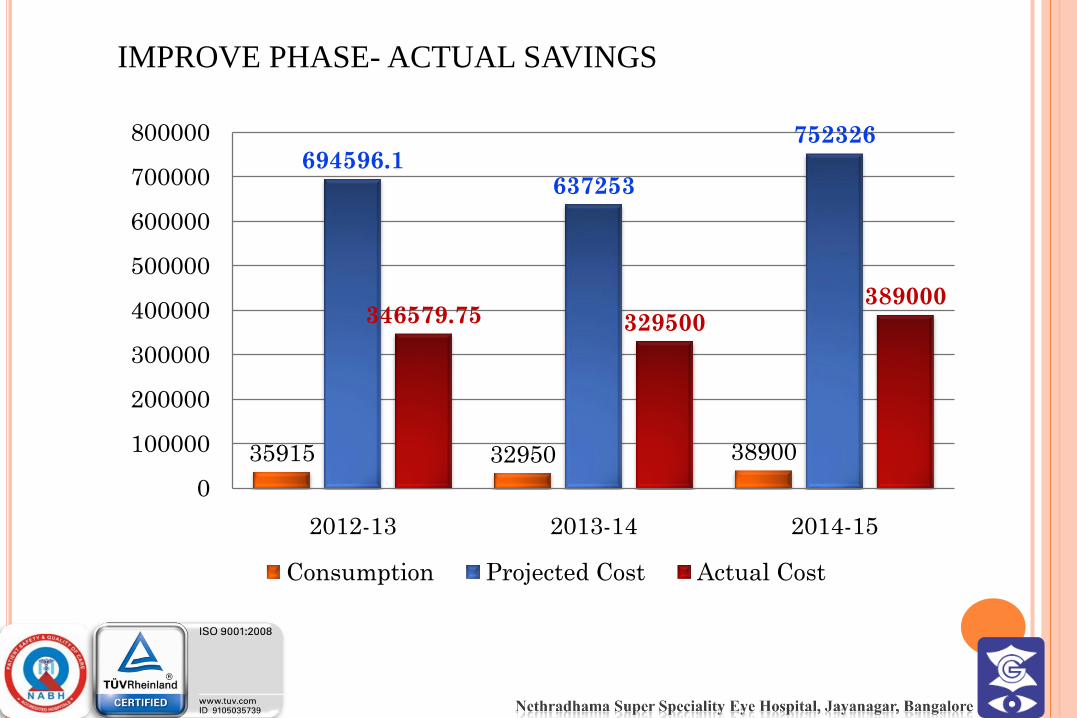
35915 32950 38900
694596.1637253
752326
346579.75 329500389000
0
100000
200000
300000
400000
500000
600000
700000
800000
2012-13 2013-14 2014-15
Consumption Projected Cost Actual Cost
IMPROVE PHASE- ACTUAL SAVINGS
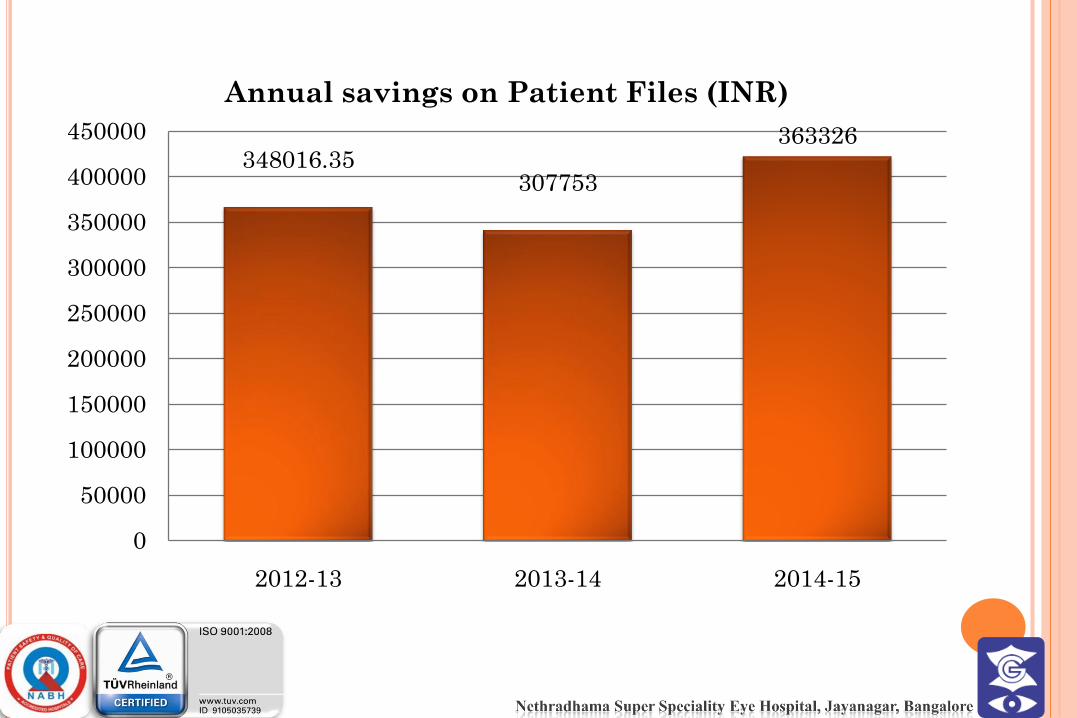
348016.35307753
363326
0
50000
100000
150000
200000
250000
300000
350000
400000
450000
2012-13 2013-14 2014-15
Annual savings on Patient Files (INR)
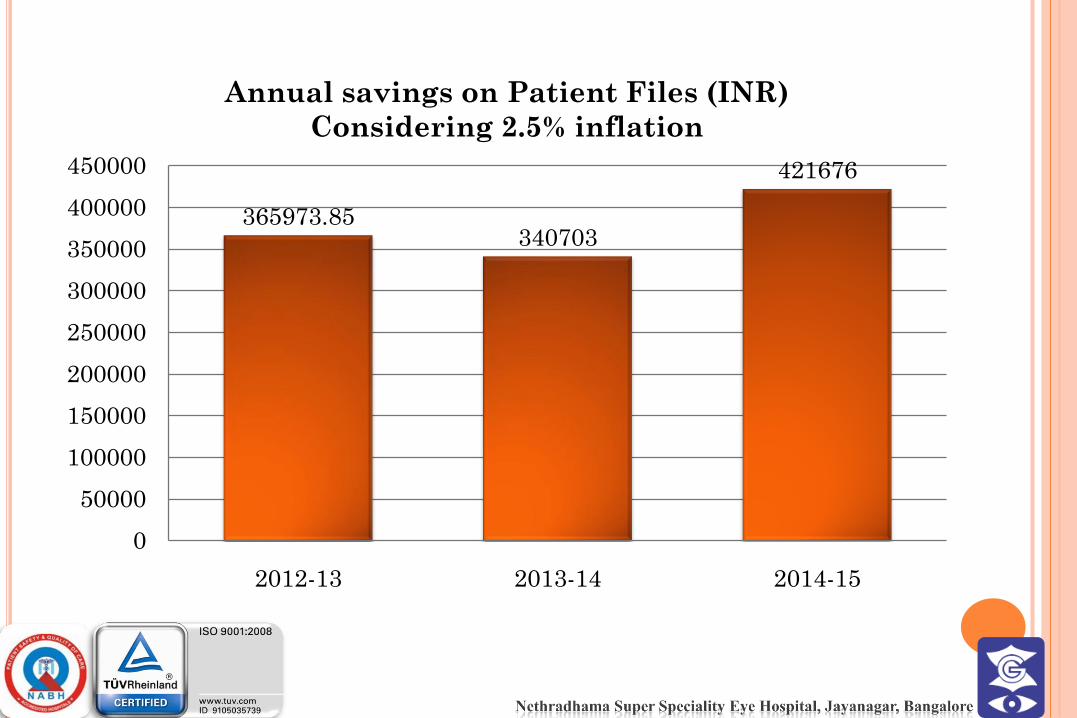
365973.85340703
421676
0
50000
100000
150000
200000
250000
300000
350000
400000
450000
2012-13 2013-14 2014-15
Annual savings on Patient Files (INR)
Considering 2.5% inflation
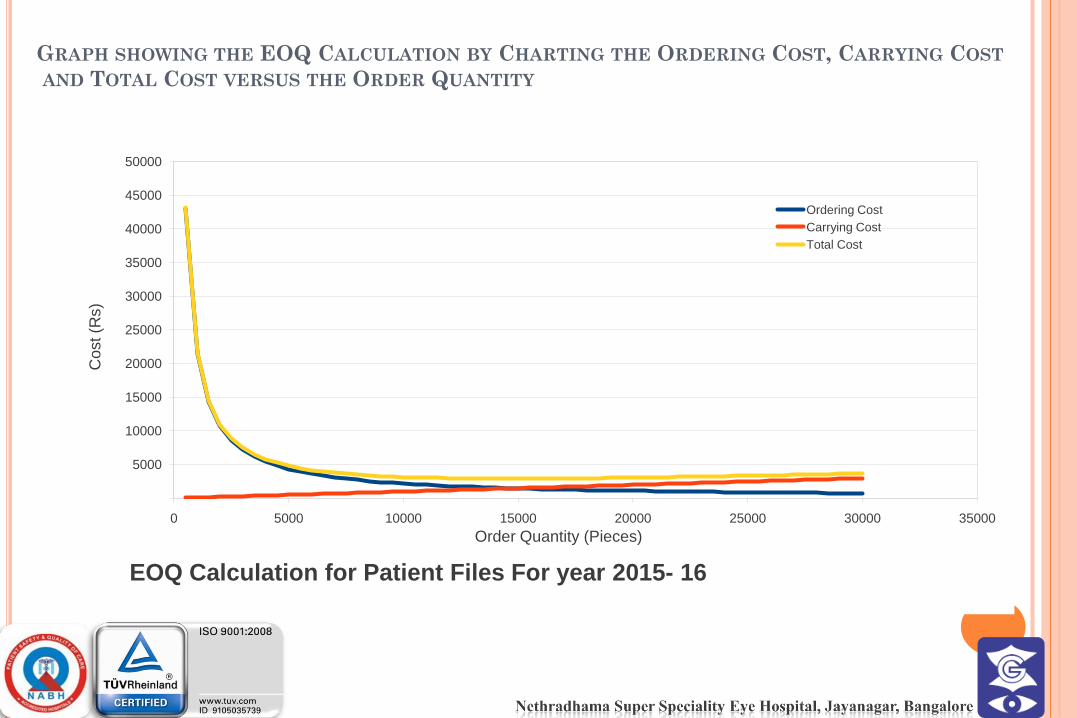
GRAPH SHOWING THE EOQ CALCULATION BY CHARTING THE ORDERING COST, CARRYING COST
AND TOTAL COST VERSUS THE ORDER QUANTITY
5000
10000
15000
20000
25000
30000
35000
40000
45000
50000
0 5000 10000 15000 20000 25000 30000 35000
Cost (R
s)
Order Quantity (Pieces)
EOQ Calculation for Patient Files For year 2015- 16
Ordering Cost
Carrying Cost
Total Cost
Direct/Tangible Benefits
Financial Gain for organization by adopting scientific way of inventory control and cost reduction
Accommodates quantity discounts either incremental or all units
Purchase price of Files are very economical
Ordering Quantity is fixed now i.e 10,000Nos to be increase to 14,000 for the financial Year 2015-16
This saved amount can be invested in some other area
Indirect/Intangible Benefits
Frequency of ordering is reduced from 7 times to 3 times compared to previous year. So ordering cost has been controlled
Motivation for other staff for cost reduction for organization without compromising on quality .
Duplication of work is minimized .
Socio-Economic Benefits
As cost of files are very economical it would help in
decreasing the burden transferred on end consumer i.e
patients which would have been costlier for them.
CONTROL PHASE
Annual Demand is monitored
Carrying Cost & EOQ is calculated whenever there is change in price
Frequency of ordering is controlled
Stock out is avoided
INNOVATIVE APPROACHES
Scientific Method of determining Purchase order Quantity
Using EOQ Formula (Wilson Model) First in healthcare Industry
Internal Lead Time reduced due to standardization of design of patient files by eliminating all variables
Widened the Horizon for sourcing the vendor
Holding & Sustaining the Improvements
Control plan has been developed & Deployed in the manner that the Ordering fixed quantity of Patient Files determined by the EOQ
calculations.
Frequency of ordering is fixed.
No drift in performance following the closure of the project by yearly monitoring and control.
The Annual demand for each item is recorded.
ABC & FSN analysis is done annually.
APPLICABILITY IN OTHER AREAS
The EOQ Analysis could be extended to other
high value materials in Category A & Top B
materials in ABC Analysis
Eg: Disposable Eye Drapes ,Disposable surgical,
Gloves, Post Operative Ophthalmic,
Medication Kits

Vision
Leadership in the Eye Care Domain
Mission
Vision Care Par Excellence