mbm - 6th edition - ch12
TRANSCRIPT

C H A P T E R 1 2
Offensive Strategies
� You miss 100 percent of the shots you don’t take.
— Wayne GretskyFormer National Hockey League All-Star
2000 2005 2010
Sale
s (b
illio
ns)
$0
$5
$10
$15
$20
$25
$30
$35
$40
$45
$50
$55
$60
$65
$70
$7.9 billion Music (6.5%)
iPod (32.6%)
$13.9 billion
Mac (45%)
Mac(26.8%)
Music(7.6%)
iPod(12.7%)
iPhone(38.6%)
iPad(7.6%)
$65.2 billion
Other(6.7%)
Mac (83%)
Other (15.9%)Other (17%)
Apple, Inc.Product Growth Portfolio
The results of Apple’s offensive strategies from 2005 to 2010 are stunning. The company’s portfolio of differentiated
products has created new product-market cat-egories that Apple dominates with a first-to-market advantage.
Apple experienced close to a fivefold growth in sales over the 5-year period, from $13.9 billion in 2005 to $65.2 billion in 2010. Just as impressive is the company’s increase in gross margin, from 29 percent in 2005 to 41 percent in 2010. During the same period, Apple was able to cut its sales, general, and administrative expenses from 14.6 to 8.5 percent of sales.
The combination of incredible product innovation, superb marketing, and cost-effi-cient management allowed the company’s operating income to grow from $528 million in 2000 to $18.4 billion in 2010.
Performance 2000 2005 2010
Percent Margin 27.0% 29.0% 41.0%
SGA (% sales) 14.6% 13.4% 8.5%
IBIT (% sales) 6.6% 11.9% 28.2%
Marketing ROI 147% 189% 543%

406 Part IV Strategic Marketing
APPLE’S PRODUCT PORTFOLIO AND OFFENSIVE GROWTH
A strategic view of Apple’s product portfolio helps us understand how the company grew both sales and margins over a 10-year period and in the process achieved an outstanding average annual rate of sales growth of 23.3 percent. Figure 12-1 presents a product life-cycle portfolio view of the company for 2000, 2005 and 2010. The product life cycles show how each of Apple’s product lines was performing at these three points in time. The size of the circle for each product is proportional to its sales: the larger the circle, the greater the sales revenue generated that year by the product. In 2010, for example, the iPhone—represented by the largest circle—was Apple’s greatest single source of sales revenue. Sales of software and peripherals are not shown, because the product life cycle for these ancillary products spans all stages of the product life cycle.
The product portfolio for 2000 shows us that at that time Apple was basically a one-product company. With sales of about $8 billion, the Mac represented 83 percent of the company’s sales. For Apple, the good news was that this product was strategi-cally only at the mid-point of its product life cycle; there was still plenty of opportunity ahead for additional sales growth. In 2005, however, the portfolio reveals no sales growth for the Mac. In fact, Mac sales fell somewhat, and this happened in a growing market, causing the Mac to lose a fairly significant share of the market between 2000 and 2005.
The launch of the iPod changed everything for Apple. By 2005 the iPod was respon-sible for 32.6 percent of sales, enabling the company to grow its total sales revenue from $7.9 billion in 2000 to almost $14 billion in 2005, despite the stagnation in Mac sales. Without the iPod, Apple sales would have been only $9.4 billion in 2005. In addition to its considerable contribution to sales, the iPod gave Apple a foothold in a new market that was unrelated to computers.
Apple replicated its offensive growth strategy for the iPod when it introduced the iPhone and then the iPad. By 2010, the iPhone had overtaken the Mac as the sales leader in the Apple product portfolio. The iPad, introduced in 2010, had first-year sales of about $5 billon. Apple also had been significantly upping its effort on the Mac and almost tri-pled its Mac sales from $6.3 billion in 2005 to $17.5 billion in 2010. The Mac’s dramatic sales growth over the 5 years equated to an average annual growth rate of 22.6 percent, which far exceeded the average annual rate of market growth.
Apple exemplifies a company with a great product portfolio and great offensive strategies. Figure 12-1 shows us not only the company’s sales growth over a 10-year period but also how it has diversified its products and positioned them on the life-cycle curve.
STRATEGIC MARKET PLANS
Apple, Google, Facebook, and many other well-known businesses experienced substan-tial growth in the 2000s. Each of these businesses had the benefit of a strategic advantage to guide its rapid growth. Their strategic market plan was market penetration with the development of completely new products for new markets. In every case, however, the strategic market plan addressed three basic performance objectives:

Chapter 12 Offensive Strategies 407
� Share Position: How will the strategic market plan contribute to the business’s share position in served markets?
� Sales Growth: To what degree will the strategic market plan contribute to sales growth? � Profit Performance: How will the strategic market plan affect short- and long-run
profit performance?
Time
iPad
iPhone
Music
iPod
Mac
Mar
ket
Sale
s
MaciPod
Total
Portfolio Sales Percent
MusiciPhoneiPadOther
$17.5$8.2
$65.2
$5.0$25.2$5.0$4.3
26.8%12.7%
100%
7.6%38.6%7.6%6.7%
MaciPod
Total
Portfolio Sales Percent
MusicOther
$6.3$4.5
$13.9
$0.9$2.2
45%32.6%
100%
6.5%15.9%
Mac
Total
Portfolio Sales Percent
Other$6.6
$7.9$1.4
83%
100%17%
Mar
ket
Sale
sM
arke
t Sa
les
Mac
iPod
Music
Mac
FIGURE 12-1 APPLE—PRODUCT LIFE-CYCLE PORTFOLIO

408 Part IV Strategic Marketing
To make the best use of limited resources, a business needs a strategic market plan that carefully maps out future growth and profit performance. 1 Each of the strategic mar-ket plans it adopts will in some way affect both its short- and long-run performance in market share, sales, and profit. Depending on the situation, some strategic market plans will be offensive and some will be defensive.
As we saw in Chapter 11 , offensive strategic market plans are usually growth oriented and are more appropriate for the growth stage of a product-market life cycle. 2 Their objec-tive is to produce sales growth and improve share position and future profit performance. Defensive strategic market plans are more likely to be implemented in the latter stages of a product-market life cycle. They are often designed to protect important share positions and to be large contributors to short-run sales revenues and profits. Figure 12-2 depicts when each type of strategy is most appropriate. This chapter examines various offensive strategic market plans, and Chapter 13 will present various defensive strategic market plans.
OFFENSIVE STRATEGIC MARKET PLANS
The combination of market attractiveness and competitive advantage creates a portfolio position for any given product-market. 3 As shown in Figure 12-3 , attractive markets are most likely to warrant an offensive strategic market plan to improve competitive
Product Life-Cycle Stages
Mar
ket
Dem
and
Off
ensi
ve
Off
ensi
ve
Defen
sive
Defensive
EmergingMarket
EarlyGrowth
RapidGrowth
LateGrowth
MaturingMarket
Strategic FocusManaging profitsand investing to protect position
Strategic FocusInvesting forgrowth and
position
MatureMarket
DecliningMarket
FIGURE 12-2 MARKET GROWTH AND OFFENSIVE AND DEFENSIVE STRATEGIES

Chapter 12 Offensive Strategies 409
advantage and share position when the business’s competitive advantage is average or below. These offensive strategies can range from improving the competitive advantage and market share in existing product-markets to entering a new market with no estab-lished share position. In addition, a business might use an offensive strategic market plan to cultivate an emerging or underdeveloped market where the business would have a strong position of advantage.
There are six portfolio positions in which an offensive strategic market plan could be beneficial. Of these, the three positions with average market attractiveness and the one with highest market attractiveness and highest competitive advantage could instead, under some conditions, be more suitable for a defensive strategic market plan. We would need more information in order to decide between an offensive and a defensive strategic market plan. For example, an offensive strategic market plan may be warranted, given the business’s sources of relative advantage. On the other hand, a defensive strategic market plan to protect the current position may be the better alternative for achieving desired performance objectives. A defensive plan could also be appropriate if the busi-ness wants to improve profits by optimizing its market focus with minimal investment.
0 806040200
80
60
40
20
0100
100
Competitive Position
Core Offensive Strategies
Invest to Grow
Improve Position
New Market Entry
Invest marketing resources to grow the marketdemand, market share, or customer revenue.Invest to improve/strengthen competitive positionand deliver a stronger value proposition, highermargins, and higher levels of customer loyalty.Invest to enter new related markets, enter newunrelated markets, or develop new product marketsin an effort to reduce exposure to market swings in sales and profits.
Mar
ket
Att
ract
iven
ess
OffensiveStrategies
OffensiveStrategies
OffensiveStrategies
orDefensiveStrategies
OffensiveStrategies
orDefensiveStrategies
OffensiveStrategies
orDefensiveStrategies
OffensiveStrategies
orDefensiveStrategies
DefensiveStrategies
DefensiveStrategies
DefensiveStrategies
FIGURE 12-3 PORTFOLIO ANALYSIS AND STRATEGIC MARKET PLANS
410 Part IV Strategic Marketing
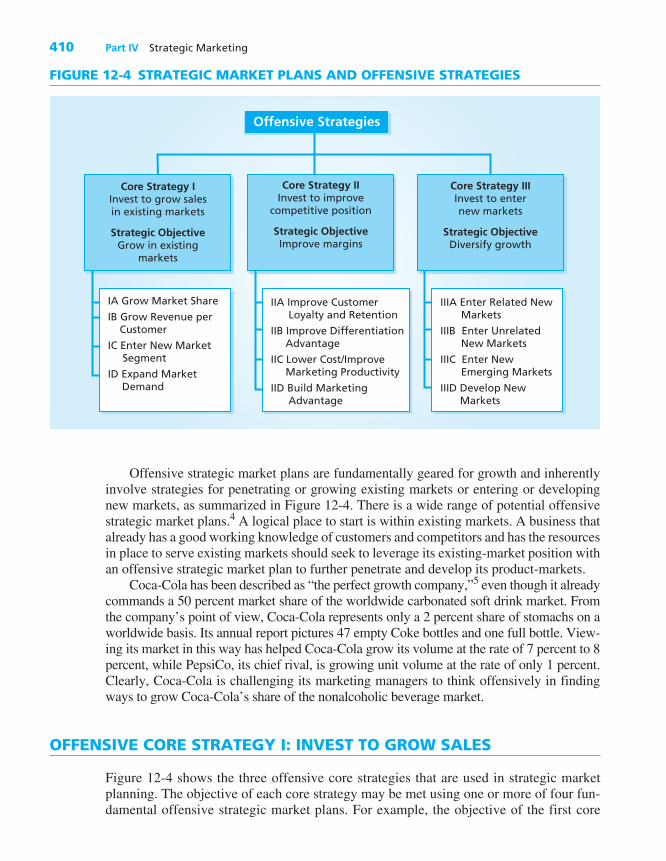
Offensive strategic market plans are fundamentally geared for growth and inherently involve strategies for penetrating or growing existing markets or entering or developing new markets, as summarized in Figure 12-4 . There is a wide range of potential offensive strategic market plans. 4 A logical place to start is within existing markets. A business that already has a good working knowledge of customers and competitors and has the resources in place to serve existing markets should seek to leverage its existing-market position with an offensive strategic market plan to further penetrate and develop its product-markets.
Coca-Cola has been described as “the perfect growth company,” 5 even though it already commands a 50 percent market share of the worldwide carbonated soft drink market. From the company’s point of view, Coca-Cola represents only a 2 percent share of stomachs on a worldwide basis. Its annual report pictures 47 empty Coke bottles and one full bottle. View-ing its market in this way has helped Coca-Cola grow its volume at the rate of 7 percent to 8 percent, while PepsiCo, its chief rival, is growing unit volume at the rate of only 1 percent. Clearly, Coca-Cola is challenging its marketing managers to think offensively in finding ways to grow Coca-Cola’s share of the nonalcoholic beverage market.
OFFENSIVE CORE STRATEGY I: INVEST TO GROW SALES
Figure 12-4 shows the three offensive core strategies that are used in strategic market planning. The objective of each core strategy may be met using one or more of four fun-damental offensive strategic market plans. For example, the objective of the first core
Offensive Strategies
Core Strategy IInvest to grow salesin existing markets
Core Strategy IIInvest to improve
competitive position
IA Grow Market Share
IB Grow Revenue per Customer
IC Enter New Market Segment
ID Expand Market Demand
Core Strategy IIIInvest to enternew markets
Strategic ObjectiveGrow in existing
markets
Strategic ObjectiveImprove margins
Strategic ObjectiveDiversify growth
IIA Improve Customer Loyalty and Retention
IIB Improve Differentiation Advantage
IIC Lower Cost/Improve Marketing Productivity
IID Build Marketing Advantage
IIIA Enter Related New Markets
IIIB Enter Unrelated New Markets
IIIC Enter New Emerging Markets
IIID Develop New Markets
FIGURE 12-4 STRATEGIC MARKET PLANS AND OFFENSIVE STRATEGIES

Chapter 12 Offensive Strategies 411
strategy is to grow the business in its existing market. The specific strategic market plans for achieving the objective range from market penetration to growing market demand. 6 A business could grow its market share, increase its revenue per customer, enter new mar-ket segments, or expand market demand and thereby create a bigger pie, in which its slice is proportionately bigger. The offensive core strategies are numbered I, II, and III, and the four specific offensive strategies are designated A, B, C, and D. This system of num-bering and lettering implies no order of importance; it just helps us keep track of the dif-ferent types of strategies.
Offensive Strategy IA: Grow Market Share
One of the more obvious marketing strategies is to grow market share. But many factors can affect a business’s ability to grow share and profitability. 7 Its share potential is one consideration. To what degree has the business achieved its share potential? What factors driving share development need to be managed to grow share in a given product-market? Finally, will share growth actually contribute to profitability? Each of these questions is an important consideration in developing an offensive strategic market plan to grow share.
In Chapter 3 , we calculated the share development index (SDI) as the ratio of the market share index to the share potential index. The share potential of a business is the market share that a business believes it can achieve with its tactical marketing strategy, given the strength of its competitive advantage and its marketing effectiveness in a given product-market. The share performance calculation that follows uses a business’s esti-mates that it should perform at 90 percent in product awareness, 50 percent in product preference, 80 percent in intentions to purchase, 80 percent in product availability, and 70 percent in rate of purchase. Performing at these levels results in a share potential index of 20 percent.
Share PotentialIndex
� �Product Product ProductPurchase PurchaseAwareness Preference Intentions Availability
� �Rate
0.90 0.50 0.80 0.8
�
� � � � 00 0.68�
� 20%
If a business’s market share were 8 percent, the business would be underperforming and, hence, would have an SDI of 40. This would mean that the business has achieved only 40 percent of its share potential index. It would have a good opportunity to grow market share with a market penetration strategy.
Share Development Index �
Market Share IndexShare Potential Index
� � �8
20100
%
%40
To grow share, a business has to examine each area of performance along the share-development path with respect to its expected versus its actual market performance. For instance, the business in the example expects to achieve 90 percent product awareness in its target market. If its actual target-market awareness were only 67 percent, this performance gap would prevent the business from reaching its full market share potential. To grow share, this business would need to examine the key performance gaps in its market share response.

412 Part IV Strategic Marketing
It is also possible that a business has reached its share potential but could still grow its share if it adopted a new strategic market plan. Product improvements that would increase product preference from 50 to 70 percent would raise the market share potential from 20 to 27 percent. Of course, to achieve this level of market penetration, the business would have to adequately communicate and deliver these product improvements to the full satisfaction of target customers.
Perhaps the most important consideration in developing strategies to grow share is to make sure the planned share growth will be profitable. Some methods of growing share can actually reduce the net marketing contribution, as illustrated in the Santa Fe Sports-wear example in Chapter 2 . Market share is a key competitive metric, but market-based businesses need to resist emphasizing it to the point of ignoring other market-based met-rics. It is easy to become caught up in share wars and win the battle for share but lose the war with respect to profits.
Offensive Strategy IB: Grow Revenue per Customer
Harley-Davidson derives 75 percent of its $4.2 billion in sales from the sale of motorcy-cles. The other 25 percent comes from purchases of clothing, parts, and accessories. Across all product categories, the company’s 2010 per customer revenue was $13,630. In clothing alone, Harley-Davidson introduces 1,200 new items annually (excluding riding boots, baby clothes, and clothing for pets). The retail clothes are such an important aspect of communicating the brand that every dealership now has fitting rooms. The incremen-tal sales of related products have much higher margins than the motorcycle sales, and they build customer loyalty. The apparel sales also enhance brand awareness and brand equity, with the wearers of Harley-Davidson clothing communicating the brand name.
As a business approaches 100 percent of its share development index, additional growth based on market share gains becomes increasingly difficult. Up to this point, a business’s overall performance could be improved by correcting ineffective tactical mar-keting strategies, improving competitive position, or increasing a business’s marketing effort. Now, with its share potential almost fully realized, the business can improve its overall performance only by growing sales with existing customers, to increase the amount of revenue per customer.
As another example, McDonald’s in its early years sold a limited product line of hamburgers, french fries, and drinks. By making product line extensions to add chicken and fish sandwiches, salads, desserts, and a breakfast menu, McDonald’s has been able to grow the average amount spent by its existing customers. Of course, these line extensions have also attracted new customers, both those who did not previously patronize fast-food restaurants and those who had been competitors’ customers.
For businesses with well-known brand names, such as Kodak, Nike, Honda, IBM, and Disney, it is easy to introduce line extensions by leveraging the high awareness and positive image of the companies’ brand names. 8 When Honda entered the lawn mower market in the early 1990s, sales of its mowers were driven by the company’s name. Cus-tomers immediately perceived the mowers to be reliable, high-quality products. This per-ception was created by Honda’s reputation for quality automobiles, motorcycles, and other motorized products. The high level of name awareness helped the company to quickly penetrate the lawn mower market. When Honda saw that many of its lawn mower customers owned other Honda products, the company then developed a growth strategy

Chapter 12 Offensive Strategies 413
that was based on increasing volumes along its entire product line by marketing to exist-ing customers.
Honda’s strategy to target existing customers for its other products is aptly expressed in the company’s marketing objective: “Our goal is to have five Hondas in every garage.” This motto reflects an offensive strategic market plan to get Honda car owners to pur-chase other Honda products, including lawn mowers, recreational vehicles (motorcycles, snowmobiles, jet skis, all-terrain vehicles, and outboard motors), portable motors, and generators. For Honda, the strategy has been instrumental in growing the company. For any business with a solid brand reputation, the existing customer base offers a consider-able opportunity for growing per-customer revenue through sales of other products.
Revenue per customer can also be increased by using price premiums. Businesses that enhance their products with value-added services or those with a reputation for high quality can charge higher prices than competing businesses and still maintain a superior customer value. General Electric’s turbine engines, for example, command a price premium because they are high quality, installation services are first rate, and the company has a global repu-tation for innovative engineering and technical know-how. The price premium enables GE to attain more revenue per customer than many competing turbine manufacturers.
Offensive Strategy IC: Enter New Market Segments
Another offensive growth strategy within existing markets is to enter a new customer segment within an existing market. 9 As the personal computer market grew, the under-$1,000 segment emerged. Soon demand in this segment was growing faster than in any other. Intel, which did not have a product for this segment, saw AMD and other competi-tors take the lead in this segment. Intel responded by designing a new product for price-sensitive customers. As shown in Figure 12-5 , the Celeron chip provided PC manufacturers with a low-cost Intel microprocessor for this market segment. Intel’s
$3,000
$2,000
$1,000
$0Performance (capacity, speed, features)
Xeon
Celeron
Pentium
Pric
e
Personal Computer Market Segments
Intel New SegmentEntry Strategy
FIGURE 12-5 INTEL’S NEW SEGMENT ENTRY STRATEGY

414 Part IV Strategic Marketing
offensive strategic market plan for entering a new market segment gave the company a new source of sales revenue and profitability.
Another illustration of a company successfully entering new segments took place in the vodka market. This market is divided into four segments based on price and differ-ences in taste, brand image, and packaging, as illustrated in Figure 12-6 . Absolut Spirits had been successful in the premium vodka market segment and was number two in over-all market share, behind market leader Smirnoff. Although Absolut held a strong position in the $15 to $25 premium segment, it lacked market positions in the super-premium seg-ment (over $25) and the traditional segment ($10 to $15). Grey Goose, a competitor’s product in the super-premium segment, had seen its U.S. sales increase from 100,000 cases in the late 1990s to 1.4 million cases in 2003. Because the market attractiveness of this segment was clearly improving, Absolut saw a good opportunity for growth. It intro-duced Level in the super-premium segment to compete with Grey Goose, Belvedere, and Ketel One. The company also positioned Danzka with unique packaging (in a metal con-tainer for faster chilling, shaped like a cocktail shaker) in the traditional segment at a suggested price of $13 to $14 per bottle.
Offensive Strategy ID: Expand Market Demand
Because at any point in time the number of customers in any given market is finite, strat-egies to enlarge a business’s customer base include a focus on winning over competitors’ customers, but they can also focus on growing market demand by drawing new customers
$30
Pric
e p
er B
ott
le
$25
$20
$15
$10
$5
$0Perceived Quality (brand image, taste, and packaging)
Super-PremiumSegmentOver $25
PremiumSegment
$15 to $25
TraditionalSegment
$10 to $15
PriceSegment
under $10
Danzka(new segment entry)
Absolut Spirits(core brand primary segment)
Level(new segment
entry)
FIGURE 12-6 NEW SEGMENT OFFENSIVE GROWTH STRATEGY IN THE VODKA MARKET

Chapter 12 Offensive Strategies 415
into the market. For example, the market demand for flat-panel TVs was 20 million in 2004. Although Sony and Samsung battle each other for market share, their common offensive strategy is to grow market demand. The worldwide market demand for flat-panel TVs increased from 30 million in 2005 to 217 million in 2011. Clearly the world-wide market is exploding. This type of offensive growth strategy is likely to benefit both companies in the years ahead.
In Chapter 3 , we learned to calculate the market development index (MDI). It is sim-ply the ratio of current market demand to maximum market demand (the maximum number of customers possible for a particular geographic market scope). For example, the worldwide MDI for the flat-panel TV is estimated at 62.
MarketDevelopment Index �
Market Demand for Fllat-Panel TVs (2011)
Market Potential for Fllat-Panel TVs
mil
�
�
100
217 million (2011)
350 llion worldwide( )�
�
100
62
The MDI of 62 indicates that the market has many potential customers who for various reasons have not entered it. As shown in Figure 12-7 , five basic forces need to be addressed for the market to reach its full potential. A strategic market plan to grow either the entire market or a specific segment would carefully consider each of these forces.
Nu
mb
er U
nit
s So
ld p
er Y
ear
CurrentMarketDemand
Awareness
Availability
Compatibility
Interest
Price/Cost
MarketPotential
Household Segment(60%)
BusinessSegment (40%)
UntappedMarket
Potential
Current MarketDemand
Potential buyers are unawareof flat-panel TV benefits.
Product is unavailable atlocal retail outlets.
Product is incompatible withlifestyle or use situation.
Product does not haveattractive benefits.
Potential buyers can’t affordthe product at current prices.
FIGURE 12-7 GROWING THE MARKET DEMAND FOR FLAT-PANEL TELEVISIONS

416 Part IV Strategic Marketing
Of these five forces that limit market demand, the three most restrictive are price, availability, and compatibility. Until prices decrease dramatically, many potential cus-tomers will not be able to enter the market.
Availability may be addressed by investing in wider distribution networks, recogniz-ing that a flat-panel TV manufacturer may find it economically infeasible to serve cus-tomers in some parts of the world. Unless availability is improved, many potential customers will remain outside the market even if prices are lowered.
For the flat-panel TV market, compatibility at first glance does not seem to be a problem. But living environments in many parts of the world are too small for easy view-ing of a flat-panel TV. Limited electrical service in some areas also limits product appli-cation (compatibility) and slows market development.
Finally, awareness and attraction to benefits best occur from actually seeing a flat-panel TV in operation, but in many worldwide markets, opportunities to view flat-panel TVs are limited by high prices or unavailability. The market for the product will move toward its full potential only when the forces that limit market development diminish.
OFFENSIVE CORE STRATEGY II: IMPROVE COMPETITIVE POSITION
In situations where a business is in an attractive market but has a weak or average com-petitive position, an investment to improve competitive position may be the best strategy to pursue. The better a business’s competitive position, the better its chances of achieving price premiums and a high level of customer retention, which in turn will improve the business’s margins and net marketing contribution. This section discusses the four offen-sive strategies for improving competitive position, as shown in Figure 12-4 .
Offensive Strategy IIA: Improve Customer Loyalty and Retention
Businesses spend money to attract new customers in growing markets, but if they do not retain these customers, they will experience higher marketing and sales expenses and lower marketing profits. As we saw in Chapter 1 , it costs much more to acquire a new customer than to keep a current one—from 5 to 10 times more. Further, a 2 percent increase in loyal customers has been shown to lower marketing costs by 10 percent. An offensive strategy to increase customer retention and customer loyalty will have an immediate impact on marketing profits (net marketing contribution).
For example, in Figure 12-8 AT&T had an 89.2 percent customer retention rate for a recent year. The company had 65.7 million customers, so this means that AT&T lost 7.1 million customers that year. To hold its customer base at 65.7 million, AT&T had to acquire 7.1 million new customers. Not only is this effort 5 to 10 times more expensive with respect to marketing and sales expenses, but new customers often use less service, resulting in a lower average monthly margin per customer. If AT&T could improve its customer retention rate from 89.2 to 94.2 percent, the company would increase the life-time value of its customers by 25 percent. For any business, retaining a higher percentage of customers and improving their loyalty is an offensive strategic investment that not only affects short-term profits but also greatly enhances long-run performance.

Chapter 12 Offensive Strategies 417
Offensive Strategy IIB: Improve Differentiation Advantage
One of the major customer complaints in the wireless communications market is reliability. To address this problem and turn it into a differentiation advantage, Verizon Wireless cre-ated a team of 50 “road warriors” who each drove 100,000 miles annually (a total of 5 mil-lion miles) in specially equipped cars to test the reliability of Verizon’s network against several competitors’ phones. An onboard computer system in each car made synchronized inbound and outbound calls that lasted 2.5 minutes each to the home office, with 15 sec-onds between calls. In addition to connection quality, Verizon checked sound quality by playing recordings of 20 phrases representing all sounds in the English language. Verizon’s computer system logged each call and used a global positioning system to note the precise locations where problems occurred. Gridlock produced the most severe test and was the best indicator of how well the system was working. Verizon’s efforts to improve reliability resulted in an increase in customer retention from 90 to 92.8 percent over a 3-year period.
To enhance the differentiation advantage achieved through the actual improvement in reliability, Verizon launched an advertising campaign using its “road warrior” testing process as the theme. The often-repeated question in the ads, “Can you hear me now ?” became a signature line for the company, familiar to almost everyone. The ads’ refrain emphasized the importance that customers place on reliability when they choose a phone service. Verizon depends heavily on its source of differentiation because the company is not a low-cost service provider.
Offensive Strategy IIC: Lower Cost/Improve Marketing Productivity
Sony found that its profit margins were shrinking in consumer electronics because prices were eroding faster than manufacturing costs could be lowered. Even though the com-pany was selling higher volumes, gross profits were in decline as margins dropped. To address this problem and restore margins to more acceptable levels, Sony examined its cost structure closely and identified several areas where costs could be cut. To promote standardization, the company pared the number of components used in Sony consumer electronics from 840,000 to just 100,000. To further reduce the cost of materials, it slashed the number of suppliers from 4,700 to just 1,000. Sony also moved more produc-tion from Japan to China, where labor costs are much lower, and added more technology to its manufacturing processes. By lowering its costs, Sony improved its profitability and remained a leader in a highly competitive market.
FIGURE 12-8 CELLULAR PHONE SERVICE CUSTOMER RETENTION
Major Cellular Phone Service Providers (2007)
Customers (millions)
Customer Retention (%)
Lost Customers (millions)
AT&T (AT&T Mobility Ltd.) 65.7 89.2 7.1
Verizon Wireless 61.1 92.8 4.4
Sprint Nextel 53.7 89.2 5.8
T-Mobile USA 28.2 86.8 3.7

418 Part IV Strategic Marketing
As another example, a 3M business found that many of its distributors who made below-average purchases were frequently late in paying. These distributors were moved to an online purchasing system where they had to provide a credit card number to initiate a purchase. The new procedure left the slow-paying distributors a bit dissatisfied, but the 3M business informed them that they could improve their buying status with on-time payments. In the end, few distributors were lost, and the 3M business greatly reduced its marketing and sales expenses and improved its cash flow. Both of these factors contrib-uted to a higher net marketing contribution and a higher marketing productivity (net mar-keting contribution per dollar of marketing expense).
Offensive Strategy IID: Build Marketing Advantage
Nautilus was a pioneer brand in the $5 billion home fitness equipment market. The com-pany’s direct marketing approach was successful, but Nautilus had not responded to mar-ket trends that included more emphasis on cardiovascular equipment and a shift toward in-store purchases. Although Nautilus could retool to produce new products, it was much harder to shift from direct marketing channels, including the company’s heavy reliance on infomercials, to selling through retail stores. But because 80 percent of the $5 billion in sales in this market occurred in retail stores, this change was essential. To close this gap and build a marketing advantage, Nautilus not only began selling through specialty sports equipment retailers, but also developed partnerships with Amazon.com, Costco, and Sports Authority. These indirect channel partnerships improved Nautilus’s competi-tive position by giving the company a marketing advantage over its competitors.
OFFENSIVE CORE STRATEGY III: ENTER NEW MARKETS
At some point, every business will need to examine growth opportunities outside its existing markets. 10 Any of three fundamental reasons could lead a business to enter a new market: (1) a limited number of attractive market opportunities within existing mar-kets; (2) attractive opportunities, in terms of meeting the business’s overall performance objectives, outside existing markets; and (3) a desire to diversify sources of profitability to reduce variation in performance. 11
The four basic offensive strategic market plans for entering new markets, as in Fig-ure 12-4 , are (IIIA) entry into established related markets, (IIIB) entry into established markets that are unrelated to markets served by the business, (IIIC) entry into new emerg-ing markets, and (IIID) entry into markets with considerable undeveloped market poten-tial. Entry into established markets (related or unrelated) means competing with established competitors for existing market demand, and entry into emerging markets requires signifi-cant investment to develop market demand, but often in the absence of strong competition.
Offensive Strategy IIIA: Enter Related New Markets
Not content to rest on its laurels with a 50 percent market share of the worldwide carbonated soft drink market, Coca-Cola has entered the $5 billion energy drinks market, illustrated in Figure 12-9 . This is a related new market entry strategy that allows Coca-Cola to develop new sources of sales growth by leveraging its core competencies and competitive advantages.

Chapter 12 Offensive Strategies 419
K2 historically was best known as a ski manufacturer. Over a 10-year period beginning in the mid 1980s, K2 steadily increased its share of the American ski market until in the mid 1990s it became the share leader. But the American ski market was by then mature, and opportunities to grow sales by growing the market or increasing market share were limited. This situation led K2 to adopt a related new market entry strategy for the snowboard and inline skate markets. K2 planned to achieve significant sales revenue growth during the subsequent 10 years as a result of this strategy, and in fact the company grew sales dra-matically to $1.4 billion by the mid 2000s. The strategy also enabled K2 to leverage its brand awareness, reputation for quality, manufacturing and design expertise, and, in some instances, its marketing channel and sales systems. These factors resulted in a variety of cost and marketing efficiencies, and K2 achieved an impressive gross profit margin of 35.4 percent. In mid 2000s K2’s sales were derived from marine and outdoor products (29.2%), action sports (30.2%), team sports (27.5%), and apparel and footwear (13.1%).
Sometimes a business discovers that entry into a new market is blocked by the cost of entry, technology requirements, or a lack of market access. To overcome the barriers to entry, a business can join forces with two or more partner companies that have com-plementary market expertise and leverage. By blending the strengths of businesses from related markets, the new entities are better equipped to develop and market products that more completely serve and fulfill customer needs. In the telecommunications industry, barriers to new market entry led to many mergers, joint ventures, and strategic alliances among telecommunications, computer, and cable TV companies.
StrongTaste
FruitFlavor
SweetTasting
BitterTasting
ClubSodas
SportsDrinks
EnergyDrinks
NoncolaSoft Drinks
FruitDrinks
FruitJuices
Iced Tea& Coffee
Bottled &MineralWaters
ColaSoft Drinks
FIGURE 12-9 NEW MARKET ENTRY OPPORTUNITIES FOR COCA-COLA

420 Part IV Strategic Marketing
Offensive Strategy IIIB: Enter Unrelated New Markets
Westinghouse acquired CBS in the mid-1990s. A week earlier, Disney had acquired ABC. The Disney acquisition was a related new market entry strategy in which Disney could leverage its name, reputation for quality, and creative and production expertise. In contrast, the Westinghouse acquisition was an unrelated new market entry strategy that moved Westinghouse into the increasingly attractive communications market. Disney was leveraging its strength in the communications industry, whereas Westinghouse was redefining itself by acquiring CBS in the hope of adapting its competitive advantage to a new, highly inviting market. The two businesses had one thing in common: Both were pursuing new sources of market share, sales growth, and profit performance.
One of the primary advantages of an unrelated new market entry strategy is reduced market dependency. Because most markets go through periods of expansion and contrac-tion, investments in unrelated businesses have a smoothing effect on the revenues and profits of the combined portfolio of product-markets. For example, the residential con-struction market is a slow-growth market that fluctuates with economic conditions. A manufacturer of earth-moving equipment for this market could reduce the magnitude of swings in performance by entering the mining or agriculture markets or any other market that is unrelated to the residential construction market. In this way, variations in overall business performance could be minimized.
An additional advantage of market diversification is reduced vulnerability. If a business derives the bulk of its performance from one type of market, a permanent downward change in that market would threaten the company’s performance and, poten-tially, its survival. In the mid 1970s, the National Cash Register Corporation (NCR) was focused primarily on the cash register market and had over 80 percent of this market. When competitors entered with a new cash register technology, NCR’s market share declined rapidly. In less than 6 years, its share shrank to less than 25 percent, and the company’s survival was at stake. A business, then, might pursue an unrelated new mar-ket entry strategy for three reasons:
1. New Source of Growth: New market diversification offers the potential to add to the business’s sales growth and profit performance.
2. Smoother Performance: New market diversification offers product diversification, which can reduce the magnitude of swings in sales and profit performance.
3. Reduced Vulnerability: New market diversification reduces market dependence and vulnerability, which helps protect the business’s performance and, in some instances, its survival.
Although these are important benefits, many businesses have failed to perform effec-tively in diversified markets and have retreated to their core markets. Mobil’s acquisition of Montgomery Ward, Coca-Cola’s acquisition of Columbia Pictures, and General Motors’ acquisition of Data Information Services were all results of unsuccessful diversi-fied new market entry strategies. The new market ventures were too far removed from the marketing and business expertise of the acquiring company. On the other hand, Phillip Morris’s acquisition of the Miller Brewing Company, PepsiCo’s merger with Quaker Oats, and Motorola’s move into wireless communication products provided the

Chapter 12 Offensive Strategies 421
advantages we have listed. These companies, in their new markets, successfully lever-aged their marketing and business expertise.
Offensive Strategy IIIC: Enter New Emerging Markets
A business also can grow by entering new emerging markets where the number of current customers is small but market potential is great. Although it is considerably riskier with respect to profit performance, this strategy can enable a business to establish an early leadership position in the market. From this position, a business can influence product positioning and market growth.
High-technology markets have rapidly emerging market demand and relatively short product and market life cycles. Businesses in these markets need to move quickly to capitalize on emerging new market opportunities or they will completely miss this oppor-tunity for growth. 12 A pioneer in these emerging new markets has the potential to achieve a competitive advantage if it can sustain its advantage in these early stages of market development. 13 When pioneers can establish a dominant design , they set a standard that other businesses entering the market must follow in order to compete. 14 A good example of establishing a dominant design was the way VHS prevailed over Beta as the design standard in the early evolution of the VCR market.
As an emerging market begins to grow, early followers enter the market. Early followers let the pioneer invest in developing the technology, establishing the design standard, and initiating market development. Then they emulate the dominant design and enter the market. Many Japanese companies use an early follower strategy. Comcast and EarthLink both entered the broadband Internet market as early followers. CompuServe, Prodigy, and America Online established dominant positions in the dial-up Internet service market, but as the technology developed and the broadband market emerged, Comcast and EarthLink entered the market, capitalizing on emerging new market demand for high-speed Internet access.
When many customers are attracted to the market, with customer use and experience quickly increasing, the market is in its rapid-growth phase. It is during this phase of mar-ket development, as customer needs become more salient and numerous, that segments begin to form. The rapid growth attracts more competitors, many of them focusing on niche markets of customers with unique needs. 15 This is a critical point for a market leader, which must respond by developing multi-segment solutions. If the market leader remains too narrowly focused, it will see its market share erode as new competitors deliver more attractive value propositions for specific segments. A market pioneer that can sustain its market leadership through this phase of a market’s development is in the best position to achieve high levels of performance. 16
Offensive Strategy IIID: Develop New Markets
Apple’s initial entry into the personal computer market relied on a strategy that focused on the enormous untapped potential of the personal computer market. Apple’s goal was to bring computing power to the masses and thereby grow this new market. The compa-ny’s original positioning strategy for the Macintosh was: “Only a few have the expertise to operate computers. . . . Introducing Macintosh, for the rest of the world.” In the
422 Part IV Strategic Marketing
beginning, Apple had few major competitors because it focused on a market that the established computer manufacturers had ignored. Only after Apple’s early success revealed the potential of this new market did competitors begin to enter it.
The populations of China, India, and Africa make up over half the world’s people, yet many of the products manufactured for the United States and Western Europe have not been formulated for these markets. Constraints due to price, use compatibility, and availability create a large, untapped new market potential for many products.
For example, products that operate with electricity have no market in rural areas of underdeveloped countries where no electrical service is available. General Electric, with its expertise in turbines for jet engines, adapted its technology to enable busi-nesses in areas with no electrical power to produce their own electricity and sell their excess to local utilities. By enabling businesses to “co-generate” electricity on a small scale, GE has created markets for many of its electrical products in remote parts of the world.
A growth strategy to develop an untapped new market involves high risk but offers the potential for high return. 17 The cost of developing a market can be significant even if the product is a good customer solution. On the other hand, there are few if any competi-tors, so a business has the opportunity to pioneer a market that has so far been largely ignored. With a “first-mover” advantage, the business has the potential to own the market until other competitors venture entry. A notable example is a company called Under Armour, which was launched in 1995 with $40,000 by a college student who maxed out five credit cards developing the market for specialty undergarments for athletes. By 2002, Under Armour had sales of $50 million, and sales continued to increase by a remarkable 72 percent annually to $1.1 billion in 2010, despite market entry by Nike, Adidas, and other large sports apparel companies.
WHEN GROWTH STALLS
Maintaining sales growth is difficult. A comprehensive study of 500 major U.S. and global companies found that, at some point, 87 percent of them over a 50-year period experienced a stall in their sales. 18 Figure 12-10 illustrates the average sales growth before and after the sales stall for these 435 companies. As shown, average sales growth prior to the stall year was somewhat lower than the average for the stall year. The aver-age growth rates for the 15 years following the sales stall were very modest, nothing close to average sales growth for the years prior to the stall year. In the words of the study’s authors: “After a burst of energy, growth does not descend gradually; it drops like a stone.”
We might assume that companies with a record of strong sales growth could recover after a sales stall and within a few years could once again attain the same levels of sales growth that preceded the stall, but this does not appear to be the case. Let’s take a closer look at what happens to companies that experience a stall in sales growth.
Of the 87 percent of the companies that experienced stalled sales, 46 percent were able to rebound fairly quickly with moderate or high growth, but 54 percent continued to see slow or negative growth for several years following the stall. As Figure 12-11 shows, of the 54 percent of companies that continued to experience slow or negative growth, only 7 percent eventually recovered to achieve moderate or high growth, and 26 percent

Chapter 12 Offensive Strategies 423
continued to experience slow or negative growth. The most startling finding of the study was that two-thirds of the companies that experienced a stall ended up being acquired by other companies, filing for bankruptcy, or becoming privately held. The message is clear: Companies that encounter stalled growth—and sooner or later, most do—must immedi-ately develop and implement a strategy to deal with it.
Ave
rag
e R
ate
of
Sale
s C
han
ge
0%
6%
4%
2%
12%
10%
8%
14%
5 Years PriorAverage 9%
Stall YearAverage 13%
Years 1–5 AfterAverage 1.6%
Years 6–10 AfterAverage 0.6%
Years 11–15 AfterAverage 1.4%
The data presented here are based on the sales performances of 435 Fortune 500 and Fortune Global 500 companies that experienced a stall in sales at some point over a 50-year period.
Source: Mathew S. Olsen, Derek van Bever, and Seth Verry, “When Growth Stalls,” Harvard Business Review, March 2008.
FIGURE 12-10 WHAT HAPPENS WHEN GROWTH STALLS
0%
10%
20%
30%
40%
50%
60%
70%
80%
90%
100%
7%
Slow orNegative Growth
26%
Moderate orHigh Growth
Moderate orHigh Growth
46%
No Stall in Growth13%
Source: Mathew S. Olsen,Derek van Bever, and SethVerry, “When Growth Stalls,”Harvard Business Review,March 2008.
Sales Stalledat Some PointOver 50 Years
87%
Slow orNegative Growth
54%Acquired,
Went Bankrupt,or Became
Private67%
500 Companies
400 Fortune 500Companies
100 Fortune 500Global Companies
FIGURE 12-11 SALES GROWTH AFTER A SALES STALL

424 Part IV Strategic Marketing
Rebounding with an Offensive Growth Strategy
Starbucks has been following an offensive strategy for many years, opening numerous new stores and adding products to its portfolio. Shown here is the company’s 2010 prod-uct portfolio with the percentage of sales for each category. The company’s total sales in 2010 were $10.7 billion.
Profit
Operating Income ($ millions)
Operating Income (% sales)
2005
$781
12.2%
2006
$894
11.5%
2007
$1,053
11.2%
2008
$504
4.8%
2009 2010
$562
5.7%
$1,420
13.3%
9 10 11 12 13 14 15 16 17 18$6
$7
$8
$9
$10
$11
$12
2005
2006
2007
2008 2010
2009
Number of Store Locations (thousands)
Sale
s (b
illio
ns)
FIGURE 12-12 STARBUCKS’ SALES GROWTH AND NUMBER OF LOCATIONS
Starbucks’ Product Portfolio – 2010
Beverages Food Equipment Coffee Beans
75% 19% 4% 2%
Starbucks’ sales and the number of its stores have grown quickly over the years, as Fig-ure 12-12 shows. But in 2008, sales leveled off, prompting Starbucks to close some less profitable stores, lowering the worldwide number from 16,690 to 16,635. The company was experiencing a stall in its sales growth, with sales falling from $10.4 billion in 2008 to $9.8 billion in 2009. The effectiveness of the offensive strategies that Starbucks imple-ments to counter the stall will determine the degree to which it can recover. In 2010, store locations increased to 17,009 and profits grew to $1.42 billion on sales of $10.7 billion. As a percentage of sales, operating income grew from 5.7 to 13.3 percent.
Chapter 12 Offensive Strategies 425
By late 2010 Starbucks saw that continued growth by adding new stores was becom-ing more difficult. In early 2011 the company adjusted its offensive strategy and changed its logo. 19 The new logo eliminates the word “coffee” and the Starbucks name from the design, a good indication that Starbucks has developed an offensive strategy to enter new markets—such as noncoffee drinks, fragrances, and apparel—while keeping its three brands of coffee (Starbucks, 15th Avenue, and Seattle’s Best). 20 Assuming that this is Starbucks’ strategy, its primary objective would be to ensure that the company rebounds from the stalled sales growth it experienced in 2009.
CHOOSING OFFENSIVE STRATEGIC MARKET PLANS
Businesses, especially highly ambitious and aggressive businesses, often pursue multiple offensive strategies. Starbucks’ objective has long been to become the world’s most rec-ognized and respected brand. To accomplish this, over the years the company has imple-mented a wide variety of offensive strategic market plans.
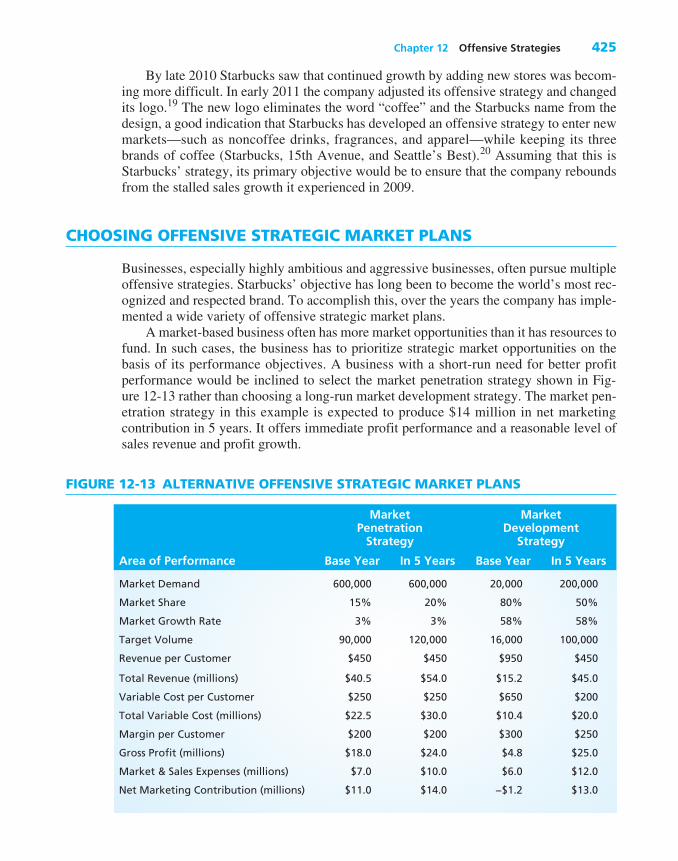
A market-based business often has more market opportunities than it has resources to fund. In such cases, the business has to prioritize strategic market opportunities on the basis of its performance objectives. A business with a short-run need for better profit performance would be inclined to select the market penetration strategy shown in Fig-ure 12-13 rather than choosing a long-run market development strategy. The market pen-etration strategy in this example is expected to produce $14 million in net marketing contribution in 5 years. It offers immediate profit performance and a reasonable level of sales revenue and profit growth.
FIGURE 12-13 ALTERNATIVE OFFENSIVE STRATEGIC MARKET PLANS
Market Penetration
Strategy
Market Development
Strategy
Area of Performance Base Year In 5 Years Base Year In 5 Years
Market Demand 600,000 600,000 20,000 200,000
Market Share 15% 20% 80% 50%
Market Growth Rate 3% 3% 58% 58%
Target Volume 90,000 120,000 16,000 100,000
Revenue per Customer $450 $450 $950 $450
Total Revenue (millions) $40.5 $54.0 $15.2 $45.0
Variable Cost per Customer $250 $250 $650 $200
Total Variable Cost (millions) $22.5 $30.0 $10.4 $20.0
Margin per Customer $200 $200 $300 $250
Gross Profit (millions) $18.0 $24.0 $4.8 $25.0
Market & Sales Expenses (millions) $7.0 $10.0 $6.0 $12.0
Net Marketing Contribution (millions) $11.0 $14.0 −$1.2 $13.0
426 Part IV Strategic Marketing
On the other hand, a business with a good cash position that is facing stagnant growth in maturing markets might pursue the market development strategy shown in Figure 12-13 . This offensive strategy would produce a $1.2 million negative net market-ing contribution in the first year. However, in 5 years, the strategy would be expected to produce $13 million in net marketing contribution. Although it is riskier, this new mar-ket development strategy could provide the business with needed growth and diversifi-cation into an attractive market. The selection of one offensive strategic market plan over another depends on the business’s short-run profit needs, strategic position and resources, and opportunities for growth.
� Summary
Businesses have a short-term obligation to investors to meet growth and performance expectations. At the same time, businesses have an obligation to investors, as well as employees, to carve out a set of marketing strategies that will improve the position of the business in the long run. The purpose of strategic market planning is to examine the attractiveness and competitive advantage of each market that is served by a business. On the basis of an assessment of its position, a business develops a strategic market objective and allocates resources accordingly. To accomplish its performance objective, a business generally needs to use a combination of offensive and defensive strategic market plans.
Offensive strategies are more growth oriented and are generally most effective dur-ing the growth phase of the product life cycle, whereas defensive strategies are more likely to be used in maturing, mature, and declining markets. Offensive strategies include three core strategies: sales growth, margin improvement, and diversified growth. A com-pany implements these core offensive strategies by using one or more of four specific strategies.
Offensive strategies for pursuing sales growth are focused on existing markets. Sales growth offensive strategies include (IA) increasing market share, (IB) growing customer purchases, (IC) expanding into new-market segments, and (ID) expanding market demand by growing market potential.
Offensive strategies to improve competitive position and ultimately margin are focused on existing markets and strategies that can improve profit margins. They include (IIA) increasing customer loyalty, (IIB) improving a differentiation advantage, (IIC) lowering costs and improving marketing productivity, and (IID) building a stronger mar-keting advantage.
Offensive strategies with the goal of diversified growth are focused on new markets and strategies that can achieve sales growth outside the current market domain. They include (IIIA) entering new related markets, (IIIB) entering new unrelated markets, (IIIC) entering new emerging markets, and (IIID) developing new markets. A company chooses a good mix of offensive strategic marketing plans by considering the expected impact of each strategy on short-term or long-run growth in revenues and profitability.
A major challenge to any company’s offensive strategies is “stalled sales growth.” Most companies, even ones that have experienced good sales growth for years, eventu-ally hit an abrupt wall. Sales growth just stops. Although some companies do regain a moderate to high level of sales growth, the majority lingers with low or negative sales growth. Many of these companies are acquired, go bankrupt, or become privately held.

Chapter 12 Offensive Strategies 427
� Market-Based Strategic Thinking
1 What would Apple’s sales and margins have looked like in 2010 if it had the same product portfolio then as it had in 2000?
2 How does the Apple product life cycle portfolio add to the strategic insight into Apple’s current and future sales and profit performance?
3 Explain why a business like Ford might shift from an offensive strategy to a defen-sive strategy over the life cycle of a particular product.
4 How can a business like Campbell’s Soup meet short-run growth and profit per-formance targets and still invest in strategic market plans that are focused on long-run objectives with respect to share position, sales growth, and profit performance?
5 How has Harley-Davidson’s offensive strategy to grow revenue per customer affected its sales and profits?
6 How would a Nike offensive strategy to increase market penetration differ from a strategy to grow customer purchases (revenue per customer) in the under-18 female athlete market?
7 Why would Google use an offensive sales growth strategy to expand the Internet search engine market rather than attempting to increase its share of this market?
8 How did Apple’s offensive growth strategies affect its percent profit margins? 9 Why would AT&T’s efforts to improve customer retention be considered an offen-
sive strategy to improve margins? 10 Absolut Vodka entered two new market segments as part of an offensive strategy to
grow sales. Explain the logic of this offensive strategy and why the company elected to create new brand names for each segment shown in Figure 12-6 .
11 Microsoft has developed a product called Meeting Pro to help facilitate the running of small business meetings. Although this is a value-added software product, Micro-soft offers it at no cost to Windows users. Explain why this is an offensive strategy to grow market share.
12 Why are offensive strategies for General Motors crucial for the long-run success of that company? What kind of offensive strategies could GM use to ensure future growth in sales and profits?
13 Microsoft has embarked on a joint venture with Sony to develop an online alternative to the telephone. What type of offensive marketing strategy best describes this joint venture, and what are the expected short- and long-run performance objectives?
14 How does a market penetration strategy to grow market share differ from a strategy to enter a new segment in the same market for Mac computers?
15 Why would a Starbucks marketing strategy to grow customer purchases (revenue per customer) be potentially more profitable than many other offensive marketing strategies?
16 Why would a business like Marriott first pursue offensive marketing strategies to increase market share or grow revenue per customer, rather than adopting other offensive marketing strategies?
17 What forces limit new-customer growth within the existing market for personal computers? How could a company like Intel grow market demand by addressing these forces?
18 What important considerations should Starbucks evaluate between a related new market entry strategy and an unrelated new market entry strategy?

428 Part IV Strategic Marketing
19 When would a business like Dell pursue an unrelated new market entry strategy? 20 What is the advantage to Apple in growing market demand for a new emerging
product-market such as the iPad?
Notes
1. D. Aaker, “Portfolio Analysis,” Strategic Market Man-agement (New York: Wiley, 1995): 155–69.
2. B. Catry and M. Chevalier, “Market Share Strategy and the Product Life Cycle,” Journal of Marketing (October 1974): 29–34.
3. P. Haspeslagh, “Portfolio Planning: Uses and Lim-its,” Harvard Business Review (January–February 1982): 58–73; and S. Robinson, R. Hichens, and D. Wade, “The Directional Policy Matrix Tool for Stra-tegic Planning,” Long-Range Planning (June 1978): 8–15.
4. D. Aaker, “Growth Strategies,” Strategic Market Man-agement (New York: Wiley, 1995): 238–59.
5. D. Bogler, “Coca-Cola Goes to War for ‘Share of Stomach,’” Financial Times (July 5, 1998).
6. C. Lillis, J. Cook, R. Best, and D. Hawkins, “Market-ing Strategies to Achieve Market Share Goals,” Strate-gic Marketing Management , H. Thomas and D. Gardner, eds. (New York: Wiley, 1985).
7. D. Szymanski, S. Bharadwaj, and R. Varadarajan, “An Analysis of the Market Share-Profitability Relation-ship,” Journal of Marketing (July 1993): 1–18; and C.D. Fogg, “Planning Gains in Market Share,” Journal of Marketing (July 1994): 30–8.
8. D. Sheinen and B. Schmitt, “Extending Brands with New Product Concepts: The Role of Category
Attribute Congruity, Brand Affect and Brand Breadth,” Journal of Business Research (September 1994): 1–10.
9. G. Hamel and C.K. Prahalad, “Seeing the Future First,” Fortune (September 5, 1994): 64–70.
10. E. Roberts and C. Berry, “Entering New Business: Selecting Strategies for Success,” Sloan Management Review (Spring 1985): 3–17.
11. R. Rumelt, “Diversification, Strategy and Profitabil-ity,” Strategic Management Journal 3 (1982): 359–69.
12. G. Stalk, Jr., “Time: The Next Source of Competitive Advantage,” Harvard Business Review (July–August 1988): 41–51; and T. Robertson, “How to Reduce Market Penetration Cycle Times,” Sloan Management Review (Fall 1993): 87–96.
12. W. Robinson and C. Fornell, “Sources of Market Pio-neer Advantage in Consumer Goods Industries,” Jour-nal of Marketing Research (August 1985): 305–17; and W. Robinson, “Sources of Market Pioneer Advan-tages: The Case for Industrial Goods Industries,” Jour-nal of Marketing Research 25 (1988): 87–94.
14. R. Best and R. Angelmar, “Strategies for Leveraging Technology Advantage,” in Handbook on Business Strategy (New York: Warren, Gorham and Lamont, 1989): 2.1–2.10.
15. V. Mahajan, S. Sharma, and R. Buzzell, “Assessing the Impact of Competitive Entry on Market Expansion
Marketing Performance Tools and Application Exercises
The three interactive marketing performance tools and application exercises outlined here will improve your ability to evaluate the four specific market strategies for each of the three offensive core strategies. To access the tools, go to rogerjbest.com. Each of these market-ing performance tools is based on Figure 12-4 .
12.1 Offensive Strategies—Core Strategy I: Grow in Existing Markets
� Using the data provided, evaluate the four offensive strategies for growing sales in existing markets.
12.2 Offensive Strategies—Core Strategy II: Improve Margins
� Using the data provided, evaluate the four offensive strategies for improving margins for sales in existing markets.
12.3 Offensive Strategies—Core Strategy III: Diversify Growth
� Using the data provided, evaluate the four offensive strategies for growing sales with diversified growth.

Chapter 12 Offensive Strategies 429
and Incumbent Sales,” Journal of Marketing (July 1993): 39–52.
16. G. Urban, T. Carter, S. Gaskin, and Z. Mucha, “Mar-keting Share Rewards to Pioneering Brands: An Empirical Analysis and Strategic Implications,” Man-agement Science 32 (1986): 635–59.
17. I. Ayal and J. Zif, “Market Expansion Strategies in Multinational Markets,” Journal of Marketing (Spring 1979): 84–94.
18. M.S. Olsen, D. van Bever, and S. Verry, “When Growth Stalls,” Harvard Business Review (March 2008): 51–61.
19. O. Blanchard, “Starbucks: Managing a Brand Expan-sion, Part 2,” The Brand Builder (January 10, 2011): http://thebrandbuilder.wordpress.com/2011/01/10/starbucks-managing-a-brands-expansion-part-2/ , retrieved January 11, 2011.
20. Blanchard, ibid.